COUNCIL - Virginia Department of Transportation
34
COUNCIL
Transcript of COUNCIL - Virginia Department of Transportation

COUNCIL

Technical Report Documentation Page
1. Report No.
FHWA/VA-94-R22 2. Government Accession No.
4. Title and Subtitle
Evaluation of a Video Image Detection System
H. Cottrell, Jr.
9. Performing Organization Name and Address
Virginia Transportation Research Council Box 3817, University Station Charlottesville, Virginia 22903-0817 12. Sponsoring Agency Name and Address
Virginia Department of Transportation 1401 E. Broad Street Richmond, Virginia 23219
3. Recipient's Catalog No.
5. Report Date May 1994
6. Performing Organization Code
8. Performing Organization Report No.
VTRC 94-R22
10. Work Unit No. (TRAIS)
11. Contract or Grant No. 9629-030-940
13. Type of Report and Period Covered
Final Report 14. Sponsoring Agency Code
15. Supplementary Notes
None
16. Abstract
A video image detection system (VIDS) is an advanced wide-area traffic monitoring sys- tem that processes input from a video camera. The Autoscope VIDS coupled with an informa- tion management system was selected as the monitoring device because testing had shown it to be the most advanced system available with respect to performance, reliability, and accuracy.
The purpose of this project was to evaluate the capabilities of the VIDS. The primary objective was to assess the performance of the VIDS for incident detection, and a secondary objective was to examine its capability to monitor traffic. Existing hardware was to be used for the VIDS as much as possible in order to fit the VIDS into the existing TMS Center operations and to minimize additional costs.
Based on an evaluation that focused on traffic monitoring, the VIDS performed unsatis- factorily at two sites and satisfactorily at a third site. The location of the video camera relative to the monitoring site, which is critical to effective operations of the VIDS, was the major cause of the unsatisfactory performance. The primary objective was not achieved. The potential for using the Autoscope at existing camera locations in Northern Virginia is limited. Based on the performance of the Autoscope at the Woodrow Wilson Bridge, it was concluded that it is difficult to accurately return an Autoscope camera to its monitoring position after it is moved for surveil- lance. A dedicated camera is necessary for the VIDS.
Recommendations were made for the use of the VIDS and for project planning and con- tract administration for future projects of this nature.
17. Key Words
advanced traffic management system, traf- fic surveillance, video image detection sys- tem, incident management, vehicle detection, traffic monitoring
18. Distribution Statement
No restrictions. This document is available to the public through NTIS, Springfield, VA 22161.
19. Security Classif. (of this report)
Unclassified 20. Security Classif. (of this page)
Unclassified 21. No. of Pages
27 pages
22. Price

FINAL REPORT
EVALUATION OF A VIDEO IMAGE DETECTION SYSTEM
B. H. Cottrell, Jr. Senior Research Scientist
(The opinions, findings, and conclusions expressed in this report are those of the author and not necessarily
those of the sponsoring agencies.)
Virginia Transportation Research Council (A Cooperative Organization Sponsored Jointly by the
Virginia Department of Transportation and the University of Virginia)
In Cooperation with the U.S. Department of Transportation Federal Highway Administration
Charlottesville, Virginia
May 1994 VTRC 94-R22

TRAFFIC RESEARCH ADVISORY COMMITTEE
L. C. TAYLOR, Chairman, Salem District Traffic Engineer, VDOT B. H. COTTRELL, JR., Executive Secretary, Research Scientist, VTRC M. G. ALDERMAN, Regional Sign Shop Coordinator, VDOT J. BROWN, Bowling Green Resident Engineer, VDOT J. L. BUTNER, Traffic Engineering Division Administrator, VDOT J. CHU, Transportation Engineer Program Supervisor, VDOT TMS Center C. A. CLAYTON, Transportation Engineer Program Supervisor, VDOT-Traffic Engineering D. E. COLE, Bristol District Traffic Engineer, VDOT J. C. DUFRESNE, Traffic Engineering, VDOT Q. D. ELLIOTT, Williamsburg Resident Engineer, VDOT C. F. GEE, State Construction Engineer, VDOT D. HANSHAW, Suffolk District Traffic Engineer, VDOT J. T. HARRIS, Transportation Engineer Program Supervisor, VDOT-Location and Design K. J. JENNINGS, Senior Transportation Engineer, VDOT-Maintenance Division T. A. JENNINGS, Safety/Technology Transfer Coordinator, Federal Highway Administration Y. L1ORT, Northern Virginia District Planning & Operations Engineer, VDOT T. W. NEAL, JR., Chemistry Lab Supervisor, VDOT R. L. SAUVAGER, Assistant Urban Division Administrator, VDOT W. W. WHITE, District Tunnel & Tolls Engineer, VDOT

EXECUTIVE SUMMARY
Introduction and Purpose
The Federal Highway Administration (FHWA) initiated a program that consisted of the demonstration of incident management and integrated system strategies to combat urban freeway congestion. Subsequently, the Virginia Department of Transportation (VDOT), and the Maryland State Highway Admin- istration (MSHA)jointly prepared a proposal entitled "Demonstration Project Concerning the Alleviation of Congestion on the Capital Beltway" (also called the Virginia/Maryland Capital Beltway Demonstration Project). 1
A video image detection system (VIDS) is an advanced wide-area traffic surveillance system that processes input from a video camera to monitor traffic. VDOT's traffic management system (TMS) in Northern Virginia is a computer- ized highway surveillance and control system that monitors 48 km (30 mi) on 1- 395, 1-495, and 1-66. It operates 550 traffic counters (loop detectors) and 48 closed circuit television (CCTV) cameras to monitor these highways from the TMS Center in Arlington, Virginia.
The Autoscope VIDS was selected because testing had shown it was the most advanced system available based on performance, reliability, and accu-
racy. The Autoscope, which was developed by Dr. Panos Michalopoulos of the University of Minnesota, uses a microprocessor, a digitizer, and a proprietary board and software for real-time video image analysis and traffic parameter extraction. Advanced machine-vision pattern-recognition algorithms are used to detect vehicles under various environmental and traffic conditions. The detectors, count detectors, and speed zones are generated and configured on a video monitor through interactive graphics using a personal computer mouse. The detectors, including some that emulate loop detectors can be moved and reconfigured relatively easily; the detectors appear as an overlay on a video monitor.
The purpose of VDOT's portion of the demonstration project was to evalu- ate the capabilities of the VIDS in the vicinity of the Woodrow Wilson Memorial Bridge (WW Bridge) on the Capital Beltway. Existing hardware (that is, camera poles, cabinets, communication cables, etc.) was to be used for the VIDS as much as possible in order to fit it into the existing TMS Center operations and to minimize additional costs. A task force comprised of representatives from the Traffic Engineering Division, VDOT's TMS Center, and the Research Council was responsible for managing the project.
Since the Autoscope was a new system at the time this effort was initi- ated, there were a limited number of consulting firms that had experience with it. At the time, Farradyne Systems, Inc., (FSI) was the exclusive distributor of
iii

the Autoscope in the Northeastern United States. (In June 1991, Econolite became the exclusive manufacturer and distributor of the Autoscope.) There- fore, VDOT contracted with FSI to design, install, and provide technical assis- tance for the operation of the Autoscope. •
Because the Autoscope did not have database management software, FSI was to integrate the Autoscope with its own software, the Management Informa- tion System for Traffic (MIST). MIST, which is an information management and control system that communicates with and controls traffic signal controllers, was expanded to communicate with and control the Autoscope processor.
Conclusion and Recommendations
VIDS Evaluation and Performance
Although the objective to assess the performance of the VIDS for incident detection was not accomplished, an examination of its capability to monitor traffic was achieved. The VIDS performed unsatisfactorily at the Telegraph Rd. and WW Bridge sites because vehicle detection was inadequate. In gen- eral, the VIDS-generated volume was substantially greater than the volume measured by loop detectors, and the speed and volume measurements were inconsistent. The location of the video camera, which is critical to effective operation of the VIDS, was the major cause of the unsatisfactory perfor- mance. The VIDS was designed for a dedicated camera located directly over the travel lanes for vehicle detection at a maximum distance of 152.5 rn (500 ft) from the monitoring site; its optimum range is 61 to 107 m (200 to 350 ft). At the Telegraph Road site, the camera pole is off to the side of the road about 12 rn (40 ft) from the shoulder and about 300 rn (1000 ft) from the travel lanes. At the WW Bridge on the Maryland side, the camera pole is off to the side of the road about 5 m (15 ft) from the shoulder and about 90 m (300 ft) from the travel lanes. Preliminary testing had yielded reasonably accurate vehicle detection despite the less than ideal camera locations. VDOT installed a dedicated camera for the Autoscope at Telegraph Road and used the WW Bridge camera for dual purposes: Autoscope vehicle detection and surveillance. The camera at the WW Bridge is critical for monitoring the bridge, so movement of this camera was to be restricted as much possible. This decision represented an effort to provide a dedicated camera for the Autoscope at one site, and to maximize use of the existing equipment at the other site. Based on a limited evaluation of volume count only, the VIDS per- formed satisfactorily at site 3.
VIDS can only be used at 2 of the existing 48 camera locations in Northern Virginia. In general, the VIDS, which was designed for camera placement
iv

directly over the travel lanes, has limited potential for the existing camera locations under surveillance by the TMS Center.
Based on the performance of the VIDS at the WW Bridge, it was concluded that it is difficult to accurately return an Autoscope camera to its monitor- ing position after it is moved for surveillance. Therefore, a dedicated Auto- scope camera is necessary for the VIDS for effective operations.
If VDOT is willing to commit the resources to make the VIDS effective, VDOT's TMS Center should consider (1) mounting cameras over the travel lanes on approaches to the WW Bridge if suitable locations are available, (2) installing dedicated VIDS cameras on existing poles at the two locations that provide better camera placement for traffic monitoring (and possibly inci- dent detection, though the chance of incidents occurring at these locations is low), (3) using the Autoscope for detection at a traffic signal, and (4) exam- ining other VIDS for the TMS Center. The three Autoscope 2002 units should be exchanged for a 2003 model before any action is undertaken. Also, it will be necessary to make the software of the MIST and Autoscope 2003 compatible.
REFERENCES
lo Shepard, F. D. 1990. Demonstration projects concerning the alleviation of con- gestion on the Capital Beltway. Charlottesville: Virginia Transportation Research Council.
Virginia Department of Transportation. 1991. Memorandum of agreement" Capital Beltway video image detection system. Richmond.

FINAL REPORT
EVALUATION OF A VIDEO IMAGE DETECTION SYSTEM
B. H. Cottrell, Jr. Senior Research Scientist
INTRODUCTION
In 1988, a series of major accidents involving large trucks occurred on the Capital Beltway. These accidents resulted in major traffic congestion. In response to these accidents, top officials of the Virginia Department of Trans- portation (VDOT), the Maryland State Highway Administration (MSHA), and the Federal Highway Administration (FHWA) intensified their efforts to improve safety on the Capital Beltway. One strategy was to examine ways to improve incident management. A traffic accident, a disabled vehicle, and a spilled load are all incidents that reduce the highway's capacity. The FHWA had initiated a
program that involved the demonstration of incident management and the inte- gration of system strategies to combat urban freeway congestion. Subse- quently, VDOT and MSHA jointly prepared a proposal entitled "Demonstration Project Concerning the Alleviation of Congestion on the Capital Beltway" (also called the Virginia/Maryland Capital Beltway Demonstration Project). 1
The purpose of this demonstration project was to demonstrate and evalu- ate a video image detection system (VIDS) and the integration of traffic advisory radio and variable message signs (TAR/VMS). Shortly after the proposal was accepted by the FHWA, MSHA decided to locate the TAR/VMS on 1-95 near Bal- timore. VDOT proceeded to install, demonstrate, and evaluate the VIDS.
An advanced wide-area vehicle detection and traffic surveillance system processes input from a video camera to monitor traffic. VDOT's traffic manage- ment system (TMS) in Northern Virginia is a computerized highway surveillance and control system that monitors 48 km (30 mi) of 1-395, 1-495, and 1-66. To carry out this effort, 550 traffic counters (loop detectors) and 48 closed circuit television (CCTV) cameras are used to monitor these highways from the TMS Center in Arlington, Virginia.
An Autoscope VIDS was selected for this project because testing had shown it was the most advanced system available based on performance, reli- ability, and accuracy. The Autoscope, developed by Dr. Panos Michalopoulos of the University of Minnesota, uses a microprocessor, a digitizer, and a propri- etary board and software for real-time video image analysis and traffic parame-

ter extraction. Advanced machine-vision, pattern-recognition algorithms are used to detect vehicles under various environmental and traffic conditions. The detectors, count detectors, and speed zones are generated and configured on a video monitor through interactive graphics using a personal computer mouse. The detectors, including some that emulate loop detectors, can be moved and reconfigured relatively easily; the detectors appear as an overlay on a video monitor. One of the major advantages of VIDS over loop detectors is that there are no delays or congestion created by lane closures for installation and mainte- nance of detectors installed in travel lanes.
PURPOSE AND SCOPE
The purpose of this project was to evaluate the capabilities of a VIDS in the vicinity of the Woodrow Wilson Memorial Bridge (WW Bridge) on the Capital Beltway.
Existing hardware (that is, camera poles, cabinets, communication cables, etc.) was used for the VIDS as much as possible in order to fit it into the existing TMS Center operations and to minimize additional costs. A task force of representatives from the Traffic Engineering Division, VDOT's TMS Center, and the Research Council was responsible for managing the project.
METHODS
Four tasks were undertaken to accomplish the study's objectives:
1. Literature review: Literature on VIDS in general and the Autoscope in particular was obtained by a computerized literature search and from manufac- turers.
2. Selection of a consultant and video monitoring sites: A consultant was selected by VDOT to design and install the VIDS, integrate its various compo- nents, interface the loop detector system data with it, and assist in its evalua- tion. Two video camera sites were selected by the task force for use with the VIDS.
3. Monitoring of equipment installation and testing: The installation and testing activities of the consultant were monitored by the researcher and the staff of the TMS Center. Near the end of the testing, the consultant conducted VIDS training sessions for the TMS Center staff and the project's task force.
4. Data collection and evaluation: During the evaluation period, the VIDS data were downloaded weekly at the TMS Center and sent to the Research Council for compilation. Research Council staff made periodic visits to the TMS Center to review the operation of the VIDS. An evaluation of the VIDS was con- ducted using the following criteria: (1) accuracy and reliability of the VIDS in detecting incidents, (2) accuracy and reliability of the VIDS in measuring traffic flow parameters such as traffic volume, vehicle speed, lane occupancy, and vehicle classification per lane and approach, (3) problems encountered with the equipment, the amount of maintenance required, and cost of the equipment, and (4) the potential for using the VIDS at existing video camera surveillance sites.
RESULTS AND DISCUSSION
Literature Review
Because the Autoscope is relatively new, there is limited information available on its performance. In a study of a site on an interstate highway in Minneapolis, the overall performance of the Autoscope was found to have an
accuracy greater than 96 percent and a false alarm rate of less than 5 percent. 2
The Autoscope speed error was within 5 percent of actual speeds. 2 The Auto- scope data closely matched loop detector data for a 24-hr period. At this site, the cameras were placed directly over the travel lanes and were used only for the Autoscope. The study was performed by the University of Minnesota and Image Sensing Systems (ISS), which was co-developer of the Autoscope.
Selection of a Consultant and Site Selection
Since the VIDS and the Autoscope were new systems at the time this effort was initiated, there were a limited number of consulting firms that had experience with it. At the time, Farradyne Systems, Inc. (FSI) was the exclusive distributor for the Autoscope in the Northeastern United States. (In June 1991, Econolite became the exclusive manufacturer and distributor of the Autoscope.) Therefore, on February 22, 1991, VDOT contracted with FSI as the sole source consultant to design, install, and provide technical assistance for the operation of the VIDS. 3 Because the Autoscope did not have database management soft- ware, FSI was to integrate the Autoscope with their own software, the Manage- ment Information System for Traffic (MIST). MIST, an information management and control system that communicates with and controls traffic signal control- lers, was expanded to communicate with and control the Autoscope processor.

Because of the preponderance of traffic congestion resulting from inci- dents at the WW Bridge, cameras that monitor approaches to this bridge were selected for this project. The CCTV camera selected to monitor the northbound approach is located near the interchange of 1-95 (I-495 outer loop) and Tele- graph Road. This four-lane approach is about 2.4 km (1.5 mi) south of the WW Bridge. The six-lane WW Bridge is on 1-95 (also 1-495 inner loop) over the Poto- mac River. A CCTV camera located on the Maryland side of the bridge was selected to monitor the southbound approach to the WW Bridge. This camera is used to monitor bridge openings for large ships. The two cameras, mounted 18.3 rn (60 ft) above the roadway on poles, are located on the shoulder of the approach opposite the one it was selected to monitor.
The planning and design of the VIDS was completed by FSI. 4 The sys- tem's configuration is depicted in Figure 1. The loop detectors, detector amplifi- ers, and communication interfaces were installed to permit a comparison between the performance of the Autoscope and the loop detectors with respect to traffic monitoring and incident detection at each site. The VIDS Central Traf- fic Computer, which was an IBM PS2 Model 80, was equipped to accommodate up to 16 Autoscopes and to display and receive full motion video. The operating system (IBM's OS/2) combined multi-tasking support with graphical user inter- face. The VIDS software consisted of two servers, VIDS and SQL. The VIDS server processes communications information, records detector data, and mon- itors the detectors. Microsoft SQL Server software is the database management system.
At the request of the FSI project engineer, the format for daily and weekly reports to be generated by the software were developed by the task force. Only one summary table, which was a log for incident detection activities, was incor- porated into the software. FSI subsequently recommended against pursuing the generation of reports because of the substantial amount of time required for software development. FSI suggested that VDOT use SQL Server to develop the summary tables.
The Speed Profile Incident Evaluation System (SPIES) algorithm devel- oped for the Autoscope compares the difference between the upstream and downstream speed values to determine whether an incident has occurred. 4
The California Algorithm, which basically uses the difference in occupancy between adjacent detectors to identify an incident, was used for the loop detec- tors and served as the baseline algorithm. 4
Equipment Installation and Testing
Preliminary testing of the Autoscope was conducted in August 1991. During its preliminary use of the Autoscope, FSI observed that only the three or four lanes nearest to the camera could be monitored for speed because of the

°o•- E la•°° ° I• E
•°cz
Q•. Ir•<
--o 0 C)
D
0 n D •..o

camera's limited field of view. (Initially, the task force believed that a single camera could monitor both approaches.) ISS staff concurred with this observa- tion. Additionally, ISS staff revealed that cameras located adjacent to the road- way produced the best results for video detection. ISS and FSI staff evaluated videotapes from the camera at Telegraph Road and a camera at a site that was reasonably similar to the WW Bridge location. (The WW Bridge camera was not operational when the videotaping was done.) They concluded that the video from the site similar to the WW Bridge yielded reasonably accurate traffic data, and the results were superior to those generated at the Telegraph Road site. The Telegraph Road camera, which was farther away from the roadway than the WW Bridge camera, generated reasonably accurate speed measurements, which are needed to detect incidents.
There was concern by ISS and FSI regarding the use of the Telegraph Road site because the distance from the camera to the monitoring site was believed to be near the outer limit of the acceptable range. ISS strongly recom- mended that the camera used for the Autoscope be dedicated solely to Auto- scope vehicle detection. Initial plans were to use the camera not only for the Autoscope, which requires that the camera remain in a Kxed position, but also for traffic surveillance, which requires that the camera be moved and refocused routinely. The significance of camera placement and having a dedicated camera
was not obvious to the task force at the outset of the project. These concerns
were the first indication that there was some incompatibility between conditions at the two selected sites and the VIDS. The VIDS was designed for a dedicated camera located directly over the travel lanes for vehicle detection at a maximum distance of 152.5 m (500 ft) from the monitoring site. The optimum distance would be between 61 and 107 m (200 and 350 ft). At the Telegraph Road site, the camera pole is off to the side of the road about 12 rn (40 ft) from the shoul- der and about 300 m (1000 ft) from the travel lanes on a slightly curved section in the camera's field of view (see Figure 2). At the WW Bridge on the Maryland side, the camera pole is off to the side of the road about 5 rn (15 ft) from the shoulder and about 90 rn (300 ft) from the travel lanes in the camera's field of view (see Figure 3). VDOT agreed to install a dedicated camera for the Auto- scope at Telegraph Road and to use the WW Bridge camera for dual purposes• vehicle detection and surveillance. The camera at the WW Bridge is critical for monitoring the bridge. To aid the VIDS, the movement of this camera was to be restricted as much possible. This decision represented an effort to provide a dedicated camera for the Autoscope at one site, and to maximize use of the existing equipment at the other site.
VIDS installation began in May 1992. A list of the VIDS equipment and its cost is presented in Table 1. Because they were unable to make the VIDS operational by mid-May, the FSI staff proposed that the current version of the Autoscope, the 2003, replace the three 2002 units, which appeared to be the problem. In August 1992, ISS and FSI staff worked to resolve the problem that was encountered with the 2002 units. Incompatibility in communications

i•i•i •
a'•

,8, • "•
171

Table 1 VIDS EQUIPMENT AND ESTIMATED COSTS
Autoscope Processors (3) Site Electronics (detectors, amplifiers, processors, modems) Video Surveillance Cameras (2) VIDS Central Traffic Computer Miscellaneous parts Consultant Services Other Services Charges Consultant Net Fee
60,000 20,800 20,000 8,200 1,700
210,000 50O
28,300 Total Costs $ 349,500
between the Autoscope and VIDS software was identified as the major problem. An agreement was made between ISS and FSI to exchange the 2002 units for a 2003 model at the end of the demonstration period because factory mainte- nance and support for the 2002 models were to be discontinued. Subsequently, the calibration of algorithms for testing and incident detection was planned for between 2 and 4 weeks.
Other problems in the communication hardware and the network between the field sites and the TMS Center were identified during the extended installation and testing period and were resolved by December 1992. Testing was also hampered by video camera problems involving video signal reception and camera control. Because VDOT and FSI both had responsibility for certain aspects of the installation and testing, there was frequently a question about which party was responsible for a given task. The testing of the dual purpose camera at the WW Bridge was a challenge because the camera was routinely moved by TMS Center operators from its Autoscope video detection position to be used for surveillance. As a result, FSI chose to abandon efforts to thor- oughly test this site before the evaluation period. Training, which was con- ducted on November 16 and 30 by FSI staff, consisted only of an overview of the VIDS hardware on the first day and an overview of the software on the second day. The VIDS User's Manual, prepared by FSI, was used as the basis for the training. 5 Also, the system was not fully operational during the training ses- sions. The task force expected the training to be fairly detailed and to provide the TMS Center staff with considerable hands-on experience.
Data collection tests on the approaches closest to the camera began on December 1, 1992, for loop detector systems at both sites and for the Autoscope processing of the camera at Telegraph Road. Although the loop detector data appeared reasonable, there were some concerns about the Autoscope data. The Autoscope volume count was generally much higher than the loop detector count at the same site. ISS staff expected this somewhat higher volume count because the distance from the camera to the lanes is about twice the maximum recommended distance of 152.5 m (500 ft). Many false alarms that were most

likely caused by vehicle detection inaccuracies were recorded as incidents. FSI attempted without much success to fine-tune the Autoscope operations to mini- mize these inaccuracies. The testing period ended on January 15, 1993.
Evaluation Period and Performance of the VIDS
The 6-month evaluation period consisted of two phases: (1) a comparison of the traffic monitoring capabilities of the Autoscope and loop detectors (about 1 month) and (2) a study of the incident detection capabilities of the Autoscope (about 5 months). In phase one, the approach on the near side of the camera at each site was selected for traffic monitoring because the video image should have been better for the approach closest to the camera. If problems in vehicle detection were evident on the near side, it was likely that these problems would be increased on the far side, on which incidents were more likely to occur on the approaches to the WW Bridge. A detailed comparative evaluation of the Auto- scope and loop detector data was planned, including its performance during daylight and darkness and clear and inclement weather. Also, an evaluation of the Autoscope's vehicle classification scheme based on vehicle length was planned.
The evaluation periods for the Telegraph Road and WW Bridge sites began January 11 and January 15, 1993, respectively. Because of problems that are described in the next section, the evaluation periods were extended to 8 months to allow additional time for evaluation.
The Autoscope volume count was generally much higher than the loop detector count for both sites. A higher volume count continued at Telegraph Road where the distance from the camera to the lanes is about twice the recom- mended distance. Figure 4 depicts the Autoscope detector configuration at site 1. Also, at the WW Bridge, there was occlusion (vehicles, especially trucks, are detected in their proper lane and in an adjacent lane because of the angle between the camera and the travel lanes). The Autoscope detector configuration is shown in Figure 5. Moreover, the magnitude and randomness of the differ- ence between the Autoscope and loop detector data were concerns.
Another major problem encountered was the occasional breakdown of the VIDS central traffic computer system. Two steps were taken to resolve this problem: (1) the IBM PS2 computer was returned to IBM to correct two hard- ware problems, and (2) an updated version of MIST software was installed. The problem continued to occur, although less frequently. To diagnose this and other problems with the VIDS system, TMS Center and FSI staff first attempted to resolve them by telephone through a series of diagnostic steps on the VIDS. When these procedures proved unsuccessful, FSI staff visited the TMS Center. One possible explanation for the operational failures that sometimes occurred
10

Figure 4. Autoscope detector configuration at the Telegraph Rd. site.
Figure 5. Autoscope detector configuration at the WW Bridge site.
11

was electrical power interruptions at the TMS Center on weekends, during which the person assigned to the VIDS did not routinely work.
Following consultations with the ISS and Econolite staff on the quality of the data, the FSI staff concluded that improvements in quality at these two sites were unlikely. Because phase two of the evaluation involved monitoring the opposing travel approaches that are even further from the cameras, the quality of the data was expected to be even lower. Therefore, phase two was omitted, and the focus was on the resolution of software problems, especially the occa- sional computer breakdowns. Once this problem was resolved, the Autoscope was connected to an alternate site at which the camera position and road geo- metrics were more suitable for the VIDS. The major disadvantage of selecting an alternate site was that the potential for incidents decreased substantially because these sites had a low frequency of incidents. Consequently, although the primary objective of evaluating the VIDS for incident detection capability was not achieved, its traffic monitoring capability was assessed.
A review of the 48 camera locations revealed that only 2 were located directly over travel lanes•and neither of these were on the Capital Beltway. A location on 1-295 near the WW Bridge was selected, and the connection of the Autoscope at this site was begun in early June 1993 and completed in Septem- ber. It was originally planned that this third site would be configured to detect incidents. However, the staff of FSI and Econolite elected to set up detectors for traffic monitoring only because this site was not receiving consistent speed readings. It was their opinion that consistency in speeds would be maximized by focusing the camera on a smaller section of the highway. Nevertheless, vari- ations in the speed data that were unsupported by observations continued. The detectors were reconfigured, and consistency in speed readings was real- ized.
Because of the problems with the data generated by the Autoscope at sites 1 and 2, a comprehensive data analysis was not performed. Because the vehicle detection reliability was low, there was no value in analyzing the Auto- scope's incident detection and vehicle classification capabilities. In fact, vehicle classification was neither made operational nor tested. Data from selected peri- ods of time were analyzed and are discussed below.
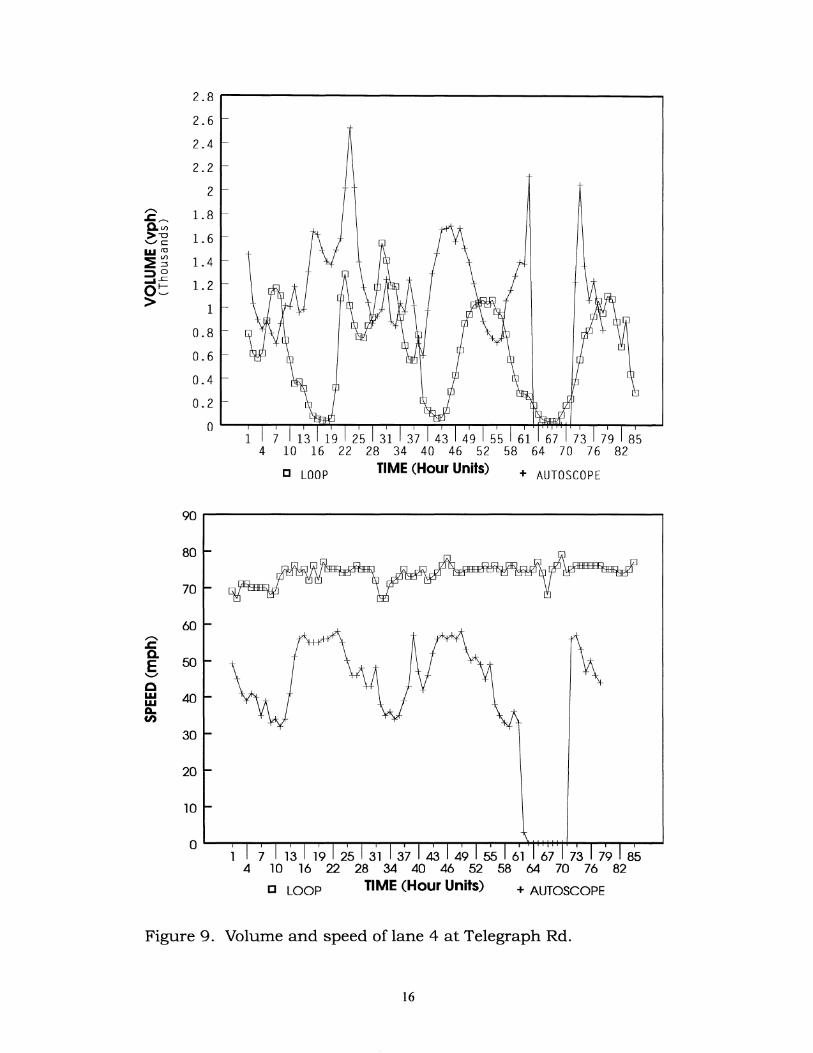
Site 1" Telegraph Road, Southbound
Volume and speed data for the Autoscope and loop detectors by lane for the week ending March 9, 1993, are graphically displayed in Figures 6 through 9. The Autoscope volumes are higher than the volumes generated by the loop detectors. Also, the Autoscope speeds are generally lower than those produced by loop detectors. The Autoscope speeds in lane 2 track the loop detector speeds closer than the other lanes. In general, the loop volume and speed data
12

1•7 73
7918s 4 10 16 22 28 34 40 46 52 58 64 70 76 82
[] LOOP TIME (Hour Units) + AUTOSCOPE
8O
7O
6O
5O
40
• 3O
2O
10
4 10 16 22 28 34 40 46 52 58 64 70 76 82
[] LOOP TIME (Hour Units) + AUTOSCOPE
Figure 6. Volume and speed of lane 1 at Telegraph Rd.
13

85 4 ]0 16 22 28 34 40 46 52 58 64 70 76 82
[] LOOP TIME (Hour Units)
+ AUTOSCOPE
7O
Figure 7. Volume and speed of lane 2 at Telegraph Rd.
14

2.8
2.6
2.4
2.2
2
1.8 •
1.6
1.4
1.2
0.8
0.6
0.4
0.2
• 1131 19
2sl31 3
7•17918s 4 10 16 22 28 34 40 46 52 58 64 70 76 82
[] LOOP TIME (Hour Units)
+ AUTOSCOPE
8O
7O
6O
• • 1•311•125131 137143149155161
4 10 16 22 28 34 40 46 52 58 64 70 76 82
[] LOOP TIME (Hour Units) + AUTOSCOPE
Figure 8. Volume and speed of lane 3 at Telegraph Rd.
15
2.6
2.4
2.2
_• 1.8
•'-• 16
:• 1.4
--'• 1 2
1
0.8
0.4
67 85 4 10 16 22 28 34 40 46 52 58 64 70 76 82
I:::! LOOP TIME (Hour Units)
+ AUTOSCOPE
90
80
70
60
•= 5O
'•' 40
30
20
lO
o I1 llbl l '11 'z14 14bl, l 1\i ,zlz lzbl '""
4 10 16 22 28 34 40 46 ,52 ,58 64 70 76 82
[] LOOP TIME (Hour Units) + AUTOSCOPE
Figure 9. Volume and speed of lane 4 at Telegraph Rd.
16

appear in a smooth and consistent pattern, whereas the Autoscope data are erratic for each of the four lanes.
Link or approach volumes and speeds for the week ending April 12, 1993, are shown in Figures 10 through 13. The loop detector volume curves are simi- lar, as would be expected for upstream and downstream volumes at the same site. The Autoscope upstream and downstream volumes are different. The speed data yield the same similarities and differences as the volume data.
The mean difference, standard deviation, and mean percentage of differ- ence for volumes and speed in lane 3 downstream are shown in Table 2. Similar statistics for link data for the week ending April 12, 1993, are shown in Table 3. The link volume and speed differences are much greater than volume and speed differences for each lane because all lanes are combined for the link data. These values also reflect the substantial difference between the Autoscope and loop detection data.
14
13
12
11
10
9
-,• 6 O--- >' 5
1111211311411s11611711811911101111111211131114111S1 16 26 36 46 56 66 76 86 96 106 116 126 1:36 146
LOOP TIME (15-MIN INTERVALS) + AUTOSCOPE
Figure 10. Upstream link volumes at Telegraph Rd.
17

12
11
10
9
8
2
1111211•l141tSl1611z11•ll•ll•O11111112111•ll•4111Sl 6 16 26 36 46 56 66 76 86 96 106 116 126 136 146
[] LOOP TIME (15-MIN INTERVALS)
+ AUTOSCOPE
Figure 1 1. Downstream link volumes at Telegraph Rd.
8o
2o
10
6 16 26 :36 46 56 66 76 86 96 106 116 126 1:36 146
[] LOOP TIME (15-MIN INTERVALS) + AUTOSCOPE
Figure 12. Upstream link speed at Telegraph Rd.
18

8O
7O
6O
5O
4O
3O
2O
10
111121131141151161171181191 11011111J1211131t14111,51 6 16 26 36 46 56 66 76 86 96 106 116 126 136 146
Figure 13. Downstream link speed at Telegraph Rd.
Table 2 STATISTICS FOR SITE 1, LANE 3 WEEK ENDING MARCH 9, 1993
Volume Speed Difference % Difference Difference % Difference
Mean Standard Deviation
873 142 -14 -23 215 102 5 7
Difference Autoscope Loop % Difference Autoscope is x % of Loop
Table 3 STATISTICS FOR SITE 1, LINK WEEK ENDING APRIL 12, 1993
Volume Speed Difference % Difference Difference % Difference
Upstream Mean Standard Deviation Downstream Mean Standard Deviation
4040 276 -25 -37 2880 292 17 27 2755 213 -20 -31 1728 207 16 32
Difference Autoscope Loop % Difference Autoscope is x % of Loop
19

Site 2" WWBridge, Northbound
Volume and speed data for the Autoscope and loop detectors by lane from the week ending March 1, 1993, are in Figures 14 through 16. The percentage of difference between the Autoscope and loop detector data is greater than the difference at site 1. It is not known why the Autoscope speed data have many zero values. Statistics for lane 1 that also portray this difference are presented in Table 4. Occlusion may be the major factor in the high Autoscope volume counts. The additional counts caused by occlusion may be higher than those caused by the longer distance from the camera to the monitoring site at site 1. Also, site 2 was especially a problem because of the need to move the camera for surveillance of the bridge. Pavement markings were placed on the pavement to mark the perimeter of the Autoscope detectors interactively drawn on the screen. Although the markings assisted in returning the camera to its Auto- scope monitoring position, it was difficult to accurately restore the camera to its original position. This repositioning of the camera may be one reason the differ- ence in the two detectors is greater at site 2. The data collection period was lim- ited to about 3 months for site 2 because it was useless to continue data collection under these conditions.
Table 4 STATISTICS FOR SITE 2, LANE 1 WEEK ENDING MARCH 1, 1993
Volume Speed Difference % Difference Difference % Difference
Mean Standard Deviation
2375 323 -43 -65 2147 376 22 34
Difference Autoscope Loop % Difference Autoscope is x % of Loop
Site 3" 1-295 near the WW Bridge, Northbound
A section of 1-295 near the WW Bridge was selected because the camera position was such that it appeared that the camera was directly over the two northbound lanes, which is the ideal camera position (see Figure 17). Because there were no loop detectors near the study section, the Autoscope volume data were analyzed by manually counting the traffic from a videotape of the site. To minimize the amount of effort for this labor intensive task, it was decided that at least 500 vehicles across each detector would be examined. This volume level was satisfied by analyzing about 15 minutes of the videotape. The Autoscope and manual volume counts and the percentage of difference are shown in Table 5 for each of the four detectors. The percentage of difference, which ranged from 2 to 7 percent (4 percent for all detectors), is much smaller than the differ- ences obtained at sites 1 and 2. It was also observed that the standard devia- tion of the Autoscope speed was much smaller than at the other sites. However,
2O

6
3
21 29 37 45 53 61 69 77 85 93 101 109
LOOPS TIME UNITS (hr)
+ AUTOSCOPE
90
8O
7O
60
5O
40
5 13 21 29 37 45 53 61 69 77 85 93 101 109
[] LOOPS TIMI= UNITS (hr) + AUTOSCOPE
Figure 14. Volume and speed of lane 1 at WW Bridge.
21

10
i,,,• •,-- 17 2,5 33 41
49J57 5 13 21 29 37 45 53 61 69 77 85 93 101 109
[] LOOPS TIME UNITS (hr) + AUTOSCOPE
8O
7O
6O
5O
40
• 30
2O
10
5 13 21 29 37 45 53 61 69 77 85 93 101 109
[] LOOPS TIMI• UNITS (hr) + AUTOSCOPE
Figure 15. Volume and speed of lane 2 at WW Bridge.

5 13 21 29 37 45 53 61 69 77 85 93 10 109
[] LOOPS TIME UNITS (hr) + AUTOSCOPE
Figure 16. Volume and speed of lane 3 at WW Bridge.
23

Figure 17. 1-295 near the WW Bridge with the camera position directly over the lanes.
Table 5 VOLUME COUNTS FOR SITE 3
Autoscope Actual % Difference
Left Lane Downstream Left Lane Upstream Right Lane Downstream Right Lane Upstream All Detectors
541 550 -2 516 550 -7 488 505 -3 481 505 -5
2026 2110 -4
% Difference Autoscope is x % of the Actual
the average speed measured by the Autoscope was about 130 kph (81 mph). FSI staff attempted to calibrate the speed based on the assumption that the normal speed would be about 88 kph (55 mph), which is the speed limit. It is obvious that the speed calibration was off substantially; a realistic speed range would be 88 to 104 kph (55 to 65 mph).
Next Generation of VIDS
Improvements are continuing to be made to the Autoscope, and other VIDS are in the testing and developmental stages. A substantially improved
24
incident detection algorithm, vehicle tracking capability, and a license plate reader are under development for the Autoscope. A Mobilizer system by Condi- tion Monitoring Systems using third-generation tracking technology is under field demonstrations. Cruise Video Traffic Management System, which is an advanced machine vision sensor coupled with advanced information manage- ment capabilities, is currently being field tested by 3M. The trend is toward integrated systems with video image detection and information management. Although these developments with VIDS are promising, it is likely that the loca- tion of the video camera will remain a critical factor for effective operations of a VIDS.
CONCLUSIONS AND RECOMMENDATIONS
VIDS Evaluation and Performance
lo Although the primary objective of assessing the performance of the VIDS for incident detection was not accomplished, an examination of its capability to monitor traffic did take place. The VIDS performed unsatisfactorily at the Telegraph Rd. and WW Bridge sites because vehicle detection was inade- quate. The location of the video camera, which is critical to the effective operation of the VIDS, was the major cause of the unsatisfactory perfor- mance. Based on a limited evaluation of volume count only, the VIDS per- formed satisfactorily at site 3.
In general, the Autoscope, which was designed for camera placement directly over the travel lanes, has limited potential for use in the existing camera locations used by the TMS Center. It could only be used at two of these locations.
It is difficult to accurately return an Autoscope camera to its monitoring position after it is moved for surveillance. Therefore, a dedicated Autoscope camera is necessary for the VIDS.
If VDOT is willing to commit the resources to make the VIDS effective, VDOT's TMS Center should consider (1) mounting cameras over the travel lanes on approaches to the WW Bridge if suitable locations are available, (2) installing dedicated VIDS cameras on existing poles at the two locations that provide better camera placement for traffic monitoring (and possibly inci- dent detection, though the chance of incidents occurring at these locations is low), (3) using the Autoscope for detection at a traffic signal, and (4) exam- ining other VIDS for the TMS Center. The Autoscope 2002 units should be exchanged for a 2003 model before any action is undertaken. Also, it will be necessary to make the software of the MIST and Autoscope 2003 compati- ble.

ACKNOWLEDGEMENTS
Special thanks are extended to Frank Shepard for initiating this research project. The contributions of the following are appreciated" Jimmy Chu, Lyn- wood Butner, Bill Tackett, R. Marty Long, Jim Robinson, Tom Jennings, and Bob Thomas for serving on the task force; Jan Kennedy and Steve Blackwell for data analysis; Marlowe Dixon, VDOT TMS Center, for data collection and VIDS monitoring; Jan Kennedy, Mike Perfater, Gary Allen, Jimmy Chu, Cathy Cragg, Mike Fitch and Bob Thomas, FHWA, for reviewing the final report; Linda Barsel for preparing the final report; and Roger Howe for editing the final report. The study was supported by a contract through the Federal Highway Administra- tion.

REFERENCES
Shepard, F. D. 1990. Demonstration projects concerning the alleviation of congestion on the Capital Beltway. Charlottesville: Virginia Transportation Research Council.
Michalopoulos, P. G., et al. 1993. Automatic incident detection through video image processing. Traffic Engineering and Control. London.
Virginia Department of Transportation. 1991 Memorandum of agreement: Capital Beltway video image detection system. Richmond.
Farradyne Systems, Inc. 1991. General functional description of the video image detection system evaluation project (draft). Prepared for the Virginia Department of Transportation. Rockville.
So Farradyne Systems, Inc. 1992. Video image detection system user's manual. Prepared for the Virginia Department of Transportation. Rockville.
27