Council Chambers 1 January 23, 2019 - Fort Erie
39
2019 Water & Wastewater Budget Council Chambers January 23, 2019 1
Transcript of Council Chambers 1 January 23, 2019 - Fort Erie

2019
Water & Wastewater
Budget
Council Chambers
January 23, 2019 1

Presentation Agenda
1) Service Delivery Overview
2) Budget: Inputs
3) Budget: Rate Setting
4) Risks & Opportunities
5) Conclusion
6) Presentation Questions
2

1) Service Delivery Overview
Customers: 13,300 (95% residential; 5% ICI)
System: 268 km watermains; 193 km sanitary sewers; 1541 fire hydrants
Safe Drinking Water Act
Legislated Full Cost Recovery Avoid deferring burden to future generations
Reliable System (i.e., Availability, flow & pressure)
Quality of Life Eliminate basement flooding/sewer backups
Protection of natural environment
Cost control 3

1) Service Delivery Overview
– Council Responsibilities
Municipal Officials legislative responsibilities:
“Taking Care of Your Drinking Water – A Guide For Members Of Municipal Councils”
“Standard of Care”
Last presented September 2016
New presentation for all municipal Councils to be coordinated by the Region in 2019
4

1) Service Delivery Overview
- Departmental Responsibilities
5
Corporate & Community Services
Billing & Collections, Customer service, Digital services
Infrastructure Services
Engineering, Capital, Operations & Maintenance,
Compliance, Customer Service

6

1) Service Delivery Overview
- Operational Commitments
Legislative Compliance
Conformance and Maintenance of Accreditation
Reduce ‘Non-Revenue’ Water Volumes ($1M problem)
Capital Investment - Watermain Replacement
Completion of Water Meter Exchange program
Ongoing focus on Leak Detection, tracking & repair programs
Reduce Infiltration to Sanitary Sewer System ($4M problem)
Capital investment – Investigation, repair, replacement, monitoring
Programs: Annual Target of Exflow Areas (e.g., Lateral replacement, disconnections)
Capture new development issues before they start
Leverage Funding Opportunities
Pursue operating (e.g., CSO) & capital (e.g., OCIF) programs
Grants Oversight Team
7

1) Service Delivery Overview
- Operational Challenges
Recruitments & aging workforce (expected retirements)
40 Watermain breaks in 2018: down compared to historical average of 50
Legislative requirements for new water projects
Anticipated legislation for the sewer system similar to the water system (QMS-based)
Commercial and industrial meter replacement program
8

9
2) Budget: Inputs
- Budget Overview
Customer Rates are a function of:
1. Expenses & Other Revenues
a) Regional treatment costs and volume estimates
b) Town expenses (i.e., operations, billing) and other revenues
c) Financing & Transfers
d) Supplementary budget requirements
2. Rate Setting
a) Customer volumes
b) Town’s billing methodology

2) Budget: Inputs
- Total Expenses
Regional Treatment
costs 60%
Wages & Benefits
11%
Materials & Supplies
7%
Infrastructure Reserves 20%
Debt costs 2%
Total: $19,165,300 10

2) Budget: Inputs
- Regional Treatment Costs
Increase in budget of $561,498 or 3.09%
60% of Town’s budget:
Status of Region rates: Budget Review Committee Jan
24/19 and Council By-law Feb 7/19
Proposed net budget increase of 5.15% (Water budget
increase of 3.8% and Wastewater increase of 6.0%).
FE water volume share: down 1.4%.
FE wastewater volume share: up 0.1%.
2020 to 2024 forecasts include 5.15% increase annually. 11

2) Budget: Inputs
- Regional Treatment Costs No change in Regional billing formulas:
Water charge
75% variable & 25% fixed
Wastewater charge
100% fixed apportioned on prior 3 year average volumes.
2019 reconciliation adjustment for 2017 actual flows is a
charge of $327,701 as volumes were higher than estimated.
2020 estimate is credit of $190,000 based on 2018 actual
flows. 12
2) Budget: Inputs
- Expenses & Other Revenue
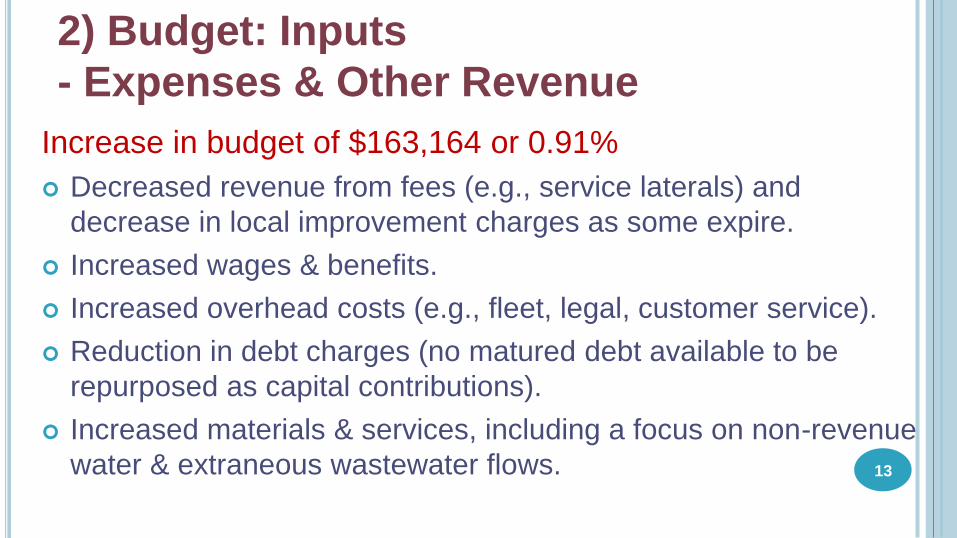
Increase in budget of $163,164 or 0.91%
Decreased revenue from fees (e.g., service laterals) and
decrease in local improvement charges as some expire.
Increased wages & benefits.
Increased overhead costs (e.g., fleet, legal, customer service).
Reduction in debt charges (no matured debt available to be
repurposed as capital contributions).
Increased materials & services, including a focus on non-revenue
water & extraneous wastewater flows. 13

2) Budget: Inputs
- Program Expenses
Maintain the Water Emergency Relief Fund (WERF)
at $15,000 for low income families.
Maintain the Seniors Utility Relief Fund (SURF) at
$21,000 for low income seniors.
KW: Lateral Replacement Program
14

2) Budget: Inputs
- Financing & Transfers
Increase in budget of $380,003 or 2.08% Reduced contribution to Water & Sewer Rate Stabilization
Reserves of $40,000 to mitigate current year pressures.
Decreased costs by using Sewer Rate Stabilization Reserve to fund reconciliation charge of $327,701; Overall charge decrease from 2018 of $370,003.
Increase in capital contributions of $50,000 from recommendations of 2017 Water Master Plan.
No change to annual Sewer Rate Stabilization Reserve contributions, pending 2019 Sewer Master Plan.
15

2) Budget: Inputs
- Capital
Capital Budget to be presented to Council February 6, 2019.
No new Water or Wastewater capital assets forecast for 2019.
Master Servicing Plans identify priority replacement Water Distribution System Master Plan: Update completed June/17
(IS-17-2017).
Wastewater Master Plan: To be completed in 2019 and will estimate
annual Life Cycle Costs and propose a funding strategy. Budget
implications will be brought forward to 2020 budget.
Both rely on funding from Development Charges. Alternatively,
reduced DCs place considerable pressure on utility rates. 16

2) Budget: Inputs
- Capital
17
Infrastructure Reserve Funding: proposed 2019 changes
No repurposed debt [2018: $328,157 ]
2018 Reserve
Actual
2019 Reserve
Proposed
Target
contribution
Water Capital Reserves $1,993,642 $2,043,642 $2,193,054
Wastewater Capital Reserves 1,627,500 1,627,500 2,204,315
TOTAL $3,621,142 $3,671,142 $4,397,369
% of Target 82% 83%

2) Budget: Inputs
- Reserves
Rate Stabilization Reserves are key to mitigating annual
increases due to:
Unknown Regional budget increases.
Unknown proportionate share changes.
Unknown future treated volumes (e.g., 2020 adjustment
expected to revert to a $190,000 credit).
18

2) Budget: Inputs
- Revenue & Expense Summary
19
$ Increase/
(Decrease)
% Increase/
(Decrease)
2018 Rate Revenue $18,196,737
Net Revenue decrease 68,237 0.38%
Net Expense increase 94,927 0.53%
Regional Treatment Costs 561,498 3.09%
Financing & Transfers (net of funded reconciliations) 10,000 0.05%
2019 Budget increase $734,662 4.04%
2019 Rate Revenue $18,931,399

2) Budget: Inputs
- Revenue & Expense Comparison
20
$
2018
Budget
$
2019
Budget
$
Increase/
(decrease)
%
Increase/
(decrease)
of Total
%
Increase/
(decrease)
over Prior
Prior Rate Revenue $18,196,737
Town net cost 7,545,550 7,718,714 173,164 0.95% 2.24%
Region net cost
(excl. reconciliation)
10,711,187 11,272,685 561,498 3.09% 4.98%
Budget increase $734,662 4.04%
Final Rate Revenue $18,196,737 $18,931,399 $18,931,399

3) Budget: Rate Setting
1. Customer Consumption volumes
Opportunity to address given slight increase of overall costs.
Adjustments to water & wastewater volumes based on 2018
budget & projections.
2. Town’s billing methodology
Base charge vs. volumetric charge.
Municipal trends.
21

3) Budget: Rate Setting
- Total Revenue
Water Billings 44%
Wastewater Billings
54%
Local Improvement
Charges 1%
Interest, Penalties, user Fees
1%
Total: $19,165,300 22

3) Budget: Rate Setting
- Consumption Volumes: Water
2018: Volume of 2.77 million m3 in rate calc:
Decreased 56,501 m3 or 2.0% in 2018 over 2017 volumes.
Est. 2018 actual volumes 0.9% lower than budget.
2019: Volume of 2.74 million m3 in rate calc:
Decreased 27,686 m3 or 1.0% over 2018 volumes.
Narrow gap with additional 2019 volume reduction.
Below 5-yr average by 1.3%.
23

3) Budget: Rate Setting
- Treated Volumes: Wastewater
2018: Volume of 2.47 million m3 in rate calc:
Decreased 50,319 m3 or 2.0% in 2018 over 2017 volumes.
Projected 2018 actual volumes 5.1% lower.
2019: Volume of 2.44 million m3 in rate calc:
Decrease 24,656 m3 or 1.0% over 2018 volumes.
Narrow gap with additional 2019 volume reduction.
Over 5-yr average by 0.9%.
24

3) Budget: Rate Setting
- Billing Methodology
25
Balancing act between base & volumetric
Priority has been on mitigating revenue shortfalls due to
decline in volumes
Making progress toward objective of:
Charging proportionately less to base. Volumetric weighting
gives homeowner more control over cost.
Decreasing risk of revenue shortfalls through better
consumption estimates.

3) Budget: Rate Setting
- Base charge
Base charge for stability and sufficiency:
2019 combined monthly base of $66.33.
No increase.
Niagara base average is 43% of monthly bill
2018 was 58%; 2019 is 55%.
Fort Erie is 2nd highest in Niagara.
5-yr forecasted decrease to 49%.
26

3) Budget: Rate Setting
- Base charge challenge
1.0
11.0
21.0
31.0
41.0
51.0
61.0
71.0
23.7
40.2 44.8
54.7 55.8 61.7 61.8
65.9 69.5
76.1
Connections/km
27

3) Budget: Rate Setting
- Municipal Burden Comparison
28
$3,800
$3,900
$4,000
$4,100
$4,200
$4,300
$4,400
$4,500
$4,600
2017 FIR
Source: BMA Municipal Study 2018

3) Budget: Rate Setting
- Volumetric rate
Volumetric Rates for control & conservation:
$3.060/m3 2018 current combined rate
$3.347/m3 2019 proposed combined rate
Niagara combined volumetric rate for 2018:
Average 2018 of $3.055/m3, min of $2.216/m3, max of $4.592/m3.
TOFE 2019 of $3.347/m3 above 2018 avg.
29

3) Budget: Rate Setting
- Water (residential ¾” meter)
Water Base Charge
= ((Region costs + net Town costs) x 51%) / #accts / 12 months
= (($3,722,894 + $4,608,382) x 51%) / 14k / 12
= $25.27/mos
Water Unit Charge:
= (Total costs - Base charge revenue) / volume
= ($8,331,276 - $4,211,724) / 2.74M m3
= $1.503/m3
30

3) Budget: Rate Setting
- Wastewater
Wastewater Base Charge
= ((Region costs + net Town costs) x 58%) / #accts / 12 months
= (($7,817,492 + $2,782,631) x 60%) / 12k / 12
= $41.06/mos
Wastewater Unit Charge:
= (Total costs - Base charge revenue) / volume
= ($10,600,123 - $6,098,948) / 2.44M m3
= $1.844/m3
31

3) Budget: Rate Setting
- INCREASE SUMMARY
2018 2019 % increase $ increase
Water/month $48.63 $49.32 1.42% $0.69
Wastewater/month $66.66 $70.56 5.85% $3.90
Monthly total $115.29 $119.88 3.98% $4.59
Annual total $1,384 $1,439 3.98% $55
32
Household cost of $3.94 per day Based on average consumption of 16m3/month

33
3.98%
1.82%
3.93%
4.74%
2.06%
0.00% 0.00%
1.00%
2.00%
3.00%
4.00%
5.00%
6.00%
2019 2018 2017 2016 2015 2014
Water & Wastewater bill increase by year
3) Budget: Rate Setting
- Rate History & Forecast
Forecast for 2020-2024 is approx. 3.89% / year

4) Risks & Opportunities
- Risks
34
Weather: impacts consumption trends & maintenance costs.
Volumetric vs. base rate: revenue risk from volume variances.
Wastewater treatment adjustment: impact on rate reserve.
Consumer shifts: impacts from changes to large consumers.
Legislative compliance: DWQMS extended to wastewater.
Provincial comparisons: relatively high Residential rate & low
Commercial and Industrial rates.
Reserves: < provincial average. Targeting improvements.

4) Risks & Opportunities
- Opportunities
Infrastructure funding: 1% rate increase provides $197,000 in additional capital reserve contributions.
Grant funding: applying for government programs where possible (e.g., Regional CSO, OCIF).
Meter change out program: reduced meter reading costs, improved customer service, greater accuracy.
Financial sustainability: indicators better than BMA averages
W WW W WW
• Asset consumption ratio: 31% 31% < Avg 34% 35%
• Debt charge % of revenue: 0.4% 1.1% < Avg 2.0% 3.7% 35

4) Risks & Opportunities
- Typical Use & Comparisons
$ per
litre
Cost
multiplier
Pepsi $0.9800 300 x
Gasoline $0.9500 285 x
Water - bottled
(24x500ml case)
$0.2500 75 x
Water - Town
(incl wastewater)
$0.0033 n/a
36

5) Conclusion
- Summary Costs: Town increase of 2.24% + Region increase of 4.98% for
a combined budget increase of 4.04%.
Rates: When costs distributed over estimated volumes for 2019, the net increase for the average household is 3.98%.
Alternatives: Approval of final rate structure by upcoming Regional Council will determine impact and any opportunities.
Recommendation: THAT Council revises the 2019 Water and Wastewater Base and Consumption rates, subject to Regional Council approval of forecasted treatment rates, effective with billing for January 2019 consumption [as noted in CBC-01-2019]
37

5) Conclusion
- Next Steps Water & Wastewater Budget & User Fees:
Feb 11 By-laws: W&WW and Fees
Capital Budget & Forecast
Feb 6 Budget-in-Committee: reports & presentation - Town
Mar 25 By-laws: Levy & General Capital
General Levy Budget: Feb 20 Budget-in-Committee: reports & presentation - Library & EDTC
Mar 5 Budget-in-Committee: reports & presentation – Town #1
Mar 20 Budget-in-Committee: follow-up – Town #2 (if necessary)
Mar 25 By-laws: Levy & General Capital (timing depends on above) 38

6) Presentation Questions
39
Please refer to Council Report No. CBC-01-2019 for further information