Coumarin Based Highly Sensitive and Selective Ratiometric Fluorescence Sensor … · Ratiometric...
14
International Journal of Research and Scientific Innovation (IJRSI) | Volume IV, Issue X, October 2017 | ISSN 2321–2705 www.rsisinternational.org Page 89 Coumarin Based Highly Sensitive and Selective Ratiometric Fluorescence Sensor for Chromium Ions in Aqueous Media Subarna Guha Central Institute of Plastic Engineering and Technology, Haldia, West Bengal, India Abstract: - A fluorescent sensor, 6-(bis((1H-benzo[d]imidazol-2- yl)methyl)amino)-2H-chromen-2-one (BIC), based on 2- chloromethyl benzimidazole with 6-amino coumarin as receptor, was synthesized. Both BIC and its Cr(III) complex are well characterized by different spectroscopic techniques like 1 HNMR, QTOF–MS ES + , FTIR and elemental analysis as well. BIC exhibits fluorescence enhancement upon binding Cr(III) in aqueous (water: methanol =7:3, v/v) solutions. Detection limit of the method is 1 x10 -7 M. Binding constant is estimated with the Benesi-Hildebrand method and the value 1.39 x10 5 indicates a fairly strong interaction between BIC and Cr(III) . There has no fluorescence response seen towards other competing cations. BIC a water soluble off-on type ratiometric Cr(III) selective fluorescent probe and used for biological applications like living cell imaging at physiological pH using a confocal microscope. The fluorescence enhancement can be ascribed to the CHEF effect associated with better rigidity and planarity of the sensor molecules induced by chelation of Cr(III). The design strategy and remarkable photophysical properties of sensor BIC help to extend the development of fluorescent sensors for metal ions. Keywords: Coumarin, 2-chloromethyl benzimidazole, Turn-on fluorescent probe, Cr(III), living cells. I. INTRODUCTION hromium is the new entry, after lead, cadmium and mercury in the major toxic metal series. Chromium exists in the environment mainly in two stable oxidation states, Cr(III) and Cr(VI). This two species differ in charge, physicochemical properties and in chemical and biological reactivity. Trivalent chromium is relatively immobile and less toxic because its compounds are usually weakly soluble in aquatic media and it also forms stable complex with soil minerals. Cr(III) is an essential micro nutrient for maintenance of ―glucose tolerance factor‖ whereas excess Cr(III) is harmful to human health [1]. The National Research Council has recommended 50–200 μg d −1 as the safe and proper quantity of Cr(III) .On the other hand, Cr(VI) is extremely toxic and potentially carcinogenic [2]. WHO states that the guideline values of 50 μg L −1 Cr(VI) are considered to be too high compared with its genotoxicity [3]. Higher oxidation potential and relatively smaller size of Cr(VI) enables it to penetrate biological cell membranes. Cr(III) has great impacts on the metabolism of carbohydrates, fats, proteins and nucleic acids by activating certain enzymes and stabilizing proteins and nucleic acids [4]. Insufficient dietary intake of Cr(III) leads to increases in risk factors associated with diabetes and cardiovascular disease, including elevated levels of circulating insulin, glucose, triglycerides and total cholesterol, and impaired immune function [5]. Chromium can be also released to the environment from anthropogenic sources because it is widely used in manufacturing processes such as tanning, steel works, plating, corrosion control, chromate and chrome pigment production [6-8]. At the same time, it is an environmental pollutant that has caused concern in industry and agriculture, [9] and so systematic investigations into the specific detection of Cr(III) still need to be developed, especially for aqueous systems [10]. Severe matrix interferences restrict its direct determination with sufficient sensitivity and selectivity with flame atomic absorption spectrometry (FAAS) [11, 12], graphite furnace atomic absorption spectrometry (GFAAS) [13, 14], inductively coupled plasma atomic emission spectroscopy (ICPAES) [15], X-ray fluorescence spectrometry [16] and electrochemical methods [17-18]. Some forms of preliminary separation and pre-concentration like liquid–liquid extraction [19-20], cloud point extraction [21], ion-exchange [22, 23] and solid phase extraction [24-26] etc. are required. Fluorescence method has more advantages over all the other mentioned methods due to its operational simplicity, high selectivity, sensitivity, rapidity, nondestructive methodology, enhanced sensitivity, high sampling frequency and low cost of equipment and direct visual perception [27]. For an efficient fluorescent sensor, in addition to high selectivity towards the target ion, a significant change in the fluorescence intensity and /or a spectral change of the probe are essential upon its interaction with the specific analyte [28]. Paramagnetic property of Cr(III) and lack of Cr(III) selective ligand are the two major culprits for the development of suitable fluorescent turn-on sensors for monitoring intracellular Cr(III). Samanta et al. [29] reported di-(2- ethylsulfanylethyl)amine as a Cr(III) selective receptor in tetrahydrofuran. Liu et al. [30] reported two fluorescent sensors capable of discriminating Fe(III) and Cr(III) . 8- hydroxyquinoline containing rhodamine B derivative [31] is used for bio-imaging of Cr(III) in contaminated cells. Zhou et al. [32] reported a ratiometric FRET-based fluorescent probe C
Transcript of Coumarin Based Highly Sensitive and Selective Ratiometric Fluorescence Sensor … · Ratiometric...

International Journal of Research and Scientific Innovation (IJRSI) | Volume IV, Issue X, October 2017 | ISSN 2321–2705
www.rsisinternational.org Page 89
Coumarin Based Highly Sensitive and Selective
Ratiometric Fluorescence Sensor for Chromium Ions
in Aqueous Media
Subarna Guha
Central Institute of Plastic Engineering and Technology, Haldia, West Bengal, India
Abstract: - A fluorescent sensor, 6-(bis((1H-benzo[d]imidazol-2-
yl)methyl)amino)-2H-chromen-2-one (BIC), based on 2-
chloromethyl benzimidazole with 6-amino coumarin as receptor,
was synthesized. Both BIC and its Cr(III) complex are well
characterized by different spectroscopic techniques like 1HNMR,
QTOF–MS ES+, FTIR and elemental analysis as well. BIC
exhibits fluorescence enhancement upon binding Cr(III) in
aqueous (water: methanol =7:3, v/v) solutions. Detection limit of
the method is 1 x10⁻⁷ M. Binding constant is estimated with the
Benesi-Hildebrand method and the value 1.39 x10⁵ indicates a
fairly strong interaction between BIC and Cr(III) . There has no
fluorescence response seen towards other competing cations. BIC
a water soluble off-on type ratiometric Cr(III) selective
fluorescent probe and used for biological applications like living
cell imaging at physiological pH using a confocal microscope.
The fluorescence enhancement can be ascribed to the CHEF
effect associated with better rigidity and planarity of the sensor
molecules induced by chelation of Cr(III). The design strategy
and remarkable photophysical properties of sensor BIC help to
extend the development of fluorescent sensors for metal ions.
Keywords: Coumarin, 2-chloromethyl benzimidazole, Turn-on
fluorescent probe, Cr(III), living cells.
I. INTRODUCTION
hromium is the new entry, after lead, cadmium and
mercury in the major toxic metal series. Chromium exists
in the environment mainly in two stable oxidation states,
Cr(III) and Cr(VI). This two species differ in charge,
physicochemical properties and in chemical and biological
reactivity. Trivalent chromium is relatively immobile and less
toxic because its compounds are usually weakly soluble in
aquatic media and it also forms stable complex with soil
minerals. Cr(III)
is an essential micro nutrient for
maintenance of ―glucose tolerance factor‖ whereas excess
Cr(III) is harmful to human health [1]. The National Research
Council has recommended 50–200 μg d−1
as the safe and
proper quantity of Cr(III) .On the other hand, Cr(VI) is
extremely toxic and potentially carcinogenic [2]. WHO states
that the guideline values of 50 μg L−1
Cr(VI) are considered to
be too high compared with its genotoxicity [3]. Higher
oxidation potential and relatively smaller size of Cr(VI)
enables it to penetrate biological cell membranes. Cr(III) has
great impacts on the metabolism of carbohydrates, fats,
proteins and nucleic acids by activating certain enzymes and
stabilizing proteins and nucleic acids [4]. Insufficient dietary
intake of Cr(III) leads to increases in risk factors associated
with diabetes and cardiovascular disease, including elevated
levels of circulating insulin, glucose, triglycerides and total
cholesterol, and impaired immune function [5]. Chromium
can be also released to the environment from anthropogenic
sources because it is widely used in manufacturing processes
such as tanning, steel works, plating, corrosion control,
chromate and chrome pigment production [6-8]. At the same
time, it is an environmental pollutant that has caused concern
in industry and agriculture, [9] and so systematic
investigations into the specific detection of Cr(III) still need
to be developed, especially for aqueous systems [10]. Severe
matrix interferences restrict its direct determination with
sufficient sensitivity and selectivity with flame atomic
absorption spectrometry (FAAS) [11, 12], graphite furnace
atomic absorption spectrometry (GFAAS) [13, 14],
inductively coupled plasma atomic emission spectroscopy
(ICPAES) [15], X-ray fluorescence spectrometry [16] and
electrochemical methods [17-18]. Some forms of preliminary
separation and pre-concentration like liquid–liquid extraction
[19-20], cloud point extraction [21], ion-exchange [22, 23]
and solid phase extraction [24-26] etc. are required.
Fluorescence method has more advantages over all the
other mentioned methods due to its operational simplicity,
high selectivity, sensitivity, rapidity, nondestructive
methodology, enhanced sensitivity, high sampling frequency
and low cost of equipment and direct visual perception [27].
For an efficient fluorescent sensor, in addition to high
selectivity towards the target ion, a significant change in the
fluorescence intensity and /or a spectral change of the probe
are essential upon its interaction with the specific analyte [28].
Paramagnetic property of Cr(III) and lack of Cr(III)
selective ligand are the two major culprits for the development
of suitable fluorescent turn-on sensors for monitoring
intracellular Cr(III). Samanta et al. [29] reported di-(2-
ethylsulfanylethyl)amine as a Cr(III) selective receptor in
tetrahydrofuran. Liu et al. [30] reported two fluorescent
sensors capable of discriminating Fe(III) and Cr(III) . 8-
hydroxyquinoline containing rhodamine B derivative [31] is
used for bio-imaging of Cr(III) in contaminated cells. Zhou et
al. [32] reported a ratiometric FRET-based fluorescent probe
C

International Journal of Research and Scientific Innovation (IJRSI) | Volume IV, Issue X, October 2017 | ISSN 2321–2705
www.rsisinternational.org Page 90
for imaging Cr(III) in living cells. A Dansyl-based Cr(III)
selective fluorescent chemosensor is reported by Wu et al.
[33].
On the other hand, coumarin derivatives are well known to
have diverse applications such as anticoagulants,
spasmolytics, anticancer drugs or as plant growth regulating
agents [34-35]. Coumarin and its derivatives [36] possess
antibacterial [37], antithrombotic and vasodilatory [38],
antimutagenic [39], lipoxygenase and cyclooxygenase
inhibition [40] properties.
From the above discussion, it is evident that the use of
coumarin derivative as a fluorescent probe for trace level
determination of Cr(III)
and monitoring of intracellular
Cr(III)
in infected cells might be an important area of
research. Considering all these facts, herein we report the
synthesis, characterizations and cell imaging studies of a new
Cr(III) selective fluorescent probe containing coumarin and 2-
chloromethyl benzimidazole units. Our present method is
much more superior to our earlier one because it is a
fluorescence enhancement method while the earlier one was
based on fluorescence quenching. More over the present probe
can detect trace level Cr(III) in contaminated living cells
under fluorescence microscope.
II. EXPERIMENTAL
2.1. Materials and Methods
2-chloromethyl benzimidazole and coumarin were purchased
from Aldrich (USA) and S. D. Fine Chem. Ltd., India
respectively. 6-aminocoumarin was synthesized starting from
coumarin by following a published procedure [41]. Analytical
reagent grade chemicals and spectroscopy grade solvents were
used. Milli-Q 18.2 M cm−1
water was used throughout all
the experiments. The sources of Mn(II), Cr(III), Fe(III),
Co(II), Ni(II), Cu(II), Zn(II), Cd(II), Hg(II)and Pb(II) ions are
either their chloride, nitrate or perchlorate salts.
2.2. Physical measurements
1HNMR spectra were recorded in CDCl3 with a Bruker
Advance 300 MHz using tetramethylsilane as the internal
standard. Absorption and fluorescence spectra were recorded
on Shimadzu Multi Spec 1501 absorption spectrophotometer
and Hitachi F-4500 fluorescence spectrophotometer equipped
with a temperature controlled cell holder, respectively. Mass
spectrum was recorded in QTOF Micro YA 263 mass
spectrometer in ESI positive mode. IR spectra were recorded
on a Perkin Elmer FTIR spectrophotometer (model: RX-1).
Micro analytical data (C, H, and N) were collected on Perkin
Elmer 2400 CHNS/O elemental analyzer. The fluorescence
imaging system was comprised of an inverted fluorescence
microscope (Leica DM 1000 LED), digital compact camera
(Leica DFC 420C), and an image processor (Leica
Application Suite v3.3.0). The microscope was equipped with
a mercury 50 watt lamp.
2.3. Synthesis of (6E)-6-((anthracen-9-yl) methyleneamino)-
2H- chromen-2-one) (BIC)
6-Aminocoumarine (0.5 g, 3.1mmol) and 2-chloromethyl
benzimidazole (1.26 g, 3.1 mmol), NaHCO3 (1.26 mg, 3.1
mmol) were added to an anhydrous DMF (10 mL), then the
suspended solution was refluxed for 24 h under a N2
atmosphere (the reaction was monitored by thin-layer
chromatography and ceased after the starting material
disappeared). After the removal of DMF, the solid was
extracted with chloroform. The organic layer was dried over
anhydrous sodium sulfate. The product was further purified on
a chromatography column (basic silica gel, ethanol and CHCl3
as eluent) and identified by 1HNMR and ESIMS. Yield 90%;
m.p.1122C; 1HNMR (300MHz, CDCl3) (supplementary,
Fig.S-1), δ: 4.53(s,2H), 4.84(s,2H), 6.16(d,1H), 6.45(d,1H),
6.66(s,1H), 6.84(d,1H), 7.26(m,4H), 7.36(d,1H), 7.53(d,4H),
7.98(s,2H). QTOF–MS ES+, (supplementary, Fig.S-2)
displays two signals of m/z 422.03 and 443.98, which can be
assigned as the signals for [M+H]+ and [M+Na]
+,
respectively; FT-IR (supplementary, Fig S-3) (KBr, cm-1
)
(COO), 1707; (C=N), 1572; UV-Visible spectrum
(supplementary, Fig.S-4) in aqueous (water: acetonitrile = 7:3,
v/v) solutions at 298K (max, nm (, 103M
-1 cm
-1), 228(1.659),
243(2.061), 263(1.465), 275(1.600), 331(0.236), 362(0.259);
Microanalytical data, Calculated for C25H19N5O2 : C, 71.25; H,
4.54; N, 16.62,found: C, 71.23; H, 4.51; N, 16.60.
2.4. Synthesis of [Cr complex]
A 10 mL methanolic solution of Cr(NO3)3,9H20(0.025 g,
0.062 mmol) was added slowly to a magnetically stirred 10
mL methanolic solution of the ligand (BIC) (0.028 g, 0.062
mmol). The mixture was stirred in air for 2 hr and then
refluxed for 15 min whereby a clear solution was formed.
Complex was obtained by evaporating the solvent. This was
characterized from QTOF –MS ES+, UV-Vis, IR spectroscopy
and also by CHN analysis. ESI-TOF–MS ES+,
(supplementary, Fig S-5) [M+H] +
= 681.99;
FTIR(supplementary, Fig S-6) (KBr, υ cm−1
): (COO), 1718;
(C=N), 1572; (NO3),1385; UV-Visible spectrum
(supplementary, Fig S-4) in aqueous (water: acetonitrile = 7:3,
v/v) solutions at 298K (max,nm(,103
M-1
cm-1
), CH3OH)
233(2.295), 241(2.424), 261(1.660), 270(1.847), 273(1.803),
276(1.885), 327(0.232), 363(0.272); Microanalytical data,
Calculated for C24H18CrN2O8 C, 56.04; H, 3.53; N, 5.45;
found: C, 56.12; H, 3.50; N, 5.54.
2.5. Measurement procedures
A 1×10⁻⁵
M solution of Cr(III) was obtained by serial dilution
of the stock solution. A 10-5
mol L-1
stock solution of BIC
was prepared by dissolving appropriate amount of BIC in
aqueous (water: methanol =7:3, v/v) solutions. The
aforementioned solutions of these metals and BIC were mixed
separately in different ratios for subsequent fluorescence
measurement. 1.00 cm quartz cell was used for fluorescence
measurement.

International Journal of Research and Scientific Innovation (IJRSI) | Volume IV, Issue X, October 2017 | ISSN 2321–2705
www.rsisinternational.org Page 91
III. RESULT AND DISCUSSION
3.1 Spectral characteristics
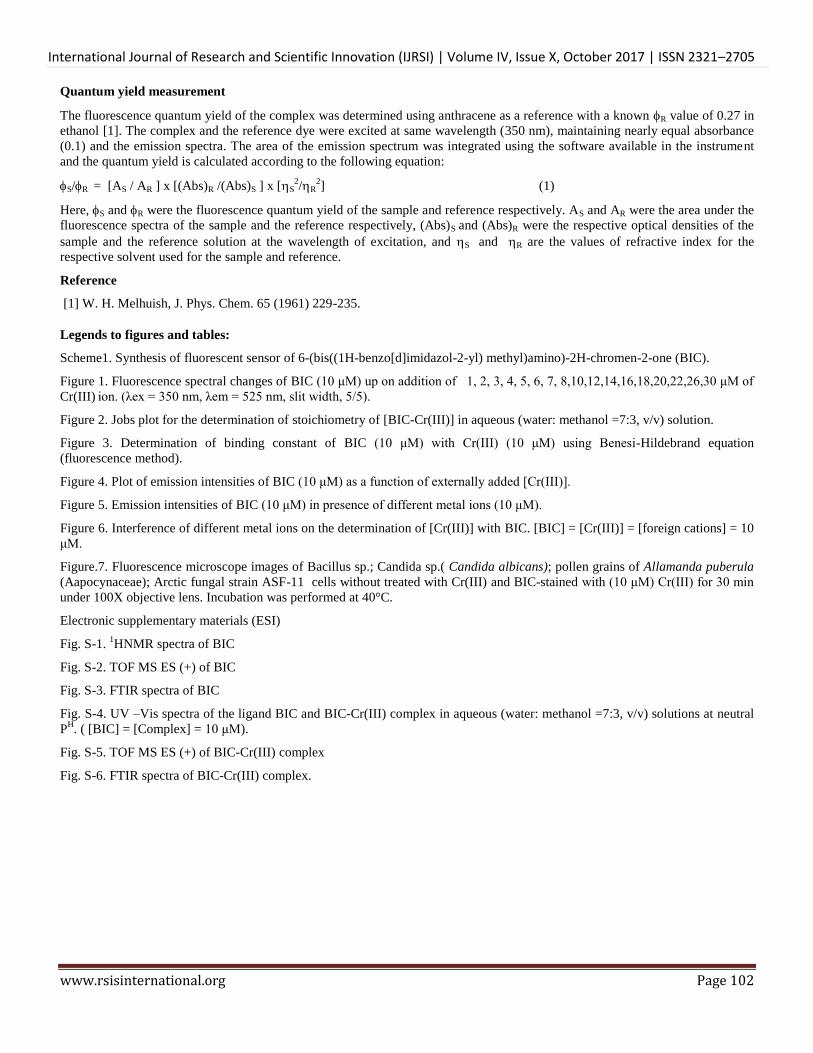
The mode of coordination of BIC with Cr(III) was
investigated by spectrophotometric titration at 25°C in
aqueous (water: methanol =7:3, v/v) solutions. Fig.S-4
(Supplementary) illustrates a typical UV-vis. titration curve of
BIC as a function of externally added Cr(III). UV-vis
spectrum of the BIC-Cr(III) system at 375 nm gradually
decrease with the increasing addition of Cr(III) .
Upon excitation of the BIC at 350 nm, the emission spectrum
of the BIC showed the maximum intensity at 510 nm with a
low quantum yield value 0.022(details were shown ESI). The
emission intensity of the BIC (at 510 nm) increased gradually
on addition of Cr(III) (0.1 μM to 3 μM) (Fig.1) and the
fluorescence quantum yield of the system increased to a value
of 0.046(λex = 350 nm). The inset plot of emission intensity
as a function of externally added Cr(III) concentration reveals
that after a certain amount of externally added Cr(III), there is
no further change in the emission intensity of the system. Fig.
2 showed the stoichiometry (BIC: Cr(III) = 1:1) of the
complex formed between BIC and Cr(III) ion as evaluated by
the method of continuous variation (Job‘s plot),which was in
agreement with the mass spectral data.
3.2 Calculation of binding constant
The relative binding affinities BIC towards Cr(III) was
quantified based on fluorescence titration data following the
modified Benesi-Hildebrand equation (Fig. 3)[42].
(1/∆F)= 1/∆Fmax + (1/K[C]n) (1/∆Fmax). Here ∆F= (Fx - F0) and
∆Fmax = F∞ - F0, where F0, Fx, and F∞ are the emission
intensities of BIC considered in the absence of Cr(III), at an
intermediate Cr(III) concentration, and at a concentration of
complete interaction, respectively, and where K is the binding
constant and [C] the Cr(III) concentration and n is the number
of these metal ions bound per ligand (here n= 1). The value of
K extracted from the slope is 1.39 x10⁵ M.
One of the most important parameters in cation sensing is the
detection limit. For many practical purposes, it is important to
sense cations at extremely low concentrations. BIC could
detect as low as 0.1 μM Cr(III) in aqueous (water: methanol
=7:3, v/v) solutions. Fig. 4 showed the plot of variation of
emission intensities of BIC as a function of added [Cr(III) ],
which could also be used for determination of unknown
[Cr(III) ] in a sample. Up to 20 times (2 μM) of the externally
added Cr(III) ion, we observed linearity. One can easily find
out the concentration of any unknown Cr(III) species in
aqueous solution.
3.3 Selectivity
The fluorescence enhancement can be ascribed to the CHEF
effect associated with better rigidity and planarity of the
sensor molecules induced by chelation of Cr(III). Changes in
[Cr(III)] under physiological conditions will exhibit ―turn-on‖
type fluorogenic behavior, which can be detected by
measuring the ratio of green fluorescence intensity with good
sensitivity and selectivity. Selectivity is another major issue in
the field of cation sensing.
The selectivity of BIC for Cr(III)
over other common
accompanying metal ions was examined in aqueous (water:
methanol =7:3, v/v) solutions. Fig. 5 indicated that only
Cr(III) enhanced the fluorescence intensity of BIC whereas
other metal ions in the 3d series played no role to coordinate
with the imines nitrogen atoms of the compound BIC.
Furthermore, the enhanced extents were in good proportion to
the Cr(III)
concentrations in a certain range, and other
physiologically important cations, even if their concentrations
were 10 times higher than that of Cr(III), and only Cr(III) ion
can effectively enhance the fluorescence of BIC. It was
interesting that the enhanced extents of the fluorescence were
in good proportion to the concentrations of Cr(III), indicating
that an assay of Cr(III) in this way to be good practice; and,
the distinct discrimination between Cr(III) and other ions
made it possible for the BIC to be used for the analysis of
Cr(III) in the presence of other ions in aqueous system.
Interferences from some of the common alkali, alkaline earth
and transition metal ions on the emission intensity of the
[BIC-Cr(III) ] system were presented in Fig.6. The
fluorescence intensity of the complex in the presence of
Cr(III) remain almost unchanged in the presence of the
common alkali, alkaline earth and transition metal ions (Na(I),
K(I), Mg(II), Mn(II), Fe(III), Co(II), Ni(II), Cu(II), Zn(II),
Cd(II), Hg(II) and Pb(II)).
3.4. Preparation and imaging of cells Studies
Bacillus sp. has long been used as bio-pesticide for controlling
looper killer at tea plantation. These cells from 24 h culture
medium have been treated with aqueous solution of
chromium nitrate (1 mg mL-1
) for 1h, washed with normal
saline and photographed under 100X fluorescence microscope
after adding BIC(Fig.7b). Fig.7a shows the control without
adding Cr(III)
salt but incubated with BIC. Similarly,
fluorescence image of Candida sp. cells (Fig.7d), freshly
collected pollen grains of Allamanda puberula
(Aapocynaceae, Fig.7f) and Arctic fungal strain ASF-11
(Fig.7h) have been collected, while their respective controls
are presented in Fig.7c, Fig.7e and Fig.7g respectively.
Photographs indicate that the BIC is easily permeable to all
types of living cells tested and harmless (as the cells remain
alive even after 30 minutes exposure to the BIC at 10 µM
concentration). Intensity of the fluorescence is proportional to
the concentration of Cr(III) present in the cell. BIC may be
used to detect intracellular Cr(III) in living cells. Thus BIC
will be useful for studying bioactivity or toxicity of Cr(III) in
living cells.
3.5. Comparison of the probe with other reported Cr(III)
selective turn-on fluorescent probes
Comparison of the present probe with other existing Cr(III)
sensitive turn-on fluorescent probes is presented in Table 1 .

International Journal of Research and Scientific Innovation (IJRSI) | Volume IV, Issue X, October 2017 | ISSN 2321–2705
www.rsisinternational.org Page 92
Amongst the reported fluorescent probes, only one probe [44]
has better LOD while our probe is least expensive as it
involves a facile one step reaction with commercially
available much cheaper chemicals. Mao et al. [44] did not
have cell imaging of the probe. To the best of our knowledge,
this is the second example of a ratiometric fluorescent probe
for monitoring Cr(III) in living cells after [32]. But [32] have
lower binding constant than our present ligand. Thus, our
probe turns out to be more promising and much greener one.
Table 1
Comparison of the present method with the reported turn-on Cr(III) selective fluorescence sensor in the literature.
Type of
sensor selectivity LOD
association
constant / Binding constant
Application Interferences Ref.
Turn on selectivity to Fe(III) and
Cr(III) in aqueous solution - 41600 M-1 -
Co2+, Ni2+, Zn2+, Cd2+, Ag+,
Pb2+, Ba2+, Mg2+, Ca2+, K+ and Na+ displayed little
interference
[30]
Turn on
selectivity only Cr(III) in
ethanol/H2O(1:1, v/v, pH
7.4) solution
- Ka= 7.5 x 10³ M-1 Cell imaging
Only Hg2+ elicited a slight fluorescence intensity
enhancement, while the
other alkali, alkaline earth, and transition metal ions
did not cause any
discernible changes
[31]
FRET-based ratiometric
selectivity only Cr(III) in ethanol–water (2 : 1, v/v)
- Ka=9.4 x10³M-1 Cell imaging
Na+, K+, Mg2+, Ca2+ gave
no interference at a 100-fold excess concentration,
and Zn2+, Cu2+, Fe2+, Mn2+,
Co2+, Ni2+, Cd2+, Hg2+, Ag+, Pb2+ gave a weak response.
[32]
Turn on selectivity only Cr(III) in
(DMF/H2O (9:1), -
Kass = 6.07 ±0.10 x10⁷ M-2
-
No significant spectral
changes observed in the presence of Li+, Na+ and
K+. Mg2+ and Ca2+, and
Mn2+, induced a slight
increase in fluorescence.
The presence of 0.2 mM Zn2+, Cd2+, Fe3+, Hg2+ and
Pb2+ just caused slight
fluorescence quenching.
[33]
Turn off
selectivity only Cr(III) in
DMF:water (9:1,
v/v) solution
9 x 10⁻⁶ mol L−1 8.1378 x 10⁴
M-1 -
Na+, K+, Mg2+,Ca2+, Cd2+,
Zn2+, Hg2+, Mn2+, Cu2+,
Fe3+, Co2+, Pb2+, Ni2+ show insignificant positive
interferences. Common
anions including oxalate, dithionite and dithionate
have no interference
[43]
Turn on selectivity only Cr(III) in
aqueous media
1.6×10⁻⁸ mol
L−1 - -
Having no interference of
biologically relevant metal
ions including Cr6+, Al3+,
Fe3+, Cd2+, Co2+, Cu2+,
Ni2+, Zn2+, Mg2+, Ba2+,
Pb2+,Na+, and K+.
[44]
Turn on
selectivity only Cr(III) in
acetonitrile-water
(1:1, (v/v)) medium of pH 6.00
2.5μg l-1 K = 4.7 x 10⁵ l
mol-1
determination
of Cr(III) and total chromium in domestic
and industrial waste
water samples
Foreign ions e,g. Na+, K+,
NH4+, Cl-, NO3
-, CH3COO-,
SO42-, C2O4
2- have more interference.
[45]

International Journal of Research and Scientific Innovation (IJRSI) | Volume IV, Issue X, October 2017 | ISSN 2321–2705
www.rsisinternational.org Page 93
Turn on
selectivity only Cr(III) in CH3CN–HEPES buffer
(0.02 M, pH 7.4) (4:6, v/v)
medium
1 x 10⁻⁶ M K = 8 x 10⁴ M-1 Cell imaging
Fe3+ and Cu2+ interfered to some extent while Co2+,
Ni2+ and Pb2+ interfered to
a negligible extent
[46]
Ratiometric
selectivity only Cr(III) in
aqueous (water: methanol
=7:3, v/v)
1 x10⁻⁷ M. Ka=1.39 x 10⁵ M-
1 Cell imaging
Na+, K+, Mg2+, Ca2+ gave
no interference and Fe2+, Cu2+, gave a weak
response.
present
IV. APPLICATIONS
4.1. Estimation of Cr(III) and Cr(VI) from the binary synthetic
mixtures
In different sets (each set in duplicate) different amounts of
Cr(III) and Cr(VI) were mixed in a total volume of 100 mL.
Direct estimation of Cr(III) was performed using our
developed method. Reduction of Cr(VI) to Cr(III) by
equivalent amount of oxalic acid was performed and total
Cr(III) in the solution was estimated as mentioned above. The
difference gave free Cr(VI) present in the solution. The results
are presented in Table 1.
Table 1
Separation of Cr(III) and Cr(VI) in binary synthetic mixtures.
No. of
observations
Amount taken
(μg)
Amount found (μg)
Error (%)
1 Cr(III)—50
Cr(VI)—50
Cr(III)— 48.9±0.6
Cr(VI) —49.4±0.06
1.1
0.6
2 Cr(III)—40
Cr(VI)—50
Cr(III)—38.4±0.5
Cr(VI)—48.5±0.6
1.2
1.5
3 Cr(III)—65 Cr(VI)—25
Cr(III)—64.1±0.03 Cr(VI)—26.2±0.09
0.9 1.2
4
Cr(III)—30
Cr(VI)—45
Cr(III)— 31.3±0.5
Cr(VI)— 44.2±0.7
1.3
0.8
5
Cr(III)—30
Cr(VI)—40
Cr(III)—29.1±0.5
Cr(VI)—40.4±0.7
0.9
0.4
4.2.Real samples analysis
The waste water samples from different sources (three
samples from tannery industrial area, Kolkata and three
samples from Durgapur Industrial belt, West Bengal, India)
were filtered through a 0.45μm Milipore membrane filter.
They were analyzed as described in the previous section. The
results are compared with a reference method [18] and a good
agreement is found between the two (t-test, P = 0.06). Results
are presented in Table 2.
Table 2
Level of Chromium species in environmental samples as
determined by present method.
Sample
no. Present method
Reference method [18]
Cr(III) Cr(VI) Cr(III) Cr(VI)
1a 682.2 ± 0.2 595.9 ± 2 681.2 ± 0.2 595 ± 2
2a 573.6 ± 3 511.5 ± 4 575 ± 3 512 ± 4
3a 470 ± 1 413.2 ± 3 467 ± 1 411 ± 3
4b 64.3 ± 3 53.5 ± 1 65.3 ± 3 54.3 ± 1
5b 42.8 ± 3 43.2 ± 4 43.1 ± 3 41.2 ± 4
6b 34.8 ± 4 36.5 ± 5 35.5 ± 4 37.5 ± 5
a Tannery water.
b Industrial water.
V. CONCLUSION
In conclusion, we report four easily synthesized highly
sensitive and selective ‗‗turn-on‘‘ fluorescent sensors (BIC)
for trace level selective determination of Cr(III) based on the
CHEF mechanism. Both the probe and its Cr(III) complex
were well characterized by different spectroscopic techniques.
The reagent possesses strong binding affinity towards Cr(III)
in evident from binding constant data of complexes. The
method is free from interferences of common accompanying
cations. It almost fulfils the demand of a green analytical
method. Finally, the probe could detect trace level Cr(III) in
living cells under fluorescence microscopy. These sensors
may be further developed as a novel type of readily
synthesized, high performance fluorescent Cr(III) sensor with
the practical applicability for Cr(III) imaging in living cells
and Cr(III) sensing in relevant aqueous (water: methanol =7:3,
v/v) systems.
ACKNOWLEDGEMENT
The authors are grateful to CIPET, Haldia for funding.
REFERENCES
[1]. V. Gómez, M.P. Callao, Trend.Anal. Chem. 25 (2006) 1006–1015.
[2]. R.D. Mount, J.R. Hockett, Water Res. 34 (2000) 1379–1385.
[3]. H. F. Maltez, E. Carasek, Talanta 65(2005)537-542.
[4]. R. A. Anderson, Chromium, Trace Elements in Human and
Animal Nutrition, Academic Press, New York, 1987, pp 225-244. [5]. J. B. Vincent, Nutr. Rev., 58(2000)67–72.
[6]. A. Ramesh Kumar, P. Riyazuddin, Microchem. J. 93 (2009) 236–
241. [7]. M.J. Marques, A. Salvador, A. Morales-Rubio, M. de la Guardia,
Fresenius J. Anal.Chem. 367 (2000) 601–613.
[8]. L.-L. Wang, J.-Q. Wang, Z.-X. Zheng, P. Xiao, J. Hazard. Mater. 177 (2010)114–118.
[9]. M. Zayed, T. Norman, Plant Soil, 249(2003)139-156.

International Journal of Research and Scientific Innovation (IJRSI) | Volume IV, Issue X, October 2017 | ISSN 2321–2705
www.rsisinternational.org Page 94
[10]. J. L. Pincus, C. Jin, W. Huang, H. K. Jacobs, A. S. Gopalan, Y.
Song, J. A. Shelnutt, D.Y. Sasaki, J. Mater. Chem., 15(2005)
2938–2945. [11]. B. Demirata, Mikrochim. Acta 136 (2001) 143–146.
[12]. A. Tunceli, A.R. Turker, Talanta 57 (2002) 1199–1204.
[13]. A. Xue, S. Qian, G. Huang, L. Chen, J. Anal. Spectrom. 15 (2000) 1513–1515.
[14]. F. Shemirani, M. Rajabi, Fresenius J. Anal. Chem. 371 (2001)
1037–1040. [15]. M. Sugiyaura, O. Fujino, S. Kihara, M. Matsui, Anal. Chim. Acta
181 (1986) 159–168.
[16]. S. Peräniemi, M. Ahlgré, Anal. Chim. Acta 315 (1995) 365–370. [17]. I. Turyan, D. Mandler, Anal. Chem. 69(1997) 894-897.
[18]. D. V. Vukomanovic, G. V. Vanloon, K. Nakatsu, D. E, zoutman,
Microchem. J. 57(1997) 86-95. [19]. K.S. Subramanian, Anal. Chem. 60 (1988) 11–15.
[20]. A. Beni, R. Karosi, J. Posta, Microchem. J. 85 (2007) 103–108.
[21]. F.S. Shemirani, D. Abkenar, A. A. Mirroshandel, M.S. Niasari, R. R. Kozania, Anal. Sci. 19 (2003) 1453–1456.
[22]. M.T.S. Cordero, E.I.V. Alonso, A.G. Torres, J.M.C. Pavon, J.
Anal. At. Spectrom. 19 (2004) 398–403.
[23]. K. Yoshimura, Analyst 113 (1988) 471–474.
[24]. K.O. Saygi, et al., J. Hazard. Mater. 153 (2008) 1009–1014.
[25]. S. Saracoglu, M. Soylak, L. Elci, Anal. Lett. 35 (2002) 1519–1530.
[26]. M. Tuzen, M. Soylak, J. Hazard. Mater. 129 (2006) 266–273.
[27]. K. Yoshimura, Analyst 113 (1988) 471–474. [28]. K.O. Saygi, J. Hazard. Mater. 153 (2008) 1009–1014.
[29]. M. Sarkar, S. Banthia, A. Samanta, Tetrahedron Lett.,
47(2006)7575-7578. [30]. J. Mao, L. Wang, W. Dou, X. Tang, Y. Yan, W. Liu, Org. Lett. 9
(2007) 4567–4570.
[31]. K. Huang, H. Yang, Z. Zhou, M. Yu, F. Li, X. Gao, T. Yi, C.
Huang, Org. Lett. 10 (2008) 2557–2560.
[32]. Z. Zhou, M. Yu, H. Yang, K. Huang, F. Li, T. Yi, C. Huang, Chem. Commun., (2008)3387-3389.
[33]. H. Wu, P. Zhou, J. Wang, L. Zhao, C. Duan, New J. Chem.,
33(2009)653-658. [34]. V. Camel, Spectrochim. Acta, Part B 58 (2003) 1177-1233.
[35]. I. P. Kostova, I. Manolov, I. Nikolova, N. Danchev, Farmaco 56
(2001) 707-713. [36]. G. J. Finn, B. S. Creaven, D. A. Egan, Melanoma Res. 11 (2001)
461-467.
[37]. P. Laurin, M. Klich, C. Dupis-Hamelin, P. Mauvais, P. Lassaigne, A. Bonnefoy, B. Musicki, Bioorg. Med. Chem. Lett. 9 (1999)
2079-2084.
[38]. R. J. S. Hoult, M. Paya, Gen. Pharmacol. 27 (1996) 713-722. [39]. S. P. Pillai, S. R. Menon, L. A. Mitscher, C. A. Pillai, D. A.
Shankel, J. Nat. Prod. 62 (1999) 1358-1360.
[40]. Y. Kimura, H. Okuda, S. Arichi, K. Baba, M. Kozawa, Biochim. Biophys. Acta 834(1985)224-229.
[41]. S. Guha, S. Lohar, I. Hauli, S. K. Mukhopadhyay, D. Das, Talanta
85(2011) 1658-1664.
[42]. H. A.Benesi, J. H. Hildebrand, J. Am. Chem. Soc.71 (1949) 2703-
2707.
[43]. D. Karak, A. Banerjee, A. Sahana, S. Guha, S. Lohar, S. Sekhar Adhikari and D. Das. J. Hazard. Mater. 188(2011)274-280.
[44]. J. Mao, Q. He, and W. Liu, Anal Bioanal Chem 396(2010)1197-
1203. [45]. B. Tang, T. Yue, J. Wu, Y. Dong, Y. Ding, and H. Wang, Talanta
64 (2004) 955-960.
[46]. S. Guha, S. Lohar, A. Banerjee, A. Sahana, A. Chaterjee, S. K. Mukherjee, J. S. Matalobos, D. Das, Talanta xx (2011) xxx–xxx,
doi:10.1016/j.talanta.2011.12.014

International Journal of Research and Scientific Innovation (IJRSI) | Volume IV, Issue X, October 2017 | ISSN 2321–2705
www.rsisinternational.org Page 95
Scheme 1
Fig.1

International Journal of Research and Scientific Innovation (IJRSI) | Volume IV, Issue X, October 2017 | ISSN 2321–2705
www.rsisinternational.org Page 96
Fig 2
Fig 3

International Journal of Research and Scientific Innovation (IJRSI) | Volume IV, Issue X, October 2017 | ISSN 2321–2705
www.rsisinternational.org Page 97
Fig. 4
Fig. 5

International Journal of Research and Scientific Innovation (IJRSI) | Volume IV, Issue X, October 2017 | ISSN 2321–2705
www.rsisinternational.org Page 98
Fig.6
Fig.7

International Journal of Research and Scientific Innovation (IJRSI) | Volume IV, Issue X, October 2017 | ISSN 2321–2705
www.rsisinternational.org Page 99
S-1. 1H-NMR spectra of BIC
S-2. TOF MS ES (+) mass spectra of BIC
International Journal of Research and Scientific Innovation (IJRSI) | Volume IV, Issue X, October 2017 | ISSN 2321–2705
www.rsisinternational.org Page 100
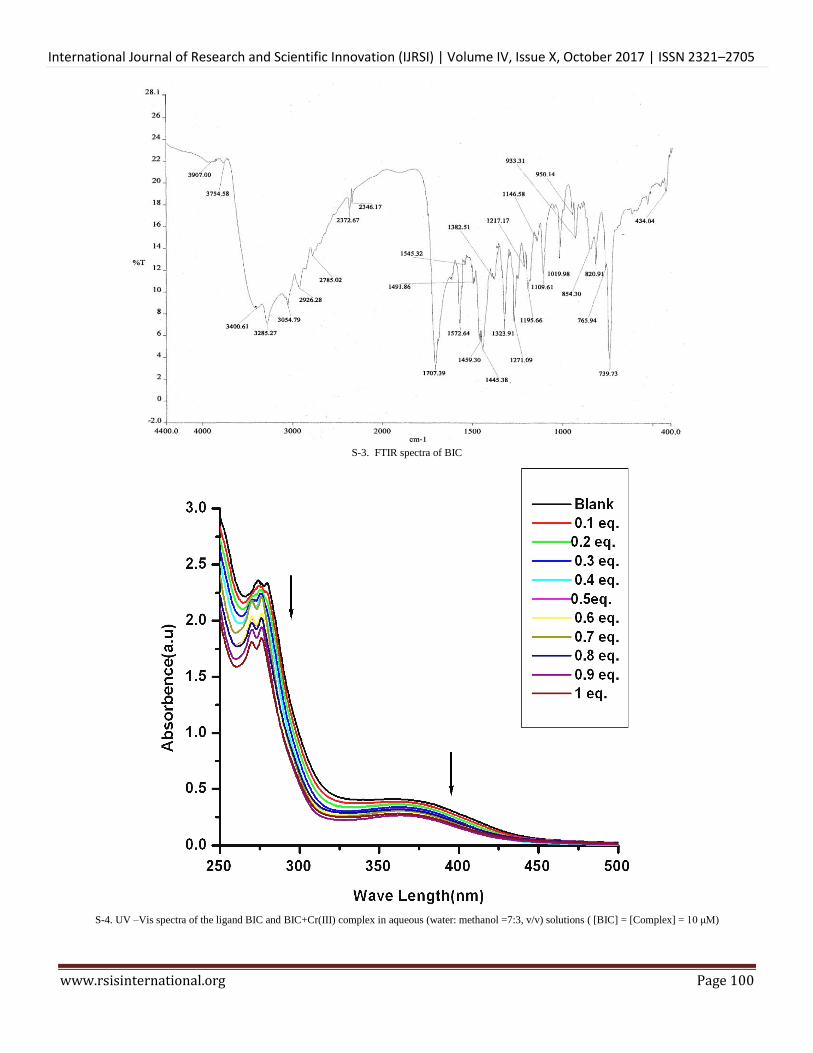
S-3. FTIR spectra of BIC
S-4. UV –Vis spectra of the ligand BIC and BIC+Cr(III) complex in aqueous (water: methanol =7:3, v/v) solutions ( [BIC] = [Complex] = 10 μM)

International Journal of Research and Scientific Innovation (IJRSI) | Volume IV, Issue X, October 2017 | ISSN 2321–2705
www.rsisinternational.org Page 101
S-5. TOF MS ES (+) mass spectra of BIC+Cr(III)
S-6. FTIR spectra of the BIC+Cr(III)complex
International Journal of Research and Scientific Innovation (IJRSI) | Volume IV, Issue X, October 2017 | ISSN 2321–2705
www.rsisinternational.org Page 102
Quantum yield measurement
The fluorescence quantum yield of the complex was determined using anthracene as a reference with a known R value of 0.27 in
ethanol [1]. The complex and the reference dye were excited at same wavelength (350 nm), maintaining nearly equal absorbance
(0.1) and the emission spectra. The area of the emission spectrum was integrated using the software available in the instrument
and the quantum yield is calculated according to the following equation:
S/R = [AS / AR ] x [(Abs)R /(Abs)S ] x [S2/R
2] (1)
Here, S and R were the fluorescence quantum yield of the sample and reference respectively. AS and AR were the area under the
fluorescence spectra of the sample and the reference respectively, (Abs)S and (Abs)R were the respective optical densities of the
sample and the reference solution at the wavelength of excitation, and S and R are the values of refractive index for the
respective solvent used for the sample and reference.
Reference
[1] W. H. Melhuish, J. Phys. Chem. 65 (1961) 229-235.
Legends to figures and tables:
Scheme1. Synthesis of fluorescent sensor of 6-(bis((1H-benzo[d]imidazol-2-yl) methyl)amino)-2H-chromen-2-one (BIC).
Figure 1. Fluorescence spectral changes of BIC (10 μM) up on addition of 1, 2, 3, 4, 5, 6, 7, 8,10,12,14,16,18,20,22,26,30 μM of
Cr(III) ion. (λex = 350 nm, λem = 525 nm, slit width, 5/5).
Figure 2. Jobs plot for the determination of stoichiometry of [BIC-Cr(III)] in aqueous (water: methanol =7:3, v/v) solution.
Figure 3. Determination of binding constant of BIC (10 μM) with Cr(III) (10 μM) using Benesi-Hildebrand equation
(fluorescence method).
Figure 4. Plot of emission intensities of BIC (10 μM) as a function of externally added [Cr(III)].
Figure 5. Emission intensities of BIC (10 μM) in presence of different metal ions (10 μM).
Figure 6. Interference of different metal ions on the determination of [Cr(III)] with BIC. [BIC] = [Cr(III)] = [foreign cations] = 10
μM.
Figure.7. Fluorescence microscope images of Bacillus sp.; Candida sp.( Candida albicans); pollen grains of Allamanda puberula
(Aapocynaceae); Arctic fungal strain ASF-11 cells without treated with Cr(III) and BIC-stained with (10 μM) Cr(III) for 30 min
under 100X objective lens. Incubation was performed at 40°C.
Electronic supplementary materials (ESI)
Fig. S-1. 1HNMR spectra of BIC
Fig. S-2. TOF MS ES (+) of BIC
Fig. S-3. FTIR spectra of BIC
Fig. S-4. UV –Vis spectra of the ligand BIC and BIC-Cr(III) complex in aqueous (water: methanol =7:3, v/v) solutions at neutral
PH. ( [BIC] = [Complex] = 10 μM).
Fig. S-5. TOF MS ES (+) of BIC-Cr(III) complex
Fig. S-6. FTIR spectra of BIC-Cr(III) complex.