COTTON Market situation
12
3. COMMODITY SNAPSHOTS OECD-FAOAGRICULTURAL OUTLOOK 2016-2025 © OECD/FAO 2016 118 COTTON Market situation The world cotton market experienced dramatic developments in the first half of the 2015 marketing year (see glossary for a definition of marketing year) caused by an acute drop in production – about 9% – in major producing countries. Worldwide cotton production has not declined this much since 2008. This unexpected drop in production led to releases of stocks; however, total world stocks still remain at a very high level (20 Mt, 5% down from 2014). Production fell in almost all major cotton producing countries led by Pakistan, the United States, and China, which experienced declines of 5%, 19% and 17%, respectively. Adverse weather, lower global world market demand and policy uncertainty all contributed to the sharp decline. The decreased synthetic fibre prices driven by substantially lower oil prices placed huge competitive pressures on world cotton markets. Nonetheless, cotton mill consumption is estimated to increase by 1% from 2014 to around 24.3 million tonnes (Mt) in the 2015 marketing year. Mill consumption estimates in China and India remained stable at 7.7 Mt and 5.3 Mt respectively, Pakistan experienced over 2% and Bangladesh over 4% growth while Viet Nam picked up 6% as Chinese direct investment in mills of the latter two countries continues to increase. Global cotton imports declined for the third consecutive season, falling 2% from 2014, to 75 Mt. Increases in imports by Indonesia, Turkey and Viet Nam were insufficient to offset the 12% decline in China’s import demand from 2014, as their new cotton support policy narrowed the price gap between domestic and imported cotton. With lower output, US exports are estimated to fall to 2.2Mt, about 11% below the previous year. India’s exports however increased slightly. Projection highlights Although the world cotton price is under pressure from substantial high stock levels and fierce competition from synthetic fibres, cotton prices are expected to be relatively stable in nominal terms after an anticipated further drop in 2016. During 2016-25, relative stability is expected as government support policies stabilise markets in major cotton producing countries. However, world cotton prices are expected to be lower than the average in 2013-15 in both real and nominal terms. World production is expected to grow at slower pace than consumption during the first few years of the outlook period, reflecting the anticipated lower price level resulting from the large global stocks that accumulated between 2010 and 2014. The stock-to-use ratio is expected to be over 40% in 2025, which is at the high-end of historical levels but well below the historical high of 87% in 2014.World cotton area should be stable for the first five years but it is projected to grow from2020 onwards. Yields rise around the world and global average yield grows slowly as production switches from relatively high yielding countries, notably China, to relatively low-yielding ones in South Asia. World cotton use is expected to grow at 1.5% p.a. as a result of economic and population growth, reaching 28.3 Mt. Consumption in China is expected to fall to 6.9 Mt following the downward trend started in 2010, while India becomes the world’s largest country for cotton
Transcript of COTTON Market situation

3. COMMODITY SNAPSHOTS
OECD-FAO AGRICULTURAL OUTLOOK 2016-2025 © OECD/FAO 2016118
COTTON
Market situationThe world cotton market experienced dramatic developments in the first half of the 2015
marketing year (see glossary for a definition of marketing year) caused by an acute drop in
production – about 9% – in major producing countries. Worldwide cotton production has not
declined this much since 2008. This unexpected drop in production led to releases of stocks;
however, total world stocks still remain at a very high level (20 Mt, 5% down from 2014).
Production fell in almost all major cotton producing countries led by Pakistan,
the United States, and China, which experienced declines of 5%, 19% and 17%, respectively.
Adverse weather, lower global world market demand and policy uncertainty all contributed to
the sharp decline. The decreased synthetic fibre prices driven by substantially lower oil prices
placed huge competitive pressures on world cotton markets. Nonetheless, cotton mill
consumption is estimated to increase by 1% from 2014 to around 24.3 million tonnes (Mt) in
the 2015 marketing year. Mill consumption estimates in China and India remained stable at
7.7 Mt and 5.3 Mt respectively, Pakistan experienced over 2% and Bangladesh over 4% growth
while Viet Nam picked up 6% as Chinese direct investment in mills of the latter two countries
continues to increase.
Global cotton imports declined for the third consecutive season, falling 2% from 2014, to
75 Mt. Increases in imports by Indonesia, Turkey and Viet Nam were insufficient to offset the
12% decline in China’s import demand from 2014, as their new cotton support policy narrowed
the price gap between domestic and imported cotton. With lower output, US exports are
estimated to fall to 2.2 Mt, about 11% below the previous year. India’s exports however
increased slightly.
Projection highlightsAlthough the world cotton price is under pressure from substantial high stock levels and
fierce competition from synthetic fibres, cotton prices are expected to be relatively stable in
nominal terms after an anticipated further drop in 2016. During 2016-25, relative stability is
expected as government support policies stabilise markets in major cotton producing
countries. However, world cotton prices are expected to be lower than the average in 2013-15 in
both real and nominal terms.
World production is expected to grow at slower pace than consumption during the first
few years of the outlook period, reflecting the anticipated lower price level resulting from the
large global stocks that accumulated between 2010 and 2014. The stock-to-use ratio is
expected to be over 40% in 2025, which is at the high-end of historical levels but well below the
historical high of 87% in 2014. World cotton area should be stable for the first five years but it is
projected to grow from 2020 onwards. Yields rise around the world and global average yield
grows slowly as production switches from relatively high yielding countries, notably China, to
relatively low-yielding ones in South Asia.
World cotton use is expected to grow at 1.5% p.a. as a result of economic and population
growth, reaching 28.3 Mt. Consumption in China is expected to fall to 6.9 Mt following the
downward trend started in 2010, while India becomes the world’s largest country for cotton

3. COMMODITY SNAPSHOTS
OECD-FAO AGRICULTURAL OUTLOOK 2016-2025 © OECD/FAO 2016 119
mill consumption (8 Mt) in 2025. Higher cotton mill consumption by 2025 is also foreseen for
Bangladesh, Pakistan, Turkey, Indonesia and Viet Nam.
It is expected that the growth in global cotton trade will be slower compared to previous
years, especially 2011-13, when growth was driven by surging Chinese imports. To obtain
value-added from mills, a shift to trading cotton yarn and fabrics rather than raw cotton has
emerged over the past few years, which is expected to continue. Nonetheless, by 2025 global
raw cotton trade will reach 8.7 Mt, nearly 7% higher than the average during 2013-15.
The United States retains its position as the world’s largest exporter, accounting for 28% of
world trade. Exports from Brazil are expected to almost double from 0.7 Mt to 1.5 Mt, making it
the world’s second largest cotton exporter. With higher production, Australia is expected to
increase cotton exports to 1.1 Mt, over 70% more than in the base period. Cotton producing
countries in Sub-Saharan Africa, as a whole, will increase their exports to reach 1.4 Mt by 2025.
On the import side, China is expected to import 1.6 Mt in 2025 and retains barely its position as
the world’s largest import market. Its dominant role in the world cotton market will be
significantly challenged as other importing countries emerge. It is projected that by 2025,
Bangladesh, Indonesia and Viet Nam will each import more than 1 Mt.
While continuing increases in farm labour costs and competition for resources with other
agricultural crops place significant constraints on growth in global cotton production, higher
productivity driven by technological progress, including greater adoption of bio-tech cotton,
creates substantial potential for cotton production to expand in the next decade. While the
medium-term prospects are for sustained growth, there may be potential short-term
uncertainties in the current Outlook which may result in short-term volatilities in demand,
supply and prices. A sudden slow-down in global economy, a sharp drop in global textiles and
clothing trade, quality and price competition from synthetic fibres and changes in government
policies are important factors that can affect the cotton market.The unprecedented high stock
level is a key driver of the world cotton price.
The expanded cotton chapter is available athttp://dx.doi.org/10.1787/agr_outlook-2016-14-en
Figure 3.8. Cotton consumption by region
Source: OECD/FAO (2016), “OECD-FAO Agricultural Outlook”, OECD Agriculture statistics (database), http://dx.doi.org/10.1787/agr-data-en.1 2 http://dx.doi.org/10.1787/888933381669
0
2
4
6
8
10
12
2005 2006 2007 2008 2009 2010 2011 2012 2013 2014 2015 2016 2017 2018 2019 2020 2021 2022 2023 2024 2025
Mt
China India Pakistan Rest of the World

3. COMMODITY SNAPSHOTS
OECD-FAO AGRICULTURAL OUTLOOK 2016-2025 © OECD/FAO 2016120
Notes
1. These absolute increases in the European Union and Canada are slightly misleading since the baseperiods included bumper crops in 2013 and 2014 in the European Union and an extreme bumpercrop in Canada in 2013.
2. The term “processed meats” refers to meat that has been treated either to be preserved orflavoured, such as hams and sausages.
3. Gasohol is a mixture of gasoline and anhydrous ethanol used as transport fuel. In Brazil, mostvehicles are flex-fuel vehicles able to run on any blend of gasoline and ethanol. At the pump,automobilists can choose between gasohol (currently E27) and hydrous ethanol (E100).
4. Wholesale price, US Omaha.
5. Producer price, Germany, net of biodiesel tariff and of energy tax.
6. The term blend wall refers to short run technical constraints that act as an impediment toincreased ethanol use. It is assumed in this Outlook that US cars will not be able to consumegasohol with more than 10% of ethanol.

COTTON – 1
OECD-FAO AGRICULTURAL OUTLOOK 2016 © OECD/FAO 2016
COTTON
Price
The benchmark A Index measure of cotton1 prices delivered to Asian ports fluctuated around USD 1 560/t during 2015 (Figure 3.8.1), ranging between USD 1 450 and 1 620/t, about the same level as in 2014. The stable price was largely due to support policies for cotton in major cotton producing countries and high global stock levels. While the current price level is substantially lower than the high achieved during 2010-11, it is still higher than the average level of USD 1 300/t during 2000-09.
Figure 3.8.1. World cotton prices
Source: OECD/FAO (2016), “OECD-FAO Agricultural Outlook”, OECD Agriculture statistics (database), http://dx.doi.org/10.1787/agr-outl-data-en.
12 http://dx.doi.org/10.1787/888933382072
Large current world cotton inventories of over 80% of annual consumption indicate an over-supply on the market, thus market balances call for lower cotton prices. It is therefore projected that world cotton prices will decrease over the first few years (2016-18) of the outlook period, but will rise slowly afterwards, in nominal terms. A slight decrease of cotton prices is foreseen for the final three projection years given consumption growth projected to slow down towards 2025. Prices will still remain below the base year average of USD 1 699/t across the projection period. Nominal cotton prices in 2016-25 are projected to be higher than in the previous decade before the 2010-11 high. The increase, however, is smaller than for other agricultural crops, which largely reflects the existence of near-perfect substitutes for cotton in final fibre uses. By 2025, the world cotton price is expected to be around USD 1 497/t, about 11% higher than the average price level during 2000-09 but 50% below the peak in 2010.
0
500
1 000
1 500
2 000
2 500
3 000
3 500
1995
2000
2005
2010
2015
2020
2025
1995
2000
2005
2010
2015
2020
2025
Nominal price Real price
USD/t

2 – COTTON
OECD-FAO AGRICULTURAL OUTLOOK 2016 © OECD/FAO 2016
Production
World cotton production is projected to grow 2.0% annually over the next ten years, reaching 28 Mt in 2025, 12% higher than in the base period 2013-15. However world production is expected to grow at a slower pace than consumption during the first few years of the outlook period, reflecting the anticipated lower price level resulting from releasing parts of the large global stocks that accumulated between 2010 and 2014. The stock-to-use ratio is expected to be around 40% in 2025, which is at a high level but still below the 84% during the base period.
World cotton production started from a low level in 2015, due to an acute drop in production (about 9% in major producing countries) in the first half of the 2015 marketing year. Adverse weather conditions, lower world market demand, and policy uncertainty all contributed to the sharpest decline since 2008 and which led to a releasing of stocks. However, as mill consumption also declined, total world stocks remained at a very high level (19 Mt, a 5% decrease from 2014). World cotton area should be stable for the first five years of the projection period, but is projected to grow from 2020 onwards. Cotton yields are expected to increase in most countries, but the global average yield is expected to increase by only 1.4% p.a. over the projection period as production switches from relatively high yielding countries, notably the People’s Republic of China (hereafter “China”), to relatively low-yielding ones in South Asia.
In 2015, production fell in almost all major cotton-producing countries, led by China, Pakistan and the United States which experienced declines of 17%, 5% and 19%, respectively. Output fell drastically in China, leading India to become the world’s largest producer in 2015 (Figure 3.8.2). While achieving high per hectare yields (about twice the world average), China’s cotton producers – particularly in its eastern provinces – utilise relatively labour-intensive technologies. Fragmented land holdings limit the ability of cotton growers in the eastern provinces to adopt mechanised production, while demographic trends indicate continued declines in rural population, with rising wages and labour contributing to a high share of production costs. China’s steadily rising wages have constrained profits for cotton growers. Mechanisation has been more widespread among the larger producing units in China’s Xinjiang province, where per hectare yields are the highest of any province. In 2014, China began to reform its cotton policy, starting with a switch from price to income support and a reduction of support to farmers in the eastern provinces.2
Figure 3.8.2. World cotton production
Source: OECD/FAO (2016), “OECD-FAO Agricultural Outlook”, OECD Agriculture statistics (database), http://dx.doi.org/10.1787/agr-outl-data-en.
12 http://dx.doi.org/10.1787/888933382088
0
5
10
15
20
25
30
2005 2006 2007 2008 2009 2010 2011 2012 2013 2014 2015 2016 2017 2018 2019 2020 2021 2022 2023 2024 2025
MtRest of the World Pakistan United States China India

COTTON – 3
OECD-FAO AGRICULTURAL OUTLOOK 2016 © OECD/FAO 2016
India is projected to produce 8.2 Mt of cotton in 2025, approximately 30% of world output. Indian farmers continue to apply new technologies to capture currently unrealised yield potential. While there is a policy debate around the use of genetically modified (GM) crops, the adoption of GM cotton in India has been part of a shift in practices and technology use that resulted in cotton production more than doubling between 2003 and the base period. Yields are expected to grow by 1.6% p.a. up to 2025, which is above the annual growth rate during 2006-15. With the cotton area also rising faster than the harvested area of any other crop, India accounts for the largest share of the expected gain in world production through to 2025 (Figure 3.8.3).
Figure 3.8.3. Area harvested share of cottonin major countries
Source: OECD/FAO (2016), “OECD-FAO Agricultural Outlook”, OECD Agriculture statistics (database), http://dx.doi.org/10.1787/agr-outl-data-en.
12 http://dx.doi.org/10.1787/888933382095
The second largest share of additional production is expected to come from Brazil where growth in cotton area is projected to be faster than for many other crops, enabling production to reach 2.2 Mt by 2025. This corresponds to annual growths rates of 4.2% during 2016-2025. Pakistan accounts for the third largest share of additional global production, and similar to India, is expected to realise faster growth in the cotton area than in other crops. Production will increase with annual growth rates of 3.0% to 2.7 Mt in 2025 However, in absolute terms, production in Pakistan is lower than in India as Pakistan has lagged considerably behind India in the adoption of GM cotton. Other major producers with strong growth are West African countries with annual growths rates of 1.3% during the projection period.
Consumption
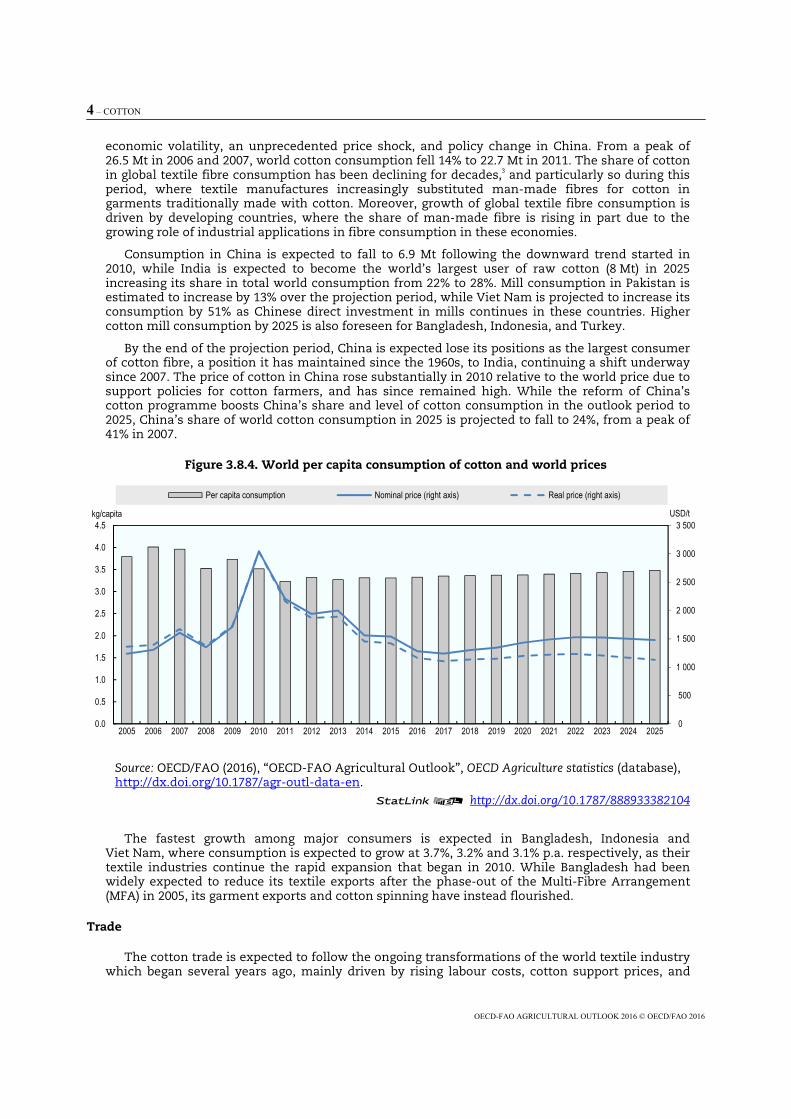
Total demand for cotton is expected to reach 28.3 Mt in 2025, surpassing the historical consumption high of 2006 by 1.8 Mt. This growth amounts to 1.5% p.a. over ten years as driven by economic- and population growth. While cotton consumption is expected to grow more rapidly (1.5% p.a.) than during 2006-15, it is expected to grow significantly more slowly than the 3% p.a. rate realised during 2000-09. While consumption grows faster than population in the next ten years, consumption on a per capita basis in 2025 is nonetheless expected to remain below the peak reached during 2005-07 but also 2010 (Figure 3.8.4).
The main driver behind the slower consumption growth in the projections for the next ten years compared to the last decade is competition with man-made fibres. The lower prices of man-made fibre, driven by substantially decreased oil prices, have placed huge competitive pressures on world cotton markets in recent years. Cotton consumption has been disrupted by global
0
2
4
6
8
10
12
14
16
18
20
2005 2006 2007 2008 2009 2010 2011 2012 2013 2014 2015 2016 2017 2018 2019 2020 2021 2022 2023 2024 2025
%
China India United States Pakistan
4 – COTTON
OECD-FAO AGRICULTURAL OUTLOOK 2016 © OECD/FAO 2016
economic volatility, an unprecedented price shock, and policy change in China. From a peak of 26.5 Mt in 2006 and 2007, world cotton consumption fell 14% to 22.7 Mt in 2011. The share of cotton in global textile fibre consumption has been declining for decades,3 and particularly so during this period, where textile manufactures increasingly substituted man-made fibres for cotton in garments traditionally made with cotton. Moreover, growth of global textile fibre consumption is driven by developing countries, where the share of man-made fibre is rising in part due to the growing role of industrial applications in fibre consumption in these economies.
Consumption in China is expected to fall to 6.9 Mt following the downward trend started in 2010, while India is expected to become the world’s largest user of raw cotton (8 Mt) in 2025 increasing its share in total world consumption from 22% to 28%. Mill consumption in Pakistan is estimated to increase by 13% over the projection period, while Viet Nam is projected to increase its consumption by 51% as Chinese direct investment in mills continues in these countries. Higher cotton mill consumption by 2025 is also foreseen for Bangladesh, Indonesia, and Turkey.
By the end of the projection period, China is expected lose its positions as the largest consumer of cotton fibre, a position it has maintained since the 1960s, to India, continuing a shift underway since 2007. The price of cotton in China rose substantially in 2010 relative to the world price due to support policies for cotton farmers, and has since remained high. While the reform of China’s cotton programme boosts China’s share and level of cotton consumption in the outlook period to 2025, China’s share of world cotton consumption in 2025 is projected to fall to 24%, from a peak of 41% in 2007.
Figure 3.8.4. World per capita consumption of cotton and world prices
Source: OECD/FAO (2016), “OECD-FAO Agricultural Outlook”, OECD Agriculture statistics (database), http://dx.doi.org/10.1787/agr-outl-data-en.
12 http://dx.doi.org/10.1787/888933382104
The fastest growth among major consumers is expected in Bangladesh, Indonesia and Viet Nam, where consumption is expected to grow at 3.7%, 3.2% and 3.1% p.a. respectively, as their textile industries continue the rapid expansion that began in 2010. While Bangladesh had been widely expected to reduce its textile exports after the phase-out of the Multi-Fibre Arrangement (MFA) in 2005, its garment exports and cotton spinning have instead flourished.
Trade
The cotton trade is expected to follow the ongoing transformations of the world textile industry which began several years ago, mainly driven by rising labour costs, cotton support prices, and
0
500
1 000
1 500
2 000
2 500
3 000
3 500
0.0
0.5
1.0
1.5
2.0
2.5
3.0
3.5
4.0
4.5
2005 2006 2007 2008 2009 2010 2011 2012 2013 2014 2015 2016 2017 2018 2019 2020 2021 2022 2023 2024 2025
USD/tkg/capita
Per capita consumption Nominal price (right axis) Real price (right axis)

COTTON – 5
OECD-FAO AGRICULTURAL OUTLOOK 2016 © OECD/FAO 2016
incentives to obtain value-added in the cotton supply chain. During this transition period, China would no longer be the world largest cotton mill consumer, and trade in cotton yarns and fabrics would replace some trade in raw cotton. Thus, while it is projected that world total cotton trade will reach 8.7 Mt in 2025, about 7% higher than during the base period, this would be considerably below the average level for 2011-13 of 9.5 Mt. The transition period would also induce changes in cotton trade flows resulting in new importers and exporters on the world market.
The leading exporter throughout the outlook period will be the United States, while Brazil is expected to become the world’s second largest exporter followed by Australia (Figure 3.8.5). Australia will increase exports by over 10% annually to reach 1.1 Mt by 2025, while Brazil will double its exports to reach 1.4 Mt. Over the past few years, given its surge in productivity and production, India has become a major player on the world cotton market, accounting for as much as 17% of the world’s cotton exports during the base period. This share is assumed to decrease to 7% by 2025, with exports amounting to 965 Mt, about 33% below the base period as the country shifts to exporting more processed textiles.
Figure 3.8.5. Cotton trade concentration
Note: Top 5 importers (2015): Bangladesh, China, India, Turkey, Viet Nam. Top 5 exporters (2015): Australia, Brazil, European Union, India, and the United States.
Source: OECD/FAO (2016), “OECD-FAO Agricultural Outlook”, OECD Agriculture statistics (database), http://dx.doi.org/10.1787/agr-outl-data-en.
12 http://dx.doi.org/10.1787/888933382111
Sub-Saharan African countries continue to be a major source of cotton exports to the world market. It is expected that their share in world trade will grow to 16% with exports reaching 1.4 Mt by 2025, although trade in that the region has been volatile in the past few decades. Cotton mill consumption is limited throughout Sub-Saharan Africa, and many countries export virtually all of their production. With the increases in productivity, in particular the adoption of bio-tech cotton in this region, both production and exports are expected to rise through to 2025.
The transition in trade would also induce changes in the composition of importers in the world cotton economy. While it is projected that China will retain its position as the world’s largest importer held since its accession to the World Trade Organization (WTO) in 2001, its share of world cotton imports will shrink to about 19% by 2025, as compared to 27% during the base period. The projected 1.6 Mt of cotton imports entering China in 2025 would be far smaller than the peak imports of about 5 Mt in 2011. Bangladesh, Indonesia and Viet Nam are projected to increase imports substantially. By 2025, these three countries will increase their imports by 45% to 60% to reach over 1 Mt each, accounting for over 40% of world trade.
-15
-10
-5
0
5
10
15
2005 2006 2007 2008 2009 2010 2011 2012 2013 2014 2015 2016 2017 2018 2019 2020 2021 2022 2023 2024 2025
Mt
Other importers Top 5 importers Other exporters Top 5 exporters

6 – COTTON
OECD-FAO AGRICULTURAL OUTLOOK 2016 © OECD/FAO 2016
Main issues and uncertainties
While the medium-term prospects for the world cotton market are stable, there will be potential short-term uncertainties in the current outlook, which may result in significant short-term volatilities in demand, supply and prices.
Demand for cotton is derived from demand for textiles and clothing, which are very sensitive to changes in economic growth. A sudden slow-down in the global economy would induce a sharp drop in the global consumption of textiles and clothing, which would disturb market stability. Given the very high stock level, a sharp decline in cotton demand would impose huge pressure on the world cotton price. During 2008 -09, the financial crisis caused world per capita consumption to fall by over 10% and resulted in world cotton prices dropping nearly 40%, from USD 1 754/t to USD 1 118/t.
With the recent strong decline in the world oil price and technical progress, man-made fibres are increasingly enhancing their competitive edge. Cotton, the price of which is distorted by government price support, continues to lose ground and the high price of cotton tends to further move demand to man-made fibres. If such a trend were to continue, a further contraction of the cotton share in total fibre consumption would lead to lower cotton demand and then prices.
China’s cotton policies are another important source of uncertainty. As the world’s largest producer, consumer and importer during the base period, China’s policy developments have important impacts on the world market. During 2011-13, China provided substantially more support to its cotton farmers than previously and did so primarily through government procurements at very high cotton prices. Consequently, 12 Mt of stock were built up in three years (Figure 3.8.6). When the government reformed its cotton policies from price support through state reserves purchases to price income support in 2014, its cotton production dropped more than 15% in the next season. Given very high stock levels and although exports of textiles and clothing are slowly picking up, China may take further steps to reform its policies for cotton, which would have important implications for the world market.
Figure 3.8.6. World cotton production, consumption and stocks
Source: OECD/FAO (2016), “OECD-FAO Agricultural Outlook”, OECD Agriculture statistics (database), http://dx.doi.org/10.1787/agr-outl-data-en.
12 http://dx.doi.org/10.1787/888933382128
Prospects for productivity gains around the world are another uncertainty, particularly in India. Producers in India adopted GM crops and updated their management practices which increased productivity, but yields remain far below those of many other cotton producers. The adoption of GM crops has been associated with an increase in total factor productivity in cotton in China,
0
5
10
15
20
25
30
2005 2006 2007 2008 2009 2010 2011 2012 2013 2014 2015 2016 2017 2018 2019 2020 2021 2022 2023 2024 2025
Mt
Rest of the World stocks China stocks Production Consumption

COTTON – 7
OECD-FAO AGRICULTURAL OUTLOOK 2016 © OECD/FAO 2016
leading to significantly higher yields. In the United States, GM adoption and boll weevil eradication have reduced the cost of growing cotton, and in Australia the adoption of GM varieties specifically targeted to local production conditions has also increased productivity. It is likely these factors account for some of the downward movement of cotton prices relative to other commodity prices since 2000. Many countries have been more cautious in their approach to GM adoption. No trade restrictions have yet been applied to cotton fibre, yarn, or other textile products made with GM cotton, but GM adoption has been slow in many countries nonetheless. Future productivity growth in countries with low yields will be determined by their adoption of new technologies, including mechanisation and increased input use.
Notes
1. In this Outlook, cotton is defined as the fibre of various species of Gossypium, predominantly
G. hirsutum. In addition to upland cotton (G. hirsutum), the totals for cotton include data for Extra Long Staple (ELS) cotton (G. barbadense), which accounts for 2% of world production. All data is on a fibre basis rather than in terms of un-ginned seed cotton from the first stage of harvesting. See the glossary for the definition of the marketing year for cotton.
2. See Box 10.1 in OECD-FAO Agricultural Outlook 2014-2023, “China’s cotton policies drive large changes in world ending stocks.”
3. See Box 10.1 in OECD-FAO Agricultural Outlook 2013-2022, “Cotton loses share to synthetic fibres”.

ANNEX: COMMODITY SNAPSHOT TABLES
OECD-FAO AGRICULTURAL OUTLOOK 2016-2025 © OECD/FAO 2016 133
Table 3.A1.9. World cotton projections
1 2 http://dx.doi.org/10.1787/888933382229
Note: Marketing year: See Glossary of Terms for definitions.Average 2013-15est: Data for 2015 are estimated.
1. Consumption for cotton means mill consumption and not final consumer demand.2. Cotlook A index, Middling 1 3/32", c.f.r. far Eastern ports (August/July).3. Excludes Iceland but includes all EU28 member countries.Source: OECD/FAO (2016), “OECD-FAO Agricultural Outlook”, OECD Agriculture statistics (database). doi: dx.doi.org/10.1787/agr-outl-data-en
Marketing year
Average2013-15est 2016 2017 2018 2019 2020 2021 2022 2023 2024 2025
WORLDProduction Mt 24.9 23.6 23.9 24.3 24.7 25.2 25.8 26.4 27.1 27.6 28.0
Area Mha 32.7 31.2 31.5 31.6 31.7 32.0 32.3 32.5 32.8 32.9 33.1Yield t/ha 0.72 0.76 0.76 0.77 0.78 0.79 0.80 0.81 0.83 0.84 0.85
Consumption1 Mt 23.9 24.7 25.2 25.5 25.9 26.2 26.6 26.9 27.4 27.8 28.3
Exports Mt 8.1 7.3 7.5 7.6 7.7 7.8 7.9 8.1 8.3 8.5 8.7Closing stocks Mt 20.2 18.8 17.5 16.3 15.1 14.1 13.3 12.8 12.5 12.2 11.8
Price2 USD/t 1 699.1 1 280.3 1 239.7 1 300.6 1 344.8 1 432.4 1 486.4 1 528.1 1 524.0 1 501.6 1 479.4
DEVELOPED COUNTRIESProduction Mt 5.4 5.3 5.3 5.5 5.5 5.6 5.8 6.0 6.1 6.3 6.4Consumption Mt 1.7 1.8 1.8 1.9 1.9 1.9 1.9 2.0 2.0 2.0 2.1Exports Mt 4.2 3.7 3.9 4.0 4.0 4.1 4.2 4.3 4.5 4.6 4.7Imports Mt 0.4 0.4 0.4 0.4 0.4 0.4 0.4 0.4 0.4 0.4 0.4Closing stocks Mt 1.5 1.5 1.5 1.6 1.5 1.6 1.6 1.6 1.6 1.6 1.6
DEVELOPING COUNTRIESProduction Mt 19.5 18.3 18.6 18.8 19.1 19.6 20.0 20.5 20.9 21.3 21.6Consumption Mt 22.2 22.9 23.3 23.6 24.0 24.3 24.6 25.0 25.4 25.8 26.2Exports Mt 3.9 3.6 3.6 3.6 3.6 3.7 3.7 3.8 3.9 3.9 4.0Imports Mt 7.6 7.0 7.1 7.2 7.3 7.4 7.6 7.8 8.0 8.1 8.3Closing stocks Mt 18.7 17.3 16.0 14.7 13.5 12.5 11.7 11.2 10.8 10.5 10.2
OECD3
Production Mt 4.9 4.7 4.8 4.9 5.0 5.0 5.2 5.3 5.5 5.7 5.8Consumption Mt 3.3 3.4 3.4 3.4 3.4 3.4 3.5 3.5 3.5 3.5 3.6Exports Mt 3.3 2.9 3.0 3.1 3.2 3.2 3.4 3.5 3.6 3.8 3.9Imports Mt 1.6 1.7 1.7 1.7 1.7 1.7 1.7 1.7 1.7 1.7 1.7Closing stocks Mt 1.7 1.7 1.7 1.7 1.7 1.7 1.7 1.7 1.7 1.7 1.7
From:OECD-FAO Agricultural Outlook 2016-2025
Access the complete publication at:http://dx.doi.org/10.1787/agr_outlook-2016-en
Please cite this chapter as:
OECD/FAO (2016), “Cotton”, in OECD-FAO Agricultural Outlook 2016-2025, OECD Publishing, Paris.
DOI: http://dx.doi.org/10.1787/agr_outlook-2016-14-en
This work is published under the responsibility of the Secretary-General of the OECD and the Director-General of the FAO. Theopinions expressed and arguments employed herein do not necessarily reflect the official views of OECD member countries, orthe governments of the FAO member countries.
This document and any map included herein are without prejudice to the status of or sovereignty over any territory, to thedelimitation of international frontiers and boundaries and to the name of any territory, city or area.
You can copy, download or print OECD content for your own use, and you can include excerpts from OECD publications,databases and multimedia products in your own documents, presentations, blogs, websites and teaching materials, providedthat suitable acknowledgment of OECD as source and copyright owner is given. All requests for public or commercial use andtranslation rights should be submitted to [email protected]. Requests for permission to photocopy portions of this material forpublic or commercial use shall be addressed directly to the Copyright Clearance Center (CCC) at [email protected] or theCentre français d’exploitation du droit de copie (CFC) at [email protected].