
Cotton Gin Pneumatic Conveying Systemsjournal.cotton.org/journal/2019-23/2/upload/JCS23-182.pdf ·...
36
182 The Journal of Cotton Science 23:182–217 (2019) http://journal.cotton.org, © The Cotton Foundation 2019 ENGINEERING & GINNING Cotton Gin Pneumatic Conveying Systems Derek Whitelock*, Michael Buser, Gregory Holt, Robert Hardin IV, Kelley Green, John Fabian, Duncan McCook D.P. Whitelock*, USDA-ARS Southwestern Cotton Ginning Research Laboratory, P.O. Box 578, Mesilla Park, NM 88047; M.D. Buser, USDA-ARS Office of National Programs, 5601 Sunnyside Ave., GWCC-BLTSVL, Beltsville, MD 20705; G.A. Holt, USDA- ARS Cotton Production and Processing Research Unit, Rt. 3 Box 215, Lubbock, TX 79401; R.G. Hardin IV, Department of Biological and Agricultural Engineering, Texas A&M University, 2117 TAMU, College Station, TX 77843 ; J.K. Green, Texas Cotton Ginners’ Association, 408 West 14th Street, Austin, TX 78701; J. Fabian; USDA-ARS Cotton Production and Processing Research Unit, Rt. 3 Box 215, Lubbock, TX 79401; and D. McCook, Lummus Corporation; 225 Bourne Boulevard, Savannah, GA 31408 *Corresponding author: [email protected] ABSTRACT Cotton gins use air to move seed cotton, lint, cottonseed, and trash through conveying pipes. In gins, pneumatic conveying systems are the principal means of moving material from one processing stage to another throughout the entire ginning plant. Further, material drying or moisture restoration can be accomplished by heating or humidifying the conveying air. Pneumatic systems are a critical and fundamental component of cotton ginning. Cotton gins use large quantities of air for pneumatic conveying. It is common for a gin to use 4,248 m 3 (150,000 ft 3 ) or more of air per minute in its vari- ous material conveying systems. Because the density of dry standard air is approximately 1.2 kg/m 3 (0.075 lb/ft 3 ), a typical gin using 4,248 m 3 /min (150,000 ft 3 /min) of air moves 305,860 kg (675,000 lb) of air per hour. This mass of air per hour is approximately 1.5 times the total mass of material handled per hour. Typically, more than 60 to 65% of the total electrical power consumed by a cotton gin is at- tributed to moving material pneumatically. Properly taking air measurements, determining air flow requirements, sizing conveying pipes, sizing fans to generate required air flow rates, and accounting for specific machinery air requirements are essential to maximizing machine utilization, minimizing energy costs, and decreasing system downtime. This update of the Cotton Ginners Handbook provides current technical information on cotton gin pneumatic systems. It draws heavily on previous versions of the Cotton Ginners Handbook (Stedronsky 1964; McCaskill et al., 1977; Baker et al., 1994) and the knowledge and experience of current and past instructors of the Air Systems classes from the National Cotton Ginners’ Association Gin Schools. AIR FLOW BASICS A ir Velocity and Flow. Air velocity is defined as the speed of the moving air stream and is usually expressed in units of meters per second, m/s (feet per minute, ft/min or fpm). The volume of air flowing through a conveying duct per unit time is defined as the air flow rate, which is normally expressed in terms of cubic meters per minute, m 3 /min (cubic feet per minute, ft 3 /min or cfm). Air flow rate is determined by multiplying the air velocity by the cross-sectional area of the duct (Fig. 1). The following equations demonstrate the relationship between air flow rate, air velocity, and cross-sectional area: Q = VA or V = Q/A or A = Q/V (Eq. 1) where: Q = air flow rate, m 3 /min (ft 3 /min) V = air velocity, m/s × 60 (ft/min) A = cross-sectional area, m 2 (ft 2 ).
Transcript of Cotton Gin Pneumatic Conveying Systemsjournal.cotton.org/journal/2019-23/2/upload/JCS23-182.pdf ·...

182The Journal of Cotton Science 23:182–217 (2019) http://journal.cotton.org, © The Cotton Foundation 2019
ENGINEERING & GINNINGCotton Gin Pneumatic Conveying Systems
Derek Whitelock*, Michael Buser, Gregory Holt, Robert Hardin IV, Kelley Green, John Fabian, Duncan McCook
D.P. Whitelock*, USDA-ARS Southwestern Cotton Ginning Research Laboratory, P.O. Box 578, Mesilla Park, NM 88047; M.D. Buser, USDA-ARS Office of National Programs, 5601 Sunnyside Ave., GWCC-BLTSVL, Beltsville, MD 20705; G.A. Holt, USDA-ARS Cotton Production and Processing Research Unit, Rt. 3 Box 215, Lubbock, TX 79401; R.G. Hardin IV, Department of Biological and Agricultural Engineering, Texas A&M University, 2117 TAMU, College Station, TX 77843 ; J.K. Green, Texas Cotton Ginners’ Association, 408 West 14th Street, Austin, TX 78701; J. Fabian; USDA-ARS Cotton Production and Processing Research Unit, Rt. 3 Box 215, Lubbock, TX 79401; and D. McCook, Lummus Corporation; 225 Bourne Boulevard, Savannah, GA 31408
*Corresponding author: [email protected]
ABSTRACT
Cotton gins use air to move seed cotton, lint, cottonseed, and trash through conveying pipes. In gins, pneumatic conveying systems are the principal means of moving material from one processing stage to another throughout the entire ginning plant. Further, material drying or moisture restoration can be accomplished by heating or humidifying the conveying air. Pneumatic systems are a critical and fundamental component of cotton ginning. Cotton gins use large quantities of air for pneumatic conveying. It is common for a gin to use 4,248 m3 (150,000 ft3) or more of air per minute in its vari-ous material conveying systems. Because the density of dry standard air is approximately 1.2 kg/m3 (0.075 lb/ft3), a typical gin using 4,248 m3/min (150,000 ft3/min) of air moves 305,860 kg (675,000 lb) of air per hour. This mass of air per hour is approximately 1.5 times the total mass of material handled per hour. Typically, more than 60 to 65% of the total electrical power consumed by a cotton gin is at-tributed to moving material pneumatically. Properly taking air measurements, determining air flow requirements, sizing conveying pipes, sizing fans to generate required air flow rates, and accounting for specific machinery air requirements are essential to maximizing machine utilization, minimizing energy costs, and decreasing system downtime. This update of the Cotton Ginners Handbook provides current technical information on cotton gin pneumatic systems. It draws heavily on previous versions of the Cotton Ginners Handbook (Stedronsky 1964; McCaskill et al., 1977; Baker et al., 1994) and the knowledge and experience of current and past instructors of the Air Systems classes from the National Cotton Ginners’ Association Gin Schools.
AIR FLOW BASICS
Air Velocity and Flow. Air velocity is defined as the speed of the moving air stream and is usually expressed in units of meters per second, m/s (feet per minute, ft/min or fpm). The volume of air flowing through
a conveying duct per unit time is defined as the air flow rate, which is normally expressed in terms of cubic meters per minute, m3/min (cubic feet per minute, ft3/min or cfm). Air flow rate is determined by multiplying the air velocity by the cross-sectional area of the duct (Fig. 1). The following equations demonstrate the relationship between air flow rate, air velocity, and cross-sectional area:
Q = VA or V = Q/A or A = Q/V (Eq. 1)where:
Q = air flow rate, m3/min (ft3/min)V = air velocity, m/s × 60 (ft/min)A = cross-sectional area, m2 (ft2).

183WHITELOCK: COTTON GIN PNEUMATIC CONVEYING SYSTEMS
For a round pipe the cross-sectional area (Fig. 1) is calculated using2A πD / 4= (Eq. 2)
where:D = pipe diameter, mm/1000 or m (in./12 or ft)π = 3.1416.
For a square or rectangular duct the cross-sectional area (Fig. 1) is calculated using
A bh= (Eq. 3)where:
b = width of the duct, mm/1000 or m (in./12 or ft)h = height of the duct, mm/1000 or m (in./12 or ft).
Figure 1. Pipe and duct cross-sectional area.
An air flow lookup table is provided in Table 1 [Table 1a for International System of Units (SI) and Table 1b for U.S. customary units (USC)] that has air flow rates for a range of air velocities in the second column and round pipe diameters across the top row. The corresponding circumference and cross-sectional area for each pipe diameter are in the second and third rows and the first column, velocity pressure, is discussed in the Air Measurements section. An example of the use of Table 1 and Equations 1 and 2 follows:
Example 1. For air moving inside a 450-mm (18-in.) diameter pipe at 20 m/s (4,000 ft/min), determine the air flow rate.
Using Table 1, move straight down the column for 450-mm (18-in.) pipe diameter and move straight right across the row for 20 m/s (4,000 ft/min). The corresponding air flow rate is located where the column and row intersect: 191 m3/min (7,069 ft3/min).
Table 1 shows that a 450-mm diameter pipe has cross-sectional area = 0.159 m2 (18-in. diameter pipe has 1.767 ft2 cross-sectional area). Using Equation 2 also gives the pipe cross-sectional area:
2
2
450 mm3.14161000 mm / mA 0.159 m
4
× = =
or2
2
18 in.3.141612 in. / ftA 1.767 ft4
× = =

184JOURNAL OF COTTON SCIENCE, Volume 23, Issue 2, 2019
Table 1a. Air flow rates for air velocity or velocity pressure and round pipe sizesz—SI units
Diameter (mm) 200 225 250 275 300 325 350 375 400 425 450 475 500 525 550 575 600 625 650Circumference (mm) 628 707 785 864 942 1021 1100 1178 1257 1335 1414 1492 1571 1649 1728 1806 1885 1963 2042Cross-sectional area (m2) 0.031 0.040 0.049 0.059 0.071 0.083 0.096 0.110 0.126 0.142 0.159 0.177 0.196 0.216 0.238 0.260 0.283 0.307 0.332
Vel. Pres.y (Pa)
Vel.x(m/s) Air flow ratew (m3/min)
18 5 9.42 11.9 14.7 17.8 21.2 24.9 28.9 33.1 37.7 42.6 47.7 53.2 58.9 64.9 71.3 77.9 84.8 92.0 99.526 6 11.3 14.3 17.7 21.4 25.4 29.9 34.6 39.8 45.24 51.1 57.3 63.8 70.7 77.9 85.5 93.5 102 110 11935 7 13.2 16.7 20.6 24.9 29.7 34.8 40.4 46.4 52.78 59.6 66.8 74.4 82.5 90.9 99.8 109 119 129 13946 8 15.1 19.1 23.6 28.5 33.9 39.8 46.2 53.0 60.32 68.1 76.3 85.1 94.2 104 114 125 136 147 15959 9 17.0 21.5 26.5 32.1 38.2 44.8 52.0 59.6 67.86 76.6 85.9 95.7 106 117 128 140 153 166 17972 10 18.8 23.9 29.5 35.6 42.4 49.8 57.7 66.3 75.40 85.1 95.4 106 118 130 143 156 170 184 19988 11 20.7 26.2 32.4 39.2 46.7 54.8 63.5 72.9 82.94 93.6 105 117 130 143 157 171 187 202 219
104 12 22.6 28.6 35.3 42.8 50.9 59.7 69.3 79.5 90.48 102 115 128 141 156 171 187 204 221 239122 13 24.5 31.0 38.3 46.3 55.1 64.7 75.0 86.1 98.02 111 124 138 153 169 185 203 221 239 259142 14 26.4 33.4 41.2 49.9 59.4 69.7 80.8 92.8 106 119 134 149 165 182 200 218 238 258 279163 15 28.3 35.8 44.2 53.5 63.6 74.7 86.6 99.4 113 128 143 159 177 195 214 234 254 276 299185 16 30.2 38.2 47.1 57.0 67.9 79.6 92.4 106 121 136 153 170 188 208 228 249 271 295 319209 17 32.0 40.6 50.1 60.6 72.1 84.6 98.1 113 128 145 162 181 200 221 242 265 288 313 338235 18 33.9 42.9 53.0 64.1 76.3 89.6 104 119 136 153 172 191 212 234 257 280 305 331 358261 19 35.8 45.3 56.0 67.7 80.6 94.6 110 126 143 162 181 202 224 247 271 296 322 350 378290 20 37.7 47.7 58.9 71.3 84.8 99.5 115 133 151 170 191 213 236 260 285 312 339 368 398319 21 39.6 50.1 61.9 74.8 89.1 105 121 139 158 179 200 223 247 273 299 327 356 387 418351 22 41.5 52.5 64.8 78.4 93.3 110 127 146 166 187 210 234 259 286 314 343 373 405 438383 23 43.4 54.9 67.7 82.0 97.5 114 133 152 173 196 219 245 271 299 328 358 390 423 458417 24 45.2 57.3 70.7 85.5 102 119 139 159 181 204 229 255 283 312 342 374 407 442 478453 25 47.1 59.6 73.6 89.1 106 124 144 166 188 213 239 266 295 325 356 390 424 460 498490 26 49.0 62.0 76.6 92.7 110 129 150 172 196 221 248 276 306 338 371 405 441 479 518528 27 50.9 64.4 79.5 96.2 115 134 156 179 204 230 258 287 318 351 385 421 458 497 538568 28 52.8 66.8 82.5 99.8 119 139 162 186 211 238 267 298 330 364 399 436 475 515 557609 29 54.7 69.2 85.4 103 123 144 167 192 219 247 277 308 342 377 413 452 492 534 577652 30 56.5 71.6 88.4 107 127 149 173 199 226 255 286 319 353 390 428 467 509 552 597696 31 58.4 74.0 91.3 110 131 154 179 205 234 264 296 330 365 403 442 483 526 571 617742 32 60.3 76.3 94.2 114 136 159 185 212 241 272 305 340 377 416 456 499 543 589 637
Table 1a. (Continued)
Diameter (mm) 675 700 725 750 800 850 900 950 1000 1050 1100 1150 1200 1250 1300 1350 1400 1450 1500Circumference (mm) 2121 2199 2278 2356 2513 2670 2827 2985 3142 3299 3456 3613 3770 3927 4084 4241 4398 4555 4712Cross-sectional area (m2) 0.358 0.385 0.413 0.442 0.503 0.567 0.636 0.709 0.785 0.866 0.950 1.039 1.131 1.227 1.327 1.431 1.539 1.651 1.767
Vel. Pres.y (Pa)
Vel.x(m/s) Air flow ratew (m3/min)
18 5 107 115 124 133 151 170 191 213 236 260 285 312 339 368 398 429 462 495 53026 6 129 139 149 159 181 204 229 255 283 312 342 374 407 442 478 515 554 594 63635 7 150 162 173 186 211 238 267 298 330 364 399 436 475 515 557 601 647 694 74246 8 172 185 198 212 241 272 305 340 377 416 456 499 543 589 637 687 739 793 84859 9 193 208 223 239 271 306 344 383 424 468 513 561 611 663 717 773 831 892 95472 10 215 231 248 265 302 340 382 425 471 520 570 623 679 736 796 859 924 991 106088 11 236 254 272 292 332 375 420 468 518 571 627 686 746 810 876 945 1016 1090 1166104 12 258 277 297 318 362 409 458 510 565 623 684 748 814 884 956 1031 1108 1189 1272
Then using Equation 1 to find the air flow rate:2 3Q = 20 m/s × 60 s/min × 0.159 m =191m / min
or2 3Q = 4000 ft/min ×1 .767 ft = 7068ft / min
Note: The International System of Units (SI) and U.S. customary units (USC) used in the examples are not always exact conversions. Values used for details like nominal pipe sizes are adjusted to be approximately equivalent and make sense in the context.

185WHITELOCK: COTTON GIN PNEUMATIC CONVEYING SYSTEMS
Diameter (mm) 675 700 725 750 800 850 900 950 1000 1050 1100 1150 1200 1250 1300 1350 1400 1450 1500Circumference (mm) 2121 2199 2278 2356 2513 2670 2827 2985 3142 3299 3456 3613 3770 3927 4084 4241 4398 4555 4712Cross-sectional area (m2) 0.358 0.385 0.413 0.442 0.503 0.567 0.636 0.709 0.785 0.866 0.950 1.039 1.131 1.227 1.327 1.431 1.539 1.651 1.767
Vel. Pres.y (Pa)
Vel.x(m/s) Air flow ratew (m3/min)
122 13 279 300 322 345 392 443 496 553 613 675 741 810 882 957 1035 1116 1201 1288 1378142 14 301 323 347 371 422 477 534 595 660 727 798 872 950 1031 1115 1202 1293 1387 1484163 15 322 346 372 398 452 511 573 638 707 779 855 935 1018 1104 1195 1288 1385 1486 1590185 16 344 369 396 424 483 545 611 680 754 831 912 997 1086 1178 1274 1374 1478 1585 1696209 17 365 393 421 451 513 579 649 723 801 883 969 1059 1154 1252 1354 1460 1570 1684 1802235 18 386 416 446 477 543 613 687 766 848 935 1026 1122 1221 1325 1434 1546 1663 1783 1909261 19 408 439 471 504 573 647 725 808 895 987 1083 1184 1289 1399 1513 1632 1755 1882 2015290 20 429 462 495 530 603 681 763 851 942 1039 1140 1246 1357 1473 1593 1718 1847 1982 2121319 21 451 485 520 557 633 715 802 893 990 1091 1197 1309 1425 1546 1672 1804 1940 2081 2227351 22 472 508 545 583 664 749 840 936 1037 1143 1254 1371 1493 1620 1752 1889 2032 2180 2333383 23 494 531 570 610 694 783 878 978 1084 1195 1311 1433 1561 1694 1832 1975 2124 2279 2439417 24 515 554 594 636 724 817 916 1021 1131 1247 1368 1496 1629 1767 1911 2061 2217 2378 2545453 25 537 577 619 663 754 851 954 1063 1178 1299 1425 1558 1696 1841 1991 2147 2309 2477 2651490 26 558 600 644 689 784 885 992 1106 1225 1351 1483 1620 1764 1914 2071 2233 2401 2576 2757528 27 580 623 669 716 814 919 1031 1148 1272 1403 1540 1683 1832 1988 2150 2319 2494 2675 2863568 28 601 647 694 742 844 953 1069 1191 1319 1455 1597 1745 1900 2062 2230 2405 2586 2774 2969609 29 623 670 718 769 875 987 1107 1233 1367 1507 1654 1807 1968 2135 2310 2491 2679 2873 3075652 30 644 693 743 795 905 1021 1145 1276 1414 1559 1711 1870 2036 2209 2389 2576 2771 2972 3181696 31 666 716 768 822 935 1055 1183 1318 1461 1611 1768 1932 2104 2283 2469 2662 2863 3071 3287742 32 687 739 793 848 965 1090 1221 1361 1508 1663 1825 1994 2171 2356 2548 2748 2956 3170 3393
z Pipe size relationships: Diameter (mm) = circumference (mm) ÷ 3.1416, Cross-sectional area (m2) = 3.1416 × [diameter (mm)/1000]2/4
y Velocity pressure based on pipe centerline velocity pressure reading at standard air (density = 1.2 kg/m3) conditions @ 21°C and 101.3 kPa
x ( )Velocity (m/s) = 1.175 velocity pressure Paw Air flow rate (m3/min) = velocity (m/s) × cross-sectional area (m2) × 60
Table 1b. Air flow rates for air velocity or velocity pressure and round pipe sizesz—USC units
Diameter (in.) 8 9 10 11 12 13 14 15 16 17 18 19 20 21 22 23 24 25 26Circumference (in.) 25.13 28.27 31.42 34.56 37.70 40.84 43.98 47.12 50.27 53.41 56.55 59.69 62.83 65.97 69.12 72.26 75.40 78.54 81.68Cross-sectional area (ft2) 0.349 0.442 0.545 0.660 0.785 0.922 1.069 1.227 1.396 1.576 1.767 1.969 2.182 2.405 2.640 2.885 3.142 3.409 3.687
Vel. Pres.y (in. H2O)
Vel.x(ft/min) Air flow ratew (ft3/min)
0.08 1000 349 442 545 660 785 922 1069 1227 1396 1576 1767 1969 2182 2405 2640 2885 3142 3409 36870.11 1200 419 530 654 792 942 1106 1283 1473 1676 1892 2121 2363 2618 2886 3168 3462 3770 4091 44240.15 1400 489 619 764 924 1100 1290 1497 1718 1955 2207 2474 2757 3054 3367 3696 4039 4398 4772 51620.19 1600 559 707 873 1056 1257 1475 1710 1963 2234 2522 2827 3150 3491 3848 4224 4616 5027 5454 58990.24 1800 628 795 982 1188 1414 1659 1924 2209 2513 2837 3181 3544 3927 4330 4752 5193 5655 6136 66370.30 2000 698 884 1091 1320 1571 1844 2138 2454 2793 3153 3534 3938 4363 4811 5280 5770 6283 6818 73740.36 2200 768 972 1200 1452 1728 2028 2352 2700 3072 3468 3888 4332 4800 5292 5808 6348 6912 7499 81110.43 2400 838 1060 1309 1584 1885 2212 2566 2945 3351 3783 4241 4725 5236 5773 6336 6925 7540 8181 88490.51 2600 908 1149 1418 1716 2042 2397 2779 3191 3630 4098 4595 5119 5672 6254 6864 7502 8168 8863 95860.59 2800 977 1237 1527 1848 2199 2581 2993 3436 3910 4414 4948 5513 6109 6735 7391 8079 8796 9545 103240.68 3000 1047 1325 1636 1980 2356 2765 3207 3682 4189 4729 5301 5907 6545 7216 7919 8656 9425 10227 110610.77 3200 1117 1414 1745 2112 2513 2950 3421 3927 4468 5044 5655 6301 6981 7697 8447 9233 10053 10908 117980.87 3400 1187 1502 1854 2244 2670 3134 3635 4172 4747 5359 6008 6694 7418 8178 8975 9810 10681 11590 125360.97 3600 1257 1590 1963 2376 2827 3318 3848 4418 5027 5675 6362 7088 7854 8659 9503 10387 11310 12272 132731.08 3800 1326 1679 2073 2508 2985 3503 4062 4663 5306 5990 6715 7482 8290 9140 10031 10964 11938 12954 140111.20 4000 1396 1767 2182 2640 3142 3687 4276 4909 5585 6305 7069 7876 8727 9621 10559 11541 12566 13635 147481.32 4200 1466 1856 2291 2772 3299 3871 4490 5154 5864 6620 7422 8270 9163 10102 11087 12118 13195 14317 154851.45 4400 1536 1944 2400 2904 3456 4056 4704 5400 6144 6936 7775 8663 9599 10583 11615 12695 13823 14999 16223
Table 1a. (Continued)

186JOURNAL OF COTTON SCIENCE, Volume 23, Issue 2, 2019
Diameter (in.) 8 9 10 11 12 13 14 15 16 17 18 19 20 21 22 23 24 25 26Circumference (in.) 25.13 28.27 31.42 34.56 37.70 40.84 43.98 47.12 50.27 53.41 56.55 59.69 62.83 65.97 69.12 72.26 75.40 78.54 81.68Cross-sectional area (ft2) 0.349 0.442 0.545 0.660 0.785 0.922 1.069 1.227 1.396 1.576 1.767 1.969 2.182 2.405 2.640 2.885 3.142 3.409 3.687
Vel. Pres.y (in. H2O)
Vel.x(ft/min) Air flow ratew (ft3/min)
1.59 4600 1606 2032 2509 3036 3613 4240 4917 5645 6423 7251 8129 9057 10036 11064 12143 13272 14451 15681 169601.73 4800 1676 2121 2618 3168 3770 4424 5131 5890 6702 7566 8482 9451 10472 11545 12671 13849 15080 16362 176981.88 5000 1745 2209 2727 3300 3927 4609 5345 6136 6981 7881 8836 9845 10908 12026 13199 14426 15708 17044 184352.03 5200 1815 2297 2836 3432 4084 4793 5559 6381 7261 8197 9189 10239 11345 12507 13727 15003 16336 17726 191722.19 5400 1885 2386 2945 3564 4241 4977 5773 6627 7540 8512 9543 10632 11781 12989 14255 15580 16965 18408 199102.35 5600 1955 2474 3054 3696 4398 5162 5986 6872 7819 8827 9896 11026 12217 13470 14783 16157 17593 19090 206472.53 5800 2025 2562 3163 3828 4555 5346 6200 7118 8098 9142 10249 11420 12654 13951 15311 16734 18221 19771 213852.70 6000 2094 2651 3272 3960 4712 5531 6414 7363 8378 9458 10603 11814 13090 14432 15839 17311 18850 20453 221222.89 6200 2164 2739 3382 4092 4869 5715 6628 7609 8657 9773 10956 12207 13526 14913 16367 17889 19478 21135 228593.07 6400 2234 2827 3491 4224 5027 5899 6842 7854 8936 10088 11310 12601 13963 15394 16895 18466 20106 21817 23597
Table 1b. (Continued)
Diameter (in.) 27 28 29 30 32 34 36 38 40 42 44 46 48 50 52 54 56 58 60Circumference (in.) 84.82 87.96 91.11 94.25 100.5 106.8 113.1 119.4 125.7 131.9 138.2 144.5 150.8 157.1 163.4 169.6 175.9 182.2 188.5Cross-sectional area (ft2) 3.976 4.276 4.587 4.909 5.585 6.305 7.069 7.876 8.727 9.621 10.56 11.54 12.57 13.64 14.75 15.90 17.10 18.35 19.63
Vel. Pres.y(in. H2O)
Vel.x(ft/min) Air flow ratew (ft3/min)
0.08 1000 3976 4276 4587 4909 5585 6305 7069 7876 8727 9621 10559 11541 12566 13635 14748 15904 17104 18348 196350.11 1200 4771 5131 5504 5890 6702 7566 8482 9451 10472 11545 12671 13849 15080 16362 17698 19085 20525 22017 235620.15 1400 5567 5986 6422 6872 7819 8827 9896 11026 12217 13470 14783 16157 17593 19090 20647 22266 23946 25687 274890.19 1600 6362 6842 7339 7854 8936 10088 11310 12601 13963 15394 16895 18466 20106 21817 23597 25447 27367 29356 314160.24 1800 7157 7697 8256 8836 10053 11349 12723 14176 15708 17318 19007 20774 22619 24544 26546 28628 30788 33026 353430.30 2000 7952 8552 9174 9817 11170 12610 14137 15752 17453 19242 21118 23082 25133 27271 29496 31809 34208 36696 392700.36 2200 8747 9407 10091 10799 12287 13871 15551 17327 19199 21166 23230 25390 27646 29998 32446 34989 37629 40365 431970.43 2400 9543 10263 11009 11781 13404 15132 16965 18902 20944 23091 25342 27698 30159 32725 35395 38170 41050 44035 471240.51 2600 10338 11118 11926 12763 14521 16393 18378 20477 22689 25015 27454 30007 32673 35452 38345 41351 44471 47704 510510.59 2800 11133 11973 12843 13744 15638 17654 19792 22052 24435 26939 29566 32315 35186 38179 41294 44532 47892 51374 549780.68 3000 11928 12828 13761 14726 16755 18915 21206 23627 26180 28863 31678 34623 37699 40906 44244 47713 51313 55043 589050.77 3200 12723 13683 14678 15708 17872 20176 22619 25203 27925 30788 33790 36931 40212 43633 47194 50894 54734 58713 628320.87 3400 13519 14539 15596 16690 18989 21437 24033 26778 29671 32712 35901 39239 42726 46360 50143 54075 58154 62382 667590.97 3600 14314 15394 16513 17671 20106 22698 25447 28353 31416 34636 38013 41548 45239 49087 53093 57256 61575 66052 706861.08 3800 15109 16249 17430 18653 21223 23959 26861 29928 33161 36560 40125 43856 47752 51814 56043 60436 64996 69722 746131.20 4000 15904 17104 18348 19635 22340 25220 28274 31503 34907 38485 42237 46164 50265 54542 58992 63617 68417 73391 785401.32 4200 16700 17959 19265 20617 23457 26481 29688 33078 36652 40409 44349 48472 52779 57269 61942 66798 71838 77061 824671.45 4400 17495 18815 20183 21598 24574 27742 31102 34654 38397 42333 46461 50780 55292 59996 64891 69979 75259 80730 863941.59 4600 18290 19670 21100 22580 25691 29003 32515 36229 40143 44257 48573 53089 57805 62723 67841 73160 78679 84400 903211.73 4800 19085 20525 22017 23562 26808 30264 33929 37804 41888 46181 50684 55397 60319 65450 70791 76341 82100 88069 942481.88 5000 19880 21380 22935 24544 27925 31525 35343 39379 43633 48106 52796 57705 62832 68177 73740 79522 85521 91739 981752.03 5200 20676 22235 23852 25525 29042 32786 36757 40954 45379 50030 54908 60013 65345 70904 76690 82702 88942 95408 1021022.19 5400 21471 23091 24769 26507 30159 34047 38170 42529 47124 51954 57020 62321 67858 73631 79639 85883 92363 99078 1060292.35 5600 22266 23946 25687 27489 31276 35308 39584 44104 48869 53878 59132 64630 70372 76358 82589 89064 95784 102748 1099562.53 5800 23061 24801 26604 28471 32393 36569 40998 45680 50615 55803 61244 66938 72885 79085 85539 92245 99205 106417 1138832.70 6000 23856 25656 27522 29452 33510 37830 42412 47255 52360 57727 63355 69246 75398 81812 88488 95426 102625 110087 1178102.89 6200 24652 26512 28439 30434 34627 39091 43825 48830 54105 59651 65467 71554 77911 84539 91438 98607 106046 113756 1217373.07 6400 25447 27367 29356 31416 35744 40352 45239 50405 55851 61575 67579 73862 80425 87266 94387 101788 109467 117426 125664
z Pipe size relationships: Diameter (in.) = circumference (in.) ÷ 3.1416, Cross-sectional area (ft2) = 3.1416 × [diameter (in.)/12]2/4
y Velocity pressure based on pipe centerline velocity pressure reading at standard air (density = 0.075 lb/ft3) conditions @ 70 °F and 29.92-in. Hg
x Velocity (ft/min) = 3650 velocity pressure (in. H2O) .w Air flow rate (ft3/min) = velocity (ft/min) × cross-sectional area (ft2)

187WHITELOCK: COTTON GIN PNEUMATIC CONVEYING SYSTEMS
Pressure. Moving air exerts a pressure on objects in the airstream, for example, seed cotton in a pipe. This pressure, called the velocity pressure, is proportional to the air density and the square of the velocity. The faster the air stream is moving, the more force it exerts on the material being conveyed. In the gin, air velocity is determined from the velocity pressure of the moving airstream. Velocity pressure is always exerted in the direction of flow and is always positive (Fig. 2).
Figure 2. Total (TP), static (SP), and velocity pressure (VP) relationships illustrated.
The air pressure that the fan must supply to overcome the resistance to air flow through the ductwork and com-ponents is called static pressure. This static pressure is equal in all directions and can exist in the absence of air flow (Fig. 2). A common example of static pressure is the pressure inside an inflated balloon. In a pneumatic conveying system, static pressure is measured perpendicular to the air flow and is usually negative before the fan inlet and positive after the fan outlet.
The total pressure in a conveying pipe is the sum of the velocity and static pressures and is either posi-tive or negative (Fig. 2).
The velocity, static, and total pressures for air flow are normally measured in units of Pascals (Pa) or inches of water column (in. H2O) with a differential pressure gauge. In metric units, 10 Pa is approximately equivalent to 1 millimeter of water column (mm H2O). In USC units, 27.7 in. H2O is approximately equivalent to 1 pound per square inch (lb/in.2 or psi).
AIR FLOW REQUIREMENTS
Efficient operation of pneumatic conveying systems depends on several factors, and air velocity is the primary factor. Table 2 shows the recommended air velocities for efficient conveying of various materials in cotton gin systems. Typical air velocity in seed cotton conveying pipes should be approximately 23 m/s (4,500 ft/min), whereas it should be approximately 8.9 m/s (1,750 ft/min) for lint systems. If the conveying air veloc-ity is too low, the conveyed material can settle out of the air stream and choke the conveying pipe, resulting in operational downtime. Excessively high air velocities should be avoided as they waste energy, create exces-sive wear on the machinery, and can damage the material being conveyed. Therefore, it is critical to maintain air velocities within recommended ranges throughout a gin’s conveying pipes or ducts. When no material is conveyed, such as in the pipe from the burner inlet to the point where seed cotton is fed into the conveying system, lower air velocities can be used. The lower velocity reduces the static pressure and energy required.

188JOURNAL OF COTTON SCIENCE, Volume 23, Issue 2, 2019
The following example demonstrates using Tables 1, 2, and 3 and Equations 1 and 2 to determine the required air flow rate and pipe size to convey a specified amount of material.
Table 2. Recommended material conveying air velocities for cotton gin systems
Material & SystemAir velocity
(m/s) (ft/min)Seed cotton in telescope pipe 27.9 - 30.5 5,500 - 6,000Seed cotton in conveying pipes 20.3 - 25.4 4,000 - 5,000Seed cotton in tower dryers 10.2 - 12.7 2,000 - 2,500Seed in small-pipe systems 20.3 - 25.4 4,000 - 5,000Hulls and trash 20.3 - 25.4 4,000 - 5,000Lint cotton 7.6 - 10.2 1,500 - 2,000
Table 3. Typical air requirements for conveying material in cotton gin systems
Seed Cotton SystemAir requirement
(m3 per kg material) (ft3 per lb material)
Unloading 1.25 - 1.56 20 - 25Conveying 0.9 - 1.25 15 - 20Drying 1.25 - 2.5 20 - 40
Lint Systems z (m3/min per m width) (ft3/min per ft width)
Gin Stand andLint Cleaner Brushes 93 1000
z Machinery dependent
Example 2. For a seed cotton conveying system to handle 30 bales per hour, determine the required air flow rate and pipe size. Assume 590 kg (1,300 lb) of seed cotton per bale.
The mass of seed cotton conveyed per minute:30 bales 590 kg hr 295 kg / min
hr bale 60 min× × =
or30 bales 1300 lb hr 650 lb / min
hr bale 60 min× × =
From Table 3 for seed cotton conveying, use 1.25 m3 per kg (20 ft3 per lb) of seed cotton. The required air flow rate:
33295 kg 1.25 mQ 369 m / min
min kg= × =
or3
3650 lb 20 ftQ 13000 ft / minmin lb
= × =
Air flow rate is also an important factor and depends on the material conveyed, pipe or duct size, and the purpose of the gin system. Typical air requirements to convey materials in cotton gin systems are shown in Table 3. The recommended air volume for conveying seed cotton is 0.9 to 1.25 m3 per kg (15-20 ft3 per lb) of seed cotton for systems used strictly for conveying. This air volume might have to be increased for systems that handle wet, trashy cotton or when air leakage is greater than normal. Also, cotton drying systems can be designed to provide 1.25 to 2.5 m3 of air per kg of cotton (20-40 ft3/lb) to enhance drying effectiveness.

189WHITELOCK: COTTON GIN PNEUMATIC CONVEYING SYSTEMS
3
2369 m / minV 23.6 m / s
0.260 m 60 s / min= =
×or
3
213000 ft / minV 4506 ft / min
2.885 ft= =
Machine Air Flow Requirements. Much of the equipment in a cotton gin, although designed for certain material capacities, also has recommended air flow requirements to operate efficiently. This is particularly true for equipment handling lint after the ginning point, such as gin stands, lint cleaners, and condensers. Insufficient air flow at machines can cause incomplete doffing and promote choke-ups that can lead to reduced efficiency, increased down time, and higher incidence of fires. Each manufacturer has recommended air flow rates for the cotton gin equipment.
AIR MEASUREMENTS
Many problems at the gin can be attributed to air flow issues. The only reliable way to determine the air flow of a system is to take measurements of air velocity and static pressure. Although pneumatic systems in gins vary greatly (no two installations are identical), procedures for making air measurements are basically the same and can be made with a relatively simple kit containing the following items (Fig. 3):
Figure 3. Items necessary for making air flow measurements in cotton gin pipes: a) 8.0-mm (5/16-in.) diameter and 3.2-mm (1/8-in.) diameter Pitot tubes; b) dif-ferential pressure gauges; c) plastic hoses to connect the Pitot tube to the gauges d) measuring tape for determining pipe diameters; and e) tables of air flow rates for various pipe diameters and velocity pressures.
1. 3.2-mm (1/8-in.) diameter by 305-mm (12-in.) long Pitot tube for pipes up to 600-mm (24-in.) diameter, and 8.0-mm (5/16-in.) diameter Pitot tube up to 1,500-mm (60-in.) long for larger diameter pipes. Duct diameter should be at least 30 times the Pitot tube diameter (never use an 8.0-mm (5/16-in.) diameter Pitot tube in a duct smaller than 240 mm [10 in.]);
The recommended air velocity for seed cotton conveying from Table 2 is 20.3 to 25.4 m/s (4,000-5,000 ft/min), selecting a value between the higher and lower velocities, we select 23 m/s (4,500 ft/min). Using Table 1, the needed pipe diameter is found by starting at 23 m/s (4,400 ft/min) in the left column. Then, move right to the air flow rate at or just below the required 369-m3/min (13,000 ft3/min) air flow rate, which is 358 m3/min (12,695 ft3/min) that corresponds to 575-mm (23-in.) pipe diameter. The actual air velocity for the required 369-m3/min (13,000-ft3/in) air flow rate with a 575-mm (23-in.) diameter pipe is determined from Equation 1 and the pipe area = 0.260 m2 (2.885 ft2) from Table 1.

190JOURNAL OF COTTON SCIENCE, Volume 23, Issue 2, 2019
2. Differential pressure gauges similar to the Magnehelic® differential pressure gauges (Dwyer Instruments, Michigan City, IN) shown in Fig. 3. Three gauges with ranges of 0 to 500 Pa (0-2 in. H2O) for most velocity pressure measurements, and 0 to 1.5 kPa and 0 to 8 kPa (0-5 in. H2O and 0-30 in. H2O) for static pressure measurements are recommended. A liquid manometer (not shown in Figure) can be used instead of a pressure gauge, but it is more awkward to manage and more fragile than a gauge;
3. Two rubber or plastic hoses to connect the Pitot tube to the gauge;4. Measuring tape for determining pipe diameters; and5. Table 1 with air flow rates for air velocity or velocity pressure, and round pipe sizes.
Although not shown in Fig. 3, a tachometer for measuring fan speeds and an ammeter to check fan motor electrical current should also be included in an air measurement kit.
Velocity Pressure Measurement. Pressure measurements are ideally taken at least one and one-half pipe diameters upstream and eight and one-half pipe diameters downstream from any disturbance such as a fan, valve, or elbow (Fig. 4). This means that if the diameter of the pipe is 600 mm (24 in.), then the air measure-ment must be taken at least 0.9-m (3-ft) upstream and 5.1-m (17-ft) downstream from a disturbance to get a reliable measurement. This is to ensure that the air stream is uniform across the cross-section of the pipe. If this ideal situation is not possible, a traverse of air readings might have to be conducted to obtain an accurate measurement (see Appendix A).
Figure 4. Distance up- and down-stream of disturbance for fully devel-oped velocity profile and for reliable air flow measurements.
Use the following procedures for taking velocity pressure and static pressure readings:1. Start all the fans for the system. If the system is a push/pull system, ensure that both fans are
operating. Pressure measurements with a Pitot tube cannot be made in pipes that are loaded with seed cotton, lint, or trash. Stop the material flow, allow material to clear the system, and then take the measurements. Air measurements for drying systems should be taken with burners turned off. From time to time, systems can be operated without burners, thus air readings need to be taken
“cold” to ensure that adequate air flow is maintained. Also, careful attention should be paid to not plug up or damage the Pitot tube, and to avoid dangerous situations while measuring.
2. Connect the gauge or manometer to the Pitot tube with the two lengths of flexible hose. The dif-ferential pressure gauge tap marked “high pressure” should be connected with tubing to the total pressure connection that is an extension of the main tube of the Pitot tube, and the “low pressure” tap on the gauge should be connected to the static pressure connection that branches off perpen-dicularly to the main tube of the Pitot tube (Fig. 5). The pressure gauge should be held vertically and should be zeroed with the set screw on the front.

191WHITELOCK: COTTON GIN PNEUMATIC CONVEYING SYSTEMS
3. A hole approximately 1.5 mm (1/16 in.) larger than the Pitot tube should be used to allow insertion of the Pitot tube. When drilling holes in conveying pipes and ducts avoid making burs that will snag material. Insert the Pitot tube with tip pointed directly into the air flow (the static pressure connection pointing upstream and the stem at a right angle to the pipe ensures that the Pitot tube points directly into the air flow). Check for uniform air velocity by observing that the velocity pressure is near zero at the near wall, reaches a maximum at the pipe center, and falls to near zero at the far wall. If the velocity pressure does not follow this pattern, then the flow is not uniform and a different straight section of pipe should be used for the measurement or a traverse should be made.
4. Keeping the Pitot tube tip pointed into the air flow at the centerline of the pipe, determine the velocity pressure by reading the differential pressure gauge. Because readings usually fluctuate, take several measurements or readings and estimate the average.After the centerline velocity pressure reading has been obtained (step 4), the air velocity (m/s [ft/min]) and
air flow rate (m3/min [ft3/min]) that the fan is delivering can be estimated from Table 1. The lefthand column of this table gives velocity pressure, and the second column gives the air velocity that corresponds to the velocity pressure, regardless of pipe diameter. The body of the table gives the air flow rate for a given velocity pressure and various commonly used pipe diameters. The air velocity and flow rate for velocity pressures and pipe sizes also can be calculated from the equations given in the footnotes of Table 1, Equations 1 and 2, and pipe areas given in Table 1. The following example demonstrates determining air velocity and flow rate using Table 1.
Example 3: If the centerline velocity pressure reading for air flowing in a 300-mm (12in.) diameter pipe is 400 Pa (1.6 in. H2O), what is the air velocity and air flow rate in the pipe?
In the far left column of Table 1, 400 Pa velocity pressure is approximately halfway between 383 and 417 Pa. In next column over, the same two rows show 23 and 24 m/s air velocity. So, the estimated air velocity for 400 Pa would be 23.5 m/s. Then, proceeding right to the column corresponding to 300-mm pipe diameter, the average of the air flow rates from the two rows (97.5 and 102 m3/min) is 99.7 m3/min.
For USC units, the method would be similar. In the far left column of Table 1, 1.6 in. H2O veloc-ity pressure is close to 1.59 in. H2O. The same row in the next column over shows 4,600-ft/min air velocity. Then, proceeding right to the column for 12-in. pipe diameter, find 3,613-ft3/min air flow rate.
Figure 5. Measuring centerline velocity pressure with a Pitot tube and differential pressure gauge.

192JOURNAL OF COTTON SCIENCE, Volume 23, Issue 2, 2019
Table 4. Air velocity and air flow rate correction factors for Pitot tube measurements at nonstandard conditions
AirTemperature Factor Elevationz Factor Air
Temperature Factor Elevationz Factor
(°C) (m) (°F) (ft)-15 0.937 0y 1.000 0 0.932 0y 1.000-10 0.946 100 1.006 10 0.942 500 1.009-5 0.955 200 1.012 20 0.952 1000 1.0180 0.963 300 1.018 30 0.962 1500 1.0285 0.972 400 1.024 40 0.971 2000 1.037
10 0.981 500 1.031 50 0.981 2500 1.04615 0.989 600 1.036 60 0.990 3000 1.05621y 1.000 700 1.042 70y 1.000 3500 1.06625 1.006 800 1.048 80 1.009 4000 1.07530 1.015 900 1.055 90 1.019 4500 1.08635 1.023 1000 1.062 100 1.028 5000 1.09540 1.032 1100 1.068 110 1.037 5500 1.10645 1.040 1200 1.074 120 1.04650 1.048 1300 1.081 130 1.05555 1.056 1400 1.088 140 1.06460 1.064 1500 1.094 150 1.07365 1.072 1600 1.100 160 1.08270 1.080 1700 1.108 170 1.09075 1.088 180 1.09880 1.095 190 1.10685 1.102 200 1.11490 1.109 225 1.13795 1.117 250 1.157100 1.125 275 1.177110 1.141 300 1.197120 1.155 325 1.217140 1.184 350 1.236160 1.213 375 1.255180 1.240 400 1.273200 1.267 425 1.292220 1.294 450 1.310240 1.320 475 1.328260 1.345 500 1.345
z Above mean sea level.y Standard condition.
Table 1 gives the velocity and air flow rate based on one centerline reading of velocity pressure for stan-dard air density (1.2 kg/m3 [0.075 lb/ft3]) at sea level and standard conditions (21 °C and 101.3 kPa [70 °F and 29.92-in. Hg]). If velocity pressure readings are taken for air at other than standard temperature and elevation, for example, near Lubbock, Texas (990-m [3,250-ft] elevation) in summer (38 °C [100 °F]), then air tempera-ture and elevation correction factors from Table 4 should be used to correct the air velocity and air flow rates.
To find and apply the correction factors, first look up the actual air temperature in Table 4 and find the corresponding correction factor in the column to the right. Next, look up the actual elevation in Table 4 and find the corresponding correction factor in the column to the right. Then, multiply each factor by the air velocity and air flow rate determined from the air measurement procedure detailed previously. The fol-lowing example shows how to obtain air temperature and elevation correction factors and apply them to air velocity and flow rate measurements.

193WHITELOCK: COTTON GIN PNEUMATIC CONVEYING SYSTEMS
Air velocity 23.5 m / s 1.023 1.055 25.4 m / s= × × =3 3Air flow rate 99.7 m / min 1.023 1.055 107.6 m / min= × × =
orAir velocity 4600 ft / min 1.023 1.056 4969 fpm= × × =
3 3Air flow rate 3613 ft / min 1.023 1.056 3903 ft / min= × × =Static Pressure Measurement. To measure the static pressure, disconnect the total pressure tubing
from the Pitot tube and differential pressure gauge, and leave the static pressure outlet connected (the static pressure outlet on the Pitot tube is perpendicular to the main tube, see Fig. 5). For measuring static pressure on the outlet side (push side) of the fan, the tubing from the Pitot tube static pressure outlet should be connected to high pressure tap on the differential pressure gauge. For static pressure measurements on the inlet side (suction side) of the fan, connect the tubing to the low pressure tap. Insert the Pitot tube into the pipe in the same manner as described in step 3 of the velocity pressure measurement procedure above and read the static pressure.
The static pressure reading also can be taken by removing the tubing from the Pitot tube and holding the end of the flexible hose over the test hole in the pipe to make a good seal. The two static pressure readings should be nearly the same.
For fans with piping on both the inlet and outlet, measure the static pressure on the opposite sides of the fan, and add the absolute value of the two static pressure readings to obtain the overall system static pressure. However, an outlet reading is all that is necessary on a push fan with no piping on the inlet, and only an inlet reading is necessary on a pull fan with no piping on the outlet. Air readings, air flow, and static pressure, can be taken at whatever point in the system where information is needed, such as at troublesome points in a piping system or at separator or machinery inlets and outlets to determine leakage.
FANS
Air flows from high-pressure to low-pressure areas. In a pneumatic conveying system, a fan is used to create the pressure differential or static pressure required to induce air flow. The fan creates pressure to overcome the flow resistance of the piping, elbows, and fittings; and accelerate and lift conveyed material. Two types of fans, centrifugal and axial flow, are used in cotton gins, but the majority are centrifugal fans.
Centrifugal Fans. The centrifugal fan resembles a paddle wheel and consists of an impeller or blast wheel that rotates within a castiron or sheet metal scroll-type housing (Fig. 6). Air enters through the inlet to the impeller parallel to the shaft, is accelerated by the blades, and discharges perpendicular to the impeller shaft. Pressure is generated by the centrifugal force on the rotating air and by the velocity of the air leaving the impeller tip. The fan housings used in ginning applications usually have a single air inlet and a single outlet. Generally, a centrifugal fan delivers lower air volumes at higher pressures up to approximately 7,500 Pa (30 in. H2O). This type of fan is commonly used for unloading systems, push/pull pre-cleaning and dry-ing systems, and for waste handling.
The main types of centrifugal fan impellers or blast wheels used in cotton gins are radial- or straight-blade and backward-inclined. Straight-blade wheels are usually open wheels with 6 to 12 flat blades (increased number of blades increases static pressure capability: 6 blades ≈ 4,500 Pa [18 in. H2O], 10 blades ≈ 7,500 Pa
Example 4: If the system in Example 3 above was handling air at 35 °C (95 °F) and was located at an elevation of 900 m (3,000 ft) above sea level, what are the correction factors for temperature and elevation and corrected air velocity and flow rate?
First, in Table 4, the temperature correction factor to the right of 35 °C is 1.023. For USC units, 95 °F falls between 90 and 100 °F. So, the temperature correction factor is between 1.019 and 1.028, approximately 1.023. Next, the elevation correction factor to the right of 900-m (3,000-ft) elevation is 1.055 (1.056). Then, multiplying the temperature and elevation factors by the measured air velocity and flow rate results in the actual velocity and flow rate:

194JOURNAL OF COTTON SCIENCE, Volume 23, Issue 2, 2019
Figure 7. Radial or straight blade centrifugal fan wheel and typical performance curve.
Figure 6. Centrifugal fan components (Exploded view courtesy of Smith Fans Inc., Lamesa, TX).
[30 in. H2O]) and are rugged, simple, and designed to handle coarse and abrasive materials in the air stream, like gin waste (Fig. 7). They are generally noisier than other types of centrifugal fan impellers and power will rise continually to free delivery, which means they can overload. Straight-blade fans are also less efficient than other centrifugal fan designs, typically converting a maximum of 70% of the input mechanical energy to the energy of the moving air stream. Backward-inclined impellers have from 8 to 12 flat blades that are inclined away from the direction of rotation (Fig. 8). They are more efficient by approximately 80% and quieter than radial blade fan, but maximum static pressure is only approximately 2,500 Pa (10 in. H2O). Their horsepower increases to maximum as air flow increases and then drops off toward free delivery, which means they are non-overloading. Backward-inclined wheels are designed for clean or lightly contaminated air with little fiber, such as burner push fans or battery condensers.

195WHITELOCK: COTTON GIN PNEUMATIC CONVEYING SYSTEMS
There are other types of centrifugal fan wheels that can be used in gins for specific purposes (Fig. 9). The wool wheel [Fig. 9(a)] is a straight-blade wheel with a back plate that prevents stringy or fibrous materials from wrapping around the blades and is sometimes used to handle and fluff cotton lint, especially for roller ginning. Rembert fans [Fig. 9(b)] with perforated flat disks or cones permit the material to pass through the fan housing without damage from the wheel. This type of fan can be used for transferring seed cotton from one location to another without using a separator. Remberttype fans normally are only approximately 35% efficient. Both wool wheel and Rembert-type fans have fan curves similar to that in Fig. 7.
Figure 9. Wool wheel (a) and Rembert wheel (b) (Courtesy of Lummus Corporation, Savannah, GA).
Size designations for centrifugal fans can be confusing because each manufacturer uses their own descriptive terms. Many centrifugal fans are designated simply by a number, No. 30, or a number that can indicate size, 923 RBO with 23-in. diameter inlet. Table 5 shows data for some common modern gin fans. Maximum operating speeds of centrifugal fans vary usually from approximately 1,200 to 3,000 rpm, but for safety, the blast wheel speed should not exceed manufacturer’s recommendations. It is a good practice to contact the manufacturer and request specific information on the fan in question.
Figure 8. Backward inclined centrifugal fan wheel and typical performance curve.

196JOURNAL OF COTTON SCIENCE, Volume 23, Issue 2, 2019
Table 5. Common modernz gin fan data
FanModel
Blast WheelInlet Dia.mm (in.)
OutletDimensions
mm (in.)
Max
Type Dia.mm (in.)
Speedrpm
Static PressurePa (in. H2O)
Lummus Corporation - Savannah, GA
913 RBO Straight Blade 574 (22.6) 330 (13) 283×316 (11.1×12.4) 2822 4977 (20)
915 RBO Straight Blade 663 (26.1) 381 (15) 325×363 (12.8×14.3) 2485 4977 (20)
919 RBO Straight Blade 838 (33) 483 (19) 410×459 (16.1×18.1) 1951 4977 (20)
921 RBO Straight Blade 927 (36.5) 533 (21) 452×508 (17.8×20) 1778 5972 (24)
923 RBO Straight Blade 1016 (40) 584 (23) 499×559 (19.6×22) 1623 5972 (24)
926 RBO Straight Blade 1146 (45.1) 660 (26) 562×630 (22.1×24.8) 1439 5972 (24)
929 RBO Straight Blade 1283 (50.5) 737 (29) 626×703 (24.6×27.7) 1286 5972 (24)
933 RBO Straight Blade 1461 (57.5) 838 (33) 711×800 (28×31.5) 1129 5972 (24)
200 BC 3 Backward Inclined 508 (20) 543 (21.38) 405×538 (16.1×21.4) 3169 3235 (13)
222 BC 3 Backward Inclined 565 (22.25) 603 (23.75) 449×598 (17.8×23.8) 2848 3235 (13)
245 BC 3 Backward Inclined 622 (24.5) 662 (26.06) 494×659 (19.6×26.2) 2587 3235 (13)
300 BC 3 Backward Inclined 762 (30) 803 (31.63) 605×808 (23.9×32) 2059 3484 (14)
365 BC 3 Backward Inclined 927 (36.5) 978 (38.50) 734×983 (29.1×39) 1727 3981 (16)
402 BC 3 Backward Inclined 1022 (40.25) 1078 (42.44) 808×1083 (32.1×42.9) 1566 3981 (16)
445 BC 3 Backward Inclined 1130 (44.5) 1191 (46.88) 894×1197 (35.4×47.4) 1416 3981 (16)
490 BC 3 Backward Inclined 1245 (49) 1311 (51.63) 981×1319 (38.8×52.2) 1286 3981 (16)
24B7 Vane-axial 610 (24) 2795 1742 (7)
36B7 Vane-axial 914 (36) 1966 1742 (7)
42B6 Vane-axial 1067 (42) 1610 1493 (6)
Kimbell Gin Machinery Co., Lubbock, TX
KGM 35-40 Straight Blade 743 (29.25) 432 (17) 267×419 (10.5×16.5) 2351 5474 (22)
KGM 45-50 Straight Blade 908 (35.75) 533 (21) 318×521 (12.5×20.5) 2157 6968 (28)
KGM 55-60 Straight Blade 1016 (40) 610 (24) 406×559 (16×22) 2114 8461 (34)
KGM 60 Straight Blade 1118 (44) 635 (25) 514×660 (20.25×26) 1772 6968 (28)
KGM 70 Straight Blade 1118 (44) 699 (27.5) 572×686 (22.5×27) 1634 6470 (26)
KGM 80 Straight Blade 1283 (50.5) 762 (30) 635×749 (25×29.5) 1499 6968 (28)
Smith Fans Inc. - Lamesa, TX
30 Straight Blade (MU)y 55.9 (22) 33.0 (13) 23.2×35.7 (9⅛×14) 2800 4484 (18)
45-50 Straight Blade (MH)y 95.9 (37.75) 53.3 (21) 30.5×54.3 (12×21⅜) 1800 6227 (25)
50C4 Straight Blade (LC)y 95.9 (37.75) 53.3 (21) 43.2×54.3 (17×21⅜) 1800 4982 (20)
60E Straight Blade (MH)y 111.8 (44) 61.0 (24) 35.7×63.5 (14×25) 1550 6227 (25)
60C4 Straight Blade (MH & LC) 111.8 (44) 61.0 (24) 48.3×63.5 (19×25) 1550 4982 (20)
36BC Backward Curved (BC & LC)y 91.4 (36) 101.6 (40) 71.8×99.1 (28.25×39) 1900 3487 (14)
40BC Backward Curved (BC & LC)y 101.6 (40) 106.7 (42) 80.6×110.2 (31.75×43.38) 1700 3487 (14)
49BC Backward Curved (BC & LC)y 124.5 (49) 127.0 (50) 97.8×124.5 (38.5×49) 1400 3487 (14)z Data for older models available from Stedronsky (1964)y MU = Moisture Unit, MH = Material and Trash Handling, LC = Lint Cleaner Pull, BC = Battery Condenser

197WHITELOCK: COTTON GIN PNEUMATIC CONVEYING SYSTEMS
Figure 10. Vane-axial fan components (Exploded view reprinted with permission from AMCA Publication 201-02, Fans and Systems]).
Another type of axial fan used in gins, but to a lesser extent is a tube-axial fan. These fans consist of an axialflow impeller with four to seven helical blades rotating within a cylinder without the guide vanes for energy recovery present on vane-axial fans. Thus, tube-axial fans operate against lower resistance pressures than vane-axial fans, approximately 500 to 1,000 Pa (2-4 in. H2O). These fans are sometimes referred to in the ginning industry as duct fans.
Axialflow fans are sized by the diameter of the cylinder housing and typically range from 300 mm to 1,500 mm (12-60 in.). Axial-flow fans generally require more horsepower as the flow rate decreases, with maximum horsepower required when flow is blocked completely (Fig. 11).
Axial Fans. Axial-flow fans resemble propellers and consist of an impeller or bladed rotor that rotates inside a sheet metal housing in-line with the connected duct (Fig. 10). The air enters parallel to the shaft at the leading edge of the blade, is propelled by the blades, and the flow is essentially parallel to the shaft and swirls around the shaft. Pressure is created by the change in air velocity as it passes through the blades. The predominant axial fan used in cotton gins is the vane-axial. Vane-axial fans consist of an axial-flow impeller usually including 7 to 12 blades within a cylinder that contains a set of guide vanes located on the discharge side of the impeller. These guide vanes assist in recovering the energy used for tangential acceleration, and therefore vane-axial fans can operate against static pressures normally up to 1,500 Pa (6 in. H2O) and as high as 2,500 Pa (10 in. H2O). Axial-flow fans cannot handle material through the fan impeller. They are primarily used in low-pressure machinery, such as lint-cleaner condensers and battery condensers. An access door should be provided on both sides of the fan to facilitate inspection for lint fly buildup, especially on the fixed vanes. In recent years, many gins have replaced axial fans on their lint cleaner exhausts with centrifugal fans, allowing gins to use cyclones on those exhausts.

198JOURNAL OF COTTON SCIENCE, Volume 23, Issue 2, 2019
Example 5: The power needed to drive a centrifugal fan can vary over a broad range, even when the fan is operated at a constant speed. For example, a gin system requires 325 m3/min (11,500 ft3/min) and has 4,000 Pa (16 in. H2O) of static pressure.
From Fig. 12, moving across the top of the table sections the nearest static pressure is 3,981 Pa (16 in. H2O). The closest or slightly higher air flow rate in the first column is 326 m3/min (11,500 ft3/min). The intersection of the static pressure column and flow rate row shows that the fan uses 34.21 kW (45.88 hp) at a speed of 1,350 rpm.
Similarly, from Fig. 13, the intersection of 325 m3/min (11,500 ft3/min) on the x-axis and 4,000 Pa (16 in. H2O) of static pressure on the y-axis falls between the 1,200-rpm and 1,400-rpm green static-rpm curves at approximately 1,350 rpm. Next, proceed up from 325 m3/min (11,500 ft3/min) on the x-axis to 1,350 rpm between the red power-rpm curves. Then, move right to the corresponding power of approximately 35 kW (46 hp).
To size a motor, round up to a 37- or 45-kW (50- or 60-hp) motor to select a standard size motor and account for drive losses and variability in conditions.
This same fan at the same speed will operate differently if connected to another piping system having a static resistance of only 3,484 Pa (14 in. H2O). From Fig. 12, under the new static pressure column and approximately the same wheel speed (1,359 rpm) the fan would deliver approximately 453-m3/min (16,000-ft3/min) flow rate and require 46.26 kW (62.04 hp).
Fan Performance Tables and Curves. The amount of air that a fan will deliver depends on its design and construction, its speed, and the static pressure of the system. Fan manufacturers test their fans and prepare fan tables and curves that show air flow capabilities and horsepower requirements of the fans at various shaft speeds and static pressures. To select a fan for a given application, the required air flow rate, static pressure for the system, and fan performance rating tables or curves from the manufacturer are needed. It is good practice to have fan tables or curves on file for all fans used in the gin. A typical performance table is shown in Fig. 12 (Fig. 12a for SI Units and Fig. 12b for USC Units) and a typical performance curve for the same fan is shown in Fig. 13 (Fig. 13a for SI Units and Fig. 13b for USC Units). The following example demonstrates the use of these fan tables and curves.
Figure 11. Typical vane-axial performance curve.

199WHITELOCK: COTTON GIN PNEUMATIC CONVEYING SYSTEMS
Figure 12a. 923 RBO straight blade, centrifugal fan (class 22) performance table—SI units. Adapted from Industrial Fans. 2000 Twin City Fan & Blower Bulletin 902; reprinted with permission.

200JOURNAL OF COTTON SCIENCE, Volume 23, Issue 2, 2019
Figure 12b. 923 RBO straight blade, centrifugal fan (class 22) performance table—USC units. Adapted from Industrial Fans. 2000 Twin City Fan & Blower Bulletin 902.

201WHITELOCK: COTTON GIN PNEUMATIC CONVEYING SYSTEMS
Figure 13a. 923 RBO straight blade, centrifugal fan performance curve—SI units. Produced with Twin City Fan Selector v10. 2017 Twin City Fan & Blower, Minneapolis, MN; reprinted with permission.
Figure 13b. 923 RBO straight blade, centrifugal fan performance curve—USC units. Produced with Twin City Fan Selector v10. 2017 Twin City Fan & Blower, Minneapolis, MN; reprinted with permission.

202JOURNAL OF COTTON SCIENCE, Volume 23, Issue 2, 2019
TS = fan tip speed, m/s (ft/s)π = 3.1416D = fan blade wheel diameter, mm/1000 or m (in./12 or ft)ω = fan shaft rotational speed, rpm.
Example 6: The fan in Fig. 12 has a wheel diameter of 1,016 mm (40 in.) and a maximum fan speed of 1,623 rpm. What is the fan tip speed?
Using Equation 4:TS 3.1416 1016 mm /1000 1623 / 60 86 m / s= × × =
orTS 3.1416 40 in. /12 1623 / 60 283 ft / s= × × =
Maximum Fan Speed. Before increasing the speed of a fan, it is necessary to determine maximum operating speed of the fan and ensure that it is not exceeded. Fans have structural elements that are affected by fan speed. These elements can fail catastrophically if the maximum safe speed of the fan is exceeded. The maximum speed varies based on the fan blade type, configuration, and precision of manufacturing. The maximum fan speed is usually included along with other fan characteristics in the fan table or curve, or contact the manufacturer to determine the maximum operating speed. If maximum fan speed information is not available, one rule of thumb is that the maximum safe speed for many fans used in gins is 91-m/s (300-ft/s) tip speed. Fan tip speed is calculated from the following equation:
TS π D ω / 60= × × (Eq. 4)where:
In addition, small increases in speed have large penalties in power. Before increasing speed, first calculate the new power required using the fan laws discussed later in this section to ensure that the fan’s motor and electric service have enough capacity.
Finally, when fan speed is increased, expect the fan to be louder, to have increased noise from the air system fittings, and have more duct and fitting leakage.
Series and Parallel Fans. There are situations where multiple fans are used in a system to greatly increase the air flow rate or overcome large static pressures. If two fans are used on the same system, the combined performance depends on their relative placement (Fig. 14). When two fans are placed parallel to each other, the air volume is doubled, but the static pressure remains the same; however, if they are placed in series, the air volume remains the same and the static pressure is doubled. Large-diameter fan wheels operating at low speeds are generally more efficient and produce less noise than small-diameter fan wheels at high speeds.
Figure 14. Static Pressure and air flow relationship for single, series, and parallel fans.

203WHITELOCK: COTTON GIN PNEUMATIC CONVEYING SYSTEMS
Fan Performance Temperature and Elevation Correction. Manufacturers base fan performance rat-ings on handling air at standard conditions; air at sea level having temperature of 21 °C (70 °F), barometric pressure of 101.3 kPa (29.92 in. Hg), and density of 1.2 kg/m3 (0.075 lb/ft3). When the conditions vary significantly from standard conditions, the static pressure and power requirements for the fan will change. For example, air at higher elevation and/or higher temperatures is less dense. Thus, the static pressure and power requirements for the fan will be lower than for the same fan at standard conditions. Correction factors for adjusting required fan static pressure and power for variations in temperature and elevation are given in Table 6, and the following examples demonstrate the proper use of the factors.
Table 6. Correction factors for adjusting estimated pressure and horsepower requirements of fans operating at nonstandard conditions
Air Temperature(°C) Factor Elevationz
(m) Factor Air Temperature(°F) Factor Elevationz
(ft) Factor
-15 0.88 0y 1.00 0 0.87 0y 1.00-10 0.90 100 1.01 10 0.89 500 1.02-5 0.91 200 1.03 20 0.91 1000 1.040 0.93 300 1.04 30 0.93 1500 1.065 0.94 400 1.05 40 0.94 2000 1.0810 0.96 500 1.07 50 0.96 2500 1.1015 0.98 600 1.08 60 0.98 3000 1.1221y 1.00 700 1.09 70y 1.00 3500 1.1425 1.01 800 1.10 80 1.02 4000 1.1630 1.03 900 1.12 90 1.04 4500 1.1835 1.05 1000 1.13 100 1.06 5000 1.2040 1.07 1100 1.14 110 1.08 5500 1.2245 1.08 1200 1.16 120 1.0950 1.09 1300 1.17 130 1.1155 1.11 1400 1.18 140 1.1360 1.13 1500 1.20 150 1.1565 1.15 1600 1.21 160 1.1770 1.17 1700 1.22 170 1.1975 1.18 180 1.2180 1.20 190 1.2385 1.22 200 1.2590 1.24 225 1.2895 1.25 250 1.34100 1.27 275 1.39110 1.30 300 1.43120 1.34 325 1.48140 1.40 350 1.53160 1.47 375 1.58180 1.54 400 1.62200 1.61 425 1.67220 1.68 450 1.72240 1.75 475 1.77260 1.81 500 1.81
z Above mean sea level.y Standard condition.
Example 7: The fan in Example 5 was selected to deliver 326 m3/min (11,500 ft3/min) of air at 3981 Pa (16 in. H2O) static pressure requiring a wheel speed of 1,350 rpm and 34.21 kW (45.88 hp) power at standard conditions. Suppose, that the actual operating conditions are at an elevation of 750 m (2,500 ft) and the air has been heated to 60 °C (140 °F). What are the performance characteristics of the fan under the actual operating conditions (assuming the fan speed remains the same)?

204JOURNAL OF COTTON SCIENCE, Volume 23, Issue 2, 2019
Because the fan speed was not changed, the fan will continue to deliver 326 m3/min (11,500 ft3/min) of air. This air, however, will be less dense than standard air because of the higher temperature and elevation. This change in density will affect static pressure and the horsepower requirement. From Table 6, the correction factor for 60 °C (140 °F) air temperature is 1.13 and the factor for 750-m (2,500-ft) elevation is approximately 1.10. The new operating static pressure:
( )Static pressure 3981 Pa / 1.13 1.10 3203 Pa= × =or
( )2 2Static pressure 16 in.H O / 1.13 1.10 12.9 in. H O= × =The new power requirement:
( )Power 34.21 kW / 1.13 1.10 27.5 kW= × =or
( )Power 45.88 hp / 1.13 1.10 36.9 hp= × =A 30-kW (40-hp) or slightly higher [37-kW (50-hp)] motor would be appropriate.
Example 8: What should the power requirements be if the fan will run without the burner on?Without the burner to heat the air, it is assumed that the air would be at standard temperature:
21 °C (70 °F). The fan would still be operated at 750-m (2,500-ft) elevation. Thus, only the el-evation correction factor from Example 7 would be used to correct the fan power. The fan power requirement for elevation only:
Power 34.21 kW /1.10 31.1 kW= =or
Power 45.88 hp /1.10 41.7 hp= =In this case, a 37-kW (50-hp) motor would be necessary.
Fan Laws. The performance of a fan changes when its speed is changed. The faster a fan is oper-ated, the more air it will deliver on a specific system, and the greater the static pressure it will develop. Output power is equal to the product of the air flow rate and the total pressure developed by the fan; therefore, power requirements increase significantly as fan speed is increased. If it becomes necessary to speed up fans, resulting changes in performance can be predicted from the following fan laws:1. Fan capacity or air flow rate varies directly with the fan wheel speed.
2 2
1 1
Q NQ N
= or 22 1
1
NQ QN
= × or 22 1
1
QN NQ
= × (Eq. 5)
2. Fan static pressure varies as the square of the fan wheel speed.2
2 2
1 1
SP NSP N
×
or
222
2 1 11
NSP SP SP speed ratioN
= × = ×
(Eq. 6)
3. Fan power required varies as the cube of the fan wheel speed.3
2 2
1 1
P NP N
×
or
332
2 1 11
NP P P speed ratioN
= × = ×
(Eq. 7)
where:subscript 1 denotes current conditions and subscript 2 denotes new conditions under consideration;Q = air flow rate, m3/min (ft3/min);N = fan wheel speed (revolutions per minute, rpm);speed ratio = the ratio of new fan speed to current or old speed, 2
1
NN
;SP = static pressure, Pa (in. H2O); andP = fan power, kW (hp).

205WHITELOCK: COTTON GIN PNEUMATIC CONVEYING SYSTEMS
Motor current (in amps) can be substituted for power in Equation 7 with only a slight error if the power factor and voltage remain constant. Current is more convenient for ginners to use, because motor current is easier to measure than actual power. The results will be accurate enough for field calculations. The following example illustrates the use of the fan laws to predict fan performance.
Example 9. A fan currently delivers 142 m3/min (5,000 ft3/min) of air at 1,600-rpm impeller speed using 12 kW (16 hp) to a gin system with 2,488-Pa (10-in. H2O) static pressure. The ginner desires to increase the air flow rate by 10% (new air flow rate = 156 m3/min [5,500 ft3/min]). Determine the new wheel speed, static pressure, and power required for the increase.
From Equation 5, the new speed:3
2 23
1 1
N Q 156 m / minspeed ratio 1.10N Q 142 m / min
= = = =
or3
2 23
1 1
N Q 5500 ft / minspeed ratio 1.10N Q 5000 ft / min
= = = =
2N 1600 rpm 1.10 1760 rpm= × =From Equation 6, the new system static pressure:
22SP 2488 Pa 1.10 2488 Pa 1.10 1.10 3010 Pa= × = × × =
or2
2 2 2 2SP 10 in.H O 1.10 10 in.H O 1.10 1.10 12.1 in.H O= × = × × =From Equation 7, the new power requirement:
32P 12 kW 1.10 12 kW 1.10 1.10 1.10 16.0 kW= × = × × × =
or3
2P 16 hp 1.10 16 hp 1.10 1.10 1.10 21.3 hp= × = × × × =
Figure 15. Air flow, static pressure, power, and fan speed relationships based on fan laws.
Many ginners do not fully understand the effects of fan speed, which is described in the fan law equations (Equa-tions 5-7). Figure 15 illustrates the relationship between fan speed, air flow, static pressure, and power. If fan speed is increased by 25%, the air flow rate also increases by 25%; but the static pressure increases by 56% and the power consumed increases 95%. Even small increases in fan speed can require the installation of a more powerful motor.

206JOURNAL OF COTTON SCIENCE, Volume 23, Issue 2, 2019
Care should be taken to choose a fan that will provide sufficient air flow for the system when the fan is operated within the speed ranges recommended by the manufacturer. Centrifugal fan performance varies widely due to differences in design and construction and how it is utilized in an air handling system. The efficiency of centrifugal fans can vary from 35 to 75% as a result of these differences. Fans for a given system should be selected so that they will operate at their most efficient point. If the sys-tem is changed, for example, a different dryer installed or pipes rerouted, the same fan could possibly be used. The fan speed could be varied to meet air flow requirements according to the fan laws, if the maximum safe operating speed specified by the manufacturer is not exceeded. However, the fan might not be operating at its most efficient point on the new system, and the electricity savings might justify purchase of a new fan. To obtain maximum efficiency from a fan, it is essential that the fan application be designed from accurate rating tables.
PRESSURE LOSSES
The static pressure needed for a required air flow depends on air velocity; size, shape, and frictional characteristics of the piping system; and the nature of the material conveyed. This static pressure require-ment, called static pressure drop or loss, is caused by friction between the pipe walls and the air. Frictional losses in fittings, such as elbows, transitions, and valves, can be significantly larger than a comparable length of pipe. Static pressure loss also occurs for any piece of equipment through which the air flows, including inclined cleaners, tower driers, separators, and cyclones (Table 7). Conveying material also increases the static pressure requirement due to friction between the material and air, energy losses due to collisions between particles and the pipe walls, and overcoming gravity to lift and suspend material in the air stream. Additional static pressure also is required to accelerate the conveyed material when it is fed into the air stream and to lift the material vertically.Table 7. Typical static pressure loss for gin components
Gin ComponentsPressure Loss
Pa in. H2O
Burner 373-622 1.5-2.5
Blowbox 249-747 1-3
Inclined Cleaner 995-493 4-6
Separator 747-1244 3-5
Tower Drier 124 per shelf 0.5 per shelf
Cyclone1D3D2D2D1D2D
1120995622
4.54
2.5
Battery Condenser 995-1244 4-5
Rock Trap 500 2
Lint Cleaner Condenser 373 1.5
Airjet Lint Cleaner 498 2
Straight Pipe Losses. The static pressure loss or friction loss due to air flow only in pipes can be deter-mined from a friction chart, like that shown in Fig. 16 (Fig. 16a for SI Units and Fig. 16b for USC Units), which is based on standard air flowing through round galvanized pipes. Using Fig. 16, the friction loss can be estimated if two of the following variables are known: air flow rate, air velocity, and pipe diameter. The following example demonstrates use of Fig. 16.

207WHITELOCK: COTTON GIN PNEUMATIC CONVEYING SYSTEMS
Example 10. What is the friction loss of a 15-m (50-ft) long section of 500-mm (20-in.) diameter pipe with 23-m/s (4,500-ft/min) air velocity?
From Fig. 16, at the intersection of the 23-m/s (4,500-ft/min) air velocity diagonal and the 500-mm (20-in.) duct diameter diagonal, proceed horizontally to the left friction loss axis to read approximately 9.3 Pa/m (1.2 in. H2O/100 ft). Thus, the friction loss for a 15-m (50-ft) section:
9.3 PaFriction loss 15 m 139.5 Pam
= × =
or
Figure 16a. Friction loss per meter length of round, galvanized pipe. Based on sea level-standard air conditions @ 21 °C and 101.3 kPa (1 L/s = 0.06 m3/min). Reprinted with permission from ASHRAE Handbook ©ASHRAE, www.ashrae.org. 2017. ASHRAE Handbook—Fundamentals (SI).
22
1.2 in.H OFriction loss 50 ft 0.6 in.H O100 ft
= × =
Figure 16 shows that smaller pipes and higher air velocities have greater frictional resistance or static pressure loss than do larger pipes or lower air velocities and therefore require more power to move the air. When conveying air only, such as in the pipe from a burner to a blowbox, larger pipe diameters can be used to reduce static pressure requirements. Because no material is conveyed, lower air velocities are acceptable.

208JOURNAL OF COTTON SCIENCE, Volume 23, Issue 2, 2019
Elbow Losses. Elbows in a piping system greatly increase the system’s static pressure. More abrupt elbows with shorter radii have greater losses than do longer radius elbows. The losses due to round elbows are often expressed in terms of the equivalent length of straight pipe that would cause the same amount of static pressure loss. Equivalent length is usually expressed in terms of Le/D, where Le is the equivalent length and D is the diameter of the pipe. Table 8 shows Le/D for 90° elbows (round duct). If the centerline radius or throat radius of an elbow is known, then the equivalent straight pipe length of the elbow can be determined by multiplying Le/D from Table 8 by the pipe diameter.Table 8. Pressure loss of 90° elbowsz in terms of equivalent length (Le) in pipe diameters (D)
Miter Short Radius Long Radius
Centerline Radius Ratio (R℄/D) 0.75 1 1.5 2 2.5
Throat Radius Ratio (RT/D) 0.25 0.5 1 1.5 2
Equivalent Length (Le/D) 65 23 17 12 10 8.5
z For bends less than 90°, the equivalent straight-pipe loss is proportional to the bend angle/90.
Example 11. Find the Le/D from Table 8 and calculate the equivalent length of a 400-mm diameter (16in. diameter) 90° elbow with centerline radius ratio equal to 1½.
From Table 8, the Le/D for a pipe with 1½ centerline radius ratio is 12. Equivalent length is thenLe 12*400 mm 4800 mm or 4.8 m= =orLe 12*16 in. 192 in. or 16 ft= =
Figure 16b. Friction loss in round, galvanized, piper per 100 ft of length. Based on sea level-standard air conditions @ 70 °F and 29.92 in. Hg. Reprinted with permission from ASHRAE Handbook ©ASHRAE, www.ashrae.org. 2009. ASHRAE Handbook—Fundamentals (I-P).

209WHITELOCK: COTTON GIN PNEUMATIC CONVEYING SYSTEMS
As seen in Table 8, elbows add considerable pressure loss to a system and the loss is greater for shorter radius elbows. Also, for bends of less than 90° the equivalent straightpipe resistance is in proportion to the bend. For example, a 60° bend will have two-thirds of the equivalent resistance of a 90° bend. Therefore, equipment should be positioned and systems designed to minimize elbows.
PNEUMATIC SYSTEM DESIGN
In cotton gins, air and material are generally directed through 18- to 24-gauge sheet metal pipes that vary in diameter from approximately 200 to 900 mm (8-36 in.) Piping systems must be planned carefully to achieve desired results and properly maintained to avoid excessive horsepower consumption. Useful rules to follow are:1. Make piping as simple and direct as possible, eliminating unnecessary elbows and valves.2. Keep pipe joints as airtight and rigid as possible to minimize air leakage, reduce horsepower re-
quirements, and save money for the ginner. However, some leakage is unavoidable. Therefore, air flow calculations should make provisions for normal leakage. Up to 35% leakage can occur through vacuum droppers. Tower dryers, rock and boll traps, and cylinder cleaners also frequently leak. Table 9 shows typical leakage values for gin machinery. Provisions must be made when sizing the fan to account for such leakage.
3. Properly maintain flights on vacuum droppers and flashings on separators to minimize leakage.4. Reduce fan speeds to reduce excessive air flow and lower power consumption. Cutting holes in pipes
to relieve pressures or to increase air flow rates is unsatisfactory.5. Excessively high conveying velocities should be avoided to protect seed quality and reduce static
pressure losses and energy consumption. Table 2 shows recommended ranges of conveying air veloci-ties for various cotton gin materials and systems. Air velocities used for conveying seed cotton and seed should be maintained within recommended ranges to avoid cracking or shattering seed when the material impacts sharpturn elbows, separator reels, and other objects.
6. It is good practice to use long radius elbows in lines conveying seed cotton and seed. This consideration is especially important for small-pipe, high-pressure seed handling systems.
7. Avoid elbows immediately before the fan inlet—allow at least a short section of straight pipe. Similarly, install a long section of straight pipe on a centrifugal fan outlet, or orient the elbow to complement the rotation of the fan. Also, a long straight section of pipe before a cylinder cleaner inlet will produce a more even distribution of seed cotton across the cleaner.
8. Consider using a control system that reduces air flow rates when little or no cotton is flowing and increases air flow rates at maximum ginning rates to promote efficient operation and possibly reduce electricity use.
The elbow has the same resistance to air flow as 4.8 m (16 ft) of straight pipe. A system contain-ing five such elbows will have an increased resistance equal to that of 60 diameters or 24 m (80 ft) of straight pipe.
Table 9. Typical air leakage for gin machinery
MachineryLeakage
m3/min ft3/min
Blowbox 14.1 500
Incline Cleaners 42.5-99.1 1500-3500
Separators 42.5-70.8 1500-2500
Vacuum Droppers 14.2-28.3 500-1000
Airjet Lint Cleaners 28.3 1000
Condensers (Lint Cleaner & Battery Condenser) 56.6-85.0 2000-3000

210JOURNAL OF COTTON SCIENCE, Volume 23, Issue 2, 2019
The number, size, and operating rate of gin stands will determine the required flow rate of seed cotton in the gin. This flow rate and the layout of gin machinery will determine the dimensions and arrangement of the piping. The air pressures needed to overcome the resistance of equipment and pipes and the quantities of cotton needed to supply gins will determine the required fan capacity.
The following example illustrates air system design, bringing together many of the principles previously discussed.
Example 12: Determine pipe size and fan characteristics for an unloading system, shown in Fig. 17, to process 30 bales per hour of machine-picked cotton. Assume 590 kg (1,300 lb) of seed cotton per bale.
The mass of seed cotton conveyed per minute:
30 bales 590 kg hr 295 kg / minhr bale 60 min
× × =
or30 bales 1300 lb hr 650 lb / min
hr bale 60 min× × =
From Table 3 for seed cotton unloading and conveying, use the air requirement of 1.25 m3 per kg (20 ft3 per lb) of seed cotton. The required air flow rate to convey the seed cotton from the module feeder to the separator:
33295 kg 1.25 m 369 m / min
min kg× =
or3
3650 lb 20 ft 13000 ft / minmin lb
× =
Determine the pipe diameter needed to convey the seed cotton at recommended velocity from the module feeder to the separator. The recommended air velocity for seed cotton conveying in Table 2 is 20.3 to 25.4 m/s (4,000-5,000 ft/min), so use approximately 23 m/s (4,500 ft/min). Using Table 1, move right on the row with 23-m/s (4,400-ft/min) air velocity to find an air flow rate nearest the required rate of 369 m3/min (13000 ft3/min), which is 358 m3/min (12695 ft3/min) in the column for 575-mm (23-in.) diameter pipe with 0.260-m2 (2.885-ft2) cross-sectional area. Calculate the
Figure 17. Unloading system diagram for Example 12.

211WHITELOCK: COTTON GIN PNEUMATIC CONVEYING SYSTEMS
actual air velocity in the selected pipe using Equation 1 to ensure that the conveying velocity will be within the recommended range from Table 2 (20.3-25.4 m/s [4,000-5,000 ft/min]):
3
2369 m / min 23.6 m / s
0.260 m 60 s / min=
×or
3
213000 ft / min 4506 ft / s
2.885 ft=
The next larger size pipe [600 mm (24 in.)] would also suffice and the actual conveying velocity [21.7 m/s (4,137 ft/min)] would be near the bottom of the recommended velocity range.
To ensure there is sufficient air flow at the module feeder, leakage at the separator must be included in the air flow rate for the section from the separator to the cyclone. On the suction side of the fan, leak-age will be into the system. Table 9 shows the typical leakage for a separator is 57 m3/min (2,000 ft3/min). The air flow rate for the pipe from the separator to the cyclone:
3 3 3369 m / min 57 m / min 426 m / min+ =or
3 3 313000 ft / min 2000 ft / min 15000 ft / min+ =Using this larger air flow rate, determine the pipe diameter needed to convey the dust and fine trash from the separator to the cyclone. The recommended air velocity for trash conveying is the same as seed cotton, 20.3 to 25.4 m/s (4,000-5,000 ft/min). Using Table 1, move right on the row with 23-m/s (4,400-ft/min) air velocity to find an air flow rate nearest the required rate of 426 m3/min (15,000 ft3/min), which is 423 m3/min (14,999 ft3/min) in the column for 625-mm (25-in.) diameter pipe with 0.307-m2 (3.409-ft2) cross-sectional area. Calculate the actual air velocity in the selected pipe using Equation 1 to ensure that the conveying velocity will be within the recommended range from Table 2 (20.3-25.4 m/s [4,000-5,000 ft/min]):
3
2426 m / min 23.1 m / s
0.307 m 60 /s min=
×or
3
215000 ft / min 4400 ft / s
3.409 ft=
Determine the straight pipe friction pressure loss for the two sections of pipe. For the 575-mm (23-in.) diameter section of pipe from the burner to separator, in Fig. 16 move up from the x-axis at flow rate of 369 m3/min or 6,150 L/s (13,000 ft3/min) to the intersection with 575-mm (23-in.) pipe diameter. Check that this point agrees with the intersection of 575-mm (23-in.) pipe diameter and 23.6-m/s (4,506-ft/min) actual air velocity. Moving left to the y-axis, the corresponding friction loss per length of pipe is approximately 8.5 Pa/m (0.95 in. H2O/100 ft). The straight pipe friction pressure loss for the 30.5-m (100-ft) section of pipe from the burner to separator:
30.5 m 8.5 Pa / m 259 Pa× =or
2 2100 ft 0.95 in. H O /100 ft 0.95 in. H O× =For the 625-mm (25-in.) diameter section of pipe from the separator to the cyclone, in Fig. 16
move up from the x-axis at flow rate of 426 m3/min or 7,100 L/s (15,000 ft3/min) to the intersection with 625-mm (25-in.) pipe diameter. Check that this point agrees with the intersection of 625-mm (25-in.) pipe diameter and 23.1-m/s (4,400-ft/min) actual air velocity. Moving left to the y-axis, the corresponding friction loss per length of pipe is approximately 7.5 Pa/m (0.80 in. H2O/100 ft). The straight pipe friction pressure loss for the 22.9-m (75-ft) section of pipe from the burner to separator:
22.9 m 7.5 Pa / m 172 Pa× =or

212JOURNAL OF COTTON SCIENCE, Volume 23, Issue 2, 2019
2 275 ft 0.80 in. H O /100 ft 0.60 in. H O× =
Determine pressure loss for the 90°, 2D radius elbows. From Table 8, a 2D centerline radius ratio elbow has equivalent length 10D. The equivalent length of the seven 575-mm (23-in.) diameter elbows between the burner and separator:
7 elbows 10 575 mm 40,250 mm 40.25 m× × = =or7 elbows 10 23 in. 1610 in. 134 ft× × = =
The elbow pressure loss between the burner and separator using the equivalent length and friction loss per length of pipe found above:
40.25 m 8.5 Pa / m 342 Pa× =or
2 2134 ft 0.95 in. H O /100 ft 1.27 in.H O× =Similarly, the equivalent length of the three 625-mm (25-in.) diameter elbows between the separa-
tor and cyclone:
3 elbows 10 625 mm 18,750 mm 18.75 m× × = =or3 elbows 10 25 in. 750 in. 62.5 ft× × = =
The elbow pressure loss between the separator and cyclone using the equivalent length and friction loss per length of pipe found above:
18.75 m 7.5 Pa / m 1 41 Pa× =or
2 262.5 ft 0.80 in. H O /100 ft 0.50 in.H O× =Determine the total static pressure drop for the system. Summing the pressure loss for the straight
pipe, elbows, and friction loss for the other components from Table 7: Burner to separator:
Burner 373 Pa (1.5 in. H2O)369 m3/min (13000 ft3/min) Straight pipe: 30.5 m (100 ft) 259 Pa (0.95 in. H2O)575-mm (23-in.) diameter Elbows: 7 342 Pa (1.27 in. H2O)
Blowbox at module feeder 500 Pa (2 in. H2O)Rock trap 500 Pa (2 in. H2O)
Separator to cyclone:Separator 1000 Pa (4 in. H2O)
426 m3/min (15000 ft3/min) Straight pipe: 22.9 m (75 ft) 172 Pa (0.60 in. H2O)625-mm (25-in.) diameter Elbows: 3 141 Pa (0.50 in. H2O)
Cyclone 1120 Pa (4.5 in. H2O)Total system static pressure 4407 Pa (17.3 in. H2O)
Determine the fan wheel speed and motor power. Assume selected fan in Fig. 12. The calcu-lated static pressure, 4,407 Pa (17.3 in. H2O), is between 3,981 Pa (16 in. H2O) and 4,479 Pa (18 in. H2O) in Fig. 12. Also, the fan air flow rate of 426 m3/min (15,000 ft3/min) is between 411- and 439-m3/min (14,500-15,500 ft3/min) air flow rates listed in the far left column. Interpolation is necessary to estimate the fan speed and power requirements for the system. For this example, round up to the slightly higher value for air flow rate and interpolate between the two static pres-sures. In the 439-m3/min (15,500-ft3/min) air flow rate row, the fan speed and power listed under the 3,981-Pa (16-in. H2O) static pressure column are 1,418-rpm fan speed and 49.33 kW (66.15 hp) and the fan speed and power listed under the 4,479-Pa (18-in. H2O) static pressure column are 1,484-rpm fan speed and 54.35 kW (72.88 hp). To interpolate between the two static pressure values, use the following equation:

213WHITELOCK: COTTON GIN PNEUMATIC CONVEYING SYSTEMS
( ) ( )( )
2 11 1
2 1
y yy y x x
x x−
= + −−
(Eq. 8)
where:(x1, y1) and (x2, y2) are the known valuesy is the unknown value at x
For this problem the x, x1, and x2 and y, y1, and y2 values are as follows:Static pressure Fan speed Powerx1 = 3,981 Pa (16 in. H2O) y1 = 1,418 rpm y1 = and 49.33 kW (66.15 hp)x = 4,407 Pa (17.3 in. H2O) y = ? y = ?x2 = 4,479 Pa (18 in. H2O) y2 = 1,484 rpm y2 = 54.35 kW (72.88 hp)
Solving for fan speed:
( ) ( )( )1484 rpm 1418 rpm
y 1418 rpm 4407 Pa 3981 Pa 1474 rpm4479 Pa 3981 Pa
−= + − =
−or
( ) ( )( )2 2
2 2
1484 rpm 1418 rpmy 1418 rpm 17.3 in.H O 16 in.H O 1461 rpm
18 in.H O 16 in.H O−
= + − =−
Solving for power:
( ) ( )( )
54.35 kW 49.33 kWy 49.33 kW 4407 Pa 3981 Pa 53.62 kW
4479 Pa 3981 Pa−
= + − =−
or
( ) ( )( )2 2
2 2
72.88 hp 66.15 hpy 66.15 hp 17.3 in.H O 16 in.H O 70.52 hp
18 in.H O 16 in.H O−
= + − =−
The estimated fan speed and power would be approximately 1,470 rpm and 55 kW (75 hp). For a more accurate estimate, two-way interpolation between the values in Fig. 12 is required. Also, the air flow rate in the pipe between the burner and module feeder would be less than 369 m3/min (13000 ft3/min) due to leakage at the module feeder blowbox. In that section no material is conveyed. Therefore, the air velocity can be reduced in that section by increasing pipe diameter, which would reduce pressure drop and fan power requirements. Preferably, work with the fan manufacturer who has the technical knowledge and experience to size and select the correct fan.
Pneumatic conveying systems are used extensively in the cotton gin, consume more than 50% of the electrical energy used at the gin, and play a critical role in proper drying of seed cotton. Pneumatic systems must be designed correctly and maintained properly to ensure efficient gin operation, reduce energy con-sumption, and limit downtime.
DISCLAIMER
Mention of trade names or commercial products in this publication is solely for the purpose of provid-ing specific information and does not imply recommendation or endorsement by the U.S. Department of Agriculture. USDA is an equal opportunity providers and employers.
REFERENCES
American Conference of Governmental Industrial Hygienists [ACGIH]. 1998. Industrial Ventilation: A Manual of Recommended Practice. 23rd ed. American Conference of Governmental Industrial Hygienists, Cincinnati, OH.
Baker, R.V., E.P. Columbus, R.C. Eckley, and B.J. Stanley. 1994. Pneumatic and Mechanical Handling Systems. p.143-171 In W.S Anthony and W.D. Mayfield (ed.) Cotton Ginners Handbook. Agricultural Handbook No. 503. U.S. Department of Agriculture, Washington, DC.

214JOURNAL OF COTTON SCIENCE, Volume 23, Issue 2, 2019
McCaskill, O.L., R.V. Baker, and V.L. Stedronsky. 1977. Fans and piping. p. 5767 In Cotton Ginners Handbook. Agricultural Handbook No. 503. U.S. Department of Agriculture, Washington, DC.
Stedronsky, V.L. 1964. Materials handling. p. 60-68 In Handbook for Cotton Ginners. Agricultural Handbook No. 260. U.S. De-partment of Agriculture, Washington, DC.
APPENDIX A. DUCT TRAVERSE
If the ideal location for a center-line Pitot air measurement in a long-straight conveying duct at least 1.5 pipe diameters upstream and 8.5 pipe diameters downstream from any obstruction or disturbance such as a fan, valve, or elbow (Fig. 4) cannot be identified or if uniform air velocity is not observed as described earlier in the Air Measurements section, then the air velocity must be averaged across the cross-section of the duct to obtain an accurate velocity measurement. This is accomplished using a duct traverse of air read-ings, which is a set of air measurements using a designated pattern of measurement points taken across the duct cross-section.
For round ducts, traverse measurements should be taken in two plains that pass through the centerline of the duct and are at 90⁰ to each other (Fig. A1). Depending on the reference, there are many different criteria for determining the number of traverse points. The ACGIH (1998) recommends 10 points in each plane for round ducts larger than 150 mm (6 in.) and 20 points in each plane for large round ducts greater than 1200 mm (48 in.). Table A1 shows the distance from the round duct wall to the measurement location for a 10-point traverse.
Figure A1. Locations for a 10-point duct traverse in a round duct with diameter D.
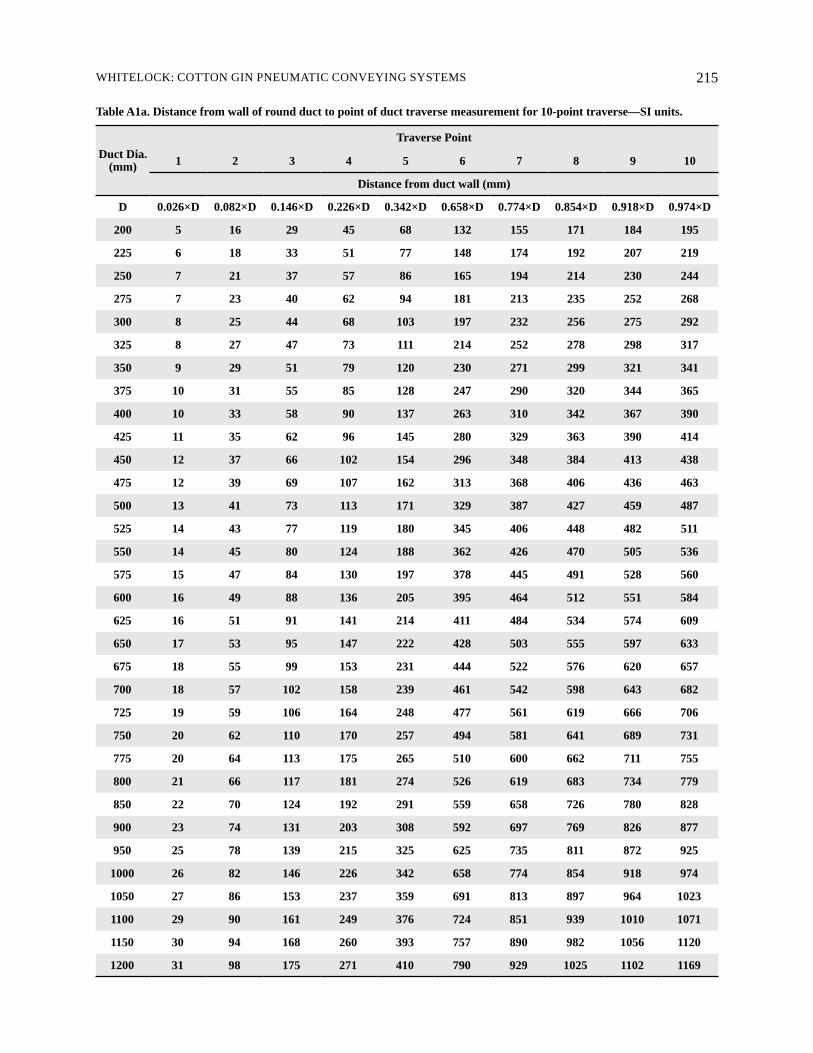
215WHITELOCK: COTTON GIN PNEUMATIC CONVEYING SYSTEMS
Table A1a. Distance from wall of round duct to point of duct traverse measurement for 10-point traverse—SI units.
Duct Dia.(mm)
Traverse Point
1 2 3 4 5 6 7 8 9 10
Distance from duct wall (mm)
D 0.026×D 0.082×D 0.146×D 0.226×D 0.342×D 0.658×D 0.774×D 0.854×D 0.918×D 0.974×D
200 5 16 29 45 68 132 155 171 184 195
225 6 18 33 51 77 148 174 192 207 219
250 7 21 37 57 86 165 194 214 230 244
275 7 23 40 62 94 181 213 235 252 268
300 8 25 44 68 103 197 232 256 275 292
325 8 27 47 73 111 214 252 278 298 317
350 9 29 51 79 120 230 271 299 321 341
375 10 31 55 85 128 247 290 320 344 365
400 10 33 58 90 137 263 310 342 367 390
425 11 35 62 96 145 280 329 363 390 414
450 12 37 66 102 154 296 348 384 413 438
475 12 39 69 107 162 313 368 406 436 463
500 13 41 73 113 171 329 387 427 459 487
525 14 43 77 119 180 345 406 448 482 511
550 14 45 80 124 188 362 426 470 505 536
575 15 47 84 130 197 378 445 491 528 560
600 16 49 88 136 205 395 464 512 551 584
625 16 51 91 141 214 411 484 534 574 609
650 17 53 95 147 222 428 503 555 597 633
675 18 55 99 153 231 444 522 576 620 657
700 18 57 102 158 239 461 542 598 643 682
725 19 59 106 164 248 477 561 619 666 706
750 20 62 110 170 257 494 581 641 689 731
775 20 64 113 175 265 510 600 662 711 755
800 21 66 117 181 274 526 619 683 734 779
850 22 70 124 192 291 559 658 726 780 828
900 23 74 131 203 308 592 697 769 826 877
950 25 78 139 215 325 625 735 811 872 925
1000 26 82 146 226 342 658 774 854 918 974
1050 27 86 153 237 359 691 813 897 964 1023
1100 29 90 161 249 376 724 851 939 1010 1071
1150 30 94 168 260 393 757 890 982 1056 1120
1200 31 98 175 271 410 790 929 1025 1102 1169

216JOURNAL OF COTTON SCIENCE, Volume 23, Issue 2, 2019
Table A1b. Distance from wall of round duct to point of duct traverse measurement for 10-point traverse—USC units
Duct Dia. (in.)
Traverse Point
1 2 3 4 5 6 7 8 9 10
Distance from duct wall (in.)
D 0.026×D 0.082×D 0.146×D 0.226×D 0.342×D 0.658×D 0.774×D 0.854×D 0.918×D 0.974×D
8 1/4 5/8 1 1/8 1 3/4 2 3/4 5 1/4 6 1/4 6 7/8 7 3/8 7 3/4
9 1/4 3/4 1 3/8 2 3 1/8 5 7/8 7 7 5/8 8 1/4 8 3/4
10 1/4 7/8 1 1/2 2 1/4 3 3/8 6 5/8 7 3/4 8 1/2 9 1/8 9 3/4
11 1/4 7/8 1 5/8 2 1/2 3 3/4 7 1/4 8 1/2 9 3/8 10 1/8 10 3/4
12 1/4 1 1 3/4 2 3/4 4 1/8 7 7/8 9 1/4 10 1/4 11 11 3/4
13 3/8 1 1/8 1 7/8 3 4 1/2 8 1/2 10 11 1/8 11 7/8 12 5/8
14 3/8 1 1/8 2 3 1/8 4 3/4 9 1/4 10 7/8 12 12 7/8 13 5/8
15 3/8 1 1/4 2 1/4 3 3/8 5 1/8 9 7/8 11 5/8 12 3/4 13 3/4 14 5/8
16 3/8 1 1/4 2 3/8 3 5/8 5 1/2 10 1/2 12 3/8 13 5/8 14 3/4 15 5/8
17 1/2 1 3/8 2 1/2 3 7/8 5 7/8 11 1/8 13 1/8 14 1/2 15 5/8 16 1/2
18 1/2 1 1/2 2 5/8 4 1/8 6 1/8 11 7/8 13 7/8 15 3/8 16 1/2 17 1/2
19 1/2 1 1/2 2 3/4 4 1/4 6 1/2 12 1/2 14 3/4 16 1/4 17 1/2 18 1/2
20 1/2 1 5/8 2 7/8 4 1/2 6 7/8 13 1/8 15 1/2 17 1/8 18 3/8 19 1/2
21 1/2 1 3/4 3 1/8 4 3/4 7 1/8 13 7/8 16 1/4 17 7/8 19 1/4 20 1/2
22 5/8 1 3/4 3 1/4 5 7 1/2 14 1/2 17 18 3/4 20 1/4 21 3/8
23 5/8 1 7/8 3 3/8 5 1/4 7 7/8 15 1/8 17 3/4 19 5/8 21 1/8 22 3/8
24 5/8 2 3 1/2 5 3/8 8 1/4 15 3/4 18 5/8 20 1/2 22 23 3/8
25 5/8 2 3 5/8 5 5/8 8 1/2 16 1/2 19 3/8 21 3/8 23 24 3/8
26 5/8 2 1/8 3 3/4 5 7/8 8 7/8 17 1/8 20 1/8 22 1/4 23 7/8 25 3/8
27 3/4 2 1/4 4 6 1/8 9 1/4 17 3/4 20 7/8 23 24 3/4 26 1/4
28 3/4 2 1/4 4 1/8 6 3/8 9 5/8 18 3/8 21 5/8 23 7/8 25 3/4 27 1/4
29 3/4 2 3/8 4 1/4 6 1/2 9 7/8 19 1/8 22 1/2 24 3/4 26 5/8 28 1/4
30 3/4 2 1/2 4 3/8 6 3/4 10 1/4 19 3/4 23 1/4 25 5/8 27 1/2 29 1/4
32 7/8 2 5/8 4 5/8 7 1/4 11 21 24 3/4 27 3/8 29 3/8 31 1/8
34 7/8 2 3/4 5 7 5/8 11 5/8 22 3/8 26 3/8 29 31 1/4 33 1/8
36 7/8 3 5 1/4 8 1/8 12 1/4 23 3/4 27 7/8 30 3/4 33 35 1/8
38 1 3 1/8 5 1/2 8 5/8 13 25 29 3/8 32 1/2 34 7/8 37
40 1 3 1/4 5 7/8 9 13 5/8 26 3/8 31 34 1/8 36 3/4 39
42 1 1/8 3 1/2 6 1/8 9 1/2 14 3/8 27 5/8 32 1/2 35 7/8 38 1/2 40 7/8
44 1 1/8 3 5/8 6 3/8 10 15 29 34 37 5/8 40 3/8 42 7/8
46 1 1/4 3 3/4 6 3/4 10 3/8 15 3/4 30 1/4 35 5/8 39 1/4 42 1/4 44 3/4
48 1 1/4 3 7/8 7 10 7/8 16 3/8 31 5/8 37 1/8 41 44 1/8 46 3/4

217WHITELOCK: COTTON GIN PNEUMATIC CONVEYING SYSTEMS
Figure A2. Example locations for a 16-point duct traverse in a rectangular duct. Each rectangle is equal area.
The same equipment as described in the Air Measurements section should be used for the duct traverse. Velocity pressure measurements should be taken at each traverse location in both plains. Then air velocity should be calculated for each measurement using the follow equations for standard air [density = 1.2 kg/m3 (0.075 lb/ft3)] conditions at 21 °C and 101.3 kPa (70 °F and 29.92-in. Hg):
( ) ( )air velocity m / s 1.29 velocity pressure Pa= (Eq. A1)
or
( ) ( )2air velocity ft / min 4005 velocity pressure in. H O= (Eq. A2)Note: Do not use Table 1 to determine air velocity as it is for centerline measurements only.
Velocity measurements should then be averaged to obtain the average air velocity for the duct. Air flow rate can then be calculated using Equations 1 and 2, shown earlier. Also, air velocity and air flow can be corrected for conditions (temperature and elevation) that differ from standard conditions in the same manner as shown the Air Measurements section.
Duct traverses for rectangular ducts are done similarly to those for round ducts. However, the duct should be divided into at least 16 small rectangles of equal areas and measure the velocity pressure at the center of each (Fig. A2). Enough traverse points should be used so that measurement locations are no more than 150 mm (6 in.) apart.


