Costs for Green Infrastructure and Stormwater Controls · Costs for Green Infrastructure and...
36
Costs for Green Infrastructure and Stormwater Controls Bob Newport U.S. EPA Region 5 (Chicago Office) June 4, 2015
-
Upload
phamkhuong -
Category
Documents
-
view
218 -
download
2
Transcript of Costs for Green Infrastructure and Stormwater Controls · Costs for Green Infrastructure and...

Costs for
Green Infrastructure and
Stormwater Controls
Bob Newport
U.S. EPA Region 5 (Chicago Office)
June 4, 2015
Topics to be Covered
� EPA data collection and cost analysis focused on post-construction stormwater BMPs- Methods- Some results
� Factors influencing BMP selection and costs
� Case studies� Co-benefits of green infrastructure

Analysis of Costs and Performance of Different Stormwater Practices
Analysis Components
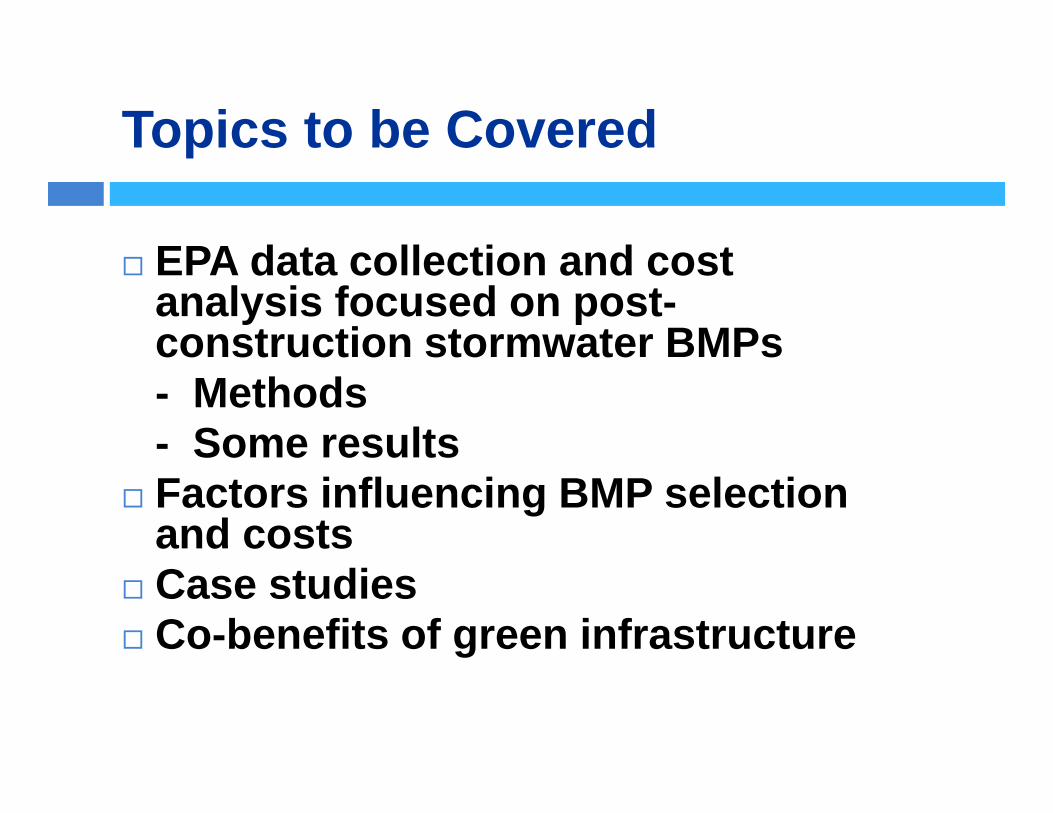
Data Inputs and Sources
� Existing standards (state, MS4) for stormwater management (baseline)
� Project characteristics (% IC, runoff coefficients, source area composition) from WinSLAMM
� BMP cost data� Hourly precipitation data from NCDC (~350 stations)� Evapotranspiration data from NASA NLDAS� Land value data from Lincoln Land Institute and other
sources� Developed land pollutant concentrations from
WinSLAMM� BMP pollutant event mean concentration (EMC) data
from International Stormwater BMP database
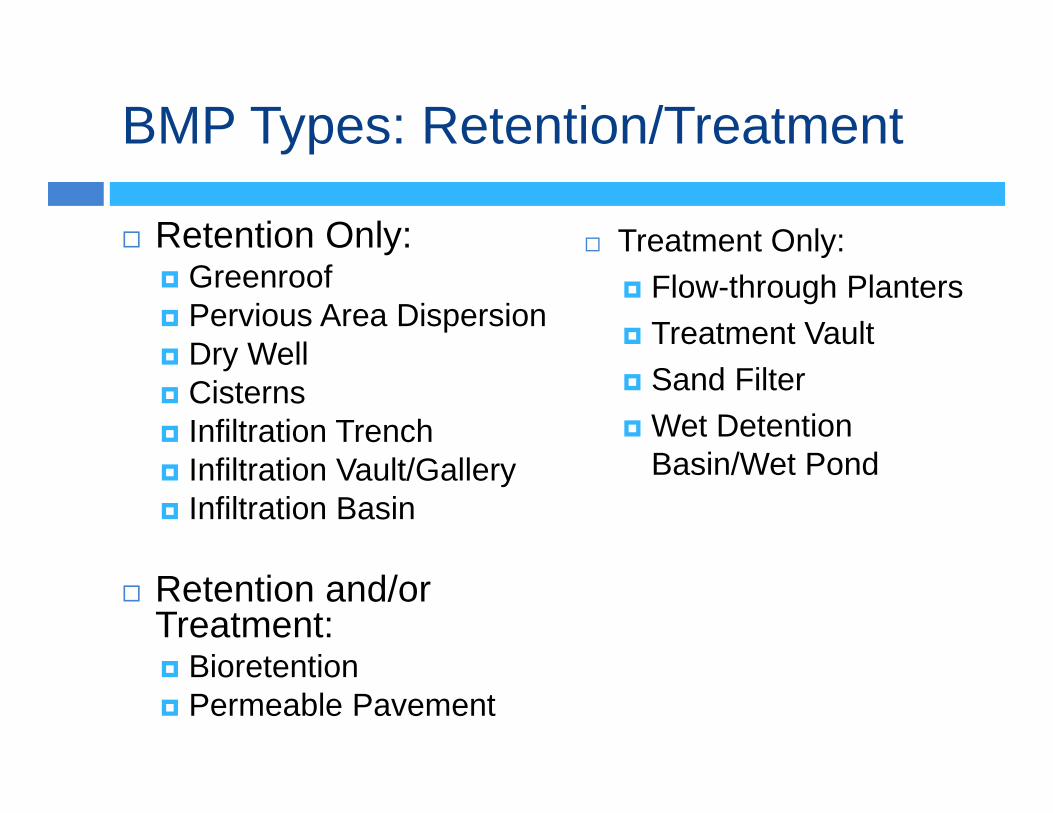
BMP Types: Retention/Treatment
� Retention Only:� Greenroof� Pervious Area Dispersion� Dry Well� Cisterns� Infiltration Trench� Infiltration Vault/Gallery� Infiltration Basin
� Retention and/or Treatment:� Bioretention� Permeable Pavement
� Treatment Only:
� Flow-through Planters
� Treatment Vault
� Sand Filter
� Wet Detention Basin/Wet Pond

BMP Cost Curves
� Cost per unit volume for each BMP type� Represent costs that would be typical for the majority of
development projects� Differentiate between new development and
redevelopment projects� Line item unit cost estimating framework (RS Means)
based on generic BMP designs� Cost types:
� Capital costs� Routine operation and maintenance costs� Major corrective maintenance� Replacement costs� Soft costs (20% of capital costs)� Land costs

BMP Total Present Value Cost Curves
Green Roof
Detention Basin

Cost Tool
� For a given combination of conditions (SLDM, soil type, climate station, etc.) tool iterates to determine the least-cost BMPs able to meet given standard – BMP feasibility defined by series of logic rules
� 10-year simulation using hourly precipitation data tracks BMP storage and water balance (infiltration, ET, discharge, bypass) to determine BMP performance
� Outputs for a given scenario are written to database
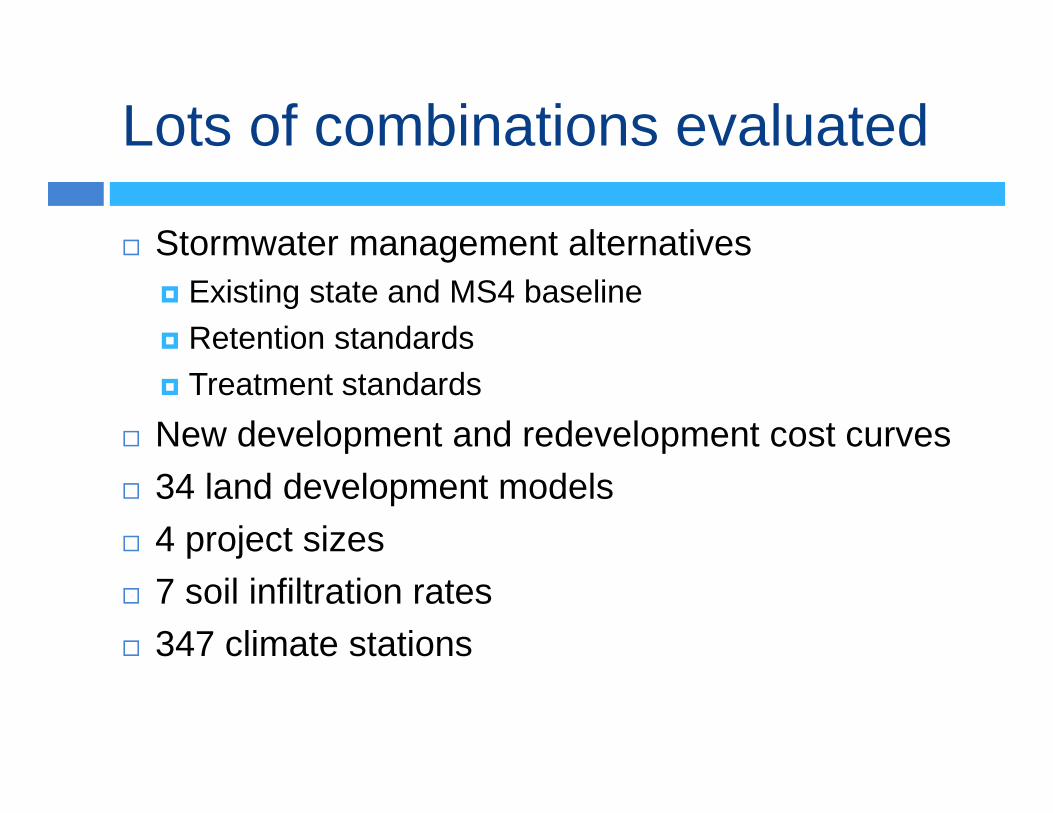
Lots of combinations evaluated
� Stormwater management alternatives� Existing state and MS4 baseline
� Retention standards
� Treatment standards
� New development and redevelopment cost curves
� 34 land development models
� 4 project sizes
� 7 soil infiltration rates
� 347 climate stations

Engineering Analysis Results
� Cost by project type� Cost by standard/soil type� BMP selection by standard� Incremental costs - baseline to performance
standard� Incremental performance (pollutants and
hydrology)

14
(0.7
5)
12
(0.6
2)
8 (0
.59)
13
(0.5
7)
9 (0
.52)
6 (0
.5)
10
(0.4
7)
7 (0
.43)
4 (0
.38)
11
(0.3
7)
5 (0
.32)
2 (0
.23)
3 (0
.2)
1 (0
.12)
15
(0.8
)
16
(0.7
6)
18
(0.7
5)
17
(0.7
2)
19
(0.6
8)
23
(0.5
2)
20
(0.4
5)
22
(0.2
9)
21
(0.2
)
27
(0.6
9)
28
(0.5
5)
29
(0.5
2)
30
(0.3
7)
25
(0.7
2)
24
(0.7
)
26
(0.5
1)
34
(0.2
9)
33
(0.6
2)
32
(0.4
5)
31
(0.1
6)
To
tal P
rsen
tV
alu
e, T
PV
($/
acre
)
Example Output
Commercial Industrial Freeway Open
Space
Residential Institutional
Blue line in the box = the median Total Present Value ($/acre)
From Engineering Analysis Results to National Costs
� The engineering analysis produced results for the set of model projects using numerous combinations of possible site, regulatory, and market conditions (approximately 20 million combinations)
� To derive national cost estimates, we needed to predict how frequently each of the various combinations occurred
� EPA developed the Project Prediction Model to forecast future development projects, which could be combined with the engineering results to estimate implementing different scenarios and what the resulting costs would be

Project Prediction Model: Forecasts future development projects
� Combines forecasts of future construction spending, population growth, and migration patterns with historical data on project characteristics (i.e., size, value, impervious cover, new or redevelopment status)
� Generates a set of future projects potentially needing post-construction BMPs for the years 2016 – 2040, and at HUC12 watershed scale.
� Projects are classified as single-family residential, multi-family residential, commercial/institutional, or industrial
� Additional project characteristics are:� Nearest of climate station (300 possible)� Soil type� Development density type (urban, suburban, exurban, rural)� Regulatory status

Summaries of Predicted Construction Spending
Commercial/Institutional Spending
Single-Family Residential Spending
RuralRedevelopment
ExurbanRedevelopment
SuburbanRedevelopment
UrbanRedevelopment
Rural NewDevelopment
Exurban NewDevelopment
Suburban NewDevelopment
Urban NewDevelopment
Multi-Family Residential Spending

Summary Predicted Projects for years 2020 - 2040
# % # % # %
New Development Inside Reg MS4s 536,030 36% 9,443,322 35% 2,747,609 29%
Redevelopment Inside Reg MS4s 497,003 33% 8,992,294 33% 3,825,437 40%
New Development Outside Reg MS4s 282,595 19% 4,864,890 18% 1,454,198 15%
Redevelopment Outside Reg MS4s 176,729 12% 3,600,671 13% 1,453,597 15%
Total Development 1,492,357 26,901,177 9,480,842
Projects Impervious AcresDevelopment Acres

Project Cost Model
� For each project:� selects two modeled projects from engineering
analysis with the closest site conditions, weights the engineering results based on % impervious surface;
� estimates implementation costs using different assumptions regarding potential opportunity costs;
� estimate the future occurrence of local codes and ordinances that can affect compliance decisions;
� estimates potential site design changes to reduce impervious surface and lower compliance costs.
Combines project forecasts with engineering results to predict national costs

Potential Changes to Site Design
� Environmental Site Design� Impervious surface now costs more relative to greens space� Reducing parking lot areas and narrowing street widths
lessens the runoff volume that needs to be controlled� EPA is actively encouraging states and metro areas to
conduct reviews of codes and ordinances that may limit the use of environmental site design and green infrastructure
� Reduced need for Flood Storage� Most projects need to meet local flood storage requirements� Typically through detention ponds (wet/dry) or detention
vaults� Retention practices that would be implemented to meet a
performance standard offset the volume that needs to be captured or detained for flood storage
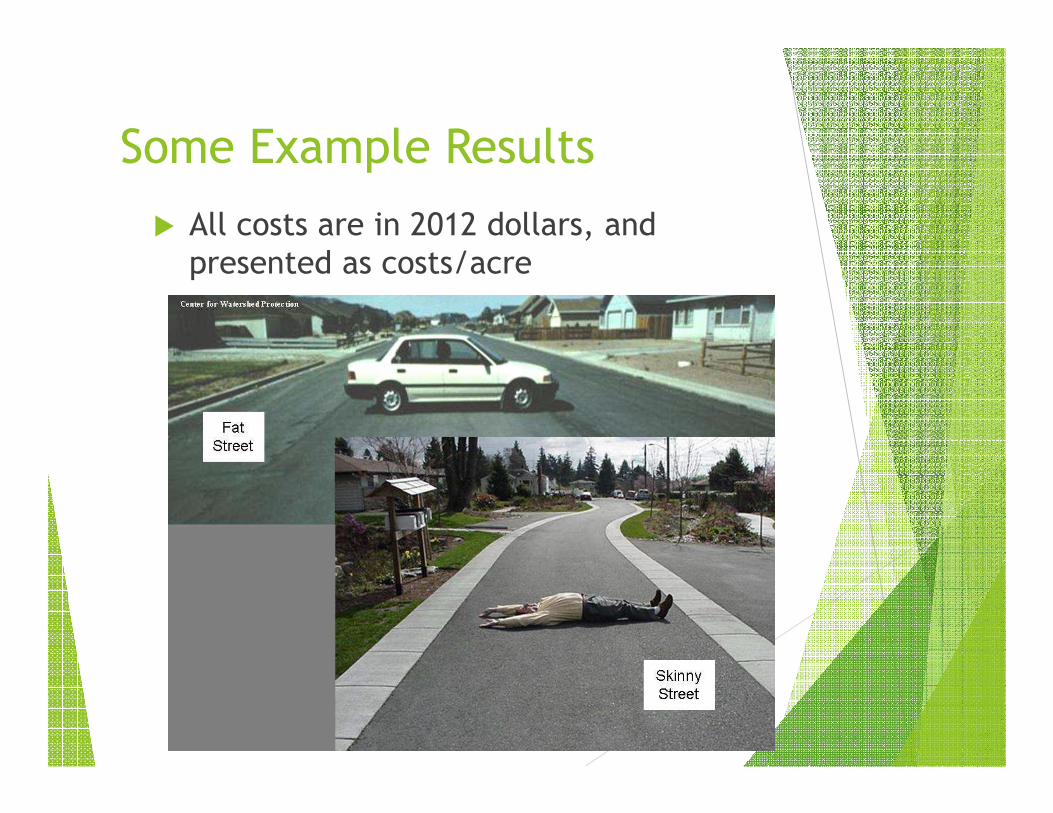
Some Example Results
� All costs are in 2012 dollars, and presented as costs/acre

Retention Estimates
� The numbers you will see assumed a retention standard of 90th percentile rainfall event for new development, and 85th percentile for redevelopment
� Retention standard is applied statewide (inside and outside of MS4s)
� EPA also assessed impacts of reducing impervious surfaces which includes:
� Modest reductions to street widths and parking stall sizes
� EPA did not change parking ratios, address shared parking or other changes that can more significantly reduce impervious surfaces

Retaining stormwater can save money on new commercial developments
Current
Regs
New Retention Standard
Current CostWith imp. surface reduction
Without imp. surface reduction
New Development in MS4
$12,700/ac - $1,500/ac + $300/ac
Redevelopment in MS4
$16,400/ac + $3,500/ac + $5,000/ac
• Most cost savings is from impervious surface reduction. Additional savings from O&M and reduced size of detention pond needed for flood control.

Retaining stormwater can savemoney for single family home developments
Current Regs New Retention Standard
Current Cost With imp. surface reduction
Without imp. surface reduction
New Development in MS4
$9,000/ac - $3,100/ac - $2,400/ac
Redevelopment in MS4
$14,300/ac - $3,000/ac - $1,000/ac
• Most cost savings is from impervious surface reduction and reduced O&M costs.

Changes to Site Design Can Save Money
�Environmental Site Design
� Reducing impervious surfaces (parking lot areas and narrowing street widths) lessens the runoff volume that needs to be controlled
� EPA is actively encouraging states and metro areas to conduct reviews of codes and ordinances that may limit the use of environmental site design and green infrastructure
�Reduced need for Flood Storage
� Retaining stormwater can reduce or eliminate the need for other water infrastructure that is currently required
� Most projects need to meet local flood storage requirements -typically through detention ponds (wet/dry) or detention vaults
� Retention practices offset the volume that needs to be captured for flood storage

Green Infrastructure Can Save Money
� Retaining stormwater with green infrastructure practices can reduce or eliminate the need for other water infrastructure that is currently required (e.g., pipes, detention ponds)

Natural Topography includes two predominant drainage patterns
Some valuable Green infrastructure on the site
Bielinski Homes

Natural Drainage Patterns MaintainedBielinski Homes
Wetlands Preserved

Bielinski Homes
With Environmental Site Design the Development is LESS expensive!

How Green Infrastructure Can Save Money –Boulder Hills, NH (UNH Stormwater Center)
� 24-unit active adult condominium community built in 2009
� Makes use of porous asphalt for road, driveways, and sidewalks
� The use of green infrastructure practices resulted in project costs 6% lower than conventional approaches
27

Boulder Hills, NH (UNH Stormwater Center)

How Green Infrastructure Can Save Money – Greenland Meadows, NH(UNH Stormwater Center)
�Three, 1-story retail units on 56 acres (25 acres of impervious surface) built in 2008
�4.5 acres of porous asphalt and gravel wetland used for stormwater management
�The use of green infrastructure practices were estimated to save 9% in overall project development costs

Greenland Meadows, NH (UNH Stormwater Center)
30

Integrating GI with Other City ProjectsLancaster, PA
Permeable Asphalt Basketball Court

Lancaster, PA – Green Alleys

Lancaster, PA – Parking Lots

Other Sources of Information of Green Infrastructure and Costs
� ASLA case studies (www.asla.org/stormwater)
� 479 case studies identified
� Half of the case studies were retrofits of existing properties, 31% were new developments and 19% were redevelopment projects
� 44% of case studies found a decrease in costs by using green infrastructure; 31% found green infrastructure did not influence costs while 25% found increased costs

Green infrastructure can provide significant co-benefitsGreen infrastructure…
� Can increases energy efficiency and reduce
energy costs (green roofs, street trees increase energy efficiency; retention increases aquifer storage and reduces cost of transporting water)
� Can reduce the economic impacts associated with
flood events
� Can protect public health and reduce illness-
related costs (reduced CSO events decrease incidents of waterborne illness and shellfish closures; increased trees and plants improve air quality)
Source: Banking on Green, 2012

[email protected]/greeninfrastructure