Costs and benefits of crop residue retention in a Chinese...
25
Costs and benefits of crop residue retention in a Chinese subsistence farming system Adam Komarek University of Western Sydney Selected paper presented at the 57th AARES Annual Conference at The Sydney Convention and Exhibition Centre in Darling Harbour, Sydney, New South Wales, 5th-8th February, 2013 http://www.aares.org.au/AARES/Events/2013_Conference_Homepage/AARES/Meetings_and_Conferences/An nual_Conferences/2013_AC_Website/Home_Page.aspx?hkey=46c806bd-ca83-4e4f-a89d-7c355ffa6ae0 This paper has been independently reviewed and is published by The Australian Agricultural and Resource Economics Society on the AgEcon Search website at http://ageconsearch.umn.edu/ University of Minnesota, 1994 Buford Ave St. Paul MN 55108-6040, USA Published 2013
Transcript of Costs and benefits of crop residue retention in a Chinese...

Costs and benefits of crop residue retention in a Chinese subsistence farming system
Adam Komarek
University of Western Sydney
Selected paper presented at the
57th AARES Annual Conference at The Sydney
Convention and Exhibition Centre in Darling Harbour,
Sydney, New South Wales, 5th-8th February, 2013
http://www.aares.org.au/AARES/Events/2013_Conference_Homepage/AARES/Meetings_and_Conferences/An
nual_Conferences/2013_AC_Website/Home_Page.aspx?hkey=46c806bd-ca83-4e4f-a89d-7c355ffa6ae0
This paper has been independently reviewed and is published by
The Australian Agricultural and Resource Economics Society
on the AgEcon Search website at http://ageconsearch.umn.edu/
University of Minnesota, 1994 Buford Ave
St. Paul MN 55108-6040, USA
Published 2013

ii
© Copyright 2013 by Adam Komarek.
All rights reserved. Readers may make verbatim
copies of this document for non-commercial
purposes by any means, provided that this
copyright notice appears on all such copies.

3
Costs and benefits of crop residue retention in a Chinese subsistence farming system
1. Introduction
The use of conservation agriculture (CA) as a paradigm for broader livelihood development
in developing countries initially started in Africa, and has recently spread into parts of Asia.
The supply of CA advice and adoption incentives doesn't appear to be matched by farm
household demand. One potential reason for this mismatch is that the enthusiasm of CA
adoption is often based on agronomic plot-level studies, and rural households generally
operate in a broader environment with farm-level constraints, objectives and non-
agronomic factors all entering household decision-making processes.
Cropping systems that use reduced tillage and crop residue retention often increase grain
yields and improve environmental outcomes (Knowler and Bradshaw, 2007; Giller et al.,
2009; Giller et al., 2011). Numerous field experiments have analysed the production effects
of either full residue removal or retention (Fischer et al., 2002; Malhi and Lemke, 2007;
Huang et al., 2008; Bakht et al., 2009; Aulakh et al., 2012) or using different amounts of crop
residue as mulch (Maskina et al., 1993; Govaerts et al., 2005; Mupangwa et al., 2012).
Trade-offs exist in the role of residues in a) boosting grain yields b) providing a resource for
livestock feed, home heating and cooking and c) providing ground cover to reduce erosion
potential. These trade-offs are more critical in areas of lower net incomes, high livestock
dependence, cold climates, or highly erodible soils, for example large areas of western
China. Evidence from other regions suggests that not all residues need to be retained to gain
the benefits of residue retention. For example, zero tillage treatments with 30% residue
retention produced the same grain yields as treatments with full residue retention in
4
Mexico (Govaerts et al., 2005). However, even if no grain yield penalties exist, grain and
crop residues have different economic values.
Questions remain regarding whether mulching is the most sensible, efficient or profitable
use of crop residues (Giller et al., 2009), and the role of residues in influencing economic
returns appears an open question with implications for agricultural development. From a
broader perspective, Erenstein (2011) and Valbuena et al. (2012) used comprehensive
survey data to highlight that many different typologies of rural households rely heavily on
residues to feed livestock, with demand being especially strong when biomass production is
limited. More generally, the attractiveness of using residues as a mulch for rural households
will be related to the aggregate costs and benefits of residue retention (Erenstein, 2002). In
this article we examine economic, production and environmental trade-offs that exist in
relation to different crop residue retention practices in western China. To achieve this we
simulate long-run field-level yields and economic returns associated with different levels of
crop residue retention in the Dingxi Prefecture, Gansu Province, northwest China.
2. Methodology
2.1. Study site
Rural households in the Dingxi Prefecture are mainly subsistence oriented, reliant on off-
farm income and have income levels well below those observed in local urban centres
(Nolan et al., 2008). Predominate crops grown among these households include spring
wheat (Triticum aestivum L.), field pea (Pisum arvense L.) and potatoes (Solanum tuberosum
L.), with households also raising small ruminants (Nolan et al., 2008). The climate is semi-
arid, with median annual rainfall between 1970 and 2010 being 384 mm, ranging from 246
5
mm in 1982 to 565 mm in 2003. Approximately two-thirds of annual rainfall is received
between May and August. Temperatures range from a maximum average in July of 26 ˚C to
a minimum average of -13˚C in January. On average there are 157 days per year with a
minimum below 0 ˚C.
A survey conducted by Nolan et al. (2008) in 2003 provides data on the basic structural
characteristics of 46 rural households in the Dingxi Prefecture. Over the 46 farms
interviewed the median population density was five people per hectare, this was calculated
as the median number of people in a household divided by the median farm size in hectares
(total land including uncultivated). The median farm livestock density was 0.8 tropical
livestock units (TLU) per hectare. This was calculated as the median farm’s TLU divided by
the median farm size, with one TLU being equivalent to a 250 kg live weight animal. Based
on the general classification described in Valbuena et al. (2012), this relatively low human
population and livestock density places the research site as a low-density location.
Li et al. (2011) observe that current farmer practice in the study region is to remove all
residues from the field after harvest. Households in western China value crop residues as a
livestock feed source as grazing bans restrict pasture grazing and alternative feed sources
are limited. In addition, households often own draught livestock and to capture an increased
demand for meat consumption a recent government policy shift has been to foster
additional livestock production in western China. Crop residues are also a valuable source of
heating (minimum temperatures often fall below -15°C during winter) and are used as a
source of cooking fuel (electricity, coal and methane generating units are expensive and
6
timber is scarce). The above factors suggest that households may wish to retain some crop
residues as mulch and to remove some for other uses.
2.2. Simulating production
The rotation examined here is observed local practice of growing spring wheat followed by
field pea, with crop sowing generally occurring in March and harvest occurring in July. This is
followed by a fallow period over winter until the following March when the next crop is
planted (i.e. one year spring wheat is grown and the next year field pea is grown).
Experimental trials conducted in 2002-2010 for this rotation provided production data
associated with four different treatments related to tillage and crop residue retention. The
four treatments were: tillage with full crop residue removal (current farmer practice), no-till
with full crop residue removal, tillage with full crop residue retention and no-tillage with full
crop residue retention. Details of the experimental design, including soil, water and nitrogen
data and management practices are available in Huang et al. (2008).
As variable residue retention rates were not examined in the experiment, the practice of
variable crop residue retention was simulated using APSIM over a 40 year period from 1970
to 2010. Different simulations were set up where the amount of crop residue removed after
harvest changed incrementally from 0% to 100% (using increments of 10%). APSIM
simulates crop, forage and soil-related processes and the influence of climate and
management activities on these processes using local climate and soil data (Keating et al.,
2003). The APSIM simulations used observed daily climate data, observed soil, nitrogen and
water characteristics and observed agronomic management practices (Huang et al., 2008).
Key model outputs from the simulations included grain yields, biomass, water balance, soil
7
nitrogen, runoff and ground cover. To validate the APSIM model, observed and predicted
yields for no-till with residue retention were compared, as were the treatment effects
between no-till with and without residue retention.
2.3. Economic assessment of simulated production
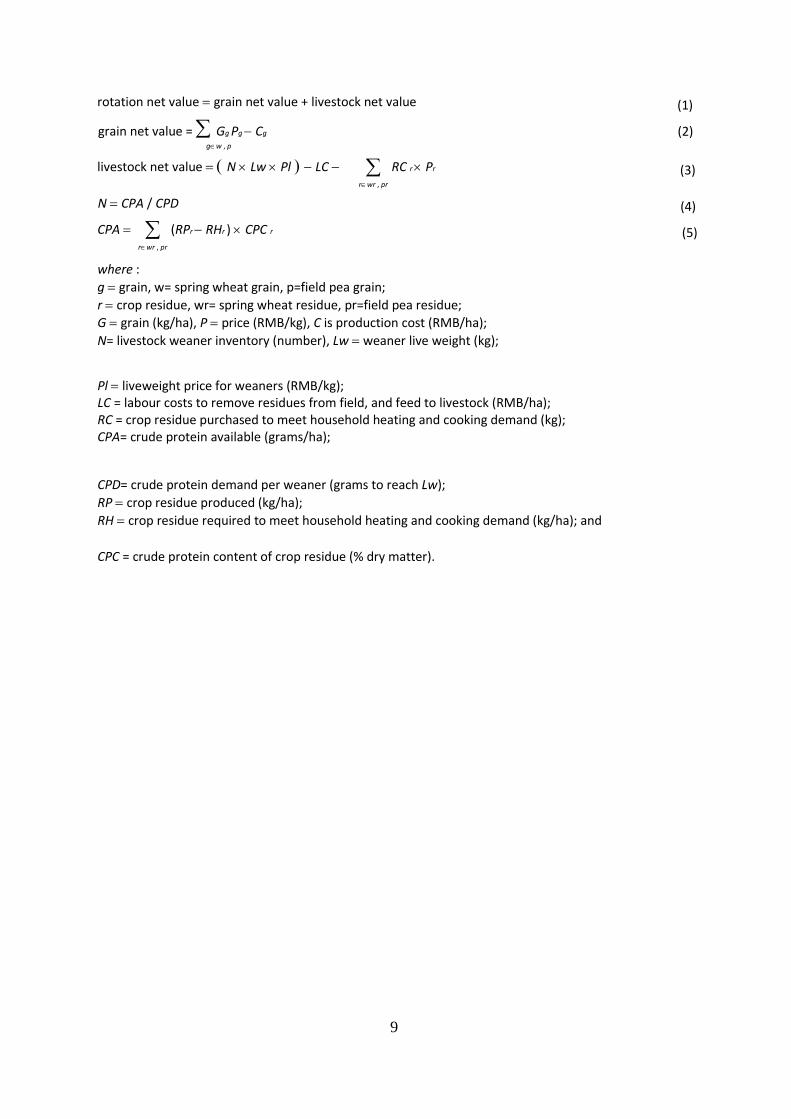
In order to determine the economic impacts of crop residue retention practices the net
annual value of the spring wheat-field pea rotation is calculated using equations 1-5 on a
per hectare basis, with fixed parameters provided in Table 1. Grain is valued as the total
value of all grain produced minus production costs per hectare (Eq. 2). The net value of
livestock has three components (Eq. 3). The first is the economic return associated with
removing residues from the field and using these residues to feed goats (the most common
local small ruminant). Standard livestock feed requirements and growth data are used to
determine the number of goats that the residue could feed (NRC, 1981; Sahlu et al., 2004).
To achieve a daily live weight gain of 50 grams and reach 16 kg at sales a goat requires an
average of 45 grams of crude protein (and 400g of dry matter) per day for 320 days. In the
region, field pea and spring wheat dry matter is approximately 16% and 6% crude protein
(Zhang et al., 2010). Based on these calculations one weaner goat requires 14,400 grams of
crude protein to grow from birth to 16 kg, in addition a breeder goat requires 15,420 grams
of crude protein for maintenance each year. At 80% residue removal 2314 kg/ha of wheat
residue and 1202 kg/ha of field pea residue is available. This amount of residue is equivalent
to 331,284 grams of crude protein and is sufficient feed for approximately 12 weaner goats
and their mothers (assuming a 120% lambing rate). Full details of the livestock calculations
are available in the online materials.
8
The second component of livestock returns is the labour cost associated with removing
variable amounts of crop residue. Based on fieldwork observations, to carry residues from
the field to the house and feed to livestock requires 20 man-days per hectare (based on
3500 kg of residues), and this requirement will vary as the amount of residue retained
changes. The third component is the cost to purchase crop residues associated with
household heating and cooking demand. Households first decide on the portion of residues
to retain, and then use the removed residues to meet family heating and cooking
requirements. Residues in excess of these family requirements are fed to livestock. If
production is too low or residue retention rates are at a level that doesn't provide enough
residues for household needs, residues need to be purchased at the market price.
9
rotation net value grain net value + livestock net value
grain net value = Gg Pg Cg gw , p
(1)
(2)
livestock net value N Lw Pl LC
N CPA / CPD
CPA rwr , pr
rwr , pr RC r Pr (3)
(4)
(5) (RPr RHr ) CPC r
where : g grain, w= spring wheat grain, p=field pea grain; r crop residue, wr= spring wheat residue, pr=field pea residue; G grain (kg/ha), P price (RMB/kg), C is production cost (RMB/ha); N= livestock weaner inventory (number), Lw weaner live weight (kg);
Pl liveweight price for weaners (RMB/kg); LC = labour costs to remove residues from field, and feed to livestock (RMB/ha); RC = crop residue purchased to meet household heating and cooking demand (kg); CPA= crude protein available (grams/ha);
CPD= crude protein demand per weaner (grams to reach Lw); RP crop residue produced (kg/ha); RH crop residue required to meet household heating and cooking demand (kg/ha); and
CPC = crude protein content of crop residue (% dry matter).
10
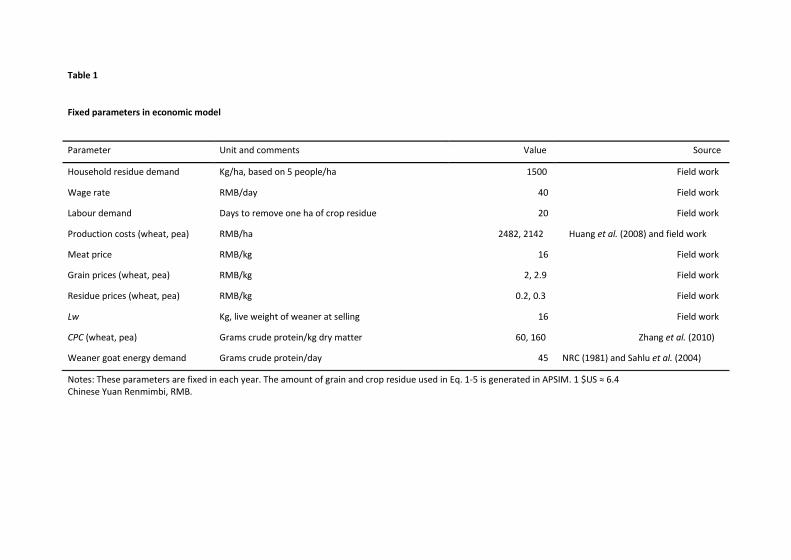
Table 1
Fixed parameters in economic model
Parameter
Household residue demand
Wage rate
Labour demand
Production costs (wheat, pea)
Meat price
Grain prices (wheat, pea)
Residue prices (wheat, pea)
Lw
CPC (wheat, pea)
Weaner goat energy demand
Unit and comments
Kg/ha, based on 5 people/ha
RMB/day
Days to remove one ha of crop residue
RMB/ha
RMB/kg
RMB/kg
RMB/kg
Kg, live weight of weaner at selling
Grams crude protein/kg dry matter
Grams crude protein/day
Value
1500
40
20
2482, 2142
16
2, 2.9
0.2, 0.3
16
60, 160
45
Source
Field work
Field work
Field work
Huang et al. (2008) and field work
Field work
Field work
Field work
Field work
Zhang et al. (2010)
NRC (1981) and Sahlu et al. (2004)
Notes: These parameters are fixed in each year. The amount of grain and crop residue used in Eq. 1-5 is generated in APSIM. 1 $US ≈ 6.4 Chinese Yuan Renmimbi, RMB.
11
Grain, residue and livestock price data are sourced from field observations and Gansu
government official sources (CSP, 2009). The overall trend for major agricultural commodity
prices in Gansu between 2004 and 2011 has been a modest rise in grain prices and a
strengthening of meat prices, with real grain prices rising 38% and real meat prices by 90%.
Despite sizeable price fluctuations in the global grains market in 2006-2008, domestic grain
prices in China have been somewhat insulated from global market variations. For example,
the increase in wheat prices from 2006-2008 within Gansu was 23%, compared to a 71% in
the global wheat price during the same period (Lu and Yu, 2011). Carter et al. (2012) and Lu
and Yu (2011) attribute this insulation to government grain self-sufficiency policies.
In order to assess if different price structures change how residue retention influences
economic returns, results are generated for three different price series:
1. Base case prices. These are the prices observed in 2011 within the study site. At
observed prices the livestock to grain price ratio is 7.
2. Medium run prices. These are 2011 prices + (2011 prices × percentage change in real
prices between 2004 and 2011). At these prices the livestock to grain price ratio is 9.
This price series is an attempt to assess what would happen if the current Chinese
trend of livestock prices rising faster than grain prices continued.
3. Falling meat prices. Meat prices fall by 40%, and grain prices do not change. At these
prices the livestock to grain price ratio is 4.
3. Results
12
3.1. Production results
Observed climatic, soil, water and crop management data were used to simulate a wheat-
field pea rotation from 1970 to 2010. All the APSIM simulation files and results are available
in the online materials. The median yield gap over the nine years between APSIM simulated
grain yields and grain yields observed in the experiment was 12% for spring wheat and -8%
for field pea. Despite APSIM under and over predicting absolute yields, APSIM predicted
similar yield gaps to those observed in the experiment for no tillage with and without
residue retention. In the experiment, the average grain yield gap over the nine years for no
tillage with and without residue retention was 31% for spring wheat and 37% for field pea,
compared to APSIM simulated differences of 28% and 39%, respectively. Observed biomass
gaps between no tillage with and without residue retention were 27% for spring wheat and
31% for field pea, compared to APSIM simulated differences of 24% and 39%, respectively.
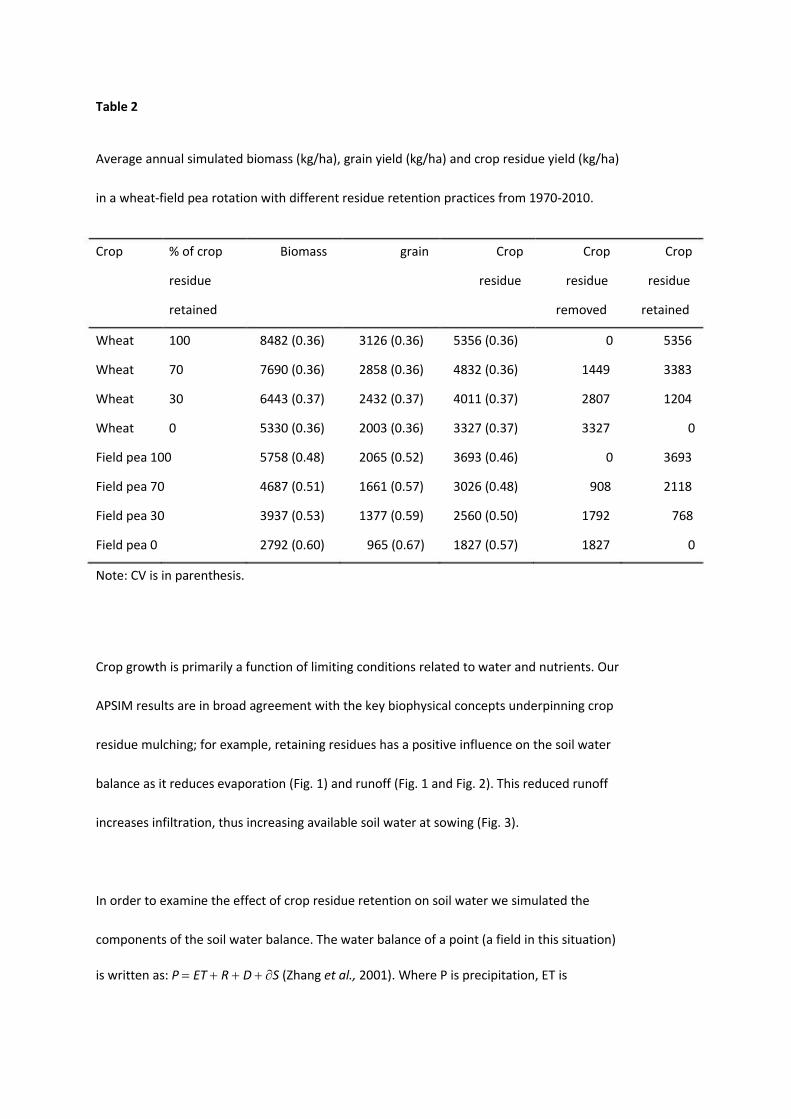
Retaining residues can improve long-run production; residue retention has a positive effect
on average biomass (Table 2). In addition, retaining residues can stabilise the relative
variability of production. For example, the coefficient of variation for the field pea biomass
(CV, i.e. standard deviation divided by mean of 40 simulated years) falls by 7% when 30% of
residues are retained, relative to zero residue retention (Table 2). This is because residue
retention stabilises soil water balances (Figure 1). This ability of crop residue mulching to
assist in smoothing long-run production has also been observed by Erenstein (2002) and
Govaerts et al. (2005).
13
Table 2
Average annual simulated biomass (kg/ha), grain yield (kg/ha) and crop residue yield (kg/ha)
in a wheat-field pea rotation with different residue retention practices from 1970-2010.
Crop % of crop
residue
retained
Wheat
Wheat
Wheat
Wheat
100
70
30
0
8482 (0.36)
7690 (0.36)
6443 (0.37)
5330 (0.36)
5758 (0.48)
4687 (0.51)
3937 (0.53)
2792 (0.60)
3126 (0.36)
2858 (0.36)
2432 (0.37)
2003 (0.36)
2065 (0.52)
1661 (0.57)
1377 (0.59)
965 (0.67)
5356 (0.36)
4832 (0.36)
4011 (0.37)
3327 (0.37)
3693 (0.46)
3026 (0.48)
2560 (0.50)
1827 (0.57)
Biomass grain Crop
residue
Crop
residue
removed
0
1449
2807
3327
0
908
1792
1827
Crop
residue
retained
5356
3383
1204
0
3693
2118
768
0
Field pea 100
Field pea 70
Field pea 30
Field pea 0
Note: CV is in parenthesis.
Crop growth is primarily a function of limiting conditions related to water and nutrients. Our
APSIM results are in broad agreement with the key biophysical concepts underpinning crop
residue mulching; for example, retaining residues has a positive influence on the soil water
balance as it reduces evaporation (Fig. 1) and runoff (Fig. 1 and Fig. 2). This reduced runoff
increases infiltration, thus increasing available soil water at sowing (Fig. 3).
In order to examine the effect of crop residue retention on soil water we simulated the
components of the soil water balance. The water balance of a point (a field in this situation)
is written as: P ET R D S (Zhang et al., 2001). Where P is precipitation, ET is
14
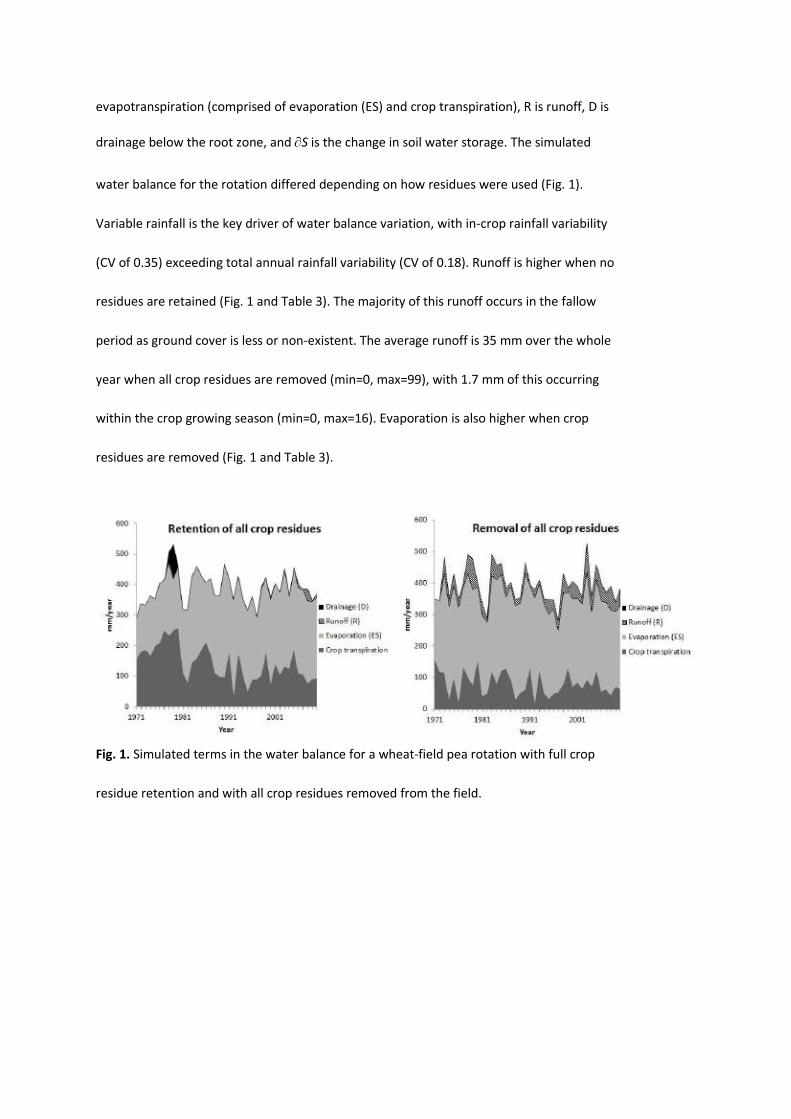
evapotranspiration (comprised of evaporation (ES) and crop transpiration), R is runoff, D is
drainage below the root zone, and S is the change in soil water storage. The simulated
water balance for the rotation differed depending on how residues were used (Fig. 1).
Variable rainfall is the key driver of water balance variation, with in-crop rainfall variability
(CV of 0.35) exceeding total annual rainfall variability (CV of 0.18). Runoff is higher when no
residues are retained (Fig. 1 and Table 3). The majority of this runoff occurs in the fallow
period as ground cover is less or non-existent. The average runoff is 35 mm over the whole
year when all crop residues are removed (min=0, max=99), with 1.7 mm of this occurring
within the crop growing season (min=0, max=16). Evaporation is also higher when crop
residues are removed (Fig. 1 and Table 3).
Fig. 1. Simulated terms in the water balance for a wheat-field pea rotation with full crop
residue retention and with all crop residues removed from the field.
15
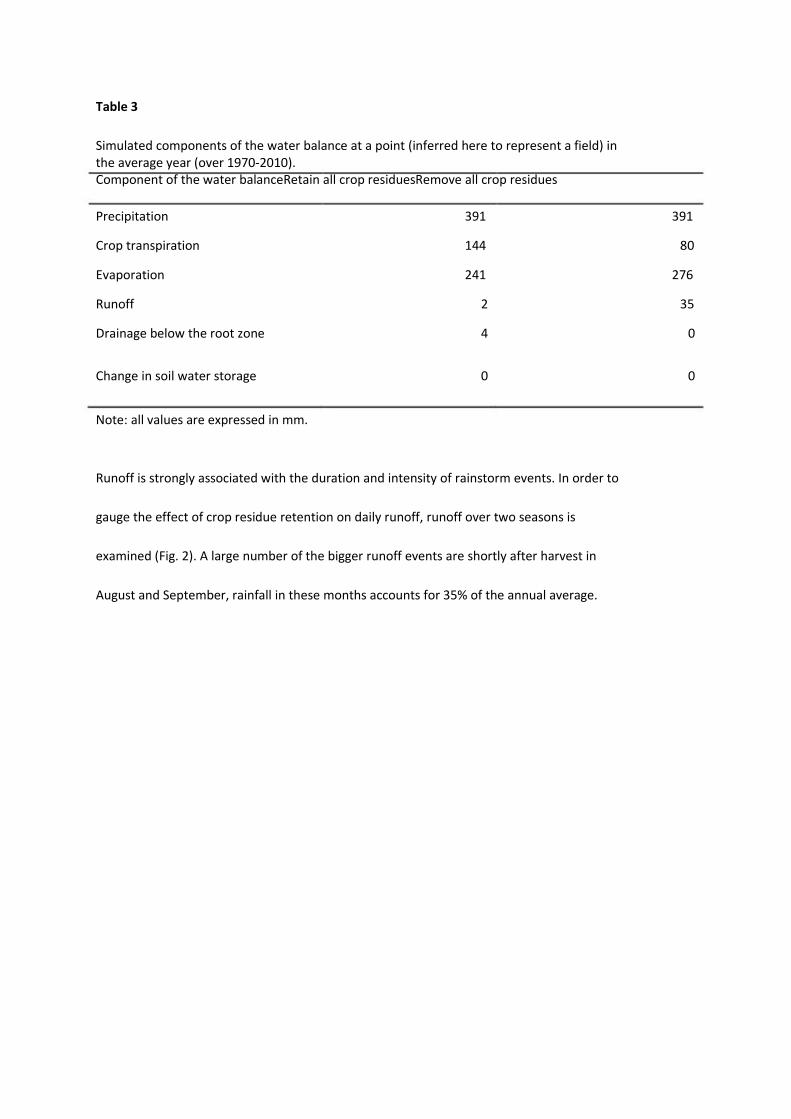
Table 3
Simulated components of the water balance at a point (inferred here to represent a field) in the average year (over 1970-2010). Component of the water balanceRetain all crop residuesRemove all crop residues
Precipitation
Crop transpiration
Evaporation
Runoff
Drainage below the root zone
Change in soil water storage
Note: all values are expressed in mm.
391
144
241
2
4
0
391
80
276
35
0
0
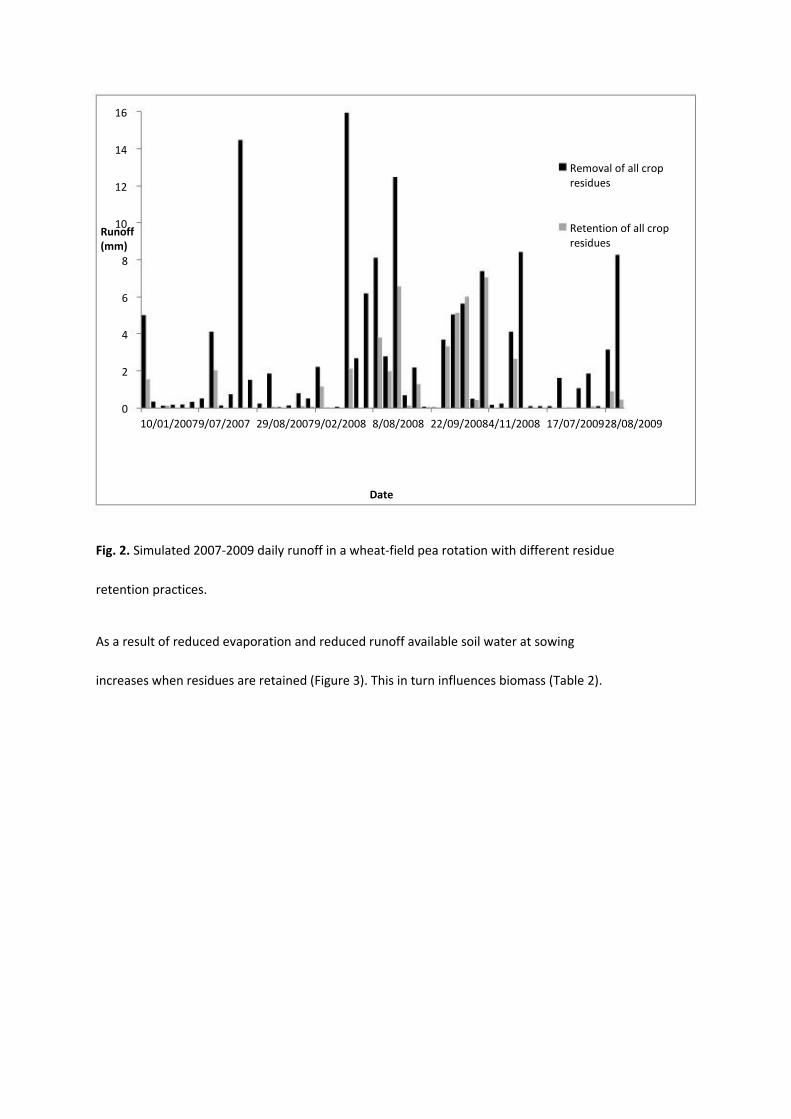
Runoff is strongly associated with the duration and intensity of rainstorm events. In order to
gauge the effect of crop residue retention on daily runoff, runoff over two seasons is
examined (Fig. 2). A large number of the bigger runoff events are shortly after harvest in
August and September, rainfall in these months accounts for 35% of the annual average.
16
16
14
12
Removal of all crop residues
Retention of all crop residues
Runoff (mm)
10
8
6
4
2
0 9/07/2007 9/02/2008 8/08/2008 10/01/2007 29/08/2007 22/09/2008 4/11/2008 17/07/2009
Date
Fig. 2. Simulated 2007-2009 daily runoff in a wheat-field pea rotation with different residue
retention practices.
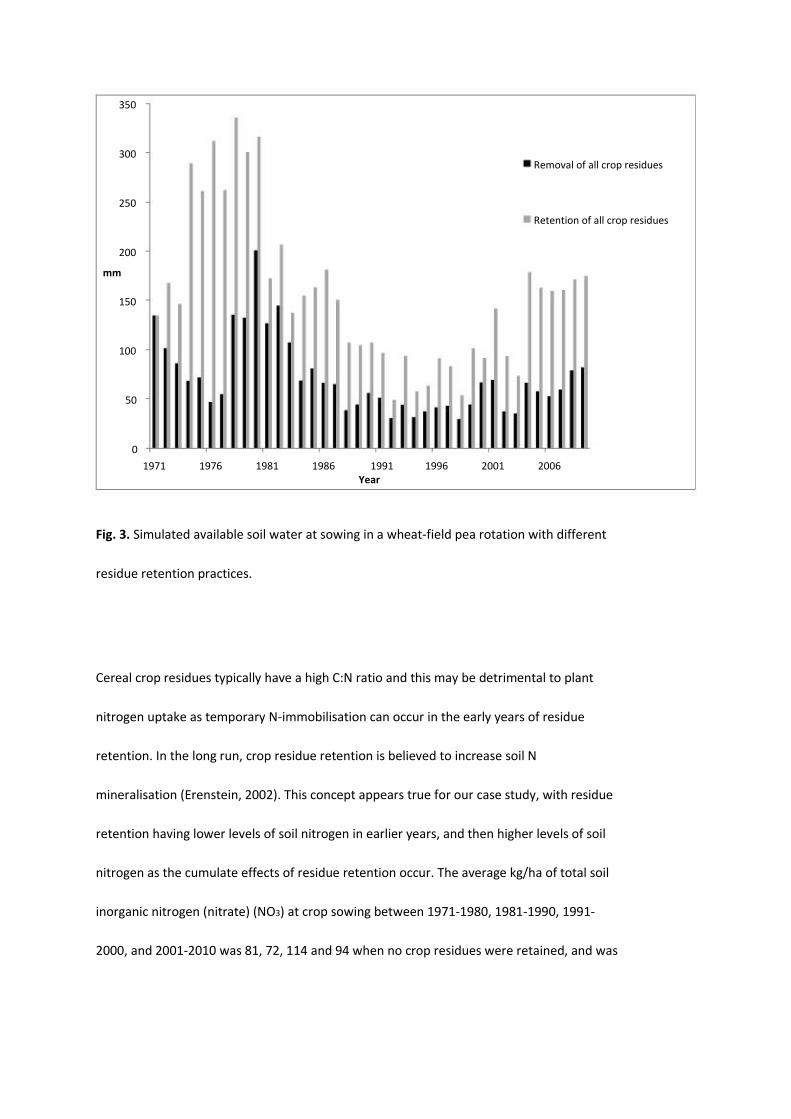
As a result of reduced evaporation and reduced runoff available soil water at sowing
increases when residues are retained (Figure 3). This in turn influences biomass (Table 2).
28/08/2009
17
350
300 Removal of all crop residues
250 Retention of all crop residues
200
mm
150
100
50
0 1971 1976 1981 1986 1991
Year 1996 2001 2006
Fig. 3. Simulated available soil water at sowing in a wheat-field pea rotation with different
residue retention practices.
Cereal crop residues typically have a high C:N ratio and this may be detrimental to plant
nitrogen uptake as temporary N-immobilisation can occur in the early years of residue
retention. In the long run, crop residue retention is believed to increase soil N
mineralisation (Erenstein, 2002). This concept appears true for our case study, with residue
retention having lower levels of soil nitrogen in earlier years, and then higher levels of soil
nitrogen as the cumulate effects of residue retention occur. The average kg/ha of total soil
inorganic nitrogen (nitrate) (NO3) at crop sowing between 1971-1980, 1981-1990, 1991-
2000, and 2001-2010 was 81, 72, 114 and 94 when no crop residues were retained, and was
18
72, 74, 183 and 239 when all crop residues were retained. Increased organic matter when
residues are retained is one reason explaining these different nitrogen levels at crop sowing.
Although the grain yield effects of conservation agriculture can be positive, negative or
insignificant and the results can be highly site-dependant (Govaerts et al., 2005; Giller et al.,
2009), in this study, using crop residues as mulch (in conjunction with no-tillage) increases
soil water and soil nitrogen content, and this translates into higher production (Table 2).
Maximum production occurs when all residues are retained; however, maximum production
does not necessarily translate into maximum economic value.
3.2. Economic results
Overall, we find that retaining a small portion of crop residues as mulch is beneficial to
economic returns, with the maximum economic return occurring when 20% of residues are
retained in the field (Fig. 4). Clear trade-offs exists between using residues as a mulch to
increase grain yields and using residues as a source of livestock feed and household heating
and cooking fuel. The value of grain production falls as residue retention declines, and the
net value of livestock production rises until 90% of residues are removed. Current farmer
practice is full residue removal (Li et al., 2011); and in this study, similar returns could be
obtained by removing 30% of residues (average economic return is 3505 RMB/ha at 30%
removal and 3573 RMB/ha at 100% removal). Higher returns are available if 30-90% of
residues were removed.
19
9000
8000
7000
6000
RMB/ha 5000
4000
3000
2000
1000
0
-1000 0 10 20 30 40 50 60 70 80 90 100
% of crop residues removed from field
Net value of livestock productionat medium run livestock:grain price ratio (ratio=9)
Net value of grain production at medium run livestock:grain price ratio (ratio=9)
Net value of livestock productionat current livestock:grain price ratio (ratio=7)
Net value of grain production at current livestock:grain price ratio (ratio=7)
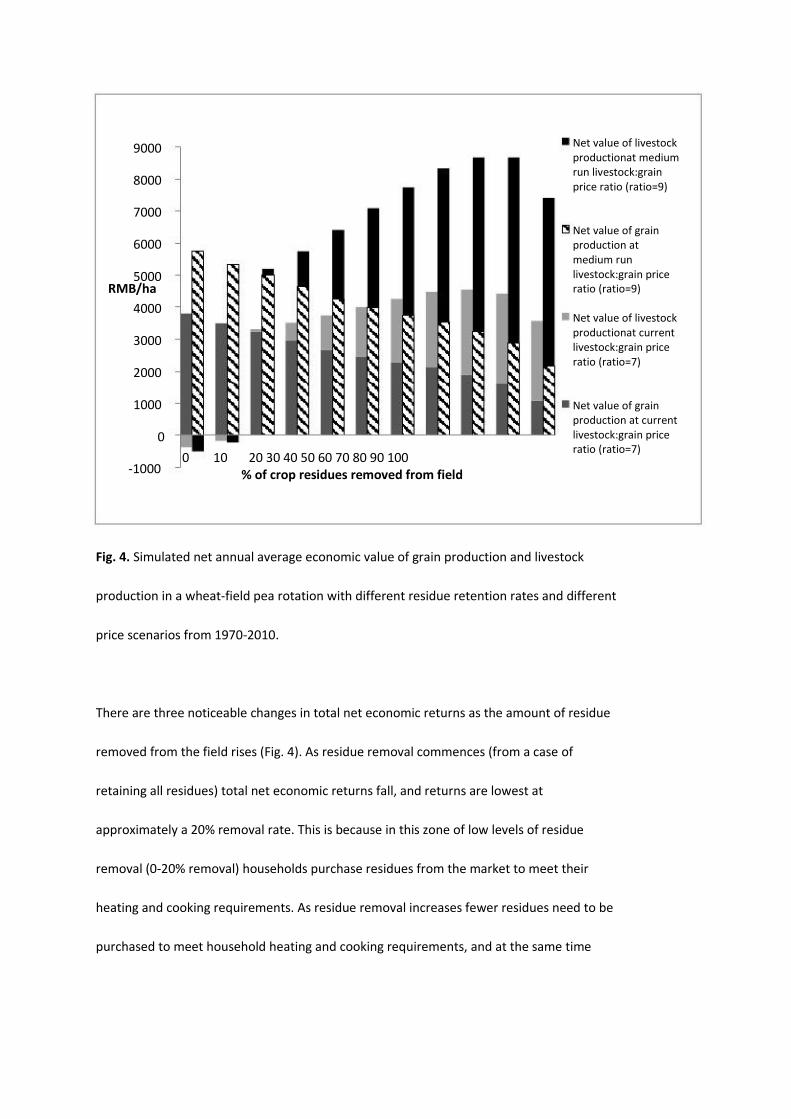
Fig. 4. Simulated net annual average economic value of grain production and livestock
production in a wheat-field pea rotation with different residue retention rates and different
price scenarios from 1970-2010.
There are three noticeable changes in total net economic returns as the amount of residue
removed from the field rises (Fig. 4). As residue removal commences (from a case of
retaining all residues) total net economic returns fall, and returns are lowest at
approximately a 20% removal rate. This is because in this zone of low levels of residue
removal (0-20% removal) households purchase residues from the market to meet their
heating and cooking requirements. As residue removal increases fewer residues need to be
purchased to meet household heating and cooking requirements, and at the same time
20
grain production declines. At 10% removal, the lost value of grain production (relative to full
residue retention) exceeds the savings made from reductions in residue purchasing costs.
Once greater than 20% of residues are removed, household residue production is sufficient
to cover household cooking and heating requirements, and all additional residues removed
from the field are used to feed livestock. Economic returns rise from 20% removal until their
maximum at 80% removal. In this zone, the value of extra residue in increasing livestock
production exceeds the value of lost grain production.
Economic returns fall once removal rates exceed approximately 80%. This is because at very
high rates of residue removal livestock production falls due to lower biomass production. At
100% removal there is 1823 kg/ha of field pea residue produced and 1823 kg removed from
the field, but at 90% removal 2273 kg/ha is produced, and 2045 kg is retained. The
reduction in residue produced when moving from 90% to 100% removal is 20%, as a result
removing a larger percentage of total residues produced (i.e. 10% more) doesn't actual
increase available residues to feed livestock as it does at lower residue retention rates.
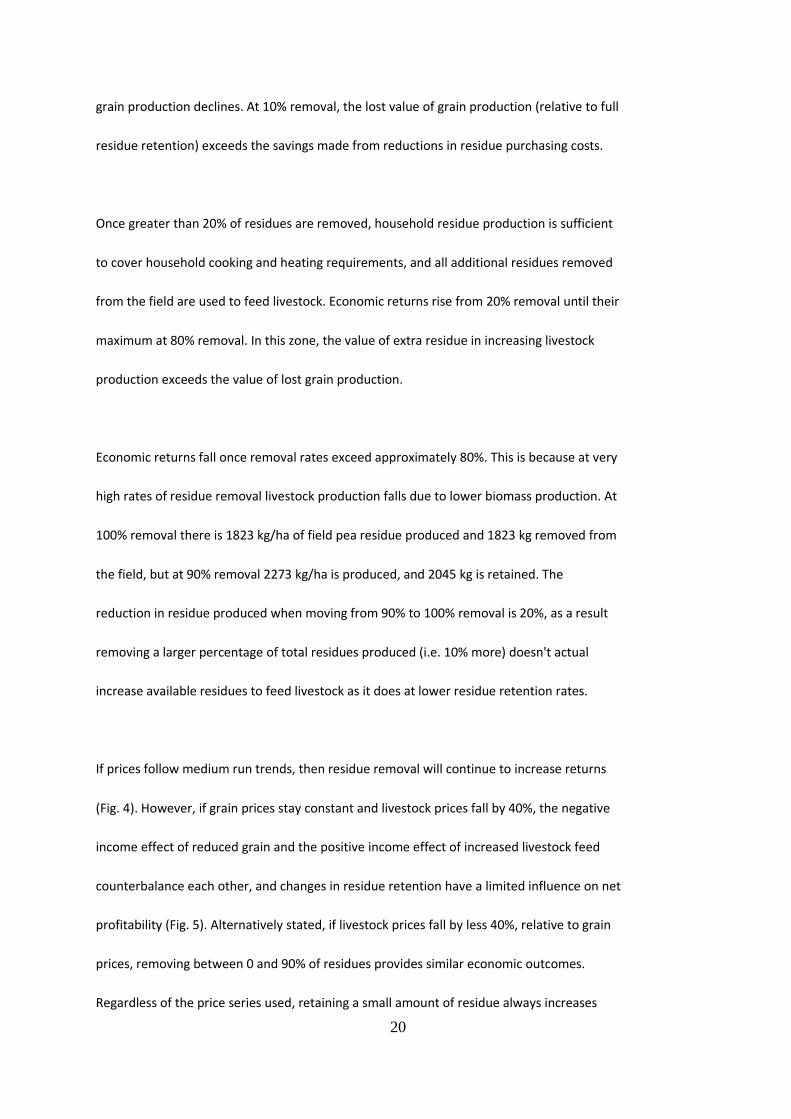
If prices follow medium run trends, then residue removal will continue to increase returns
(Fig. 4). However, if grain prices stay constant and livestock prices fall by 40%, the negative
income effect of reduced grain and the positive income effect of increased livestock feed
counterbalance each other, and changes in residue retention have a limited influence on net
profitability (Fig. 5). Alternatively stated, if livestock prices fall by less 40%, relative to grain
prices, removing between 0 and 90% of residues provides similar economic outcomes.
Regardless of the price series used, retaining a small amount of residue always increases
21
average economic returns, with an increase of residue retention from 0 to 20% increasing
average economic returns by at least 15% in each of the three price series (Fig. 5).
10000
8000
6000
4000
2000
0
0 10 20 30 40 50 60 70 80 90 100 % of crop residues removed from field
Fig. 5. Simulated net annual average economic value of rotation with different residue
retention rates and different price series from 1970-2010.
Net value of rotation at current livestock:grain price ratio (ratio=7)
Net value of rotation at lower livestock:grain price ratio (ratio=4)
RMB/ha
Net value of rotation at higher livestock:grain price ratio (ratio=9)
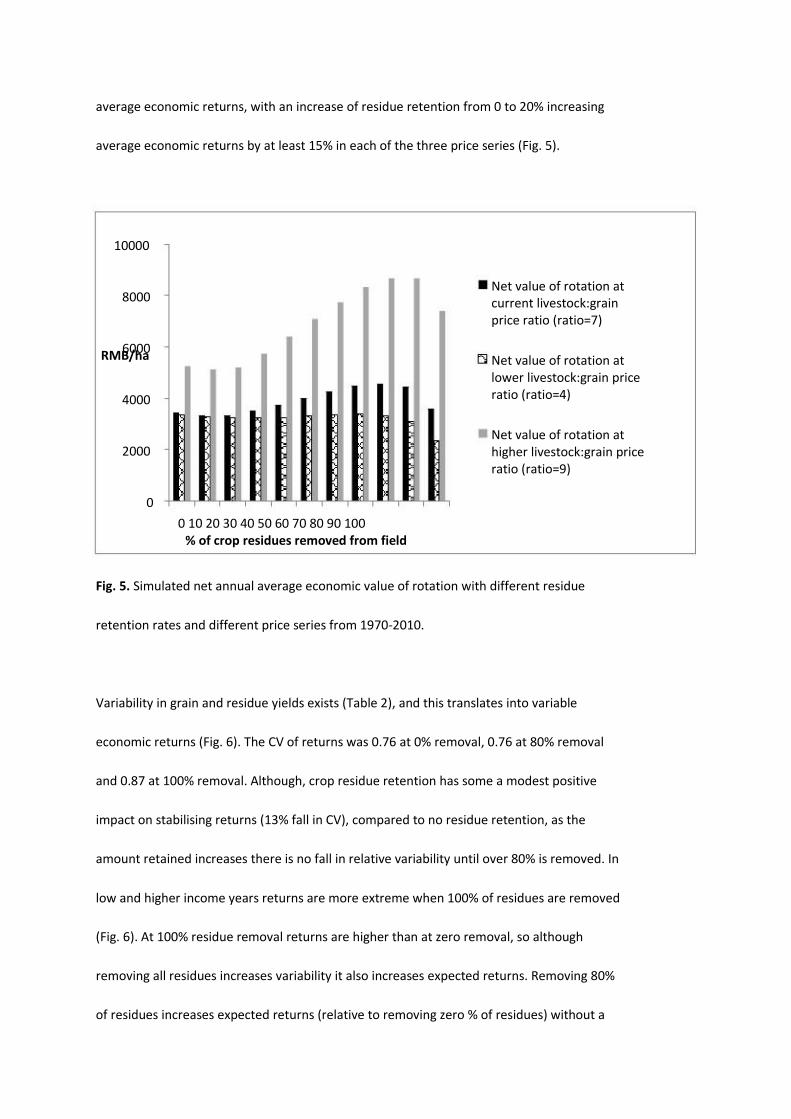
Variability in grain and residue yields exists (Table 2), and this translates into variable
economic returns (Fig. 6). The CV of returns was 0.76 at 0% removal, 0.76 at 80% removal
and 0.87 at 100% removal. Although, crop residue retention has some a modest positive
impact on stabilising returns (13% fall in CV), compared to no residue retention, as the
amount retained increases there is no fall in relative variability until over 80% is removed. In
low and higher income years returns are more extreme when 100% of residues are removed
(Fig. 6). At 100% residue removal returns are higher than at zero removal, so although
removing all residues increases variability it also increases expected returns. Removing 80%
of residues increases expected returns (relative to removing zero % of residues) without a
22
shift in CV. More promising is that removing 80% of residues increases expected returns
(relative to removing 100% of residues) and also reduces CV.
1.0
0.9
0.8
Cumulative probability
0.7
0.6
0.5
Remove 0% of crop residues
Remove 80% of crop residues
Remove 100% of crop residues
0.4
0.3
0.2
0.1
0.0 -1000 40009000
Profit (RMB/ha)
Fig. 6. Cumulative probability of annual profit/ha over 40 years of model simulations using base case prices and different residue retention rates.
3.3. Ground cover results
High levels of groundcover can reduce the susceptibility of soil to wind and water erosion.
Groundcover (live and dead plant cover) was simulated in APSIM and results are expressed
as the mean percentage of days in the year when groundcover fell below a nominated
threshold of 50%. When all residues are removed, in the average year, there are 75 days
where ground cover exceeds 50%. On the contrary, when all residues are retained there are
23
287 days when ground cover exceeds 50%. When only ground cover after harvest, prior to
the next season’s crop is considered (i.e. ignoring standing biomass, living cover) there are
zero days and 249 days where ground cover exceeds 50% when all residues are removed
and when all residues are retained, respectively. These differences in ground cover
influence both runoff (Fig. 2) and wind erosion potential.
Conclusions
In the article we offer some modest insights into the production, economic and
environmental consequences of retaining crop residues. Major findings of this study are that
(1) residue retention improves and stabilises production and reduces erosion potential, and
(2) removing 30-80% of crop residues increases economic returns (relative to full removal or
zero removal) as the value of additional residues for livestock feed and heating exceeds the
value of lost grain production. Current farmer practice in the study site is to remove all crop
residues, and the uptake of conservation agriculture practices in China has been minimal (Li
et al., 2011). Promoting full removal or retention of crop residues should be carefully
considered as mixed farming systems often rely on both grain and residues for income and
household consumption needs. Advocating retaining a small portion of residues as mulch
may assist in lifting incomes and stabilising the relative variability of incomes, as in this study
retaining 20% of residues as mulch leads to economic returns greater than the current
practice of full residue removal, and reduced the CV of economic returns. In addition,
developing alternative forage resources for livestock feed, for example lucerne (Medicago
sativa L.), may encourage using crop residues as mulch.
24
Tensions exist between farmers improving their economic situation and reducing
environmental stress, like water and wind erosion. China’s Sloping Land Conversion Program
aims to reduce environmental stress by providing farmers with financial incentives to plant
trees and perennial grasses (Qu et al., 2011). Although monitoring could prove challenging,
the idea of providing financial incentives to retain crop residues should be further canvassed
as crop residues have an ability to reduce erosion potential, and this is critical in fragile
environments like western China. A complicating factor is that residue retention can
increase herbicide and fertiliser runoff (Erenstein, 2002), and this should also be properly
factored into decisions regarding payments of residue retention.
Acknowledgements
The Australian Centre for International Agricultural Research funded this research.
References
Aulakh, M.S., Manchanda, J.S., Garg, A.K., Kumar, S., Dercon, G. and Nguyen, M.-L. (2012). Crop production and nutrient use efficiency of conservation agriculture for soybean–wheat rotation in the Indo-Gangetic Plains of Northwestern India, Soil and Tillage Research 120, 50–60. Bakht, J., Shafi, M., Jan, M.T. and Shah, Z. (2009). Influence of crop residue management, cropping system and N fertilizer on soil N and C dynamics and sustainable wheat (Triticum aestivum L.) production, Soil and Tillage Research 104, 233–240. Carter, C.A., Zhong, F. and Zhu, J. (2012). Advances in chinese agriculture and its global implications, Applied Economic Perspectives and Policy 34, 1–36. CSP (2009). Gansu Yearbook. China Statistics Press Drafting Committee, Lanzhou. Erenstein, O. (2002). Crop residue mulching in tropical and semi-tropical countries: An evaluation of residue availability and other technological implications, Soil and Tillage Research 67, 115– 133. Erenstein, O. (2011). Cropping systems and crop residue management in the Trans-Gangetic Plains: Issues and challenges for conservation agriculture from village surveys, Agricultural Systems 104, 54–62. Fischer, R.A., Santiveri, F. and Vidal, I.R. (2002). Crop rotation, tillage and crop residue management for wheat and maize in the sub-humid tropical highlands: I. Wheat and legume performance, Field Crops Research 79, 107–122.
25
Giller, K.E., Corbeels, M., Nyamangara, J., Triomphe, B., Affholder, F., Scopel, E. and Tittonell, P. (2011). A research agenda to explore the role of conservation agriculture in African smallholder farming systems, Field Crops Research 124, 468–472. Giller, K.E., Witter, E., Corbeels, M. and Tittonell, P. (2009). Conservation agriculture and smallholder farming in Africa: The heretics' view, Field Crops Research 114, 23–34. Govaerts, B., Sayre, K.D. and Deckers, J. (2005). Stable high yields with zero tillage and permanent bed planting?, Field Crops Research 94, 33–42. Huang, G.B., Zhang, R.Z., Li, G.D., Li, L.L., Chan, K.Y., Heenan, D.P., Chen, W., Unkovich, M.J., Robertson, M.J., Cullis, B.R. and Bellotti, W.D. (2008). Productivity and sustainability of a spring wheat-field pea rotation in a semi-arid environment under conventional and conservation tillage systems, Field Crops Research 107, 43–55. Keating, B.A., Carberry, P.S., Hammer, G.L., Probert, M.E., Robertson, M.J., Holzworth, D., Huth, N.I., Hargreaves, J.N.G., Meinke, H., Hochman, Z., McLean, G., Verburg, K., Snow, V., Dimes, J.P., Silburn, M., Wang, E., Brown, S., Bristow, K.L., Asseng, S., Chapman, S., McCown, R.L., Freebairn, D.M. and Smith, C.J. (2003). An overview of APSIM, a model designed for farming systems simulation, European Journal of Agronomy 18, 267–288. Knowler, D. and Bradshaw, B. (2007). Farmers’ adoption of conservation agriculture: A review and synthesis of recent research, Food Policy 32, 25–48. Li, L.-l., Huang, G.B., Zhang, R.Z., Bellotti, B., Li, G. and Chan, K.Y. (2011). Benefits of conservation agriculture on soil and water conservation and its progress in China, Agricultural Sciences in China 10, 850–859. Lu, K. and Yu, B. (2011). The impact of high food prices on poverty in China, Development in Practice 21, 679–690. Malhi, S.S. and Lemke, R. (2007). Tillage, crop residue and N fertilizer effects on crop yield, nutrient uptake, soil quality and nitrous oxide gas emissions in a second 4-yr rotation cycle, Soil and Tillage Research 96, 269–283. Maskina, M., Power, J.F., Doran, J.W. and Wilhelm, W. (1993). Residual effects of no-till crop residues on corn yield and nitrogen uptake, Publications from USDA-ARS / UNL Faculty. Paper 90. Mupangwa, W., Twomlow, S. and Walker, S. (2012). Reduced tillage, mulching and rotational effects on maize (Zea mays L.), cowpea (Vigna unguiculata (Walp) L.) and sorghum (Sorghum bicolor L. (Moench)) yields under semi-arid conditions, Field Crops Research 132, 139–148. Nolan, S., Unkovich, M., Yuying, S., Lingling, L. and Bellotti, W. (2008). Farming systems of the Loess Plateau, Gansu Province, China, Agriculture, Ecosystems & Environment 124, 13–23. NRC (1981). Nutrient Requirements of Goats: Angora, Dairy and Meat Goats in Temperate and Tropical Countries. National Academy Press, Washington, D.C. Qu, F., Kuyvenhoven, A., Shi, X. and Heerink, N. (2011). Sustainable natural resource use in rural China: Recent trends and policies, China Economic Review 22, 444–460. Sahlu, T., Goetsch, A.L., Luo, J., Nsahlai, I.V., Moore, J.E., Galyean, M.L., Owens, F.N., Ferrell, C.L. and Johnson, Z.B. (2004). Nutrient requirements of goats: developed equations, other considerations and future research to improve them, Small Ruminant Research 53, 191–219. Valbuena, D., Erenstein, O., Homann-Kee Tui, S., Abdoulaye, T., Claessens, L., Duncan, A.J., Gérard, B., Rufino, M.C., Teufel, N., van Rooyen, A. and van Wijk, M.T. (2012). Conservation agriculture in mixed crop–livestock systems: Scoping crop residue trade-offs in Sub-Saharan Africa and South Asia, Field Crops Research 132, 175–184. Zhang, L., Dawes, W.R. and Walker, G.R. (2001). Response of mean annual evapotranspiration to vegetation changes at catchment scale, Water Resources Research 37, 701–708. Zhang, Q., Shen, Y., Nan, Z.B., Whish, J., Bell, L. and Bellotti, W.D. (2010). Production and nutritive value of alternative annual forage crop options in a rainfed region of western China. in Dove, H. and Culvenor, R.A. (eds.), 15th Agronomy Conference, Food Security from Sustainable Agriculture, Lincoln, New Zealand.