Costs and Benefits of Commissioning New and Existing Commercial Buildings Building a Sustainable...
26
Costs and Benefits of Commissioning New and Existing Commercial Buildings Building a Sustainable Campus Community U.C. Santa Cruz, June 21, 2005 Evan Mills, Norman Bourassa, and Mary Ann Piette Lawrence Berkeley National Laboratory Hannah Friedman and Tudi Haasl Portland Energy Conservation, Inc. David Claridge and Tehesia Powell Texas A&M University - Energy Systems Lab Sponsors: U.S. Department of Energy • CEC-PIER
-
Upload
buddy-johnston -
Category
Documents
-
view
214 -
download
0
Transcript of Costs and Benefits of Commissioning New and Existing Commercial Buildings Building a Sustainable...

Costs and Benefits of Commissioning New and Existing Commercial Buildings
Building a Sustainable Campus CommunityU.C. Santa Cruz, June 21, 2005
Evan Mills, Norman Bourassa, and Mary Ann PietteLawrence Berkeley National Laboratory
Hannah Friedman and Tudi HaaslPortland Energy Conservation, Inc.
David Claridge and Tehesia PowellTexas A&M University - Energy Systems Lab
Sponsors: U.S. Department of Energy • CEC-PIER

Commissioning (Cx) is Quality Assurance(Green Buildings are not exempt from Murphy’s Law)
• Articulating/verifying design intent
• Construction observation; warranty enforcement --> Controlling first cost
• Identifying broken, disabled, or malfunctioning systems
• Optimizing performance (comfort, reliability, safety, energy)
• Training operators
• Enhancing safety and risk management

Project Objective and Methods
• Objective: Evaluate costs and benefits of Cx, understand energy savings opportunities from correcting design & operational problems
• Methods:– Gather data (real buildings)– Focus on energy; consider non-energy impacts (+/-)– Separate treatment of new and existing buildings– Standardize information (definitions, normalized energy prices,
inflation). Has significant effect on results; allows inter-comparisons
– Perform statistical and correlation analyses
>> About 200 fields of data collected <<

Resulting Sample Characteristics
• 224 buildings (175 projects), of which 150 are existing buildings and 74 are new construction– 19+ commissioning providers– Largest sample yet compiled
• Diversity of building types(heavy on public buildings)
• 30.4 million square feet across 21 states– Existing buildings: median 151,000 ft2
– New construction: median 69,500 ft2
• $17 million investment in commissioning• Projects span two decades, but most
done in the 1990s

Top-level Findings (all values are medians)
• Existing Buildings– Cost: $0.27/ft2 • NEBs: $0.18/ft2
– Deficiencies: 3500 (11 per building)– Whole-building energy savings: 15%– Payback time: 8 months
• New Construction– Cost: $1.00/ft2 • NEBs: $1.24/ft2
– Deficiencies: 3300 (28 per building)– Payback time: 4.8 years
• Cost-effective over range of energy intensitiesbuilding types, sizes, and locations
• Most successful: energy-intensive buildings• Cost-effective outcomes harder in small buildings

Cost Allocation
Commissioning Cost Allocation(Existing Buildings, N=55)
Verification & Persistance Tracking
2%
Reporting2%
Investigation and Planning
69%
Implementation27%
5.2 Million ($2003)
for whole Sample
Commissioning Cost Allocation(New Construction, N=5)
Construction Observation
14%
Design Review18%
Warranty4%
AcceptanceTesting
64%
11.8 Million ($2003)
for whole Sample
Existing Buildings (N=55)
New Construction (N=5)

Normalized Costs

Payback Times: Existing Buildings
Attractive payback times across range of building sizes
Fig 7. Existing Buildings Commissioning:Costs, Savings, and Payback Times
-
50,000
100,000
150,000
200,000
250,000
300,000
350,000
400,000
450,000
500,000
- 50,000 100,000 150,000 200,000 250,000
Commissioning Costs ($2003)
N=100
Payback time = 1 year
Payback time = 6 months
Payback time = 1 month
Outlier (35,184; 1,034,667)
Median Payback Time = 0.7 years

Payback Times: New Construction
Payback times not always attractive (if NEBs excluded)
Median Payback Time = 4.8 years
-
5,000
10,000
15,000
20,000
25,000
30,000
- 50,000 100,000 150,000 200,000 250,000
Commissioning Costs ($2003)
N=33
Outliers: (390,575;165,130), (661,752; 149,513 ), (1,126,000; 306,344 )
Payback time = 20 years
Payback time = 5 years
Payback time = 1 year

Results Vary by Building Type
Excluding non-energy impacts
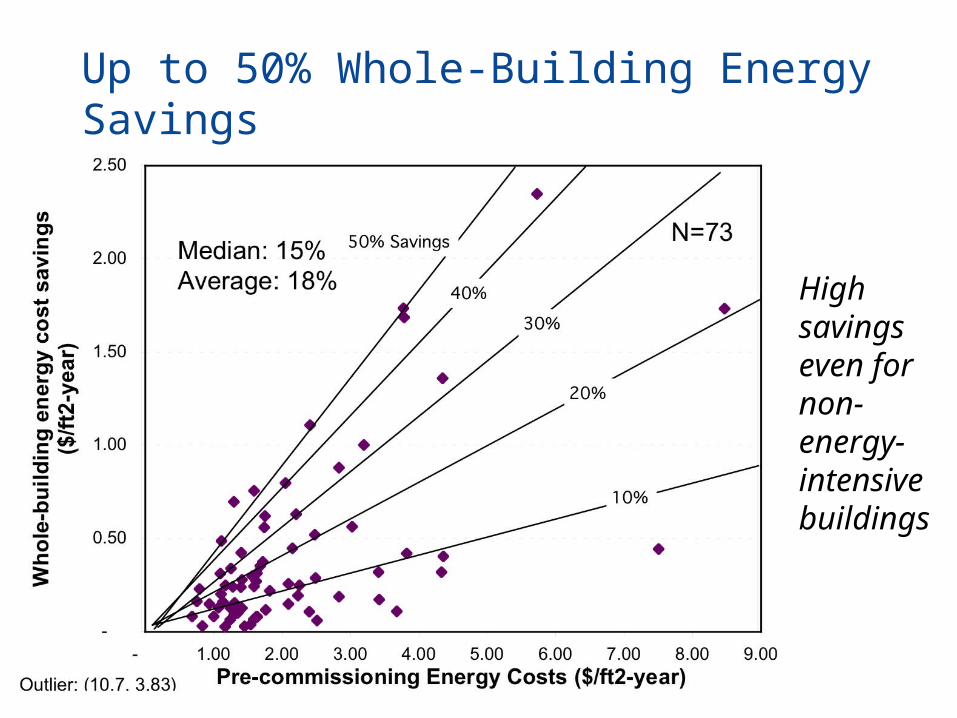
Up to 50% Whole-Building Energy Savings
High savings even for non-energy-intensive buildings
Median: 15%Average: 18%

Energy Savings & Payback Times Independent of Pre-Cx Energy Intensities

Emergence & Persistence of Energy Savings

Drivers: Existing Buildings
Reasons for Existing Buildings Commissioning (N=85)
69%
94%
65%
24%
47%
59%
1%
8%
13%
28%
0% 20% 40% 60% 80% 100%
Ensure system performance (energy and non-energy-related systems)
Obtain energy savings
Ensure or improve thermal comfort
Extended equipment life
Train and increase awareness of building operators
Smoother process and turnover (new construction)
Increase occupant productivity
Ensure adequate indoor air quality
Comply with LEED or other sustainability rating system
Reduce liability
Qualify for rebate, financing, or other services
Research/demonstration/pilot
Participation in utility program
Percent of projects reporting
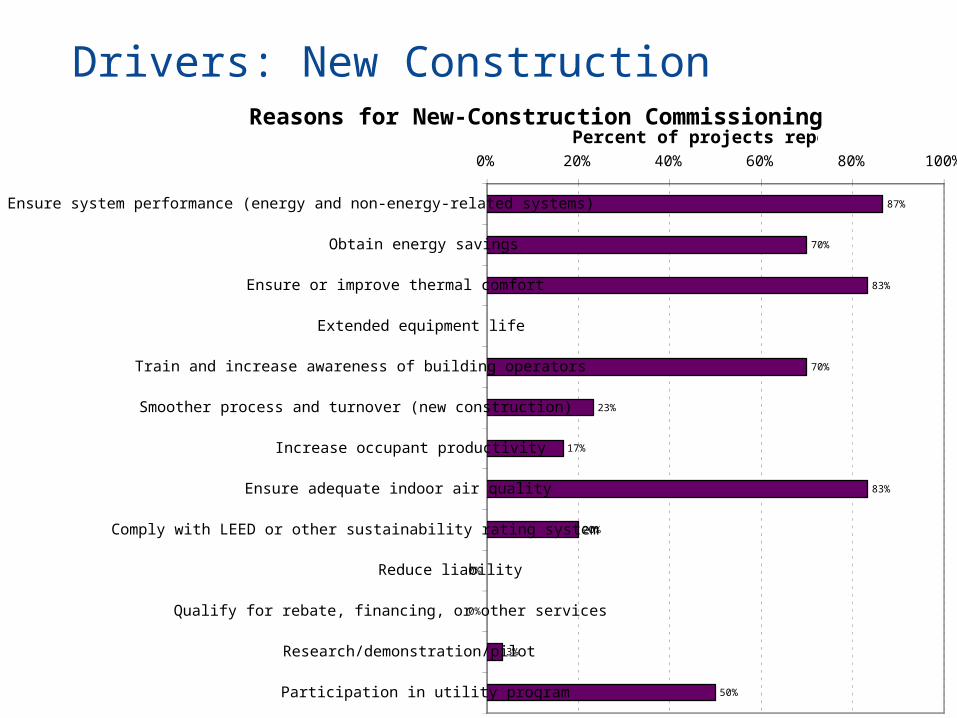
Drivers: New ConstructionReasons for New-Construction Commissioning (N=30)
87%
70%
83%
70%
23%
17%
83%
20%
0%
0%
3%
50%
0% 20% 40% 60% 80% 100%
Ensure system performance (energy and non-energy-related systems)
Obtain energy savings
Ensure or improve thermal comfort
Extended equipment life
Train and increase awareness of building operators
Smoother process and turnover (new construction)
Increase occupant productivity
Ensure adequate indoor air quality
Comply with LEED or other sustainability rating system
Reduce liability
Qualify for rebate, financing, or other services
Research/demonstration/pilot
Participation in utility program
Percent of projects reporting

0% 20% 40% 60% 80% 100%
Document design intent or update current documentation
Develop commissioning Plan
Perform utility bill analysis, benchmarking
Perform trend analysis
Building modeling
Document master list of findings
Estimate energy cost savings for findings
Present a findings and recommendations report
Update system documentation (control sequences)
Implement O&M improvements
Implement capital improvements
Monitor fixes
Measure energy savings
Develop systems manual/recommissioning manual
Final report
Share of projects including given activity
Scope(Existing bldgs.)

Savings Scale with Commissioning Scope

0% 20% 40% 60% 80% 100%
Commissioning provider development of design intentdocuments
Write specifications
Develop commissioning plan
Design review (indicate # of review cycles)
Develop sequences of operation (if not well-developed bymech or controls contractor)
Review submittals
Construction observation
Verification checks/prefunctional testing
Functional testing
Commissioning provider significantly involved in issueresolution
Oversee training
Review O&M manuals
Develop systems manual/recommissioning manual
Perform trend analysis
Evaluate energy cost savings
Final report
Share of projects including given activity
Scope(New construction)
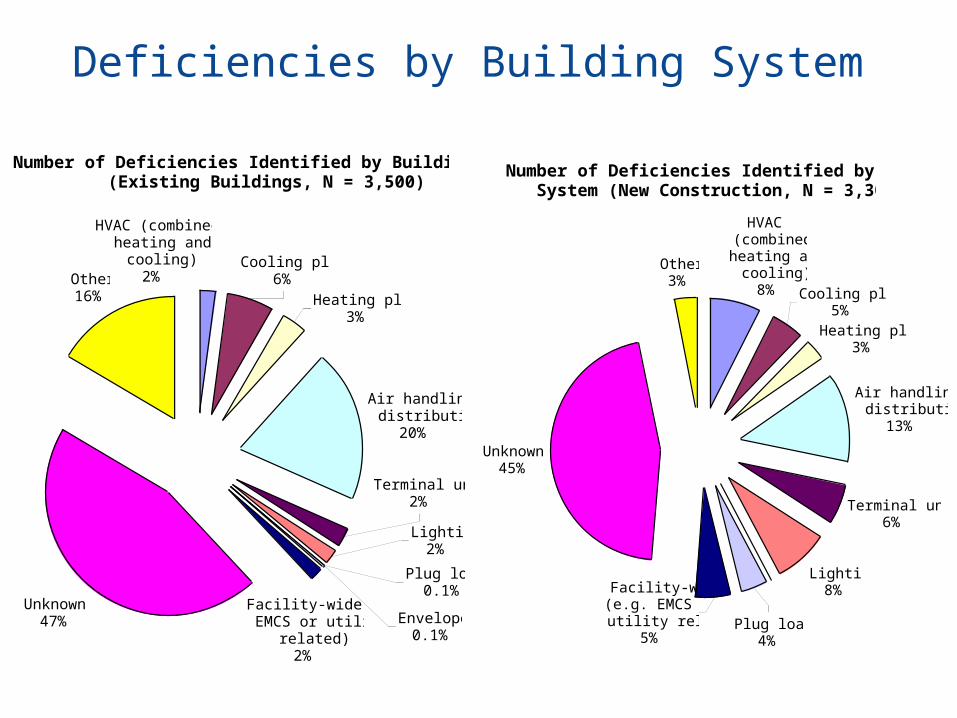
Deficiencies by Building System
Number of Deficiencies Identified by Building System(Existing Buildings, N = 3,500)
Air handling & distribution
20%
Unknown47%
Other16%
Cooling plant6%
Heating plant3%
HVAC (combined heating and
cooling)2%
Lighting2%
Terminal units2%
Facility-wide (e.g. EMCS or utility
related)2%
Plug loads0.1%
Envelope0.1%
Number of Deficiencies Identified by Building System (New Construction, N = 3,305)
Air handling & distribution
13%
Terminal units6%
Lighting8%
Unknown45%
Other3%
Cooling plant5%
Plug loads4%
Facility-wide (e.g. EMCS or utility related)
5%
HVAC (combined
heating and cooling)
8%
Heating plant3%
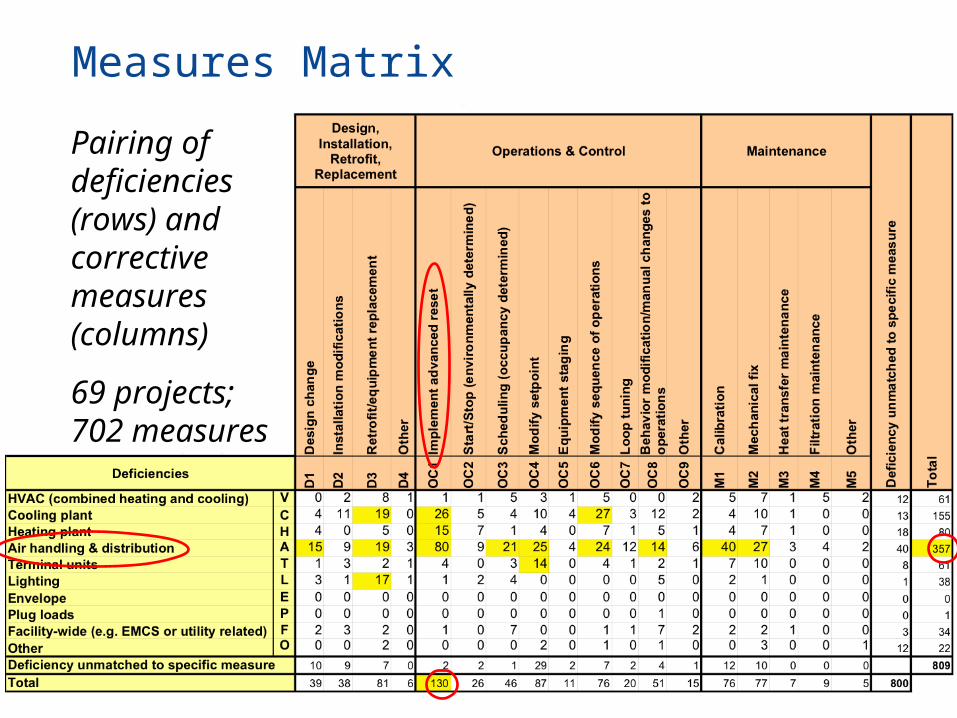
Measures Matrix
Pairing of deficiencies (rows) and corrective measures (columns)
69 projects; 702 measures

Observed Non-Energy Impacts
Reported Non-Energy Impacts (Existing Buildings)
Ongoing Labor Cost 7%
Indoor Air Quality17%
Productivity/Safety5%
Thermal Comfort21%Liability
1%
Equipment Life33%
Change orders and warranty claims
5%
Other First Cost10%
0%
36Projects
(81 benefits)
Reported Non-Energy Impacts(New Construction)
Productivity/Safety12%
Indoor Air Quality16%
Equipment Life19%
Ongoing Labor Cost 2%
Thermal Comfort19%
0%
Other First Cost15%
Change Orders and Warranty Claims
18%
44Projects
(95 benefits)
Existing Buildings (N=55)
New Construction (N=5)

Value of Non-Energy Benefits Often Offsets Entire Cost of Commissioning
Commissioning Cost vs. First-Cost Savings in New Construction (N=20 Projects)
(600)
(500)
(400)
(300)
(200)
(100)
-
100
200
300
400
500
600
Project
$2003(1000s)
Commissioning Cost
Non-Energy First-CostSavings
1,126
1,418
20 projects

New Construction: Costs range from -1% to 2%+ of total construction cost
Inclusion of non-energy benefits (e.g. equipment downsizing, reduced callbacks, … significantly reduces costs

National Potential; National Need
• National potential:– Assuming median savings of 15% – $18 billion annual energy savings potential
(US-wide) -- plus non-energy benefits
• National need:– Without commissioning, many energy-
efficiency projects, programs, and policies will often fall short of their goals

Recommendations
• Cx is needed, and is a good investment, with significant energy savings and other benefits
• No energy management program is complete without commissioning (in-house or out-sourced)
• Invest in commissioning and institutionalize the process > track outcomes > refine process
• Develop “Green Building Commissioning”
Participate in our Research:Evan Mills
Lawrence Berkeley National Laboratory510-486-6784 • [email protected]
http://eetd.lbl.gov/emills/PUBS/Cx-Costs-Benefits.html

Existing Buildings vs. New Construction
• Existing buildings– larger– greater normalized energy savings– more cost-effective (excluding NEBs)
• New construction– less comprehensive– normalized costs higher– larger non-energy benefits– NEBs are a more important motivation for embarking on
commissioning, and can go farther in offsetting the cost of commissioning
– more deficiencies found