COSTED PLAN FOR SCALING UP NUTRITION: NIGERIA · COSTED PLAN FOR SCALING UP NUTRITION: Nigeria ....
182
COSTED PLAN FOR SCALING UP NUTRITION: NIGERIA DISCUSSION PAPER SEPTEMBER 2014 Meera Shekar Christine McDonald Ali Subandoro Julia Dayton Eberwein Max Mattern Jonathan Kweku Akuoku Public Disclosure Authorized Public Disclosure Authorized Public Disclosure Authorized Public Disclosure Authorized
Transcript of COSTED PLAN FOR SCALING UP NUTRITION: NIGERIA · COSTED PLAN FOR SCALING UP NUTRITION: Nigeria ....

COSTED PLAN FOR SCALING UP
NUTRITION:
NIGERIA
D I S C U S S I O N P A P E R
S E P T E M B E R 2 0 1 4
Meera Shekar
Christine McDonald
Ali Subandoro
Julia Dayton Eberwein
Max Mattern
Jonathan Kweku Akuoku
Pub
lic D
iscl
osur
e A
utho
rized
Pub
lic D
iscl
osur
e A
utho
rized
Pub
lic D
iscl
osur
e A
utho
rized
Pub
lic D
iscl
osur
e A
utho
rized
wb350881
Typewritten Text
98286


COSTED PLAN FOR SCALING UP NUTRITION:
Nigeria
Meera Shekar, Christine McDonald, Ali Subandoro, Julia Dayton
Eberwein, Max Mattern and Jonathan Kweku Akuoku
September 2014

ii
Health, Nutrition and Population (HNP) Discussion Paper
This series is produced by the Health, Nutrition, and Population (HNP) Family of the
World Bank's Human Development Network (HDN). The papers in this series aim to
provide a vehicle for publishing preliminary and unpolished results on HNP topics to
encourage discussion and debate. The findings, interpretations, and conclusions expressed
in this paper are entirely those of the author(s) and should not be attributed in any manner
to the World Bank, to its affiliated organizations or to members of its Board of Executive
Directors or the countries they represent. Citation and the use of material presented in this
series should take into account this provisional character.
Enquiries about the series and submissions should be made directly to the Editor, Martin
Lutalo ([email protected]). Submissions undergo informal peer review by selected
internal reviewers and have to be cleared by the Task Team Leader's Sector Manager.
The sponsoring department and author(s) bear full responsibility for the quality of the
technical contents and presentation of material in the series.
Since the material will be published as presented, authors should submit an electronic
copy in the predefined template (available at www.worldbank.org/hnppublications on the
Guide for Authors page). Drafts that do not meet minimum presentational standards may
be returned to authors for more work before being accepted.
For information regarding the HNP Discussion Paper Series, please contact Martin Lutalo
at [email protected] or 202-522-3234 (fax).
© 2014 The International Bank for Reconstruction and Development / The World Bank
1818 H Street, NW Washington, DC 20433
All rights reserved.

iii
Health, Nutrition and Population (HNP) Discussion Paper
Costed Plans for Scaling Up Nutrition:
Nigeria
Meera Shekar, Christine McDonald, Ali Subandoro, Julia Dayton Eberwein, Max Mattern
and Jonathan Kweku Akuoku
Abstract: This paper estimates country-specific costs and benefits of scaling up key
nutrition investments in Nigeria. Building on the methodology established in the global
report Scaling Up Nutrition: What will it cost?, we first estimate the costs and benefits of
a nationwide scale up of ten effective nutrition-specific interventions. This would require
an annual public investment of $837 million and would yield enormous benefits: over 8.7
million DALYs and 183,000 lives would be saved annually, while more than 3 million
cases of stunting among children under five would be averted. As it is unlikely that the
Government of Nigeria or its partners will find the $837 million necessary to reach full
national coverage, we also considers five potential scale-up scenarios based on
considerations of burden of stunting, potential for impact, resource requirements and
capacity for implementation in Nigeria. Using cost-benefit analyses we propose scale-up
scenarios that represent a compromise between the need to move to full coverage and the
constraints imposed by limited resources. This analysis takes an innovative approach to
nutrition costing by not only estimating the costs and benefits of nutrition-specific
interventions, but also exploring costs for a selected number of nutrition-sensitive
interventions implemented outside of the health sector. We identify and cost four
candidate nutrition-sensitive interventions with high impact potential for Nigeria,
including biofortification of cassava, aflatoxin control, school-based deworming, and
school-based promotion of good hygiene. Overall, these findings point to a selection of
nutrition-specific interventions and a candidate list of nutrition-sensitive approaches that
represent a cost-effective approach to reducing child malnutrition in Nigeria. Moving
forward, these results are intended to help guide decision makers as they plan future
efforts to scale-up action against malnutrition in Nigeria and develop nutrition financing
plans that bring together the health, education and agriculture sectors.
Keywords: nutrition-specific interventions, nutrition-sensitive interventions, cost of
nutrition interventions, cost-benefit analysis, nutrition financing.
Disclaimer: The findings, interpretations and conclusions expressed in the paper are
entirely those of the authors, and do not represent the views of the World Bank, its
Executive Directors, or the countries they represent.
Correspondence Details: Meera Shekar, World Bank, 1818 H. St. NW, Washington,
D.C., Tel. 202-473-6029, [email protected].

iv
Table of Contents
GLOSSERY OF TERMS ............................................................................................. VII
GLOSSARY OF TECHNICAL TERMS................................................................... VIII
ACKNOWLEDGMENTS ............................................................................................... X
EXECUTIVE SUMMARY .......................................................................................... XII
PART I – BACKGROUND ............................................................................................ 18
A. COUNTRY CONTEXT ......................................................................................... 18
B. HEALTH AND NUTRITIONAL STATUS IN NIGERIA ....................................... 18
C. THE IMPORTANCE OF INVESTING IN NUTRITION ...................................... 22
D. A MULTI-SECTORIAL APPROACH FOR IMPROVING NUTRITION .............. 25
E. PARTNER EFFORTS TO ADDRESS MALNUTRITION IN NIGERIA ............... 27
PART II – RATIONALE AND OBJECTIVES FOR DEVELOPING A SET OF
COSTED SCALE-UP SCENARIOS FOR NIGERIA ................................................. 29
PART III – METHODOLOGY ..................................................................................... 30
A. SCOPE OF THE ANALYSIS AND DESCRIPTION OF THE INTERVENTIONS 30
B. ESTIMATION OF TARGET POPULATION SIZES, CURRENT COVERAGE
LEVELS AND UNIT COSTS ..................................................................................... 32
C. ESTIMATION OF COSTS AND BENEFITS......................................................... 34
D. SCENARIOS FOR SCALING UP NUTRITION INTERVENTIONS ..................... 36
PART IV – RESULTS FOR NUTRITION-SPECIFIC INTERVENTIONS ............ 37
A. TOTAL COST, EXPECTED BENEFITS AND COST EFFECTIVENESS .......... 37
B. POTENTIAL SCALE-UP SCENARIOS............................................................... 41
C. COST-BENEFIT ANALYSIS OF THE SCALE-UP SCENARIOS ....................... 51
D. PROPOSED SCENARIOS ................................................................................... 54
E. FINANCING CURRENT COVERAGE ............................................................... 54
F. UNCERTAINTIES AND SENSITIVITY ANALYSES ........................................... 55
PART V – NUTRITION-SENSITIVE INTERVENTIONS ....................................... 57
A. BIOFORTIFICATION OF CASSAVA ................................................................. 57
B. AFLATOXIN REDUCTION THROUGH BIOCONTROL ................................... 57
C. SCHOOL-BASED DEWORMING ....................................................................... 58
D. SCHOOL-BASED PROMOTION OF GOOD HYGIENE ................................... 58
PART VI – CONCLUSIONS AND POLICY IMPLICATIONS................................ 59
APPENDICES ................................................................................................................. 61
Appendix 1: Partners Collaborating on Nutrition in Nigeria, 2014 ....................... 61
Appendix 2: Target Population Size ...................................................................... 63

v
Appendix 3: Data Sources and Relevant Assumptions .......................................... 64
Appendix 4: Methodology for Estimating Costs for Nigeria ................................. 68
Appendix 5: Methodology for Estimating DALYs for Nigeria ............................. 69
Appendix 6: Methodology for Nigeria LiST estimates .......................................... 71
Appendix 7: Methodology for Estimating Economic Benefits .............................. 73
Appendix 8: Scenario 5a Costs and Benefits by Intervention and by State ........... 76
Appendix 9: Sensitivity Analysis ........................................................................... 80
REFERENCES ................................................................................................................ 82
List of Tables Table 1. Nutrition-Specific Interventions Delivered Primarily Through Health Sector ... 30
Table 2. Multi-Sectorial, Nutrition-Sensitive Interventions – an exploratory process ..... 31
Table 3. Unit Costs and Delivery Platforms Used in the Calculations for Nutrition-
specific Interventions ................................................................................................. 33
Table 4. Unit Costs and Delivery Platforms Used in the Estimations for selected
nutrition-sensitive Interventions ................................................................................ 33
Table 5. Estimated Cost of Scaling Up 10 Nutrition Specific Interventions to Full
Coverage .................................................................................................................... 37
Table 6. Scale up of all 10 Interventions Over 5 years, 3 Scenarios in US$ Millions ...... 38
Table 7. Estimated Annual Benefits for Scaling Up 10 Nutrition Interventions to Full
Coverage .................................................................................................................... 39
Table 8. Cost Effectiveness of Scaling Up 10 Nutrition Interventions to Full Coverage,
US$ ............................................................................................................................ 41
Table 9. Scenario 1: Cost and Benefits of Scaling Up 10 Nutrition Interventions by
Region ........................................................................................................................ 42
Table 10. Scenario 2: Cost and Benefits for Scaling Up 10 Nutrition-specific
Interventions by Intervention ..................................................................................... 45
Table 11. Scenario 3: Costs and Benefits for Scaling Up 10 Nutrition-specific
Interventions by State ................................................................................................ 47
Table 12. Scenario 4: Cost of Scaling Up 10 Nutrition Interventions by State and by
Intervention, US Millions .......................................................................................... 48
Table 13. Annual Costs and Benefits from Scenarios 4a and 4b ...................................... 48
Table 14. Full and Partial Program Coverage Targets ...................................................... 49
Table 15. Scenarios Considered Within Scenario 5 .......................................................... 50
Table 16. Costs and Benefits of Most Cost-Effective Scenarios ...................................... 51
Table 17. Scale Up of Scenarios 4 and 5 in US$ Millions ............................................... 53
Table 18. Economic Benefits of Two Scenarios, 5 year scale up ..................................... 54
Table 19. Fiscal Space Analysis for Current National Nutrition Expenditures (2013) .... 55
Table 20. Projected Funding Available for Nutrition 2014-2017 ..................................... 55
Table 21. Preliminary results for costing nutrition-sensitive interventions ...................... 57

vi
List of Figures Figure 1: Prevalence of Stunting & GNI per capita in Nigeria & Selected Countries...…18
Figure 2: State-level prevalence of stunting (2011) and poverty estimates (2009)…...….19
Figure 3: Wealth inequities in child undernutrition…………………………………...…20
Figure 4: Vitamin A supplementation in Nigeria by region, 2003 and 2008…………….21
Figure 5: Rates of return to investment in human capital……………….…………….…24
Figure 6. Scenario 2: Step-wise Scale-Up by Intervention……………………...............44

vii
GLOSSERY OF TERMS
ANC antenatal clinics
ARI acute respiratory infections
BMGF Bill and Melinda Gates Foundation
CCT conditional cash transfers
CIDA Canadian International Development Agency
C-IMCI community-based approach to integrated management of childhood illnesses
CHAI Clinton Health Access Initiative
CMAM community-based management of acute malnutrition
CNPs community nutrition programs
CIFF Children’s Investment Fund Foundation
DALYs disability adjusted life years
EU European Union
FGoN Federal Government of Nigeria
GAIN Global Alliance for Improved Nutrition
GMP growth monitoring and promotion
GNI gross national income
GNP gross national product
HKI Helen Keller International
IFA iron folic acid
IITA International Institute for Tropical Agriculture
LiST Lives Saved Tool
M&E monitoring and evaluation
MAM management of acute malnutrition
MI Micronutrient Initiative
MICS Multiple Indicator Cluster Survey
MoH Ministry of Health
NAFDAC National Agency for Food and Drug Administration
NDHS Nigeria Demographic and Health Survey
NPV net present value
NTD neglected tropical disease
ORS oral rehydration solution
R4D Results For Development
SAM severe acute malnutrition
SMART Standardized Monitoring and Assessment of Relief and Transitions
SOML Saving One Million Lives
UNICEF United Nations Children’s Fund
UHC Universal Health Coverage
USAID United States Agency for International Development
WASH Water, Sanitation and Hygiene
WHO World Health Organization
WINNN Working to Improve Nutrition in Northern Nigeria

viii
GLOSSARY OF TECHNICAL TERMS
Aflatoxins are a group of toxic compounds produced by certain molds, especially
aspergillus flavus, which contaminate stored food supplies such as animal feed, maize
and peanuts. Research shows that human consumption of high levels of aflatoxins can
lead to liver cirrhosis (Kuniholm et al., 2008) and liver cancer in adults (Abt Associates
2014). It is widely understood that there is a relationship between aflatoxin exposure and
child stunting but this relationship has not yet been adequately quantified in the published
literature (Unnevehr and Grace 2013, Abt Associates 2014).
Biocontrol (also called biological control) is the use of an invasive agent to reduce pest
or mold population below a desired level. Aflatoxins can be reduced through biocontrol
and the most effective method involves a single application of a product (such as
AflaSafeTM) containing strains unique to the specific country or location.
Biofortification is the idea of breeding crops to increase their nutritional value. This can
be done either through conventional selective breeding, or through genetic engineering.
A DALY is a Disability Adjusted Life Year, and is equivalent to a year of healthy life
lost due to a health condition. The DALY, developed in 1993 by the World Bank,
combines the years of life lost from a disease (YLL) and the years of life spent with
disability from the disease (YLD). DALYs count the gains from both mortality (how
many more years of life lost due to premature death are prevented) and morbidity (how
many years or parts of years of life lost due to disability are prevented). An advantages of
the DALY is that it is a metric that is recognized and understood by external audiences
such as the WHO and the NIH. It helps to gauge the contribution of individual diseases
relative to overall burden of disease by geographic region or health area. Combined with
cost data, DALYs allow for estimating and comparing the cost-effectiveness of scaling up
nutrition interventions in different countries.
The Lives Saved Tool (LiST) is an estimation tool that translates measured coverage
changes into estimates of mortality reduction and cases of childhood stunting averted.
LiST is used to project how increasing intervention coverage would impact child and
maternal survival. It is a part of an integrated set of tools that comprise the Spectrum
policy modeling system.
Stunting is an anthropometric measure of low height-for-age. It is an indicator of
chronic undernutrition and is the result of prolonged food deprivation and/or disease or
illness. It is measured in terms of Z-score (or standard deviation score; see definition
below) and a child is considered stunted with a height-for-age Z-score of -2 or lower.
Underweight is an anthropometric measure of low weight-for-age. It is used as a
composite indicator to reflect both acute and chronic undernutrition, although it cannot

ix
distinguish between them. It is measured in terms of Z-score (or standard deviation score;
see definition below) and a child is considered underweight with a Z-score of -2 or lower.
Wasting is an anthropometric indicator of low weight-for-height. It is an indicator of
acute undernutrition and the result of more recent food deprivation or illness. It is
measured in terms of Z-score (or standard deviation score; see definition below) and a
child is considered stunted with a Z-score of -2 or lower.
A Z-score or standard deviation score is calculated with the following formula:

x
ACKNOWLEDGMENTS
The authors are grateful to the World Bank for publishing this report as an HNP
Discussion Paper.
This document was produced by a team led by Meera Shekar, with Christine McDonald,
Tuoyo Okorosobo, Ali Subandoro, Max Mattern, Julia Dayton Eberwein, Jonathan
Kweku Akuoku and Wendy Karamba. Erika L. Yanick provided helpful formatting.
The team is very grateful to partners in the Federal Government of Nigeria for their
collaboration in this effort. Without the leadership and commitment of the Federal
Minister of State Dr. Mohammad Ali Pate, and his Senior Advisor Dr. Kelechi Ohiri,
this report would not have been commissioned. And, without the strong support from the
Federal Minister of Health Prof. C.O Onyebuchi Chukwu and Dr. Chris Osa
Isokpunwu, Deputy Director and Head of Nutrition at the Federal Ministry of Health, the
work would not have been completed. The Saving One Million Lives (SOML) team
consisting of Banji Filani, Seyi Ibidapo and Temilade Adelore provided extensive inputs
and support. The report benefitted tremendously from advice and consultations with
several other colleagues from FMOH and NPHCDA who are leading the development of
the Federal Government’s Strategic Plan for Nutrition. The report also benefitted from
comments and suggestions from participants at the IUNS 20th International Congress of
Nutrition Satellite Session on Nutrition Costing in September, 2013 in Granada, Spain.
The Bill and Melinda Gates Foundation was a strong partner with the World Bank in
advancing this work, and provided financial support. Ellen Piwoz from BMGF also
provided valuable technical inputs. Stanley Chitekwe of UNICEF Nigeria facilitated
access to necessary local data. Colleagues from DFID, USAID, Save the Children,
Children’s Investment Fund Foundation (CIFF), Clinton Health Access Initiative (CHAI),
and the EC in Nigeria provided valuable feedback and inputs.
Marty Makinen, Mark Roland, and Milan Thomas of R4D undertook the Fiscal Space
Analysis for health in Nigeria that provided useful inputs for this report. Shunsuke
Mabuchi, Ayodeji O. Odutolu, Karima Saleh and Albertus Voetberg from the World
Bank gave useful comments during the peer review process.
Finally, the team is grateful for the support and guidance from the Nigeria Country
Management Unit, Marie Francoise Marie-Nelly (Country Director), and Trina Haque
HNP Practice Manager.

xi

xii
EXECUTIVE SUMMARY
1. The overall objective of this programmatic Knowledge Product is to support
the Federal Ministry of Health in the Government of Nigeria to develop a costed
scale-up plan for nutrition. This scale-up plan will be complemented with a health-
sector fiscal space analysis financed by the Children’s Investment Fund Foundation
(CIFF) and conducted by Results For Development (R4D). The executive summary is
written for policy makers; it highlights the main findings and discusses the implications
for nutrition policy in Nigeria. The paper itself is more technical in nature and is written
for planners and programmers. The analysis seeks to estimate the potential impact and
allocative efficiency of investments in nutrition, with the goal of guiding Nigeria’s
ongoing nutrition strategic planning process. The report has benefitted tremendously from
a strong partnership with the FMOH and SOML, as well as extensive consultation with
partners such as DFID, UNICEF, USAID, Save the Children, CIFF, CHAI and other
stakeholders in Nigeria.
2. Nigeria is home to the third largest population of chronically undernourished
(stunted) children in the world. Within Nigeria, there is enormous geographic variation
in nutrition outcomes, with the worst malnutrition concentrated in the North-Eastern and
North-Western regions. Vitamin and mineral deficiencies (hidden hunger) are also
pervasive, of which anemia and vitamin A deficiencies are the most prevalent.
3. Malnutrition, particularly in very young children, leads to increased
mortality, greater susceptibility to illness, and long-term effects on cognitive
abilities, resulting in irreversible losses in human capital that contribute to future
losses in economic productivity. Undernutrition is responsible for approximately half of
under-five child mortality and one-fifth of maternal mortality in developing countries, and
children who have been malnourished early in life are more likely to experience cognitive
deficiencies and poor schooling outcomes. Over the long-term, stunting results in 10-17
percent loss of wages, and it is estimated that Nigeria loses over US$1.5 billion in GDP
annually to vitamin and mineral deficiencies alone (Government of Nigeria 2014; World
Bank 2009).
4. At the same time, nutrition interventions are consistently identified as among
the most cost effective development actions, and the costs of scaling up nutrition
interventions are modest. Cost-benefit analysis shows that nutrition interventions are
highly effective (Hoddinott et al 2013; World Bank 2010a). It is estimated that investing
in nutrition can increase a country’s gross domestic product (GDP) by at least 3 percent
annually (Horton and Steckel 2013). Globally, the cost of scaling up key nutrition
interventions across 68 countries is estimated at $10.3 billion per annum, and would
provide preventive nutrition services to about 356 million children, save at least 1.1
million lives and 30 million DALYs, and reduce the number of stunted children by about
30 million worldwide (World Bank 2010a).

xiii
5. This report builds on the global costing exercise to identify country-specific
estimates of the costs and benefits of scaling up key nutrition investments in Nigeria.
It is intended to help guide the development of the National Strategic Plan of Action
for Nutrition, and aims to maximize allocative efficiencies by identifying the most
cost effective package of interventions. The methodology is based on the costing
framework established by Scaling Up Nutrition: What will it cost? (World Bank 2010a),
which is adapted to the country-specific context of Nigeria. By combining costing with
estimates of impact (in terms of DALYs saved, lives saved, and cases of childhood
stunting averted) this report strengthens the “case for nutrition” and guides policy makers
in prioritizing investments in situations where financial and human resources are
constrained. Furthermore, this analysis takes an innovative approach by also exploring the
costs and benefits of selected (albeit not exhaustive) nutrition-sensitive interventions
implemented outside of the health sector.
6. We first estimate the costs and benefits of a nationwide scale up of all ten
nutrition-specific interventions. These ten interventions were selected as a starting point
because they have demonstrated effectiveness in improving child nutrition and have clear
delivery scenarios that allow them to achieve scale. We refer to this as the “full coverage”
scenario, 1 and estimate that it would require an annual public investment of $837 million.
The expected benefits are enormous: over 8.7 million DALYs and 183,000 lives would
be saved annually, while more than 3 million cases of stunting among children under five
would be averted.
7. Given resource constraints, few countries are able to effectively scale-up all
ten nutrition-specific interventions to full national coverage simultaneously. We
therefore consider 5 potential scale-up scenarios based on considerations of burden
of stunting, potential for impact, resource requirements and capacity for
implementation in Nigeria.
Scenario 1: Scale up by region
Scenario 2: Scale up by intervention
Scenario 3: Scale up by state
Scenario 4: Scale up by state and by intervention
Scenario 5: Scale up by levels of program coverage
8. Scenarios 4 and 5 represent the most cost effective means of scaling up, when
measured in terms of cost per DALY saved, cost per life saved and cost per case of
childhood stunting averted. We further refine our analysis by comparing variations
of these scenarios:
Scenario 4a: scale up critical interventions, including community nutrition programs,
micronutrient supplementation, deworming and community-based management of
1 “Full” program coverage levels are 100 percent coverage for all interventions except for the public
provision of complementary food for prevention of moderate acute malnutrition and community-based
management of severe acute malnutrition for which “full” coverage is 80 percent.

xiv
severe acute malnutrition to full program coverage levels in states where stunting
prevalence exceeds 25 percent.
Scenario 4b: scale up critical interventions, including community nutrition programs,
micronutrient supplementation, deworming and community-based management of
severe acute malnutrition in states where stunting prevalence exceeds 35 percent.
Scenario 5a: scale up all 10 interventions to partial coverage levels.2
Scenario 5b: scale up micronutrient and deworming interventions3 to partial coverage
levels in all 36 states, and scale up community nutrition programs and community-
based management of severe acute malnutrition to partial coverage levels in states
where stunting prevalence exceeds 35 percent.
The table below presents estimated costs and benefits for each of these scenarios.
Estimated Costs and Benefits of 5 Scenarios
Recommended
Scenarios
Annual
Public
Investment
(US$
million)
Annual Benefits Cost per Benefit Unit
DALYs
Saved
Lives
Saved
No. of Cases
of Stunting
Averted
DALY
Saved
Lives
Saved
Cases of
Stunting
Averted
Scenario 4a $337 4,694,076 96,092 n/a 66 3,229 n/a
Scenario 4b $271 3,439,969 70,911 n/a 72 3,496 n/a
Scenario 5a $353 4,388,415 96,463 1,434,988 85 3,849 259
Scenario 5b $184 2,256,091 58,519 n/a 82 3,152 n/a
Source: Authors’ calculations.
9. The analysis further identifies three scenarios (4a, 4b and 5a) that have the
potential to significantly improve nutrition outcomes in a highly cost-effective
manner, while also prioritizing the use of scarce resources. Scenario 4b represents the
lowest-cost option, and would scale up critical interventions, including community
nutrition programs, micronutrient supplementation, deworming and community-based
management of severe acute malnutrition in states where the prevalence of stunting
among children under five exceeds 35 percent. Scenario 4a is slightly more expensive,
2 “Partial” program coverage is as follows: 35 percent coverage for public provision of complementary food for
prevention of moderate acute malnutrition and community-based management of severe acute malnutrition; 50 percent
coverage for community programs for growth promotion; 80 percent coverage for therapeutic zinc supplements with
ORS; 90 percent for vitamin A supplements, micronutrient powders, deworming, iron folic-acid supplements for
pregnant women; and 100 percent for iron fortification of staple foods and salt iodization.
3 This includes deworming, vitamin A supplementation, zinc supplementation, multi micronutrient powders, iron
fortification of staple foods and salt iodization

xv
but increases the coverage of these interventions to all states with stunting rates higher
than 25 percent. Scenario 5a is the most expensive of the three proposed scenarios but is
also the most politically attractive: it scales up all interventions in all 36 states, while
focusing primarily on increasing the coverage of low-cost, high-impact interventions such
as micronutrient supplementation.
10. Recognizing the difficulty of scaling up to full coverage in one year, and
following the five-year time frame of the Federal Government’s National Strategic
Plan of Action for Nutrition, we estimate the cost of scaling up these interventions
over five years to be $769 million for scenario 4b, $987 million for scenario 4a, and
$912 million for scenario 5a.4 This is significantly less than the $2.4 billion needed for
the five year scale up of the “full coverage” scenario, but still represents a significant
increase over current spending on nutrition in Nigeria.
11. Scenario 5a is considered a highly attractive investments, with positive
returns on investment and significant additions to economic productivity. 5 When
scaled up gradually over 5 years, this scenarios has the potential to add over US$1 billion
annually to the Nigerian economy over the productive lives of children who would
otherwise have died or become stunted. Moreover, these investments in Nigeria’s human
capital result in a positive net present value (NPV) and internal rates of return (IRR)
exceeding 18 percent.
12. The costs discussed thus far relate to the scale up from current coverage, and
therefore do not take into account the financing necessary to maintain existing
coverage levels, which R4D estimates at approximately US$49 million annually in a
draft fiscal space analysis of nutrition in Nigeria (2014). The R4D analysis also
identifies several sources of “planned” investments for nutrition estimated at about $175
million over the next 4 years. This suggests a planned increase in funding for nutrition of
approximately $126 million over four years. Our analysis predicts financing needs over
five years of between $769 million and $987 million for scaling up under the three
proposed scenarios, resulting in an estimated financing gap of between $543 and $861
million over five years. Therefore, any scale up of nutrition interventions will not only
require additional financing, but also the prioritization of interventions based on need,
cost-effectiveness and allocative efficiencies.
13. While every attempt has been made to use actual program costs in these
estimates, in reality the estimates likely overestimate the costs and underestimate the
benefits. In many cases, actual program costs will be lower than estimated because they
4 For scenarios 4a and 4b we assume that coverage scales up progressively over 5 years, with 20% achieved
in year 1, 40% in year 2, 60% in year 3, 80% in year 4 and 100% in year 5. The scale up of Scenario 5a
matches the assumptions in Nigeria’s National Strategic Plan of Action for Nutrition (NSPAN), and
therefore does not follow the same scale up pattern. For more information on the scale up of Scenario 5a,
please see Chapter IV-B
5 Scenario 5a is the only one for which we were able to calculate NPV and IRR.

xvi
can be added to existing programs. Program experience shows that the incremental costs
of adding to an existing program are lower, as existing implementation arrangements can
be used, thereby containing costs for staffing, operations and training. Moreover, we do
not account for potential savings achieved through expected economies of scale. With
respect to the benefits, given the limitations of the LiST tool, it is only possible to
estimate the benefits of some of the interventions. As a result, we likely underestimate the
potential benefits of scaling up the ten proven nutrition specific interventions.
14. This analysis takes an innovative approach by not only estimating the costs
and benefits of nutrition-specific interventions, but also exploring those of selected
nutrition-sensitive interventions implemented outside of the health sector. While
recognizing that the evidence base for impact of nutrition-sensitive interventions is less
conclusive, we consider four nutrition-sensitive interventions in the agriculture and
education sectors that have shown some potential for improving nutrition outcomes. In
Nigeria, these include biofortification of cassava, aflatoxin control, school-based
deworming, and school-based promotion of good hygiene. The first two of these
interventions would be implemented through the agriculture sector, and the second two
through the education sector. The estimated annual costs are modest: US$25 million for
biofortification of cassava, US$65 million for aflatoxin control, US$8 million for school-
based deworming and US$60 million for school-based promotion of good hygiene.
However, these must be considered rough approximations, as there are significant
limitations in the available data and in the methodological approaches, especially in
contextualizing these global costs to the Nigerian situation. In addition we were not able
to estimate the benefits of these interventions due to data and methodological
shortcomings, although we do report benefits estimated by other reports.
15. Overall, these findings point to a selection of nutrition-specific interventions
and a candidate list of nutrition-sensitive approaches that represent a cost-effective
approach to reducing child malnutrition in Nigeria. Most of the malnutrition that
occurs in the first 1000 days of a child’s life is essentially irreversible. Therefore,
investing in early childhood nutrition interventions offers a window of opportunity to
permanently lock-in human capital and to super-charge the potential demographic
dividend in Nigeria. This fits into the President’s Transformational Agenda for Nigeria
and the government’s flagship Saving One Million Lives (SOML) initiative, which focus
on six pillars, one of which is nutrition. However, despite strong commitments to address
malnutrition, there are currently no financial allocations for nutrition in FGoN’s 2014
budget.
16. Moving forward, these results will be useful to decision makers as they plan
future efforts to scale-up action against malnutrition in Nigeria and develop
nutrition financing plans that bring together the health, education and agriculture
sectors. In the health sector, plans for financing Universal Health Coverage (UHC) and
SOML must include these costs under the nutrition pillar of SOML. There also exist
several opportunities to incorporate these highly cost-effective interventions into the
World Bank’s existing and pipeline investments in Health (e.g. the State Health Project

xvii
and planned support for SOML), agriculture (such as FADAMA III) and education (e.g.
the State Education Project and the Global Partnership on Education).
18
PART I – BACKGROUND
A. COUNTRY CONTEXT
1. With an estimated 163 million inhabitants, Nigeria is the most populous country in
Africa, and despite strong GDP growth that averaged more than 8 percent over the past
decade, Nigeria’s poverty rate remains persistently high (World Bank 2013a). Nigeria
currently ranks 156th out of 187 countries on the Human Development Index, and the estimated
life expectancy is 52 years. In 2010, 46 percent of the population lived below the poverty line, a
prevalence which represents a decline of less than three percentage points since 2004. A recent
World Bank poverty analysis highlighted a combination of two economic patterns at the sub-
national level: i) increased poverty and decreased urbanization in Northern States with most
important economic activities taking place in Southern States; and ii) within the North and South,
Western States perform relatively better than Eastern States (World Bank, 2013a). The same
analysis also showed that the degree of inequality in Nigeria has increased: from 2004 to 2010
the Gini index increased from 0.38 to 0.41.
B. HEALTH AND NUTRITIONAL STATUS IN NIGERIA
2. Nigeria is home to the third largest population of chronically undernourished
children in the world, with an under-five mortality rate of 157 deaths per 1,000 live births, and
an infant mortality rate of 75 per 1,000 (NDHS 2008). These rates remain stubbornly above sub-
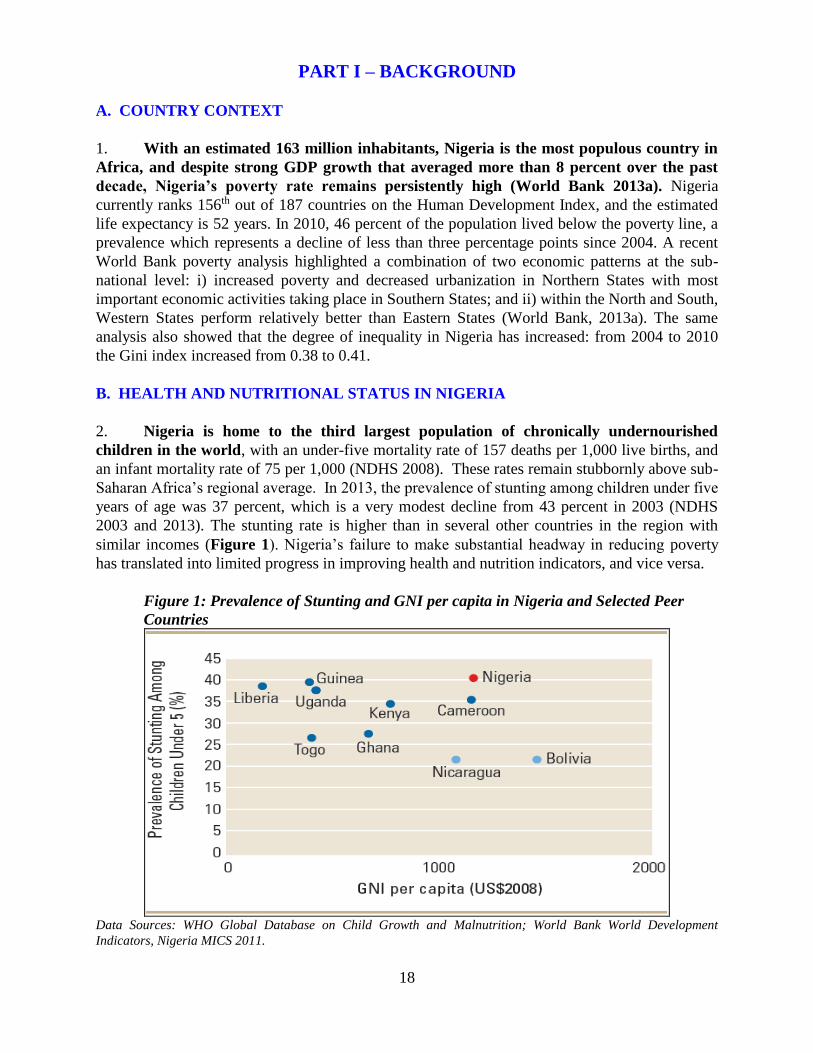
Saharan Africa’s regional average. In 2013, the prevalence of stunting among children under five
years of age was 37 percent, which is a very modest decline from 43 percent in 2003 (NDHS
2003 and 2013). The stunting rate is higher than in several other countries in the region with
similar incomes (Figure 1). Nigeria’s failure to make substantial headway in reducing poverty
has translated into limited progress in improving health and nutrition indicators, and vice versa.
Figure 1: Prevalence of Stunting and GNI per capita in Nigeria and Selected Peer
Countries
Data Sources: WHO Global Database on Child Growth and Malnutrition; World Bank World Development
Indicators, Nigeria MICS 2011.

19
3. There is great regional variation in child stunting and the prevalence of stunting
actually increased in 5 of the 6 regions between 2003 and 2008. The national average masks
dramatic geographical disparities within the country. Figure 2 demonstrates striking disparities
between northern and southern regions, in which all states in North-Eastern and North-Western
have stunting prevalence above 40 percent, whereas the majority of states in the southern
regions have stunting prevalence below 25 percent (Nigeria MICS 2011). The prevalence of
stunting in the North West region is 2.5 times the prevalence in the South East region. In Lagos,
only 8.9 percent of children under five are stunted, whereas in the state of Katsina, the
prevalence is 61.9 percent. The same figure also shows that the disparities in poverty closely
mirror the disparities in malnutrition, but the patterns are not identical. Many states with
relatively lower poverty rates (i.e. Niger, Ondo, and Oyo) still have high rates of stunting. Child
wasting (low weight-for-height) rates, which reflect acute nutritional deficits that are often
compounded by infection or disease, are also highly variable by state: in FCT (Abuja) the
prevalence is 3.4 percent, whereas in Borno, it is 18.7 percent.
Figure 2. State-level prevalence of stunting (2011) and poverty estimates (2009)
Source: Poverty map from World Bank, 2013; Stunting map created from sub-national stunting data from Nigeria
MICS 2011.

20
4. Inequities in child undernutrition across wealth quintiles are also pronounced in
Nigeria. Stunting rates in the poorest households (52 percent) are more than twice those in
the richest households (24 percent) (Figure 3). However, while stunting rates are highest
among the poorest quintile, somewhat surprisingly even in the richest households, nearly one-
quarter of children are stunted. This shows that while poverty is associated with stunting, other
factors are also involved. Non-food influences, such as informational asymmetries, disease and
optimal feeding and caregiving practices have a major role to play in causing malnutrition.
Figure 3. Wealth inequities in child undernutrition
0 10 20 30 40 50 60
Poorest
Second
Middle
Fourth
Richest
% Stunting Among Children Under 5
We
alth
qu
inti
le
Source: NDHS 2008
5. Vitamin and mineral deficiencies (hidden hunger) and are also pervasive in Nigeria.
It is estimated that 30 percent of Nigerian children under five and 20 percent of pregnant women
are vitamin A deficient (Maziya-Dixon et al. 2006). Vitamin A deficiency increases child
mortality, increases vulnerability to infectious diseases such as measles and leads of blindness
among children under five years-old. Coverage of vitamin A supplementation is low in Nigeria,
with only 65.2 percent of children 6-59 months of age receiving a supplement in the past six
months (Nigeria MICS 2011).6 Data from DHS 2008 indicates even lower vitamin A coverage
(26 percent) and the coverage actually decreased from 34 percent in 2003 (Figure 4).7 Given the
strong evidence that high coverage with twice-annual doses of Vitamin A supplementation has
the potential to reduce child mortality by 23 percent on average, this is a lost opportunity. The
most recent data available indicate that 76 percent of preschool-aged children and 67 percent of
pregnant women are anemic, with approximately half of all anemia caused by inadequate dietary
intake of iron, and the rest due to infections and parasites. One in five households does not
consume adequately iodized salt (), thereby predisposing these children to IQ losses of up to 13
points, increasing the risk of still births, and wasted pregnancies.
6 There is a discrepancy between the DHS (2008) and the MICS (2011).
7 No data available on children who received twice-annual doses so this indicator is used as a proxy.

21
Figure 4: Vitamin A supplementation in Nigeria by region, 2003 and 2008.
Source: Nigeria DHS, 2008
6. Another health burden in Nigeria is the high levels of aflatoxins, which are naturally
occurring carcinogenic (cancerous) by-products of common fungi that grow on crops such
as maize and peanuts. A recent review of published articles shows that the mean level of
aflatoxin contamination in maize and groundnuts in Nigeria is well above safe levels (Abt
Associates 2014) and well above levels in other African countries (Liu and Wu, 2010).
Groundnut contamination is generally higher in the south and maize contamination is higher in
the north and west. Evidence shows that consumption of high levels of aflatoxins can lead to
liver cirrhosis (Kuniholm et al., 2008) and liver cancer in adults (Abt Associates 2014). Further,
it is widely understood that there is a relationship between aflatoxin exposure and child stunting,
albeit the evidence base is more tentative, and this relationship has not yet been adequately
quantified in the published literature (Unnevehr and Grace 2013, Abt Associates 2014). Using
data on aflatoxin exposure and growth from other countries, one study estimated that up to 4.4
million children in Nigeria become stunted from consuming maize and groundnuts that are
contaminated with aflatoxin (Khlangwiset 2011). Almost 8,000 deaths/year from liver cancer in
Nigeria are attributed to aflatoxin exposure, resulting in over 100,000 lost DALYs. This
translates into a monetized impact of between 0.2 percent and 1.6 percent of Nigeria’s GDP (Abt
Associates 2014). While the evidence on the links between aflatoxins and child stunting is still
tentative, the links with liver cancer are well established, and provide sufficient impetus for
actions to control aflatoxin exposure in Nigeria.
7. Approximately 87,100 children under five die each year in Nigeria from diarrhea.
Nearly 90 percent is directly attributed to poor water, sanitation and hygiene (World Bank
2012). Diarrheal episodes exacerbate the relationship between malnutrition and infection, as

22
children tend to eat less, absorb fewer nutrients and reduced resistance to infections. Prolonged
diarrheal episodes lead to impaired growth and development (Ejemot et al. 2006). Poor sanitation
is also a contributing factor – through its impact on malnutrition rates – to other leading causes of
child mortality including malaria, acute respiratory infections, and measles.
8. In Nigeria, 45 percent of school-age children, totaling nearly 12 million, are
estimated to be infected with parasitic intestinal worms (helminthic infections). In the short
term, helminthic infections potentially cause anemia, increase morbidity, undernutrition and
impairment of mental and physical development (Hotez et al. 2008). In the long term, infected
children are estimated to have an average IQ loss of 3.75 points per child and they earn less as
adults (43 percent) than those who grow up free of worms (Bleakley 2007).
C. THE IMPORTANCE OF INVESTING IN NUTRITION
9. Undernutrition is an underlying cause of approximately half of deaths (3.1 million)
in children under five and one-fifth of maternal deaths in developing countries. The joint
effect of suboptimum breastfeeding and fetal growth restriction in neonatal period alone
contributes 1.3 million deaths or 19 percent of all deaths of children under five (Black et al.
2013). Undernourished children are more likely to die from common childhood illnesses such
as diarrhea, measles, pneumonia, malaria or HIV/AIDS.
10. For those malnourished children who survive, there are long-lasting health and
schooling consequences, including cognitive deficits and poorer schooling outcomes.
Children with impaired cognitive skills have lower school enrollment, attendance and graduation,
which in turn results in lower productivity, earnings and economic well-being. Stunted children
lose 0.7 grades of schooling, and are more likely to drop out of school. Iodine deficient children
lose on average 13 IQ points and iron deficiency anemia reduces performance on tests by 8 IQ
points, making them less educable (World Bank 2006). Behrman and colleagues (2009) showed
improved schooling and test scores from participation in nutrition programs in early childhood.
11. In Nigeria, being underweight in the early years of life accounts for 8 percent of
Disability-Adjusted-Life-Years (DALYs). This was the biggest risk factor affecting DALYs,
with micronutrient deficiencies and suboptimal breastfeeding also among the 15 highest risk
factors (Murray et al. 2013). The DALYs lost from Vitamin A deficiency in Nigeria is nearly
800,000 annually, with virtually all losses occurring in children under five years of age
(Menakshi et al. 2010).
12. Malnutrition costs developing countries billions in lost revenue through reduced
economic productivity, particularly through lower wages, lower physical and mental
capabilities and more days away from work as a result of illness. Childhood stunting is
estimated to reduce at least 10 percent of potential lifetime earnings (World Bank 2006). Other
studies have shown that a 1 percent loss in adult height results in a 2–2.4 percent loss in
productivity (Caulfield et al. 2004, Strauss and Thomas 1998). In addition, micronutrient
deficiencies in childhood and adulthood have tremendous economic cost. Childhood anemia
alone is associated with a 2.5 percent drop in adult wages. Anemia in adults has been estimated
to be equivalent to 0.6 percent of GDP, and goes up to 3.4 percent when including the secondary
effects of retarded cognitive development in children (Horton 1999). Horton and Ross (2003)
estimate that eliminating iron-deficiency anemia would result in a 5–17 percent increase in adult

23
productivity. Collectively, micronutrient deficiencies alone in Nigeria add up to an estimated
loss of over US$1.5 billion in GDP every year (World Bank 2010b). The economic costs of
undernutrition affect the most vulnerable and the poorest in the developing world. A recent
analysis estimates these losses at 11 percent of GDP in Africa and Asia each year (Horton and
Steckel 2013). This equals about $149 billion of productivity losses.
13. Investing in early childhood nutrition interventions has the potential to super-
charge the potential demographic dividend in Nigeria. Demographic dividend refers to the
growth in a country’s economy resulting from changes in the age structure leading to a youth
bulge and reduced dependency ratios in the population. This dividend is more likely to be
realized if these cohorts are better nourished and productive. By increasing investment in human
capital as fertility rates decline, Nigeria could potentially harness the demographic dividend by:
(i) increasing GDP by nearly 50 percent and sustain that gain indefinitely; (ii) raise per capita
incomes by 30 percent or more by 2030, and (iii) lift around 32 million additional people out of
poverty by 2030 (Bloom et al. 2010).
14. Most of the malnutrition that occurs in the first 1000 days of a child’s life is
essentially irreversible. Therefore, the window of opportunity for preventing malnutrition
is the first 1000 days between pregnancy and two years of age. After that age, most actions
are too little, too late and too expensive (World Bank 2006; Black et al. 2008, 2013). Figure 5
shows that the rates of return from nutrition investments are highest for programs targeting
towards the earliest years since these investments build a foundation for future learning and
productivity, prevent irreversible losses, and lock-in human capital for life (Heckman and
Masterov 2004).

24
Figure 5. Rates of return to investment in human capital
Source: Heckman and Masterov (2004)
15. Malnutrition and poverty are interrelated and exacerbate each other. A recent study
(Hoddinott et al. 2011) concludes that individuals who are not stunted at 36 months are one-third
less likely to live in poor households as adults. Poverty increases the risk of malnutrition by
lowering poor households’ purchasing power, reducing access to basic health services, and
exposing them to unhealthy environments, thereby compromising food intakes (both quality and
quantity), and increasing infections. Poor households are also more likely to have frequent
pregnancies, larger family sizes with high dependency ratios, more infections and increased
health-care costs. Conversely, malnutrition causes poor health status, poor cognitive
development and less schooling, resulting in in poor human capital and long-term productivity
losses. However, as Figure 2 shows, while child stunting rates are highest among the poorest
two quintiles in Nigeria, even among the richest quintile nearly 25 percent children are stunted.
This suggests a need to design somewhat different strategies to address undernutrition among the
poorest, vs those among the non-poor.
16. Nutrition interventions are consistently identified as cost effective development
actions and the costs of scaling up nutrition interventions are modest. Hoddinott and
colleagues (2013) estimated that for every dollar invested in programs to reduce stunting would
generate between $24.4 and $26.6 in economic returns. Others have estimated global benefit-
cost ratios for integrated child care programs to be between 9 and 16; for iodine supplementation
for women, between 15 and 520; for vitamin A supplementation for children under 6 years,
between 4 and 43; for iron supplementation for pregnant women, between 6 and 14; and for iron
fortification per capita, between 176 and 200 (World Bank 2010). A recent World Bank
publication estimated that investing in nutrition can increase a country’s gross domestic product
(GDP) by at least 3 percent annually. The same study estimated these investment costs at $10.3
billion per annum globally, to be financed through domestic public and private sector and donor
resources (World Bank 2010a). These investments would provide preventive nutrition services to

25
about 356 million children, save at least 1.1 million lives and 30 million DALYs, and reduce the
number of stunted children by about 30 million worldwide. Bhutta et al. (2013) came up with
very similar estimates. In another study, Hoddinott, Rosegrant and Torero (2012) estimate that,
for just $100 per child, interventions including micronutrient provision, complementary foods,
treatments for worms and diarrheal diseases, and behavior change programs, could reduce
chronic under-nutrition by 36 percent in developing countries. Clearly there is huge potential
pay-off from dedicating more resources to the scale-up of evidence-based, cost-effective nutrition
interventions.
D. A MULTI-SECTORIAL APPROACH FOR IMPROVING NUTRITION
17. The determinants of malnutrition are multi-sectorial. Therefore, to successfully and
sustainably improve nutrition outcomes, a multi-sectorial approach is needed. At a
proximate level, access to food, health, hygiene and adequate child care practices are key to
reducing malnutrition. At a more distal level, poverty, women’s status and other social factors
play an important role. It has been demonstrated that direct actions to address the proximate
determinants of malnutrition can be further enhanced by action on some of the more distal levels.
For example, programs supporting improved infant and young child feeding practices will be
more effective if they are complemented with programs to address gender issues through, for
example, the reduction of women’s workloads, thus allowing women more time for childcare.
Similarly, conditional cash transfer programs that target the poor, if designed appropriately, have
the potential not just to address poverty, but also to increase demand for nutrition services and
good nutrition behaviors.
18. While the health sector is key in delivering “nutrition-specific” interventions to the
poor (such as Vitamin A supplementation or deworming), multisectoral “nutrition-
sensitive” actions through agriculture sector, social protection, water and sanitation and
poverty reduction programs have the potential to strengthen nutritional outcomes in
several ways. Examples of these include: (a) improving the context within which the nutrition-
specific interventions are delivered, for example through investment in food systems,
empowerment of women and equitable education; (b) integrating nutrition considerations into
programs in other sectors as delivery platforms (such as conditional cash transfer programs) that
will potentially increase the scale and coverage of nutrition-specific interventions,; and (c) by
increasing “policy coherence” through government-wide attention to policies or strategies and
trade-offs, which may have positive or unintended negative consequences on nutrition. The
synergy with other sectors is critical to break the cycle of malnutrition and sustain the gains from
direct nutrition-specific interventions (World Bank 2013b).
19. There is currently very limited guidance on costing for nutrition-sensitive
interventions for at least two reasons. First, evidence on effectiveness of “nutrition-sensitive”
interventions with respect to nutritional outcomes is limited. Second, compared with nutrition-
specific interventions, estimating and attributing the costs of nutrition-sensitive interventions is
more complex since these interventions have multiple objectives, improved nutrition outcomes
being only one of them. Notwithstanding these limitations, the availability of costing information
is crucial to assess cost effectiveness of these interventions, and this paper makes a first-ever
attempt to address these issues.

26
20. We identify and cost four selected nutrition-sensitive interventions that are relevant
for scale-up in the Nigerian context, for which there is evidence of the positive impact on
nutrition outcomes, and for which there is some cost information. These include two
interventions delivered through the agriculture sector—biofortification of cassava and aflatoxin
reduction through biocontrol intervention—and two delivered through the education sector—
school-based deworming and school-based promotion of good hygiene. Other potential
nutrition-sensitive interventions include the reduction of women’s work-loads through
appropriate technologies in agriculture, social safety nets and conditional cash transfers targeted
to the poor and designed to have an impact on nutrition outcomes, and water and sanitation
programs that reduce the exposure to infections and childhood diseases.
21. Biofortification has the potential to reduce micronutrient deficiencies in a highly
cost-effective manner. Biofortification uses plant breeding techniques to enhance the
micronutrient content of staple foods. Evaluation of the orange-flesh sweet potato
biofortification program in Uganda and Mozambique showed high farmer adoption, significant
increase in vitamin A intakes and improvement of child vitamin A status (Arimond et al, 2011;
Hotz et al. 2010). An ex-ante cost study of biofortification in 14 countries suggests that most cost
per DALY averted fall in the “highly” cost-effective category, particularly in South Asia and
Africa (Menakshi et al. 2010). A recent study by HarvestPlus that ranked countries using
country-level data according to their suitability for investment in biofortification interventions
identified Nigeria as “top priority” country for benefiting from biofortification (Asare-Marfo et
al. 2013).
22. Nigeria formally launched biofortified cassava to address vitamin A deficiency in
2012. Cassava is one of the four most important staple foods (along with rice, maize and wheat)
in the country. In 2013, three new cassava varieties are being introduced to 50,000 farmers
household in Nigeria and could reach as many as 2 million farmers in the next three years. The
three launched varieties have the potential to meet 25 percent of the daily vitamin A needs of
consumers. Collaborating with HarvestPlus, the government will continue to work with farmers
and the private sector to significantly scale up vitamin A-biofortified cassava dissemination.
23. Biocontrol of aflatoxins has the potential to reduce aflatoxins in maize and
groundnuts by at least 80-90 percent (Bandyopadhyay and Cotty 2013). Field testing of
biocontrol products in Burkina Faso, Kenya, Nigeria and Senegal, although not formally
published, is producing extremely positive results. The method involves a single application of a
product (AflaSafeTM) containing strains unique to that country. Efforts are already underway in
Nigeria to build on this experience and expand the use of biocontrol products to control
aflatoxins (Abt Associates 2014).
24. School-based deworming has been proven to be an efficient and cost-effective
intervention to address health and nutrition outcomes, with cost per DALY saved estimated
at US$4.55 (J-PAL 2012). The cost of delivering deworming tablets through schools is
inexpensive because it uses the existing infrastructure and delivery platforms in schools and
community links with teachers. Teachers only need minimal training to safely administer the
delivery, thus it does not add significantly to teachers’ workloads. The delivery costs of school-
based deworming in schools are about $0.04 per treatment (Guyatt 2003), yet the benefits are
enormous. Bi-annual deworming significantly increased school attendance and reduced self-
reported illness and anemia, while providing modest gains in height-for-age Z-scores in Kenya

27
(J-PAL 2012). Evidence from India also suggests that deworming has the potential to reduce
cases of childhood stunting and underweight (Awasthi et al, 2013). In the long term, deworming
improved self-reported health, increased total schooling years, and increased earnings by 20
percent (Baird et al 2011).
25. School-based deworming in Nigeria is included in integrated Neglected Tropical
Diseases (NTD) control policy and plan, a school health policy and school feeding
guidelines. In early 2013, Nigeria launched a multi-year national plan for the control and
elimination of NTDs (NTD Master Plan). The NTD Master Plan provides a platform for Nigeria
to stimulate global efforts to reach elimination and control of diseases under the London
Declaration and the Millennium Development Goal 6. Nigeria’s NTD plan, worth $332 million,
will provide treatment for more than 60 million people annually over the next five years. In late
2012, Nigeria received a donation of 23,025 million tablets to support the scale-up of treatment
to combat NTDs. The donated tables will be sufficient to treat nearly eight million school
children and adults in 12 states.
26. Improved hygiene behaviors through promotion of hand-washing and good hygiene
behavior would decrease the risk of stunting in one in three children. Correct hand washing
at critical times can reduce diarrhea by 42 -47 percent and lower the incidence of diarrhea for
children by 53 percent and reduce the incidence of acute respiratory infections (ARI’s) by 44
percent (World Bank 2012). A recent campaign promoting hand washing with soap in primary
schools in Egypt, China and Colombia demonstrated significant reduction in absenteeism related
to diarrhea and respiratory-illness (UNICEF 2012). A study in Brazil showed a relationship
between the effects of early childhood diarrhea on later school readiness and school performance,
revealing the potential long-term human and economic costs of early childhood diarrhea (Lorntz
et al. 2006).
27. Effectiveness of promoting good hygiene behavior in schools is demonstrated by its
long terms impact and broad effect on communities. Schools are ideal settings for hygiene
education, where children can learn and sustain lifelong proper hygiene practices through peer-
to-peer teaching, classroom sessions with focused training materials and role-playing or
interactive songs. A study on the long-term effect of hygiene education program for both adults
and children found that hygiene behaviors are sustained beyond the end of an intervention. The
study also found that educated students can also influence family members by sharing this
information, which may in turn affect behavior change at the community level (Bolt and
Cairncross 2004).
E. PARTNER EFFORTS TO ADDRESS MALNUTRITION IN NIGERIA
28. Many partners are supporting the Federal Ministry of Health to address
malnutrition in Nigeria and most of the interventions are in the north where malnutrition
is most severe. Partners include UNICEF, DFID, Helen Keller International (HKI),
Micronutrient Initiative, Save the Children UK, Global Alliance for Improved Nutrition (GAIN),
Action Against Hunger, Valid International and Food Basket International (Government of
Nigeria 2014). UNICEF implements nutrition programs in 36 states and mainly provides support
for Infant and young child feeding, micronutrient deficiency control and treatment of severe acute
malnutrition through Community Management of Acute Malnutrition (CMAM). DFID supports
the Working to Improve Nutrition in Northern Nigeria (WINNN) program which provides key

28
services to children under five in five states in Northern Nigeria. Interventions include
community-based management of acute malnutrition, vitamin A supplementation and
deworming, and promotion of improved infant and young child feeding practices. Nigeria is a
priority country for Save the Children's Global Child Survival Campaign and Save the Children
UK supports the Katsina State Ministry of health. GAIN works with the National Agency for
Food and Drug Administration (NAFDAC) to fortify wheat and maize flour with iron, vegetable
oil with vitamins A and B and sugar with vitamin A. (Appendix 1 provides a list of region- and
state-specific partner interventions.)

29
PART II – RATIONALE AND OBJECTIVES FOR DEVELOPING A SET
OF COSTED SCALE-UP SCENARIOS FOR NIGERIA
29. The overall objective of this programmatic Knowledge Product (KP) is to support
the Government of Nigeria to develop a costed scale-up plan for nutrition. This scale-up
plan will be complemented with a health-sector fiscal space analysis financed by the
Children’s Investment Fund Foundation (CIFF), conducted by Results For Development
(R4D). These efforts will provide the Government of Nigeria with the tools needed to leverage
adequate resources from their domestic budgets, as well as from development partners in support
of the costed scale-up plan. Within this context, the objectives of this analysis are as follows:
i. To estimate scale-up costs in Nigeria for a set of well-proven nutrition-specific
interventions that have the potential to be scaled-up through tested delivery mechanisms;
ii. To conduct a basic economic analysis to calculate the potential benefits and cost
effectiveness associated with the proposed scale up;
iii. To propose a series of scenarios for a costed scale-up plan that rolls out this package of
nutrition-specific interventions in phases, based on considerations of impact, geography,
implementation capacity and costs;
iv. Explore initial costs for a limited number of nutrition-sensitive interventions through the
agriculture and education sectors.
30. While the economic arguments for increasing investments in nutrition are sound,
one of the first questions raised by key decision-makers in any country is “How much will
it cost?” In 2010, the World Bank spearheaded a study, Scaling Up Nutrition: What will it Cost?
to answer that question at the global level. The analysis estimated the level of global financing
required to scale up 10 evidence-based nutrition-specific interventions in 36 countries that
account for 90 percent of the world’s stunting burden and 32 smaller countries which also have a
high prevalence of undernutrition. The results of the study highlighted the global financing gap,
underscored the importance of investing in nutrition at the global level, and laid out a
methodology for estimating the costs for nutrition-specific interventions. However, these global
estimates did not capture the nuances and context in each country, nor were these estimates
contextualized to every individual country’s policy and capacity setting or its fiscal constraints.
This report builds on the early work to address this gap, and contextualize the cost estimates for
Nigeria.
31. Further, the multisectoral approach requires nutrition-sensitive approaches or
interventions that can be delivered through other sectors. As discussed above, there is
currently very limited guidance on costing for nutrition-sensitive interventions. Therefore, this is
an exploratory analysis, to be used primarily to engage other sectors in planning for nutritional
outcomes. This initial exercise will contribute to a broader discussion about methodological and
other issues for costing nutrition-sensitive interventions, and will thereby encourage the
formulation of standard definitions, methodologies and guidance for costing these interventions
in the future.
30
PART III – METHODOLOGY
A. SCOPE OF THE ANALYSIS AND DESCRIPTION OF THE INTERVENTIONS
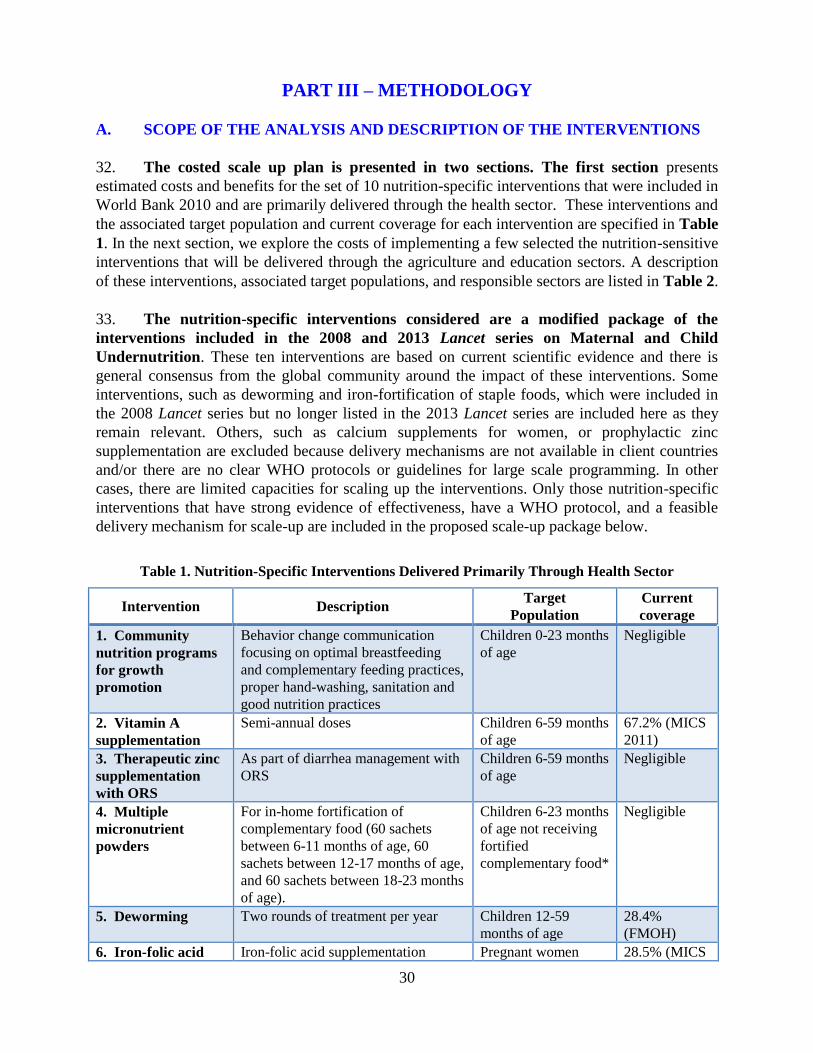
32. The costed scale up plan is presented in two sections. The first section presents
estimated costs and benefits for the set of 10 nutrition-specific interventions that were included in
World Bank 2010 and are primarily delivered through the health sector. These interventions and
the associated target population and current coverage for each intervention are specified in Table
1. In the next section, we explore the costs of implementing a few selected the nutrition-sensitive
interventions that will be delivered through the agriculture and education sectors. A description
of these interventions, associated target populations, and responsible sectors are listed in Table 2.
33. The nutrition-specific interventions considered are a modified package of the
interventions included in the 2008 and 2013 Lancet series on Maternal and Child
Undernutrition. These ten interventions are based on current scientific evidence and there is
general consensus from the global community around the impact of these interventions. Some
interventions, such as deworming and iron-fortification of staple foods, which were included in
the 2008 Lancet series but no longer listed in the 2013 Lancet series are included here as they
remain relevant. Others, such as calcium supplements for women, or prophylactic zinc
supplementation are excluded because delivery mechanisms are not available in client countries
and/or there are no clear WHO protocols or guidelines for large scale programming. In other
cases, there are limited capacities for scaling up the interventions. Only those nutrition-specific
interventions that have strong evidence of effectiveness, have a WHO protocol, and a feasible
delivery mechanism for scale-up are included in the proposed scale-up package below.
Table 1. Nutrition-Specific Interventions Delivered Primarily Through Health Sector
Intervention Description Target
Population
Current
coverage
1. Community
nutrition programs
for growth
promotion
Behavior change communication
focusing on optimal breastfeeding
and complementary feeding practices,
proper hand-washing, sanitation and
good nutrition practices
Children 0-23 months
of age
Negligible
2. Vitamin A
supplementation
Semi-annual doses Children 6-59 months
of age
67.2% (MICS
2011)
3. Therapeutic zinc
supplementation
with ORS
As part of diarrhea management with
ORS
Children 6-59 months
of age
Negligible
4. Multiple
micronutrient
powders
For in-home fortification of
complementary food (60 sachets
between 6-11 months of age, 60
sachets between 12-17 months of age,
and 60 sachets between 18-23 months
of age).
Children 6-23 months
of age not receiving
fortified
complementary food*
Negligible
5. Deworming Two rounds of treatment per year Children 12-59
months of age
28.4%
(FMOH)
6. Iron-folic acid Iron-folic acid supplementation Pregnant women 28.5% (MICS

31
supplementation during pregnancy 2011)
7. Iron fortification
of staple foods
Fortification of wheat flour with iron General population Negligible
8. Salt iodization Iodization of centrally-processed salt General population 77.5% (MICS
2011)
9. Public provision
of complementary
food for prevention
of moderate acute
malnutrition
Provision of a small amount (~250
kcals per day) of nutrient-dense
complementary food for the
prevention of moderate malnutrition
(moderate acute malnutrition and/or
moderate stunting)
Twice the prevalence
of underweight
(WAZ < -2) among
children 6-23 months
of age*
Negligible
10. Community-
based management
of severe acute
malnutrition
Includes the identification of severe
acute malnutrition, community or
clinic-based treatment (depending on
the presence of complications), and
therapeutic feeding using ready-to-
use therapeutic food
Incidence (estimated
as twice the
prevalence) of severe
wasting (WHZ <-3)
among children 6-59
months of age
34.5% (data
from 11 states
provided by
UNICEF)
34. In the follow-on section, the analysis focuses on nutrition-sensitive interventions that
have the potential to have an impact on nutrition outcomes. As discussed above, there is not
as much evidence-based research on nutrition-sensitive interventions as there is for nutrition
specific interventions. Therefore, our estimates are exploratory and are limited to four potential
interventions that can be scaled up and have potential for impact on nutrition outcomes.
Additional interventions were not included in these initial estimates because the impact on
nutrition is yet to be clearly documented (Masset et al. 2011; World Bank 2013; Ruel et al.
2013), and because this is an exploratory instead of an exhaustive effort. Furthermore, cost
attribution is complex because these interventions are designed for multiple purposes.
Table 2. Multi-Sectorial, Nutrition-Sensitive Interventions – an exploratory process
Intervention Description Target Population Potential for
impact
Interventions to be delivered through the agricultural sector
Biofortification Promote use of vitamin A-rich
cassava varieties to 50,000 farming
households in 2013 and potentially
expanded to 1.8 million farmers
General population Increase in vitamin
A intakes and
improve vitamin A
status (Hotz 2012a,
2012b)
Aflatoxin control Promote use of biocontrols such as
AflaSafeTM for maize and
groundnuts
General population Improve child
nutrition status
(stunting) and
reduce morbidity
(Khlangwiset and
Wu 2011)
Interventions to be delivered through the education sector
School-based
deworming
Distribution of
mebendazole/albendazole to
school-age children and training to
school teachers, community
workers and health workers
School-aged
children
Reduce anemia and
morbidity, improve
cognitive outcomes
(Miguel and Kremer
2004)

32
School-based
promotion of good
hygiene
Hygiene education program to
teach healthy practices in schools
School-aged
children
Improve child
nutrition outcomes
(stunting)(Spears
2013)
B. ESTIMATION OF TARGET POPULATION SIZES, CURRENT COVERAGE
LEVELS AND UNIT COSTS
35. Target population estimates are based primarily on demographic data obtained from the
Federal Ministry of Health and UNICEF Nigeria and are provided in Appendix 2. UNICEF
Nigeria projected the sizes of the various subgroups at the state level in 2013 using data from
Nigeria’s National Population Commission. The prevalence of child stunting (height-for-age Z-
score <-2), underweight (weight-for-age Z-score <-2), and severe wasting (weight-for-height Z-
score <-3) among children under five years of age in each state were obtained from the 2013
Nigeria MICS survey data.
36. Data on current coverage levels for interventions was obtained from various sources.
Current coverage levels for community nutrition programs for behavior change communication,
zinc supplementation with ORS, multiple micronutrient powders for home fortification, iron
fortification of staple foods, and provision of complementary food for the prevention of moderate
malnutrition were set to zero percent either because the intervention was not being implemented
and coverage was very minimal or because current reliable data were not available. Coverage
data for vitamin A supplementation were obtained from the 2011 Nigeria MICS report. Data on
deworming coverage were from programmatic data from the first round of MNCH weeks in 2012
as reported by the Federal Ministry of Health (FMOH). For coverage of iron folic acid
supplementation for pregnant women, MNCH programmatic data from the FMOH were used for
all states. The 2011 Nigeria MICS survey data were used to estimate the proportion of
households consuming adequately iodized salt in each state. Finally, UNICEF provided data on
the number of children treated for severe acute malnutrition in the 11 states where programs for
Community Management of Acute Malnutrition (CMAM) supported by the Children Investment
Fund Foundation (CIFF) are in operation. Data from the more recent semi-annual SMART
surveys were explored, but were considered unsuitable for these purposes because of concerns
about validity.8 Preliminary results from the Nigeria DHS 2013 provided estimates of the
current incidence of severe acute malnutrition and moderately acute malnutrition. We also used
the DHS 2013 to classify the states according to levels of stunting
37. Whenever possible, the unit costs of the nutrition-specific interventions were
estimated using programmatic data that were provided by local implementing partners, the
Federal Ministry of Health, and state governments based on program experience. The
estimated unit costs and the delivery platforms are listed in Table 3. In cases where the
intervention was not yet being implemented or local data were not available, the global unit cost
estimate from the World Bank (2010a) was used. A complete index of data sources and relevant
assumptions for these interventions can be found in Appendix 3.
8 For example, the state-levels estimates of stunting (a long-term measure of malnutrition) varied tremendously from
one semi-annual survey to the next. Even with changes to the growth reference used, erratic patterns remained and
could not be reconciled.

33
Table 3. Unit Costs and Delivery Platforms Used in the Calculations for Nutrition-specific
Interventions
Intervention
Unit Cost
(US$ per beneficiary
per year)
Costed Delivery Platform
1. Community nutrition programs
for growth promotion of children* $5.00
Community nutrition
programs
2. Vitamin A supplementation for
children* $0.44 MNCH weeks
3. Therapeutic zinc
supplementation with ORS for
children*
$0.86 MNCH weeks
4. Multiple micronutrient powders
for children** $3.60
Community nutrition
programs
5. Deworming for children* $0.44 MNCH weeks
6. Iron-folic acid supplementation
for pregnant women*
$1.79 (MNCH weeks)
$2.00 (community nutrition
programs)
40% via MNCH weeks
60% via Community nutrition
programs
7. Iron fortification of staple foods
for general population** $0.20 Market-based delivery system
8. Salt iodization for general
population** $0.05 Market-based delivery system
9. Public provision of
complementary food for prevention
of moderate acute malnutrition in
children**
$51.10 Community nutrition
programs
10. Community-based management
of severe acute malnutrition in
children *
$80.00
Primary health care and
Community Nutrition
programs
*denotes unit cost based on cost data from Nigeria.
** denotes unit cost based on global estimates.
38. For the nutrition-sensitive interventions, the unit costs were estimated using global
estimates with the exception of aflatoxin control. The unit cost for aflatoxin per hectare comes
from the International Institute for Tropical Agriculture (IITA) in Nigeria (Bandyopadhyay
2013). The other interventions are not yet implemented and no programmatic data are available
from local implementing partners so the only data available are global data. The unit costs and
the delivery platforms are listed in Table 4.
Table 4. Unit Costs and Delivery Platforms Used in the Estimations for selected nutrition-sensitive
Interventions
Intervention
Unit Cost
(US$ per beneficiary
per year)
Costed Delivery Platform
1. Biofortification of vitamin A-rich
yellow cassava n/a Agriculture production
2. Aflatoxin control through
biocontrol application $15.60 per hectare Agriculture production
3. School-based deworming $0.08 School-based deworming

34
distribution
4. School-based promotion of good
hygiene $2.00 Hygiene education campaign
C. ESTIMATION OF COSTS AND BENEFITS
39. The “program experience” methodology employed in World Bank (2010a is used for calculating the cost of scaling up in Nigeria. The “program experience” approach generates unit cost data that capture all aspects of service delivery (e.g. costs of commodities, transportation and storage, personnel, training, supervision, monitoring and evaluation, relevant overhead, wastage etc.) for each intervention from actual programs that are in operation in Nigeria and considers the context in which they are delivered. Another commonly used method is the “ingredients approach” in which selected activities are bundled into appropriate delivery packages (for example, number of visits to a health center) (e.g. in Bhutta et al. 2013). Although the “program experience” approach tends to yield cost estimates that are higher than the “ingredients approach,” the estimates more accurately reflect real programmatic experience, including inefficiencies in service delivery. It should, however, be noted that the calculated costs are reported in financial or budgetary terms. They do not capture the full social resource requirements, which account for the opportunity costs of the time committed by beneficiaries accessing the services.
40. We calculate the annual public investment required to scale up the interventions as
follows:
where:
Y = annual public investment required to scale up to full coverage
= additional total cost to scale up to full coverage
= additional cost for capacity development, M&E, and technical assistance
= cost covered by households living above poverty line for selected interventions
Appendix 4 describes the methodology in detail.
The expected benefits from scaling up nutrition interventions are calculated in terms of: (i)
DALYs saved; (ii) number of lives saved; (iii) cases of childhood stunting averted; and (iv)
increased program coverage. To calculate the number of DALYs, we use the method employed
by Black et al. (2008) to estimate the averted morbidity and mortality from scaling up different
nutrition interventions. The method uses population attributable fractions (PAF) based on the
comparative risk assessment project (Ezzati et al. 2004; Ezzati et al. 2002) to estimate the burden
of infectious diseases attributable to different forms of undernutrition using most recent Global
Burden of Disease study (2010). DALY estimates in this study are neither discounted nor age-
weighted, in line with the methodology used in the IMHE Global Burden of Disease 2010 and
the WHO Global Health Estimates 2012. Appendix 5 describes the detailed methodology for
calculation of DALYs. The projected number of lives saved and cases of childhood stunting
averted are calculated using the Lives Saved Tool (LiST), which translates measured coverage
changes into estimates of mortality reduction and changes in the prevalence of under five
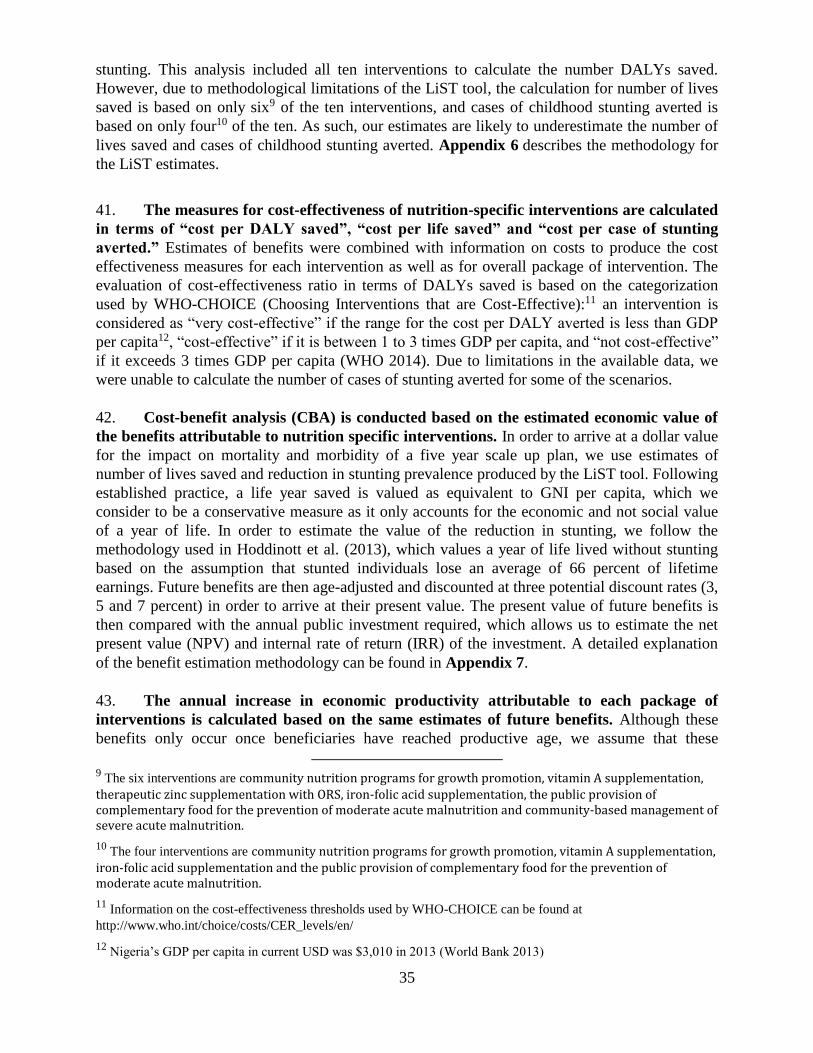
35
stunting. This analysis included all ten interventions to calculate the number DALYs saved.
However, due to methodological limitations of the LiST tool, the calculation for number of lives
saved is based on only six9 of the ten interventions, and cases of childhood stunting averted is
based on only four10 of the ten. As such, our estimates are likely to underestimate the number of
lives saved and cases of childhood stunting averted. Appendix 6 describes the methodology for
the LiST estimates.
41. The measures for cost-effectiveness of nutrition-specific interventions are calculated
in terms of “cost per DALY saved”, “cost per life saved” and “cost per case of stunting
averted.” Estimates of benefits were combined with information on costs to produce the cost
effectiveness measures for each intervention as well as for overall package of intervention. The
evaluation of cost-effectiveness ratio in terms of DALYs saved is based on the categorization
used by WHO-CHOICE (Choosing Interventions that are Cost-Effective):11 an intervention is
considered as “very cost-effective” if the range for the cost per DALY averted is less than GDP
per capita12, “cost-effective” if it is between 1 to 3 times GDP per capita, and “not cost-effective”
if it exceeds 3 times GDP per capita (WHO 2014). Due to limitations in the available data, we
were unable to calculate the number of cases of stunting averted for some of the scenarios.
42. Cost-benefit analysis (CBA) is conducted based on the estimated economic value of
the benefits attributable to nutrition specific interventions. In order to arrive at a dollar value
for the impact on mortality and morbidity of a five year scale up plan, we use estimates of
number of lives saved and reduction in stunting prevalence produced by the LiST tool. Following
established practice, a life year saved is valued as equivalent to GNI per capita, which we
consider to be a conservative measure as it only accounts for the economic and not social value
of a year of life. In order to estimate the value of the reduction in stunting, we follow the
methodology used in Hoddinott et al. (2013), which values a year of life lived without stunting
based on the assumption that stunted individuals lose an average of 66 percent of lifetime
earnings. Future benefits are then age-adjusted and discounted at three potential discount rates (3,
5 and 7 percent) in order to arrive at their present value. The present value of future benefits is
then compared with the annual public investment required, which allows us to estimate the net
present value (NPV) and internal rate of return (IRR) of the investment. A detailed explanation
of the benefit estimation methodology can be found in Appendix 7.
43. The annual increase in economic productivity attributable to each package of
interventions is calculated based on the same estimates of future benefits. Although these
benefits only occur once beneficiaries have reached productive age, we assume that these
9 The six interventions are community nutrition programs for growth promotion, vitamin A supplementation,
therapeutic zinc supplementation with ORS, iron-folic acid supplementation, the public provision of complementary food for the prevention of moderate acute malnutrition and community-based management of severe acute malnutrition.
10 The four interventions are community nutrition programs for growth promotion, vitamin A supplementation,
iron-folic acid supplementation and the public provision of complementary food for the prevention of moderate acute malnutrition.
11 Information on the cost-effectiveness thresholds used by WHO-CHOICE can be found at
http://www.who.int/choice/costs/CER_levels/en/
12 Nigeria’s GDP per capita in current USD was $3,010 in 2013 (World Bank 2013)

36
benefits serve as an approximation of the present value of economic productivity lost each year
as a result of mortality and morbidity that would otherwise be prevented by scaling up nutrition
interventions. Values presented are taken from a year in which all beneficiaries have reached
productive age.
44. The approach for estimating the potential costs and benefits of nutrition sensitive
interventions differs from the methodology used for nutrition specific interventions.
Similar to nutrition specific interventions, the total cost for scaling up the interventions is
calculated by multiplying the unit cost by the target population (local Nigerian unit costs or
regional unit costs are used depending on availability). However, since most nutrition-sensitive
interventions have multiple objectives, it is not always feasible to attribute the nutrition related
benefits to the overall costs of the interventions. Because these constraints limit the accuracy of
cost-effectiveness estimates, we instead rely on secondary sources/published literature when
available, with cost-effectiveness presented in terms of cost per DALY saved.
D. SCENARIOS FOR SCALING UP NUTRITION INTERVENTIONS
45. When estimating the costs and benefits of scaling up nutrition interventions, we
begin with estimates for scaling all ten interventions to full national coverage, followed by
estimates for various scale up scenarios. The “full coverage” estimates can be considered the
medium-term policy goal for FGoN, however, resource constraints will likely limit the
government’s ability to achieve full national coverage in the short-term. Therefore, we also
propose 5 scenarios for prioritizing the scale up of nutrition interventions over a shorter-term
time frame of 5 years:
Scenario 1: Prioritize scale up by region
Scenario 2: Prioritize scale up by intervention
Scenario 3: Prioritize scale up by state
Scenario 4: Prioritize scale up by state and by intervention
Scenario 5: Prioritize scale up by target coverage
Within each scenario we consider several variations and analyze their cost-effectiveness in terms
of cost per DALY saved, cost per life saved and cost per case of childhood stunting averted.
After our initial analysis, we present the 5 most attractive scale-up scenarios and discuss them in
more detail.
46. “Full coverage” is defined as 100 percent of the target population for all
interventions except the treatment of severe acute malnutrition, for which full coverage is
assumed to be 80 percent. This is consistent with the methodology used in World Bank, 2010a,
and is based on the reality that few community-based treatment programs have successfully
achieved more than 80 percent coverage at scale. Under Scenario 5, we also propose several
“partial coverage” scenarios that reduce coverage targets to more realistic levels, including some
coverage rates that are in line with the coverage envisioned in the Government’s draft National
Strategic Plan for Nutrition.

37
PART IV – RESULTS FOR NUTRITION-SPECIFIC INTERVENTIONS
A. TOTAL COST, EXPECTED BENEFITS AND COST EFFECTIVENESS
47. The total additional public investment required to scale up 10 nutrition-specific
interventions from current coverage levels to full coverage at the national-level in Nigeria is
estimated at US$837 million annually (Table 5). This cost includes the additional cost of
scaling up all ten interventions across the entire country (US$892 million per year) plus
additional resources for monitoring and evaluation, operations research and technical support,
and capacity development for program delivery (estimated at US$98 million). Of this total
amount of US$991 million, part of the costs for iron fortification, multiple micronutrient
powders, salt iodization and complementary food could be covered from private resources from
households above the poverty line (estimated at US$153 million), which leaves a financing gap
of US$837 million for a full scale-up nationwide.
Table 5. Estimated Cost of Scaling Up 10 Nutrition Specific Interventions to Full Coverage
Intervention Annual Cost
(US$ million)
Community programs for growth promotion of children 70
Vitamin A supplementation for children 5
Therapeutic zinc supplementation with ORS for children 27
Micronutrient powders for children 19
Deworming for children 18
Iron-folic acid supplementation for pregnant women 12
Iron fortification of staple foods for general population 35
Salt Iodization for general population 2
Public provision of complementary food for prevention of moderate acute
malnutrition in children
413
Community-based management of severe acute malnutrition in children 294
Total cost for scaling up all 10 interventions 892
Capacity development for program delivery 80
M&E, operations research and tech. support 18
Household contributions (153)
ANNUAL PUBLIC INVESTMENT REQUIRED 837

38
48. A five-year budget for the scale up of all 10 interventions nationwide is estimated to
cost between US$ 2.4 and 2.9 billion, depending on the how fast the program reaches full
coverage. We have provided these figures (Table 6) for the purpose of comparison only. When
the 10 interventions are fully scaled up by year 3, the total programmatic costs over five years is
estimated at US$2.9 billion. If full coverage is reached by year 4, then the total cost is US$2.7
billion. If it takes five years to reach full coverage, then the total five-year budget would be
US$2.4 billion
Table 6. Scale up of all 10 Interventions Over 5 years, 3 Scenarios in US$ Millions
Time to Reach
100% Scale
Year 1
(20%
coverage)
Year 2
(40%
Coverage)
Year 3
(60%
coverage)
Year 4
(80%
coverage)
Year 5
(100%
coverage)
Total
Scale Up
Costs
Over 5 Years
3 Years 192 403 773 765 765 2,897
4 Years 192 403 576 765 765 2,700
5 Years 184 327 462 614 765 2,351
49. The expected benefits from scaling up these ten nutrition-specific interventions
across the entire country are enormous (Table 7). Over 8.7 million DALYs and 183,000 lives
would be saved annually, while more than 3 million cases of stunting among children under five
would be averted. Program coverage is assumed to expand as follows:
• 14 million families with children 0-23 months reached by community programs for
behavior change communication and growth promotion;
• 10.6 million additional children 6-59 months receive twice-yearly doses of life-saving
vitamin A supplementation;
• 31.4 million children 6-59 months receive zinc supplementation as part of diarrhea
management;
• 5.2 million children 6-23 months receive vitamins and minerals through multiple
micronutrient powders;
• 39.9 million children 12-59 months receive deworming medication;
• 6.3 million additional pregnant women receive iron-folic acid tablets as part of their
antenatal care;
• 174.4 million people consume staple foods fortified with iron;
• 38.8 million more people who do not currently use iodized salt obtain it;
• 3.7 million more children 6-59 months treated for severe acute malnutrition using
community-based management practices;
• 8.1 million children aged 6-23 months receive a small amount of nutrient-dense
complementary food (~250 kcals/day) for the prevention or treatment of moderate
malnutrition.
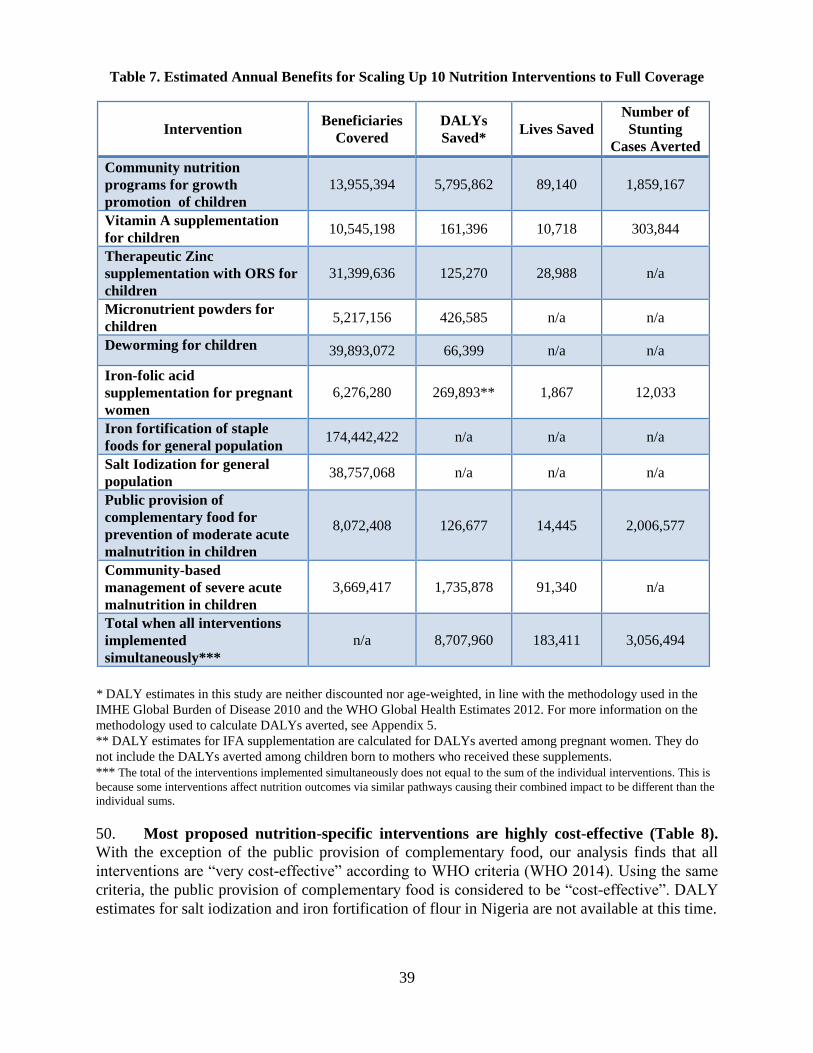
39
Table 7. Estimated Annual Benefits for Scaling Up 10 Nutrition Interventions to Full Coverage
* DALY estimates in this study are neither discounted nor age-weighted, in line with the methodology used in the
IMHE Global Burden of Disease 2010 and the WHO Global Health Estimates 2012. For more information on the
methodology used to calculate DALYs averted, see Appendix 5.
** DALY estimates for IFA supplementation are calculated for DALYs averted among pregnant women. They do
not include the DALYs averted among children born to mothers who received these supplements.
*** The total of the interventions implemented simultaneously does not equal to the sum of the individual interventions. This is
because some interventions affect nutrition outcomes via similar pathways causing their combined impact to be different than the
individual sums.
50. Most proposed nutrition-specific interventions are highly cost-effective (Table 8).
With the exception of the public provision of complementary food, our analysis finds that all
interventions are “very cost-effective” according to WHO criteria (WHO 2014). Using the same
criteria, the public provision of complementary food is considered to be “cost-effective”. DALY
estimates for salt iodization and iron fortification of flour in Nigeria are not available at this time.
Intervention Beneficiaries
Covered
DALYs
Saved* Lives Saved
Number of
Stunting
Cases Averted
Community nutrition
programs for growth
promotion of children
13,955,394 5,795,862 89,140 1,859,167
Vitamin A supplementation
for children 10,545,198 161,396 10,718 303,844
Therapeutic Zinc
supplementation with ORS for
children
31,399,636 125,270 28,988 n/a
Micronutrient powders for
children 5,217,156 426,585 n/a n/a
Deworming for children 39,893,072 66,399 n/a n/a
Iron-folic acid
supplementation for pregnant
women
6,276,280 269,893** 1,867 12,033
Iron fortification of staple
foods for general population 174,442,422 n/a n/a n/a
Salt Iodization for general
population 38,757,068 n/a n/a n/a
Public provision of
complementary food for
prevention of moderate acute
malnutrition in children
8,072,408 126,677 14,445 2,006,577
Community-based
management of severe acute
malnutrition in children
3,669,417 1,735,878 91,340 n/a
Total when all interventions
implemented
simultaneously***
n/a 8,707,960 183,411 3,056,494

40
51. In countries such as Nigeria where fiscal and capacity constraints will limit scale-up,
the public provision of complementary foods may be a lower priority. Issues of governance,
accountability, and supply logistics will further constrain the scale-up of the public provision of
complementary foods. While the benefits are clear, the relatively high cost of this type of
intervention, in addition to the aforementioned concerns, lead us to conclude that the public
provision of complementary food should be implemented only once adequate capacity has been
developed.
52. For the package as a whole, the total cost per DALY saved is estimated at $102, the
total cost per life saved is estimated at $4,865, and the total cost per case of stunting averted
is estimated to be $292.13 Variation in costs among the interventions is high, with costs per life
saved ranging from $433 for vitamin A supplementation to $28,557 for the public provision of
complementary foods. Overall, these cost estimates translate into an increase in annual public
resource requirements of $14.50 per child. This compares favorably to global estimates of $30
per child calculated in World Bank (2010a).
13
For the total cost per benefit unit, we divide the total annual program cost for all 10 interventions (excluding
M&E, and capacity development costs, but before subtracting household contributions) by the benefits estimates
available. Note that DALYs saved estimates are not available for 2 of the 10 interventions, lives saved estimates are
not available for 4 of the 10 interventions and stunting reduction estimates are not available for 6 of the 10
interventions.

41
Table 8. Cost Effectiveness of Scaling Up 10 Nutrition Interventions to Full Coverage, US$
*Very cost-effective according to WHO-CHOICE criteria (WHO 2014).
**Cost-effective according to WHO-CHOICE criteria (WHO 2014).
*** The total of the interventions implemented simultaneously does not equal to the sum of the individual interventions. This is
because some interventions affect nutrition outcomes via similar pathways causing their combined impact to be different than the
individual sums.
B. POTENTIAL SCALE-UP SCENARIOS
53. Scenario 1: Scale Up by Region. Table 9 shows the estimated costs and benefits of
scaling up the ten nutrition specific interventions by region. The regions display significant
disparities in malnutrition rates. All states in the North-Western region have stunting levels
above 40 percent (nearly 2.5 times that in the South East) and this region accounts for almost 40
percent of the overall costs. The states with high malnutrition rates will disproportionately
benefit from scaling up nutrition interventions as demonstrated by high expected benefits in
terms of DALYs saved and lives saved.
Intervention Cost/DALY Saved Cost/Life
Saved
Cost/Stunted
Case Averted Nigeria Global
Community nutrition programs for
growth promotion of children
12* 53-153 783 38
Vitamin A supplementation for
children
29* 3-16 433 15
Therapeutic Zinc supplementation
with ORS for children
216* 73 932
Micronutrient powders for children 44* 12
Deworming for children 264* n/a
Iron-folic acid supplementation for
pregnant women
43* 66-115 6,280 974
Iron fortification of staple foods for
general population
n/a
Salt Iodization for general population n/a
Public provision of complementary
food for prevention of moderate acute
malnutrition of children
3,256** 500-1000 28,557 206
Community-based management of
severe acute malnutrition of children
169* 41 3,214
TOTAL when all interventions
implemented simultaneously***
102* n/a 4,865 292

42
Table 9. Scenario 1: Cost and Benefits of Scaling Up 10 Nutrition Interventions by Region
Region Annual Public
Investment (US$
million)
Annual Benefits
DALYs Saved Lives Saved
North-Central $81 1,255,680 24,530
North-Eastern $134 1,205,553 27,570
North-Western $405 2,502,917 60,022
South-Eastern $58 899,369 16,278
South-South $69 1,199,935 22,212
South-Western $91 1,644,492 32,798
TOTAL $837 8,707,946 183,411
54. Given the high stunting rates in the North-West, the preferred scenario (Scenario 1)
is to scale up interventions in states in the North-West region, with an annual public
investment of $405 million. This scenario would save over 2.5 million DALYs and at least
60,000 lives. It would also increase program coverage as follows:
• 3.6 million families with children 0-23 months reached by community programs for
behavior change;
• 3.6 million additional children 6-59 months receive twice-yearly doses of life-saving
vitamin A supplementation;
• 8.0 million children 6-59 months receive zinc supplementation as part of diarrhea
management;
• 0.08 million children 6-23 months receive vitamins and minerals through multiple
micronutrient powders;
• 9 million children 12-59 months receive deworming medication;
• 1.2 million additional pregnant women receive iron-folic acid tablets as part of their
antenatal care;
• 44.3 million people able to consume staple foods fortified with iron;
• 16.6 million more people gain access to iodized salt;
• 2.0 million more children 6-59 months treated for severe acute malnutrition using
community-based management practices;
• 16.5 million children aged 6-23 months receive a small amount of nutrient-dense
complementary food (~250 kcals/day) for the prevention or treatment of moderate
malnutrition.
However, because budgetary allocations in Nigeria are done by state, rather than by region, the
regional scale-up approach is not a pragmatic option.
55. Scenario 2: Scale Up by Intervention. Scenario 2 is based on step-wise scale-up by
intervention. The primary considerations for choosing the interventions in each step are cost
effectiveness, recommended phasing of interventions, implementation capacity and delivery
mechanisms. The proposed plan for a step-wise scale-up by intervention is summarized below
and illustrated in Figure 6.
Step 1 focuses on a package of primarily preventive interventions that can be scaled up
quickly, either with existing capacities or with modest investment in capacity-building for

43
community nutrition programs and child health days. It also includes community-based
management of severe acute malnutrition at 30 percent coverage. Although in most other
country contexts, this is a resource-intensive intervention and relatively complex to
implement, in Nigeria, efforts are already underway to implement community-based
management of severe acute malnutrition in 11 states, and some capacities have been
built, making the 30 percent coverage goal feasible. The cost of scaling up community
nutrition programs for behavior change communication and all micronutrient and
deworming interventions at full coverage in all states and community-based management
of severe acute malnutrition to reach 30 percent of the target population is US$296.4
million. An additional US$26.7 million for capacity development and US$5.9 million for
monitoring and evaluation, operations research, and technical support is budgeted, which
brings the total cost of step one to US$329.0 million. The portion of scale up costs that
could be covered by households above the poverty line is estimated at US$21.7 million.
Therefore the total public investment required for Step 1 is estimated at US$307.3
million.
Step 2 includes the costs of a full scale up of treatment for severe acute malnutrition from
a base of 30 percent in Step 1 to 80 percent coverage, with the assumption that additional
implementation capacities are built in Step 1. The estimated cost of this scale-up is
US$183.5 million. We also include an additional US$3.7 million for monitoring and
evaluation, operations research, and technical support and US$16.5 million for capacity
development in step two, which brings the total public investment required for Step 2
to US$203.7 million.
Step 3 adds scaling up of the public provision of complementary foods to prevent
moderate acute malnutrition among children under 2 years of age. The total cost of this
intervention is US$412.5 million. The additional cost for monitoring and evaluation,
operations research, and technical support and capacity development in step three is
US$45.4. Of the total cost, an estimated US$131.6 million could be resourced from
private resources in households above the poverty line. This brings the estimated public
investment required for Step 3 to US$326.3 million.
Step 3 interventions are assigned the lowest priority for the following reasons: (i) the 2013
Lancet nutrition series concluded that there are no additional benefits of public provision of
complementary foods beyond those provided by dietary counseling and education; (ii) at
US$6,849 per DALY saved, the cost-effectiveness of public provision of complementary foods is
much less attractive than that of other proposed interventions; (iii) the total cost of
complementary foods is overwhelming and accounts for more than half cost of the total cost of
scaling up all interventions, while the benefits as estimated lives saved or DALYs saved are
lower than other interventions; (iv) governance, accountability, supply-chain, and logistics are
key challenges associated with large-scale food distribution and are not inconsequential in a
country the size of Nigeria. The estimated benefits do not out-weigh these risks, and the costs are
high, as compared with other interventions. Under these circumstances, rapid scale-up is neither
feasible nor is it recommended.
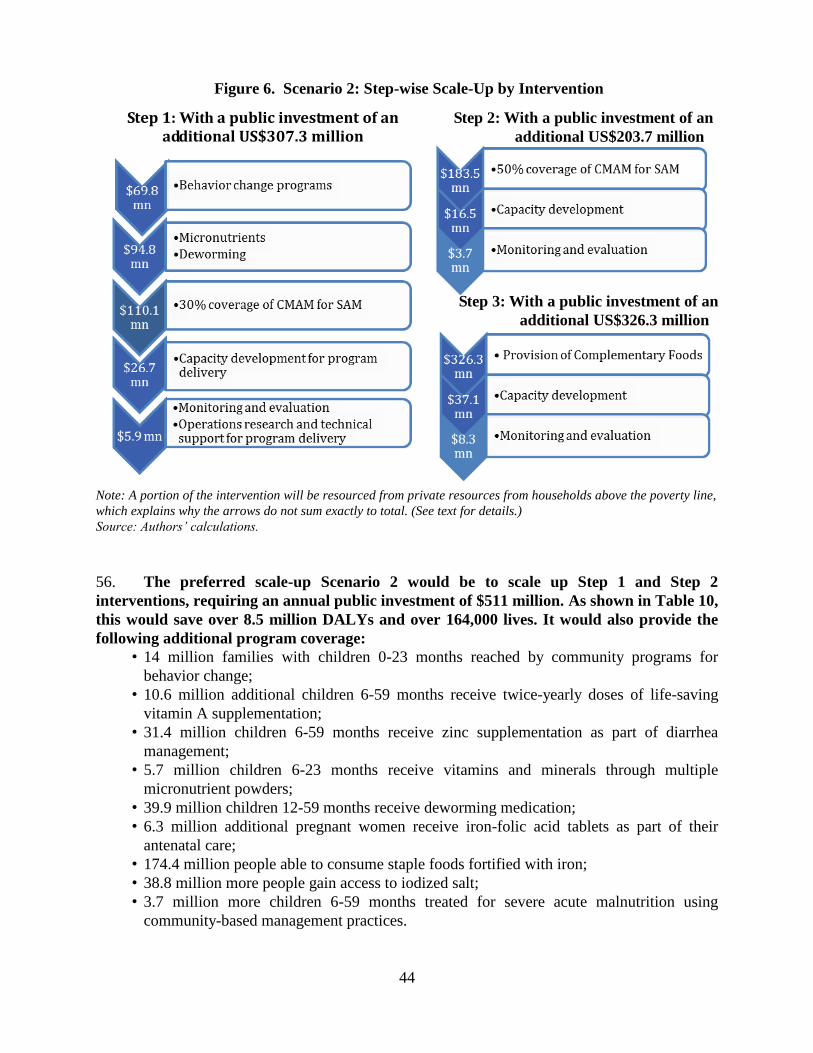
44
Figure 6. Scenario 2: Step-wise Scale-Up by Intervention
Note: A portion of the intervention will be resourced from private resources from households above the poverty line,
which explains why the arrows do not sum exactly to total. (See text for details.)
Source: Authors’ calculations.
56. The preferred scale-up Scenario 2 would be to scale up Step 1 and Step 2
interventions, requiring an annual public investment of $511 million. As shown in Table 10,
this would save over 8.5 million DALYs and over 164,000 lives. It would also provide the
following additional program coverage:
• 14 million families with children 0-23 months reached by community programs for
behavior change;
• 10.6 million additional children 6-59 months receive twice-yearly doses of life-saving
vitamin A supplementation;
• 31.4 million children 6-59 months receive zinc supplementation as part of diarrhea
management;
• 5.7 million children 6-23 months receive vitamins and minerals through multiple
micronutrient powders;
• 39.9 million children 12-59 months receive deworming medication;
• 6.3 million additional pregnant women receive iron-folic acid tablets as part of their
antenatal care;
• 174.4 million people able to consume staple foods fortified with iron;
• 38.8 million more people gain access to iodized salt;
• 3.7 million more children 6-59 months treated for severe acute malnutrition using
community-based management practices.
Step 1: With a public investment of an additional US$307.3 million
Step 2: With a public investment of an
additional US$203.7 million
Step 3: With a public investment of an
additional US$326.3 million

45
Table 10. Scenario 2: Cost and Benefits for Scaling Up 10 Nutrition-specific Interventions by
Intervention
Interventions Annual Public
Investment
(US$ millions)
Annual Benefits
DALYs Saved Lives Saved
Step 1: Community nutrition programs
for growth promotion, all micronutrient
and deworming, 30% coverage of
community-based management of severe
acute malnutrition
$307 7,496,345 122,638
Step 2: 50% of community-based
management of severe acute malnutrition
$204 1,084,924 56,742
SUBTOTAL (STEP 1 AND 2
INTERVENTIONS WHEN
IMPLEMENTED
SIMULTANEOUSLY)*
$511 8,581,269
164,390
Step 3: Public provision of complementary
food for moderate acute malnutrition
$326 126,677 14,445
TOTAL when all interventions
implemented simultaneously*
$837 8,707,946 183,411
* The total of the interventions implemented simultaneously does not equal to the sum of the individual
interventions. This is because some interventions affect nutrition outcomes via similar pathways causing their
combined impact to be different than the individual sums.
57. Scenario 3: Scale Up by State. Scenario 3 proposes scaling up all 10 interventions in
three steps using state-level geographic targeting criteria based on the prevalence of child
stunting in these states. First are the highest burden states with a stunting prevalence above 35
percent. The middle burden states are those with a stunting prevalence between 25 and 35
percent and the lowest burden states are those with stunting prevalence below 25 percent. The
step-wise scale-up by state is summarized below and Table 11 shows the estimated cost and
benefits for each step.
For the highest burden states, all 10 interventions would be scaled up in the 13 states
with a stunting prevalence above 35%. Eleven of the 13 states are in North-Western and
North-Eastern regions, and one (Plateaux) is in the North-Central region. It is proposed
that Nasarawa would also be included since it is currently participating in the results-
based financing program. The total cost including costs of M&E operations research,
technical assistance, and capacity development would be US$578.8 million. Adjusting for
household contributions, the annual public investment required for the highest
burden states is estimated at US$506.9 million.
Next, for the middle burden states, all 10 interventions would be scaled up in 5 states
with a stunting prevalence between 25 and 35 percent. The total cost including costs of
M&E operations research, technical assistance, and capacity development would be
US$132.1 million. After subtracting contributions from household living above the
poverty line, an annual public investment required for middle burden states is
US$105.0 million.

46
For the lowest burden states, all 10 interventions would be scaled up in the remaining 19
states with a stunting prevalence below 25 percent. Most of states are in southern regions
(South-East, South-South and South-West) with the exceptions of FCT Abuja, Kogi and
Benue which are in the North-Central region. The total annual cost of this step including
costs of M&E operations research, technical assistance, and capacity development would
be US$279.8 million. After adjusting for contributions from households living above the
poverty line, the annual public investment required for the lowest burden states is
US$ 225.4 million.
58. The preferred Scenario 3 is to prioritize the highest burden states, which would
focus on scaling-up all interventions in the 13 states with the most severe stunting rates.
This would require an annual public investment of $507 million; saving at least 3.5 million
DALYs and over 80,000 lives. Program coverage would increase as follows:
• 5.2 million families with children 0-23 months reached by community programs for
behavior change;
• 5.3 million additional children 6-59 months receive twice-yearly doses of life-saving
vitamin A supplementation;
• 11.7 million children 6-59 months receive zinc supplementation as part of diarrhea
management;
• 0.6 million children 6-23 months receive vitamins and minerals through multiple
micronutrient powders;
• 13.1 million children 12-59 months receive deworming medication;
• 2.1 million additional pregnant women receive iron-folic acid tablets as part of their
antenatal care;
• 65.1 million people able to consume staple foods fortified with iron;
• 22.9 million more people gain access to iodized salt;
• 2.3 million more children 6-59 months treated for severe acute malnutrition using
community-based management practices;
• 22.9 million children aged 6-23 months receive a small amount of nutrient-dense
complementary food (~250 kcals/day) for the prevention or treatment of moderate
malnutrition.

47
Table 11. Scenario 3: Costs and Benefits for Scaling Up 10 Nutrition-specific Interventions by State
States Criteria Annual Public
Investment
(US$ million)
Annual Benefits
DALYs Saved Lives Saved
Highest Burden1 13 States with >35%
stunting and/or RBF
States
$507 3,505,652 81,678
Middle Burden2 5 States with 25-35%
stunting
$105 1,276,744 28,835
Lowest Burden3 States with <25%
stunting
$225 3,925,549 72,898
TOTAL $837 8,707,946 183,411 1Bauchi, Gombe, Taraba, Yobe, Jigawa, Kaduna, Kano, Katsina, Kebbi, Sokoto, Zamfara, Nasarawa, Plateau. 2Borno, Adamawa, Niger, Kwara, Oyo. 3FCT Abuja, Benue, Kogi, Ondo, Ebonyi, Cross-Rivers, Abia, Anambra, Enugu, Imo, Akwa-Ibom, Bayelsa, Delta,
Edo, Rivers, Ekiti, Lagos, Ogun, Osun.
59. Scenario 4: Scale Up by State and by Intervention. Scenario 4 is a hybrid of Scenario 2 and
3 and proposes the scaling up by state and by selected interventions as listed in Table 12 below.
The first variation, Scenario 4a, is to scale up step 1 and step 2 interventions in 18 states where
stunting rates are higher than 25 percent (highest and middle burden states), requiring an annual
public investment of $337 million, saving almost 4.7 million DALYs and 96,000 lives. Scenario
4a would provide the following program benefits:
• 7.2 million families with children 0-23 months reached by community programs for
behavior change;
• 6.9 million additional children 6-59 months receive twice-yearly doses of life-saving
vitamin A supplementation;
• 16.1 million children 6-59 months receive zinc supplementation as part of diarrhea
management;
• 1.4 million children 6-23 months receive vitamins and minerals through multiple
micronutrient powders;
• 17.4 million children 12-59 months receive deworming medication;
• 2.9 million additional pregnant women receive iron-folic acid tablets as part of their
antenatal care;
• 89.1 million people able to consume staple foods fortified with iron;
• 28.3 million more people gain access to iodized salt;
• 2.8 million more children 6-59 months treated for severe acute malnutrition using
community-based management practices.
48
Table 12. Scenario 4: Cost of Scaling Up 10 Nutrition Interventions by State and by Intervention,
US Millions
Intervention/State Highest
Burden1
Middle
Burden2
Lowest
Burden3
Step 1 Interventions: Community nutrition
programs for growth promotion, all
micronutrient and deworming, 30%
coverage of community-based management
of severe acute malnutrition
$144 $41 $123
Step 2 Interventions: 50% of community-
based management of severe acute
malnutrition
$128 $25 $51
Step 3 Interventions: Public provision of
complementary food for prevention of
moderate acute malnutrition
$236 $39 $52
1Bauchi, Gombe, Taraba, Yobe, Jigawa, Kaduna, Kano, Katsina, Kebbi, Sokoto, Zamfara, Nasarawa, Plateau. 2Borno, Adamawa, Niger, Kwara, Oyo. 3FCT Abuja, Benue, Kogi, Ondo, Ebonyi, Cross-Rivers, Abia, Anambra, Enugu, Imo, Akwa-Ibom, Bayelsa, Delta,
Edo, Rivers, Ekiti, Lagos, Ogun, Osun.
Table 13. Annual Costs and Benefits from Scenarios 4a and 4b
Scenarios Annual Public Investment
(US$ million)
Annual Benefits
DALYs Saved Lives
Saved
Scenario 4a
$337 4,694,076 96,092
Scenario 4b
$271 3,439,969 70,911
60. Scenario 4b would limit scaling up step 1 and step 2 interventions to the 13 states
with the highest burden of stunting. Scenario 4b would require an annual public
investment of $271 million, and would save over 3.4 million DALYs and 70,000 lives (Table
13). Furthermore, Scenario 4b would provide the following program benefits:
5.2 million families with children 0-23 months reached by community programs for
behavior change;
5.3 million additional children 6-59 months receive twice-yearly doses of life-saving
vitamin A supplementation;
11.7 million children 6-59 months receive zinc supplementation as part of diarrhea
management;
0.6 million children 6-23 months receive vitamins and minerals through multiple
micronutrient powders;
13.1 million children 12-59 months receive deworming medication;
2.1 million additional pregnant women receive iron-folic acid tablets as part of their
antenatal care;

49
65.1 million people are able to consume staple foods fortified with iron;
22.9 million more people gain access to iodized salt;
2.3 million more children 6-59 months treated for severe acute malnutrition using
community-based management practices.
61. Scenario 5: Scale up by varying program coverage targets. As discussed above, the
previous scenarios assume full program coverage. Scenario 5 allows for “partial” coverage rates
as a way to scale-up to the eventual “full coverage” scenario (Table 14). These partial program
coverage targets were agreed upon at a meeting between donors and the Government of Nigeria
in February, 2014.14
Table 14. Full and Partial Program Coverage Targets
14
The interventions are expected to reach the following share of targeted coverage: 10% in year 1, 32.5% in year 2,
55% in year 3, 77.5% in year 4 and 100% by year 5. Capacity building is assumed to be 9% of total costs, and within
that, 79% is for capacity building and training 13% is for resource mobilization and advocacy and 8% is for
coordination. Capacity building will be distributed across the five years as follows: 20% in year 1, 30% in years 3
and 4, 10% in year 4 and the final 10% in year 5. Finally, monitoring and evaluation is estimated to be 2% of
intervention costs.
Intervention Percent of target population
covered by Year 5
Full Coverage
(Scenarios 1-4)
Partial Coverage
(Scenario 5)
Community nutrition programs for growth promotion
of children 100 50
Vitamin A supplementation for children 100 90
Therapeutic zinc supplementation with ORS for
children 100 80
Micronutrient powders for children 100 90
Deworming for children 100 90
Iron-folic acid supplementation for pregnant women 100 90
Iron fortification of staple foods for general
population 100 100
Salt Iodization for general population 100 100
Public provision of complementary food for
prevention of moderate acute malnutrition in children 100 35
Community-based management of severe acute
malnutrition in children 80 35

50
Table 15. Scenarios Considered Within Scenario 5
Scenario Annual Public
Investment
(US$ million)
Annual Benefits
DALYs
Saved
Lives
Saved
Cases of
Stunting
Averted
5a) All interventions in all states
at “partial” coverage rates $353 4,388,415 96,463 1,434,988
5b) Micronutrients and
deworming interventions at
“partial” coverage rates in all
states and community nutrition
programs and community-based
management of severe acute
malnutrition at “partial”
coverage rates in highest burden
states*
$184 2,256,091 58,519 n/a
*Highest burden states are Bauchi, Gombe, Taraba, Yobe, Jigawa, Kaduna, Kano, Katsina, Kebbi, Sokoto,
Zamfara, Nasarawa, Plateau.
62. Scenario 5a would scale up all 10 interventions to the partial coverage levels and
would require total annual public investment of US$353 million (Table 15). This includes
the total cost of scaling up the 10 interventions of US$371 million plus US$34 million for
capacity development and $8 million for monitoring and evaluation, operations support and
technical support. We also assume households above the poverty line can contribute $59 million
towards the costs of some interventions, yielding the net total of US$353.
63. This scenario would save over 4.3 million DALYs, 96,000 lives, and avert over 1.4
million cases of stunting among children under five years of age. (Appendix 8 provides the
estimates of cost and benefits by state). Additionally, this scenario would provide the following
program benefits:
• 7.4 million additional children 6-59 months receive twice-yearly doses of life-saving
vitamin A supplementation;
• 7.0 million families with children 0-23 months reached by community programs for
behavior change;
• 25.1 million children 6-59 months receive zinc supplementation as part of diarrhea
management;
• 4.9 million children 6-23 months receive vitamins and minerals through multiple
micronutrient powders;
• 34.3 million children 12-59 months receive deworming medication;
• 5.4 million additional pregnant women receive iron-folic acid tablets as part of their
antenatal care;
• 174.4 million more people able to consume staple foods fortified with iron;
• 38.8 million more people gain access to iodized salt;

51
• 1.4 million more children 6-59 months treated for severe acute malnutrition using
community-based management practices;
• 2.4 million children aged 6-23 months receive a small amount of nutrient-dense
complementary food (~250 kcals/day) for the prevention or treatment of moderate
malnutrition.
64. Another scenario (Scenario 5b) would scale up interventions that require less
capacity and lower dependence on strong health systems and are relatively low-cost (such
as micronutrient and deworming interventions15) in all 36 states. It would also provide
community nutrition programs and community-based management of severe acute
malnutrition at “partial” coverage in the 13 states with the highest burden of stunting.
Scenario 5b would require an annual public investment of $184 million, and would save
over 2.2 million DALYs and 58,000 lives. This option would provide the following program
benefits:
• 7.4 million additional children 6-59 months receive twice-yearly doses of life-saving
vitamin A supplementation;
• 2.6 million families with children 0-23 months reached by community programs for
behavior change;
• 25.1 million children 6-59 months receive zinc supplementation as part of diarrhea
management;
• 4.9 million children 6-23 months receive vitamins and minerals through multiple
micronutrient powders;
• 34.3 million children 12-59 months receive deworming medication;
• 5.4 million additional pregnant women receive iron-folic acid tablets as part of their
antenatal care;
• 174.4 million more people able to consume staple foods fortified with iron;
• 38.8 million more people gain access to iodized salt;
• 0.9 million more children 6-59 months treated for severe acute malnutrition using
community-based management practices;
C. COST-BENEFIT ANALYSIS OF THE SCALE-UP SCENARIOS
65. The scenario with the greatest impact per dollar spent is Scenario 2, with a cost per
DALY saved of $56 and a cost per life saved of US$2,919. Yet this scenario is also extremely
costly and requires an annual public investment of US$511 million. We will therefore consider
other scenarios that are also cost-effective but require fewer public resources.
66. Table 16 presents a comparison of the various scenarios and shows that scenarios
4a, 4b, 5a and 5b are cost-effective and require relatively modest public investments in
order to reach scale. Scenarios 4a and 4b are more cost-effective but also target specific states.
It is worth noting that the two scenarios under Scenario 5 may be more politically feasible, given
that the interventions are scaled up in all Nigerian states.
Table 16. Costs and Benefits of Most Cost-Effective Scenarios
15
This include deworming, vitamin A supplements, zinc supplements, multi micronutrient powders, iron fortification
of staple foods and salt iodization

52
Scenario Annual
Public
Investment
(US$
million)
Annual Benefits Cost per Benefit Unit (US$)
DALYs
Saved
Lives
Saved
Cases of
Stunting
Averted
DALY
Saved
Life
Saved
Case of
Stunting
Averted
Full National
Coverage $837 8,707,960 183,411 3,056,494 102 4,865 292
Scenario 1 $405 2,502,917 60,022 n/a 167 6,980 n/a
Scenario 2 $511 8,581,269 164,390 n/a 56 2,919 n/a
Scenario 3 $507 3,505,652 81,678 n/a 149 6,383 n/a
Scenario 4a $337 4,694,076 96,092 n/a 66 3,229 n/a
Scenario 4b $271 3,439,969 70,911 n/a 72 3,496 n/a
Scenario 5a $353 4,388,415 96,463 1,434,988 85 3,849 259
Scenario 5b $184 2,256,091 58,519 n/a 82 3,152 n/a
67. Recognizing the difficulty of scaling to full coverage in one year, and following the
five-year time frame of the Government’s National Strategic Plan of Action for Nutrition,
we consider the costs over five years for Scenarios 4a, 4b, 5a and 5b (Table 17).
Interventions are assumed to increase from current coverage as follows: 20 percent of coverage
in year 1, 40 percent in year 2, 60 percent in year 3, 80 percent in year 4 and 100 percent in year
5. For these calculations, we consider the expenditures on capacity development and system
strengthening required to scale to full coverage to be a fixed cost, with some additional funds
allocated to refresher training and rehiring in the years after scale has been reached. Thus, the
average annual amount spent on capacity development is allocated across the five years, rather
than increasing in proportion to coverage as is the case with the other costs.

53
Table 17. Scale Up of Scenarios 4 and 5 in US$ Millions
Scenario Year 1
(20%
coverage)
Year 2
(40%
Coverage)
Year 3
(60%
coverage)
Year 4
(80%
coverage)
Year 5
(100%
coverage)
Total
Scale Up Costs
Over 5 Years
Scenario 4
4a $74 $134 $191 $254 $316 $987
4b $59 $106 $173 $201 $251 $769
Scenario 5
5a $39 $113 $186 $251 $323 $912
5b $20 $59 $97 $131 $169 $476
68. A high burden of malnutrition negatively impacts a nation’s human capital.
Therefore, an investment in improving nutrition outcomes among children is also an
investment in Nigeria’s economic future. The two main ways through which malnutrition
affects economic productivity are increased mortality and morbidity, or in other words, lives lost
and years lived with a disease or disability. For the purposes of this analysis, we estimate the
potential economic benefits of scaling up nutrition interventions in terms of lives saved
(reduction in mortality) and cases of stunting averted (reduction in morbidity). Because each life
lost results in one less citizen contributing to the nation’s economy, and because stunted children
tend to earn and consume less, these impact estimates help us to arrive at approximations of the
return on investment attributable to the scale up of a particular package of interventions.
69. It should be noted that these estimates of economic benefits are based on a highly
conservative methodology that does not necessarily account for all of the potential benefits
associated with improving nutrition outcomes among Nigerian children. However, they
clearly demonstrate that the opportunity costs of not scaling up nutrition interventions are
substantial: we estimate that a five-year scale up plan that brings all ten interventions to full
national coverage could produce $2.6 billion in annual returns over the productive lives of the
children affected.
70. Although it was only possible to assess two scenarios (full coverage and Scenario
5a), our analysis finds that both yield positive net present values produce internal rates of
return greater than 18 percent (Table 18). An increase in the assumed discount rate reduces
the present value of future benefits, and therefore we perform a sensitivity analysis using 3
possible discount rates: 3, 5 and 7 percent. For the full national coverage the net present value
varies between US$103 billion (3 percent discount rate) to US$34 billion for the 7 percent
discount rate. For Scenario 5a it varies between US$40 and 12 billion.
71. All scenarios have the potential to increase economic productivity by increasing the
economic productivity of beneficiaries once they enter the labor force. Reaching full national
coverage for all 10 nutrition specific interventions could add as much as $2.6 billion annually.
Scenario 5a also has a high positive impact on economic productivity with an annual addition to
the Nigerian economy of $1.04 billion.

54
Table 18. Economic Benefits of Two Scenarios, 5 year scale up
Scenario Net Present Value by Discount Rate
(US$ billions)
Internal
Rate of
Return
(percent)
Annual
Increase in
Economic
Productivity16
(US$ billions)
3% 5% 7%
Full National
Coverage
$102.9 $57.6 $33.6 25.14% $2.6
Scenario 5a $40 $21.9 $12.4 18.54% $1.04
D. PROPOSED SCENARIOS
72. Based on their cost-effectiveness, economic contributions and resource
requirements, we propose consideration of Scenarios 4a, 4b, and 5a for implementation.
First, these three scenarios require relatively modest public investments when compared with the
requirements for reaching full national coverage. Second, each scenario is highly cost effective,
with scenarios 4a/4b/5a featuring estimated costs of $66/$72/$85 per DALY saved and
$3,229/$3,496/$3,849 per life saved. For Scenario 5a we were also able to calculate the cost per
case of childhood stunting averted which is US$259 as compared with US$292 for the full
coverage scenario. While Scenarios 4a and 4b are more cost-effective, Scenario 5a offers the
political advantage of distributing benefits more evenly among the states, while Scenarios 4a and
4b focuses solely on states with the highest burden of stunting.
E. FINANCING CURRENT COVERAGE
73. The costs discussed thus far relate to the scale up from current coverage and do not
take into account the financing necessary to maintain existing coverage levels, which we
estimate at approximately US$49 million annually (Table 19). In order to estimate the cost of
financing nutrition interventions at their current scale, this report uses a recent fiscal space
analysis for nutrition in Nigeria conducted by R4D (2014). This analysis attempts to identify
funding for nutrition by source, which we consider to be a proxy for the resources dedicated to
fund existing interventions. However, because this analysis accounts for total funding, it is not
possible to separate financing for program costs from overhead costs. Therefore, it is likely that
these financing numbers overestimate the “sustaining costs” required for baseline intervention
coverage.
74. The R4D analysis has also identified several sources of “planned” investments in
nutrition (Table 20) estimated at about $175 million over the next 4 years. This represents a
potential increase in funding of approximately $126 million between 2014 and 2017.
Considering our previous analysis, which demonstrated financing needs over five years of
between $769 million and $987 million for scaling up under the three proposed scenarios, the
estimated financing gap ranges between $543 and $861 million over this time period, even after
16
The annual increase in economic productivity is measured as the estimated annual addition to economic
productivity once all beneficiaries have reached productive age.

55
accounting for the planned $126 million in increased investments and the $49 million in
sustaining costs for maintaining current coverage. Our analysis predicts additional financing
needs over five years of between $769 million and $987 million for scaling up under the three
proposed scenarios, resulting in an estimated financing gap of between $543 and $861 million
over five years. Therefore, there is clearly a need to leverage additional financing for scaling-up
nutrition interventions, while also prioritizing these interventions based on both need and cost-
effectiveness.
Table 19. Fiscal Space Analysis for Current National Nutrition Expenditures (2013)
Donor Estimated 2013 Expenditure on
Nutrition (US$ millions)
DFID* 17.71
Micronutrient Initiative 1.03
EU 0.93
ECHO 5.47
CIDA 1.25
CIFF 10.62
UNICEF (non-grant) 1.94
Federal Government 10.00
GAIN TBC
TOTAL 48.90
*includes DFID Working to Improve Nutrition in Northern Nigeria program as well as contributions channeled
through UNICEF.
Source: R4D 2014.
Table 20. Projected Funding Available for Nutrition 2014-2017
Donor Projected Funding for Nutrition
2014-2017 (US$ millions)
UNICEF –IYCF 6.40
UNICEF – CMAM 59.84
UNICEF - Policy Support 3.20
UNICEF – Micronutrients 10.56
DFID WINNN 55.00
Federal Government 40.00
Total Available Financing 175.00
Source: R4D 2014.
F. UNCERTAINTIES AND SENSITIVITY ANALYSES
75. Because actual unit costs may differ from our estimates, it is important to consider
the effects of either an increase or decrease in these costs on the overall cost of the
interventions. This uncertainty is greatest for higher-cost interventions, and less significant for
those with lower-costs. For example, given the prevalence of information on and experience

56
with less expensive micronutrient and deworming interventions, there is a higher degree of
certainty around their estimated costs and financing needs. On the other hand, the costs of
community nutrition programs can vary greatly depending on their context, with the intensity of
behavior change campaign campaigns, the number of community health workers employed, and
the amount of incentives provided all affecting unit costs. Finally, there is very little information
concerning the costs associated with the public provision of complementary food. In Nigeria,
there is no delivery mechanism that can be used as a reference for these programs, while unit
costs are highly dependent on the choice of targeting method and other factors such as
widespread corruption and diversion of food supplies. In order to account for these uncertainties,
we perform a partial sensitivity analysis on both the Full National Coverage Scenario and
Scenario 5a (which also corresponds to the scale up used in in Nigeria’s National Strategic Plan
of Action for Nutrition). This sensitivity analysis considers the impact of variation in unit costs
while holding other variables constant. The results of the sensitivity analysis are presented in
Appendix 9.

57
PART V – NUTRITION-SENSITIVE INTERVENTIONS
76. We present cost-benefit estimates for four nutrition-sensitive interventions delivered
through the agriculture and education sectors: biofortification of cassava; aflatoxin
reduction through biocontrol interventions; school-based deworming; and school-based
promotion of good hygiene practices. Table 21 summarizes the cost of scaling up these
interventions and, when available, DALYs saved and cost per DALYs saved. Biofortification of
cassava, school-based deworming, and aflatoxin control through biocontrol are considered to be
cost-effective scenarios in Nigeria. Costs per DALYs saved are not available for school-based
promotion of good hygiene.
Table 21. Preliminary results for costing nutrition-sensitive interventions
Intervention Annual Cost
(US$ million)
DALYs Saved Cost/DALY Saved
Biofortification of cassava 25 800,000 $0.3-0.5
Aflatoxin control
(biocontrol) 65 1,537,790 $43.00
School-based deworming 8 n/a $4.55*
School-based promotion of
good hygiene 60 n/a n/a
*Estimate for Kenya as cost/DALYs saved not available for Nigeria.
A. BIOFORTIFICATION OF CASSAVA
77. The projected total cost of scaling up biofortification of yellow cassava is US$ 25
million. This cost includes only maintenance breeding and release and dissemination
components. The R&D and adaptive breeding phases are already completed, thus the costs of
these components are no longer relevant and have been excluded from the calculation. Given the
unavailability of current programmatic costing information, the total cost of scaling up is
obtained from the ex-ante assessment of biofortification in Nigeria (Fiedler 2010).
78. The cost per DALY saved for biofortification of cassava in Nigeria is estimated to be
between US$ 0.30 (optimistic) to US$0.50 (pessimistic), which is highly cost-effective (Birol
et al. 2014). The cost estimate of $25 million comes from Meenakshi et al. (2010). No
estimations are currently possible for lives saved through biofortification.
B. AFLATOXIN REDUCTION THROUGH BIOCONTROL
79. The total cost of scaling up aflatoxin reduction through biocontrol is estimated to be
US$65 million. The cost calculation uses the unit cost of Afla-safeTM biocontrol developed by
IITA and tested in Nigeria, with a cost per hectare of approximately US$15.6, including material
and distribution costs (Bandyopadhyay 2013). Crop area is based on FAO’s 2010 projections of

58
Nigerian maize planting area, which is estimated at 4.19 million hectares. For the purposes of
this exercise, it is assumed that AflaSafeTM will be applied to all maize fields.17
80. The cost per DALY saved for biocontrol in Nigeria is US$ 43, which is considered
highly-cost effective. An ex-ante assessment of several aflatoxin control measures in Nigeria
identified biocontrol as the most cost-effective for aflatoxin control compared to other
agricultural interventions. The estimated DALYs saved annually and the tentative numbers of
stunting cases prevented annually via biocontrol in Nigeria are 1,537,079 and 875,560,
respectively, albeit stunting estimates are based on tentative evidence. By comparison, the
postharvest intervention package will tentatively prevent 254,880 cases of stunting and save
439,329 DALYs (Khlangwiset 2011). No estimations are currently possible for lives saved
through aflatoxin control.
C. SCHOOL-BASED DEWORMING
81. The cost of scaling up school-based deworming is estimated to be US$8 million
annually. The unit cost (US$0.08) used in the calculation is obtained from regional estimates of
delivery cost in schools for Ghana (Guyatt et al. 2003), assuming twice a year treatment. These
estimates compare well with recent regional “bottom-up” cost analysis, based on NTD national
plans from 36 sub-Saharan Africa countries (Sedosh et al. 2013) which estimates the unit cost of
preventive chemotherapy (PCT) of five NTDs (lymphatic filariasis, onchocerciasis,
schistosomiasis, trachoma and soil-transmitted helminthiasis) in the Africa region at $0.26. The
major cost components for deworming are human resources, surveillance and mapping, non-
donated drugs, advocacy, infrastructure and logistics, and implementation and management. The
target population is school-age children (6-19 years-old) enrolled in primary and secondary
schools and the current coverage is assumed to be negligible.
D. SCHOOL-BASED PROMOTION OF GOOD HYGIENE
82. The cost of scaling up school-based promotion of hand-washing and good hygiene
behavior is estimated to be US$60 million. While promotion of WASH in schools normally
includes sustainable, safe water supply points, hand-washing stands and sanitation facilities; the
costing includes only the component for hygiene education. Due to unavailability of unit cost
estimate specifically for Nigeria, the unit cost is obtained from UNICEF report (2012) on WASH
in schools. The unit cost for hygiene education component is estimated to be US$2 per student
and includes the cost of capacity building, monitoring, advocacy, social mobilization. The target
population is school-age children and the current coverage is assumed to be negligible.
17
Most maize is for human consumption in Nigeria but some is also for other purposes. We were not able to
estimate how many hectares produce maize for human consumption versus other purposes.

59
PART VI – CONCLUSIONS AND POLICY IMPLICATIONS
83. Systematic costing of highly effective nutrition interventions is important for
priority-setting, resource mobilization and advocacy. Combining costing with estimates of
impact (in terms of DALYs and lives saved) and cost-effectiveness analysis will make the “case
for nutrition” stronger and will aid in priority setting by identifying the most cost-effective
packages of interventions in situations where financing is constrained. This will potentially be a
powerful evidence-based advocacy tool for policymakers when making budget allocations (i.e.
Ministry of Finance) as it provides useful evidence on what the government can “buy” (in terms
of DALYs and lives saved) given available resources, thereby maximizing allocative efficiencies.
84. Reaching full national coverage will be expensive and will require a significant
increase in the amount of public resources devoted to nutrition in Nigeria. As it is unlikely
that the government or its partners will find the $837 million necessary to reach full national
coverage, it is important to consider scenarios that make the most of the resources available.
Therefore, our findings and recommendations are based on cost-benefit analyses that can help
policy makers to prioritize the allocation of resources more effectively so as to maximize
allocative efficiencies and potential for impact. The scenarios (4a, 4b, 5a and 5b) proposed in this
report represent a compromise between the need to move to full coverage and the constraints
imposed by limited resources.
85. A high burden of malnutrition negatively impacts a nation’s human capital.
Therefore, an investment in improving nutrition outcomes among children is also an
investment in Nigeria’s economic future. All scenarios have the potential to increase the
economic productivity of beneficiaries once they enter the labor force. Reaching full national
coverage for all 10 nutrition-specific interventions could add as much as $2.6 billion annually to
the Nigerian economy, while the lower-cost scenario 5a would add US$1.04 billion annually.
Our analyses also find that all scenarios yield positive net present values, and most produce
internal rates of return greater than 18 percent. It should be noted that these estimates of
economic benefits are based on a highly conservative methodology that does not necessarily
account for all of the potential benefits associated with improving nutrition outcomes among
Nigerian children.
86. Although this report focuses extensively on nutrition specific interventions, the
causes of malnutrition are multisectoral and therefore any longer-term approach to
improving nutrition outcomes must include nutrition sensitive interventions. This analysis
takes an innovative approach to nutrition costing by not only estimating the costs and benefits of
nutrition-specific interventions, but also exploring costs for a selected number of nutrition-
sensitive interventions implemented outside of the health sector. We have identified four
candidate nutrition-sensitive interventions with high impact potential for Nigeria, including
biofortification of cassava, aflatoxin control, school-based deworming, and school-based
promotion of good hygiene. However, these interventions are just a starting point, and as the
Government begins to develop a multisectoral nutrition policy, it would be useful consult across
sectors and ministries in order to identify other possible nutrition sensitive interventions that are
cost-effective.

60
87. Overall, these findings point to a powerful set of nutrition-specific interventions and
a candidate list of nutrition-sensitive approaches that represent a highly cost-effective
approach to reducing the high levels of child malnutrition in Nigeria. Most of the
malnutrition that occurs in the first 1000 days of a child’s life is essentially irreversible.
Investing in early childhood nutrition interventions offers a window of opportunity to
permanently lock-in human capital, and to super-charge the potential demographic dividend in
Nigeria. This fits in to the President’s Transformational Agenda for Nigeria and the
government’s flagship Saving One Million Lives (SOML) initiative, which focus on six pillars,
one of which is nutrition. However, despite strong commitments to address malnutrition, the
government of Nigeria currently has no financial allocations for nutrition in FGoN’s 2014
budget.
88. Moving forward, these results will be useful to decision makers as they plan future
efforts to scale-up action against malnutrition in Nigeria and develop nutrition financing
plans that bring together the health, education and agriculture sectors. In the health sector,
plans for financing Universal Health Coverage (UHC) and SOML must include these costs under
the nutrition pillar of SOML. There also exist several opportunities to incorporate these highly
cost-effective interventions into the World Bank’s existing and pipeline investments in Health
(e.g. the State Health Project and planned support for SOML), agriculture (such as FADAMA III)
and education (e.g. the State Education Project and the Global Partnership on Education).

61
APPENDICES
Appendix 1: Partners Collaborating on Nutrition in Nigeria, 2014
Region and
State
Partners
Present Activities
NORTHWEST REGION
Jigawa Save the Children
ACF
MSF
UNICEF
WINN, EveryOne Advocacy
WINN, CMAM
CMAM
WINN; MNCHW; Zinc supp; IYCF
Kaduna None None
Kano UNICEF
World Bank
WHO
MCHPS
MNCHW, CMAM, IYCF, MNDC
RBM
MCHW, CMAM, IYCF, MNDC
MNCHW, CMAM, IYCF, MNDC
Katsina Save the Children CMAM (cash transfers), FSL project, EveryOne Advocacy
Kebbi UNICEF
Save the Children
ACF
WINN, CMAM, Zinc supp
WINN
WINN
Sokoto UNICEF
MSF Poland
CMAM and IYCF
CMAM and SAM treatment
Zamfara Save the Children
Save the Children
UK
UNICEF
ACF
WINN
CMAM and IYCF
WINN, CMAM; IYCF
WINN
NORTH-CENTRAL REGION
Benue SPRING
UNICEF and
HKI
IYCF
MNDC; IYCF; CMAM
FCT- Abuja SPRING IYCF
Kogi None None
Kwara None None
Niger UNICEF IYCF; MNDC; NISS
Nasarawa UNICEF
IHVN
MCHW; IYCF
RUTF Supply
Plateau None None
NORTHEAST REGION
Adamawa UNICEF CMAM; IYCF; MNDC
Bauchi None None
Borno UNICEF
HKI
Gombe ANJIHH
Save the Children
MNCHW
EveryOne Advocacy

62
UNICEF CMAM; IYCF
Taraba MITSOAH
UNICEF
MNCHW; SAM Treatment; IYCF; IDD Monitoring; Training
Yobe Save the Children
UNICEF
ACF
WINN Project
WINN Project
WINN Project
SOUTHEAST REGION
Abia UNICEF
BASICS II
IYCF; MNDC
IYCF; MNDC
Anambra None None
Ebonyi None None
Enugu UNICEF
WHO
GAIN
IYCF; MNDC; Treatment of SAM
MNDC
Imo None None
SOUTH-SOUTH REGION
SOUTHWEST REGION
Ekiti UNICEF MNCHW; MNDC
Lagos None None
Ogun UNICEF
FBFI
SAM Treatment; MNCHW; MNDC; Training
Support for IYCF
Ondo UNICEF MNCHW
Osun None None
Oyo UNICEF Vit A, Zinc, IFA Supp, Training, GMP equipment, IEC
materials, RUTF supplies, MNCHW
Source: Government documents and consultation with partners.

63
Appendix 2: Target Population Size
Region
Total
population and
population to
benefit from
iron
fortification of
staples
Children 0-23
months to
cover under
the community
nutrition
programs
Children 6-59
months not
covered by vitamin
A supplementation
Children 6-59
months to cover
under the
therapeutic zinc
supplementation
with oral
rehydration salts
Children 6-23
months not
covered by
multiple
micronutrient
powders
Children 12-
59 months
not covered
by
deworming
Pregnant women
not receiving iron
folic acid
supplementation
Population
not
consuming
iodized salt
Children 6-23
months to receive
complementary
feeding
Children 6-59
months not
treated for severe
acute malnutrition
(1) (2) (3) (4) (5) (6) (7) (8) (9) (10)
North-
Central 25,869,988 2,069,599 1,674,207 4,656,598 1,018,615 2,907,551 712,145 6,404,668 533,584 361,945
North-
Eastern 23,699,434 1,895,955 2,107,576 4,265,898 555,785 2,091,285 1,001,205 6,428,538 866,181 733,398
North-
Western 44,296,509 3,543,721 3,540,604 7,973,372 74,135 4,485,859 1,076,338 16,510,527 2,583,655 2,416,719
South-
Eastern 20,037,552 1,603,004 755,367 3,606,759 927,210 2,904,244 847,783 2,053,174 275,043 348,090
South-South 26,104,018 2,088,321 1,137,854 4,698,723 1,165,903 3,172,578 996,739 2,944,841 400,338 346,023
South-
Western 34,434,921 2,754,794 1,329,592 6,198,286 1,475,508 4,385,019 1,485,268 4,415,320 590,588 380,595
NATIONAL 174,442,422 13,955,394 10,545,198 31,399,636 5,217,156 19,946,536 6,119,478 38,757,068 5,249,389 4,586,771
Sources and notes (1) UNICEF 2013 projections based on the National Population Council (Total population)
(2) UNICEF 2013 projections based on the National Population Council (Children 0-23 months)
(3) UNICEF 2013 projections based on the National Population Council (Children 6-59 months) , State-level vitamin A coverage estimates from MICS 2011 report and September 2012
SMART survey results for 8 states (Borno, Jigawa, Kano, Katsina, Kebbi, Sokoto, Yobe, Zamfara)
(4) UNICEF 2013 projections based on the National Population Council (Children 6-59 months)
(5) UNICEF 2013 projections based on the National Population Council (Children 6-23 months)
(6) UNICEF 2013 projections based on the National Population Council (Children 12-59 months), State-level deworming coverage estimates from the FMOH 2012 programmatic data from the
first round of MNCH weeks in 2012 and September 2012 SMART survey results for 8 states (Borno, Jigawa, Kano, Katsina, Kebbi, Sokoto)
(7) UNICEF 2013 projections based on the National Population Council (Total population), State-level iron folic acid coverage estimates from the FMOH 2012 programmatic data from the first
round of MNCH weeks in 2012
(8) UNICEF 2013 projections based on the National Population Council (Total population), Percent of households consuming iodized salt from MICS 2011
(9) UNICEF 2013 projections based on the National Population Council (Children 6-23 months), State-specific data on underweight from MICS 2011
(10) UNICEF 2013 projections based on the National Population Council (Children 6-59 months), State-specific data on severe wasting from MICS 2011, UNICEF provided coverage data for
11 states (Adamawa, Bauchi, Borno, Gombe, Yobe, Jigawa, Kano, Katsina, Kebbi, Sokoto, Zamfara)
This represents the total population of children 6-59 months not treated for severe acute malnutrition although we expect to reach 80 percent of this population

64
Appendix 3: Data Sources and Relevant Assumptions
Intervention Costed delivery platform Cost estimate Source Assumptions
Behavior change interventions
Breastfeeding promotion Community nutrition
programs
Included in community
nutrition programs $ 5
per participant per year
UNICEF (2013) Behavior change campaign
interventions cost US$ 5 per child
under five years of age and we
assume there are two children under
five years of age per participating
mother. Focus is on exclusive breast
feeding, infant and young child
complementary food, hygiene
practices among others.
Education on appropriate
complementary feeding
practices (excluding
provision of food)
Community nutrition
programs
Included in community
nutrition programs
UNICEF (2013) Assume zero additional cost as it is
included in community nutrition
program
Hand washing Community nutrition
programs
Included in community
nutrition programs
UNICEF (2013) Assume zero additional cost as it is
included in community nutrition
program
Micronutrients and deworming interventions

65
Vitamin A
supplementation
Maternal, New Born and
Child Health Weeks
US$ 0.44 per child per
year. Freight and
handling costs added to
the unit capsule cost of
US$0.02
UNICEF (2013);
Federal Republic of
Nigeria (2011); Takang
et al (2012); Katsina
State Government
(2012); Anger (2012);
Federal Capital
Territory (2012);
Zoakah (2012);
Ososanya (2013)
Supplements are distributed through
biannual MNCH weeks, with
overhead costs (for planning;
advocacy; social mobilization;
health worker and volunteer
training; monitoring; supervision;
and logistics support to fixed
facilities and outreach stations)
shared with other interventions
(therapeutic zinc supplementation
with ORS, deworming and iron
folic acid supplementation).
Therapeutic zinc
supplementation with
ORS
Maternal, New Born and
Child Health Weeks
US$0.86 per child per
year.
UNICEF (2013);
Takang et al (2012)
Each child is assumed to have 2-3
episodes of diarrhea per year with
average of 12 tablets needed to treat
one episode. MNCHW
implementation overhead costs are
shared with other interventions
Micronutrient powders Community nutrition
programs
US$1.80 per child 6-11
months of age per year
and US$3.60 per year
per child 12-23 months
of age.
Horton et al (2010) Global estimates are used. There is
insufficient information on in-
country implementation of this
intervention that is just
commencing in 2 of 36+1 states.

66
Deworming Maternal, New Born and
Child Health Weeks
US$0.44 per child 12-59
months of age per year
UNICEF (2013);
Federal Republic of
Nigeria (2011); Takang
et al (2012); Katsina
State Government
(2012); Anger (2012);
Federal Capital
Territory (2012);
Zoakah (2012);
Ososanya (2013)
Assume ½ tablet of Albendazole
per child 12 – 23 months of age and
one tablet per child 24 – 59 months
of age is given in each round of the
biannual MNCHW. Overhead costs
are shared with other interventions
Iron-folic acid
supplementation for
pregnant women
Maternal, New Born and
Child Health
Weeks/Community
nutrition programs
US$ 1.79 per pregnancy
through MNCHW;
US$2.00 per pregnancy
through community
nutrition programs
UNICEF (2013);
Federal Republic of
Nigeria (2011); Takang
et al (2012); Katsina
State Government
(2012); Anger (2012);
Federal Capital
Territory (2012);
Zoakah (2012);
Ososanya (2013);
Horton et al (2010)
Assume daily IFA supplementation
for last two trimesters of pregnancy
(about 180 tablets) delivered
through MNCHWs to 40% of target
population and remaining reached
through community nutrition
programs and ANTE-NATAL
CARE services. MNCHW overhead
costs shared with other
interventions. Provision made for
weekly SMS reminders
Iron fortification of staple
foods
Market-based delivery
systems
US$0.20 per person per
year (flour fortification)
Horton et al (2010);
Aminu (2013);
UNICEF (2013)
Global estimate is used. No specific
information on Nigeria available.
Salt iodization Market-based delivery
systems
US$0.05 per person per
year
Horton et al (2010);
Aminu (2013)
Global estimate is used. No specific
information on Nigeria available.
Complementary and
therapeutic food
interventions

67
Treatment of severe acute
malnutrition
Primary Health Care and
Community Nutrition
Programs
US$80.00 per child per
episode
UNICEF (2013) Food cost about US$50. Additional
costs are for freight and handling;
training, monitoring and
supervision of health workers; and
provision of equipment. Cases are
managed in PHC facilities.
Screening carried out at community
and facility levels.
Prevention/treatment of
moderate malnutrition
Community Nutrition
Programs or Primary health
care system
US$51.10 per child per
year
Horton et al (2010);
UNICEF (2013)
Global estimate is used. There is no
programmatic delivery mechanism
as yet in Nigeria.

68
Appendix 4: Methodology for Estimating Costs for Nigeria
The following steps lay out the methodology used to estimate costs for each intervention:
1. Description of each intervention;
2. Definition of target populations for each intervention;
3. Estimation of the size of the target populations for each intervention in each state/region
using the most current demographic data;
4. Specification of the delivery platform or channel(s) for each intervention, based on the
country context and the accepted delivery modes;
5. Data on the current coverage levels for each intervention in each state/region;
6. Estimation of unit cost per beneficiary for each intervention from program experience in
Nigeria, whenever possible, and/or Africa region;
7. Calculation of additional costs of scaling up to full coverage by multiplying the unit cost for
each intervention with the size of the “uncovered” target population for each intervention by
state/region. The formula for calculation is:
where:
= additional costs of scaling up to full coverage
= unit cost per beneficiary
= current coverage level (percentage)
8. Estimation of additional resources for: (i) capacity development for program delivery and (ii)
M&E and technical support, estimated at 9% and 2% of total cost of interventions,
respectively;
9. Estimation of a portion of the total cost that can be covered by private household resources. It
is assumed that households above poverty line could cover the cost of iron fortification,
multiple micronutrient powders, salt iodization and complementary food from private
resources;
10. Calculating the annual public investment required to scale up these interventions to full
coverage using the following formula:
where:
Y = annual public investment required to scale up to full coverage
= additional total cost to scale up to full coverage
= additional cost for capacity development, M&E, and technical assistance
= cost covered by households living above poverty line for selected interventions
Full coverage is defined as 100% of the target population for all interventions except the
treatment of severe acute malnutrition, which is set to 80%. This is consistent with World Bank
(2010a) methods and is based on the reality that few community-based treatment programs have
successfully achieved more than 80% coverage at scale.

69
Appendix 5: Methodology for Estimating DALYs for Nigeria
The following steps were undertaken to estimate the impact in DALYs averted of implementing
the various nutrition interventions:
1. Estimate the effectiveness of each intervention on mortality and morbidity for each
targeted cause
2. Calculate the rate of YLL and YLD due to each cause-risk factor combination for the
target population
3. Calculate the DALYs averted under current or counterfactual coverage scenario
4. Calculate the DALYs averted under the proposed intervention coverage scenario
5. Calculate the net DALYs averted by the proposed intervention
1. Estimate the effectiveness of each intervention on mortality and morbidity for each
targeted cause
To estimate the effectiveness of the interventions, key articles by Black et al and Bhutta et al in
the Lancet series on maternal and child undernutrition were first consulted. Additional literature
searches for the latest evidence were conducted in the Pubmed online database and the Cochrane
Library of systematic reviews and meta-analyses. Effectiveness figures that were reported as
statistically significant were extracted and used for the calculations.
2. Calculate the rate of YLL and YLD
The WHO’s 2012 Global Health Estimates (GHE 2012) data tables provide country-specific
YLL and YLD rates for each cause of death or disease. GHE 2012 morbidity and mortality
estimates were used in combination with country-specific population attributable fractions (PAF)
from the 2010 GBD. This assumes that the risk factor impacts on morbidity and mortality did
not differ significantly between the two estimates.
To calculate the rate of morbidity and mortality from a cause due to a specific risk factor, the first
step is to calculate the PAF for the cause-risk factor combination. The PAF was extracted from
the country-specific risk factor attribution table from the 2010 GBD data. This was done
separately for YLL and YLD. In the second step, the country-specific YLLs and YLDs for the
target population, in most cases under-fives, were extracted from the GHE 2012 estimates. To
calculate the YLL rate, the country-specific YLL is multiplied by the YLL PAF and then by
100,000. The final figure is divided by country-specific population of interest (usually under-
fives) to get the rate. The same final steps are followed to calculate the YLD, although instead
multiplying country-specific YLDs by the YLD PAF. The population estimate for the rate
calculation was extracted from GHE 2012.
YLL per 100,000 = (U-5_cause_total_YLL * YLL_PAF * 100,000)/U-5_ population
YLD per 100,000 = (U-5_cause_total_YLD * YLD_PAF * 100,000)/U-5_population

70
3. Calculate counterfactual DALYs averted
To calculate the DALYs averted if current intervention coverage were maintained, the following
formula was used: YLL = U-5_population_intervention_year * current_coverage * intervention_mortality_reduction * YLL_rate
YLD = U-5_population_intervention_year * current_coverage * intervention_morbidity_reduction * YLL_rate
DALY_current = YLL+YLD
4. Calculate total DALYs averted under intervention coverage
To calculate the potential DALYs averted under the intervention coverage, a similar formula as
above was used:
YLL = U-5_population_intervention_year * intervention_coverage * intervention_mortality_reduction * YLL_rate
YLD = U-5_population_intervention_year * intervention_coverage * intervention_morbidity_reduction * YLL_rate
DALY_intervention = YLL+YLD
5. Calculate net DALYs averted
The potential net DALYs averted by the intervention is:
DALYs averted = DALY_intervention - DALY_current

71
Appendix 6: Methodology for Nigeria LiST estimates
The Lives Saved Tool (LiST) is a part of an integrated set of tools that comprise the Spectrum
policy modeling system. These tools include DemProj for creating demographic projections;
AIM to model and incorporate the impact of HIV/AIDS on demographic projections and child
survival interventions; and FamPlan for incorporating changing fertility into the demographic
projection. LiST is used to project how increasing intervention coverage would impact child and
maternal survival. The table below summarizes data sources used for the Nigeria LiST estimates.
Nigeria LiST estimates - Data Sources
Demographic data Source
First year population 2011 MICS and provided Cost table
Sex ratio at birth 2011 MICS
Life expectancy 2008 NDHS
Family Planning
Unmet need 2011 MICS
Total fertility rate 2011 MICS
Age-specific fertility rate Used sub-Saharan Africa model
Health, mortality, economic status
Vitamin A deficiency 2011 MICS
Zinc deficiency
Estimating the global prevalence of zinc
deficiency: results based on zinc availability in
national food supplies and the prevalence of
stunting. PLoS One. 2012;7(11):e50568. doi:
10.1371/journal.pone.0050568. Epub 2012 Nov
29.
Diarrhea incidence
Diarrhea incidence in low- and middle-income
countries in 1990 and 2010: a systematic review.
Fisher Walker CL. BMC Public Health 2012, 12:220
Severe pneumonia incidence
Global burden of childhood pneumonia and diarrhoea.
Fischer Walker C, Rudan I, Liu L, Nair H,
Theodoratou W, Bhutta ZA, O’Brien KL, Campbell H,
Black RE. Lancet 2013; 381: 14
Malaria exposure (women)
The Limits and Intensity of Plasmodium
falciparum Transmission: Implications for Malaria
Control and Elimination Worldwide. Guerra CA,
Gikandi PW, Tatem AJ, Noor AM, Smith DL, et
al. PLoS Medicine Vol. 5, No. 2, e38
Stunting distribution
LiST default; data has been calculated using DHS
and MICS datasets.
Wasting distribution
LiST default; data has been calculated using DHS
and MICS datasets.
Neonatal mortality 2008 DHS
Infant mortality 2011 MICS

72
Child mortality 2011 MICS
Distribution of causes of death
Liu L, Johnson HL, Cousens S, Perin J, Scott S,
Lawn JE, Rudan I, Campbell H, Cibulskis R, Li
M, Mathers C, Black RE. Global, regional, and
national causes of child mortality: an updated
systematic analysis for 2010 with time trends since
2000. Lancet, 379(9832):2151 - 2161
Maternal mortality ratio 2008 DHS
Household poverty status 2008 DHS
Household size 2008 DHS
Once the demographic and health data have been updated, the coverage and scale-up plan for
each intervention is introduced into LiST. LiST can use either a sequential method to calculate
the impact of individual interventions or LiST can calculate the simultaneous impact of a set of
interventions implemented at the same time. The second, simultaneous method is like to yield
slightly lower estimates because interventions may have overlapping benefits. In this analysis we
present the both the individual/sequential results of the individual interventions in the “full
coverage” scenario (with totals calculated using the simultaneous method) and the simultaneous
impact in the various scale-up scenarios.
Note on Estimates of Cases of Stunting Averted:
In order to estimate the number of cases of under-five stunting averted attributable to the annual
investment in scaling up of nutrition interventions, we use LiST to model changes in the
prevalence of stunting over 5 years during which the interventions have reached 100 percent
scale. Next, we model changes in the prevalence of stunting over 5 years with no scale-up of the
interventions. We then take the difference between the estimated stunting prevalence in year 5
with the scale up and the prevalence in year 5 absent a scale-up, and multiply this percentage
point difference by the total population of children under five.
Our reason for using stunting prevalence in year 5 relates to the assumptions built into the LiST
model, which assumes that stunting is itself a risk factor for becoming stunting in the next time
period. As a result, stunting prevalence remains flat during the first two years of the scale-up,
before dropping precipitously until year 5, after which the prevalence begins to level out. We
assume that continuing investments in maintaining scale after year 5 will serve to maintain the
gains in stunting prevalence reduction, and therefore we present this reduction as the benefits
attributable to a one-year investment in scaling up nutrition.
On the other hand, when estimating stunting reduction (and lives saved) attributable to a five year
scale up plan, we model this scale up directly in LiST and use the annual results over 5 years in
our cost-benefit analysis. This provides a more accurate portrayal of the direct benefits
attributable to a five year scale up plan, and does not assume that the scale will necessarily be
maintained following the end of the period covered in the plan.

73
Appendix 7: Methodology for Estimating Economic Benefits
There is considerable debate in the literature regarding the methodology for monetizing the value
of a life saved. In this analysis, we chose to focus solely on the economic value of a life year,
which we measure as equal to GNI per capita. Other studies also attempt to estimate the social
value of a life year, and therefore we acknowledge that our results may underestimate the true
value of a life year saved.
Still, valuing years of life saved alone does not account for the economic benefits of reduced
morbidity, which includes the long-term, non-lethal impacts of malnutrition on individuals.
While there are a number of long-term impacts of nutritional deficiencies, we choose to focus on
stunting given the availability of country-specific impact estimates produced by the LiST tool.18
In order to estimate the value of a case of childhood stunting averted, we follow the methodology
used in Hoddinott et al. (2013), the authors begin by assuming that stunted individuals lose an
average of 66% of lifetime earnings, based on direct estimates of the impact of stunting in early
life on later life outcomes found in Hoddinott et al. (2011).19 This point estimate for the effects of
stunting on future consumption is used as a proxy for the effect of stunting on lifetime earnings.
Additionally, Hoddinott et al. (2013) account for uncertainty by assuming that only 90% of the
total gains will be realized, which we also include in our calculations. However, unlike the
authors, we also adjust our calculations to reflect the country’s labor force participation rate.
For both lives saved and cases of stunting averted, the benefits of a five year scale up plan are
attributed to a group of children that is assumed to enter the labor force at age 15 and exit the
labor force at age 52, which is equivalent to Nigeria’s life expectancy at birth. Benefits from both
stunting and lives saved are then multiplied by a lifetime discount factor (LDF) derived from
three potential discount rates (3% 5% and 7%), an adjustment for age at the time of investment
(for simplicity we assume an average age of two years for all children), as well as the years of
lifetime productivity expected. The LDF represents the years of productivity that are “counted” in
the calculation, discounted back to their present value in the year in which the investment in
nutrition is made. As we assume an average age of two years for all beneficiaries, we use an LDF
that assumes that these children will enter the labor force in 13 years from the time of
investment. Importantly, given the time frame considered under this analysis (50 years), we do
not attempt to account for projected growth in the country’s GDP and per capita incomes. This
downward bias contributes to the conservative nature of our estimates.
The following equations are used to estimate 1) the economic value of lives saved (reduced
mortality); and 2) increased future productivity (reduced morbidity):
18
It should be noted that because stunting is just one of many long-term consequences of poor nutrition, actual
economic benefits may be much higher than estimated here.
19 Hoddinott et al. (2011) provided direct estimates of the impact of stunting in early life on later life outcomes,
which found that an individual stunted at age 36 months had, on average, 66% lower per capita consumption over his or her productive life.

74
1)
2)
Where:
Lives saved attributable to the intervention scale up are estimated using the LiST tool.
Cases of child stunting averted are calculated by subtracting the under five stunting
prevalence (%) after the intervention calculated by LiST from the stunting prevalence in
year 0 and multiplying it by the total under five population.
The coefficient of deficit is equal to the reduction in lifetime earnings attributable to
stunting.
The lifetime discount factor (LDF) is used to discount future benefits to their value at the
time of investment. It is derived from a discount rate, age at the time of investment and
the estimated age of entry and exit into the workforce. The equation used to calculate the
LDF is:
Where:
o LDF is the lifetime discount factor
o r is the discount rate
o t is the number of years since the initial investment in scaling up the interventions
(we assume that children enter the labor force at 15 years old, which is reflected in
the starting value for t)
o n is the life expectancy at birth

75
The following values and sources are used in our calculations:
Indicator Value Source
GNI per capita $2,710 World Bank 2013
Life expectancy at birth 52 years World Bank 2011
Labor force participation rate 56% World Bank 2012
Coefficient of deficit (stunting) 0.66 Hoddinott 2011
Actual gains realized 90% Hoddinott 2013
To arrive at a Net Present Value (NPV), we use the following equation:
Finally, the annual addition to economic productivity is measured by taking the total economic
benefits for a year in which all beneficiaries of the initial one-year investment have reached
productive age (i.e. in year 13). These benefits are not discounted back to their present value, as
they are considered the annual opportunity cost of not investing in scaling up nutrition
interventions. It should be noted that these benefits are derived from a progressive, 5-year scale
up plan, and therefore subsequent investments that maintain the target scale will increase the
total annual benefits as new beneficiaries are reached.

76
Appendix 8: Scenario 5a Costs and Benefits by Intervention and by State
Interventions Annual Public
Investment (US$
million)
Annual Benefits
DALYs
Saved
Lives
Saved
Cases of Stunting
Averted
Community programs for growth promotion $34.9 2,897,931 8,974 1,859,167
Vitamin A supplementation $3.3 112,190 1,485 303,844
Therapeutic zinc Supplementation with ORS $21.6 100,216 4,278 n/a
Micronutrient powders $17.5 383,927 n/a n/a
Deworming $15.1 57,125 n/a n/a
Iron-folic acid supplementation $10.2 232,146 321 12,033
Iron fortification of staple foods $34.9 n/a n/a n/a
Salt Iodization $1.9 n/a n/a n/a
Comp. Food for Prevention of MAM $119.4 44,337 998 2,006,577
CMAM for Severe Malnutrition $112.7 560,544 5,859 n/a
TOTAL (WHEN IMPLEMENTED
SIMULTANEOUSLY) $371.3 4,388,415 96,463 1,434,988
Capacity development for program delivery $33.5
M&E, operations research $7.5
Household contributions ($59.3)

77

78

79
Region StateAnnual Public
Investment RequiredDALYs Saved Lives Saved
Cases of
Stunting
Averted
North-Central FCT Abuja 4,054,345.00$ 61,134 1,042 36,843
North-Central Benue 6,225,220.00$ 139,869 2,536 94,717
North-Central Kogi 5,414,105.00$ 95,843 1,843 71,360
North-Central Kwara 3,774,728.00$ 72,240 1,704 78,638
North-Central Nasarawa 3,767,046.00$ 52,536 1,099 44,765
North-Central Niger 11,100,147.00$ 147,505 3,431 157,508
North-Central Plateau 7,911,189.00$ 86,306 1,755 69,495
North Central Subtotal 42,246,780.00$ 655,433 13,409 553,327
North-Eastern Adamawa 8,065,568.00$ 86,554 1,702 64,804
North-Eastern Bauchi 13,663,113.00$ 142,287 3,262 138,613
North-Eastern Borno 13,285,009.00$ 141,535 3,924 190,676
North-Eastern Gombe 5,062,981.00$ 72,219 1,807 83,725
North-Eastern Taraba 4,326,340.00$ 66,854 1,519 65,693
North-Eastern Yobe 9,599,948.00$ 76,926 2,044 96,610
North Eastern Subtotal 54,002,959.00$ 586,374 14,258 640,122
North-Western Jigawa 15,211,657.00$ 166,531 4,260 206,699
North-Western Kaduna 33,857,310.00$ 200,701 4,195 176,909
North-Western Kano 46,356,488.00$ 272,406 6,616 289,423
North-Western Katsina 18,534,774.00$ 197,333 4,921 231,504
North-Western Kebbi 8,615,081.00$ 103,333 2,855 140,007
North-Western Sokoto 10,572,566.00$ 146,591 3,771 181,721
North-Western Zamfara 8,943,700.00$ 123,773 3,359 164,301
North Western Subtotal 142,091,577.00$ 1,210,668 29,977 1,390,564
South-Eastern Abia 5,472,679.00$ 85,312 1,747 73,927
South-Eastern Anambra 10,265,662.00$ 119,018 2,098 77,712
South-Eastern Ebonyi 3,971,693.00$ 62,020 1,265 51,427
South-Eastern Enugu 4,702,636.00$ 98,171 2,037 87,469
South-Eastern Imo 6,347,482.00$ 106,873 1,942 71,273
South Eastern Subtotal 30,760,152.00$ 471,393 9,089 361,808
South-South Akwa-Ibom 6,960,856.00$ 119,005 2,007 70,895
South-South Bayelsa 2,258,387.00$ 45,746 865 32,638
South-South Cross-River 4,333,959.00$ 85,324 1,583 60,679
South-South Delta 9,358,653.00$ 125,650 2,760 119,431
South-South Edo 5,423,803.00$ 89,706 1,734 68,490
South-South Rivers 9,048,647.00$ 162,807 3,355 143,554
South South Subtotal 37,384,305.00$ 628,238 12,304 495,688
South-Western Ekiti 3,832,535.00$ 70,221 1,145 39,422
South-Western Lagos 14,973,298.00$ 272,248 5,778 248,925
South-Western Ogun 7,592,819.00$ 116,066 2,625 117,158
South-Western Ondo 5,057,529.00$ 104,722 2,286 101,254
South-Western Osun 5,240,210.00$ 92,287 1,652 60,984
South-Western Oyo 9,792,834.00$ 180,754 3,940 172,359
South Western Subtotal 46,489,225.00$ 836,298 17,426 740,100
GRAND TOTAL 352,974,998.00$ 4,388,404 96,463 4,181,609
BENEFITS

80
Appendix 9: Sensitivity Analysis
Full National coverage
Assumption Changed Effect on Total Cost
Iron fortification of staple foods costs double Increase from $837.2 million to
$862.9 million
All micronutrient and deworming unit cost doubles Increase from $837.2 million to
$944.9 million
Community nutrition program unit cost doubles Increase from $837.2 million to
$914.7 million
Complementary food unit cost doubles Increase from $837.2 million to
$1,163.5 million
CMAM for SAM unit cost doubles Increase from $837.2 million to
$1,163.1 million
Iron fortification of staple foods costs reduced by
50%
Decrease from $837.2 million
to $824.4 million
All micronutrient and deworming unit cost
reduced by 50%
Decrease from $837.2 million
to $783.4 million
Community nutrition program unit cost reduced
by 50%
Decrease from $837.2 million
to $798.5 million
Complementary food unit cost reduced by 50% Decrease from $837.2 million
to $674.1 million
CMAM for SAM unit cost reduced by 50% Decrease from $837.2 million
to $674.3 million
Scenario 5a
Assumption Changed Effect on Total Cost
Iron fortification of staple foods costs double Increase from $352.98 million
to $391.7 million
All micronutrient and deworming unit cost doubles Increase from $352.98 million
to $447.8 million
Community nutrition program unit cost doubles Increase from $352.98 million
to $378.6 million
Complementary food unit cost doubles Increase from $352.98 million
to $447.4 million
CMAM for SAM unit cost doubles Increase from $352.98 million
to $478.1 million
Iron fortification of staple foods costs reduced by
50%
Decrease from $352.98 million
to $340.1 million
All micronutrient and deworming unit cost
reduced by 50%
Decrease from $352.98 million
to $305.6 million
Community nutrition program unit cost reduced
by 50%
Decrease from $352.98 million
to $333.6 million

81
Complementary food unit cost reduced by 50% Decrease from $352.98 million
to $305.8 million
CMAM for SAM unit cost reduced by 50% Decrease from $352.98 million
to $290.4 million

82
REFERENCES
Abt Associates. 2014. Country Assessment for Aflatoxin Contamination and Control in
Nigeria. January 8. Bethesda, MD: Abt Associates.
Arimond M, C. Hawkes, M.T. Ruel et al. 2011. “Agricultural interventions and nutrition:
Lessons from the past and new evidence”. In Combating Micronutrient Deficiencies: Food-
based Approaches. Rome: FAO.
Asare-Marfo, D,, E. Birol, C. Gonzalez, M. Moursi, S. Perez, J. Schwarz and M. Zeller.
2013. “Prioritizing Countries for Biofortification Interventions Using Country-Level Data.”
HarvestPlus Working Paper No. 11(October 2013). Washington, DC: HarvestPlus.
Awasthi, S. et al. 2013. “Population deworming every 6 months with albendazole in 1
million pre-school children in north India: DEVTA, a cluster-randomized trial.” Lancet.
381(9876):1478-86.
Baird, S., J.H. Hicks, M. Kremer and E. Miguel. 2011. Worms at work: long run impacts of
child health gains. Working paper. Harvard University
Bandyopadhyay, R. (IITA plant pathologist). 2013. Personal communication (Nigeria).
Bandyopadhyay, R. and J. Cotty. 2013. “Biological Controls for Aflatoxin Reduction.” in
Unnevehr, L. and D. Grace, eds. “Aflatoxins: Finding Solutions for Improved Food Safety.”
2020 Focus Brief #20 (16). Washington, DC: International Food Policy Research Institute.
Behrman, J.R., M.C. Calderon, S.H. Preston, J. Hoddinott, R. Martorell and A.D. Stein.
2009. “Nutritional supplementation in girls influences the growth of their children:
Prospective study in Guatemala.” American Journal of Clinical Nutrition 90(1):1372-9.
Bhutta, Z., T. Ahmed, R. Black, S. Cousens, K. Dewey, E. Giugliani, B. Haider, B.
Kirkwood, S. Morris, H. Sachdev and M. Shekar. 2008. “What works? Interventions for
maternal and child undernutrition and survival.” The Lancet 371:417‐440.
Bhutta Z.A., et al., for the Maternal and Child Undernutrition Study Group. 2013. “Evidence-
based interventions for improvement of maternal and child nutrition: what can be done and at
what cost?” Lancet; Maternal and Child Nutrition series.
Birol et al. 2014. Cost-effectiveness of biofortification revisited. Washington, DC:
HarvestPlus, Preliminary results as cited in HarvestPlus Biofortification Progress Brief #25.
Washington, DC:HarvestPlus.
http://www.harvestplus.org/sites/default/files/Biofortification_Progress_Briefs_August2014_
WEB_0.pdf

83
Black R.E., et al., for the Maternal and Child Undernutrition Study Group. 2008. “Maternal
and child undernutrition: global and regional exposures and health consequences.” Lancet;
371: 243-60
Black R.E., et al., for the Maternal and Child Under nutrition Study Group. 2013. “Maternal
and child undernutrition and overweight in low-income and middle-income countries.”
Lancet; Maternal and Child Nutrition series.
Bleakley, H. 2007. “Disease and Development: Evidence from Hookworm Eradication in the
American South.” Quarterly Journal of Economics 122(1):73-117
Bloom D., J. Finlay, S. Humair et al. 2010. “Prospects for economic growth in Nigeria: A
demographic perspective.” Paper presented at the IUSSP Seminar on Demographics and
Macroeconomic Performance held at Novotel, Gare de Lyon, Paris, France 4-5 June 2010.
Bolt, E. and S. Cairncross. 2004. “Sustainability of Hygiene Behaviour and the Effectiveness
of Change Interventions: Lessons learned on research methodologies and research
implementation from a multi-country research study.” IRC International Water and Sanitation
Centre, Delft, the Netherlands.
Caulfield, L.E., M. de Onis, M. Blossner, and R.E. Black. 2004. “Undernutrition as an
underlying cause of child deaths associated with diarrhea, pneumonia, malaria, and measles.”
American Journal of Clinical Nutrition. 80(1): 193-198.
DCP2 (Disease Control Priorities Project). 2008. Deworming Children Brings Huge Health
and Development Gains in Low-Income Countries. Seattle, WA: University of Washington.
Ejemot, R, et al. 2008. “Hand-washing for Preventing Diarrhoea,” Cochrane Database of
Systematic Reviews. Issue 1.
Ezzati M, A.D. Lopez, A. Rogers, S. Vander Hoorn and C.J. Murray. 2002. “Selected major risk factors and global and regional burden of disease.” Lancet; 360: 1347-60
Ezzati M., A.D. Lopez, A. Rogers and C.J. Murray. 2004. “Comparative quantification of health risks: The global and regional burden of disease attributable to selected major risk factors.” Geneva: World Health Organization.
Fiedler, J. 2010. The Cost of Micronutrient Interventions. Washington DC: HarvestPlus.
Global Burden of Disease Study. 2010. Institute for Health Metrics and Evaluation
http://www.healthmetricsandevaluation.org/gbd
Goodman C., P. Coleman and A. Mills. 2000. Economic analysis of malaria control in Sub-
Saharan Africa. Geneva: Global Forum for Health Research.

84
Government of Nigeria. 2013. National Strategic Plan of Action for Nutrition (2014-2018).
Abuja, Nigeria.
Guyatt, H.L. 2003 “The Cost of delivering and sustaining a control programme for
schistosomiasis and soil-transmitted helmithiasis.” Acta Tropica 86:267-74.
Heckman, J. J. and D. Masterov. 2004. “The productivity argument for investing in young
children.” Technical Report Working Paper No. 5, Committee on Economic Development.
Hoddinott J., J. Maluccio, J. Behrman, R. Martorell, P. Melgar, and A.R. Quisumbing.
2011. The consequences of early childhood growth failure over the life course. Discussion
Paper 1073, Washington, DC: International Food Policy Research Institute.
Hoddinott, J. M. Rosegrant, M. Torero. 2012. “Investments to reduce hunger and
undernutrition.” Challenge Paper prepared for the 2012 Copenhagen Consensus.
Hoddinott, J., H. Alderman, J.R. Behrman, L Haddad and S. Horton. 2013. “The economic
rationale for investing in stunting reduction.” Maternal and Child Nutrition 9(Suppl. 2):69-
82.
Horton S. 1999. “Opportunities for Investment in nutrition in low-income Asia.’ Asia
Development Review, 17:246-73.
Horton S. and J. Ross. 2003. “The economics of iron deficiency.” Food Policy. 28(1)51-75.
Horton S. and R. Steckel. 2013. “Global economic losses attributable to malnutrition 1900–
2000 and projections to 2050.” In The Economics of Human Challenges, ed B. Lomborg
Cambridge, U.K.: Cambridge University Press.
Hotez, P. P.J. Brindley, J.M. Bethony et al. 2008. “Helminth infections: the great neglected
tropical disease.” The Journal of Clinical Investigation 118 (4): 1312
Hotz C, Loechl C, De Brauw A, et al. 2012a. « A large scale intervention to introduce orange
sweet potato in Mozambique increases vitamin A intakes among child and women.” British
Journal of Nutrition. 108: 163-76.
Hotz C, Loechl C, Lubowa A, et al. 2012b. « Introduction of B carotene-rich orange sweet
potato in rural Uganda resulted in creased vitamin A intakes among children and women and
improved vitamin A status among children.” Journal of Nutrition. 142: 1871-80
J-PAL (Abdul Latif Jameel Poverty Action Lab). 2012. Deworming: A Best Buy For
Development. J-PAL Policy Bulletin. March, 2012. Boston, MA: Massachusetts Institute of
Technology.
85
Khlangwiset, P. 2011. “Reducing the Risks of Aflatoxin Through Public Health
Interventions.” Doctoral dissertation. University of Pittsburg.
Khlangwiset, P and Wu F. 2011. “Cost and efficacy of public health interventions to reduce
aflatoxin-induced human diseases.” Food Addit Contam Part A Chem Anal Control Expo
Risk Assess. July; 27 (7): 998-1014
Kuniholm, M. H., O.A. Lesi, M. Mendy, et al. 2008. “Aflatoxin exposure and viral hepatitis
in the etiology of liver cirrhosis in the Gambia, West Africa.” Environ Health Perspect,
116(11), 1553-1557.
Liu Y., and F. Wu. 2010. “Global Burden of Aflatoxin-Induced Hepatocellular Carcinoma: A
Risk Assessment.” Environmental Health Perspectives 118:818-824.
Lorntz B. et al. 2006. “Early Childhood Diarrhea Predicts Impaired School Performance.”
The Pediatric Infectious Disease Journal, vol. 25, no. 6, June 2006, pp. 513–520.
Masset E, L. Haddad, A. Cornelius and J. Isaza-Castro. 2011, “A systematic review of
agricultural interventions that aim to improve nutritional status of children.” London: EPPI-
Centre, Social Science Research Unit, Institute of Education, University of London.
Maziya-Dixon B.B. et al. 2006. “Vitamin A deficiency is prevalence in children less than 5
years-old.” Journal of Nutrition. Aug 136 (8): 2255-61
Menakshi J. et.al. 2010. “How cost-effective is biofortification in combating micronutrient
malnutrition? An ex-ante assessment.” World Development 38(1): 64-75.
Miguel, E and M. Kremer. 2004. “Worms: identifying impacts on education and health in the
presence of treatment externalities.” Econometrica 72(1): 159-217
Murray C.J. et al. 2013. “Disability-adjusted life years (DALYs) for 291 diseases and injuries
in 21 regions, 1990-2010: a systematic analysis for the Global Burden of Disease Study.”
Lancet 380 (9859): 2197–223.
Nigeria Multiple Indicators Cluster Survey (MICS). 2011. National Bureau of Statistics
(NBS).
Nigeria Demographic and Health Survey (NDHS). 2008.
http://microdata.worldbank.org/index.php/catalog/1459

86
Results for Development (R4D). 2014. Saving One Million Lives Fiscal Space Analysis.
(Preliminary Results March 2014).
Ruel M., et al., for the Maternal and Child Undernutrition Study Group. 2013: Nutrition-
sensitive interventions and programmes: how can they help to accelerate progress in
improving maternal and child nutrition? Lancet; Maternal and Child Nutrition series.
Seddoh, A. et al. 2013. “Towards Investment Case for Neglected Tropical Diseases.”
Working paper for Lancet Commission on Investing in Health. Draft
Shephard GS, P. Khlangsiwet and Wu F. 2011. “Aflotoxin and growth impairment: A
review.” Critical Review of Toxicology. October. 41(9):740-55.
Spears, D. 2013. “How much international variation in child height can sanitation explain?”
World Bank Policy Research Working Paper 6351. Washington, DC: World Bank
Stenberg K. et al. 2013. “Advancing social and economic development by investing in
women’s and children’s health: a new Global Investment Framework.” The Lancet Health
Policy, Published Online November 19, 2013 http://dx.doi.org/10.1016/50140-
6736(13)62231-x. p.8.
Strauss, J. and D. Thomas. 1998. “Heath, Nutrition and Economic Development.” Journal of
Economic Literature. 36(1):766-817.
UNICEF. 2012. Water, sanitation and hygiene (WASH) in schools. New York: UNICEF.
Unnevehr, L. and D. Grace, eds. 2013. “Aflatoxins: Finding Solutions for Improved Food
Safety.” 2020 Focus Brief #20. Washington, DC: International Food Policy Research
Institute.
World Bank. 2006. Repositioning nutrition as central to development: A strategy for large-
scale action. Washington, DC: World Bank.
World Bank. 2010a. Scaling Up Nutrition. What Will It Cost? Washington, DC: The World
Bank.

87
World Bank. 2010b. Nigeria: Country Nutrition Profiles. Washington, DC: World Bank.
World Bank. 2012. Nigeria: economic impacts of poor sanitation. Water and Sanitation
Program. Washington, DC: World Bank.
World Bank. 2013a. Where has all the growth gone? A poverty update for Nigeria.
Washington, DC: World Bank
World Bank. 2013b. Improving Nutrition Through Multisectoral Approaches. Washington,
DC: World Bank.
WHO. 2012. Global Health Estimates. Geneva: WHO.
http://www.who.int/healthinfo/global_burden_disease/en/
WHO. 2014. Cost-effectiveness and strategic planning: threshold values for intervention
cost-effectiveness by region. Geneva, Switzerland: WHO-CHOICE (Choosing Interventions
that are cost-effective) Program. http://www.who.int/choice/costs/CER_levels/en/


COSTED PLAN FOR SCALING UP NUTRITION:
Nigeria
Meera Shekar, Christine McDonald, Ali Subandoro, Julia Dayton
Eberwein, Max Mattern and Jonathan Kweku Akuoku
September 2014

ii
Health, Nutrition and Population (HNP) Discussion Paper
This series is produced by the Health, Nutrition, and Population (HNP) Family of the
World Bank's Human Development Network (HDN). The papers in this series aim to
provide a vehicle for publishing preliminary and unpolished results on HNP topics to
encourage discussion and debate. The findings, interpretations, and conclusions expressed
in this paper are entirely those of the author(s) and should not be attributed in any manner
to the World Bank, to its affiliated organizations or to members of its Board of Executive
Directors or the countries they represent. Citation and the use of material presented in this
series should take into account this provisional character.
Enquiries about the series and submissions should be made directly to the Editor, Martin
Lutalo ([email protected]). Submissions undergo informal peer review by selected
internal reviewers and have to be cleared by the Task Team Leader's Sector Manager.
The sponsoring department and author(s) bear full responsibility for the quality of the
technical contents and presentation of material in the series.
Since the material will be published as presented, authors should submit an electronic
copy in the predefined template (available at www.worldbank.org/hnppublications on the
Guide for Authors page). Drafts that do not meet minimum presentational standards may
be returned to authors for more work before being accepted.
For information regarding the HNP Discussion Paper Series, please contact Martin Lutalo
at [email protected] or 202-522-3234 (fax).
© 2014 The International Bank for Reconstruction and Development / The World Bank
1818 H Street, NW Washington, DC 20433
All rights reserved.

iii
Health, Nutrition and Population (HNP) Discussion Paper
Costed Plans for Scaling Up Nutrition:
Nigeria
The World Bank Group
with support from the Bill and Melinda Gates Foundation
Abstract: This paper estimates country-specific costs and benefits of scaling up
key nutrition investments in Nigeria. Building on the methodology established in the
global report Scaling Up Nutrition: What will it cost?, we first estimate the costs and
benefits of a nationwide scale up of ten effective nutrition-specific interventions. This
would require an annual public investment of $837 million and would yield enormous
benefits: over 8.7 million DALYs and 183,000 lives would be saved annually, while more
than 3 million cases of stunting among children under five would be averted. As it is
unlikely that the Government of Nigeria or its partners will find the $837 million
necessary to reach full national coverage, we also considers five potential scale-up
scenarios based on considerations of burden of stunting, potential for impact, resource
requirements and capacity for implementation in Nigeria. Using cost-benefit analyses we
propose scale-up scenarios that represent a compromise between the need to move to full
coverage and the constraints imposed by limited resources. This analysis takes an
innovative approach to nutrition costing by not only estimating the costs and benefits of
nutrition-specific interventions, but also exploring costs for a selected number of
nutrition-sensitive interventions implemented outside of the health sector. We identify
and cost four candidate nutrition-sensitive interventions with high impact potential for
Nigeria, including biofortification of cassava, aflatoxin control, school-based deworming,
and school-based promotion of good hygiene. Overall, these findings point to a selection
of nutrition-specific interventions and a candidate list of nutrition-sensitive approaches
that represent a cost-effective approach to reducing child malnutrition in Nigeria. Moving
forward, these results are intended to help guide decision makers as they plan future
efforts to scale-up action against malnutrition in Nigeria and develop nutrition financing
plans that bring together the health, education and agriculture sectors.
Keywords: nutrition-specific interventions, nutrition-sensitive interventions, cost of
nutrition interventions, cost-benefit analysis, nutrition financing.
Disclaimer: The findings, interpretations and conclusions expressed in the paper are
entirely those of the authors, and do not represent the views of the World Bank, its
Executive Directors, or the countries they represent.
Correspondence Details: Meera Shekar, World Bank, 1818 H. St. NW, Washington,
D.C., Tel. 202-473-6029, [email protected].

iv
Table of Contents
GLOSSERY OF TERMS ............................................................................................. VII
GLOSSARY OF TECHNICAL TERMS................................................................... VIII
ACKNOWLEDGMENTS ............................................................................................... X
EXECUTIVE SUMMARY .......................................................................................... XII
PART I – BACKGROUND ............................................................................................ 18
A. COUNTRY CONTEXT ......................................................................................... 18
B. HEALTH AND NUTRITIONAL STATUS IN NIGERIA ....................................... 18
C. THE IMPORTANCE OF INVESTING IN NUTRITION ...................................... 22
D. A MULTI-SECTORIAL APPROACH FOR IMPROVING NUTRITION .............. 25
E. PARTNER EFFORTS TO ADDRESS MALNUTRITION IN NIGERIA ............... 27
PART II – RATIONALE AND OBJECTIVES FOR DEVELOPING A SET OF
COSTED SCALE-UP SCENARIOS FOR NIGERIA ................................................. 29
PART III – METHODOLOGY ..................................................................................... 30
A. SCOPE OF THE ANALYSIS AND DESCRIPTION OF THE INTERVENTIONS 30
B. ESTIMATION OF TARGET POPULATION SIZES, CURRENT COVERAGE
LEVELS AND UNIT COSTS ..................................................................................... 32
C. ESTIMATION OF COSTS AND BENEFITS......................................................... 34
D. SCENARIOS FOR SCALING UP NUTRITION INTERVENTIONS ..................... 36
PART IV – RESULTS FOR NUTRITION-SPECIFIC INTERVENTIONS ............ 37
A. TOTAL COST, EXPECTED BENEFITS AND COST EFFECTIVENESS .......... 37
B. POTENTIAL SCALE-UP SCENARIOS............................................................... 41
C. COST-BENEFIT ANALYSIS OF THE SCALE-UP SCENARIOS ....................... 51
D. PROPOSED SCENARIOS ................................................................................... 54
E. FINANCING CURRENT COVERAGE ............................................................... 54
F. UNCERTAINTIES AND SENSITIVITY ANALYSES ........................................... 55
PART V – NUTRITION-SENSITIVE INTERVENTIONS ....................................... 57
A. BIOFORTIFICATION OF CASSAVA ................................................................. 57
B. AFLATOXIN REDUCTION THROUGH BIOCONTROL ................................... 57
C. SCHOOL-BASED DEWORMING ....................................................................... 58
D. SCHOOL-BASED PROMOTION OF GOOD HYGIENE ................................... 58
PART VI – CONCLUSIONS AND POLICY IMPLICATIONS................................ 59
APPENDICES ................................................................................................................. 61
Appendix 1: Partners Collaborating on Nutrition in Nigeria, 2014 ....................... 61
Appendix 2: Target Population Size ...................................................................... 63

v
Appendix 3: Data Sources and Relevant Assumptions .......................................... 64
Appendix 4: Methodology for Estimating Costs for Nigeria ................................. 68
Appendix 5: Methodology for Estimating DALYs for Nigeria ............................. 69
Appendix 6: Methodology for Nigeria LiST estimates .......................................... 71
Appendix 7: Methodology for Estimating Economic Benefits .............................. 73
Appendix 8: Scenario 5a Costs and Benefits by Intervention and by State ........... 76
Appendix 9: Sensitivity Analysis ........................................................................... 80
REFERENCES ................................................................................................................ 82
List of Tables Table 1. Nutrition-Specific Interventions Delivered Primarily Through Health Sector ... 30
Table 2. Multi-Sectorial, Nutrition-Sensitive Interventions – an exploratory process ..... 31
Table 3. Unit Costs and Delivery Platforms Used in the Calculations for Nutrition-
specific Interventions ................................................................................................. 33
Table 4. Unit Costs and Delivery Platforms Used in the Estimations for selected
nutrition-sensitive Interventions ................................................................................ 33
Table 5. Estimated Cost of Scaling Up 10 Nutrition Specific Interventions to Full
Coverage .................................................................................................................... 37
Table 6. Scale up of all 10 Interventions Over 5 years, 3 Scenarios in US$ Millions ...... 38
Table 7. Estimated Annual Benefits for Scaling Up 10 Nutrition Interventions to Full
Coverage .................................................................................................................... 39
Table 8. Cost Effectiveness of Scaling Up 10 Nutrition Interventions to Full Coverage,
US$ ............................................................................................................................ 41
Table 9. Scenario 1: Cost and Benefits of Scaling Up 10 Nutrition Interventions by
Region ........................................................................................................................ 42
Table 10. Scenario 2: Cost and Benefits for Scaling Up 10 Nutrition-specific
Interventions by Intervention ..................................................................................... 45
Table 11. Scenario 3: Costs and Benefits for Scaling Up 10 Nutrition-specific
Interventions by State ................................................................................................ 47
Table 12. Scenario 4: Cost of Scaling Up 10 Nutrition Interventions by State and by
Intervention, US Millions .......................................................................................... 48
Table 13. Annual Costs and Benefits from Scenarios 4a and 4b ...................................... 48
Table 14. Full and Partial Program Coverage Targets ...................................................... 49
Table 15. Scenarios Considered Within Scenario 5 .......................................................... 50
Table 16. Costs and Benefits of Most Cost-Effective Scenarios ...................................... 51
Table 17. Scale Up of Scenarios 4 and 5 in US$ Millions ............................................... 53
Table 18. Economic Benefits of Two Scenarios, 5 year scale up ..................................... 54
Table 19. Fiscal Space Analysis for Current National Nutrition Expenditures (2013) .... 55
Table 20. Projected Funding Available for Nutrition 2014-2017 ..................................... 55
Table 21. Preliminary results for costing nutrition-sensitive interventions ...................... 57

vi
List of Figures Figure 1: Prevalence of Stunting & GNI per capita in Nigeria & Selected Countries...…18
Figure 2: State-level prevalence of stunting (2011) and poverty estimates (2009)…...….19
Figure 3: Wealth inequities in child undernutrition…………………………………...…20
Figure 4: Vitamin A supplementation in Nigeria by region, 2003 and 2008…………….21
Figure 5: Rates of return to investment in human capital……………….…………….…24
Figure 6. Scenario 2: Step-wise Scale-Up by Intervention……………………...............44

vii
GLOSSERY OF TERMS
ANC antenatal clinics
ARI acute respiratory infections
BMGF Bill and Melinda Gates Foundation
CCT conditional cash transfers
CIDA Canadian International Development Agency
C-IMCI community-based approach to integrated management of childhood illnesses
CHAI Clinton Health Access Initiative
CMAM community-based management of acute malnutrition
CNPs community nutrition programs
CIFF Children’s Investment Fund Foundation
DALYs disability adjusted life years
EU European Union
FGoN Federal Government of Nigeria
GAIN Global Alliance for Improved Nutrition
GMP growth monitoring and promotion
GNI gross national income
GNP gross national product
HKI Helen Keller International
IFA iron folic acid
IITA International Institute for Tropical Agriculture
LiST Lives Saved Tool
M&E monitoring and evaluation
MAM management of acute malnutrition
MI Micronutrient Initiative
MICS Multiple Indicator Cluster Survey
MoH Ministry of Health
NAFDAC National Agency for Food and Drug Administration
NDHS Nigeria Demographic and Health Survey
NPV net present value
NTD neglected tropical disease
ORS oral rehydration solution
R4D Results For Development
SAM severe acute malnutrition
SMART Standardized Monitoring and Assessment of Relief and Transitions
SOML Saving One Million Lives
UNICEF United Nations Children’s Fund
UHC Universal Health Coverage
USAID United States Agency for International Development
WASH Water, Sanitation and Hygiene
WHO World Health Organization
WINNN Working to Improve Nutrition in Northern Nigeria

viii
GLOSSARY OF TECHNICAL TERMS
Aflatoxins are a group of toxic compounds produced by certain molds, especially
aspergillus flavus, which contaminate stored food supplies such as animal feed, maize
and peanuts. Research shows that human consumption of high levels of aflatoxins can
lead to liver cirrhosis (Kuniholm et al., 2008) and liver cancer in adults (Abt Associates
2014). It is widely understood that there is a relationship between aflatoxin exposure and
child stunting but this relationship has not yet been adequately quantified in the published
literature (Unnevehr and Grace 2013, Abt Associates 2014).
Biocontrol (also called biological control) is the use of an invasive agent to reduce pest
or mold population below a desired level. Aflatoxins can be reduced through biocontrol
and the most effective method involves a single application of a product (such as
AflaSafeTM) containing strains unique to the specific country or location.
Biofortification is the idea of breeding crops to increase their nutritional value. This can
be done either through conventional selective breeding, or through genetic engineering.
A DALY is a Disability Adjusted Life Year, and is equivalent to a year of healthy life
lost due to a health condition. The DALY, developed in 1993 by the World Bank,
combines the years of life lost from a disease (YLL) and the years of life spent with
disability from the disease (YLD). DALYs count the gains from both mortality (how
many more years of life lost due to premature death are prevented) and morbidity (how
many years or parts of years of life lost due to disability are prevented). An advantages of
the DALY is that it is a metric that is recognized and understood by external audiences
such as the WHO and the NIH. It helps to gauge the contribution of individual diseases
relative to overall burden of disease by geographic region or health area. Combined with
cost data, DALYs allow for estimating and comparing the cost-effectiveness of scaling up
nutrition interventions in different countries.
The Lives Saved Tool (LiST) is an estimation tool that translates measured coverage
changes into estimates of mortality reduction and cases of childhood stunting averted.
LiST is used to project how increasing intervention coverage would impact child and
maternal survival. It is a part of an integrated set of tools that comprise the Spectrum
policy modeling system.
Stunting is an anthropometric measure of low height-for-age. It is an indicator of
chronic undernutrition and is the result of prolonged food deprivation and/or disease or
illness. It is measured in terms of Z-score (or standard deviation score; see definition
below) and a child is considered stunted with a height-for-age Z-score of -2 or lower.
Underweight is an anthropometric measure of low weight-for-age. It is used as a
composite indicator to reflect both acute and chronic undernutrition, although it cannot

ix
distinguish between them. It is measured in terms of Z-score (or standard deviation score;
see definition below) and a child is considered underweight with a Z-score of -2 or lower.
Wasting is an anthropometric indicator of low weight-for-height. It is an indicator of
acute undernutrition and the result of more recent food deprivation or illness. It is
measured in terms of Z-score (or standard deviation score; see definition below) and a
child is considered stunted with a Z-score of -2 or lower.
A Z-score or standard deviation score is calculated with the following formula:

x
ACKNOWLEDGMENTS
The authors are grateful to the World Bank for publishing this report as an HNP
Discussion Paper.
This document was produced by a team led by Meera Shekar, with Christine McDonald,
Tuoyo Okorosobo, Ali Subandoro, Max Mattern, Julia Dayton Eberwein, Jonathan
Kweku Akuoku and Wendy Karamba. Erika L. Yanick provided helpful formatting.
The team is very grateful to partners in the Federal Government of Nigeria for their
collaboration in this effort. Without the leadership and commitment of the Federal
Minister of State Dr. Mohammad Ali Pate, and his Senior Advisor Dr. Kelechi Ohiri,
this report would not have been commissioned. And, without the strong support from the
Federal Minister of Health Prof. C.O Onyebuchi Chukwu and Dr. Chris Osa
Isokpunwu, Deputy Director and Head of Nutrition at the Federal Ministry of Health, the
work would not have been completed. The Saving One Million Lives (SOML) team
consisting of Banji Filani, Seyi Ibidapo and Temilade Adelore provided extensive inputs
and support. The report benefitted tremendously from advice and consultations with
several other colleagues from FMOH and NPHCDA who are leading the development of
the Federal Government’s Strategic Plan for Nutrition. The report also benefitted from
comments and suggestions from participants at the IUNS 20th International Congress of
Nutrition Satellite Session on Nutrition Costing in September, 2013 in Granada, Spain.
The Bill and Melinda Gates Foundation was a strong partner with the World Bank in
advancing this work, and provided financial support. Ellen Piwoz from BMGF also
provided valuable technical inputs. Stanley Chitekwe of UNICEF Nigeria facilitated
access to necessary local data. Colleagues from DFID, USAID, Save the Children,
Children’s Investment Fund Foundation (CIFF), Clinton Health Access Initiative (CHAI),
and the EC in Nigeria provided valuable feedback and inputs.
Marty Makinen, Mark Roland, and Milan Thomas of R4D undertook the Fiscal Space
Analysis for health in Nigeria that provided useful inputs for this report. Shunsuke
Mabuchi, Ayodeji O. Odutolu, Karima Saleh and Albertus Voetberg from the World
Bank gave useful comments during the peer review process.
Finally, the team is grateful for the support and guidance from the Nigeria Country
Management Unit, Marie Francoise Marie-Nelly (Country Director), and Trina Haque
HNP Practice Manager.

xi

xii
EXECUTIVE SUMMARY
1. The overall objective of this programmatic Knowledge Product is to support
the Federal Ministry of Health in the Government of Nigeria to develop a costed
scale-up plan for nutrition. This scale-up plan will be complemented with a health-
sector fiscal space analysis financed by the Children’s Investment Fund Foundation
(CIFF) and conducted by Results For Development (R4D). The executive summary is
written for policy makers; it highlights the main findings and discusses the implications
for nutrition policy in Nigeria. The paper itself is more technical in nature and is written
for planners and programmers. The analysis seeks to estimate the potential impact and
allocative efficiency of investments in nutrition, with the goal of guiding Nigeria’s
ongoing nutrition strategic planning process. The report has benefitted tremendously from
a strong partnership with the FMOH and SOML, as well as extensive consultation with
partners such as DFID, UNICEF, USAID, Save the Children, CIFF, CHAI and other
stakeholders in Nigeria.
2. Nigeria is home to the third largest population of chronically undernourished
(stunted) children in the world. Within Nigeria, there is enormous geographic variation
in nutrition outcomes, with the worst malnutrition concentrated in the North-Eastern and
North-Western regions. Vitamin and mineral deficiencies (hidden hunger) are also
pervasive, of which anemia and vitamin A deficiencies are the most prevalent.
3. Malnutrition, particularly in very young children, leads to increased
mortality, greater susceptibility to illness, and long-term effects on cognitive
abilities, resulting in irreversible losses in human capital that contribute to future
losses in economic productivity. Undernutrition is responsible for approximately half of
under-five child mortality and one-fifth of maternal mortality in developing countries, and
children who have been malnourished early in life are more likely to experience cognitive
deficiencies and poor schooling outcomes. Over the long-term, stunting results in 10-17
percent loss of wages, and it is estimated that Nigeria loses over US$1.5 billion in GDP
annually to vitamin and mineral deficiencies alone (Government of Nigeria 2014; World
Bank 2009).
4. At the same time, nutrition interventions are consistently identified as among
the most cost effective development actions, and the costs of scaling up nutrition
interventions are modest. Cost-benefit analysis shows that nutrition interventions are
highly effective (Hoddinott et al 2013; World Bank 2010a). It is estimated that investing
in nutrition can increase a country’s gross domestic product (GDP) by at least 3 percent
annually (Horton and Steckel 2013). Globally, the cost of scaling up key nutrition
interventions across 68 countries is estimated at $10.3 billion per annum, and would
provide preventive nutrition services to about 356 million children, save at least 1.1
million lives and 30 million DALYs, and reduce the number of stunted children by about
30 million worldwide (World Bank 2010a).

xiii
5. This report builds on the global costing exercise to identify country-specific
estimates of the costs and benefits of scaling up key nutrition investments in Nigeria.
It is intended to help guide the development of the National Strategic Plan of Action
for Nutrition, and aims to maximize allocative efficiencies by identifying the most
cost effective package of interventions. The methodology is based on the costing
framework established by Scaling Up Nutrition: What will it cost? (World Bank 2010a),
which is adapted to the country-specific context of Nigeria. By combining costing with
estimates of impact (in terms of DALYs saved, lives saved, and cases of childhood
stunting averted) this report strengthens the “case for nutrition” and guides policy makers
in prioritizing investments in situations where financial and human resources are
constrained. Furthermore, this analysis takes an innovative approach by also exploring the
costs and benefits of selected (albeit not exhaustive) nutrition-sensitive interventions
implemented outside of the health sector.
6. We first estimate the costs and benefits of a nationwide scale up of all ten
nutrition-specific interventions. These ten interventions were selected as a starting point
because they have demonstrated effectiveness in improving child nutrition and have clear
delivery scenarios that allow them to achieve scale. We refer to this as the “full coverage”
scenario, 1 and estimate that it would require an annual public investment of $837 million.
The expected benefits are enormous: over 8.7 million DALYs and 183,000 lives would
be saved annually, while more than 3 million cases of stunting among children under five
would be averted.
7. Given resource constraints, few countries are able to effectively scale-up all
ten nutrition-specific interventions to full national coverage simultaneously. We
therefore consider 5 potential scale-up scenarios based on considerations of burden
of stunting, potential for impact, resource requirements and capacity for
implementation in Nigeria.
Scenario 1: Scale up by region
Scenario 2: Scale up by intervention
Scenario 3: Scale up by state
Scenario 4: Scale up by state and by intervention
Scenario 5: Scale up by levels of program coverage
8. Scenarios 4 and 5 represent the most cost effective means of scaling up, when
measured in terms of cost per DALY saved, cost per life saved and cost per case of
childhood stunting averted. We further refine our analysis by comparing variations
of these scenarios:
Scenario 4a: scale up critical interventions, including community nutrition programs,
micronutrient supplementation, deworming and community-based management of
1 “Full” program coverage levels are 100 percent coverage for all interventions except for the public
provision of complementary food for prevention of moderate acute malnutrition and community-based
management of severe acute malnutrition for which “full” coverage is 80 percent.

xiv
severe acute malnutrition to full program coverage levels in states where stunting
prevalence exceeds 25 percent.
Scenario 4b: scale up critical interventions, including community nutrition programs,
micronutrient supplementation, deworming and community-based management of
severe acute malnutrition in states where stunting prevalence exceeds 35 percent.
Scenario 5a: scale up all 10 interventions to partial coverage levels.2
Scenario 5b: scale up micronutrient and deworming interventions3 to partial coverage
levels in all 36 states, and scale up community nutrition programs and community-
based management of severe acute malnutrition to partial coverage levels in states
where stunting prevalence exceeds 35 percent.
The table below presents estimated costs and benefits for each of these scenarios.
Estimated Costs and Benefits of 5 Scenarios
Recommended
Scenarios
Annual
Public
Investment
(US$
million)
Annual Benefits Cost per Benefit Unit
DALYs
Saved
Lives
Saved
No. of Cases
of Stunting
Averted
DALY
Saved
Lives
Saved
Cases of
Stunting
Averted
Scenario 4a $337 4,694,076 96,092 n/a 66 3,229 n/a
Scenario 4b $271 3,439,969 70,911 n/a 72 3,496 n/a
Scenario 5a $353 4,388,415 96,463 1,434,988 85 3,849 259
Scenario 5b $184 2,256,091 58,519 n/a 82 3,152 n/a
Source: Authors’ calculations.
9. The analysis further identifies three scenarios (4a, 4b and 5a) that have the
potential to significantly improve nutrition outcomes in a highly cost-effective
manner, while also prioritizing the use of scarce resources. Scenario 4b represents the
lowest-cost option, and would scale up critical interventions, including community
nutrition programs, micronutrient supplementation, deworming and community-based
management of severe acute malnutrition in states where the prevalence of stunting
among children under five exceeds 35 percent. Scenario 4a is slightly more expensive,
2 “Partial” program coverage is as follows: 35 percent coverage for public provision of complementary food for
prevention of moderate acute malnutrition and community-based management of severe acute malnutrition; 50 percent
coverage for community programs for growth promotion; 80 percent coverage for therapeutic zinc supplements with
ORS; 90 percent for vitamin A supplements, micronutrient powders, deworming, iron folic-acid supplements for
pregnant women; and 100 percent for iron fortification of staple foods and salt iodization.
3 This includes deworming, vitamin A supplementation, zinc supplementation, multi micronutrient powders, iron
fortification of staple foods and salt iodization

xv
but increases the coverage of these interventions to all states with stunting rates higher
than 25 percent. Scenario 5a is the most expensive of the three proposed scenarios but is
also the most politically attractive: it scales up all interventions in all 36 states, while
focusing primarily on increasing the coverage of low-cost, high-impact interventions such
as micronutrient supplementation.
10. Recognizing the difficulty of scaling up to full coverage in one year, and
following the five-year time frame of the Federal Government’s National Strategic
Plan of Action for Nutrition, we estimate the cost of scaling up these interventions
over five years to be $769 million for scenario 4b, $987 million for scenario 4a, and
$912 million for scenario 5a.4 This is significantly less than the $2.4 billion needed for
the five year scale up of the “full coverage” scenario, but still represents a significant
increase over current spending on nutrition in Nigeria.
11. Scenario 5a is considered a highly attractive investments, with positive
returns on investment and significant additions to economic productivity. 5 When
scaled up gradually over 5 years, this scenarios has the potential to add over US$1 billion
annually to the Nigerian economy over the productive lives of children who would
otherwise have died or become stunted. Moreover, these investments in Nigeria’s human
capital result in a positive net present value (NPV) and internal rates of return (IRR)
exceeding 18 percent.
12. The costs discussed thus far relate to the scale up from current coverage, and
therefore do not take into account the financing necessary to maintain existing
coverage levels, which R4D estimates at approximately US$49 million annually in a
draft fiscal space analysis of nutrition in Nigeria (2014). The R4D analysis also
identifies several sources of “planned” investments for nutrition estimated at about $175
million over the next 4 years. This suggests a planned increase in funding for nutrition of
approximately $126 million over four years. Our analysis predicts financing needs over
five years of between $769 million and $987 million for scaling up under the three
proposed scenarios, resulting in an estimated financing gap of between $543 and $861
million over five years. Therefore, any scale up of nutrition interventions will not only
require additional financing, but also the prioritization of interventions based on need,
cost-effectiveness and allocative efficiencies.
13. While every attempt has been made to use actual program costs in these
estimates, in reality the estimates likely overestimate the costs and underestimate the
benefits. In many cases, actual program costs will be lower than estimated because they
4 For scenarios 4a and 4b we assume that coverage scales up progressively over 5 years, with 20% achieved
in year 1, 40% in year 2, 60% in year 3, 80% in year 4 and 100% in year 5. The scale up of Scenario 5a
matches the assumptions in Nigeria’s National Strategic Plan of Action for Nutrition (NSPAN), and
therefore does not follow the same scale up pattern. For more information on the scale up of Scenario 5a,
please see Chapter IV-B
5 Scenario 5a is the only one for which we were able to calculate NPV and IRR.

xvi
can be added to existing programs. Program experience shows that the incremental costs
of adding to an existing program are lower, as existing implementation arrangements can
be used, thereby containing costs for staffing, operations and training. Moreover, we do
not account for potential savings achieved through expected economies of scale. With
respect to the benefits, given the limitations of the LiST tool, it is only possible to
estimate the benefits of some of the interventions. As a result, we likely underestimate the
potential benefits of scaling up the ten proven nutrition specific interventions.
14. This analysis takes an innovative approach by not only estimating the costs
and benefits of nutrition-specific interventions, but also exploring those of selected
nutrition-sensitive interventions implemented outside of the health sector. While
recognizing that the evidence base for impact of nutrition-sensitive interventions is less
conclusive, we consider four nutrition-sensitive interventions in the agriculture and
education sectors that have shown some potential for improving nutrition outcomes. In
Nigeria, these include biofortification of cassava, aflatoxin control, school-based
deworming, and school-based promotion of good hygiene. The first two of these
interventions would be implemented through the agriculture sector, and the second two
through the education sector. The estimated annual costs are modest: US$25 million for
biofortification of cassava, US$65 million for aflatoxin control, US$8 million for school-
based deworming and US$60 million for school-based promotion of good hygiene.
However, these must be considered rough approximations, as there are significant
limitations in the available data and in the methodological approaches, especially in
contextualizing these global costs to the Nigerian situation. In addition we were not able
to estimate the benefits of these interventions due to data and methodological
shortcomings, although we do report benefits estimated by other reports.
15. Overall, these findings point to a selection of nutrition-specific interventions
and a candidate list of nutrition-sensitive approaches that represent a cost-effective
approach to reducing child malnutrition in Nigeria. Most of the malnutrition that
occurs in the first 1000 days of a child’s life is essentially irreversible. Therefore,
investing in early childhood nutrition interventions offers a window of opportunity to
permanently lock-in human capital and to super-charge the potential demographic
dividend in Nigeria. This fits into the President’s Transformational Agenda for Nigeria
and the government’s flagship Saving One Million Lives (SOML) initiative, which focus
on six pillars, one of which is nutrition. However, despite strong commitments to address
malnutrition, there are currently no financial allocations for nutrition in FGoN’s 2014
budget.
16. Moving forward, these results will be useful to decision makers as they plan
future efforts to scale-up action against malnutrition in Nigeria and develop
nutrition financing plans that bring together the health, education and agriculture
sectors. In the health sector, plans for financing Universal Health Coverage (UHC) and
SOML must include these costs under the nutrition pillar of SOML. There also exist
several opportunities to incorporate these highly cost-effective interventions into the
World Bank’s existing and pipeline investments in Health (e.g. the State Health Project

xvii
and planned support for SOML), agriculture (such as FADAMA III) and education (e.g.
the State Education Project and the Global Partnership on Education).

18
PART I – BACKGROUND
A. COUNTRY CONTEXT
1. With an estimated 163 million inhabitants, Nigeria is the most populous country in
Africa, and despite strong GDP growth that averaged more than 8 percent over the past
decade, Nigeria’s poverty rate remains persistently high (World Bank 2013a). Nigeria
currently ranks 156th out of 187 countries on the Human Development Index, and the estimated
life expectancy is 52 years. In 2010, 46 percent of the population lived below the poverty line, a
prevalence which represents a decline of less than three percentage points since 2004. A recent
World Bank poverty analysis highlighted a combination of two economic patterns at the sub-
national level: i) increased poverty and decreased urbanization in Northern States with most
important economic activities taking place in Southern States; and ii) within the North and South,
Western States perform relatively better than Eastern States (World Bank, 2013a). The same
analysis also showed that the degree of inequality in Nigeria has increased: from 2004 to 2010
the Gini index increased from 0.38 to 0.41.
B. HEALTH AND NUTRITIONAL STATUS IN NIGERIA
2. Nigeria is home to the third largest population of chronically undernourished
children in the world, with an under-five mortality rate of 157 deaths per 1,000 live births, and
an infant mortality rate of 75 per 1,000 (NDHS 2008). These rates remain stubbornly above sub-
Saharan Africa’s regional average. In 2013, the prevalence of stunting among children under five
years of age was 37 percent, which is a very modest decline from 43 percent in 2003 (NDHS
2003 and 2013). The stunting rate is higher than in several other countries in the region with
similar incomes (Figure 1). Nigeria’s failure to make substantial headway in reducing poverty
has translated into limited progress in improving health and nutrition indicators, and vice versa.
Figure 1: Prevalence of Stunting and GNI per capita in Nigeria and Selected Peer
Countries
Data Sources: WHO Global Database on Child Growth and Malnutrition; World Bank World Development
Indicators, Nigeria MICS 2011.

19
3. There is great regional variation in child stunting and the prevalence of stunting
actually increased in 5 of the 6 regions between 2003 and 2008. The national average masks
dramatic geographical disparities within the country. Figure 2 demonstrates striking disparities
between northern and southern regions, in which all states in North-Eastern and North-Western
have stunting prevalence above 40 percent, whereas the majority of states in the southern
regions have stunting prevalence below 25 percent (Nigeria MICS 2011). The prevalence of
stunting in the North West region is 2.5 times the prevalence in the South East region. In Lagos,
only 8.9 percent of children under five are stunted, whereas in the state of Katsina, the
prevalence is 61.9 percent. The same figure also shows that the disparities in poverty closely
mirror the disparities in malnutrition, but the patterns are not identical. Many states with
relatively lower poverty rates (i.e. Niger, Ondo, and Oyo) still have high rates of stunting. Child
wasting (low weight-for-height) rates, which reflect acute nutritional deficits that are often
compounded by infection or disease, are also highly variable by state: in FCT (Abuja) the
prevalence is 3.4 percent, whereas in Borno, it is 18.7 percent.
Figure 2. State-level prevalence of stunting (2011) and poverty estimates (2009)
Source: Poverty map from World Bank, 2013; Stunting map created from sub-national stunting data from Nigeria
MICS 2011.

20
4. Inequities in child undernutrition across wealth quintiles are also pronounced in
Nigeria. Stunting rates in the poorest households (52 percent) are more than twice those in
the richest households (24 percent) (Figure 3). However, while stunting rates are highest
among the poorest quintile, somewhat surprisingly even in the richest households, nearly one-
quarter of children are stunted. This shows that while poverty is associated with stunting, other
factors are also involved. Non-food influences, such as informational asymmetries, disease and
optimal feeding and caregiving practices have a major role to play in causing malnutrition.
Figure 3. Wealth inequities in child undernutrition
0 10 20 30 40 50 60
Poorest
Second
Middle
Fourth
Richest
% Stunting Among Children Under 5
We
alth
qu
inti
le
Source: NDHS 2008
5. Vitamin and mineral deficiencies (hidden hunger) and are also pervasive in Nigeria.
It is estimated that 30 percent of Nigerian children under five and 20 percent of pregnant women
are vitamin A deficient (Maziya-Dixon et al. 2006). Vitamin A deficiency increases child
mortality, increases vulnerability to infectious diseases such as measles and leads of blindness
among children under five years-old. Coverage of vitamin A supplementation is low in Nigeria,
with only 65.2 percent of children 6-59 months of age receiving a supplement in the past six
months (Nigeria MICS 2011).6 Data from DHS 2008 indicates even lower vitamin A coverage
(26 percent) and the coverage actually decreased from 34 percent in 2003 (Figure 4).7 Given the
strong evidence that high coverage with twice-annual doses of Vitamin A supplementation has
the potential to reduce child mortality by 23 percent on average, this is a lost opportunity. The
most recent data available indicate that 76 percent of preschool-aged children and 67 percent of
pregnant women are anemic, with approximately half of all anemia caused by inadequate dietary
intake of iron, and the rest due to infections and parasites. One in five households does not
consume adequately iodized salt (), thereby predisposing these children to IQ losses of up to 13
points, increasing the risk of still births, and wasted pregnancies.
6 There is a discrepancy between the DHS (2008) and the MICS (2011).
7 No data available on children who received twice-annual doses so this indicator is used as a proxy.

21
Figure 4: Vitamin A supplementation in Nigeria by region, 2003 and 2008.
Source: Nigeria DHS, 2008
6. Another health burden in Nigeria is the high levels of aflatoxins, which are naturally
occurring carcinogenic (cancerous) by-products of common fungi that grow on crops such
as maize and peanuts. A recent review of published articles shows that the mean level of
aflatoxin contamination in maize and groundnuts in Nigeria is well above safe levels (Abt
Associates 2014) and well above levels in other African countries (Liu and Wu, 2010).
Groundnut contamination is generally higher in the south and maize contamination is higher in
the north and west. Evidence shows that consumption of high levels of aflatoxins can lead to
liver cirrhosis (Kuniholm et al., 2008) and liver cancer in adults (Abt Associates 2014). Further,
it is widely understood that there is a relationship between aflatoxin exposure and child stunting,
albeit the evidence base is more tentative, and this relationship has not yet been adequately
quantified in the published literature (Unnevehr and Grace 2013, Abt Associates 2014). Using
data on aflatoxin exposure and growth from other countries, one study estimated that up to 4.4
million children in Nigeria become stunted from consuming maize and groundnuts that are
contaminated with aflatoxin (Khlangwiset 2011). Almost 8,000 deaths/year from liver cancer in
Nigeria are attributed to aflatoxin exposure, resulting in over 100,000 lost DALYs. This
translates into a monetized impact of between 0.2 percent and 1.6 percent of Nigeria’s GDP (Abt
Associates 2014). While the evidence on the links between aflatoxins and child stunting is still
tentative, the links with liver cancer are well established, and provide sufficient impetus for
actions to control aflatoxin exposure in Nigeria.
7. Approximately 87,100 children under five die each year in Nigeria from diarrhea.
Nearly 90 percent is directly attributed to poor water, sanitation and hygiene (World Bank
2012). Diarrheal episodes exacerbate the relationship between malnutrition and infection, as

22
children tend to eat less, absorb fewer nutrients and reduced resistance to infections. Prolonged
diarrheal episodes lead to impaired growth and development (Ejemot et al. 2006). Poor sanitation
is also a contributing factor – through its impact on malnutrition rates – to other leading causes of
child mortality including malaria, acute respiratory infections, and measles.
8. In Nigeria, 45 percent of school-age children, totaling nearly 12 million, are
estimated to be infected with parasitic intestinal worms (helminthic infections). In the short
term, helminthic infections potentially cause anemia, increase morbidity, undernutrition and
impairment of mental and physical development (Hotez et al. 2008). In the long term, infected
children are estimated to have an average IQ loss of 3.75 points per child and they earn less as
adults (43 percent) than those who grow up free of worms (Bleakley 2007).
C. THE IMPORTANCE OF INVESTING IN NUTRITION
9. Undernutrition is an underlying cause of approximately half of deaths (3.1 million)
in children under five and one-fifth of maternal deaths in developing countries. The joint
effect of suboptimum breastfeeding and fetal growth restriction in neonatal period alone
contributes 1.3 million deaths or 19 percent of all deaths of children under five (Black et al.
2013). Undernourished children are more likely to die from common childhood illnesses such
as diarrhea, measles, pneumonia, malaria or HIV/AIDS.
10. For those malnourished children who survive, there are long-lasting health and
schooling consequences, including cognitive deficits and poorer schooling outcomes.
Children with impaired cognitive skills have lower school enrollment, attendance and graduation,
which in turn results in lower productivity, earnings and economic well-being. Stunted children
lose 0.7 grades of schooling, and are more likely to drop out of school. Iodine deficient children
lose on average 13 IQ points and iron deficiency anemia reduces performance on tests by 8 IQ
points, making them less educable (World Bank 2006). Behrman and colleagues (2009) showed
improved schooling and test scores from participation in nutrition programs in early childhood.
11. In Nigeria, being underweight in the early years of life accounts for 8 percent of
Disability-Adjusted-Life-Years (DALYs). This was the biggest risk factor affecting DALYs,
with micronutrient deficiencies and suboptimal breastfeeding also among the 15 highest risk
factors (Murray et al. 2013). The DALYs lost from Vitamin A deficiency in Nigeria is nearly
800,000 annually, with virtually all losses occurring in children under five years of age
(Menakshi et al. 2010).
12. Malnutrition costs developing countries billions in lost revenue through reduced
economic productivity, particularly through lower wages, lower physical and mental
capabilities and more days away from work as a result of illness. Childhood stunting is
estimated to reduce at least 10 percent of potential lifetime earnings (World Bank 2006). Other
studies have shown that a 1 percent loss in adult height results in a 2–2.4 percent loss in
productivity (Caulfield et al. 2004, Strauss and Thomas 1998). In addition, micronutrient
deficiencies in childhood and adulthood have tremendous economic cost. Childhood anemia
alone is associated with a 2.5 percent drop in adult wages. Anemia in adults has been estimated
to be equivalent to 0.6 percent of GDP, and goes up to 3.4 percent when including the secondary
effects of retarded cognitive development in children (Horton 1999). Horton and Ross (2003)
estimate that eliminating iron-deficiency anemia would result in a 5–17 percent increase in adult

23
productivity. Collectively, micronutrient deficiencies alone in Nigeria add up to an estimated
loss of over US$1.5 billion in GDP every year (World Bank 2010b). The economic costs of
undernutrition affect the most vulnerable and the poorest in the developing world. A recent
analysis estimates these losses at 11 percent of GDP in Africa and Asia each year (Horton and
Steckel 2013). This equals about $149 billion of productivity losses.
13. Investing in early childhood nutrition interventions has the potential to super-
charge the potential demographic dividend in Nigeria. Demographic dividend refers to the
growth in a country’s economy resulting from changes in the age structure leading to a youth
bulge and reduced dependency ratios in the population. This dividend is more likely to be
realized if these cohorts are better nourished and productive. By increasing investment in human
capital as fertility rates decline, Nigeria could potentially harness the demographic dividend by:
(i) increasing GDP by nearly 50 percent and sustain that gain indefinitely; (ii) raise per capita
incomes by 30 percent or more by 2030, and (iii) lift around 32 million additional people out of
poverty by 2030 (Bloom et al. 2010).
14. Most of the malnutrition that occurs in the first 1000 days of a child’s life is
essentially irreversible. Therefore, the window of opportunity for preventing malnutrition
is the first 1000 days between pregnancy and two years of age. After that age, most actions
are too little, too late and too expensive (World Bank 2006; Black et al. 2008, 2013). Figure 5
shows that the rates of return from nutrition investments are highest for programs targeting
towards the earliest years since these investments build a foundation for future learning and
productivity, prevent irreversible losses, and lock-in human capital for life (Heckman and
Masterov 2004).

24
Figure 5. Rates of return to investment in human capital
Source: Heckman and Masterov (2004)
15. Malnutrition and poverty are interrelated and exacerbate each other. A recent study
(Hoddinott et al. 2011) concludes that individuals who are not stunted at 36 months are one-third
less likely to live in poor households as adults. Poverty increases the risk of malnutrition by
lowering poor households’ purchasing power, reducing access to basic health services, and
exposing them to unhealthy environments, thereby compromising food intakes (both quality and
quantity), and increasing infections. Poor households are also more likely to have frequent
pregnancies, larger family sizes with high dependency ratios, more infections and increased
health-care costs. Conversely, malnutrition causes poor health status, poor cognitive
development and less schooling, resulting in in poor human capital and long-term productivity
losses. However, as Figure 2 shows, while child stunting rates are highest among the poorest
two quintiles in Nigeria, even among the richest quintile nearly 25 percent children are stunted.
This suggests a need to design somewhat different strategies to address undernutrition among the
poorest, vs those among the non-poor.
16. Nutrition interventions are consistently identified as cost effective development
actions and the costs of scaling up nutrition interventions are modest. Hoddinott and
colleagues (2013) estimated that for every dollar invested in programs to reduce stunting would
generate between $24.4 and $26.6 in economic returns. Others have estimated global benefit-
cost ratios for integrated child care programs to be between 9 and 16; for iodine supplementation
for women, between 15 and 520; for vitamin A supplementation for children under 6 years,
between 4 and 43; for iron supplementation for pregnant women, between 6 and 14; and for iron
fortification per capita, between 176 and 200 (World Bank 2010). A recent World Bank
publication estimated that investing in nutrition can increase a country’s gross domestic product
(GDP) by at least 3 percent annually. The same study estimated these investment costs at $10.3
billion per annum globally, to be financed through domestic public and private sector and donor
resources (World Bank 2010a). These investments would provide preventive nutrition services to
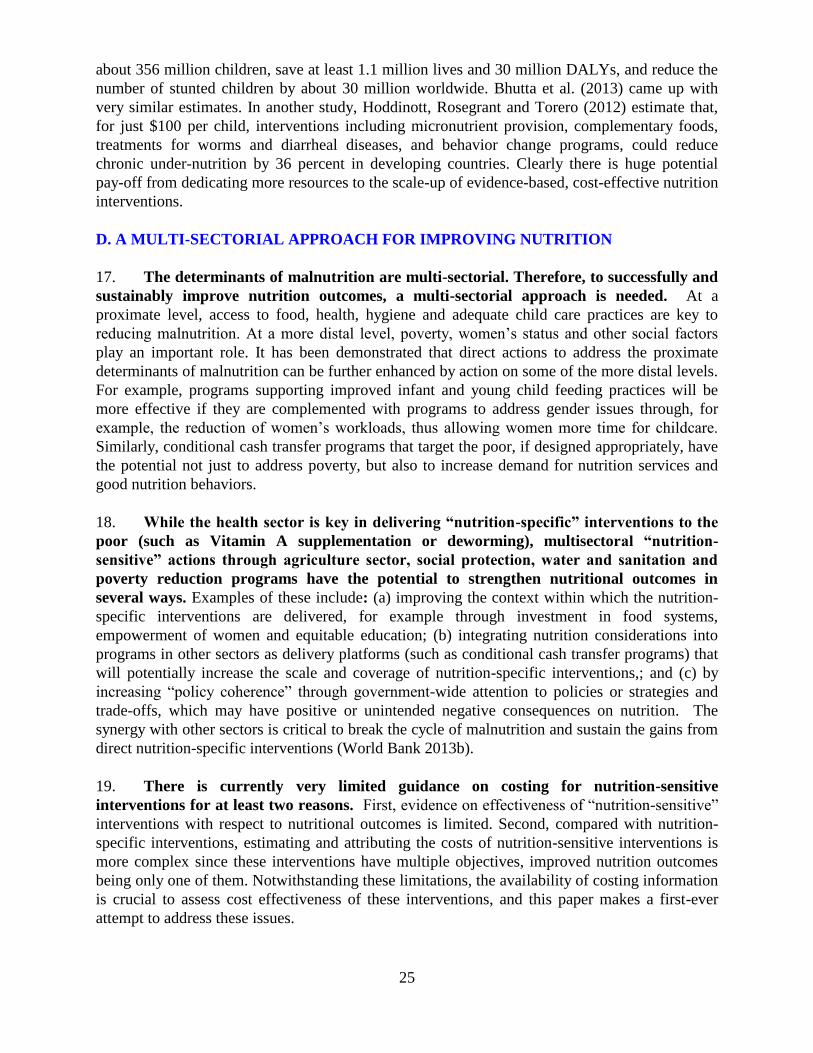
25
about 356 million children, save at least 1.1 million lives and 30 million DALYs, and reduce the
number of stunted children by about 30 million worldwide. Bhutta et al. (2013) came up with
very similar estimates. In another study, Hoddinott, Rosegrant and Torero (2012) estimate that,
for just $100 per child, interventions including micronutrient provision, complementary foods,
treatments for worms and diarrheal diseases, and behavior change programs, could reduce
chronic under-nutrition by 36 percent in developing countries. Clearly there is huge potential
pay-off from dedicating more resources to the scale-up of evidence-based, cost-effective nutrition
interventions.
D. A MULTI-SECTORIAL APPROACH FOR IMPROVING NUTRITION
17. The determinants of malnutrition are multi-sectorial. Therefore, to successfully and
sustainably improve nutrition outcomes, a multi-sectorial approach is needed. At a
proximate level, access to food, health, hygiene and adequate child care practices are key to
reducing malnutrition. At a more distal level, poverty, women’s status and other social factors
play an important role. It has been demonstrated that direct actions to address the proximate
determinants of malnutrition can be further enhanced by action on some of the more distal levels.
For example, programs supporting improved infant and young child feeding practices will be
more effective if they are complemented with programs to address gender issues through, for
example, the reduction of women’s workloads, thus allowing women more time for childcare.
Similarly, conditional cash transfer programs that target the poor, if designed appropriately, have
the potential not just to address poverty, but also to increase demand for nutrition services and
good nutrition behaviors.
18. While the health sector is key in delivering “nutrition-specific” interventions to the
poor (such as Vitamin A supplementation or deworming), multisectoral “nutrition-
sensitive” actions through agriculture sector, social protection, water and sanitation and
poverty reduction programs have the potential to strengthen nutritional outcomes in
several ways. Examples of these include: (a) improving the context within which the nutrition-
specific interventions are delivered, for example through investment in food systems,
empowerment of women and equitable education; (b) integrating nutrition considerations into
programs in other sectors as delivery platforms (such as conditional cash transfer programs) that
will potentially increase the scale and coverage of nutrition-specific interventions,; and (c) by
increasing “policy coherence” through government-wide attention to policies or strategies and
trade-offs, which may have positive or unintended negative consequences on nutrition. The
synergy with other sectors is critical to break the cycle of malnutrition and sustain the gains from
direct nutrition-specific interventions (World Bank 2013b).
19. There is currently very limited guidance on costing for nutrition-sensitive
interventions for at least two reasons. First, evidence on effectiveness of “nutrition-sensitive”
interventions with respect to nutritional outcomes is limited. Second, compared with nutrition-
specific interventions, estimating and attributing the costs of nutrition-sensitive interventions is
more complex since these interventions have multiple objectives, improved nutrition outcomes
being only one of them. Notwithstanding these limitations, the availability of costing information
is crucial to assess cost effectiveness of these interventions, and this paper makes a first-ever
attempt to address these issues.

26
20. We identify and cost four selected nutrition-sensitive interventions that are relevant
for scale-up in the Nigerian context, for which there is evidence of the positive impact on
nutrition outcomes, and for which there is some cost information. These include two
interventions delivered through the agriculture sector—biofortification of cassava and aflatoxin
reduction through biocontrol intervention—and two delivered through the education sector—
school-based deworming and school-based promotion of good hygiene. Other potential
nutrition-sensitive interventions include the reduction of women’s work-loads through
appropriate technologies in agriculture, social safety nets and conditional cash transfers targeted
to the poor and designed to have an impact on nutrition outcomes, and water and sanitation
programs that reduce the exposure to infections and childhood diseases.
21. Biofortification has the potential to reduce micronutrient deficiencies in a highly
cost-effective manner. Biofortification uses plant breeding techniques to enhance the
micronutrient content of staple foods. Evaluation of the orange-flesh sweet potato
biofortification program in Uganda and Mozambique showed high farmer adoption, significant
increase in vitamin A intakes and improvement of child vitamin A status (Arimond et al, 2011;
Hotz et al. 2010). An ex-ante cost study of biofortification in 14 countries suggests that most cost
per DALY averted fall in the “highly” cost-effective category, particularly in South Asia and
Africa (Menakshi et al. 2010). A recent study by HarvestPlus that ranked countries using
country-level data according to their suitability for investment in biofortification interventions
identified Nigeria as “top priority” country for benefiting from biofortification (Asare-Marfo et
al. 2013).
22. Nigeria formally launched biofortified cassava to address vitamin A deficiency in
2012. Cassava is one of the four most important staple foods (along with rice, maize and wheat)
in the country. In 2013, three new cassava varieties are being introduced to 50,000 farmers
household in Nigeria and could reach as many as 2 million farmers in the next three years. The
three launched varieties have the potential to meet 25 percent of the daily vitamin A needs of
consumers. Collaborating with HarvestPlus, the government will continue to work with farmers
and the private sector to significantly scale up vitamin A-biofortified cassava dissemination.
23. Biocontrol of aflatoxins has the potential to reduce aflatoxins in maize and
groundnuts by at least 80-90 percent (Bandyopadhyay and Cotty 2013). Field testing of
biocontrol products in Burkina Faso, Kenya, Nigeria and Senegal, although not formally
published, is producing extremely positive results. The method involves a single application of a
product (AflaSafeTM) containing strains unique to that country. Efforts are already underway in
Nigeria to build on this experience and expand the use of biocontrol products to control
aflatoxins (Abt Associates 2014).
24. School-based deworming has been proven to be an efficient and cost-effective
intervention to address health and nutrition outcomes, with cost per DALY saved estimated
at US$4.55 (J-PAL 2012). The cost of delivering deworming tablets through schools is
inexpensive because it uses the existing infrastructure and delivery platforms in schools and
community links with teachers. Teachers only need minimal training to safely administer the
delivery, thus it does not add significantly to teachers’ workloads. The delivery costs of school-
based deworming in schools are about $0.04 per treatment (Guyatt 2003), yet the benefits are
enormous. Bi-annual deworming significantly increased school attendance and reduced self-
reported illness and anemia, while providing modest gains in height-for-age Z-scores in Kenya

27
(J-PAL 2012). Evidence from India also suggests that deworming has the potential to reduce
cases of childhood stunting and underweight (Awasthi et al, 2013). In the long term, deworming
improved self-reported health, increased total schooling years, and increased earnings by 20
percent (Baird et al 2011).
25. School-based deworming in Nigeria is included in integrated Neglected Tropical
Diseases (NTD) control policy and plan, a school health policy and school feeding
guidelines. In early 2013, Nigeria launched a multi-year national plan for the control and
elimination of NTDs (NTD Master Plan). The NTD Master Plan provides a platform for Nigeria
to stimulate global efforts to reach elimination and control of diseases under the London
Declaration and the Millennium Development Goal 6. Nigeria’s NTD plan, worth $332 million,
will provide treatment for more than 60 million people annually over the next five years. In late
2012, Nigeria received a donation of 23,025 million tablets to support the scale-up of treatment
to combat NTDs. The donated tables will be sufficient to treat nearly eight million school
children and adults in 12 states.
26. Improved hygiene behaviors through promotion of hand-washing and good hygiene
behavior would decrease the risk of stunting in one in three children. Correct hand washing
at critical times can reduce diarrhea by 42 -47 percent and lower the incidence of diarrhea for
children by 53 percent and reduce the incidence of acute respiratory infections (ARI’s) by 44
percent (World Bank 2012). A recent campaign promoting hand washing with soap in primary
schools in Egypt, China and Colombia demonstrated significant reduction in absenteeism related
to diarrhea and respiratory-illness (UNICEF 2012). A study in Brazil showed a relationship
between the effects of early childhood diarrhea on later school readiness and school performance,
revealing the potential long-term human and economic costs of early childhood diarrhea (Lorntz
et al. 2006).
27. Effectiveness of promoting good hygiene behavior in schools is demonstrated by its
long terms impact and broad effect on communities. Schools are ideal settings for hygiene
education, where children can learn and sustain lifelong proper hygiene practices through peer-
to-peer teaching, classroom sessions with focused training materials and role-playing or
interactive songs. A study on the long-term effect of hygiene education program for both adults
and children found that hygiene behaviors are sustained beyond the end of an intervention. The
study also found that educated students can also influence family members by sharing this
information, which may in turn affect behavior change at the community level (Bolt and
Cairncross 2004).
E. PARTNER EFFORTS TO ADDRESS MALNUTRITION IN NIGERIA
28. Many partners are supporting the Federal Ministry of Health to address
malnutrition in Nigeria and most of the interventions are in the north where malnutrition
is most severe. Partners include UNICEF, DFID, Helen Keller International (HKI),
Micronutrient Initiative, Save the Children UK, Global Alliance for Improved Nutrition (GAIN),
Action Against Hunger, Valid International and Food Basket International (Government of
Nigeria 2014). UNICEF implements nutrition programs in 36 states and mainly provides support
for Infant and young child feeding, micronutrient deficiency control and treatment of severe acute
malnutrition through Community Management of Acute Malnutrition (CMAM). DFID supports
the Working to Improve Nutrition in Northern Nigeria (WINNN) program which provides key

28
services to children under five in five states in Northern Nigeria. Interventions include
community-based management of acute malnutrition, vitamin A supplementation and
deworming, and promotion of improved infant and young child feeding practices. Nigeria is a
priority country for Save the Children's Global Child Survival Campaign and Save the Children
UK supports the Katsina State Ministry of health. GAIN works with the National Agency for
Food and Drug Administration (NAFDAC) to fortify wheat and maize flour with iron, vegetable
oil with vitamins A and B and sugar with vitamin A. (Appendix 1 provides a list of region- and
state-specific partner interventions.)

29
PART II – RATIONALE AND OBJECTIVES FOR DEVELOPING A SET
OF COSTED SCALE-UP SCENARIOS FOR NIGERIA
29. The overall objective of this programmatic Knowledge Product (KP) is to support
the Government of Nigeria to develop a costed scale-up plan for nutrition. This scale-up
plan will be complemented with a health-sector fiscal space analysis financed by the
Children’s Investment Fund Foundation (CIFF), conducted by Results For Development
(R4D). These efforts will provide the Government of Nigeria with the tools needed to leverage
adequate resources from their domestic budgets, as well as from development partners in support
of the costed scale-up plan. Within this context, the objectives of this analysis are as follows:
i. To estimate scale-up costs in Nigeria for a set of well-proven nutrition-specific
interventions that have the potential to be scaled-up through tested delivery mechanisms;
ii. To conduct a basic economic analysis to calculate the potential benefits and cost
effectiveness associated with the proposed scale up;
iii. To propose a series of scenarios for a costed scale-up plan that rolls out this package of
nutrition-specific interventions in phases, based on considerations of impact, geography,
implementation capacity and costs;
iv. Explore initial costs for a limited number of nutrition-sensitive interventions through the
agriculture and education sectors.
30. While the economic arguments for increasing investments in nutrition are sound,
one of the first questions raised by key decision-makers in any country is “How much will
it cost?” In 2010, the World Bank spearheaded a study, Scaling Up Nutrition: What will it Cost?
to answer that question at the global level. The analysis estimated the level of global financing
required to scale up 10 evidence-based nutrition-specific interventions in 36 countries that
account for 90 percent of the world’s stunting burden and 32 smaller countries which also have a
high prevalence of undernutrition. The results of the study highlighted the global financing gap,
underscored the importance of investing in nutrition at the global level, and laid out a
methodology for estimating the costs for nutrition-specific interventions. However, these global
estimates did not capture the nuances and context in each country, nor were these estimates
contextualized to every individual country’s policy and capacity setting or its fiscal constraints.
This report builds on the early work to address this gap, and contextualize the cost estimates for
Nigeria.
31. Further, the multisectoral approach requires nutrition-sensitive approaches or
interventions that can be delivered through other sectors. As discussed above, there is
currently very limited guidance on costing for nutrition-sensitive interventions. Therefore, this is
an exploratory analysis, to be used primarily to engage other sectors in planning for nutritional
outcomes. This initial exercise will contribute to a broader discussion about methodological and
other issues for costing nutrition-sensitive interventions, and will thereby encourage the
formulation of standard definitions, methodologies and guidance for costing these interventions
in the future.

30
PART III – METHODOLOGY
A. SCOPE OF THE ANALYSIS AND DESCRIPTION OF THE INTERVENTIONS
32. The costed scale up plan is presented in two sections. The first section presents
estimated costs and benefits for the set of 10 nutrition-specific interventions that were included in
World Bank 2010 and are primarily delivered through the health sector. These interventions and
the associated target population and current coverage for each intervention are specified in Table
1. In the next section, we explore the costs of implementing a few selected the nutrition-sensitive
interventions that will be delivered through the agriculture and education sectors. A description
of these interventions, associated target populations, and responsible sectors are listed in Table 2.
33. The nutrition-specific interventions considered are a modified package of the
interventions included in the 2008 and 2013 Lancet series on Maternal and Child
Undernutrition. These ten interventions are based on current scientific evidence and there is
general consensus from the global community around the impact of these interventions. Some
interventions, such as deworming and iron-fortification of staple foods, which were included in
the 2008 Lancet series but no longer listed in the 2013 Lancet series are included here as they
remain relevant. Others, such as calcium supplements for women, or prophylactic zinc
supplementation are excluded because delivery mechanisms are not available in client countries
and/or there are no clear WHO protocols or guidelines for large scale programming. In other
cases, there are limited capacities for scaling up the interventions. Only those nutrition-specific
interventions that have strong evidence of effectiveness, have a WHO protocol, and a feasible
delivery mechanism for scale-up are included in the proposed scale-up package below.
Table 1. Nutrition-Specific Interventions Delivered Primarily Through Health Sector
Intervention Description Target
Population
Current
coverage
1. Community
nutrition programs
for growth
promotion
Behavior change communication
focusing on optimal breastfeeding
and complementary feeding practices,
proper hand-washing, sanitation and
good nutrition practices
Children 0-23 months
of age
Negligible
2. Vitamin A
supplementation
Semi-annual doses Children 6-59 months
of age
67.2% (MICS
2011)
3. Therapeutic zinc
supplementation
with ORS
As part of diarrhea management with
ORS
Children 6-59 months
of age
Negligible
4. Multiple
micronutrient
powders
For in-home fortification of
complementary food (60 sachets
between 6-11 months of age, 60
sachets between 12-17 months of age,
and 60 sachets between 18-23 months
of age).
Children 6-23 months
of age not receiving
fortified
complementary food*
Negligible
5. Deworming Two rounds of treatment per year Children 12-59
months of age
28.4%
(FMOH)
6. Iron-folic acid Iron-folic acid supplementation Pregnant women 28.5% (MICS

31
supplementation during pregnancy 2011)
7. Iron fortification
of staple foods
Fortification of wheat flour with iron General population Negligible
8. Salt iodization Iodization of centrally-processed salt General population 77.5% (MICS
2011)
9. Public provision
of complementary
food for prevention
of moderate acute
malnutrition
Provision of a small amount (~250
kcals per day) of nutrient-dense
complementary food for the
prevention of moderate malnutrition
(moderate acute malnutrition and/or
moderate stunting)
Twice the prevalence
of underweight
(WAZ < -2) among
children 6-23 months
of age*
Negligible
10. Community-
based management
of severe acute
malnutrition
Includes the identification of severe
acute malnutrition, community or
clinic-based treatment (depending on
the presence of complications), and
therapeutic feeding using ready-to-
use therapeutic food
Incidence (estimated
as twice the
prevalence) of severe
wasting (WHZ <-3)
among children 6-59
months of age
34.5% (data
from 11 states
provided by
UNICEF)
34. In the follow-on section, the analysis focuses on nutrition-sensitive interventions that
have the potential to have an impact on nutrition outcomes. As discussed above, there is not
as much evidence-based research on nutrition-sensitive interventions as there is for nutrition
specific interventions. Therefore, our estimates are exploratory and are limited to four potential
interventions that can be scaled up and have potential for impact on nutrition outcomes.
Additional interventions were not included in these initial estimates because the impact on
nutrition is yet to be clearly documented (Masset et al. 2011; World Bank 2013; Ruel et al.
2013), and because this is an exploratory instead of an exhaustive effort. Furthermore, cost
attribution is complex because these interventions are designed for multiple purposes.
Table 2. Multi-Sectorial, Nutrition-Sensitive Interventions – an exploratory process
Intervention Description Target Population Potential for
impact
Interventions to be delivered through the agricultural sector
Biofortification Promote use of vitamin A-rich
cassava varieties to 50,000 farming
households in 2013 and potentially
expanded to 1.8 million farmers
General population Increase in vitamin
A intakes and
improve vitamin A
status (Hotz 2012a,
2012b)
Aflatoxin control Promote use of biocontrols such as
AflaSafeTM for maize and
groundnuts
General population Improve child
nutrition status
(stunting) and
reduce morbidity
(Khlangwiset and
Wu 2011)
Interventions to be delivered through the education sector
School-based
deworming
Distribution of
mebendazole/albendazole to
school-age children and training to
school teachers, community
workers and health workers
School-aged
children
Reduce anemia and
morbidity, improve
cognitive outcomes
(Miguel and Kremer
2004)

32
School-based
promotion of good
hygiene
Hygiene education program to
teach healthy practices in schools
School-aged
children
Improve child
nutrition outcomes
(stunting)(Spears
2013)
B. ESTIMATION OF TARGET POPULATION SIZES, CURRENT COVERAGE
LEVELS AND UNIT COSTS
35. Target population estimates are based primarily on demographic data obtained from the
Federal Ministry of Health and UNICEF Nigeria and are provided in Appendix 2. UNICEF
Nigeria projected the sizes of the various subgroups at the state level in 2013 using data from
Nigeria’s National Population Commission. The prevalence of child stunting (height-for-age Z-
score <-2), underweight (weight-for-age Z-score <-2), and severe wasting (weight-for-height Z-
score <-3) among children under five years of age in each state were obtained from the 2013
Nigeria MICS survey data.
36. Data on current coverage levels for interventions was obtained from various sources.
Current coverage levels for community nutrition programs for behavior change communication,
zinc supplementation with ORS, multiple micronutrient powders for home fortification, iron
fortification of staple foods, and provision of complementary food for the prevention of moderate
malnutrition were set to zero percent either because the intervention was not being implemented
and coverage was very minimal or because current reliable data were not available. Coverage
data for vitamin A supplementation were obtained from the 2011 Nigeria MICS report. Data on
deworming coverage were from programmatic data from the first round of MNCH weeks in 2012
as reported by the Federal Ministry of Health (FMOH). For coverage of iron folic acid
supplementation for pregnant women, MNCH programmatic data from the FMOH were used for
all states. The 2011 Nigeria MICS survey data were used to estimate the proportion of
households consuming adequately iodized salt in each state. Finally, UNICEF provided data on
the number of children treated for severe acute malnutrition in the 11 states where programs for
Community Management of Acute Malnutrition (CMAM) supported by the Children Investment
Fund Foundation (CIFF) are in operation. Data from the more recent semi-annual SMART
surveys were explored, but were considered unsuitable for these purposes because of concerns
about validity.8 Preliminary results from the Nigeria DHS 2013 provided estimates of the
current incidence of severe acute malnutrition and moderately acute malnutrition. We also used
the DHS 2013 to classify the states according to levels of stunting
37. Whenever possible, the unit costs of the nutrition-specific interventions were
estimated using programmatic data that were provided by local implementing partners, the
Federal Ministry of Health, and state governments based on program experience. The
estimated unit costs and the delivery platforms are listed in Table 3. In cases where the
intervention was not yet being implemented or local data were not available, the global unit cost
estimate from the World Bank (2010a) was used. A complete index of data sources and relevant
assumptions for these interventions can be found in Appendix 3.
8 For example, the state-levels estimates of stunting (a long-term measure of malnutrition) varied tremendously from
one semi-annual survey to the next. Even with changes to the growth reference used, erratic patterns remained and
could not be reconciled.

33
Table 3. Unit Costs and Delivery Platforms Used in the Calculations for Nutrition-specific
Interventions
Intervention
Unit Cost
(US$ per beneficiary
per year)
Costed Delivery Platform
1. Community nutrition programs
for growth promotion of children* $5.00
Community nutrition
programs
2. Vitamin A supplementation for
children* $0.44 MNCH weeks
3. Therapeutic zinc
supplementation with ORS for
children*
$0.86 MNCH weeks
4. Multiple micronutrient powders
for children** $3.60
Community nutrition
programs
5. Deworming for children* $0.44 MNCH weeks
6. Iron-folic acid supplementation
for pregnant women*
$1.79 (MNCH weeks)
$2.00 (community nutrition
programs)
40% via MNCH weeks
60% via Community nutrition
programs
7. Iron fortification of staple foods
for general population** $0.20 Market-based delivery system
8. Salt iodization for general
population** $0.05 Market-based delivery system
9. Public provision of
complementary food for prevention
of moderate acute malnutrition in
children**
$51.10 Community nutrition
programs
10. Community-based management
of severe acute malnutrition in
children *
$80.00
Primary health care and
Community Nutrition
programs
*denotes unit cost based on cost data from Nigeria.
** denotes unit cost based on global estimates.
38. For the nutrition-sensitive interventions, the unit costs were estimated using global
estimates with the exception of aflatoxin control. The unit cost for aflatoxin per hectare comes
from the International Institute for Tropical Agriculture (IITA) in Nigeria (Bandyopadhyay
2013). The other interventions are not yet implemented and no programmatic data are available
from local implementing partners so the only data available are global data. The unit costs and
the delivery platforms are listed in Table 4.
Table 4. Unit Costs and Delivery Platforms Used in the Estimations for selected nutrition-sensitive
Interventions
Intervention
Unit Cost
(US$ per beneficiary
per year)
Costed Delivery Platform
1. Biofortification of vitamin A-rich
yellow cassava n/a Agriculture production
2. Aflatoxin control through
biocontrol application $15.60 per hectare Agriculture production
3. School-based deworming $0.08 School-based deworming

34
distribution
4. School-based promotion of good
hygiene $2.00 Hygiene education campaign
C. ESTIMATION OF COSTS AND BENEFITS
39. The “program experience” methodology employed in World Bank (2010a is used for calculating the cost of scaling up in Nigeria. The “program experience” approach generates unit cost data that capture all aspects of service delivery (e.g. costs of commodities, transportation and storage, personnel, training, supervision, monitoring and evaluation, relevant overhead, wastage etc.) for each intervention from actual programs that are in operation in Nigeria and considers the context in which they are delivered. Another commonly used method is the “ingredients approach” in which selected activities are bundled into appropriate delivery packages (for example, number of visits to a health center) (e.g. in Bhutta et al. 2013). Although the “program experience” approach tends to yield cost estimates that are higher than the “ingredients approach,” the estimates more accurately reflect real programmatic experience, including inefficiencies in service delivery. It should, however, be noted that the calculated costs are reported in financial or budgetary terms. They do not capture the full social resource requirements, which account for the opportunity costs of the time committed by beneficiaries accessing the services.
40. We calculate the annual public investment required to scale up the interventions as
follows:
where:
Y = annual public investment required to scale up to full coverage
= additional total cost to scale up to full coverage
= additional cost for capacity development, M&E, and technical assistance
= cost covered by households living above poverty line for selected interventions
Appendix 4 describes the methodology in detail.
The expected benefits from scaling up nutrition interventions are calculated in terms of: (i)
DALYs saved; (ii) number of lives saved; (iii) cases of childhood stunting averted; and (iv)
increased program coverage. To calculate the number of DALYs, we use the method employed
by Black et al. (2008) to estimate the averted morbidity and mortality from scaling up different
nutrition interventions. The method uses population attributable fractions (PAF) based on the
comparative risk assessment project (Ezzati et al. 2004; Ezzati et al. 2002) to estimate the burden
of infectious diseases attributable to different forms of undernutrition using most recent Global
Burden of Disease study (2010). DALY estimates in this study are neither discounted nor age-
weighted, in line with the methodology used in the IMHE Global Burden of Disease 2010 and
the WHO Global Health Estimates 2012. Appendix 5 describes the detailed methodology for
calculation of DALYs. The projected number of lives saved and cases of childhood stunting
averted are calculated using the Lives Saved Tool (LiST), which translates measured coverage
changes into estimates of mortality reduction and changes in the prevalence of under five

35
stunting. This analysis included all ten interventions to calculate the number DALYs saved.
However, due to methodological limitations of the LiST tool, the calculation for number of lives
saved is based on only six9 of the ten interventions, and cases of childhood stunting averted is
based on only four10 of the ten. As such, our estimates are likely to underestimate the number of
lives saved and cases of childhood stunting averted. Appendix 6 describes the methodology for
the LiST estimates.
41. The measures for cost-effectiveness of nutrition-specific interventions are calculated
in terms of “cost per DALY saved”, “cost per life saved” and “cost per case of stunting
averted.” Estimates of benefits were combined with information on costs to produce the cost
effectiveness measures for each intervention as well as for overall package of intervention. The
evaluation of cost-effectiveness ratio in terms of DALYs saved is based on the categorization
used by WHO-CHOICE (Choosing Interventions that are Cost-Effective):11 an intervention is
considered as “very cost-effective” if the range for the cost per DALY averted is less than GDP
per capita12, “cost-effective” if it is between 1 to 3 times GDP per capita, and “not cost-effective”
if it exceeds 3 times GDP per capita (WHO 2014). Due to limitations in the available data, we
were unable to calculate the number of cases of stunting averted for some of the scenarios.
42. Cost-benefit analysis (CBA) is conducted based on the estimated economic value of
the benefits attributable to nutrition specific interventions. In order to arrive at a dollar value
for the impact on mortality and morbidity of a five year scale up plan, we use estimates of
number of lives saved and reduction in stunting prevalence produced by the LiST tool. Following
established practice, a life year saved is valued as equivalent to GNI per capita, which we
consider to be a conservative measure as it only accounts for the economic and not social value
of a year of life. In order to estimate the value of the reduction in stunting, we follow the
methodology used in Hoddinott et al. (2013), which values a year of life lived without stunting
based on the assumption that stunted individuals lose an average of 66 percent of lifetime
earnings. Future benefits are then age-adjusted and discounted at three potential discount rates (3,
5 and 7 percent) in order to arrive at their present value. The present value of future benefits is
then compared with the annual public investment required, which allows us to estimate the net
present value (NPV) and internal rate of return (IRR) of the investment. A detailed explanation
of the benefit estimation methodology can be found in Appendix 7.
43. The annual increase in economic productivity attributable to each package of
interventions is calculated based on the same estimates of future benefits. Although these
benefits only occur once beneficiaries have reached productive age, we assume that these
9 The six interventions are community nutrition programs for growth promotion, vitamin A supplementation,
therapeutic zinc supplementation with ORS, iron-folic acid supplementation, the public provision of complementary food for the prevention of moderate acute malnutrition and community-based management of severe acute malnutrition.
10 The four interventions are community nutrition programs for growth promotion, vitamin A supplementation,
iron-folic acid supplementation and the public provision of complementary food for the prevention of moderate acute malnutrition.
11 Information on the cost-effectiveness thresholds used by WHO-CHOICE can be found at
http://www.who.int/choice/costs/CER_levels/en/
12 Nigeria’s GDP per capita in current USD was $3,010 in 2013 (World Bank 2013)

36
benefits serve as an approximation of the present value of economic productivity lost each year
as a result of mortality and morbidity that would otherwise be prevented by scaling up nutrition
interventions. Values presented are taken from a year in which all beneficiaries have reached
productive age.
44. The approach for estimating the potential costs and benefits of nutrition sensitive
interventions differs from the methodology used for nutrition specific interventions.
Similar to nutrition specific interventions, the total cost for scaling up the interventions is
calculated by multiplying the unit cost by the target population (local Nigerian unit costs or
regional unit costs are used depending on availability). However, since most nutrition-sensitive
interventions have multiple objectives, it is not always feasible to attribute the nutrition related
benefits to the overall costs of the interventions. Because these constraints limit the accuracy of
cost-effectiveness estimates, we instead rely on secondary sources/published literature when
available, with cost-effectiveness presented in terms of cost per DALY saved.
D. SCENARIOS FOR SCALING UP NUTRITION INTERVENTIONS
45. When estimating the costs and benefits of scaling up nutrition interventions, we
begin with estimates for scaling all ten interventions to full national coverage, followed by
estimates for various scale up scenarios. The “full coverage” estimates can be considered the
medium-term policy goal for FGoN, however, resource constraints will likely limit the
government’s ability to achieve full national coverage in the short-term. Therefore, we also
propose 5 scenarios for prioritizing the scale up of nutrition interventions over a shorter-term
time frame of 5 years:
Scenario 1: Prioritize scale up by region
Scenario 2: Prioritize scale up by intervention
Scenario 3: Prioritize scale up by state
Scenario 4: Prioritize scale up by state and by intervention
Scenario 5: Prioritize scale up by target coverage
Within each scenario we consider several variations and analyze their cost-effectiveness in terms
of cost per DALY saved, cost per life saved and cost per case of childhood stunting averted.
After our initial analysis, we present the 5 most attractive scale-up scenarios and discuss them in
more detail.
46. “Full coverage” is defined as 100 percent of the target population for all
interventions except the treatment of severe acute malnutrition, for which full coverage is
assumed to be 80 percent. This is consistent with the methodology used in World Bank, 2010a,
and is based on the reality that few community-based treatment programs have successfully
achieved more than 80 percent coverage at scale. Under Scenario 5, we also propose several
“partial coverage” scenarios that reduce coverage targets to more realistic levels, including some
coverage rates that are in line with the coverage envisioned in the Government’s draft National
Strategic Plan for Nutrition.

37
PART IV – RESULTS FOR NUTRITION-SPECIFIC INTERVENTIONS
A. TOTAL COST, EXPECTED BENEFITS AND COST EFFECTIVENESS
47. The total additional public investment required to scale up 10 nutrition-specific
interventions from current coverage levels to full coverage at the national-level in Nigeria is
estimated at US$837 million annually (Table 5). This cost includes the additional cost of
scaling up all ten interventions across the entire country (US$892 million per year) plus
additional resources for monitoring and evaluation, operations research and technical support,
and capacity development for program delivery (estimated at US$98 million). Of this total
amount of US$991 million, part of the costs for iron fortification, multiple micronutrient
powders, salt iodization and complementary food could be covered from private resources from
households above the poverty line (estimated at US$153 million), which leaves a financing gap
of US$837 million for a full scale-up nationwide.
Table 5. Estimated Cost of Scaling Up 10 Nutrition Specific Interventions to Full Coverage
Intervention Annual Cost
(US$ million)
Community programs for growth promotion of children 70
Vitamin A supplementation for children 5
Therapeutic zinc supplementation with ORS for children 27
Micronutrient powders for children 19
Deworming for children 18
Iron-folic acid supplementation for pregnant women 12
Iron fortification of staple foods for general population 35
Salt Iodization for general population 2
Public provision of complementary food for prevention of moderate acute
malnutrition in children
413
Community-based management of severe acute malnutrition in children 294
Total cost for scaling up all 10 interventions 892
Capacity development for program delivery 80
M&E, operations research and tech. support 18
Household contributions (153)
ANNUAL PUBLIC INVESTMENT REQUIRED 837

38
48. A five-year budget for the scale up of all 10 interventions nationwide is estimated to
cost between US$ 2.4 and 2.9 billion, depending on the how fast the program reaches full
coverage. We have provided these figures (Table 6) for the purpose of comparison only. When
the 10 interventions are fully scaled up by year 3, the total programmatic costs over five years is
estimated at US$2.9 billion. If full coverage is reached by year 4, then the total cost is US$2.7
billion. If it takes five years to reach full coverage, then the total five-year budget would be
US$2.4 billion
Table 6. Scale up of all 10 Interventions Over 5 years, 3 Scenarios in US$ Millions
Time to Reach
100% Scale
Year 1
(20%
coverage)
Year 2
(40%
Coverage)
Year 3
(60%
coverage)
Year 4
(80%
coverage)
Year 5
(100%
coverage)
Total
Scale Up
Costs
Over 5 Years
3 Years 192 403 773 765 765 2,897
4 Years 192 403 576 765 765 2,700
5 Years 184 327 462 614 765 2,351
49. The expected benefits from scaling up these ten nutrition-specific interventions
across the entire country are enormous (Table 7). Over 8.7 million DALYs and 183,000 lives
would be saved annually, while more than 3 million cases of stunting among children under five
would be averted. Program coverage is assumed to expand as follows:
• 14 million families with children 0-23 months reached by community programs for
behavior change communication and growth promotion;
• 10.6 million additional children 6-59 months receive twice-yearly doses of life-saving
vitamin A supplementation;
• 31.4 million children 6-59 months receive zinc supplementation as part of diarrhea
management;
• 5.2 million children 6-23 months receive vitamins and minerals through multiple
micronutrient powders;
• 39.9 million children 12-59 months receive deworming medication;
• 6.3 million additional pregnant women receive iron-folic acid tablets as part of their
antenatal care;
• 174.4 million people consume staple foods fortified with iron;
• 38.8 million more people who do not currently use iodized salt obtain it;
• 3.7 million more children 6-59 months treated for severe acute malnutrition using
community-based management practices;
• 8.1 million children aged 6-23 months receive a small amount of nutrient-dense
complementary food (~250 kcals/day) for the prevention or treatment of moderate
malnutrition.

39
Table 7. Estimated Annual Benefits for Scaling Up 10 Nutrition Interventions to Full Coverage
* DALY estimates in this study are neither discounted nor age-weighted, in line with the methodology used in the
IMHE Global Burden of Disease 2010 and the WHO Global Health Estimates 2012. For more information on the
methodology used to calculate DALYs averted, see Appendix 5.
** DALY estimates for IFA supplementation are calculated for DALYs averted among pregnant women. They do
not include the DALYs averted among children born to mothers who received these supplements.
*** The total of the interventions implemented simultaneously does not equal to the sum of the individual interventions. This is
because some interventions affect nutrition outcomes via similar pathways causing their combined impact to be different than the
individual sums.
50. Most proposed nutrition-specific interventions are highly cost-effective (Table 8).
With the exception of the public provision of complementary food, our analysis finds that all
interventions are “very cost-effective” according to WHO criteria (WHO 2014). Using the same
criteria, the public provision of complementary food is considered to be “cost-effective”. DALY
estimates for salt iodization and iron fortification of flour in Nigeria are not available at this time.
Intervention Beneficiaries
Covered
DALYs
Saved* Lives Saved
Number of
Stunting
Cases Averted
Community nutrition
programs for growth
promotion of children
13,955,394 5,795,862 89,140 1,859,167
Vitamin A supplementation
for children 10,545,198 161,396 10,718 303,844
Therapeutic Zinc
supplementation with ORS for
children
31,399,636 125,270 28,988 n/a
Micronutrient powders for
children 5,217,156 426,585 n/a n/a
Deworming for children 39,893,072 66,399 n/a n/a
Iron-folic acid
supplementation for pregnant
women
6,276,280 269,893** 1,867 12,033
Iron fortification of staple
foods for general population 174,442,422 n/a n/a n/a
Salt Iodization for general
population 38,757,068 n/a n/a n/a
Public provision of
complementary food for
prevention of moderate acute
malnutrition in children
8,072,408 126,677 14,445 2,006,577
Community-based
management of severe acute
malnutrition in children
3,669,417 1,735,878 91,340 n/a
Total when all interventions
implemented
simultaneously***
n/a 8,707,960 183,411 3,056,494

40
51. In countries such as Nigeria where fiscal and capacity constraints will limit scale-up,
the public provision of complementary foods may be a lower priority. Issues of governance,
accountability, and supply logistics will further constrain the scale-up of the public provision of
complementary foods. While the benefits are clear, the relatively high cost of this type of
intervention, in addition to the aforementioned concerns, lead us to conclude that the public
provision of complementary food should be implemented only once adequate capacity has been
developed.
52. For the package as a whole, the total cost per DALY saved is estimated at $102, the
total cost per life saved is estimated at $4,865, and the total cost per case of stunting averted
is estimated to be $292.13 Variation in costs among the interventions is high, with costs per life
saved ranging from $433 for vitamin A supplementation to $28,557 for the public provision of
complementary foods. Overall, these cost estimates translate into an increase in annual public
resource requirements of $14.50 per child. This compares favorably to global estimates of $30
per child calculated in World Bank (2010a).
13
For the total cost per benefit unit, we divide the total annual program cost for all 10 interventions (excluding
M&E, and capacity development costs, but before subtracting household contributions) by the benefits estimates
available. Note that DALYs saved estimates are not available for 2 of the 10 interventions, lives saved estimates are
not available for 4 of the 10 interventions and stunting reduction estimates are not available for 6 of the 10
interventions.

41
Table 8. Cost Effectiveness of Scaling Up 10 Nutrition Interventions to Full Coverage, US$
*Very cost-effective according to WHO-CHOICE criteria (WHO 2014).
**Cost-effective according to WHO-CHOICE criteria (WHO 2014).
*** The total of the interventions implemented simultaneously does not equal to the sum of the individual interventions. This is
because some interventions affect nutrition outcomes via similar pathways causing their combined impact to be different than the
individual sums.
B. POTENTIAL SCALE-UP SCENARIOS
53. Scenario 1: Scale Up by Region. Table 9 shows the estimated costs and benefits of
scaling up the ten nutrition specific interventions by region. The regions display significant
disparities in malnutrition rates. All states in the North-Western region have stunting levels
above 40 percent (nearly 2.5 times that in the South East) and this region accounts for almost 40
percent of the overall costs. The states with high malnutrition rates will disproportionately
benefit from scaling up nutrition interventions as demonstrated by high expected benefits in
terms of DALYs saved and lives saved.
Intervention Cost/DALY Saved Cost/Life
Saved
Cost/Stunted
Case Averted Nigeria Global
Community nutrition programs for
growth promotion of children
12* 53-153 783 38
Vitamin A supplementation for
children
29* 3-16 433 15
Therapeutic Zinc supplementation
with ORS for children
216* 73 932
Micronutrient powders for children 44* 12
Deworming for children 264* n/a
Iron-folic acid supplementation for
pregnant women
43* 66-115 6,280 974
Iron fortification of staple foods for
general population
n/a
Salt Iodization for general population n/a
Public provision of complementary
food for prevention of moderate acute
malnutrition of children
3,256** 500-1000 28,557 206
Community-based management of
severe acute malnutrition of children
169* 41 3,214
TOTAL when all interventions
implemented simultaneously***
102* n/a 4,865 292

42
Table 9. Scenario 1: Cost and Benefits of Scaling Up 10 Nutrition Interventions by Region
Region Annual Public
Investment (US$
million)
Annual Benefits
DALYs Saved Lives Saved
North-Central $81 1,255,680 24,530
North-Eastern $134 1,205,553 27,570
North-Western $405 2,502,917 60,022
South-Eastern $58 899,369 16,278
South-South $69 1,199,935 22,212
South-Western $91 1,644,492 32,798
TOTAL $837 8,707,946 183,411
54. Given the high stunting rates in the North-West, the preferred scenario (Scenario 1)
is to scale up interventions in states in the North-West region, with an annual public
investment of $405 million. This scenario would save over 2.5 million DALYs and at least
60,000 lives. It would also increase program coverage as follows:
• 3.6 million families with children 0-23 months reached by community programs for
behavior change;
• 3.6 million additional children 6-59 months receive twice-yearly doses of life-saving
vitamin A supplementation;
• 8.0 million children 6-59 months receive zinc supplementation as part of diarrhea
management;
• 0.08 million children 6-23 months receive vitamins and minerals through multiple
micronutrient powders;
• 9 million children 12-59 months receive deworming medication;
• 1.2 million additional pregnant women receive iron-folic acid tablets as part of their
antenatal care;
• 44.3 million people able to consume staple foods fortified with iron;
• 16.6 million more people gain access to iodized salt;
• 2.0 million more children 6-59 months treated for severe acute malnutrition using
community-based management practices;
• 16.5 million children aged 6-23 months receive a small amount of nutrient-dense
complementary food (~250 kcals/day) for the prevention or treatment of moderate
malnutrition.
However, because budgetary allocations in Nigeria are done by state, rather than by region, the
regional scale-up approach is not a pragmatic option.
55. Scenario 2: Scale Up by Intervention. Scenario 2 is based on step-wise scale-up by
intervention. The primary considerations for choosing the interventions in each step are cost
effectiveness, recommended phasing of interventions, implementation capacity and delivery
mechanisms. The proposed plan for a step-wise scale-up by intervention is summarized below
and illustrated in Figure 6.
Step 1 focuses on a package of primarily preventive interventions that can be scaled up
quickly, either with existing capacities or with modest investment in capacity-building for

43
community nutrition programs and child health days. It also includes community-based
management of severe acute malnutrition at 30 percent coverage. Although in most other
country contexts, this is a resource-intensive intervention and relatively complex to
implement, in Nigeria, efforts are already underway to implement community-based
management of severe acute malnutrition in 11 states, and some capacities have been
built, making the 30 percent coverage goal feasible. The cost of scaling up community
nutrition programs for behavior change communication and all micronutrient and
deworming interventions at full coverage in all states and community-based management
of severe acute malnutrition to reach 30 percent of the target population is US$296.4
million. An additional US$26.7 million for capacity development and US$5.9 million for
monitoring and evaluation, operations research, and technical support is budgeted, which
brings the total cost of step one to US$329.0 million. The portion of scale up costs that
could be covered by households above the poverty line is estimated at US$21.7 million.
Therefore the total public investment required for Step 1 is estimated at US$307.3
million.
Step 2 includes the costs of a full scale up of treatment for severe acute malnutrition from
a base of 30 percent in Step 1 to 80 percent coverage, with the assumption that additional
implementation capacities are built in Step 1. The estimated cost of this scale-up is
US$183.5 million. We also include an additional US$3.7 million for monitoring and
evaluation, operations research, and technical support and US$16.5 million for capacity
development in step two, which brings the total public investment required for Step 2
to US$203.7 million.
Step 3 adds scaling up of the public provision of complementary foods to prevent
moderate acute malnutrition among children under 2 years of age. The total cost of this
intervention is US$412.5 million. The additional cost for monitoring and evaluation,
operations research, and technical support and capacity development in step three is
US$45.4. Of the total cost, an estimated US$131.6 million could be resourced from
private resources in households above the poverty line. This brings the estimated public
investment required for Step 3 to US$326.3 million.
Step 3 interventions are assigned the lowest priority for the following reasons: (i) the 2013
Lancet nutrition series concluded that there are no additional benefits of public provision of
complementary foods beyond those provided by dietary counseling and education; (ii) at
US$6,849 per DALY saved, the cost-effectiveness of public provision of complementary foods is
much less attractive than that of other proposed interventions; (iii) the total cost of
complementary foods is overwhelming and accounts for more than half cost of the total cost of
scaling up all interventions, while the benefits as estimated lives saved or DALYs saved are
lower than other interventions; (iv) governance, accountability, supply-chain, and logistics are
key challenges associated with large-scale food distribution and are not inconsequential in a
country the size of Nigeria. The estimated benefits do not out-weigh these risks, and the costs are
high, as compared with other interventions. Under these circumstances, rapid scale-up is neither
feasible nor is it recommended.

44
Figure 6. Scenario 2: Step-wise Scale-Up by Intervention
Note: A portion of the intervention will be resourced from private resources from households above the poverty line,
which explains why the arrows do not sum exactly to total. (See text for details.)
Source: Authors’ calculations.
56. The preferred scale-up Scenario 2 would be to scale up Step 1 and Step 2
interventions, requiring an annual public investment of $511 million. As shown in Table 10,
this would save over 8.5 million DALYs and over 164,000 lives. It would also provide the
following additional program coverage:
• 14 million families with children 0-23 months reached by community programs for
behavior change;
• 10.6 million additional children 6-59 months receive twice-yearly doses of life-saving
vitamin A supplementation;
• 31.4 million children 6-59 months receive zinc supplementation as part of diarrhea
management;
• 5.7 million children 6-23 months receive vitamins and minerals through multiple
micronutrient powders;
• 39.9 million children 12-59 months receive deworming medication;
• 6.3 million additional pregnant women receive iron-folic acid tablets as part of their
antenatal care;
• 174.4 million people able to consume staple foods fortified with iron;
• 38.8 million more people gain access to iodized salt;
• 3.7 million more children 6-59 months treated for severe acute malnutrition using
community-based management practices.
Step 1: With a public investment of an additional US$307.3 million
Step 2: With a public investment of an
additional US$203.7 million
Step 3: With a public investment of an
additional US$326.3 million

45
Table 10. Scenario 2: Cost and Benefits for Scaling Up 10 Nutrition-specific Interventions by
Intervention
Interventions Annual Public
Investment
(US$ millions)
Annual Benefits
DALYs Saved Lives Saved
Step 1: Community nutrition programs
for growth promotion, all micronutrient
and deworming, 30% coverage of
community-based management of severe
acute malnutrition
$307 7,496,345 122,638
Step 2: 50% of community-based
management of severe acute malnutrition
$204 1,084,924 56,742
SUBTOTAL (STEP 1 AND 2
INTERVENTIONS WHEN
IMPLEMENTED
SIMULTANEOUSLY)*
$511 8,581,269
164,390
Step 3: Public provision of complementary
food for moderate acute malnutrition
$326 126,677 14,445
TOTAL when all interventions
implemented simultaneously*
$837 8,707,946 183,411
* The total of the interventions implemented simultaneously does not equal to the sum of the individual
interventions. This is because some interventions affect nutrition outcomes via similar pathways causing their
combined impact to be different than the individual sums.
57. Scenario 3: Scale Up by State. Scenario 3 proposes scaling up all 10 interventions in
three steps using state-level geographic targeting criteria based on the prevalence of child
stunting in these states. First are the highest burden states with a stunting prevalence above 35
percent. The middle burden states are those with a stunting prevalence between 25 and 35
percent and the lowest burden states are those with stunting prevalence below 25 percent. The
step-wise scale-up by state is summarized below and Table 11 shows the estimated cost and
benefits for each step.
For the highest burden states, all 10 interventions would be scaled up in the 13 states
with a stunting prevalence above 35%. Eleven of the 13 states are in North-Western and
North-Eastern regions, and one (Plateaux) is in the North-Central region. It is proposed
that Nasarawa would also be included since it is currently participating in the results-
based financing program. The total cost including costs of M&E operations research,
technical assistance, and capacity development would be US$578.8 million. Adjusting for
household contributions, the annual public investment required for the highest
burden states is estimated at US$506.9 million.
Next, for the middle burden states, all 10 interventions would be scaled up in 5 states
with a stunting prevalence between 25 and 35 percent. The total cost including costs of
M&E operations research, technical assistance, and capacity development would be
US$132.1 million. After subtracting contributions from household living above the
poverty line, an annual public investment required for middle burden states is
US$105.0 million.

46
For the lowest burden states, all 10 interventions would be scaled up in the remaining 19
states with a stunting prevalence below 25 percent. Most of states are in southern regions
(South-East, South-South and South-West) with the exceptions of FCT Abuja, Kogi and
Benue which are in the North-Central region. The total annual cost of this step including
costs of M&E operations research, technical assistance, and capacity development would
be US$279.8 million. After adjusting for contributions from households living above the
poverty line, the annual public investment required for the lowest burden states is
US$ 225.4 million.
58. The preferred Scenario 3 is to prioritize the highest burden states, which would
focus on scaling-up all interventions in the 13 states with the most severe stunting rates.
This would require an annual public investment of $507 million; saving at least 3.5 million
DALYs and over 80,000 lives. Program coverage would increase as follows:
• 5.2 million families with children 0-23 months reached by community programs for
behavior change;
• 5.3 million additional children 6-59 months receive twice-yearly doses of life-saving
vitamin A supplementation;
• 11.7 million children 6-59 months receive zinc supplementation as part of diarrhea
management;
• 0.6 million children 6-23 months receive vitamins and minerals through multiple
micronutrient powders;
• 13.1 million children 12-59 months receive deworming medication;
• 2.1 million additional pregnant women receive iron-folic acid tablets as part of their
antenatal care;
• 65.1 million people able to consume staple foods fortified with iron;
• 22.9 million more people gain access to iodized salt;
• 2.3 million more children 6-59 months treated for severe acute malnutrition using
community-based management practices;
• 22.9 million children aged 6-23 months receive a small amount of nutrient-dense
complementary food (~250 kcals/day) for the prevention or treatment of moderate
malnutrition.

47
Table 11. Scenario 3: Costs and Benefits for Scaling Up 10 Nutrition-specific Interventions by State
States Criteria Annual Public
Investment
(US$ million)
Annual Benefits
DALYs Saved Lives Saved
Highest Burden1 13 States with >35%
stunting and/or RBF
States
$507 3,505,652 81,678
Middle Burden2 5 States with 25-35%
stunting
$105 1,276,744 28,835
Lowest Burden3 States with <25%
stunting
$225 3,925,549 72,898
TOTAL $837 8,707,946 183,411 1Bauchi, Gombe, Taraba, Yobe, Jigawa, Kaduna, Kano, Katsina, Kebbi, Sokoto, Zamfara, Nasarawa, Plateau. 2Borno, Adamawa, Niger, Kwara, Oyo. 3FCT Abuja, Benue, Kogi, Ondo, Ebonyi, Cross-Rivers, Abia, Anambra, Enugu, Imo, Akwa-Ibom, Bayelsa, Delta,
Edo, Rivers, Ekiti, Lagos, Ogun, Osun.
59. Scenario 4: Scale Up by State and by Intervention. Scenario 4 is a hybrid of Scenario 2 and
3 and proposes the scaling up by state and by selected interventions as listed in Table 12 below.
The first variation, Scenario 4a, is to scale up step 1 and step 2 interventions in 18 states where
stunting rates are higher than 25 percent (highest and middle burden states), requiring an annual
public investment of $337 million, saving almost 4.7 million DALYs and 96,000 lives. Scenario
4a would provide the following program benefits:
• 7.2 million families with children 0-23 months reached by community programs for
behavior change;
• 6.9 million additional children 6-59 months receive twice-yearly doses of life-saving
vitamin A supplementation;
• 16.1 million children 6-59 months receive zinc supplementation as part of diarrhea
management;
• 1.4 million children 6-23 months receive vitamins and minerals through multiple
micronutrient powders;
• 17.4 million children 12-59 months receive deworming medication;
• 2.9 million additional pregnant women receive iron-folic acid tablets as part of their
antenatal care;
• 89.1 million people able to consume staple foods fortified with iron;
• 28.3 million more people gain access to iodized salt;
• 2.8 million more children 6-59 months treated for severe acute malnutrition using
community-based management practices.

48
Table 12. Scenario 4: Cost of Scaling Up 10 Nutrition Interventions by State and by Intervention,
US Millions
Intervention/State Highest
Burden1
Middle
Burden2
Lowest
Burden3
Step 1 Interventions: Community nutrition
programs for growth promotion, all
micronutrient and deworming, 30%
coverage of community-based management
of severe acute malnutrition
$144 $41 $123
Step 2 Interventions: 50% of community-
based management of severe acute
malnutrition
$128 $25 $51
Step 3 Interventions: Public provision of
complementary food for prevention of
moderate acute malnutrition
$236 $39 $52
1Bauchi, Gombe, Taraba, Yobe, Jigawa, Kaduna, Kano, Katsina, Kebbi, Sokoto, Zamfara, Nasarawa, Plateau. 2Borno, Adamawa, Niger, Kwara, Oyo. 3FCT Abuja, Benue, Kogi, Ondo, Ebonyi, Cross-Rivers, Abia, Anambra, Enugu, Imo, Akwa-Ibom, Bayelsa, Delta,
Edo, Rivers, Ekiti, Lagos, Ogun, Osun.
Table 13. Annual Costs and Benefits from Scenarios 4a and 4b
Scenarios Annual Public Investment
(US$ million)
Annual Benefits
DALYs Saved Lives
Saved
Scenario 4a
$337 4,694,076 96,092
Scenario 4b
$271 3,439,969 70,911
60. Scenario 4b would limit scaling up step 1 and step 2 interventions to the 13 states
with the highest burden of stunting. Scenario 4b would require an annual public
investment of $271 million, and would save over 3.4 million DALYs and 70,000 lives (Table
13). Furthermore, Scenario 4b would provide the following program benefits:
5.2 million families with children 0-23 months reached by community programs for
behavior change;
5.3 million additional children 6-59 months receive twice-yearly doses of life-saving
vitamin A supplementation;
11.7 million children 6-59 months receive zinc supplementation as part of diarrhea
management;
0.6 million children 6-23 months receive vitamins and minerals through multiple
micronutrient powders;
13.1 million children 12-59 months receive deworming medication;
2.1 million additional pregnant women receive iron-folic acid tablets as part of their
antenatal care;

49
65.1 million people are able to consume staple foods fortified with iron;
22.9 million more people gain access to iodized salt;
2.3 million more children 6-59 months treated for severe acute malnutrition using
community-based management practices.
61. Scenario 5: Scale up by varying program coverage targets. As discussed above, the
previous scenarios assume full program coverage. Scenario 5 allows for “partial” coverage rates
as a way to scale-up to the eventual “full coverage” scenario (Table 14). These partial program
coverage targets were agreed upon at a meeting between donors and the Government of Nigeria
in February, 2014.14
Table 14. Full and Partial Program Coverage Targets
14
The interventions are expected to reach the following share of targeted coverage: 10% in year 1, 32.5% in year 2,
55% in year 3, 77.5% in year 4 and 100% by year 5. Capacity building is assumed to be 9% of total costs, and within
that, 79% is for capacity building and training 13% is for resource mobilization and advocacy and 8% is for
coordination. Capacity building will be distributed across the five years as follows: 20% in year 1, 30% in years 3
and 4, 10% in year 4 and the final 10% in year 5. Finally, monitoring and evaluation is estimated to be 2% of
intervention costs.
Intervention Percent of target population
covered by Year 5
Full Coverage
(Scenarios 1-4)
Partial Coverage
(Scenario 5)
Community nutrition programs for growth promotion
of children 100 50
Vitamin A supplementation for children 100 90
Therapeutic zinc supplementation with ORS for
children 100 80
Micronutrient powders for children 100 90
Deworming for children 100 90
Iron-folic acid supplementation for pregnant women 100 90
Iron fortification of staple foods for general
population 100 100
Salt Iodization for general population 100 100
Public provision of complementary food for
prevention of moderate acute malnutrition in children 100 35
Community-based management of severe acute
malnutrition in children 80 35

50
Table 15. Scenarios Considered Within Scenario 5
Scenario Annual Public
Investment
(US$ million)
Annual Benefits
DALYs
Saved
Lives
Saved
Cases of
Stunting
Averted
5a) All interventions in all states
at “partial” coverage rates $353 4,388,415 96,463 1,434,988
5b) Micronutrients and
deworming interventions at
“partial” coverage rates in all
states and community nutrition
programs and community-based
management of severe acute
malnutrition at “partial”
coverage rates in highest burden
states*
$184 2,256,091 58,519 n/a
*Highest burden states are Bauchi, Gombe, Taraba, Yobe, Jigawa, Kaduna, Kano, Katsina, Kebbi, Sokoto,
Zamfara, Nasarawa, Plateau.
62. Scenario 5a would scale up all 10 interventions to the partial coverage levels and
would require total annual public investment of US$353 million (Table 15). This includes
the total cost of scaling up the 10 interventions of US$371 million plus US$34 million for
capacity development and $8 million for monitoring and evaluation, operations support and
technical support. We also assume households above the poverty line can contribute $59 million
towards the costs of some interventions, yielding the net total of US$353.
63. This scenario would save over 4.3 million DALYs, 96,000 lives, and avert over 1.4
million cases of stunting among children under five years of age. (Appendix 8 provides the
estimates of cost and benefits by state). Additionally, this scenario would provide the following
program benefits:
• 7.4 million additional children 6-59 months receive twice-yearly doses of life-saving
vitamin A supplementation;
• 7.0 million families with children 0-23 months reached by community programs for
behavior change;
• 25.1 million children 6-59 months receive zinc supplementation as part of diarrhea
management;
• 4.9 million children 6-23 months receive vitamins and minerals through multiple
micronutrient powders;
• 34.3 million children 12-59 months receive deworming medication;
• 5.4 million additional pregnant women receive iron-folic acid tablets as part of their
antenatal care;
• 174.4 million more people able to consume staple foods fortified with iron;
• 38.8 million more people gain access to iodized salt;
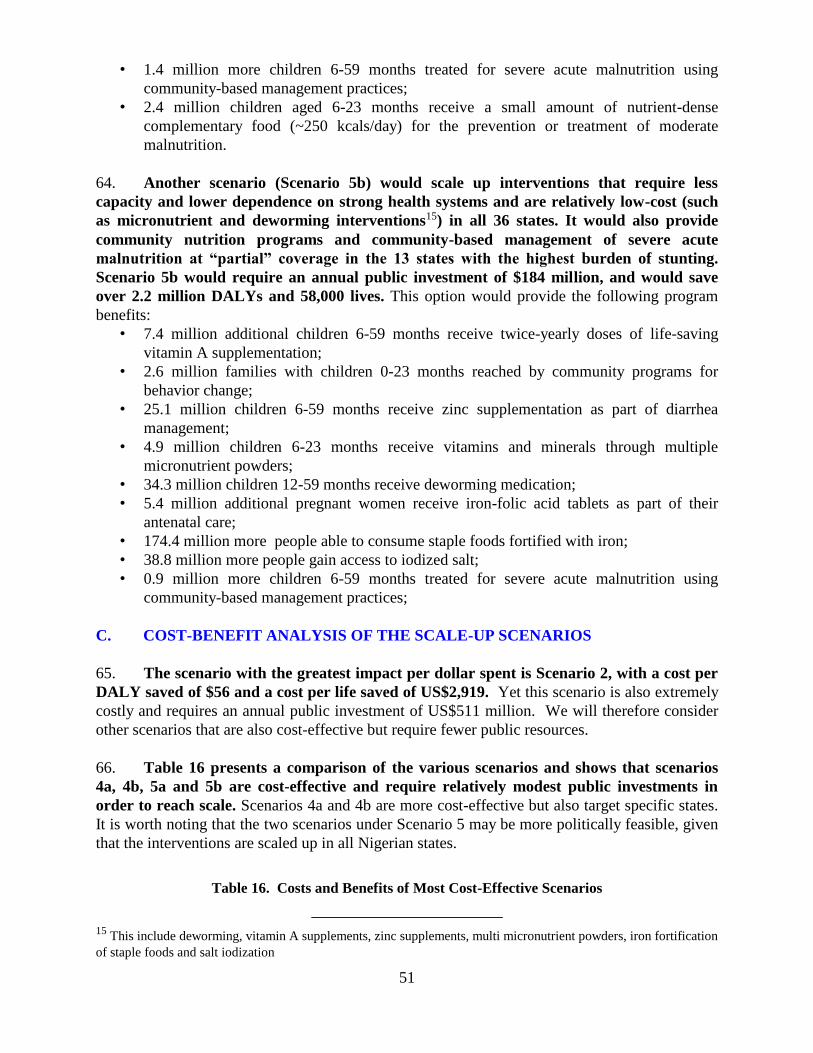
51
• 1.4 million more children 6-59 months treated for severe acute malnutrition using
community-based management practices;
• 2.4 million children aged 6-23 months receive a small amount of nutrient-dense
complementary food (~250 kcals/day) for the prevention or treatment of moderate
malnutrition.
64. Another scenario (Scenario 5b) would scale up interventions that require less
capacity and lower dependence on strong health systems and are relatively low-cost (such
as micronutrient and deworming interventions15) in all 36 states. It would also provide
community nutrition programs and community-based management of severe acute
malnutrition at “partial” coverage in the 13 states with the highest burden of stunting.
Scenario 5b would require an annual public investment of $184 million, and would save
over 2.2 million DALYs and 58,000 lives. This option would provide the following program
benefits:
• 7.4 million additional children 6-59 months receive twice-yearly doses of life-saving
vitamin A supplementation;
• 2.6 million families with children 0-23 months reached by community programs for
behavior change;
• 25.1 million children 6-59 months receive zinc supplementation as part of diarrhea
management;
• 4.9 million children 6-23 months receive vitamins and minerals through multiple
micronutrient powders;
• 34.3 million children 12-59 months receive deworming medication;
• 5.4 million additional pregnant women receive iron-folic acid tablets as part of their
antenatal care;
• 174.4 million more people able to consume staple foods fortified with iron;
• 38.8 million more people gain access to iodized salt;
• 0.9 million more children 6-59 months treated for severe acute malnutrition using
community-based management practices;
C. COST-BENEFIT ANALYSIS OF THE SCALE-UP SCENARIOS
65. The scenario with the greatest impact per dollar spent is Scenario 2, with a cost per
DALY saved of $56 and a cost per life saved of US$2,919. Yet this scenario is also extremely
costly and requires an annual public investment of US$511 million. We will therefore consider
other scenarios that are also cost-effective but require fewer public resources.
66. Table 16 presents a comparison of the various scenarios and shows that scenarios
4a, 4b, 5a and 5b are cost-effective and require relatively modest public investments in
order to reach scale. Scenarios 4a and 4b are more cost-effective but also target specific states.
It is worth noting that the two scenarios under Scenario 5 may be more politically feasible, given
that the interventions are scaled up in all Nigerian states.
Table 16. Costs and Benefits of Most Cost-Effective Scenarios
15
This include deworming, vitamin A supplements, zinc supplements, multi micronutrient powders, iron fortification
of staple foods and salt iodization

52
Scenario Annual
Public
Investment
(US$
million)
Annual Benefits Cost per Benefit Unit (US$)
DALYs
Saved
Lives
Saved
Cases of
Stunting
Averted
DALY
Saved
Life
Saved
Case of
Stunting
Averted
Full National
Coverage $837 8,707,960 183,411 3,056,494 102 4,865 292
Scenario 1 $405 2,502,917 60,022 n/a 167 6,980 n/a
Scenario 2 $511 8,581,269 164,390 n/a 56 2,919 n/a
Scenario 3 $507 3,505,652 81,678 n/a 149 6,383 n/a
Scenario 4a $337 4,694,076 96,092 n/a 66 3,229 n/a
Scenario 4b $271 3,439,969 70,911 n/a 72 3,496 n/a
Scenario 5a $353 4,388,415 96,463 1,434,988 85 3,849 259
Scenario 5b $184 2,256,091 58,519 n/a 82 3,152 n/a
67. Recognizing the difficulty of scaling to full coverage in one year, and following the
five-year time frame of the Government’s National Strategic Plan of Action for Nutrition,
we consider the costs over five years for Scenarios 4a, 4b, 5a and 5b (Table 17).
Interventions are assumed to increase from current coverage as follows: 20 percent of coverage
in year 1, 40 percent in year 2, 60 percent in year 3, 80 percent in year 4 and 100 percent in year
5. For these calculations, we consider the expenditures on capacity development and system
strengthening required to scale to full coverage to be a fixed cost, with some additional funds
allocated to refresher training and rehiring in the years after scale has been reached. Thus, the
average annual amount spent on capacity development is allocated across the five years, rather
than increasing in proportion to coverage as is the case with the other costs.

53
Table 17. Scale Up of Scenarios 4 and 5 in US$ Millions
Scenario Year 1
(20%
coverage)
Year 2
(40%
Coverage)
Year 3
(60%
coverage)
Year 4
(80%
coverage)
Year 5
(100%
coverage)
Total
Scale Up Costs
Over 5 Years
Scenario 4
4a $74 $134 $191 $254 $316 $987
4b $59 $106 $173 $201 $251 $769
Scenario 5
5a $39 $113 $186 $251 $323 $912
5b $20 $59 $97 $131 $169 $476
68. A high burden of malnutrition negatively impacts a nation’s human capital.
Therefore, an investment in improving nutrition outcomes among children is also an
investment in Nigeria’s economic future. The two main ways through which malnutrition
affects economic productivity are increased mortality and morbidity, or in other words, lives lost
and years lived with a disease or disability. For the purposes of this analysis, we estimate the
potential economic benefits of scaling up nutrition interventions in terms of lives saved
(reduction in mortality) and cases of stunting averted (reduction in morbidity). Because each life
lost results in one less citizen contributing to the nation’s economy, and because stunted children
tend to earn and consume less, these impact estimates help us to arrive at approximations of the
return on investment attributable to the scale up of a particular package of interventions.
69. It should be noted that these estimates of economic benefits are based on a highly
conservative methodology that does not necessarily account for all of the potential benefits
associated with improving nutrition outcomes among Nigerian children. However, they
clearly demonstrate that the opportunity costs of not scaling up nutrition interventions are
substantial: we estimate that a five-year scale up plan that brings all ten interventions to full
national coverage could produce $2.6 billion in annual returns over the productive lives of the
children affected.
70. Although it was only possible to assess two scenarios (full coverage and Scenario
5a), our analysis finds that both yield positive net present values produce internal rates of
return greater than 18 percent (Table 18). An increase in the assumed discount rate reduces
the present value of future benefits, and therefore we perform a sensitivity analysis using 3
possible discount rates: 3, 5 and 7 percent. For the full national coverage the net present value
varies between US$103 billion (3 percent discount rate) to US$34 billion for the 7 percent
discount rate. For Scenario 5a it varies between US$40 and 12 billion.
71. All scenarios have the potential to increase economic productivity by increasing the
economic productivity of beneficiaries once they enter the labor force. Reaching full national
coverage for all 10 nutrition specific interventions could add as much as $2.6 billion annually.
Scenario 5a also has a high positive impact on economic productivity with an annual addition to
the Nigerian economy of $1.04 billion.

54
Table 18. Economic Benefits of Two Scenarios, 5 year scale up
Scenario Net Present Value by Discount Rate
(US$ billions)
Internal
Rate of
Return
(percent)
Annual
Increase in
Economic
Productivity16
(US$ billions)
3% 5% 7%
Full National
Coverage
$102.9 $57.6 $33.6 25.14% $2.6
Scenario 5a $40 $21.9 $12.4 18.54% $1.04
D. PROPOSED SCENARIOS
72. Based on their cost-effectiveness, economic contributions and resource
requirements, we propose consideration of Scenarios 4a, 4b, and 5a for implementation.
First, these three scenarios require relatively modest public investments when compared with the
requirements for reaching full national coverage. Second, each scenario is highly cost effective,
with scenarios 4a/4b/5a featuring estimated costs of $66/$72/$85 per DALY saved and
$3,229/$3,496/$3,849 per life saved. For Scenario 5a we were also able to calculate the cost per
case of childhood stunting averted which is US$259 as compared with US$292 for the full
coverage scenario. While Scenarios 4a and 4b are more cost-effective, Scenario 5a offers the
political advantage of distributing benefits more evenly among the states, while Scenarios 4a and
4b focuses solely on states with the highest burden of stunting.
E. FINANCING CURRENT COVERAGE
73. The costs discussed thus far relate to the scale up from current coverage and do not
take into account the financing necessary to maintain existing coverage levels, which we
estimate at approximately US$49 million annually (Table 19). In order to estimate the cost of
financing nutrition interventions at their current scale, this report uses a recent fiscal space
analysis for nutrition in Nigeria conducted by R4D (2014). This analysis attempts to identify
funding for nutrition by source, which we consider to be a proxy for the resources dedicated to
fund existing interventions. However, because this analysis accounts for total funding, it is not
possible to separate financing for program costs from overhead costs. Therefore, it is likely that
these financing numbers overestimate the “sustaining costs” required for baseline intervention
coverage.
74. The R4D analysis has also identified several sources of “planned” investments in
nutrition (Table 20) estimated at about $175 million over the next 4 years. This represents a
potential increase in funding of approximately $126 million between 2014 and 2017.
Considering our previous analysis, which demonstrated financing needs over five years of
between $769 million and $987 million for scaling up under the three proposed scenarios, the
estimated financing gap ranges between $543 and $861 million over this time period, even after
16
The annual increase in economic productivity is measured as the estimated annual addition to economic
productivity once all beneficiaries have reached productive age.
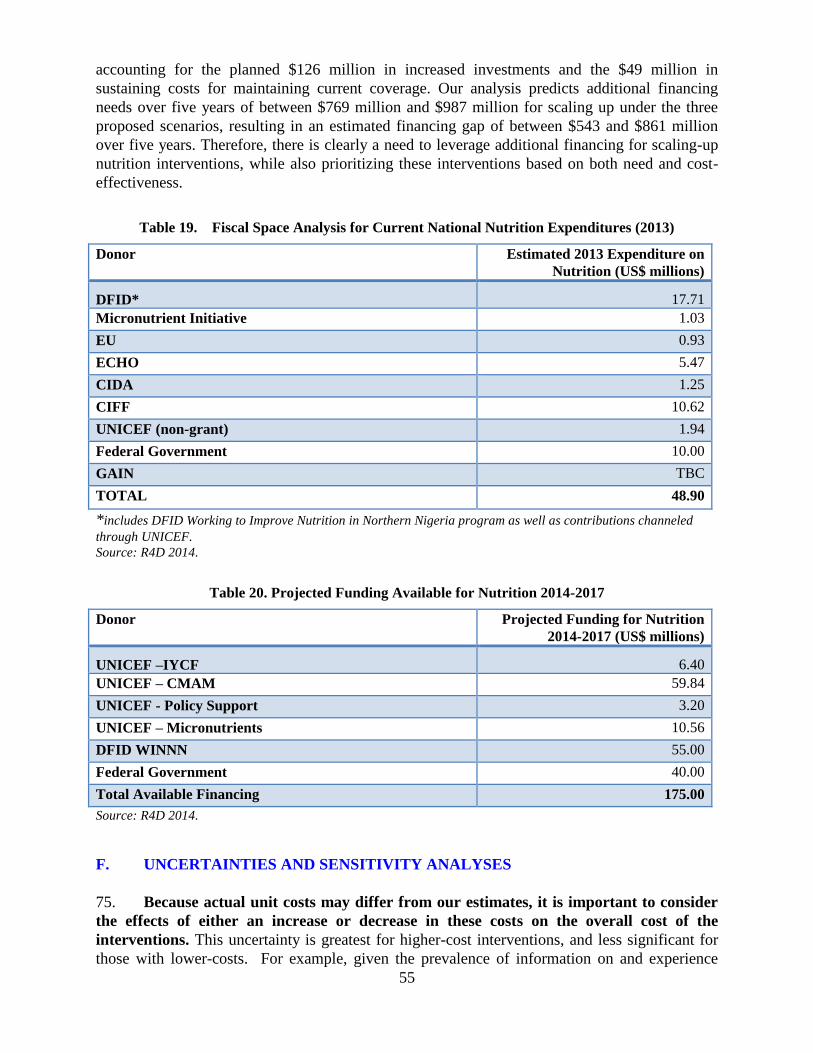
55
accounting for the planned $126 million in increased investments and the $49 million in
sustaining costs for maintaining current coverage. Our analysis predicts additional financing
needs over five years of between $769 million and $987 million for scaling up under the three
proposed scenarios, resulting in an estimated financing gap of between $543 and $861 million
over five years. Therefore, there is clearly a need to leverage additional financing for scaling-up
nutrition interventions, while also prioritizing these interventions based on both need and cost-
effectiveness.
Table 19. Fiscal Space Analysis for Current National Nutrition Expenditures (2013)
Donor Estimated 2013 Expenditure on
Nutrition (US$ millions)
DFID* 17.71
Micronutrient Initiative 1.03
EU 0.93
ECHO 5.47
CIDA 1.25
CIFF 10.62
UNICEF (non-grant) 1.94
Federal Government 10.00
GAIN TBC
TOTAL 48.90
*includes DFID Working to Improve Nutrition in Northern Nigeria program as well as contributions channeled
through UNICEF.
Source: R4D 2014.
Table 20. Projected Funding Available for Nutrition 2014-2017
Donor Projected Funding for Nutrition
2014-2017 (US$ millions)
UNICEF –IYCF 6.40
UNICEF – CMAM 59.84
UNICEF - Policy Support 3.20
UNICEF – Micronutrients 10.56
DFID WINNN 55.00
Federal Government 40.00
Total Available Financing 175.00
Source: R4D 2014.
F. UNCERTAINTIES AND SENSITIVITY ANALYSES
75. Because actual unit costs may differ from our estimates, it is important to consider
the effects of either an increase or decrease in these costs on the overall cost of the
interventions. This uncertainty is greatest for higher-cost interventions, and less significant for
those with lower-costs. For example, given the prevalence of information on and experience

56
with less expensive micronutrient and deworming interventions, there is a higher degree of
certainty around their estimated costs and financing needs. On the other hand, the costs of
community nutrition programs can vary greatly depending on their context, with the intensity of
behavior change campaign campaigns, the number of community health workers employed, and
the amount of incentives provided all affecting unit costs. Finally, there is very little information
concerning the costs associated with the public provision of complementary food. In Nigeria,
there is no delivery mechanism that can be used as a reference for these programs, while unit
costs are highly dependent on the choice of targeting method and other factors such as
widespread corruption and diversion of food supplies. In order to account for these uncertainties,
we perform a partial sensitivity analysis on both the Full National Coverage Scenario and
Scenario 5a (which also corresponds to the scale up used in in Nigeria’s National Strategic Plan
of Action for Nutrition). This sensitivity analysis considers the impact of variation in unit costs
while holding other variables constant. The results of the sensitivity analysis are presented in
Appendix 9.

57
PART V – NUTRITION-SENSITIVE INTERVENTIONS
76. We present cost-benefit estimates for four nutrition-sensitive interventions delivered
through the agriculture and education sectors: biofortification of cassava; aflatoxin
reduction through biocontrol interventions; school-based deworming; and school-based
promotion of good hygiene practices. Table 21 summarizes the cost of scaling up these
interventions and, when available, DALYs saved and cost per DALYs saved. Biofortification of
cassava, school-based deworming, and aflatoxin control through biocontrol are considered to be
cost-effective scenarios in Nigeria. Costs per DALYs saved are not available for school-based
promotion of good hygiene.
Table 21. Preliminary results for costing nutrition-sensitive interventions
Intervention Annual Cost
(US$ million)
DALYs Saved Cost/DALY Saved
Biofortification of cassava 25 800,000 $0.3-0.5
Aflatoxin control
(biocontrol) 65 1,537,790 $43.00
School-based deworming 8 n/a $4.55*
School-based promotion of
good hygiene 60 n/a n/a
*Estimate for Kenya as cost/DALYs saved not available for Nigeria.
A. BIOFORTIFICATION OF CASSAVA
77. The projected total cost of scaling up biofortification of yellow cassava is US$ 25
million. This cost includes only maintenance breeding and release and dissemination
components. The R&D and adaptive breeding phases are already completed, thus the costs of
these components are no longer relevant and have been excluded from the calculation. Given the
unavailability of current programmatic costing information, the total cost of scaling up is
obtained from the ex-ante assessment of biofortification in Nigeria (Fiedler 2010).
78. The cost per DALY saved for biofortification of cassava in Nigeria is estimated to be
between US$ 0.30 (optimistic) to US$0.50 (pessimistic), which is highly cost-effective (Birol
et al. 2014). The cost estimate of $25 million comes from Meenakshi et al. (2010). No
estimations are currently possible for lives saved through biofortification.
B. AFLATOXIN REDUCTION THROUGH BIOCONTROL
79. The total cost of scaling up aflatoxin reduction through biocontrol is estimated to be
US$65 million. The cost calculation uses the unit cost of Afla-safeTM biocontrol developed by
IITA and tested in Nigeria, with a cost per hectare of approximately US$15.6, including material
and distribution costs (Bandyopadhyay 2013). Crop area is based on FAO’s 2010 projections of

58
Nigerian maize planting area, which is estimated at 4.19 million hectares. For the purposes of
this exercise, it is assumed that AflaSafeTM will be applied to all maize fields.17
80. The cost per DALY saved for biocontrol in Nigeria is US$ 43, which is considered
highly-cost effective. An ex-ante assessment of several aflatoxin control measures in Nigeria
identified biocontrol as the most cost-effective for aflatoxin control compared to other
agricultural interventions. The estimated DALYs saved annually and the tentative numbers of
stunting cases prevented annually via biocontrol in Nigeria are 1,537,079 and 875,560,
respectively, albeit stunting estimates are based on tentative evidence. By comparison, the
postharvest intervention package will tentatively prevent 254,880 cases of stunting and save
439,329 DALYs (Khlangwiset 2011). No estimations are currently possible for lives saved
through aflatoxin control.
C. SCHOOL-BASED DEWORMING
81. The cost of scaling up school-based deworming is estimated to be US$8 million
annually. The unit cost (US$0.08) used in the calculation is obtained from regional estimates of
delivery cost in schools for Ghana (Guyatt et al. 2003), assuming twice a year treatment. These
estimates compare well with recent regional “bottom-up” cost analysis, based on NTD national
plans from 36 sub-Saharan Africa countries (Sedosh et al. 2013) which estimates the unit cost of
preventive chemotherapy (PCT) of five NTDs (lymphatic filariasis, onchocerciasis,
schistosomiasis, trachoma and soil-transmitted helminthiasis) in the Africa region at $0.26. The
major cost components for deworming are human resources, surveillance and mapping, non-
donated drugs, advocacy, infrastructure and logistics, and implementation and management. The
target population is school-age children (6-19 years-old) enrolled in primary and secondary
schools and the current coverage is assumed to be negligible.
D. SCHOOL-BASED PROMOTION OF GOOD HYGIENE
82. The cost of scaling up school-based promotion of hand-washing and good hygiene
behavior is estimated to be US$60 million. While promotion of WASH in schools normally
includes sustainable, safe water supply points, hand-washing stands and sanitation facilities; the
costing includes only the component for hygiene education. Due to unavailability of unit cost
estimate specifically for Nigeria, the unit cost is obtained from UNICEF report (2012) on WASH
in schools. The unit cost for hygiene education component is estimated to be US$2 per student
and includes the cost of capacity building, monitoring, advocacy, social mobilization. The target
population is school-age children and the current coverage is assumed to be negligible.
17
Most maize is for human consumption in Nigeria but some is also for other purposes. We were not able to
estimate how many hectares produce maize for human consumption versus other purposes.
59
PART VI – CONCLUSIONS AND POLICY IMPLICATIONS
83. Systematic costing of highly effective nutrition interventions is important for
priority-setting, resource mobilization and advocacy. Combining costing with estimates of
impact (in terms of DALYs and lives saved) and cost-effectiveness analysis will make the “case
for nutrition” stronger and will aid in priority setting by identifying the most cost-effective
packages of interventions in situations where financing is constrained. This will potentially be a
powerful evidence-based advocacy tool for policymakers when making budget allocations (i.e.
Ministry of Finance) as it provides useful evidence on what the government can “buy” (in terms
of DALYs and lives saved) given available resources, thereby maximizing allocative efficiencies.
84. Reaching full national coverage will be expensive and will require a significant
increase in the amount of public resources devoted to nutrition in Nigeria. As it is unlikely
that the government or its partners will find the $837 million necessary to reach full national
coverage, it is important to consider scenarios that make the most of the resources available.
Therefore, our findings and recommendations are based on cost-benefit analyses that can help
policy makers to prioritize the allocation of resources more effectively so as to maximize
allocative efficiencies and potential for impact. The scenarios (4a, 4b, 5a and 5b) proposed in this
report represent a compromise between the need to move to full coverage and the constraints
imposed by limited resources.
85. A high burden of malnutrition negatively impacts a nation’s human capital.
Therefore, an investment in improving nutrition outcomes among children is also an
investment in Nigeria’s economic future. All scenarios have the potential to increase the
economic productivity of beneficiaries once they enter the labor force. Reaching full national
coverage for all 10 nutrition-specific interventions could add as much as $2.6 billion annually to
the Nigerian economy, while the lower-cost scenario 5a would add US$1.04 billion annually.
Our analyses also find that all scenarios yield positive net present values, and most produce
internal rates of return greater than 18 percent. It should be noted that these estimates of
economic benefits are based on a highly conservative methodology that does not necessarily
account for all of the potential benefits associated with improving nutrition outcomes among
Nigerian children.
86. Although this report focuses extensively on nutrition specific interventions, the
causes of malnutrition are multisectoral and therefore any longer-term approach to
improving nutrition outcomes must include nutrition sensitive interventions. This analysis
takes an innovative approach to nutrition costing by not only estimating the costs and benefits of
nutrition-specific interventions, but also exploring costs for a selected number of nutrition-
sensitive interventions implemented outside of the health sector. We have identified four
candidate nutrition-sensitive interventions with high impact potential for Nigeria, including
biofortification of cassava, aflatoxin control, school-based deworming, and school-based
promotion of good hygiene. However, these interventions are just a starting point, and as the
Government begins to develop a multisectoral nutrition policy, it would be useful consult across
sectors and ministries in order to identify other possible nutrition sensitive interventions that are
cost-effective.
60
87. Overall, these findings point to a powerful set of nutrition-specific interventions and
a candidate list of nutrition-sensitive approaches that represent a highly cost-effective
approach to reducing the high levels of child malnutrition in Nigeria. Most of the
malnutrition that occurs in the first 1000 days of a child’s life is essentially irreversible.
Investing in early childhood nutrition interventions offers a window of opportunity to
permanently lock-in human capital, and to super-charge the potential demographic dividend in
Nigeria. This fits in to the President’s Transformational Agenda for Nigeria and the
government’s flagship Saving One Million Lives (SOML) initiative, which focus on six pillars,
one of which is nutrition. However, despite strong commitments to address malnutrition, the
government of Nigeria currently has no financial allocations for nutrition in FGoN’s 2014
budget.
88. Moving forward, these results will be useful to decision makers as they plan future
efforts to scale-up action against malnutrition in Nigeria and develop nutrition financing
plans that bring together the health, education and agriculture sectors. In the health sector,
plans for financing Universal Health Coverage (UHC) and SOML must include these costs under
the nutrition pillar of SOML. There also exist several opportunities to incorporate these highly
cost-effective interventions into the World Bank’s existing and pipeline investments in Health
(e.g. the State Health Project and planned support for SOML), agriculture (such as FADAMA III)
and education (e.g. the State Education Project and the Global Partnership on Education).

61
APPENDICES
Appendix 1: Partners Collaborating on Nutrition in Nigeria, 2014
Region and
State
Partners
Present Activities
NORTHWEST REGION
Jigawa Save the Children
ACF
MSF
UNICEF
WINN, EveryOne Advocacy
WINN, CMAM
CMAM
WINN; MNCHW; Zinc supp; IYCF
Kaduna None None
Kano UNICEF
World Bank
WHO
MCHPS
MNCHW, CMAM, IYCF, MNDC
RBM
MCHW, CMAM, IYCF, MNDC
MNCHW, CMAM, IYCF, MNDC
Katsina Save the Children CMAM (cash transfers), FSL project, EveryOne Advocacy
Kebbi UNICEF
Save the Children
ACF
WINN, CMAM, Zinc supp
WINN
WINN
Sokoto UNICEF
MSF Poland
CMAM and IYCF
CMAM and SAM treatment
Zamfara Save the Children
Save the Children
UK
UNICEF
ACF
WINN
CMAM and IYCF
WINN, CMAM; IYCF
WINN
NORTH-CENTRAL REGION
Benue SPRING
UNICEF and
HKI
IYCF
MNDC; IYCF; CMAM
FCT- Abuja SPRING IYCF
Kogi None None
Kwara None None
Niger UNICEF IYCF; MNDC; NISS
Nasarawa UNICEF
IHVN
MCHW; IYCF
RUTF Supply
Plateau None None
NORTHEAST REGION
Adamawa UNICEF CMAM; IYCF; MNDC
Bauchi None None
Borno UNICEF
HKI
Gombe ANJIHH
Save the Children
MNCHW
EveryOne Advocacy

62
UNICEF CMAM; IYCF
Taraba MITSOAH
UNICEF
MNCHW; SAM Treatment; IYCF; IDD Monitoring; Training
Yobe Save the Children
UNICEF
ACF
WINN Project
WINN Project
WINN Project
SOUTHEAST REGION
Abia UNICEF
BASICS II
IYCF; MNDC
IYCF; MNDC
Anambra None None
Ebonyi None None
Enugu UNICEF
WHO
GAIN
IYCF; MNDC; Treatment of SAM
MNDC
Imo None None
SOUTH-SOUTH REGION
SOUTHWEST REGION
Ekiti UNICEF MNCHW; MNDC
Lagos None None
Ogun UNICEF
FBFI
SAM Treatment; MNCHW; MNDC; Training
Support for IYCF
Ondo UNICEF MNCHW
Osun None None
Oyo UNICEF Vit A, Zinc, IFA Supp, Training, GMP equipment, IEC
materials, RUTF supplies, MNCHW
Source: Government documents and consultation with partners.

63
Appendix 2: Target Population Size
Region
Total
population and
population to
benefit from
iron
fortification of
staples
Children 0-23
months to
cover under
the community
nutrition
programs
Children 6-59
months not
covered by vitamin
A supplementation
Children 6-59
months to cover
under the
therapeutic zinc
supplementation
with oral
rehydration salts
Children 6-23
months not
covered by
multiple
micronutrient
powders
Children 12-
59 months
not covered
by
deworming
Pregnant women
not receiving iron
folic acid
supplementation
Population
not
consuming
iodized salt
Children 6-23
months to receive
complementary
feeding
Children 6-59
months not
treated for severe
acute malnutrition
(1) (2) (3) (4) (5) (6) (7) (8) (9) (10)
North-
Central 25,869,988 2,069,599 1,674,207 4,656,598 1,018,615 2,907,551 712,145 6,404,668 533,584 361,945
North-
Eastern 23,699,434 1,895,955 2,107,576 4,265,898 555,785 2,091,285 1,001,205 6,428,538 866,181 733,398
North-
Western 44,296,509 3,543,721 3,540,604 7,973,372 74,135 4,485,859 1,076,338 16,510,527 2,583,655 2,416,719
South-
Eastern 20,037,552 1,603,004 755,367 3,606,759 927,210 2,904,244 847,783 2,053,174 275,043 348,090
South-South 26,104,018 2,088,321 1,137,854 4,698,723 1,165,903 3,172,578 996,739 2,944,841 400,338 346,023
South-
Western 34,434,921 2,754,794 1,329,592 6,198,286 1,475,508 4,385,019 1,485,268 4,415,320 590,588 380,595
NATIONAL 174,442,422 13,955,394 10,545,198 31,399,636 5,217,156 19,946,536 6,119,478 38,757,068 5,249,389 4,586,771
Sources and notes (1) UNICEF 2013 projections based on the National Population Council (Total population)
(2) UNICEF 2013 projections based on the National Population Council (Children 0-23 months)
(3) UNICEF 2013 projections based on the National Population Council (Children 6-59 months) , State-level vitamin A coverage estimates from MICS 2011 report and September 2012
SMART survey results for 8 states (Borno, Jigawa, Kano, Katsina, Kebbi, Sokoto, Yobe, Zamfara)
(4) UNICEF 2013 projections based on the National Population Council (Children 6-59 months)
(5) UNICEF 2013 projections based on the National Population Council (Children 6-23 months)
(6) UNICEF 2013 projections based on the National Population Council (Children 12-59 months), State-level deworming coverage estimates from the FMOH 2012 programmatic data from the
first round of MNCH weeks in 2012 and September 2012 SMART survey results for 8 states (Borno, Jigawa, Kano, Katsina, Kebbi, Sokoto)
(7) UNICEF 2013 projections based on the National Population Council (Total population), State-level iron folic acid coverage estimates from the FMOH 2012 programmatic data from the first
round of MNCH weeks in 2012
(8) UNICEF 2013 projections based on the National Population Council (Total population), Percent of households consuming iodized salt from MICS 2011
(9) UNICEF 2013 projections based on the National Population Council (Children 6-23 months), State-specific data on underweight from MICS 2011
(10) UNICEF 2013 projections based on the National Population Council (Children 6-59 months), State-specific data on severe wasting from MICS 2011, UNICEF provided coverage data for
11 states (Adamawa, Bauchi, Borno, Gombe, Yobe, Jigawa, Kano, Katsina, Kebbi, Sokoto, Zamfara)
This represents the total population of children 6-59 months not treated for severe acute malnutrition although we expect to reach 80 percent of this population

64
Appendix 3: Data Sources and Relevant Assumptions
Intervention Costed delivery platform Cost estimate Source Assumptions
Behavior change interventions
Breastfeeding promotion Community nutrition
programs
Included in community
nutrition programs $ 5
per participant per year
UNICEF (2013) Behavior change campaign
interventions cost US$ 5 per child
under five years of age and we
assume there are two children under
five years of age per participating
mother. Focus is on exclusive breast
feeding, infant and young child
complementary food, hygiene
practices among others.
Education on appropriate
complementary feeding
practices (excluding
provision of food)
Community nutrition
programs
Included in community
nutrition programs
UNICEF (2013) Assume zero additional cost as it is
included in community nutrition
program
Hand washing Community nutrition
programs
Included in community
nutrition programs
UNICEF (2013) Assume zero additional cost as it is
included in community nutrition
program
Micronutrients and deworming interventions

65
Vitamin A
supplementation
Maternal, New Born and
Child Health Weeks
US$ 0.44 per child per
year. Freight and
handling costs added to
the unit capsule cost of
US$0.02
UNICEF (2013);
Federal Republic of
Nigeria (2011); Takang
et al (2012); Katsina
State Government
(2012); Anger (2012);
Federal Capital
Territory (2012);
Zoakah (2012);
Ososanya (2013)
Supplements are distributed through
biannual MNCH weeks, with
overhead costs (for planning;
advocacy; social mobilization;
health worker and volunteer
training; monitoring; supervision;
and logistics support to fixed
facilities and outreach stations)
shared with other interventions
(therapeutic zinc supplementation
with ORS, deworming and iron
folic acid supplementation).
Therapeutic zinc
supplementation with
ORS
Maternal, New Born and
Child Health Weeks
US$0.86 per child per
year.
UNICEF (2013);
Takang et al (2012)
Each child is assumed to have 2-3
episodes of diarrhea per year with
average of 12 tablets needed to treat
one episode. MNCHW
implementation overhead costs are
shared with other interventions
Micronutrient powders Community nutrition
programs
US$1.80 per child 6-11
months of age per year
and US$3.60 per year
per child 12-23 months
of age.
Horton et al (2010) Global estimates are used. There is
insufficient information on in-
country implementation of this
intervention that is just
commencing in 2 of 36+1 states.

66
Deworming Maternal, New Born and
Child Health Weeks
US$0.44 per child 12-59
months of age per year
UNICEF (2013);
Federal Republic of
Nigeria (2011); Takang
et al (2012); Katsina
State Government
(2012); Anger (2012);
Federal Capital
Territory (2012);
Zoakah (2012);
Ososanya (2013)
Assume ½ tablet of Albendazole
per child 12 – 23 months of age and
one tablet per child 24 – 59 months
of age is given in each round of the
biannual MNCHW. Overhead costs
are shared with other interventions
Iron-folic acid
supplementation for
pregnant women
Maternal, New Born and
Child Health
Weeks/Community
nutrition programs
US$ 1.79 per pregnancy
through MNCHW;
US$2.00 per pregnancy
through community
nutrition programs
UNICEF (2013);
Federal Republic of
Nigeria (2011); Takang
et al (2012); Katsina
State Government
(2012); Anger (2012);
Federal Capital
Territory (2012);
Zoakah (2012);
Ososanya (2013);
Horton et al (2010)
Assume daily IFA supplementation
for last two trimesters of pregnancy
(about 180 tablets) delivered
through MNCHWs to 40% of target
population and remaining reached
through community nutrition
programs and ANTE-NATAL
CARE services. MNCHW overhead
costs shared with other
interventions. Provision made for
weekly SMS reminders
Iron fortification of staple
foods
Market-based delivery
systems
US$0.20 per person per
year (flour fortification)
Horton et al (2010);
Aminu (2013);
UNICEF (2013)
Global estimate is used. No specific
information on Nigeria available.
Salt iodization Market-based delivery
systems
US$0.05 per person per
year
Horton et al (2010);
Aminu (2013)
Global estimate is used. No specific
information on Nigeria available.
Complementary and
therapeutic food
interventions

67
Treatment of severe acute
malnutrition
Primary Health Care and
Community Nutrition
Programs
US$80.00 per child per
episode
UNICEF (2013) Food cost about US$50. Additional
costs are for freight and handling;
training, monitoring and
supervision of health workers; and
provision of equipment. Cases are
managed in PHC facilities.
Screening carried out at community
and facility levels.
Prevention/treatment of
moderate malnutrition
Community Nutrition
Programs or Primary health
care system
US$51.10 per child per
year
Horton et al (2010);
UNICEF (2013)
Global estimate is used. There is no
programmatic delivery mechanism
as yet in Nigeria.

68
Appendix 4: Methodology for Estimating Costs for Nigeria
The following steps lay out the methodology used to estimate costs for each intervention:
1. Description of each intervention;
2. Definition of target populations for each intervention;
3. Estimation of the size of the target populations for each intervention in each state/region
using the most current demographic data;
4. Specification of the delivery platform or channel(s) for each intervention, based on the
country context and the accepted delivery modes;
5. Data on the current coverage levels for each intervention in each state/region;
6. Estimation of unit cost per beneficiary for each intervention from program experience in
Nigeria, whenever possible, and/or Africa region;
7. Calculation of additional costs of scaling up to full coverage by multiplying the unit cost for
each intervention with the size of the “uncovered” target population for each intervention by
state/region. The formula for calculation is:
where:
= additional costs of scaling up to full coverage
= unit cost per beneficiary
= current coverage level (percentage)
8. Estimation of additional resources for: (i) capacity development for program delivery and (ii)
M&E and technical support, estimated at 9% and 2% of total cost of interventions,
respectively;
9. Estimation of a portion of the total cost that can be covered by private household resources. It
is assumed that households above poverty line could cover the cost of iron fortification,
multiple micronutrient powders, salt iodization and complementary food from private
resources;
10. Calculating the annual public investment required to scale up these interventions to full
coverage using the following formula:
where:
Y = annual public investment required to scale up to full coverage
= additional total cost to scale up to full coverage
= additional cost for capacity development, M&E, and technical assistance
= cost covered by households living above poverty line for selected interventions
Full coverage is defined as 100% of the target population for all interventions except the
treatment of severe acute malnutrition, which is set to 80%. This is consistent with World Bank
(2010a) methods and is based on the reality that few community-based treatment programs have
successfully achieved more than 80% coverage at scale.

69
Appendix 5: Methodology for Estimating DALYs for Nigeria
The following steps were undertaken to estimate the impact in DALYs averted of implementing
the various nutrition interventions:
1. Estimate the effectiveness of each intervention on mortality and morbidity for each
targeted cause
2. Calculate the rate of YLL and YLD due to each cause-risk factor combination for the
target population
3. Calculate the DALYs averted under current or counterfactual coverage scenario
4. Calculate the DALYs averted under the proposed intervention coverage scenario
5. Calculate the net DALYs averted by the proposed intervention
1. Estimate the effectiveness of each intervention on mortality and morbidity for each
targeted cause
To estimate the effectiveness of the interventions, key articles by Black et al and Bhutta et al in
the Lancet series on maternal and child undernutrition were first consulted. Additional literature
searches for the latest evidence were conducted in the Pubmed online database and the Cochrane
Library of systematic reviews and meta-analyses. Effectiveness figures that were reported as
statistically significant were extracted and used for the calculations.
2. Calculate the rate of YLL and YLD
The WHO’s 2012 Global Health Estimates (GHE 2012) data tables provide country-specific
YLL and YLD rates for each cause of death or disease. GHE 2012 morbidity and mortality
estimates were used in combination with country-specific population attributable fractions (PAF)
from the 2010 GBD. This assumes that the risk factor impacts on morbidity and mortality did
not differ significantly between the two estimates.
To calculate the rate of morbidity and mortality from a cause due to a specific risk factor, the first
step is to calculate the PAF for the cause-risk factor combination. The PAF was extracted from
the country-specific risk factor attribution table from the 2010 GBD data. This was done
separately for YLL and YLD. In the second step, the country-specific YLLs and YLDs for the
target population, in most cases under-fives, were extracted from the GHE 2012 estimates. To
calculate the YLL rate, the country-specific YLL is multiplied by the YLL PAF and then by
100,000. The final figure is divided by country-specific population of interest (usually under-
fives) to get the rate. The same final steps are followed to calculate the YLD, although instead
multiplying country-specific YLDs by the YLD PAF. The population estimate for the rate
calculation was extracted from GHE 2012.
YLL per 100,000 = (U-5_cause_total_YLL * YLL_PAF * 100,000)/U-5_ population
YLD per 100,000 = (U-5_cause_total_YLD * YLD_PAF * 100,000)/U-5_population

70
3. Calculate counterfactual DALYs averted
To calculate the DALYs averted if current intervention coverage were maintained, the following
formula was used: YLL = U-5_population_intervention_year * current_coverage * intervention_mortality_reduction * YLL_rate
YLD = U-5_population_intervention_year * current_coverage * intervention_morbidity_reduction * YLL_rate
DALY_current = YLL+YLD
4. Calculate total DALYs averted under intervention coverage
To calculate the potential DALYs averted under the intervention coverage, a similar formula as
above was used:
YLL = U-5_population_intervention_year * intervention_coverage * intervention_mortality_reduction * YLL_rate
YLD = U-5_population_intervention_year * intervention_coverage * intervention_morbidity_reduction * YLL_rate
DALY_intervention = YLL+YLD
5. Calculate net DALYs averted
The potential net DALYs averted by the intervention is:
DALYs averted = DALY_intervention - DALY_current

71
Appendix 6: Methodology for Nigeria LiST estimates
The Lives Saved Tool (LiST) is a part of an integrated set of tools that comprise the Spectrum
policy modeling system. These tools include DemProj for creating demographic projections;
AIM to model and incorporate the impact of HIV/AIDS on demographic projections and child
survival interventions; and FamPlan for incorporating changing fertility into the demographic
projection. LiST is used to project how increasing intervention coverage would impact child and
maternal survival. The table below summarizes data sources used for the Nigeria LiST estimates.
Nigeria LiST estimates - Data Sources
Demographic data Source
First year population 2011 MICS and provided Cost table
Sex ratio at birth 2011 MICS
Life expectancy 2008 NDHS
Family Planning
Unmet need 2011 MICS
Total fertility rate 2011 MICS
Age-specific fertility rate Used sub-Saharan Africa model
Health, mortality, economic status
Vitamin A deficiency 2011 MICS
Zinc deficiency
Estimating the global prevalence of zinc
deficiency: results based on zinc availability in
national food supplies and the prevalence of
stunting. PLoS One. 2012;7(11):e50568. doi:
10.1371/journal.pone.0050568. Epub 2012 Nov
29.
Diarrhea incidence
Diarrhea incidence in low- and middle-income
countries in 1990 and 2010: a systematic review.
Fisher Walker CL. BMC Public Health 2012, 12:220
Severe pneumonia incidence
Global burden of childhood pneumonia and diarrhoea.
Fischer Walker C, Rudan I, Liu L, Nair H,
Theodoratou W, Bhutta ZA, O’Brien KL, Campbell H,
Black RE. Lancet 2013; 381: 14
Malaria exposure (women)
The Limits and Intensity of Plasmodium
falciparum Transmission: Implications for Malaria
Control and Elimination Worldwide. Guerra CA,
Gikandi PW, Tatem AJ, Noor AM, Smith DL, et
al. PLoS Medicine Vol. 5, No. 2, e38
Stunting distribution
LiST default; data has been calculated using DHS
and MICS datasets.
Wasting distribution
LiST default; data has been calculated using DHS
and MICS datasets.
Neonatal mortality 2008 DHS
Infant mortality 2011 MICS

72
Child mortality 2011 MICS
Distribution of causes of death
Liu L, Johnson HL, Cousens S, Perin J, Scott S,
Lawn JE, Rudan I, Campbell H, Cibulskis R, Li
M, Mathers C, Black RE. Global, regional, and
national causes of child mortality: an updated
systematic analysis for 2010 with time trends since
2000. Lancet, 379(9832):2151 - 2161
Maternal mortality ratio 2008 DHS
Household poverty status 2008 DHS
Household size 2008 DHS
Once the demographic and health data have been updated, the coverage and scale-up plan for
each intervention is introduced into LiST. LiST can use either a sequential method to calculate
the impact of individual interventions or LiST can calculate the simultaneous impact of a set of
interventions implemented at the same time. The second, simultaneous method is like to yield
slightly lower estimates because interventions may have overlapping benefits. In this analysis we
present the both the individual/sequential results of the individual interventions in the “full
coverage” scenario (with totals calculated using the simultaneous method) and the simultaneous
impact in the various scale-up scenarios.
Note on Estimates of Cases of Stunting Averted:
In order to estimate the number of cases of under-five stunting averted attributable to the annual
investment in scaling up of nutrition interventions, we use LiST to model changes in the
prevalence of stunting over 5 years during which the interventions have reached 100 percent
scale. Next, we model changes in the prevalence of stunting over 5 years with no scale-up of the
interventions. We then take the difference between the estimated stunting prevalence in year 5
with the scale up and the prevalence in year 5 absent a scale-up, and multiply this percentage
point difference by the total population of children under five.
Our reason for using stunting prevalence in year 5 relates to the assumptions built into the LiST
model, which assumes that stunting is itself a risk factor for becoming stunting in the next time
period. As a result, stunting prevalence remains flat during the first two years of the scale-up,
before dropping precipitously until year 5, after which the prevalence begins to level out. We
assume that continuing investments in maintaining scale after year 5 will serve to maintain the
gains in stunting prevalence reduction, and therefore we present this reduction as the benefits
attributable to a one-year investment in scaling up nutrition.
On the other hand, when estimating stunting reduction (and lives saved) attributable to a five year
scale up plan, we model this scale up directly in LiST and use the annual results over 5 years in
our cost-benefit analysis. This provides a more accurate portrayal of the direct benefits
attributable to a five year scale up plan, and does not assume that the scale will necessarily be
maintained following the end of the period covered in the plan.
73
Appendix 7: Methodology for Estimating Economic Benefits
There is considerable debate in the literature regarding the methodology for monetizing the value
of a life saved. In this analysis, we chose to focus solely on the economic value of a life year,
which we measure as equal to GNI per capita. Other studies also attempt to estimate the social
value of a life year, and therefore we acknowledge that our results may underestimate the true
value of a life year saved.
Still, valuing years of life saved alone does not account for the economic benefits of reduced
morbidity, which includes the long-term, non-lethal impacts of malnutrition on individuals.
While there are a number of long-term impacts of nutritional deficiencies, we choose to focus on
stunting given the availability of country-specific impact estimates produced by the LiST tool.18
In order to estimate the value of a case of childhood stunting averted, we follow the methodology
used in Hoddinott et al. (2013), the authors begin by assuming that stunted individuals lose an
average of 66% of lifetime earnings, based on direct estimates of the impact of stunting in early
life on later life outcomes found in Hoddinott et al. (2011).19 This point estimate for the effects of
stunting on future consumption is used as a proxy for the effect of stunting on lifetime earnings.
Additionally, Hoddinott et al. (2013) account for uncertainty by assuming that only 90% of the
total gains will be realized, which we also include in our calculations. However, unlike the
authors, we also adjust our calculations to reflect the country’s labor force participation rate.
For both lives saved and cases of stunting averted, the benefits of a five year scale up plan are
attributed to a group of children that is assumed to enter the labor force at age 15 and exit the
labor force at age 52, which is equivalent to Nigeria’s life expectancy at birth. Benefits from both
stunting and lives saved are then multiplied by a lifetime discount factor (LDF) derived from
three potential discount rates (3% 5% and 7%), an adjustment for age at the time of investment
(for simplicity we assume an average age of two years for all children), as well as the years of
lifetime productivity expected. The LDF represents the years of productivity that are “counted” in
the calculation, discounted back to their present value in the year in which the investment in
nutrition is made. As we assume an average age of two years for all beneficiaries, we use an LDF
that assumes that these children will enter the labor force in 13 years from the time of
investment. Importantly, given the time frame considered under this analysis (50 years), we do
not attempt to account for projected growth in the country’s GDP and per capita incomes. This
downward bias contributes to the conservative nature of our estimates.
The following equations are used to estimate 1) the economic value of lives saved (reduced
mortality); and 2) increased future productivity (reduced morbidity):
18
It should be noted that because stunting is just one of many long-term consequences of poor nutrition, actual
economic benefits may be much higher than estimated here.
19 Hoddinott et al. (2011) provided direct estimates of the impact of stunting in early life on later life outcomes,
which found that an individual stunted at age 36 months had, on average, 66% lower per capita consumption over his or her productive life.

74
1)
2)
Where:
Lives saved attributable to the intervention scale up are estimated using the LiST tool.
Cases of child stunting averted are calculated by subtracting the under five stunting
prevalence (%) after the intervention calculated by LiST from the stunting prevalence in
year 0 and multiplying it by the total under five population.
The coefficient of deficit is equal to the reduction in lifetime earnings attributable to
stunting.
The lifetime discount factor (LDF) is used to discount future benefits to their value at the
time of investment. It is derived from a discount rate, age at the time of investment and
the estimated age of entry and exit into the workforce. The equation used to calculate the
LDF is:
Where:
o LDF is the lifetime discount factor
o r is the discount rate
o t is the number of years since the initial investment in scaling up the interventions
(we assume that children enter the labor force at 15 years old, which is reflected in
the starting value for t)
o n is the life expectancy at birth

75
The following values and sources are used in our calculations:
Indicator Value Source
GNI per capita $2,710 World Bank 2013
Life expectancy at birth 52 years World Bank 2011
Labor force participation rate 56% World Bank 2012
Coefficient of deficit (stunting) 0.66 Hoddinott 2011
Actual gains realized 90% Hoddinott 2013
To arrive at a Net Present Value (NPV), we use the following equation:
Finally, the annual addition to economic productivity is measured by taking the total economic
benefits for a year in which all beneficiaries of the initial one-year investment have reached
productive age (i.e. in year 13). These benefits are not discounted back to their present value, as
they are considered the annual opportunity cost of not investing in scaling up nutrition
interventions. It should be noted that these benefits are derived from a progressive, 5-year scale
up plan, and therefore subsequent investments that maintain the target scale will increase the
total annual benefits as new beneficiaries are reached.

76
Appendix 8: Scenario 5a Costs and Benefits by Intervention and by State
Interventions Annual Public
Investment (US$
million)
Annual Benefits
DALYs
Saved
Lives
Saved
Cases of Stunting
Averted
Community programs for growth promotion $34.9 2,897,931 8,974 1,859,167
Vitamin A supplementation $3.3 112,190 1,485 303,844
Therapeutic zinc Supplementation with ORS $21.6 100,216 4,278 n/a
Micronutrient powders $17.5 383,927 n/a n/a
Deworming $15.1 57,125 n/a n/a
Iron-folic acid supplementation $10.2 232,146 321 12,033
Iron fortification of staple foods $34.9 n/a n/a n/a
Salt Iodization $1.9 n/a n/a n/a
Comp. Food for Prevention of MAM $119.4 44,337 998 2,006,577
CMAM for Severe Malnutrition $112.7 560,544 5,859 n/a
TOTAL (WHEN IMPLEMENTED
SIMULTANEOUSLY) $371.3 4,388,415 96,463 1,434,988
Capacity development for program delivery $33.5
M&E, operations research $7.5
Household contributions ($59.3)

77

78
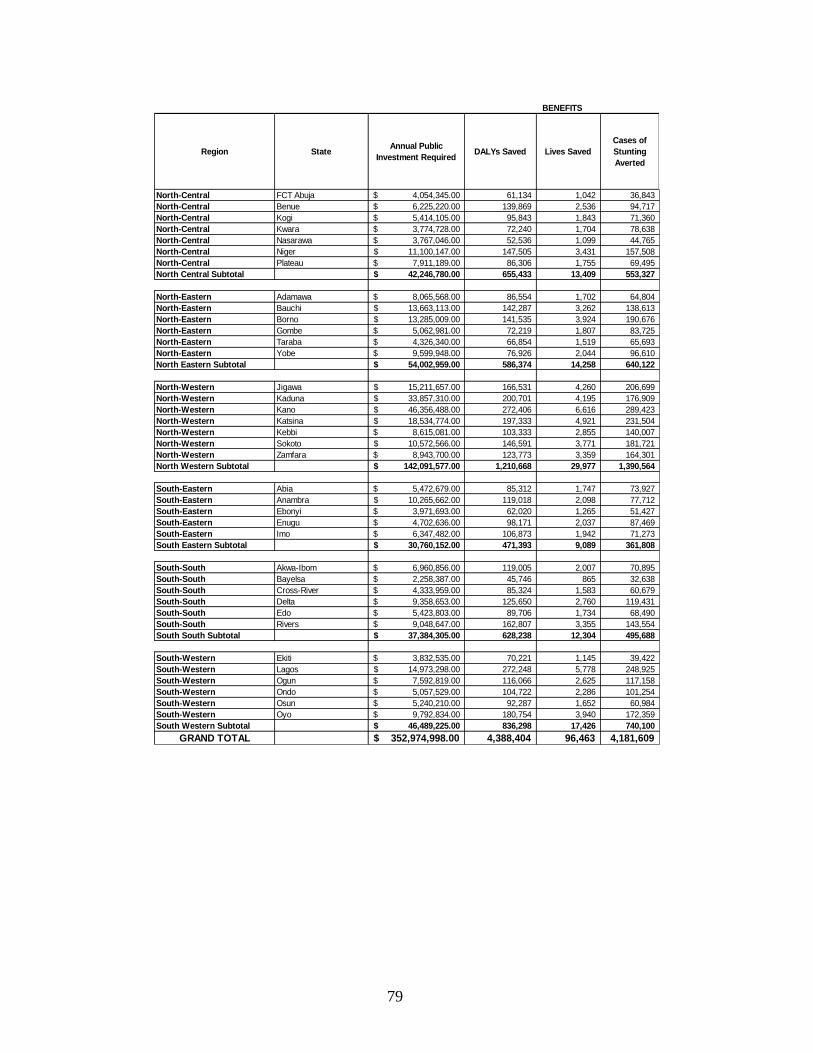
79
Region StateAnnual Public
Investment RequiredDALYs Saved Lives Saved
Cases of
Stunting
Averted
North-Central FCT Abuja 4,054,345.00$ 61,134 1,042 36,843
North-Central Benue 6,225,220.00$ 139,869 2,536 94,717
North-Central Kogi 5,414,105.00$ 95,843 1,843 71,360
North-Central Kwara 3,774,728.00$ 72,240 1,704 78,638
North-Central Nasarawa 3,767,046.00$ 52,536 1,099 44,765
North-Central Niger 11,100,147.00$ 147,505 3,431 157,508
North-Central Plateau 7,911,189.00$ 86,306 1,755 69,495
North Central Subtotal 42,246,780.00$ 655,433 13,409 553,327
North-Eastern Adamawa 8,065,568.00$ 86,554 1,702 64,804
North-Eastern Bauchi 13,663,113.00$ 142,287 3,262 138,613
North-Eastern Borno 13,285,009.00$ 141,535 3,924 190,676
North-Eastern Gombe 5,062,981.00$ 72,219 1,807 83,725
North-Eastern Taraba 4,326,340.00$ 66,854 1,519 65,693
North-Eastern Yobe 9,599,948.00$ 76,926 2,044 96,610
North Eastern Subtotal 54,002,959.00$ 586,374 14,258 640,122
North-Western Jigawa 15,211,657.00$ 166,531 4,260 206,699
North-Western Kaduna 33,857,310.00$ 200,701 4,195 176,909
North-Western Kano 46,356,488.00$ 272,406 6,616 289,423
North-Western Katsina 18,534,774.00$ 197,333 4,921 231,504
North-Western Kebbi 8,615,081.00$ 103,333 2,855 140,007
North-Western Sokoto 10,572,566.00$ 146,591 3,771 181,721
North-Western Zamfara 8,943,700.00$ 123,773 3,359 164,301
North Western Subtotal 142,091,577.00$ 1,210,668 29,977 1,390,564
South-Eastern Abia 5,472,679.00$ 85,312 1,747 73,927
South-Eastern Anambra 10,265,662.00$ 119,018 2,098 77,712
South-Eastern Ebonyi 3,971,693.00$ 62,020 1,265 51,427
South-Eastern Enugu 4,702,636.00$ 98,171 2,037 87,469
South-Eastern Imo 6,347,482.00$ 106,873 1,942 71,273
South Eastern Subtotal 30,760,152.00$ 471,393 9,089 361,808
South-South Akwa-Ibom 6,960,856.00$ 119,005 2,007 70,895
South-South Bayelsa 2,258,387.00$ 45,746 865 32,638
South-South Cross-River 4,333,959.00$ 85,324 1,583 60,679
South-South Delta 9,358,653.00$ 125,650 2,760 119,431
South-South Edo 5,423,803.00$ 89,706 1,734 68,490
South-South Rivers 9,048,647.00$ 162,807 3,355 143,554
South South Subtotal 37,384,305.00$ 628,238 12,304 495,688
South-Western Ekiti 3,832,535.00$ 70,221 1,145 39,422
South-Western Lagos 14,973,298.00$ 272,248 5,778 248,925
South-Western Ogun 7,592,819.00$ 116,066 2,625 117,158
South-Western Ondo 5,057,529.00$ 104,722 2,286 101,254
South-Western Osun 5,240,210.00$ 92,287 1,652 60,984
South-Western Oyo 9,792,834.00$ 180,754 3,940 172,359
South Western Subtotal 46,489,225.00$ 836,298 17,426 740,100
GRAND TOTAL 352,974,998.00$ 4,388,404 96,463 4,181,609
BENEFITS

80
Appendix 9: Sensitivity Analysis
Full National coverage
Assumption Changed Effect on Total Cost
Iron fortification of staple foods costs double Increase from $837.2 million to
$862.9 million
All micronutrient and deworming unit cost doubles Increase from $837.2 million to
$944.9 million
Community nutrition program unit cost doubles Increase from $837.2 million to
$914.7 million
Complementary food unit cost doubles Increase from $837.2 million to
$1,163.5 million
CMAM for SAM unit cost doubles Increase from $837.2 million to
$1,163.1 million
Iron fortification of staple foods costs reduced by
50%
Decrease from $837.2 million
to $824.4 million
All micronutrient and deworming unit cost
reduced by 50%
Decrease from $837.2 million
to $783.4 million
Community nutrition program unit cost reduced
by 50%
Decrease from $837.2 million
to $798.5 million
Complementary food unit cost reduced by 50% Decrease from $837.2 million
to $674.1 million
CMAM for SAM unit cost reduced by 50% Decrease from $837.2 million
to $674.3 million
Scenario 5a
Assumption Changed Effect on Total Cost
Iron fortification of staple foods costs double Increase from $352.98 million
to $391.7 million
All micronutrient and deworming unit cost doubles Increase from $352.98 million
to $447.8 million
Community nutrition program unit cost doubles Increase from $352.98 million
to $378.6 million
Complementary food unit cost doubles Increase from $352.98 million
to $447.4 million
CMAM for SAM unit cost doubles Increase from $352.98 million
to $478.1 million
Iron fortification of staple foods costs reduced by
50%
Decrease from $352.98 million
to $340.1 million
All micronutrient and deworming unit cost
reduced by 50%
Decrease from $352.98 million
to $305.6 million
Community nutrition program unit cost reduced
by 50%
Decrease from $352.98 million
to $333.6 million

81
Complementary food unit cost reduced by 50% Decrease from $352.98 million
to $305.8 million
CMAM for SAM unit cost reduced by 50% Decrease from $352.98 million
to $290.4 million

82
REFERENCES
Abt Associates. 2014. Country Assessment for Aflatoxin Contamination and Control in
Nigeria. January 8. Bethesda, MD: Abt Associates.
Arimond M, C. Hawkes, M.T. Ruel et al. 2011. “Agricultural interventions and nutrition:
Lessons from the past and new evidence”. In Combating Micronutrient Deficiencies: Food-
based Approaches. Rome: FAO.
Asare-Marfo, D,, E. Birol, C. Gonzalez, M. Moursi, S. Perez, J. Schwarz and M. Zeller.
2013. “Prioritizing Countries for Biofortification Interventions Using Country-Level Data.”
HarvestPlus Working Paper No. 11(October 2013). Washington, DC: HarvestPlus.
Awasthi, S. et al. 2013. “Population deworming every 6 months with albendazole in 1
million pre-school children in north India: DEVTA, a cluster-randomized trial.” Lancet.
381(9876):1478-86.
Baird, S., J.H. Hicks, M. Kremer and E. Miguel. 2011. Worms at work: long run impacts of
child health gains. Working paper. Harvard University
Bandyopadhyay, R. (IITA plant pathologist). 2013. Personal communication (Nigeria).
Bandyopadhyay, R. and J. Cotty. 2013. “Biological Controls for Aflatoxin Reduction.” in
Unnevehr, L. and D. Grace, eds. “Aflatoxins: Finding Solutions for Improved Food Safety.”
2020 Focus Brief #20 (16). Washington, DC: International Food Policy Research Institute.
Behrman, J.R., M.C. Calderon, S.H. Preston, J. Hoddinott, R. Martorell and A.D. Stein.
2009. “Nutritional supplementation in girls influences the growth of their children:
Prospective study in Guatemala.” American Journal of Clinical Nutrition 90(1):1372-9.
Bhutta, Z., T. Ahmed, R. Black, S. Cousens, K. Dewey, E. Giugliani, B. Haider, B.
Kirkwood, S. Morris, H. Sachdev and M. Shekar. 2008. “What works? Interventions for
maternal and child undernutrition and survival.” The Lancet 371:417‐440.
Bhutta Z.A., et al., for the Maternal and Child Undernutrition Study Group. 2013. “Evidence-
based interventions for improvement of maternal and child nutrition: what can be done and at
what cost?” Lancet; Maternal and Child Nutrition series.
Birol et al. 2014. Cost-effectiveness of biofortification revisited. Washington, DC:
HarvestPlus, Preliminary results as cited in HarvestPlus Biofortification Progress Brief #25.
Washington, DC:HarvestPlus.
http://www.harvestplus.org/sites/default/files/Biofortification_Progress_Briefs_August2014_
WEB_0.pdf

83
Black R.E., et al., for the Maternal and Child Undernutrition Study Group. 2008. “Maternal
and child undernutrition: global and regional exposures and health consequences.” Lancet;
371: 243-60
Black R.E., et al., for the Maternal and Child Under nutrition Study Group. 2013. “Maternal
and child undernutrition and overweight in low-income and middle-income countries.”
Lancet; Maternal and Child Nutrition series.
Bleakley, H. 2007. “Disease and Development: Evidence from Hookworm Eradication in the
American South.” Quarterly Journal of Economics 122(1):73-117
Bloom D., J. Finlay, S. Humair et al. 2010. “Prospects for economic growth in Nigeria: A
demographic perspective.” Paper presented at the IUSSP Seminar on Demographics and
Macroeconomic Performance held at Novotel, Gare de Lyon, Paris, France 4-5 June 2010.
Bolt, E. and S. Cairncross. 2004. “Sustainability of Hygiene Behaviour and the Effectiveness
of Change Interventions: Lessons learned on research methodologies and research
implementation from a multi-country research study.” IRC International Water and Sanitation
Centre, Delft, the Netherlands.
Caulfield, L.E., M. de Onis, M. Blossner, and R.E. Black. 2004. “Undernutrition as an
underlying cause of child deaths associated with diarrhea, pneumonia, malaria, and measles.”
American Journal of Clinical Nutrition. 80(1): 193-198.
DCP2 (Disease Control Priorities Project). 2008. Deworming Children Brings Huge Health
and Development Gains in Low-Income Countries. Seattle, WA: University of Washington.
Ejemot, R, et al. 2008. “Hand-washing for Preventing Diarrhoea,” Cochrane Database of
Systematic Reviews. Issue 1.
Ezzati M, A.D. Lopez, A. Rogers, S. Vander Hoorn and C.J. Murray. 2002. “Selected major risk factors and global and regional burden of disease.” Lancet; 360: 1347-60
Ezzati M., A.D. Lopez, A. Rogers and C.J. Murray. 2004. “Comparative quantification of health risks: The global and regional burden of disease attributable to selected major risk factors.” Geneva: World Health Organization.
Fiedler, J. 2010. The Cost of Micronutrient Interventions. Washington DC: HarvestPlus.
Global Burden of Disease Study. 2010. Institute for Health Metrics and Evaluation
http://www.healthmetricsandevaluation.org/gbd
Goodman C., P. Coleman and A. Mills. 2000. Economic analysis of malaria control in Sub-
Saharan Africa. Geneva: Global Forum for Health Research.

84
Government of Nigeria. 2013. National Strategic Plan of Action for Nutrition (2014-2018).
Abuja, Nigeria.
Guyatt, H.L. 2003 “The Cost of delivering and sustaining a control programme for
schistosomiasis and soil-transmitted helmithiasis.” Acta Tropica 86:267-74.
Heckman, J. J. and D. Masterov. 2004. “The productivity argument for investing in young
children.” Technical Report Working Paper No. 5, Committee on Economic Development.
Hoddinott J., J. Maluccio, J. Behrman, R. Martorell, P. Melgar, and A.R. Quisumbing.
2011. The consequences of early childhood growth failure over the life course. Discussion
Paper 1073, Washington, DC: International Food Policy Research Institute.
Hoddinott, J. M. Rosegrant, M. Torero. 2012. “Investments to reduce hunger and
undernutrition.” Challenge Paper prepared for the 2012 Copenhagen Consensus.
Hoddinott, J., H. Alderman, J.R. Behrman, L Haddad and S. Horton. 2013. “The economic
rationale for investing in stunting reduction.” Maternal and Child Nutrition 9(Suppl. 2):69-
82.
Horton S. 1999. “Opportunities for Investment in nutrition in low-income Asia.’ Asia
Development Review, 17:246-73.
Horton S. and J. Ross. 2003. “The economics of iron deficiency.” Food Policy. 28(1)51-75.
Horton S. and R. Steckel. 2013. “Global economic losses attributable to malnutrition 1900–
2000 and projections to 2050.” In The Economics of Human Challenges, ed B. Lomborg
Cambridge, U.K.: Cambridge University Press.
Hotez, P. P.J. Brindley, J.M. Bethony et al. 2008. “Helminth infections: the great neglected
tropical disease.” The Journal of Clinical Investigation 118 (4): 1312
Hotz C, Loechl C, De Brauw A, et al. 2012a. « A large scale intervention to introduce orange
sweet potato in Mozambique increases vitamin A intakes among child and women.” British
Journal of Nutrition. 108: 163-76.
Hotz C, Loechl C, Lubowa A, et al. 2012b. « Introduction of B carotene-rich orange sweet
potato in rural Uganda resulted in creased vitamin A intakes among children and women and
improved vitamin A status among children.” Journal of Nutrition. 142: 1871-80
J-PAL (Abdul Latif Jameel Poverty Action Lab). 2012. Deworming: A Best Buy For
Development. J-PAL Policy Bulletin. March, 2012. Boston, MA: Massachusetts Institute of
Technology.

85
Khlangwiset, P. 2011. “Reducing the Risks of Aflatoxin Through Public Health
Interventions.” Doctoral dissertation. University of Pittsburg.
Khlangwiset, P and Wu F. 2011. “Cost and efficacy of public health interventions to reduce
aflatoxin-induced human diseases.” Food Addit Contam Part A Chem Anal Control Expo
Risk Assess. July; 27 (7): 998-1014
Kuniholm, M. H., O.A. Lesi, M. Mendy, et al. 2008. “Aflatoxin exposure and viral hepatitis
in the etiology of liver cirrhosis in the Gambia, West Africa.” Environ Health Perspect,
116(11), 1553-1557.
Liu Y., and F. Wu. 2010. “Global Burden of Aflatoxin-Induced Hepatocellular Carcinoma: A
Risk Assessment.” Environmental Health Perspectives 118:818-824.
Lorntz B. et al. 2006. “Early Childhood Diarrhea Predicts Impaired School Performance.”
The Pediatric Infectious Disease Journal, vol. 25, no. 6, June 2006, pp. 513–520.
Masset E, L. Haddad, A. Cornelius and J. Isaza-Castro. 2011, “A systematic review of
agricultural interventions that aim to improve nutritional status of children.” London: EPPI-
Centre, Social Science Research Unit, Institute of Education, University of London.
Maziya-Dixon B.B. et al. 2006. “Vitamin A deficiency is prevalence in children less than 5
years-old.” Journal of Nutrition. Aug 136 (8): 2255-61
Menakshi J. et.al. 2010. “How cost-effective is biofortification in combating micronutrient
malnutrition? An ex-ante assessment.” World Development 38(1): 64-75.
Miguel, E and M. Kremer. 2004. “Worms: identifying impacts on education and health in the
presence of treatment externalities.” Econometrica 72(1): 159-217
Murray C.J. et al. 2013. “Disability-adjusted life years (DALYs) for 291 diseases and injuries
in 21 regions, 1990-2010: a systematic analysis for the Global Burden of Disease Study.”
Lancet 380 (9859): 2197–223.
Nigeria Multiple Indicators Cluster Survey (MICS). 2011. National Bureau of Statistics
(NBS).
Nigeria Demographic and Health Survey (NDHS). 2008.
http://microdata.worldbank.org/index.php/catalog/1459

86
Results for Development (R4D). 2014. Saving One Million Lives Fiscal Space Analysis.
(Preliminary Results March 2014).
Ruel M., et al., for the Maternal and Child Undernutrition Study Group. 2013: Nutrition-
sensitive interventions and programmes: how can they help to accelerate progress in
improving maternal and child nutrition? Lancet; Maternal and Child Nutrition series.
Seddoh, A. et al. 2013. “Towards Investment Case for Neglected Tropical Diseases.”
Working paper for Lancet Commission on Investing in Health. Draft
Shephard GS, P. Khlangsiwet and Wu F. 2011. “Aflotoxin and growth impairment: A
review.” Critical Review of Toxicology. October. 41(9):740-55.
Spears, D. 2013. “How much international variation in child height can sanitation explain?”
World Bank Policy Research Working Paper 6351. Washington, DC: World Bank
Stenberg K. et al. 2013. “Advancing social and economic development by investing in
women’s and children’s health: a new Global Investment Framework.” The Lancet Health
Policy, Published Online November 19, 2013 http://dx.doi.org/10.1016/50140-
6736(13)62231-x. p.8.
Strauss, J. and D. Thomas. 1998. “Heath, Nutrition and Economic Development.” Journal of
Economic Literature. 36(1):766-817.
UNICEF. 2012. Water, sanitation and hygiene (WASH) in schools. New York: UNICEF.
Unnevehr, L. and D. Grace, eds. 2013. “Aflatoxins: Finding Solutions for Improved Food
Safety.” 2020 Focus Brief #20. Washington, DC: International Food Policy Research
Institute.
World Bank. 2006. Repositioning nutrition as central to development: A strategy for large-
scale action. Washington, DC: World Bank.
World Bank. 2010a. Scaling Up Nutrition. What Will It Cost? Washington, DC: The World
Bank.

87
World Bank. 2010b. Nigeria: Country Nutrition Profiles. Washington, DC: World Bank.
World Bank. 2012. Nigeria: economic impacts of poor sanitation. Water and Sanitation
Program. Washington, DC: World Bank.
World Bank. 2013a. Where has all the growth gone? A poverty update for Nigeria.
Washington, DC: World Bank
World Bank. 2013b. Improving Nutrition Through Multisectoral Approaches. Washington,
DC: World Bank.
WHO. 2012. Global Health Estimates. Geneva: WHO.
http://www.who.int/healthinfo/global_burden_disease/en/
WHO. 2014. Cost-effectiveness and strategic planning: threshold values for intervention
cost-effectiveness by region. Geneva, Switzerland: WHO-CHOICE (Choosing Interventions
that are cost-effective) Program. http://www.who.int/choice/costs/CER_levels/en/


This paper estimates country-specific costs and benefits of scaling up key nutrition investments in Nigeria. Building on the methodology established in the global report—Scaling Up Nutrition: What will it cost?—the authors estimate the costs and benefits of a nationwide scale up of ten effective nutrition-specific interventions. This would require an annual public investment of $837 million and would yield enormous benefits: over 8.7 million DALYs and 183,000 lives would be saved annually, while more than 3 million cases of stunting among children under five would be averted. As it is unlikely that the Government of Nigeria or its partners will find the $837 million necessary to reach full national coverage, the authors consider five potential scale-up scenarios based on considerations of burden of stunting, potential for impact, resource requirements and capacity for implementation in Nigeria. Using cost-benefit analyses, they propose scale-up scenarios that represent a compromise between the need to move to full coverage and the constraints imposed by limited resources and capacities. This analysis takes an innovative approach to nutrition costing by not only estimating the costs and benefits of nutrition-specific interventions, but also exploring costs for a selected number of nutrition-sensitive interventions implemented outside of the health sector. The authors identify and cost four candidate nutrition-sensitive interventions with impact potential in Nigeria, including biofortification of cassava, aflatoxin control, school-based deworming, and school-based promotion of good hygiene. Overall, these findings point to a candidate list of nutrition-sensitive approaches that represent a cost-effective approach to reducing child malnutrition in Nigeria. Moving forward, these results are intended to help guide decision makers as they plan future efforts to scale-up action against malnutrition in Nigeria and develop nutrition financing plans that bring to bear resources from the health, social protection, education, and agriculture sectors. .
ABOUT THIS SERIES: This series is produced by the Health, Nutrition, and Population Global Practice of the World Bank. The
papers in this series aim to provide a vehicle for publishing preliminary results on HNP topics to encourage
discussion and debate. The findings, interpretations, and conclusions expressed in this paper are entirely
those of the author(s) and should not be attributed in any manner to the World Bank, to its affiliated
organizations or to members of its Board of Executive Directors or the countries they represent. Citation and
the use of material presented in this series should take into account this provisional character. For free copies
of papers in this series please contact the individual author/s whose name appears on the paper. Enquiries
about the series and submissions should be made directly to the Editor Martin Lutalo (mlutalo@
worldbank.org) or HNP Advisory Service ([email protected], tel 202 473-2256).
For more information, see also www.worldbank.org/hnppublications.
1818 H Street, NW
Washington, DC USA 20433
Telephone: 202 473 1000
Facsimile: 202 477 6391
Internet: www.worldbank.org
E-mail: [email protected]