Coste de salarios en el mundo - Sartia | Selection and
46
Prices and earnings Price comparison Asia is the region with the greatest variation in prices Food costs five times as much in Tokyo as in Mumbai Domestic purchasing power Buying an iPhone in Zurich requires 22 hours of work In Manila this takes around 20 times longer Wage comparison Highest net wages in Zurich, Geneva and Luxembourg Shortest working hours in Paris, Lyon and Copenhagen CIO Wealth Management Research September 2012 Edition 2012 A comparison of purchasing power around the globe Prices and earnings iPhone App For smartphone users: scan the code with an App such as “scan” www.ubs.com/pricesandearnings
Transcript of Coste de salarios en el mundo - Sartia | Selection and

Prices and earnings
Price comparison
Asia is the region with the greatest variation in prices
Food costs five times as much in Tokyo as in Mumbai
Domestic purchasing power
Buying an iPhone in Zurich requires 22 hours of work
In Manila this takes around 20 times longer
Wage comparison
Highest net wages in Zurich, Geneva and Luxembourg
Shortest working hours in Paris, Lyon and Copenhagen
CIO Wealth Management ResearchSeptember 2012
Edition 2012
A comparison of purchasing power around the globe
Prices and earnings iPhone App For smartphone users: scan the code with an App such as “scan” www.ubs.com/pricesandearnings

Prices and earnings 20122
Montreal
New YorkToronto
Chicago
Los Angeles
Mexico City
Miami
Caracas
Bogotá
Lima
Santiago de Chile Buenos Aires
São PauloRio de Janeiro
OsloStockholm
Helsinki
Tallinn
Riga
Vilnius
Moscow
KievWarsaw
PragueBratislava
Budapest
BucharestSofia
Athens
Copenhagen
BerlinAmsterdam
FrankfurtMunich
ViennaZurichLjubljana
Milan
Rome
DublinLondon
Brussels Luxembourg
ParisGeneva
Lyon
BarcelonaMadrid
Lisbon
Johannesburg
Nairobi
Tel Aviv
Manama
DubaiDoha
Cairo
Delhi
Mumbai
Kuala Lumpur
Bangkok
Hong Kong
Manila
Taipei
Shanghai
Beijing
SeoulTokyo
SydneyAuckland
Jakarta
Istanbul
Nicosia
Cities (countries)Amsterdam (Netherlands)Athens (Greece)Auckland (New Zealand)Bangkok (Thailand)Barcelona (Spain)Beijing (China)Berlin (Germany)Bogotá (Colombia)Bratislava (Slovakia)Brussels (Belgium)Bucharest (Romania)Budapest (Hungary)Buenos Aires (Argentina)Cairo (Egypt)Caracas (Venezuela)Chicago (United States)Copenhagen (Denmark)Delhi (India)Doha (Qatar)Dubai (United Arab Emirates)Dublin (Ireland)Frankfurt (Germany)Geneva (Switzerland)Helsinki (Finland)Hong Kong (China)Istanbul (Turkey)Jakarta (Indonesia)Johannesburg (South Africa)Kiev (Ukraine)Kuala Lumpur (Malaysia)Lima (Peru)Lisbon (Portugal)Ljubljana (Slovenia)London (Great Britain)Los Angeles (United States)Luxembourg (Luxembourg)Lyon (France)Madrid (Spain)Manama (Bahrain)Manila (Philippines)Mexico City (Mexico)Miami (United States)Milan (Italy)Montreal (Canada)Moscow (Russia)Mumbai (India)Munich (Germany)Nairobi (Kenya)New York (United States)Nicosia (Cyprus)Oslo (Norway)Paris (France)Prague (Czech Republic)Riga (Latvia)Rio de Janeiro (Brazil)Rome (Italy)Santiago de Chile (Chile)São Paulo (Brazil)Seoul (South Korea)Shanghai (China)Sofia (Bulgaria)Stockholm (Sweden)Sydney (Australia)Taipei (Taiwan)Tallinn (Estonia)Tel Aviv (Israel)Tokyo (Japan)Toronto (Canada)Vienna (Austria)Vilnius (Lithuania)Warsaw (Poland)Zurich (Switzerland)

Prices and earnings 2012 3
Prices and earnings
Montreal
New YorkToronto
Chicago
Los Angeles
Mexico City
Miami
Caracas
Bogotá
Lima
Santiago de Chile Buenos Aires
São PauloRio de Janeiro
OsloStockholm
Helsinki
Tallinn
Riga
Vilnius
Moscow
KievWarsaw
PragueBratislava
Budapest
BucharestSofia
Athens
Copenhagen
BerlinAmsterdam
FrankfurtMunich
ViennaZurichLjubljana
Milan
Rome
DublinLondon
Brussels Luxembourg
ParisGeneva
Lyon
BarcelonaMadrid
Lisbon
Johannesburg
Nairobi
Tel Aviv
Manama
DubaiDoha
Cairo
Delhi
Mumbai
Kuala Lumpur
Bangkok
Hong Kong
Manila
Taipei
Shanghai
Beijing
SeoulTokyo
SydneyAuckland
Jakarta
Istanbul
Nicosia
A comparison of purchasing power around the globeEdition 2012

Prices and earnings 20124
Contents
5Overview
Editorial �������������������������������������������������������������������������������� 5
Methodology ������������������������������������������������������������������������ 6
Overview
Price levels ���������������������������������������������������������������������������� 8
Wage levels �������������������������������������������������������������������������� 9
Domestic purchasing power ������������������������������������������������� 10
Working time required to buy ���…��������������������������������������� 11
Exchange rates used ������������������������������������������������������������ 12
Price comparison
Total expenditure on goods and services ����������������������������� 14
Food prices ������������������������������������������������������������������������� 15
Prices for woman’s and men’s clothing �������������������������������� 16
Prices of home electronics and household appliances ����������� 17
Housing ������������������������������������������������������������������������������� 18
Public transport ������������������������������������������������������������������� 20
Car prices and maintenance costs ���������������������������������������� 21
Restaurant and hotel prices ������������������������������������������������� 22
Prices of a city break ������������������������������������������������������������ 23
Prices of services ������������������������������������������������������������������ 24
Wage comparison
International wage comparison �������������������������������������������� 26
Gross and net hourly pay ����������������������������������������������������� 27
Taxes and social security contributions ��������������������������������� 28
Working hours and vacation days ���������������������������������������� 30
Exchange rate changes �������������������������������������������������������� 31
Inflation ������������������������������������������������������������������������������� 32
Geographical distribution of regions ������������������������������������ 33
Appendix ����������������������������������������������������������������������������� 34
14Price comparison
26Wage comparison

Prices and earnings 2012 5
Dear Reader,
How long do you have to work to pay for a Big Mac or an iPhone? In which regions are electronic devices particularly cheap? In this study, now our fifteenth comparison of pur-chasing power in 72 cities around the world, we look at these and other questions in depth� We gleaned the results from what now amount to more than 50,000 price and earnings data items�
First published in 1970, we update the study every three years with current data from price and earnings surveys conducted in the various cities� The fact that we have taken Europe as the basis for our reference basket of prices and earnings may have a limiting effect on certain parts of our study. At the same time, we have specified the items surveyed as broadly as possible to ensure comparability� We were aided in this process by intensive and regular communication with local data collectors�
This year, we again confirmed certain expectations. People in Asia still work considerably longer hours than their Euro-pean counterparts, for example, but earn significantly less on average per hour worked� The data also shows the impact of the financial and debt crisis, whether in terms of
price and earnings trends in individual cities or in terms of movements in the foreign exchange markets, where major currencies such as the euro and the US dollar came under immense political and economic pressure� Finally, the worldwide disparity in the prices of food staples such as bread and rice is astonishing�
We are once again indebted to chambers of commerce, universities, members of student organizations, various individuals and UBS employees around the world for their help in preparing this year’s study� We would like to thank all those involved for their efforts.
We hope that this study and the interactive version of our Prices & Earnings iPhone App will prove to be a valuable companion on your physical and imaginary trips around the world, and that you enjoy reading it�
Andreas Höfert Daniel Kalt
Andreas HöfertChief Economist
Daniel KaltChief Economist Switzerland

Prices and earnings 20126
Methodology
Between the end of April and the end of May we carried out a standardized price and earnings survey in 72 cities around the world. The survey was conducted locally by mutually independent observers. A total of more than 50,000 data points were collected and included in the survey evaluation.
For reasons of comparability, we converted all prices and earnings into a common currency� In order to minimize the effect of daily price fluctuations, the average exchange rate during the assessment period was used� The exchange rates are listed on page 12�
Definition of the reference basket of goodsConsumer habits and preferences vary greatly around the world� For example, normally little alcohol is consumed in Arabian countries, while warm winter clothing is usually not needed in tropical countries�
A global price comparison, however, requires a standardized basket of goods and services� Our reference basket of goods is based on European consumer habits and includes 122 positions which were described as precisely as possible in the question-naire� Due to the focus on European consumer habits, it was not possible to include all the products from our reference basket of goods in some places� Where products were not available or deviated too much from the goods and services in the reference basket, substitutes typical for the respective location were used or the prices of the unavailable goods and services were extrapolated from local price levels�
The individual positions of the reference basket of goods were grouped into nine consumption categories, which form the basis for the calculation of the cost of living� The weightings of these main categories were set in accordance with the Euro-pean Union’s (Eurostat, 2012) harmonized index of consumer prices (HICP) and divided as follows:
Food/groceries 14%
Beverages/tobacco products 5%
Hygiene and healthcare 8%
Clothing 7%
Household and electronic devices 10%
Home 10%
Heating/lighting 6%
Transportation 16%
Miscellaneous services 24%
Methodology for the comparison of prices and earnings
In comparison to a standard consumer price index, the basket we compiled comprises only a limited selection of goods and services� For this reason, the individual articles within the main categories were weighted in such a way that when multiplied by the respective average prices they equated to approximately the monthly consumption of a three-person European family�
Changes in the reference basket of goodsDue to changes in consumer habits over time and the techno-logical developments made in individual products, it is neces-sary to change the weighting and composition of the basket of goods� In contrast to the 2009 edition, we have not only aligned the weighting of the basket of goods with the latest Eurostat data, we also modified the specifications of individual goods (for instance the personal computer)� The only product we removed from the reference basket of goods is the iPod Nano, which has been replaced by the iPhone�
Changes in the structure of working populationThe process for collecting salary data involves eight questions on salaries, taxes and social security contributions as well as working hours for 15 different occupational profiles. For this year’s edition, the weighting of the individual occupational profiles was adjusted in line with the latest Eurostat figures on the working population share by sector� This impacted the weighting of the service sector in particular and thus in some cases directly affected the corresponding data series – a fact that should be taken into account when comparing this report with previous editions of Prices and Earnings�
The individual data items were collected from companies deemed to be representative and the occupational profiles were delimited as far as possible in terms of family status, work experience and education� Input from cross-border commuters was also not included in the survey� This ensures that the location of the salary level obtained in the survey corresponds with that of the related price level� The 2012 edition of Prices and Earnings includes analyses of income, working hours and payroll deductions on pages 26 to 30� Detailed information on the individual occupations is contained in the electronic version�
NoteThe grouping of the individual cities by geographical region can be found on page 33�
Time, price, earnings and percentage figures are rounded in most cases to improve readability. The index values are based on the figures actually obtained in the survey�
The sample size per city may not be statistically representative for single data points�

Prices and earnings 2012 7
OverviewMarcel Aisslinger
Rebecca Kutz
umjb
@fo
tolia
.com

Prices and earnings 20128
Overview
Oslo, Zurich and Tokyo most expensiveOur survey shows that Oslo, Zurich and Tokyo are the most expensive cities in the world� Prices for many goods and services are lowest in the two Indian metropolises of Delhi and Mumbai� Taking rent into account as well, the rankings remain unchanged� Tokyo has ousted Copenhagen to take third place in our price rankings compared with 2009� One remarkable finding is that when rents are included, relative price levels compared to New York move down in all cities except Hong Kong�
At the regional level, the three frontrunners Oslo, Zurich and Tokyo differ from the general picture in their respective regions� Oslo and Zurich are around 20% above Western European price levels, while Tokyo is a full 50% more expensive than the majority of cities in Asia� By contrast, the general picture for cities in Africa as well as in Oceania is relatively uniform�
How do shifts in price levels come about?The top and bottom places in the rankings are currently occupied by the same cities as three years ago� There have been a number of major changes in the middle group, however�
Our analysis shows that changes in inflation and especially in exchange rates are the key factors that bring about shifts in price levels calculated in US dollars� For instance, the New Zealand and Australian dollars appreciated strongly against the US dollar, leading to a marked rise in US dollar price levels in Auckland and Sydney�
The index of Moscow also gained due to currency appreciation, further amplified by general price inflation. On the other hand, Dublin experienced a relative decline in the price index due to the financial and euro crisis.
Price levels
City 1Excl. rent
New York = 100Incl. rent
New York = 100Oslo 116.0 104.5Zurich 110.1 102.5Tokyo 108.9 100.0Geneva 106.5 96.8Copenhagen 100.9 88.8New York 100 100Luxembourg 94.4 85.4Stockholm 91.9 81.7Caracas 91.0 85.3London 87.3 83.0Helsinki 86.5 82.3Frankfurt 86.4 77.2Munich 84.6 75.1Paris 83.9 77.5Sydney 83.6 77.8Montreal 81.8 73.7Vienna 81.3 72.0Milan 79.6 72.1Rome 79.1 73.8Chicago 79.0 72.8Lyon 78.4 68.8Dubai 78.1 77.2Amsterdam 77.0 69.0Miami 77.0 70.7Auckland 76.7 67.7Dublin 76.2 69.7Los Angeles 75.8 68.6Brussels 75.8 68.7Tel Aviv 75.4 68.4Barcelona 74.7 65.6Toronto 74.3 67.2Hong Kong 73.1 75.2Berlin 72.3 64.1Istanbul 71.5 65.5Madrid 69.6 61.6Doha 68.6 66.9Seoul 67.8 66.3Lisbon 67.4 60.1Athens 66.1 58.1Moscow 66.1 61.2Nicosia 63.9 56.9Taipei 63.8 57.9Ljubljana 63.3 55.1São Paulo 61.7 56.1Rio de Janeiro 61.2 55.5Beijing 60.3 51.8Tallinn 58.2 50.1Budapest 56.7 50.3Shanghai 56.1 49.6Bangkok 55.3 48.1Buenos Aires 55.0 47.6Riga 54.5 47.1Prague 54.3 48.0Manama 54.0 49.5Bratislava 53.9 47.0Jakarta 53.7 48.6Warsaw 53.7 47.9Kiev 53.1 46.8Bogotá 53.1 46.9Santiago de Chile 52.8 47.6Johannesburg 52.1 47.2Kuala Lumpur 52.0 46.1Mexico City 51.2 45.7Vilnius 50.8 43.5Lima 50.8 44.4Nairobi 48.6 43.7Cairo 42.4 36.2Sofia 42.3 36.4Manila 41.5 35.8Bucharest 39.8 34.7Mumbai 34.1 31.0Delhi 33.1 29.4
MethodologyThese calculations are based on the cost of a basket of 122 goods and service weighted according to European consumption habits�
1 Listed according to value of index (price level excluding rent)
Price levels

Prices and earnings 2012 9
Overview
Ove
rvie
w
Wage levels
Zurich, Geneva, Copenhagen and Oslo head the rankingsThe trend established in recent years has reaffirmed itself in international comparison: At the top of the index are European cities, while in the regional comparison the highest wages are, on average, paid in North America� At the lower end of the scale are South American cities, where on average gross earnings are only about one quarter of their North American counterparts�
While average values provide a good overview, a closer look at the indi-vidual figures shows how wide the pay divide is in particular regions. The largest wage differences are in Asia, where the highest value (Tokyo) is twelve times higher than the lowest (Delhi)� Gross wages are closest together in the more homogenous region of North America, with wage levels in New York just 1�3 times higher than Montreal�
The top two spots in this year’s wage survey are taken by the Swiss cities of Zurich and Geneva� This contributes in no small part to the fact that people in Western European cities on average earn four times more than their peers in Eastern Europe� Their dominance is compounded by the fact that, in Switzerland, deductions from salary are relatively low, which further widens the gap between net wages earned there and in other countries, especially in the rest of Western Europe�
Sydney and Auckland also managed to “improve” compared with 2009: Both countries closed in on the cities at the head of the pack, since both the Australian and the New Zealand dollar appreciated more strongly against the US dollar than the Swiss franc�
By contrast, wage levels in Dublin and Athens decreased sharply, exacer-bated by the financial problems faced by Ireland and Greece in the wake of the financial crisis. Delhi also slipped back, trading places with Mumbai; alongside Manila and Jakarta, the Indian city now brings up the rear of the wage rankings�
Net wages are a good indicator of the budget that employees have available to spend� However, it should be considered that certain country or city-specific deductions may not be included in these figures and in certain cases could place an additional strain on net wages�
Wage levels
City 1Gross
New York = 100Net
New York = 100Zurich 131.1 132.4Geneva 123.6 119.2Copenhagen 123.1 93.4Oslo 119.1 97.4Luxembourg 105.4 109.7New York 100 100Sydney 94.1 98.0Tokyo 92.4 90.4Munich 91.5 76.0Frankfurt 88.2 78.1Los Angeles 86.3 80.9Chicago 83.3 80.6Stockholm 82.9 78.1Miami 81.8 79.9Brussels 81.5 59.5Helsinki 80.2 74.2Vienna 80.2 70.8London 79.5 75.2Berlin 79.2 70.1Amsterdam 78.3 69.4Paris 78.1 73.6Dublin 77.7 78.8Toronto 76.8 68.6Montreal 76.2 66.2Milan 70.3 61.5Lyon 64.2 64.7Nicosia 60.8 68.5Auckland 59.8 63.5Barcelona 59.6 58.7Madrid 57.0 57.9Rome 55.1 48.2Seoul 54.8 50.2Dubai 49.6 64.2Lisbon 44.0 42.6Tel Aviv 43.0 43.5Hong Kong 42.8 49.8Johannesburg 41.5 38.9Athens 41.4 40.0Ljubljana 36.4 32.0Taipei 33.3 39.3Manama 30.5 38.8Moscow 30.4 33.8São Paulo 30.1 30.5Tallinn 28.0 28.3Istanbul 27.9 28.2Bratislava 27.7 27.3Rio de Janeiro 27.2 27.5Doha 26.6 34.4Prague 24.5 25.1Riga 24.2 21.4Warsaw 23.8 21.9Buenos Aires 23.6 25.4Santiago de Chile 22.6 21.5Bogotá 22.3 22.0Lima 22.2 23.1Vilnius 21.7 21.2Kuala Lumpur 21.5 22.0Shanghai 20.9 21.6Budapest 20.1 18.1Caracas 20.0 23.4Beijing 17.0 18.0Bucharest 14.8 13.5Bangkok 14.6 17.4Sofia 13.8 13.6Mexico City 13.7 15.1Cairo 11.0 12.1Kiev 10.5 11.2Nairobi 10.4 10.2Mumbai 8.5 9.3Manila 8.0 8.1Jakarta 7.9 9.2Delhi 7.6 8.3
MethodologyEffective hourly wages for 15 professions, weighted according to distribution; net after deductions of taxes and social security contributions (see pp. 26–29).
1 Listed according to gross value of the index

Prices and earnings 201210
Overview
The value of wagesPrice and earnings trends show the value of a basket of goods and services or the level of remuneration in a given profession over time� High absolute prices or low wage levels have only a limited bearing on the prosperity of a city’s population, however. It is only by comparing the two figures that we can establish how many goods and services can be purchased with a given level of income�
Taking annual net income as the benchmark, residents of North American cities can afford to buy our reference basket of goods on average around twelve times per year, compared to just under ten times for those in Western Europe� Citizens in the surveyed cities in Eastern Europe and South America have to budget carefully, as they can only afford to buy just under five baskets per year. Based on the assumption that our weighted basket of goods corresponds to the monthly spending of a European family of three, these figures also indicate that in many cases one income per family is not sufficient to allow them to purchase the reference basket twelve times per year�
This analysis based on annual income partly ignores differences in productiv-ity between individual cities, however, as a higher number of working hours can partially make up for lower hourly wages (see also page 30)� The table opposite therefore shows purchasing power in terms of both annual income and hourly wages, based on effective hours worked per year and profes-sion�
Copenhagen has the highest purchasing power in terms of gross hourly wages, followed by Zurich, Geneva and Los Angeles� Bringing up the rear are Nairobi, Kiev, Manila and Jakarta, where the real equivalent value of wages is between five and seven times lower than in New York.
The crucial factor is net disposable incomeThe decisive measure is what employees can purchase with their net wages, in other words after social security contributions and taxes have been deducted, which is why the table is sorted according to the purchasing power of net hourly wages� This shows yet another picture: Sydney and Luxembourg are new among the first four ranks while Zurich and Geneva are able to maintain their places in the leading quartet thanks to a com-paratively low tax burden�
The impact of tax and social security deductions is most strongly felt in Copenhagen, Oslo, Munich and Brussels, which lose some of their strength compared with their gross purchasing power� There were fewer changes in the lower half of the rankings, with exactly the same four cities occupying the last four places on all three measures�
NoteWhen comparing purchasing power, it should be noted that local workers, who are used as the basis for our earnings data, would buy a different set of items in Asian or African cities than their European and North American counterparts� Imported products are particularly important, as they are not much cheaper in emerging countries than they are in Western Europe and North America�
Methodology1 Listed according to value of index based on net hourly wages
2 Gross or net hourly wages divided by the cost of the entire basket of goods excluding rent
3 Net annual income divided by the cost of the entire basket of goods excluding rent
Domestic purchasing power Domestic purchasing power subject to…
City 1
Hourly pay 2 gross
N.Y. = 100
Hourly pay 2 net
N.Y. = 100
Annual income 3 net
N.Y. = 100Zurich 119.1 120.3 110.6Sydney 112.5 117.2 104.5Luxembourg 111.7 116.2 87.0Geneva 116.0 111.9 98.8Nicosia 95.1 107.2 86.8Los Angeles 113.9 106.8 98.4Miami 106.2 103.7 97.7Dublin 101.9 103.3 82.0Chicago 105.4 101.9 91.6New York 100 100 100Berlin 109.6 97.0 82.1Copenhagen 122.0 92.5 75.3Toronto 103.4 92.3 80.4Frankfurt 102.1 90.5 76.1Amsterdam 101.6 90.1 75.7Munich 108.2 89.8 77.0Paris 93.1 87.7 65.1Vienna 98.6 87.1 74.9London 91.1 86.2 73.0Helsinki 92.7 85.8 70.8Stockholm 90.2 84.9 74.0Oslo 102.7 84.0 71.2Madrid 81.8 83.1 67.0Tokyo 84.8 83.0 80.9Auckland 78.0 82.9 74.8Lyon 81.9 82.5 65.6Dubai 63.5 82.1 79.5Montreal 93.1 80.9 68.1Barcelona 79.7 78.6 66.8Brussels 107.6 78.6 65.9Milan 88.3 77.2 61.8Johannesburg 79.7 74.7 66.8Seoul 80.8 74.0 78.2Manama 56.4 71.9 66.4Hong Kong 58.5 68.1 72.6Lisbon 65.3 63.2 50.6Taipei 52.1 61.5 61.7Rome 69.6 60.9 53.7Athens 62.6 60.5 52.1Tel Aviv 57.0 57.7 53.4Moscow 45.9 51.2 44.8Bratislava 51.3 50.7 45.7Ljubljana 57.5 50.5 43.8Doha 38.8 50.2 50.2São Paulo 48.7 49.4 42.0Tallinn 48.0 48.7 40.9Prague 45.2 46.2 40.8Buenos Aires 42.9 46.2 41.1Lima 43.6 45.5 44.2Rio de Janeiro 44.5 45.0 40.7Kuala Lumpur 41.3 42.2 38.6Vilnius 42.6 41.7 36.1Bogotá 42.1 41.4 38.5Warsaw 44.3 40.8 34.0Santiago de Chile 42.8 40.7 38.8Istanbul 39.0 39.4 39.8Riga 44.4 39.3 34.4Shanghai 37.3 38.4 36.6Bucharest 37.1 34.0 30.2Sofia 32.6 32.1 29.1Budapest 35.5 32.0 29.3Bangkok 26.5 31.4 33.7Beijing 28.3 29.9 28.2Mexico City 26.8 29.6 33.1Cairo 26.0 28.5 32.8Mumbai 24.9 27.3 28.9Caracas 21.9 25.7 23.0Delhi 23.0 25.0 25.9Kiev 19.7 21.1 18.3Nairobi 21.4 21.0 21.2Manila 19.3 19.5 19.8Jakarta 14.7 17.2 16.7

Prices and earnings 2012 11
Overview
Ove
rvie
w
Working time required to buy
Earning a Big Mac fasterThe quality and nature of many goods varies widely from one place to the next. This is compounded by regional influences that affect the characteris-tics and availability of individual products� One commodity is especially well suited for the purposes of international comparison by virtue of the fact that it is pretty much the same wherever you buy it around the globe: the Big Mac�
On average among the countries surveyed, it takes 28 minutes to earn enough money to buy a Big Mac – nine minutes less than in 2009. While in Western Europe people can bite into their burger after only 17 minutes’ work, in South America it takes 49 minutes, almost three times as long� Like three years ago, Tokyo continues to occupy the top spot, while Nairobi is in last place with the longest working time required�
A rise in global average wages can be observed compared with 2009� This has had a consistently positive impact on purchasing power for certain goods, as the comparison between two basic foodstuffs shows: the amount of work needed to buy a kilo of bread (international average) is now 17 minutes (2009: 25 minutes), while for rice it is 16 minutes (2009: 22 minutes)�
Saving for an iPhone can take patienceIn this year’s survey we replaced the iPod nano used in 2009 with the iPhone 4S (16 GB) – one of the most sought-after products in recent years. If we exclude discounted offers used to lock buyers into a contract, buying an iPhone can take a considerable amount of work�
People working in Zurich are able to afford the smartphone the quickest, that is, after 22 hours of work. The working time required is ten times longer in Mexico City and Bucharest� According to the regional average, the amount of time needed in North America (35 hours), Oceania (42 hours) and Western Europe (48 hours) is under 50 hours, while in Eastern Europe, South America, Asia and Africa the purchase would on average require considerably more than three weeks’ salary (assuming a 45-hour working week)�
Working time/buy
City 1 Big Mac
in min.1kg of bread
in min.1kg ricein min.
1 iPhone 4S 16GB, in hrs.
Amsterdam 16 7 9 44.5Athens 30 13 26 86.0Auckland 16 17 8 51.0Bangkok 36 26 20 165.0Barcelona 19 12 6 52.5Beijing 34 28 16 184.0Berlin 16 11 9 55.5Bogotá 52 34 17 142.0Bratislava 32 21 20 126.5Brussels 20 11 12 54.0Bucharest 57 21 27 229.5Budapest 49 14 27 206.0Buenos Aires 45 12 17 187.0Cairo 67 8 19 290.5Caracas 81 59 13 271.5Chicago 11 16 9 32.0Copenhagen 16 9 6 36.5Delhi 65 16 40 369.5Doha 21 13 16 82.5Dubai 12 10 14 46.5Dublin 14 8 10 39.0Frankfurt 15 9 11 41.5Geneva 14 6 7 23.5Helsinki 16 14 7 44.5Hong Kong 10 24 10 53.0Istanbul 42 9 14 165.5Jakarta 62 47 28 348.5Johannesburg 26 10 11 93.5Kiev 46 18 30 266.5Kuala Lumpur 26 20 21 129.0Lima 21 20 16 162.0Lisbon 22 14 8 96.5Ljubljana 25 23 38 101.0London 16 7 13 42.5Los Angeles 11 18 6 33.0Luxembourg 11 9 10 29.5Lyon 17 10 13 52.5Madrid 18 10 6 53.0Manama 20 6 10 72.5Manila 73 70 28 435.0Mexico City 48 26 22 219.5Miami 12 13 6 32.5Milan 18 15 16 55.0Montreal 19 14 14 44.5Moscow 18 7 12 119.0Mumbai 56 30 31 338.0Munich 15 11 11 42.5Nairobi 84 28 41 292.5New York 10 13 6 27.5Nicosia 12 8 9 53.5Oslo 18 11 12 36.0Paris 16 15 13 43.5Prague 34 13 16 131.5Riga 33 23 22 168.5Rio de Janeiro 45 33 12 160.0Rome 23 17 19 70.0Santiago de Chile 56 22 21 157.0São Paulo 39 27 8 106.0Seoul 17 14 10 56.0Shanghai 29 43 9 142.0Sofia 36 20 29 247.5Stockholm 17 19 11 45.0Sydney 12 9 6 32.5Taipei 15 9 12 79.0Tallinn 28 20 16 139.0Tel Aviv 17 10 21 99.5Tokyo 9 15 15 35.0Toronto 11 11 10 37.5Vienna 14 9 9 45.5Vilnius 33 19 34 168.5Warsaw 36 13 24 141.0Zurich 13 6 6 22.0
MethodologyPrice of the product divided by the weighted net hourly wage in 15 professions�

Prices and earnings 201212
Overview
Exchange rates used 1
Major currencies feel the effects of the financial crisisWhen comparing data over an extended period, exchange rate trends play an especially crucial role� Toward the end of the period from 2006 and 2009 and after the outbreak of the financial crisis in the United States in 2008, in particular, “smaller” currencies (such as the New Zealand dollar or the Norwegian krone) and currencies of countries in which traditional commodi-ties are mined and exported dropped sharply in value�
These smaller currency zones fell victim to their low liquidity as investors sought refuge in the major currencies of the US dollar and the euro, and depreciated due to falling commodity prices� This trend has reversed somewhat since 2009, after both the US dollar and the euro suffered due to political and economic developments, and the trend in interest rates and commodity prices began to favor the diversification currencies.
Extreme examples of this countermovement are the Canadian and Austral-ian dollars: although they slipped around 9% versus the US dollar from 2006 to 2009, between 2009 and 2012 the two currencies clawed back these losses and appreciated by some 26% and 51%, respectively� The South African rand, the Swedish krona and the Brazilian real also fall into this category�
Spotlight on political motivesThe appreciation of numerous currencies against the major currencies since 2009 has been additionally boosted by the expansive monetary policy in the euro and dollar zones, where the purse strings have been loosened considerably in an attempt to mitigate the effects of the financial crisis.
Another country has joined the Eurozone since 2009: Estonia, which replaced its national currency with the euro effective January 2011. This takes the number of countries using the euro up to 17� Accordingly, this year’s study comprises 21 cities from the Eurozone�
The sharp appreciation of the Swiss franc against the euro and also against the US dollar has had differing effects. While Swiss people traveling in the Eurozone and the United States are likely pleased about the strength of their domestic currency since it gives them more bang for their buck, it is unfavorable for Swiss exporters because it makes their goods and services more expensive. The EURCHF floor of 1.20 has helped to ease this burden somewhat, keeping the Swiss franc at a constant level versus the euro since September 2011�
Exchange rates
CityLocal currency(LC) USD/LC EUR/LC CHF/LC
Amsterdam EUR 1 1.295 1.000 1.201Athens EUR 1 1.295 1.000 1.201Auckland NZD 1 0.785 0.607 0.729Bangkok THB 1 0.032 0.025 0.030Barcelona EUR 1 1.295 1.000 1.201Beijing CNY 1 0.158 0.122 0.147Berlin EUR 1 1.295 1.000 1.201Bogotá COP 100 0.056 0.043 0.052Bratislava EUR 1 1.295 1.000 1.201Brussels EUR 1 1.295 1.000 1.201Bucharest RON 1 0.293 0.226 0.271Budapest HUF 100 0.447 0.345 0.414Buenos Aires ARS 1 0.226 0.174 0.209Cairo EGP 1 0.166 0.128 0.154Caracas VEF 1 0.233 0.180 0.216Chicago USD 1 1.000 0.772 0.927Copenhagen DKK 1 0.174 0.135 0.162Delhi INR 1 0.019 0.014 0.017Doha QAR 1 0.275 0.212 0.255Dubai AED 1 0.272 0.210 0.252Dublin EUR 1 1.295 1.000 1.201Frankfurt EUR 1 1.295 1.000 1.201Geneva CHF 1 1.079 0.833 1.000Helsinki EUR 1 1.295 1.000 1.201Hong Kong HKD 1 0.129 0.099 0.119Istanbul TRY 1 0.559 0.432 0.518Jakarta IDR 1000 0.109 0.008 0.101Johannesburg ZAR 1 0.125 0.096 0.116Kiev UAH 1 0.124 0.096 0.115Kuala Lumpur MYR 1 0.326 0.252 0.302Lima PEN 1 0.377 0.291 0.349Lisbon EUR 1 1.295 1.000 1.201Ljubljana EUR 1 1.295 1.000 1.201London GBP 1 1.607 1.241 1.490Los Angeles USD 1 1.000 0.772 0.927Luxembourg EUR 1 1.295 1.000 1.201Lyon EUR 1 1.295 1.000 1.201Madrid EUR 1 1.295 1.000 1.201Manama BHD 1 2.653 2.053 2.466Manila PHP 1 0.024 0.018 0.022Mexico City MXN 1 0.074 0.058 0.069Miami USD 1 1.000 0.772 0.927Milan EUR 1 1.295 1.000 1.201Montreal CAD 1 0.999 0.771 0.926Moscow RUB 1 0.033 0.026 0.031Mumbai INR 1 0.019 0.014 0.017Munich EUR 1 1.295 1.000 1.201Nairobi KES 100 1.197 0.921 1.107New York USD 1 1.000 0.772 0.927Nicosia EUR 1 1.295 1.000 1.201Oslo NOK 1 0.171 0.132 0.158Paris EUR 1 1.295 1.000 1.201Prague CZK 1 0.051 0.040 0.048Riga LVL 1 1.856 1.433 1.721Rio de Janeiro BRL 1 0.510 0.394 0.473Rome EUR 1 1.295 1.000 1.201Santiago de Chile CLP 100 0.204 0.157 0.189São Paulo BRL 1 0.510 0.394 0.473Seoul KRW 100 0.087 0.067 0.081Shanghai CNY 1 0.158 0.122 0.147Sofia BGN 1 0.662 0.511 0.614Stockholm SEK 1 0.144 0.111 0.134Sydney AUD 1 1.009 0.779 0.936Taipei TWD 1 0.034 0.026 0.032Tallinn EUR 1 1.295 1.000 1.201Tel Aviv ILS 1 0.263 0.203 0.244Tokyo JPY 1 0.013 0.010 0.012Toronto CAD 1 0.999 0.771 0.926Vienna EUR 1 1.295 1.000 1.201Vilnius LTL 1 0.375 0.290 0.348Warsaw PLN 1 0.305 0.235 0.283Zurich CHF 1 1.079 0.833 1.000
NoteSee also page 31, exchange rate movements 2009–2012.
Sources: Reuters EcoWin, Bloomberg
1 Average exchange rates during survey period (end of April to end of May 2012)

Prices and earnings 2012 13
Price comparisonRebecca Kutz
phot
ocas
e.co
m

Prices and earnings 20121414
Price comparison
Total expenditure on goods and services
Goods and services
City USD 1Index
New York = 100Amsterdam 3,034 77.0Athens 2,605 66.1Auckland 3,019 76.7Bangkok 2,178 55.3Barcelona 2,941 74.7Beijing 2,375 60.3Berlin 2,847 72.3Bogotá 2,089 53.1Bratislava 2,122 53.9Brussels 2,983 75.8Bucharest 1,568 39.8Budapest 2,232 56.7Buenos Aires 2,166 55.0Cairo 1,669 42.4Caracas 3,583 91.0Chicago 3,112 79.0Copenhagen 3,974 100.9Delhi 1,304 33.1Doha 2,700 68.6Dubai 3,077 78.1Dublin 3,003 76.2Frankfurt 3,402 86.4Geneva 4,195 106.5Helsinki 3,407 86.5Hong Kong 2,880 73.1Istanbul 2,814 71.5Jakarta 2,114 53.7Johannesburg 2,052 52.1Kiev 2,091 53.1Kuala Lumpur 2,050 52.0Lima 2,000 50.8Lisbon 2,656 67.4Ljubljana 2,493 63.3London 3,437 87.3Los Angeles 2,985 75.8Luxembourg 3,716 94.4Lyon 3,087 78.4Madrid 2,742 69.6Manama 2,127 54.0Manila 1,634 41.5Mexico City 2,015 51.2Miami 3,031 77.0Milan 3,136 79.6Montreal 3,222 81.8Moscow 2,604 66.1Mumbai 1,342 34.1Munich 3,333 84.6Nairobi 1,913 48.6New York 3,938 100Nicosia 2,517 63.9Oslo 4,569 116.0Paris 3,304 83.9Prague 2,138 54.3Riga 2,145 54.5Rio de Janeiro 2,409 61.2Rome 3,116 79.1Santiago de Chile 2,080 52.8São Paulo 2,431 61.7Seoul 2,672 67.8Shanghai 2,211 56.1Sofia 1,667 42.3Stockholm 3,621 91.9Sydney 3,294 83.6Taipei 2,513 63.8Tallinn 2,294 58.2Tel Aviv 2,968 75.4Tokyo 4,289 108.9Toronto 2,926 74.3Vienna 3,202 81.3Vilnius 2,002 50.8Warsaw 2,113 53.7Zurich 4,334 110.1
Monthly spending highest in OsloOslo’s inhabitants spend the most on average on goods and services each month� Outlays for our reference basket of goods in the Norwegian capital amount to 4,573 US dollars and are thus some 68% higher than the world average (2,720 US dollars) and three and a half times as high as in Delhi (1,307 US dollars), the cheapest city in the comparison�
The median value (that divides the list of outlays into two equal halves) of 2,686 US dollars shows that monthly consumer spending is above the global average in around half of the cities, and below it in the other half� There are regional trends, however� For example, average prices in all Western European cities apart from Athens and Lisbon and in the metropo-lises of North America and Oceania are above the world average, while those in Eastern Europe, Africa and South America, with the exception of Caracas, are below it�
In Western Europe the entire basket of goods and services costs an average of 3,335 US dollars and is therefore some 77% more expensive than in Africa and 57% more expensive than in Eastern Europe� There are only minor differences compared with North America and Oceania. Asia is the most heterogeneous region in terms of prices� The continent is represented at both extremes of the price list: Tokyo ranks high, while Delhi and Mumbai rank low�
Greatest disparity among prices of non-tradable goodsIn contrast to foodstuffs, clothes and electronics products, many services are not traded internationally� Non-tradable goods such as haircuts, cleaning services or even taxi journeys are therefore closely tied to local wage levels� Such services are much cheaper in lower-wage regions than in places like Switzerland or North America where wages are highest� The price range for services is also much wider than for goods that can be traded internationally. The cost of domestic help differs by up to 81% from the international average, for example, while the price of a personal computer differs by just 23%.
MethodologyCost of a basket of 122 goods and services weighted according to European consumption habits�
1 Monthly spending of an average European family

Prices and earnings 2012 1515
Price comparison
Pric
e co
mpa
riso
n
Food prices
City USD 1Index
New York = 100Amsterdam 364 66.0Athens 390 70.7Auckland 497 90.0Bangkok 422 76.5Barcelona 394 71.3Beijing 463 83.9Berlin 389 70.5Bogotá 363 65.8Bratislava 345 62.4Brussels 434 78.5Bucharest 244 44.2Budapest 341 61.7Buenos Aires 310 56.2Cairo 300 54.4Caracas 689 124.9Chicago 460 83.3Copenhagen 567 102.8Delhi 208 37.7Doha 355 64.4Dubai 485 87.8Dublin 455 82.3Frankfurt 439 79.6Geneva 714 129.4Helsinki 497 90.1Hong Kong 651 117.9Istanbul 430 77.9Jakarta 369 66.9Johannesburg 311 56.3Kiev 263 47.6Kuala Lumpur 346 62.7Lima 304 55.0Lisbon 311 56.3Ljubljana 368 66.7London 436 79.0Los Angeles 502 90.9Luxembourg 525 95.0Lyon 477 86.4Madrid 432 78.3Manama 278 50.4Manila 293 53.0Mexico City 260 47.1Miami 499 90.4Milan 487 88.2Montreal 519 94.1Moscow 314 56.9Mumbai 186 33.7Munich 500 90.5Nairobi 292 52.8New York 552 100Nicosia 370 67.0Oslo 599 108.6Paris 523 94.7Prague 295 53.5Riga 316 57.3Rio de Janeiro 354 64.2Rome 497 90.0Santiago de Chile 348 63.1São Paulo 379 68.7Seoul 629 114.0Shanghai 404 73.2Sofia 265 48.0Stockholm 553 100.2Sydney 509 92.1Taipei 448 81.1Tallinn 333 60.4Tel Aviv 477 86.3Tokyo 927 168.0Toronto 453 82.1Vienna 504 91.2Vilnius 284 51.4Warsaw 291 52.7Zurich 704 127.5
Food prices
Food most expensive in Tokyo, Zurich and GenevaThe average global cost of our food basket, comprising 39 different prod-ucts, is 424 US dollars� Our survey takes account of monthly spending for food weighted according to consumption, with important food staples being given a higher weighting�
Food is most expensive in Tokyo (928 US dollars), Geneva (715 US dollars) and Zurich (704 US dollars), and is cheapest in the Indian cities of Mumbai (186 US dollars) and Delhi (208 US dollars)� While a kilo of bread costs an average of 3.20 US dollars in Zurich, this figure is only 0.60 US dollars in Delhi� And while in Tokyo you can expect to pay 2�90 US dollars for a liter of milk, this can be purchased for a mere 0�80 US dollars in Mumbai�
These examples clearly demonstrate how greatly spending varies within individual regions. In Asia, residents of Tokyo pay around five times more for the basket of food than the inhabitants of Mumbai� Price levels are rela-tively uniform within the Oceania, Africa and North America regions: Africa lies at the bottom end of the regional comparison with average spending of 301 US dollars, while Oceania ranks at the upper end with average spend-ing of 503 US dollars�
Average food costs have increased by around 11% since 2009 when mea-sured in US dollars� In some countries, price increases of nearly 50% were observed� For example, monthly expenditure for food has increased by 46% in Kuala Lumpur, by 40% in Auckland and by 40% in Johannesburg� A reason for this large price increase is likely to be the strong appreciation of the respective currencies during the last three years versus the US dollar�
MethodologyCost of a basket of goods containing 39 food items weighted according to European consumption habits�
1 Monthly expenditure of an average European family

Prices and earnings 20121616
Price comparison
Prices for women’s and men’s clothing
Manila an attractive shopping destinationIn Manila, a couple can buy a new wardrobe for 410 US dollars� A complete outfit in the mid-priced segment here costs 140 US dollars for women and 270 US dollars for men� Such a joint shopping trip in Tokyo, however, will cost more than seven times as much. At 1,220 US dollars, women come off slightly better than men, who have to pay 1,880 US dollars for a complete outfit in the Japanese capital.
In a global comparison, Africa and South America remain the cheapest regions for purchasing clothing, while Western Europe and North America are the most expensive. The largest price differentials can be found in Asia and the Middle East. After Tokyo, the second-most expensive shopping destination is Dubai. Complete outfits for men and women cost a com-bined total of 2,720 US dollars here� A further 500 kilometers to the west in Manama, the same clothing can be purchased for 900 US dollars�
Outside Rome, there is nowhere in the world where men can buy clothing cheaper than women. The difference is particularly marked in Tokyo and Oslo� In Vilnius, however, male and female customers pay almost the same�
Clothing
City
Women’sclothing 1
USD
Men’sclothing 2
USD
Index
New York = 100Amsterdam 690 1,040 110.8Athens 630 1,110 112.5Auckland 560 670 79.2Bangkok 400 600 64.2Barcelona 580 1,110 109.2Beijing 660 700 87.5Berlin 570 710 82.5Bogotá 310 440 48.3Bratislava 250 340 37.5Brussels 630 800 92.5Bucharest 180 300 30.8Budapest 580 920 96.7Buenos Aires 400 660 68.3Cairo 380 430 51.7Caracas 520 950 94.2Chicago 740 1,200 125.0Copenhagen 950 1,150 135.0Delhi 260 410 43.3Doha 340 470 51.7Dubai 1,270 1,450 175.0Dublin 470 600 68.3Frankfurt 840 890 111.7Geneva 850 1,150 129.2Helsinki 610 1,200 116.7Hong Kong 390 620 65.0Istanbul 630 880 97.5Jakarta 190 390 37.5Johannesburg 310 400 45.8Kiev 430 600 65.8Kuala Lumpur 230 540 50.0Lima 310 470 50.0Lisbon 390 510 57.5Ljubljana 560 1,000 100London 480 800 82.5Los Angeles 710 1,240 125.8Luxembourg 960 1,440 154.2Lyon 740 1,180 123.3Madrid 580 910 95.8Manama 390 510 57.5Manila 140 270 26.7Mexico City 620 930 100.0Miami 630 880 97.5Milan 870 1,170 130.8Montreal 630 1,100 111.7Moscow 820 1,040 119.2Mumbai 320 540 55.8Munich 830 1,130 125.8Nairobi 220 280 32.5New York 570 980 100Nicosia 630 950 101.7Oslo 840 1,450 147.5Paris 1,020 1,410 156.7Prague 250 530 50.0Riga 440 570 65.0Rio de Janeiro 230 350 37.5Rome 910 830 111.7Santiago de Chile 360 610 62.5São Paulo 300 600 57.5Seoul 220 300 33.3Shanghai 400 960 87.5Sofia 270 430 45.0Stockholm 760 1,240 129.2Sydney 580 820 90.0Taipei 980 1,070 132.5Tallinn 610 830 92.5Tel Aviv 440 580 65.8Tokyo 1,220 1,880 199.2Toronto 310 840 74.2Vienna 980 1,040 130.0Vilnius 480 510 63.3Warsaw 580 950 98.3Zurich 1,100 1,190 147.5
MethodologyThe prices quoted are based on purchases of good quality clothing in large department stores, not in specialized shops or boutiques and not designer articles. The combination of the clothing basket influences in part the price difference between women’s and men’s clothing.
1 Complete women’s wardrobe, consisting of a (two-piece) suit, blazer/jacket, dress, pantyhose and a pair of outdoor shoes
2 Complete men’s wardrobe, consisting of a suit, blazer/jacket, shirt, jeans, socks and a pair of outdoor shoes

Prices and earnings 2012 1717
Price comparison
Pric
e co
mpa
riso
n
Electronics and household appliances
City USD 1Index
New York = 100Amsterdam 4,960 125.3Athens 4,620 116.6Auckland 4,450 112.3Bangkok 4,370 110.3Barcelona 5,000 126.3Beijing 4,370 110.5Berlin 4,670 117.9Bogotá 4,170 105.3Bratislava 4,740 119.8Brussels 4,580 115.7Budapest 5,270 133.0Buenos Aires 5,170 130.5Bucharest 3,830 96.6Caracas 8,460 213.6Chicago 4,270 107.8Delhi 4,590 115.9Doha 3,790 95.8Dubai 4,550 114.9Dublin 5,160 130.4Frankfurt 5,510 139.1Geneva 5,330 134.7Helsinki 5,400 136.4Hong Kong 4,770 120.4Istanbul 5,490 138.6Jakarta 4,460 112.7Johannesburg 3,800 95.9Cairo 4,220 106.5Kiev 4,140 104.4Copenhagen 5,060 127.8Kuala Lumpur 4,300 108.7Lima 4,480 113.1Lisbon 5,180 130.9Ljubljana 4,970 125.4London 4,910 124.0Los Angeles 3,590 90.7Luxembourg 4,660 117.7Lyon 4,540 114.7Madrid 4,940 124.7Milan 4,790 121.0Manama 3,810 96.3Manila 5,630 142.2Mexico City 4,580 115.7Miami 3,580 90.3Montreal 4,610 116.3Moscow 5,050 127.6Mumbai 3,610 91.2Munich 4,770 120.5Nairobi 4,340 109.5New York 3,960 100Nicosia 5,480 138.3Oslo 5,190 131.1Paris 5,030 127.0Prague 4,900 123.6Riga 4,460 112.7Rio de Janeiro 5,400 136.5Rome 5,190 131.0Santiago de Chile 4,520 114.2São Paulo 5,010 126.5Seoul 4,790 120.8Shanghai 3,950 99.8Sofia 3,890 98.2Stockholm 4,950 125.0Sydney 5,210 131.6Taipei 4,290 108.3Tallinn 5,200 131.4Tel Aviv 5,740 145.0Tokyo 4,820 121.7Toronto 4,520 114.3Vilnius 4,770 120.3Warsaw 4,410 111.4Vienna 5,560 140.4Zurich 5,130 129.5
Prices of home electronics and household appliances
US, Africa and Asia attractiveElectronics in particular have seen rapid advances in terms of product devel-opment� With this in mind, we have added a notebook to our basket of consumer electronics and household appliances from 2009 and replaced the iPod nano with the iPhone 4S�
Appliances and electronics are most expensive in Caracas (8,460 US dollars), while the basket is cheapest in Miami (3,580 US dollars) and Los Angeles (3,590 US dollars)� The vastly higher price in Caracas is due in part to the high level of overall price inflation, and even the depreciation of the bolivar fuerte against the US dollar since 2009 was not enough to compen-sate for the price difference.
Whereas in the US, Europe and Asia electronics goods are viewed as products for daily use, in Africa and other parts of the world they have the status of luxury items� The electronics basket costs 3,610 US dollars in Mumbai, only slightly more than the 3,590 US dollars it costs in Los Ange-les, but based on the respective net hourly wages and assuming a standard 45-hour week, an employee in Mumbai would have to work for around 8.5 weeks longer to be able to afford it. Western Europe, where the basket costs an average of 5,006 US dollars, is at the upper end of the price list and is therefore not an attractive shopping destination for electronics goods compared to other regions�
It is striking that there is less disparity in the prices of personal computers, televisions, iPhones, cameras and notebooks relative to the average than in the prices of frying pans, refrigerators, vacuum cleaners and hairdryers� The supply of the former is dominated more strongly by a small number of global brands, while the latter are sold by a larger number of small, local manufacturers�
The law of one price for homogeneous goodsApart from the Big Mac, the iPhone is the only homogeneous product within the entire “Prices and Earnings” reference basket� In a fully inte-grated market, competition should ensure that a homogeneous product is traded at the same price worldwide� However, the law of one price is undermined by a range of factors such as import duties, transaction costs and the existence of different providers. Nevertheless, prices for the iPhone vary by just 17% from the international average, the smallest price differen-tial of all goods�
MethodologyCost of a basket comprising refrigerator, television (40-inch LED), iPhone 4S (16GB), digital camera, vacuum cleaner, frying pan, hairdryer, PC and note-book�
1 Prices over the period of the survey (end of April to end of May 2012)

Prices and earnings 20121818
Price comparison
Housing
Heterogeneous housing market The structures of local housing markets are driven by regional peculiarities and demographic trends� Skyscrapers, semi-tim-bered houses and log cabins are just a few of the types of housing that characterize the US, Europe and Africa� In order to paint as accurate a picture of the global housing market as possible, we examined the following four categories: monthly rents for furnished four-room apartments, unfurnished three-room apartments, apartments typical for the city in question and purchase prices per square meter for apartments of a size typical for the city. While the first two apartment types corre-spond to Western standards, the last two are characterized by local patterns� Asking prices were determined for four and three-room apartments and purchase prices per square meter, while long-term average rents were used for apartments typi-cal for the city� Asking prices were used for new rentals and are equivalent to the current market price� Long-term average rents are used in the case of properties that are already occu-pied and may differ from current market prices, especially in the case of long-standing tenancies�
Furnished four-room apartmentFour-room apartments were built after 1980 and offer a level of comfort targeted at employees with a mid-level manage-ment function�
The global average cost of such an apartment is around 2,630 US dollars per month� The price range is immense, and large price differences can be observed even within individual cities.
Rents in Hong Kong, Helsinki, New York and Tokyo are the highest in all three price ranges analyzed� On average, the rent for properties in a top location in Hong Kong is 14,490 US dollars per month, and in New York 14,100 US dollars per month�
Unfurnished three-room apartmentUnfurnished three-room apartments are located in middle-class residential areas near the city�
A large difference in rents can be observed here as well. Com-pared with the global average of 1,540 US dollars, New York tops the list with a rental price of 4,300 US dollars per month� Rent is cheapest on average for a three-room apartment in Sofia, at a price of 450 US dollars per month.
Locally typical rental pricesRents typical for a city reflect the average monthly housing costs for a local family� They are guidance values for apart-ments which are typical for the city in question in terms of fur-nishing standard, size and location�
From a regional perspective, Eastern Europe and Africa have the most favorable housing conditions� The highest rents typi-cal for a city are paid in North America, the Middle East and Western Europe� The cities of New York, Dubai and Zurich, in particular, have the highest average rental prices, where monthly rents are a good 60–100% above the regional average�
Purchase price per square meterThe purchase price per square meter is the guidance value for purchasing a residential property of a size typical for the city and in an average location�
Here, too, the price differences within individual regions are very large� People in Switzerland who want to realize their dream of owning their own home have to dig the deepest into their pockets, with a square meter costing 11,860 US dollars in Geneva and 11,720 US dollars in Zurich� The cost is a good 16 times lower in Mumbai, where the average price per square meter is 710 US dollars�
Supply and demand determine apartment pricesEven though the positions were described as precisely as pos-sible in the questionnaire, the prices identified will always be subject to subjective components. Since differences in price always reflect differences in quality, a direct comparison is only possible to a limited extent� However, interesting patterns have been discernible in rental price developments since 2009 that show just how strongly supply and demand influence the housing market� For example, rents in Bangkok have risen dra-matically� Local participants in the study report that high gas prices have prompted many consumers to start making increased use of public transport instead of cars� This fuels demand for apartments located near train stations, which in turn pushes up the prices of such apartments� In Mumbai, by contrast, increased immigration of workers is responsible for the rise in rents� In Zurich the high rental prices is a direct reflection of the low vacancy rate of under 0.1%.

Prices and earnings 2012 19
Price comparison
Pric
e co
mpa
riso
n
MethodologyAverage cost of hous-ing per month, which an apartment seeker would expect to pay on the free market at the time of the survey�
1 Rental prices (monthly gross rents) are based on apartments built after 1980 (4 rooms, kitchen, bathroom, with garage) including all ancillary costs� The living comfort meets the needs of employees with a mid-level man-agement function in areas favored by them
2 Rental prices (monthly gross rents) are based on apartments built after 1980 (3 rooms, kitchen, bathroom, with garage) including all ancillary costs with an average comfort customary in the local-ity and near the city center
3 The figures given are merely tentative values for average rent prices (monthly gross rents) for a majority of local households
4 The figures given are merely tentative values for average purchase prices per square meter� The purchase prices are based on apartments built after 1980 of a size typical for the city, with an average comfort customary in the locality and near the city center
Housing prices
Furnished 4-room apartment 1
price rangeUnfurnished 3-room apartment 2
price rangeNormal local
rent 3Normal local
purchase price 4 per m2
Cityexpensive
USDmedium
USDcheap
USDexpensive
USDmedium
USDcheap
USDmedium
USDmedium
USDAmsterdam 3,760 2,330 1,750 2,330 1,580 1,100 1,110 3,900Athens 1,940 1,490 1,170 910 650 530 880 2,410Auckland 3,770 1,640 1,270 2,360 1,330 820 1,020 3,540Bangkok 2,250 1,460 880 1,630 930 600 410 2,860Barcelona 2,090 1,270 950 1,520 1,090 740 980 3,760Beijing 2,500 1,550 1,010 1,640 660 430 310 3,250Berlin 3,340 2,400 1,750 2,070 1,180 890 840 2,910Bogotá 3,240 1,550 800 1,590 840 390 630 1,960Bratislava 2,620 1,680 1,070 1,280 840 620 410 2,090Brussels 3,630 2,540 1,810 3,120 1,840 1,270 1,240 3,200Bucharest 1,280 980 690 790 530 410 390 1,170Budapest 3,350 2,120 1,420 2,160 1,170 760 560 2,120Buenos Aires 2,050 1,360 1,070 910 740 540 400 1,460Cairo 2,070 1,110 630 1,000 490 230 170 1,410Caracas 6,000 3,820 2,250 4,230 2,780 1,620 2,100 3,260Chicago 6,940 3,540 1,990 3,300 2,210 1,100 1,400 3,170Copenhagen 3,040 2,620 1,960 2,420 1,740 1,130 1,100 4,180Delhi 2,890 870 390 1,530 560 260 470 1,490Doha 6,240 4,870 3,680 3,570 3,000 2,250 1,740 2,750Dubai 7,300 4,880 2,430 4,970 3,480 2,340 2,450 3,950Dublin 3,240 2,330 1,550 2,530 1,590 1,190 1,550 3,700Frankfurt 3,410 2,370 1,740 2,240 1,640 1,170 1,280 3,740Geneva 6,410 4,700 3,280 3,630 2,430 1,640 1,570 11,860Helsinki 10,360 8,680 7,510 1,720 1,440 1,280 1,440 5,120Hong Kong 14,490 9,660 4,830 11,970 4,220 2,090 1,800 8,330Istanbul 6,890 3,150 1,540 2,190 1,480 890 1,280 1,970Jakarta 3,510 2,720 2,020 1,660 1,090 710 670 1,610Johannesburg 2,980 2,160 1,240 1,540 1,300 890 740 1,370Kiev 2,980 1,630 930 1,500 850 620 560 1,460Kuala Lumpur 2,180 1,260 760 870 620 340 780 1,370Lima 1,800 1,500 890 1,190 540 280 490 800Lisbon 2,330 1,310 780 1,750 1,180 740 1,100 2,650Ljubljana 2,760 1,770 1,100 1,520 1,020 780 480 3,160London 8,560 4,830 2,820 5,400 3,260 2,010 1,980 8,070Los Angeles 3,720 2,560 2,180 2,360 1,880 1,400 1,200 3,300Luxembourg 3,420 2,310 1,630 2,760 1,840 1,500 1,810 5,440Lyon 1,980 1,550 1,170 1,550 1,220 820 950 4,600Madrid 2,890 1,300 1,110 1,440 1,060 800 1,050 3,100Manama 3,650 2,490 1,580 1,660 1,280 870 910 1,700Manila 2,470 1,440 950 830 510 270 190 1,640Mexico City 2,270 1,400 580 1,480 980 450 740 1,370Miami 8,500 2,690 1,630 4,120 1,930 1,040 1,520 3,630Milan 4,680 2,860 2,320 2,850 1,810 1,540 1,260 4,300Montreal 3,630 2,270 1,350 2,620 1,740 1,150 1,360 3,220Moscow 5,920 3,640 2,620 3,720 2,780 1,800 850 5,020Mumbai 2,800 1,680 560 2,210 800 350 450 710Munich 4,140 2,500 1,790 2,630 1,810 1,330 970 5,220Nairobi 3,020 2,380 1,310 2,070 1,230 320 480 1,310New York 14,100 7,240 3,680 10,310 4,300 1,970 3,350 11,060Nicosia 3,340 1,880 1,050 1,750 930 540 920 3,040Oslo 4,010 3,250 2,210 3,250 2,210 1,790 1,970 7,360Paris 4,660 3,250 2,490 3,340 2,280 1,390 1,670 10,810Prague 1,850 1,230 920 1,110 870 700 730 2,950Riga 2,490 930 530 1,270 840 450 470 2,680Rio de Janeiro 4,580 3,200 1,970 2,230 1,320 970 760 3,700Rome 4,400 3,240 1,550 2,420 2,030 1,460 1,810 5,180Santiago de Chile 3,190 2,340 1,710 1,400 1,020 710 670 1,760São Paulo 3,950 2,810 1,900 1,920 1,580 970 850 3,500Seoul 4,870 3,440 1,750 3,940 2,640 1,850 2,180 4,740Shanghai 2,950 1,420 970 1,580 920 710 710 3,790Sofia 1,060 760 560 620 450 360 340 1,060Stockholm 3,170 2,530 1,960 2,310 1,830 1,300 1,180 6,710Sydney 7,740 4,180 3,130 2,820 2,180 1,400 1,640 4,350Taipei 3,410 2,430 1,420 2,640 1,700 1,040 950 6,410Tallinn 1,490 980 620 970 710 450 450 2,720Tel Aviv 3,240 2,580 1,790 2,210 1,710 1,200 1,280 6,110Tokyo 11,110 6,180 3,910 5,010 2,490 1,190 1,630 9,490Toronto 3,600 2,560 1,590 2,360 2,020 1,150 1,090 2,680Vienna 3,730 2,490 1,810 1,860 1,420 1,100 950 3,460Vilnius 1,460 980 690 730 490 350 320 1,680Warsaw 2,140 1,620 1,060 1,610 1,200 830 710 2,890Zurich 5,840 4,480 2,680 4,010 2,500 1,800 2,550 11,720

Prices and earnings 20122020
Price comparison
Public transport
Cheapest in Africa and South AmericaThe prices for public transport are cheapest in Africa, South America and Asia� It costs most to travel by bus, tram or subway, taxi and train in Western Europe and North America. While the first two categories are offered in all of the cities included in the study, there are substantial differences above all in rail network standards. In many regions of the world, and in Western Europe in particular, the rail network is extensive and well developed� Some cities in South America and in the Middle East, by contrast, are still not connected to a rail network�
Highest prices for the bus, tram or subway in North American citiesIn Oslo and Copenhagen, a journey of ten kilometers or ten stops with the bus, tram or subway costs over 4�80 US dollars� This cost is nearly the same in Zurich and Stockholm� In other places, this amount could take you the full distance across Switzerland of 350 km� For example, in Mumbai travelling a distance of 10 km costs just 0�13 dollars�
Taxi rides in Switzerland are expensiveIn Zurich or Geneva, you might think twice about taking a taxi to get to your destination. In both cities a five-kilometer inner-city trip during the day costs around 28 US dollars� The global average, by contrast, is approxima tely 10 US dollars� In Cairo the same distance by taxi costs just 1.49 US dollars – the cheapest taxi price in our survey.
Train travel in Germany and London about 70 percent above the Western European averageIn Germany, a second class train journey over 200 kilometers costs an average of 79 US dollars – around 65% more than the Western European average� At 87 US dollars, Frankfurt is the most expensive departure destination� Rail tickets in London are not much less expensive than in Frankfurt at 82 US dollars. The differences in North America are also enormous� A 200-kilometer train journey in New York costs around 86 US dollars – a good 78% more than the North American average. At under 4 US dollars, it is cheapest to travel by train in the Asia cities of Jakarta, Mumbai and Bangkok�
Public transport
City
Bus, Tramor Metro 1
USDTaxi 2
USD
Train 3
USDAmsterdam 3.19 16.34 30.05Athens 1.81 5.50 13.81Auckland 2.57 13.62 40.86Bangkok 0.75 2.47 3.47Barcelona 2.59 10.36 41.96Beijing 0.26 3.64 14.25Berlin 2.98 10.79 80.30Bogotá 0.84 2.81 n.a.Bratislava 1.08 5.61 22.97Brussels 2.42 15.71 26.03Bucharest 0.75 3.17 9.43Budapest 1.43 7.64 15.96Buenos Aires 0.28 7.97 n.a.Cairo 0.19 1.49 5.24Caracas 0.35 11.65 n.a.Chicago 2.25 12.50 34.99Copenhagen 4.88 17.33 59.92Delhi 0.25 1.95 10.58Doha 1.14 4.12 n.a.Dubai 0.54 8.17 n.a.Dublin 2.74 14.89 34.53Frankfurt 3.24 16.23 86.77Geneva 3.67 27.78 58.23Helsinki 3.28 12.71 34.83Hong Kong 1.33 3.99 20.48Istanbul 0.95 8.94 15.84Jakarta 0.38 2.93 2.64Johannesburg 1.25 4.07 15.59Kiev 0.25 4.56 12.15Kuala Lumpur 0.68 2.44 7.06Lima 0.47 4.52 n.a.Lisbon 1.83 11.50 27.63Ljubljana 2.03 7.25 18.49London 3.70 23.03 81.95Los Angeles 1.50 25.06 34.33Luxembourg 1.94 19.43 54.13Lyon 2.07 13.08 40.02Madrid 1.94 13.27 44.51Manama 0.80 11.52 n.a.Manila 0.34 2.88 5.58Mexico City 0.37 3.60 n.a.Miami 1.83 15.32 27.33Milan 1.94 16.84 34.75Montreal 2.87 12.98 70.58Moscow 0.85 13.24 10.56Mumbai 0.13 1.76 2.72Munich 3.24 18.04 71.23Nairobi 0.54 7.16 35.80New York 2.42 8.50 85.98Nicosia 1.45 9.31 n.a.Oslo 5.12 23.22 48.58Paris 2.16 9.39 42.87Prague 1.37 8.05 12.78Riga 1.30 6.34 9.23Rio de Janeiro 1.56 7.29 n.a.Rome 1.94 9.38 36.69Santiago de Chile 1.17 7.13 6.49São Paulo 1.53 6.83 n.a.Seoul 0.90 3.40 17.54Shanghai 0.58 3.64 10.40Sofia 0.66 2.00 6.62Stockholm 4.52 24.64 41.60Sydney 3.43 9.75 39.35Taipei 0.68 4.37 11.25Tallinn 1.81 5.86 9.79Tel Aviv 1.72 13.57 16.95Tokyo 2.46 21.42 44.72Toronto 3.08 13.31 35.62Vienna 2.59 17.27 42.03Vilnius 0.94 4.63 13.73Warsaw 0.79 3.15 14.62Zurich 4.66 28.93 68.47
1 Price of a single ticket for public transport (bus, tram or subway) for a journey of approximately 10 kilometers/6 miles or at least 10 stops
2 Price for a distance of 5 kilometers/3 miles during the day within the city limits, including service
3 Price of a single ticket (2nd class) for a train journey of 200 kilometers
n�a� = not available

Prices and earnings 2012 21
Price comparison
Pric
e co
mpa
riso
n
Car prices and maintenance costs 2, 3
City Mid-price carPrice 1
USDTax 2
USDFuel 3
USDAmsterdam VW Golf, Easyline 24,000 689 1.80Athens Opel Astra Sedan 1.8 24,900 389 2.02Auckland Holden Cruze 23,900 226 1.33Bangkok Toyota Altis 1.8 29,600 103 1.00Barcelona Renault Megane 26,900 177 1.77Beijing Toyota Corolla 23,800 67 1.24Berlin Audi A4 2.0 35,600 246 2.10Bogotá Chevrolet Aveo Sedan 1.6 20,200 303 1.24Bratislava Skoda Octavia 2.0 TDI 26,700 65 1.93Brussels Renault Megane 1.6 23,200 500 1.91Bucharest Dacia Logan Sandero 1.6 11,700 36 1.90Budapest Ford Focus 1.6 22,600 76 1.95Buenos Aires Renault Sandero 1.6 20,200 307 1.27Cairo Kia Cerato 1.6 21,500 50 0.15Caracas Chevrolet Aveo 49,000 18 0.01Chicago Toyota Camry 22,100 95 1.11Copenhagen Ford Mondeo M5 Trend 2.0 63,400 641 1.99Delhi Honda City 15,300 93 0.77Doha Nissan Tiida 1.8 17,000 27 0.24Dubai Toyota Camry 23,100 94 1.01Dublin Ford Focus 32,000 427 2.01Frankfurt VW Passat Trendline 36,800 78 1.89Geneva VW Golf VI Trendline 25,200 135 2.04Helsinki Toyota Avensis 1.8 34,600 152 1.97Hong Kong VW Golf 2.5 23,800 509 1.65Istanbul Renault Fluence 1.5 34,600 1,189 2.37Jakarta Honda Civic 47,800 717 0.76Johannesburg VW Golf 35,500 56 1.45Kiev Skoda Octavia 24,900 – 1.22Kuala Lumpur Proton Inspira 1.8 25,700 91 0.59Lima Toyota Yaris 19,300 95 1.36Lisbon Renault Megane 1.6 38,100 181 1.95Ljubljana Skoda Octavia 2.0 24,600 140 1.71London Audi A3 28,000 217 2.40Los Angeles Honda Civic 30,100 296 1.13Luxembourg Audi A3 31,100 118 1.60Lyon Renault Megane 30,400 – 1.84Madrid Renault Megane 21,600 177 1.76Manama Toyota Corolla 18,600 93 0.93Manila Toyota Vios 1.3 17,400 47 1.02Mexico City Nissan Sentra 19,400 28 0.81Miami Nissan Maxima 32,400 98 1.05Milan VW Polo 1.2 TDI 18,800 186 2.24Montreal Ford Fusion 21,400 308 1.33Moscow Nissan Tiida 1.8 21,200 73 0.93Mumbai Maruti Suzuki Dzire 11,500 754 0.91Munich VW Passat Comfortline 1.8 38,400 150 1.86Nairobi Toyota Corolla 23,900 – 1.29New York Nissan Altima 20,500 100 1.15Nicosia Toyota Corolla 1.6 24,600 74 1.67Oslo Toyota Auris 42,700 574 2.37Paris Peugeot 308 2.0 33,700 486 1.89Prague Skoda Octavia 27,800 116 1.88Riga Toyota Corolla 29,700 98 1.76Rio de Janeiro Chevrolet Corsa 16,100 357 0.88Rome Alfa Romeo Giulietta 2.0 32,400 389 2.27Santiago de Chile Toyota Yaris 1500 13,400 255 1.24São Paulo Chevrolet Cobalt 1.8 23,700 485 1.28Seoul Hyundai i40 26,000 523 1.56Shanghai Volkswagen, Sagitar 1.8 29,400 76 1.26Sofia Toyota Avensis 27,700 119 1.71Stockholm Volvo S60 36,400 334 2.14Sydney Honda Jazz 22,200 245 1.50Taipei Toyota Corolla Altis 1.8 E 22,400 382 1.10Tallinn Renault Megane 21,200 – 1.72Tel Aviv Mazda Spirit 3 33,900 413 2.14Tokyo Mazda Atenza 26,300 495 1.62Toronto Honda Civic Sedan DX 15,000 75 1.25Vienna VW Golf 29,800 453 1.80Vilnius Skoda Octavia 1.6 23,700 – 1.72Warsaw Opel Astra III 25,000 55 1.76Zurich VW Golf 6 GTI 45,200 426 2.01
1 Purchase price (including sales taxes) of a popular mid-range car (5-door, standard equipment)
2 Annual vehicle tax and/or annual registration fee
3 Gas price per liter at the time of the survey (end of April to end of May 2012)

Prices and earnings 201222
Price comparison
Restaurant and hotel prices
Exclusive nights in vibrant citiesNew York and Tokyo, two cities that never sleep, are the most expensive places to spend the night in luxury� Whether for a business trip or a vacation, a double room in a top-class hotel, including breakfast and service, costs 730 US dollars per night in both cities� And guests in Dubai, one of the boom cities in terms of hotel construction, pay only slightly less at 680 US dollars� The global average is 360 US dollars� The cheapest destinations for five-star standards are Bucharest (190 US dollars), Cairo (200 US dollars) and Mexico City (210 US dollars)�
Prices in the luxury hotel sector vary greatly from city to city worldwide� There are various reasons for this, such as wage levels, location, prestige and image of the hotel and city in question, while factors such as seasonal-ity, time of booking and the political and economic situation at the time of the survey also play an important role�
In terms of regions, guests in Africa pay the least for an overnight stay in a first-class hotel, with the regional average of around 250 US dollars being 31% below the global figure. The most expensive regions for an exclusive overnight stay for two are the Middle East (407 US dollars), Asia (394 US dollars) and Western Europe (379 US dollars)�
Guests in Tokyo (370 US dollars) and New York (340 US dollars) also pay the most for mid-range hotels� The cheapest cities for mid-range accommo-dation are Vilnius (90 US dollars), Sofia and Lisbon (both 80 US dollars). In the latter two cities the average price is more than 50% below the global average of 171 US dollars�
Anyone spending the night in a foreign city will usually also want to sample the local cuisine� Among all 72 cities surveyed, the average cost of a meal in a good restaurant is around 48 US dollars� This three-course meal, comprising starter, main course and dessert, and including service but excluding drinks, is most expensive in Geneva, Oslo and Dubai at more than 95 US dollars� Eating out in style was the cheapest in Delhi, Manama and Manila� In all three cities an evening meal in a good restaurant costs just 18 US dollars�
Restaurant and hotel prices
CityRestaurant 1
USDHotel***** 2
USDHotel*** 2
USDAmsterdam 51 390 200Athens 54 210 100Auckland 45 280 190Bangkok 57 320 90Barcelona 52 330 170Beijing 41 400 160Berlin 35 230 120Bogotá 26 300 140Bratislava 28 230 120Brussels 63 280 130Bucharest 26 190 100Budapest 28 410 130Buenos Aires 26 280 160Cairo 27 200 100Caracas 69 400 190Chicago 39 270 200Copenhagen 73 490 270Delhi 18 250 100Doha 63 360 200Dubai 96 680 200Dublin 56 260 130Frankfurt 69 370 130Geneva 100 620 270Helsinki 44 450 200Hong Kong 58 610 290Istanbul 44 420 240Jakarta 19 320 160Johannesburg 28 320 100Kiev 43 530 150Kuala Lumpur 58 220 120Lima 36 400 130Lisbon 45 390 80Ljubljana 32 240 140London 51 440 200Los Angeles 38 270 170Luxembourg 82 380 140Lyon 30 310 180Madrid 53 240 170Manama 18 350 170Manila 18 300 160Mexico City 31 210 130Miami 28 330 160Milan 74 320 170Montreal 52 310 210Moscow 74 530 200Mumbai 25 280 160Munich 53 340 170Nairobi 22 220 170New York 71 730 340Nicosia 34 270 140Oslo 98 410 220Paris 65 600 210Prague 58 350 120Riga 36 300 110Rio de Janeiro 23 440 180Rome 36 320 210Santiago de Chile 34 410 140São Paulo 43 470 310Seoul 61 510 240Shanghai 65 440 250Sofia 19 220 80Stockholm 69 340 180Sydney 45 350 220Taipei 63 350 120Tallinn 35 250 160Tel Aviv 40 360 180Tokyo 73 730 370Toronto 71 340 150Vienna 48 360 140Vilnius 22 220 90Warsaw 31 280 110Zurich 91 630 280
1 Price of an evening meal (three-course menu with starter, main course and dessert, excluding drinks) including service in a good restaurant
2 Price for a double room with bathtub and WC, including breakfast for two people and service, in a first-class international hotel or a good mid-range hotel

Prices and earnings 2012 23
Price comparison
Pric
e co
mpa
riso
n
Price of a city break
City USDIndex
New York = 100Amsterdam 720 60.6Athens 590 50.0Auckland 580 48.7Bangkok 550 46.5Barcelona 740 62.2Beijing 730 62.0Berlin 720 60.4Bogotá 540 46.1Bratislava 490 41.3Brussels 730 61.5Bucharest 370 31.0Budapest 740 62.2Buenos Aires 620 52.8Cairo 420 35.8Caracas 830 70.2Chicago 540 45.5Copenhagen 1,060 89.8Delhi 370 31.3Doha 690 58.5Dubai 1,120 94.6Dublin 580 49.4Frankfurt 950 79.9Geneva 1,220 102.8Helsinki 960 81.5Hong Kong 970 81.8Istanbul 720 60.6Jakarta 500 42.3Johannesburg 490 41.6Kiev 930 78.9Kuala Lumpur 500 42.6Lima 600 50.9Lisbon 720 60.8Ljubljana 550 46.3London 930 78.3Los Angeles 520 44.3Luxembourg 970 81.9Lyon 740 62.5Madrid 590 50.2Manama 530 44.5Manila 450 38.4Mexico City 440 37.1Miami 560 47.7Milan 770 65.0Montreal 720 60.6Moscow 970 81.6Mumbai 400 33.8Munich 800 67.5Nairobi 490 41.4New York 1,180 100Nicosia 490 41.5Oslo 1,000 84.5Paris 1,100 92.9Prague 740 62.6Riga 580 48.7Rio de Janeiro 710 60.2Rome 650 54.6Santiago de Chile 630 53.4São Paulo 770 65.2Seoul 780 66.1Shanghai 740 63.0Sofia 420 35.7Stockholm 810 68.2Sydney 690 57.9Taipei 650 54.6Tallinn 490 41.2Tel Aviv 600 50.4Tokyo 1,190 100.5Toronto 680 57.5Vienna 830 69.9Vilnius 410 35.0Warsaw 650 54.9Zurich 1,250 105.4
Price of a city break
Exchange rates determine the cost of city breaksTo give the clearest possible picture of the cost of a city break for two peo-ple, we put together a basket of ten goods and services� In addition to an overnight stay for two people in a first-class hotel, the basket contains an evening meal for two people including a bottle of red wine, a taxi ride, use of public transport, car hire and the cost of a paperback book, a telephone call and postage�
Weekend travelers generally stay within their own continent� It is therefore particularly interesting to compare the spending on trips to neighboring regions�
The strong Swiss franc means that a weekend in Zurich or Geneva is par-ticularly expensive for tourists from the Eurozone. The effect of strong exchange rates is also felt in North America� In 2009 short breaks to the United States were even more expensive than trips to Canada� In 2012, however, a similar package costs on average 160 US dollars more in Toronto and Montreal than in the US cities of Los Angeles, Miami and Chicago� The Canadian dollar has risen some 26% against the US dollar between 2009 and 2012� The exception is New York, which as in 2009 is the most expensive destination in North America�
The global average cost of a short break is around 710 US dollars� While tourists in Zurich can expect costs of around 1,300 US dollars, visitors to Bucharest spend less than 400 US dollars� As in 2009, the most expensive regions for city breaks are Western Europe (850 US dollars), North America (700 US dollars) and the Middle East (690 US dollars)� The least expensive regions are Eastern Europe (610 US dollars) and Africa (470 US dollars)� Asia, South America and Oceania are in the middle of the rankings�
NoteThe prices do not include the cost of any travel to and from the destination�
MethodologyExpenditure includes two evening meals with wine, an overnight hotel stay for two people, the cost of a hire car (100 kilometers), public transport and taxi and miscellaneous minor expenses (telephone call, paperback book, etc�)�

Prices and earnings 201224
Price comparison
Prices of services Prices of services
City USD1
IndexNew York = 100
Amsterdam 690 69.0Athens 580 57.9Auckland 630 63.0Bangkok 440 44.0Barcelona 750 75.6Beijing 420 41.7Berlin 530 53.1Bogotá 410 41.3Bratislava 330 33.5Brussels 690 69.5Budapest 390 38.8Buenos Aires 380 38.2Bucharest 270 27.0Caracas 690 68.9Chicago 770 77.8Delhi 210 20.6Doha 860 86.9Dubai 780 78.8Dublin 720 72.3Frankfurt 710 70.8Geneva 1,080 108.1Helsinki 840 84.4Hong Kong 520 52.2Istanbul 620 62.7Jakarta 320 32.7Johannesburg 400 40.4Cairo 300 30.2Kiev 450 44.8Copenhagen 950 95.8Kuala Lumpur 400 39.8Lima 410 41.2Lisbon 570 57.1Ljubljana 490 49.2London 760 76.7Los Angeles 570 57.7Luxembourg 860 86.5Lyon 700 70.2Madrid 630 62.8Milan 710 71.3Manama 510 51.2Manila 300 29.8Mexico City 470 47.7Miami 610 61.5Montreal 690 69.1Moscow 690 69.5Mumbai 210 21.4Munich 710 71.6Nairobi 370 37.1New York 1,000 100Nicosia 490 49.1Oslo 1,270 127.6Paris 770 77.5Prague 460 45.8Riga 410 40.7Rio de Janeiro 530 53.4Rome 690 69.6Santiago de Chile 460 46.5São Paulo 540 53.8Seoul 590 59.6Shanghai 460 46.6Sofia 290 29.4Stockholm 890 89.8Sydney 680 68.5Taipei 480 48.6Tallinn 380 38.1Tel Aviv 620 62.3Tokyo 930 93.9Toronto 750 74.9Vilnius 360 35.8Warsaw 420 41.8Vienna 680 68.0Zurich 1,120 112.8
The price of services is influenced by labor costsTo compare service costs as accurately as possible, we analyzed a basket of 27 services weighted according to European consumption habits� In addi-tion to traditional spending on such things as domestic help, visits to hair-dressers and restaurants, or phone and TV charges, the basket also con-tains prices of newer everyday consumption services such as broadband Internet access, course fees for training and continuing education and tick-ets for a variety of leisure activities�
Our global prices and earnings comparison shows that where earnings are higher, service prices are also higher, and vice versa� In line with the higher wage levels in Oceania, North America and Western Europe, the basket of services is most expensive in these regions at an average of 720 US dollars� The entire basket is available most cheaply in Africa, where it costs 360 US dollars, around 40% less than the global average of 590 US dollars� Accordingly, Africa has the lowest average net hourly wage of 5�13 US dol-lars and is some 60% below the global wage level at an average of 12�27 US dollars per hour�
Haircuts for example are not tradable. Prices therefore also reflect local wage levels� According to our survey haircuts are most expensive in Oslo, where men pay 82 US Dollars and women 128 US Dollars� The cheapest haircuts are found in Mumbai, at 1�70 US Dollars for men and 4�40 US Dol-lars for women�
Local daily newspapers are cheapest in Africa and Asia, at an average of 0�50 US Dollars� People in Western Europe looking to keep up to date with current events pay around 2�30 US Dollars, while Zurich has the most expensive daily newspapers, costing 4�17 US Dollars on average�
The smallest difference in service prices is for overnight stays in high-end and mid-range hotels, with prices in both categories differing by just 35% from the global average� In contrast to other services, most hotels belong to international chains and cater primarily to foreign guests, which may explain their higher average prices�
MethodologyCost of a basket of 27 services weighted according to European consumption habits�
1 Monthly spending of an average European family

Prices and earnings 2012 25
Wage comparisonMarcel Aisslinger
drea
mst
ime.
com
Prices and earnings 201226
Wage comparison
International wage comparison
A look at the international distribution of wages reveals some surprising facts, yet also confirms the trends observed in past years� All regions posted a considerable growth in gross hourly wages on average compared with 2009� Workers in North America still earn the most, at 26�8 US dollars per hour, closely followed by their colleagues in Western Europe, at 27�4 US dollars per hour� Bringing up the rear are Asia (9�0 US dollars), Eastern Europe (7�5 US dollars) and South America (7�4 US dollars)�
When comparing wages after deduction of taxes and social security contributions, people in Zurich, Geneva and Luxem-bourg earn the most� Workers in Delhi and Manila, by contrast, are paid only 6 percent of the hourly wage in Zurich in terms of the weighted average of the 15 occupations surveyed� The cities of Zurich, Geneva, Luxembourg and New York vie for the top spot in 13 of the 15 occupations, while Manila and Cairo have the lowest net wage for five and three occupations respectively�
The largest differences within the individual occupational groups are in the public sector professions of primary school teacher and bus driver which in Cairo are paid only about 1�5 percent of the net wage earned by primary school teachers or bus drivers in Luxembourg� A smaller yet still substantial difference is evident among product managers, which in Delhi receive around 10 percent of the salary of their Zurich counterparts�
Product managers are also one of the best-paid occupations in our survey, topping the list of the most highly paid professions per city 13 times overall� Financial analysts and department managers occupy first place even more frequently, with 27 and 26 top spots respectively� The occupations with the lowest wages are female factory workers with 23 mentions and female sales assistants with 19 mentions� The trio of the lowest wages is completed by the occupation of unskilled construction worker, which brings up the rear on 14 occa-sions�
Alongside local conditions, the main reasons for the differ-ences within and across occupational groups are workers, edu-cational background and professional experience� It is no surprise, therefore, that the top earners mentioned above belong to the occupational groups with tertiary education and – at around 40,000 US dollars per year on a global average – earn considerably more than the other profiles.
The smallest wage differences are found in Stockholm, where the lowest wage (female sales assistant) is around one half of the salary of the highest wage (department head)� While in most Western European and North American cities the lowest wages are still at least one quarter of the highest ones, the wage differences in Asia, South America and the Middle East are considerably larger�
MethodologyWage comparisons are always fraught with a degree of uncer-tainty; it is extremely difficult to collect reliable data on income in some cities� Our wage and salary comparison covers 15 differ-ent occupations� The profession of financial analyst has been added since the last survey� For this year’s survey, the weighting of the individual occupational profiles has been adjusted in line with the latest figures from Eurostat on the working population so that it provides as representative a cross-section of workers in the industrial and service sector as possible� In order to provide as precise and comparable data as possible, detailed specifica-tions were made in terms of age, marital status, education and the duration of professional activity; furthermore, the data were collected from corporations which are representative accord-ing to our specifications� In addition, no data on cross-border commuters was included so as to ensure that the location of the respective salary level obtained corresponds with that of the related price level� Since we are not dealing with statistical aver-ages and the collection of wage data per occupational group and city is limited to a small number of companies, a different selection of companies could lead to different results�
Gross income: gross earnings including possible supplements such as profit sharing, performance bonuses, vacation pay, additional monthly salaries and family allowances�
Taxes: income tax taking into account marital status and standard exemptions�
Social security contributions: compulsory contributions payable by employees for statutory old age, disability and unemployment insurance as well as for state health insurance� Social security contributions also include employee contributions to occupational old age and health insurance schemes provided that they are largely typical for the city or country�
Net income: gross income less taxes and social security contributions
NoteA detailed breakdown of income and working hours for each occupational group can be found in the appendix to the electronic version of this study�www.ubs.com/research

Prices and earnings 2012 27
Wag
e co
mpa
riso
n
Wage comparison
Gross and net hourly pay in USD
CityUSD/hour
net USD/hour
gross Amsterdam 17.50 25.50Athens 10.10 13.50Auckland 16.00 19.50Bangkok 4.40 4.80Barcelona 14.80 19.40Beijing 4.50 5.60Berlin 17.70 25.80Bogotá 5.50 7.30Bratislava 6.90 9.00Brussels 15.00 26.50Bucharest 3.40 4.80Budapest 4.60 6.60Buenos Aires 6.40 7.70Cairo 3.00 3.60Caracas 5.90 6.50Chicago 20.30 27.10Copenhagen 23.50 40.10Delhi 2.10 2.50Doha 8.70 8.70Dubai 16.20 16.20Dublin 19.80 25.30Frankfurt 19.70 28.70Geneva 30.00 40.20Helsinki 18.70 26.10Hong Kong 12.50 13.90Istanbul 7.10 9.10Jakarta 2.30 2.60Johannesburg 9.80 13.50Kiev 2.80 3.40Kuala Lumpur 5.50 7.00Lima 5.80 7.20Lisbon 10.70 14.30Ljubljana 8.10 11.90London 19.00 25.90Los Angeles 20.40 28.10Luxembourg 27.60 34.30Lyon 16.30 20.90Madrid 14.60 18.50Manama 9.80 9.90Manila 2.00 2.60Mexico City 3.80 4.50Miami 20.10 26.60Milan 15.50 22.90Montreal 16.70 24.80Moscow 8.50 9.90Mumbai 2.30 2.80Munich 19.20 29.80Nairobi 2.60 3.40New York 25.20 32.60Nicosia 17.30 19.80Oslo 24.50 38.80Paris 18.50 25.40Prague 6.30 8.00Riga 5.40 7.90Rio de Janeiro 6.90 8.90Rome 12.10 17.90Santiago de Chile 5.40 7.40São Paulo 7.70 9.80Seoul 12.70 17.90Shanghai 5.40 6.80Sofia 3.40 4.50Stockholm 19.70 27.00Sydney 24.70 30.60Taipei 9.90 10.80Tallinn 7.10 9.10Tel Aviv 11.00 14.00Tokyo 22.80 30.10Toronto 17.30 25.00Vienna 17.80 26.10Vilnius 5.30 7.10Warsaw 5.50 7.70Zurich 33.40 42.70
0 5 10 15 20 4530 35 4025
Net in USD per hourGross in USD per hour
MethodologyEffective hourly wage in 15 professions, taking into account working hours, paid vacation and legal holidays; weighting according to dis-tribution of professions�

Prices and earnings 201228
Wage comparison
Taxes and social security contributions
City %Amsterdam 30Athens 24Auckland 17Bangkok 6Barcelona 23Beijing 17Berlin 30Bogotá 12Bratislava 23Brussels 43Bucharest 29Budapest 29Buenos Aires 17Cairo 15Caracas 7Chicago 25Copenhagen 41Delhi 12Doha 0Dubai 0Dublin 20Frankfurt 31Geneva 25Helsinki 27Hong Kong 9Istanbul 21Jakarta 7Johannesburg 22Kiev 17Kuala Lumpur 18Lima 16Lisbon 23Ljubljana 31London 26Los Angeles 28Luxembourg 18Lyon 22Madrid 20Manama 2Manila 19Mexico City 12Miami 23Milan 32Montreal 33Moscow 14Mumbai 11Munich 35Nairobi 24New York 22Nicosia 12Oslo 36Paris 26Prague 20Riga 31Rio de Janeiro 15Rome 32Santiago de Chile 24São Paulo 17Seoul 24Shanghai 17Sofia 24Stockholm 26Sydney 18Taipei 8Tallinn 21Tel Aviv 18Tokyo 25Toronto 28Vienna 30Vilnius 24Warsaw 29Zurich 21
0 5 10 15 20 25 30 35 40 45
Total taxes and social security contributions in % of gross wages
MethodologyWeighted average of income taxes and mandatory or customary social security contributions in 15 professions (see p� 26)�

Prices and earnings 2012 29
Wage comparison
One fifth of gross salary for deductionsWho wouldn’t like to have their entire gross monthly salary at their disposal, be relieved from any tax burden and monthly deductions? Then you might consider moving to Doha or Dubai, where there is no income tax at all for the 15 occupa-tions surveyed. This is made possible by special conditions – in these cases, local raw material deposits� However, most coun-tries can only finance their national budgets and social services through taxes and deductions�
Around one fifth of gross salary goes to the state according to the global average of the 72 cities surveyed� The highest income tax and social security burden is in Western Europe at 27�9%, followed by North America 26�5% and Eastern Europe 24�3%� The latter is especially noteworthy in that it further reduces the comparatively low gross wage level in this region on a net basis. Deductions totaling just over one fifth of gross salary also apply in African countries, with an average of 20�5%�
Over one third of gross earnings is deducted in Brussels, Copenhagen, Oslo and Munich� Luxembourg, Madrid and Dublin have the lowest deductions in European comparison, where they amount to under 21%� A comparatively larger share of gross salary is taken home by employees in the Mid-dle East (8�8% of deductions), Asia (14�5% of deductions), South America (15% of deductions) and Oceania (17�7% of deductions)�
The weighted global average of the wage data obtained is 16�5 US dollars gross and 12�3 US dollars net per hour� The most money after deductions is earned in Zurich (33.4 US dol-lars), Geneva (30 US dollars) and Luxembourg (27�6 US dollars), while the lowest wages are in Asia, where workers in Jakarta, Mumbai, Delhi and Manila only receive between 2�0 US dollars and 2�3 US dollars per hour worked�
Wage levels are only a function of the hours worked to a limited extentWhen comparing hourly and annual salaries, it is interesting to note the influence of annual working hours. In Asian cities in particular, which are almost all in the top third in terms of hours worked (see also page 30), we would expect that the high annual working hours to place workers significantly higher in the index on an annual salary basis than on an hourly salary basis� However, the impact is relatively low with a maxi-mum difference of around 3.5 percentage points, using New York as a reference. The effect is somewhat greater, but in the other direction, in Luxembourg, Paris and Copenhagen� All three cities are below the global average in terms of working hours� When compared with the wage level on an hourly ba-sis, their position slides on an annual salary basis versus New York by 27, 19 and 17 percentage points respectively�
Social security and tax systems Public sector spending and social security systems in the individual countries differ greatly, which is why the percentage deductions from gross salary for taxes and social security deductions vary widely depending on the city and country� While on the one hand deductions are a good indicator of the income actually remaining for consumption, on the other it should be considered that in some cases social security deduc-tions can also replace personal items of expenditure such as healthcare costs or private retirement provision� Thus workers in Scandinavian countries tend to have higher-than-average deductions; in return they enjoy largely free access to education and childcare� Health insurance is another source of discrepancy� While in Switzerland basic medical insurance is obligatory and has to be paid regardless of basic income (very low incomes re-ceive subsidies), in other countries the costs of health insurance are contained in employee deductions from salary�
Only direct income tax was included in the survey, which is why the deduction percentage does not provide a complete picture of countries’ respective tax burdens� When national tax systems are restructured, which frequently involves tax deductions being offset by VAT hikes, this can distort the data that are being compared� The way tax systems are structured has a large influence on wage differences within a country� While many Western states apply progressive taxation (increasing tax rate for increasing income), certain countries in the Middle East do not even have any direct income tax� What is more, some countries use proportional taxation, which barely affects wage disparities on a net basis�
Wag
e co
mpa
riso
n

Prices and earnings 201230
Wage comparison
Working hours and vacation days
CityWorking hours
per yearVacation days 1
per yearAmsterdam 1,755 24Athens 1,822 23Auckland 1,852 20Bangkok 2,312 7Barcelona 1,761 29Beijing 1,979 9Berlin 1,742 29Bogotá 1,981 15Bratislava 1,884 24Brussels 1,730 20Bucharest 1,837 26Budapest 1,912 23Buenos Aires 1,831 13Cairo 2,331 15Caracas 1,879 18Chicago 1,854 12Copenhagen 1,674 30Delhi 2,265 14Doha 2,166 26Dubai 2,096 25Dublin 1,707 21Frankfurt 1,731 28Geneva 1,893 20Helsinki 1,713 29Hong Kong 2,296 12Istanbul 2,140 19Jakarta 2,112 12Johannesburg 1,887 15Kiev 1,850 25Kuala Lumpur 1,986 15Lima 2,107 27Lisbon 1,696 22Ljubljana 1,792 23London 1,787 23Los Angeles 1,943 13Luxembourg 1,788 25Lyon 1,642 27Madrid 1,734 30Manama 1,989 22Manila 2,246 11Mexico City 2,375 6Miami 1,939 12Milan 1,753 23Montreal 1,783 13Moscow 1,800 25Mumbai 2,251 20Munich 1,756 26Nairobi 2,197 22New York 2,062 13Nicosia 1,779 22Oslo 1,749 25Paris 1,558 30Prague 1,829 21Riga 1,806 23Rio de Janeiro 1,895 30Rome 1,899 22Santiago de Chile 2,035 15São Paulo 1,810 30Seoul 2,308 14Shanghai 1,967 9Sofia 1,894 22Stockholm 1,795 26Sydney 1,846 15Taipei 2,116 11Tallinn 1,760 28Tel Aviv 1,966 16Tokyo 2,012 17Toronto 1,847 14Vienna 1,786 25Vilnius 1,789 24Warsaw 1,793 23Zurich 1,887 24
Working hours and vacation days
Significant regional differencesA regional comparison shows the same distribution of annual working hours as in 2009. Asian cities still lead the field with an average of 2,154 hours, followed by Africa with 2,138 hours, the Middle East with 2,023 hours and South America with 1,989 hours� People work the least in North America (1,904), Oceania (1,849), Eastern Europe (1,829) and Western Europe (1,757). The average of all 72 cities surveyed is 1,915 hours per year; annual working hours are below this figure in all Western European cities.
While the global average has barely changed in a three-year comparison (2009: 1,902 hours), there were larger shifts in individual countries. Along-side the major changes in weekly working hours (for example, Bogotá), these shifts can be attributed in part to changes in the number of vacation days defined by law (for example, Buenos Aires).
Not just 9,000 kilometers separate Mexico City and Paris, but also a good 800 annual working hours� At 2,375 hours for Mexico City and 1,558 hours for Paris, the two capitals are at the top and bottom of this year’s list� This difference is also due to the fact that workers in the French capital have five times as much vacation�
In global and thus also in Western European comparison, people in Paris and Lyon spend the fewest hours at their workplace� By contrast, the cities of Geneva and Zurich together with Rome have the longest working hours in Western Europe�
Around five weeks of vacation in EuropeThe regional distribution of working hours is also reflected in paid vacation. If you like going on holiday, you should perhaps move your workplace to Europe, where workers enjoy around five weeks of paid relaxation (25 days in the west, 24 days in the east)�
There are major differences within South America and Asia. With six days, Mexico has the lowest figure among all cities included in the study, while São Paulo and Rio de Janeiro even lead Western European cities with an average of 30 days of paid vacation� In Bangkok the employees surveyed receive an average of no more than seven days of paid vacation, signifi-cantly fewer than in Tokyo (17) or Mumbai (20)� To compensate for this, workers in the Thai capital enjoy 14 public holidays in addition to their vacation days�
MethodologyAnnual working hours including vacation (paid) and legal holidays; weighted average of 14 professions (excluding primary school teachers)�
1 Paid working days (excluding legal holidays)

Prices and earnings 2012 31
Exchange rate changes
Source: Reuters EcoWin, Bloomberg1 Average exchange rates
for survey period (end of April to end of May 2012)
2 Appreciation of LC (+); depreciation of LC (–)
3 EUR since January 2011n�a� = not available
Exchange rate changes
City Local currency (LC)
USD/LC 2012 1
USD/LC ∆%∆2012/2009 2
EUR/LC 2012 1
EUR/LC ∆%∆2012/2009 2
Amsterdam EUR 1 1.295 –0.95 1.000 –Athens EUR 1 1.295 –0.95 1.000 –Auckland NZD 1 0.785 47.27 0.607 48.86Bangkok THB 1 0.032 15.01 0.025 16.10Barcelona EUR 1 1.295 –0.95 1.000 –Beijing CNY 1 0.158 8.26 0.122 9.28Berlin EUR 1 1.295 –0.95 1.000 –Bogotá COP 100 0.056 39.02 0.043 40.05Bratislava EUR 1 1.295 –0.95 1.000 –Brussels EUR 1 1.295 –0.95 1.000 –Bucharest RON 1 0.293 –4.10 0.226 –3.24Budapest HUF 100 0.447 3.77 0.345 4.76Buenos Aires ARS 1 0.226 –17.52 0.174 –16.75Cairo EGP 1 0.166 –6.64 0.128 –5.77Caracas VEF 1 0.233 –49.94 0.180 –49.47Chicago USD 1 1.000 – 0.772 0.94Copenhagen DKK 1 0.174 –0.71 0.135 0.22Delhi INR 1 0.019 –4.67 0.014 –3.76Doha QAR 1 0.275 –0.01 0.212 0.84Dubai AED 1 0.272 0.01 0.210 0.94Dublin EUR 1 1.295 –0.95 1.000 –Frankfurt EUR 1 1.295 –0.95 1.000 –Geneva CHF 1 1.079 24.42 0.833 25.58Helsinki EUR 1 1.295 –0.95 1.000 –Hong Kong HKD 1 0.129 –0.13 0.099 0.80Istanbul TRY 1 0.559 –4.46 0.432 –3.55Jakarta IDR 1000 0.109 28.39 0.084 29.60Johannesburg ZAR 1 0.125 23.89 0.096 24.99Kiev UAH 1 0.124 –0.03 0.096 0.94Kuala Lumpur MYR 1 0.326 19.70 0.252 20.84Lima PEN 1 0.377 19.42 0.291 20.41Lisbon EUR 1 1.295 –0.95 1.000 –Ljubljana EUR 1 1.295 –0.95 1.000 –London GBP 1 1.607 13.14 1.241 14.22Los Angeles USD 1 1.000 – 0.772 0.94Luxembourg EUR 1 1.295 –0.95 1.000 –Lyon EUR 1 1.295 –0.95 1.000 –Madrid EUR 1 1.295 –0.95 1.000 –Manama BHD 1 2.653 –0.02 2.053 1.18Manila PHP 1 0.024 13.69 0.018 14.77Mexico City MXN 1 0.074 9.02 0.058 10.07Miami USD 1 1.000 – 0.772 0.94Milan EUR 1 1.295 –0.95 1.000 –Montreal CAD 1 0.999 26.16 0.771 27.34Moscow RUB 1 0.033 14.27 0.026 15.41Mumbai INR 1 0.019 –4.67 0.014 –3.76Munich EUR 1 1.295 –0.95 1.000 –Nairobi KES 100 1.197 –3.91 0.921 –3.24New York USD 1 1.000 – 0.772 0.94Nicosia EUR 1 1.295 –0.95 1.000 –Oslo NOK 1 0.171 15.58 0.132 16.68Paris EUR 1 1.295 –0.95 1.000 –Prague CZK 1 0.051 6.89 0.040 7.87Riga LVL 1 1.856 0.53 1.433 1.47Rio de Janeiro BRL 1 0.510 17.88 0.394 19.02Rome EUR 1 1.295 –0.95 1.000 –Santiago de Chile CLP 100 0.204 20.68 0.157 21.84São Paulo BRL 1 0.510 17.88 0.394 19.02Seoul KRW 100 0.087 26.47 0.067 27.67Shanghai CNY 1 0.158 8.26 0.122 9.28Sofia BGN 1 0.662 –0.91 0.511 0.02Stockholm SEK 1 0.144 23.07 0.111 24.23Sydney AUD 1 1.009 51.19 0.779 52.70Taipei TWD 1 0.034 16.90 0.026 18.00Tallinn EUR 1 1.295 n.a. 3 1.000 n.a. 3
Tel Aviv ILS 1 0.263 9.50 0.203 10.43Tokyo JPY 1 0.013 22.41 0.010 23.56Toronto CAD 1 0.999 26.16 0.771 27.34Vienna EUR 1 1.295 –0.95 1.000 –Vilnius LTL 1 0.375 –0.89 0.290 0.04Warsaw PLN 1 0.305 7.66 0.235 8.62Zurich CHF 1 1.079 24.42 0.833 25.58

Prices and earnings 201232
Inflation 2009 – 2012 1
City (countries) 2009 2010 2011Amsterdam (Netherlands) 1.0 0.9 2.5Athens (Greece) 1.3 4.7 3.1Auckland (New Zealand) 2.1 2.3 4.0Bangkok (Thailand) –0.8 3.3 3.8Barcelona (Spain) –0.2 2.0 3.1Beijing (China) –0.7 3.3 5.4Berlin (Germany) 0.2 1.2 2.5Bogotá (Colombia)2 4.2 2.3 3.4Bratislava (Slovakia) 0.9 0.7 4.1Brussels (Belgium) 0.0 2.3 3.5Bucharest (Romania) 2 5.6 6.1 5.8Budapest (Hungary) 4.2 4.9 3.9Buenos Aires (Argentina) 2 6.3 10.5 9.8Cairo (Egypt) 16.2 11.7 11.1Caracas (Venezuela) 2 27.1 28.2 26.1Chicago (United States) –0.3 1.6 3.1Copenhagen (Denmark) 1.3 2.3 2.8Delhi (New Delhi, India) 10.9 12.0 8.6Doha (Qatar) –4.9 –2.4 2.0Dubai (United Arab Emirates) 2 1.6 0.9 0.9Dublin (Ireland) –1.7 –1.6 1.1Frankfurt (Germany) 0.2 1.2 2.5Geneva (Switzerland) –0.5 0.7 0.2Helsinki (Finland) 1.6 1.7 3.3Hong Kong (China) 0.6 2.3 5.3Istanbul (Turkey) 6.3 8.6 6.5Jakarta (Indonesia) 4.8 5.1 5.4Johannesburg (South Africa) 3 7.1 4.3 5.0Kiev (Ukraine) 15.9 9.4 8.0Kuala Lumpur (Malaysia) 0.6 1.7 3.2Lima (Peru) 2.9 1.5 3.4Lisbon (Portugal) –0.9 1.4 3.6Ljubljana (Slovenia) 0.9 1.8 1.8London (Great Britain) 2.1 3.3 4.5Los Angeles (United States) –0.3 1.6 3.1Luxembourg (Luxembourg) 0.4 2.3 3.4Lyon (France) 0.1 1.7 2.3Madrid (Spain) –0.2 2.0 3.1Manama (Bahrain) 2.8 2.0 1.0Manila (Philippines) 4.2 3.8 4.8Mexico City (Mexico) 2 5.3 4.2 3.4Miami (United States) –0.3 1.6 3.1Milan (Italy) 0.8 1.6 2.9Montreal (Canada) 0.3 1.8 2.9Moscow (Russia) 11.7 6.9 8.4Mumbai (Bombay, India) 10.9 12.0 8.6Munich (Germany) 0.2 1.2 2.5Nairobi (Kenya) 2 10.6 4.1 14.0New York (United States) –0.3 1.6 3.1Nicosia (Cyprus) 0.2 2.6 3.5Oslo (Norway) 2.2 2.4 1.3Paris (France) 0.1 1.7 2.3Prague (Czech Republic) 1.0 1.5 1.9Riga (Latvia) 3.3 –1.2 4.2Rio de Janeiro (Brazil) 4.9 5.0 6.6Rome (Italy) 0.8 1.6 2.9Santiago de Chile (Chile) 1.5 1.4 3.3São Paulo (Brazil) 4.9 5.0 6.6Seoul (South Korea) 2.8 2.9 4.0Shanghai (China) –0.7 3.3 5.4Sofia (Bulgaria) 2.5 3.0 3.4Stockholm (Sweden) 2.0 1.9 1.4Sydney (Australia) 1.8 2.8 3.4Taipei (Taiwan) –0.9 1.0 1.4Tallinn (Estonia) –0.1 2.9 5.1Tel Aviv (Israel) 3.3 2.7 3.4Tokyo (Japan) –1.3 –0.7 –0.3Toronto (Canada) 0.3 1.8 2.9Vienna (Austria) 0.4 1.7 3.6Vilnius (Lithuania) 4.2 1.2 4.1Warsaw (Poland) 3.5 2.5 4.3Zurich (Switzerland) –0.5 0.7 0.2
Source: International Monetary Fund
1 Annual change of average consumer prices (percentage)
2 After 2011: estimate
3 After 2010: estimate
Inflation

Prices and earnings 2012 33
Geographical distribution of regions
Africa Asia Eastern Europe Middle East North America Oceania South America Western Europe
Cairo Bangkok Bratislava Doha Chicago Auckland Bogotá AmsterdamJohannesburg Beijing Bucharest Dubai Los Angeles Sydney Buenos Aires AthensNairobi Delhi Budapest Istanbul Miami Caracas Barcelona
Hong Kong Kiev Manama Montreal Lima BerlinJakarta Ljubljana Nicosia New York Mexico City BrusselsKuala Lumpur Moscow Tel Aviv Toronto Rio de Janeiro CopenhagenManila Prague Santiago de Chile DublinMumbai Riga São Paulo FrankfurtSeoul Sofia GenevaShanghai Tallinn HelsinkiTaipei Vilnius LisbonTokyo Warsaw London
LuxembourgLyonMadridMilanMunichOsloParisRomeStockholmViennaZurich
Geographical distribution of regions

Prices and earnings 201234
Appendix
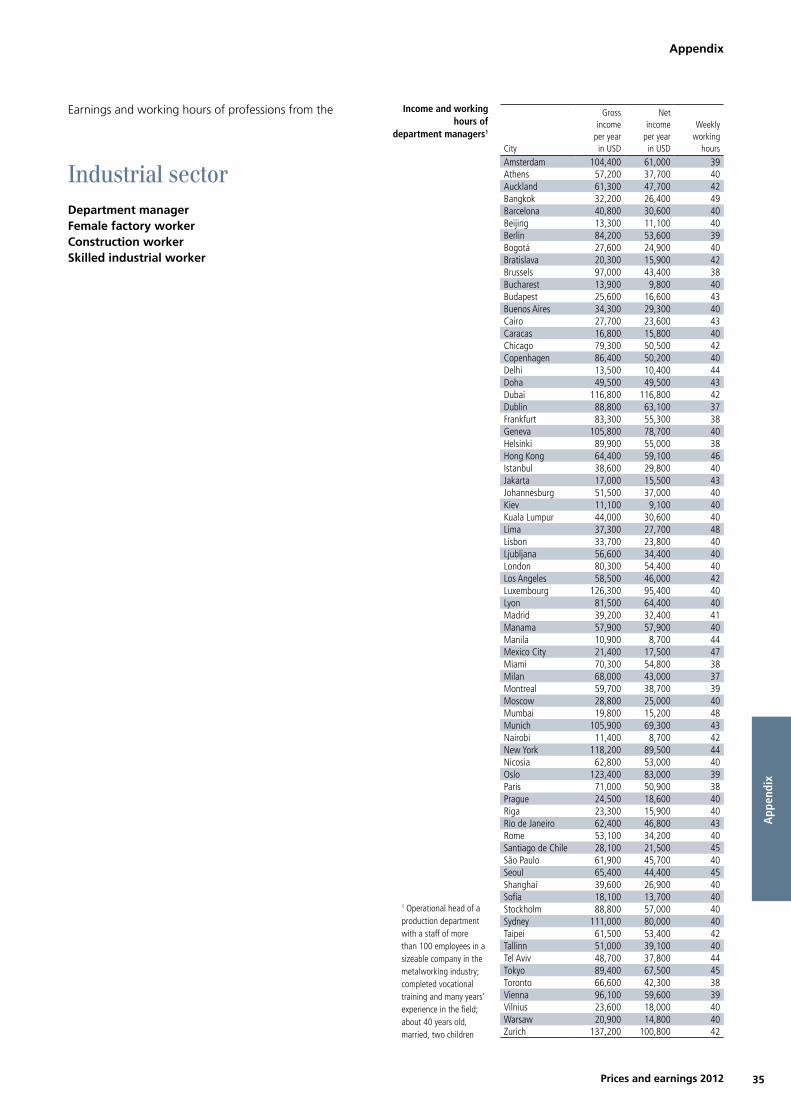
Prices and earnings 2012 35
Appendix
Industrial sectorCity
Gross income
per yearin USD
Net income
per yearin USD
Weeklyworking
hours
Amsterdam 104,400 61,000 39Athens 57,200 37,700 40Auckland 61,300 47,700 42Bangkok 32,200 26,400 49Barcelona 40,800 30,600 40Beijing 13,300 11,100 40Berlin 84,200 53,600 39Bogotá 27,600 24,900 40Bratislava 20,300 15,900 42Brussels 97,000 43,400 38Bucharest 13,900 9,800 40Budapest 25,600 16,600 43Buenos Aires 34,300 29,300 40Cairo 27,700 23,600 43Caracas 16,800 15,800 40Chicago 79,300 50,500 42Copenhagen 86,400 50,200 40Delhi 13,500 10,400 44Doha 49,500 49,500 43Dubai 116,800 116,800 42Dublin 88,800 63,100 37Frankfurt 83,300 55,300 38Geneva 105,800 78,700 40Helsinki 89,900 55,000 38Hong Kong 64,400 59,100 46Istanbul 38,600 29,800 40Jakarta 17,000 15,500 43Johannesburg 51,500 37,000 40Kiev 11,100 9,100 40Kuala Lumpur 44,000 30,600 40Lima 37,300 27,700 48Lisbon 33,700 23,800 40Ljubljana 56,600 34,400 40London 80,300 54,400 40Los Angeles 58,500 46,000 42Luxembourg 126,300 95,400 40Lyon 81,500 64,400 40Madrid 39,200 32,400 41Manama 57,900 57,900 40Manila 10,900 8,700 44Mexico City 21,400 17,500 47Miami 70,300 54,800 38Milan 68,000 43,000 37Montreal 59,700 38,700 39Moscow 28,800 25,000 40Mumbai 19,800 15,200 48Munich 105,900 69,300 43Nairobi 11,400 8,700 42New York 118,200 89,500 44Nicosia 62,800 53,000 40Oslo 123,400 83,000 39Paris 71,000 50,900 38Prague 24,500 18,600 40Riga 23,300 15,900 40Rio de Janeiro 62,400 46,800 43Rome 53,100 34,200 40Santiago de Chile 28,100 21,500 45São Paulo 61,900 45,700 40Seoul 65,400 44,400 45Shanghai 39,600 26,900 40Sofia 18,100 13,700 40Stockholm 88,800 57,000 40Sydney 111,000 80,000 40Taipei 61,500 53,400 42Tallinn 51,000 39,100 40Tel Aviv 48,700 37,800 44Tokyo 89,400 67,500 45Toronto 66,600 42,300 38Vienna 96,100 59,600 39Vilnius 23,600 18,000 40Warsaw 20,900 14,800 40Zurich 137,200 100,800 42
App
endi
x
Department managerFemale factory workerConstruction workerSkilled industrial worker
Earnings and working hours of professions from the Income and workinghours of
department managers1
1 Operational head of a production department with a staff of more than 100 employees in a sizeable company in the metalworking industry; completed vocational training and many years’ experience in the field; about 40 years old, married, two children

Prices and earnings 201236
Appendix
City
Gross income
per yearin USD
Net income
per yearin USD
Weeklyworking
hours
Amsterdam 40,300 28,000 39Athens 15,400 12,200 40Auckland 27,200 22,900 40Bangkok 5,800 5,600 52Barcelona 25,000 19,900 40Beijing 5,400 4,500 40Berlin 32,000 23,200 37Bogotá 4,100 3,800 45Bratislava 12,600 9,700 42Brussels 33,500 18,600 38Bucharest 5,800 4,100 40Budapest 6,500 4,800 40Buenos Aires 7,500 6,200 40Cairo 1,900 1,700 48Caracas 5,400 5,100 41Chicago 33,800 25,300 40Copenhagen 64,800 37,800 38Delhi 1,800 1,800 51Doha 3,200 3,200 48Dubai 9,800 9,800 48Dublin 28,200 23,200 39Frankfurt 34,100 26,000 37Geneva 55,400 41,600 40Helsinki 33,500 25,900 38Hong Kong 14,000 12,800 49Istanbul 9,200 7,500 46Jakarta 1,400 1,400 48Johannesburg 15,900 13,000 40Kiev 4,000 3,200 40Kuala Lumpur 5,100 4,400 47Lima 7,600 6,600 48Lisbon 18,500 15,000 40Ljubljana 12,400 8,800 40London 37,600 27,600 38Los Angeles 47,300 33,300 42Luxembourg 29,900 23,600 40Lyon 23,800 18,900 35Madrid 19,900 17,100 40Manama 11,800 11,700 44Manila 2,800 2,300 48Mexico City 3,100 2,800 47Miami 33,800 26,800 40Milan 28,800 20,100 40Montreal 35,400 24,100 40Moscow 11,800 8,300 40Mumbai 1,400 1,300 48Munich 31,500 21,200 37Nairobi 2,800 2,100 49New York 41,300 32,600 44Nicosia 21,000 19,400 38Oslo 63,700 41,100 39Paris 25,400 18,900 35Prague 9,200 7,600 40Riga 9,300 6,200 40Rio de Janeiro 6,300 5,800 43Rome 16,200 8,700 43Santiago de Chile 7,400 5,800 44São Paulo 7,100 6,500 44Seoul 10,500 8,900 47Shanghai 8,200 7,000 43Sofia 5,100 3,900 43Stockholm 37,900 28,800 40Sydney 50,500 41,800 40Taipei 11,000 10,100 48Tallinn 10,600 8,500 40Tel Aviv 15,200 13,100 43Tokyo 48,000 36,400 44Toronto 29,700 24,000 38Vienna 25,400 20,100 40Vilnius 8,500 6,500 40Warsaw 8,400 6,100 40Zurich 53,200 43,500 41
Income and workinghours of
female factory workers1
1 Unskilled or semi-skilledmachine operator in a medium-sized company, mainly in the textile industry; about 25 years old, single
City
Gross income
per yearin USD
Net income
per yearin USD
Weeklyworking
hours
Amsterdam 30,200 22,500 39Athens 17,100 12,400 43Auckland 28,500 24,000 40Bangkok 3,000 2,800 54Barcelona 29,800 22,700 42Beijing 7,600 6,700 42Berlin 28,500 21,500 42Bogotá 7,000 6,200 45Bratislava 10,000 7,900 43Brussels 34,200 21,000 38Bucharest 7,900 5,300 43Budapest 7,000 5,400 46Buenos Aires 10,200 8,800 40Cairo 2,600 2,200 51Caracas 6,100 5,700 40Chicago 49,000 36,100 40Copenhagen 58,500 33,000 38Delhi 1,300 1,300 56Doha 4,100 4,100 54Dubai 3,600 3,600 48Dublin 28,200 23,200 40Frankfurt 34,100 22,500 40Geneva 58,900 44,300 40Helsinki 38,700 28,800 39Hong Kong 18,900 17,200 51Istanbul 9,500 7,800 48Jakarta 1,300 1,200 52Johannesburg 7,500 7,000 45Kiev 4,900 4,500 48Kuala Lumpur 6,100 5,400 52Lima 5,400 5,200 60Lisbon 13,900 11,500 40Ljubljana 13,000 9,100 40London 39,100 28,600 42Los Angeles 47,000 32,000 42Luxembourg 28,500 24,100 40Lyon 24,000 18,800 37Madrid 23,200 19,000 43Manama 7,600 7,600 44Manila 2,700 2,500 45Mexico City 3,100 2,700 48Miami 40,100 31,100 45Milan 28,900 20,100 40Montreal 27,600 18,800 37Moscow 13,000 11,400 41Mumbai 1,300 1,300 39Munich 28,000 18,800 33Nairobi 2,500 1,800 54New York 69,300 53,000 43Nicosia 24,500 21,800 45Oslo 62,800 40,400 39Paris 25,900 19,000 35Prague 9,100 7,500 43Riga 14,600 10,100 40Rio de Janeiro 8,400 7,500 44Rome 19,600 14,500 43Santiago de Chile 6,700 5,300 47São Paulo 6,600 6,100 40Seoul 13,000 13,000 50Shanghai 6,700 5,600 40Sofia 5,700 4,500 43Stockholm 43,300 32,500 40Sydney 39,200 34,600 33Taipei 20,100 19,000 47Tallinn 10,600 8,500 40Tel Aviv 21,000 17,600 42Tokyo 47,000 35,100 45Toronto 46,200 35,700 43Vienna 29,500 22,400 40Vilnius 9,800 7,500 40Warsaw 9,700 7,000 40Zurich 61,800 50,200 41
Income and workinghours of construc-tion workers2
2 Unskilled or semi-skilledlabourer, without voca-tional training; about 25 years old, single

Prices and earnings 2012 37
Appendix
City
Gross income
per yearin USD
Net income
per yearin USD
Weeklyworking
hours
Amsterdam 55,400 37,000 38Athens 24,500 18,500 40Auckland 41,800 33,900 40Bangkok 10,900 10,200 52Barcelona 31,500 24,900 40Beijing 6,200 5,700 44Berlin 47,400 32,400 39Bogotá 7,300 6,600 45Bratislava 16,300 12,600 42Brussels 52,100 29,800 38Bucharest 7,400 5,100 40Budapest 10,900 8,300 43Buenos Aires 11,400 9,500 42Cairo 6,600 5,700 48Caracas 9,700 9,300 40Chicago 58,500 44,900 42Copenhagen 68,900 40,500 38Delhi 4,800 4,100 51Doha 20,600 20,600 48Dubai 38,300 38,300 48Dublin 42,600 35,200 38Frankfurt 48,800 36,300 37Geneva 78,400 59,200 40Helsinki 40,500 29,800 39Hong Kong 23,100 22,500 49Istanbul 20,300 16,600 45Jakarta 10,100 9,200 47Johannesburg 41,800 29,000 40Kiev 7,000 5,700 40Kuala Lumpur 12,800 10,500 47Lima 15,900 13,000 48Lisbon 25,900 19,400 40Ljubljana 17,900 13,500 40London 51,700 37,900 38Los Angeles 62,300 49,600 41Luxembourg 45,300 39,000 40Lyon 29,400 23,200 36Madrid 27,300 21,200 41Manama 24,000 22,900 40Manila 3,600 2,500 48Mexico City 4,800 4,500 48Miami 56,500 42,300 42Milan 36,900 26,000 40Montreal 42,500 29,000 38Moscow 15,900 13,900 40Mumbai 3,100 2,700 54Munich 51,700 35,600 37Nairobi 4,400 3,200 49New York 79,100 61,900 43Nicosia 33,800 30,000 38Oslo 72,900 46,900 39Paris 32,100 24,900 35Prague 15,400 12,600 40Riga 15,300 10,200 40Rio de Janeiro 18,600 15,500 43Rome 31,300 23,200 43Santiago de Chile 12,200 8,500 47São Paulo 12,600 10,400 39Seoul 41,600 29,400 43Shanghai 9,200 7,900 43Sofia 9,300 7,300 43Stockholm 44,300 33,300 40Sydney 72,000 55,800 43Taipei 24,700 22,500 42Tallinn 17,900 14,000 40Tel Aviv 25,000 21,400 42Tokyo 77,700 61,000 40Toronto 44,300 29,900 38Vienna 56,200 33,800 41Vilnius 17,700 13,500 40Warsaw 13,200 9,500 40Zurich 79,800 64,600 42
Income and workinghours of
skilled industrial workers1
1 Skilled worker with vocational training and about 10 years’ experience with a large company in the metal-working industry; about 35 years old, married, two children
App
endi
x

Prices and earnings 201238
Appendix
Services sectorCity
Gross income
per yearin USD
Net income
per yearin USD
Weeklyworking
hours
Amsterdam 39,200 27,800 39Athens 23,300 18,300 40Auckland 31,500 26,400 40Bangkok 8,400 7,800 46Barcelona 34,100 25,500 40Beijing 7,000 6,100 48Berlin 38,600 28,100 40Bogotá 7,600 7,300 48Bratislava 14,100 11,000 43Brussels 36,500 21,600 37Bucharest 7,500 5,400 44Budapest 11,500 8,800 41Buenos Aires 16,300 13,600 47Cairo 1,400 1,200 48Caracas 5,400 5,100 40Chicago 52,100 38,900 39Copenhagen 56,300 35,000 38Delhi 2,500 2,200 51Doha 10,400 10,400 60Dubai 16,300 16,300 39Dublin 45,500 37,600 38Frankfurt 33,300 26,400 41Geneva 77,400 57,500 40Helsinki 42,200 30,700 39Hong Kong 20,100 18,300 51Istanbul 14,600 11,100 48Jakarta 2,600 2,500 47Johannesburg 11,900 9,200 28Kiev 5,300 4,300 40Kuala Lumpur 8,300 7,300 47Lima 6,200 5,700 45Lisbon 22,500 17,200 38Ljubljana 15,000 11,500 40London 44,400 32,200 38Los Angeles 60,200 49,000 39Luxembourg 93,900 78,900 40Lyon 30,300 23,200 36Madrid 25,400 20,200 40Manama 10,900 10,900 51Manila 2,500 2,200 63Mexico City 3,800 3,500 50Miami 30,600 22,400 40Milan 36,500 25,800 36Montreal 48,700 34,300 37Moscow 18,600 16,300 41Mumbai 3,200 3,100 60Munich 40,000 26,800 39Nairobi 3,100 2,200 48New York 57,200 46,000 40Nicosia 24,700 21,800 40Oslo 60,000 38,600 37Paris 32,800 25,300 35Prague 16,200 13,100 40Riga 13,700 9,600 40Rio de Janeiro 9,800 8,200 44Rome 33,500 24,500 40Santiago de Chile 10,000 7,900 47São Paulo 11,300 9,600 41Seoul 43,600 29,500 60Shanghai 8,500 7,100 40Sofia 7,300 5,700 45Stockholm 41,300 31,200 40Sydney 41,800 36,100 40Taipei 23,200 21,400 60Tallinn 17,700 12,400 40Tel Aviv 26,500 21,900 42Tokyo 56,300 41,800 43Toronto 36,700 23,400 33Vienna 42,900 30,400 38Vilnius 12,200 9,200 40Warsaw 10,000 7,300 40Zurich 90,700 73,300 42
Bus driverCar mechanicCall center agentFinancial analystEngineerCook (Chef de Partie)Bank credit clerkProduct managerSecretary/personal assistantFemale sales assistantPrimary school teacher
Earnings and working hours of professions from the Income and workinghours of
bus drivers1
1 Employed by municipaltransport operator, around 10 years’ experience; about 35 years old, married, two children

Prices and earnings 2012 39
Appendix
City
Gross income
per yearin USD
Net income
per yearin USD
Weeklyworking
hours
Amsterdam 26,300 20,100 39Athens 18,500 14,800 43Auckland 36,500 30,300 42Bangkok 11,100 10,400 50Barcelona 29,100 25,800 40Beijing 8,500 7,100 40Berlin 35,500 25,100 37Bogotá 8,400 7,500 45Bratislava 11,300 8,800 42Brussels 38,200 22,400 38Bucharest 9,500 6,300 43Budapest 9,300 6,500 43Buenos Aires 11,900 9,800 45Cairo 2,700 2,300 60Caracas 10,900 10,400 40Chicago 44,000 36,900 40Copenhagen 68,400 39,900 38Delhi 1,900 1,900 51Doha 9,800 9,800 48Dubai 14,200 14,200 48Dublin 38,300 30,200 39Frankfurt 40,400 27,100 38Geneva 61,900 46,600 40Helsinki 38,200 28,500 38Hong Kong 20,100 18,100 52Istanbul 13,500 10,200 48Jakarta 2,200 2,100 46Johannesburg 21,000 15,200 45Kiev 6,500 5,200 43Kuala Lumpur 10,700 9,200 49Lima 7,600 6,500 45Lisbon 19,700 15,700 40Ljubljana 18,100 12,600 40London 40,900 29,800 39Los Angeles 42,100 30,200 40Luxembourg 38,900 31,500 40Lyon 26,200 20,600 37Madrid 20,500 18,900 41Manama 9,200 9,200 47Manila 2,700 2,100 48Mexico City 3,400 3,100 50Miami 40,700 29,900 42Milan 29,400 20,600 37Montreal 43,800 29,300 36Moscow 15,800 13,900 41Mumbai 2,100 2,100 70Munich 37,300 23,300 37Nairobi 2,600 1,900 59New York 50,000 39,500 43Nicosia 28,600 25,600 38Oslo 78,200 49,700 39Paris 28,000 21,000 35Prague 13,600 10,600 40Riga 15,500 10,500 40Rio de Janeiro 14,200 12,300 44Rome 22,900 16,400 43Santiago de Chile 11,000 8,500 44São Paulo 12,600 11,000 40Seoul 11,700 9,500 71Shanghai 9,300 8,000 40Sofia 7,500 5,800 43Stockholm 41,300 31,200 40Sydney 39,400 34,400 41Taipei 16,700 15,300 47Tallinn 21,200 15,800 40Tel Aviv 18,900 15,800 43Tokyo 54,000 39,600 44Toronto 33,300 24,100 35Vienna 34,100 24,900 40Vilnius 13,900 10,600 40Warsaw 12,600 8,900 40Zurich 68,900 56,500 42
Income and workinghours of
car mechanics1
1 With completed appren-ticeship and around 5 years’ experience; about 25 years old, single
City
Gross income
per yearin USD
Net income
per yearin USD
Weeklyworking
hours
Amsterdam 27,700 20,500 38Athens 16,300 13,000 40Auckland 27,500 23,100 40Bangkok 6,500 6,200 43Barcelona 28,000 21,800 40Beijing 7,600 6,200 40Berlin 28,100 21,200 41Bogotá 5,300 5,100 45Bratislava 16,400 12,200 42Brussels 36,000 21,800 38Bucharest 5,300 3,600 43Budapest 8,900 6,300 43Buenos Aires 10,400 8,500 35Cairo 3,100 2,700 45Caracas 6,700 6,300 40Chicago 38,700 28,400 39Copenhagen 42,200 26,300 38Delhi 4,000 3,600 38Doha 11,500 11,500 40Dubai 19,600 19,600 44Dublin 28,800 23,400 36Frankfurt 29,100 21,100 40Geneva 61,800 48,200 40Helsinki 35,600 27,200 38Hong Kong 19,000 17,600 49Istanbul 9,300 7,500 48Jakarta 3,200 3,000 41Johannesburg 6,600 6,200 44Kiev 3,900 3,200 40Kuala Lumpur 7,100 5,800 40Lima 8,300 7,400 44Lisbon 14,900 12,200 35Ljubljana 17,900 12,600 40London 27,100 21,000 39Los Angeles 45,700 32,800 40Luxembourg 37,200 30,200 40Lyon 24,700 19,700 36Madrid 25,600 21,100 37Manama 14,400 9,200 44Manila 4,800 3,900 43Mexico City 14,600 12,300 49Miami 37,700 28,900 40Milan 23,200 16,600 37Montreal 32,000 21,800 36Moscow 10,000 8,700 40Mumbai 4,800 4,700 48Munich 30,200 19,900 38Nairobi 4,900 3,600 45New York 41,700 32,800 40Nicosia 21,100 18,600 40Oslo 46,500 35,600 39Paris 25,600 19,300 35Prague 10,500 8,500 40Riga 13,000 8,700 40Rio de Janeiro 7,500 6,600 38Rome 13,200 10,700 30Santiago de Chile 8,500 6,700 41São Paulo 4,800 4,400 39Seoul 24,500 18,800 53Shanghai 7,600 6,500 42Sofia 10,900 8,500 43Stockholm 41,700 31,600 40Sydney 36,800 32,900 39Taipei 14,800 13,700 42Tallinn 13,600 10,700 40Tel Aviv 19,700 16,400 43Tokyo 44,700 32,200 42Toronto 37,400 26,200 40Vienna 32,600 24,100 40Vilnius 8,000 6,300 40Warsaw 7,600 5,600 40Zurich 58,900 46,600 42
Income and workinghours of call centeragents2
2 Trained agent at an inbound call/service centre, e.g. in the telecommunications or technology sector; about 25 years old, single
App
endi
x

Prices and earnings 201240
Appendix
City
Gross income
per yearin USD
Net income
per yearin USD
Weeklyworking
hours
Amsterdam 66,700 40,900 37Athens 34,400 24,900 40Auckland 64,900 50,000 42Bangkok 19,400 17,000 43Barcelona 58,300 41,200 40Beijing 19,800 15,700 41Berlin 81,700 49,100 45Bogotá 31,900 24,200 40Bratislava 48,300 35,600 42Brussels 78,200 38,200 38Bucharest 13,200 9,200 40Budapest 29,300 19,000 40Buenos Aires 15,400 12,700 40Cairo 10,900 9,200 39Caracas 12,400 11,700 40Chicago 103,500 75,900 40Copenhagen 109,200 58,500 42Delhi 14,100 10,900 43Doha 23,100 23,100 40Dubai 80,000 80,000 44Dublin 85,000 51,300 39Frankfurt 104,100 58,400 39Geneva 171,100 115,400 41Helsinki 74,500 47,300 37Hong Kong 62,600 54,000 43Istanbul 33,500 26,400 43Jakarta 15,800 11,100 40Johannesburg 65,900 44,900 40Kiev 13,300 10,900 40Kuala Lumpur 22,700 17,200 40Lima 29,400 22,500 40Lisbon 63,100 39,900 35Ljubljana 27,800 17,700 40London 64,200 47,500 40Los Angeles 80,300 54,300 44Luxembourg 89,400 59,300 40Lyon 100,900 79,800 48Madrid 65,100 47,500 39Manama 27,800 27,600 43Manila 9,700 8,000 40Mexico City 28,000 23,600 44Miami 71,500 55,800 40Milan 58,700 37,900 39Montreal 56,300 37,000 39Moscow 46,100 40,500 40Mumbai 18,000 14,500 48Munich 105,900 57,900 40Nairobi 14,200 10,200 43New York 120,600 91,800 45Nicosia 107,000 82,800 39Oslo 144,000 86,900 50Paris 86,900 57,900 35Prague 21,900 16,300 40Riga 33,000 22,300 40Rio de Janeiro 70,300 53,100 43Rome 94,500 54,700 43Santiago de Chile 30,600 10,600 41São Paulo 19,900 15,200 40Seoul 130,800 123,600 43Shanghai 53,200 34,700 40Sofia 21,900 17,200 40Stockholm 83,400 56,100 39Sydney 110,300 79,900 40Taipei 36,000 32,200 42Tallinn 27,800 21,500 40Tel Aviv 83,000 51,300 42Tokyo 144,000 108,000 48Toronto 74,600 49,500 53Vienna 72,500 44,900 44Vilnius 38,500 29,300 40Warsaw 24,900 16,600 40Zurich 140,400 98,400 42
Income and workinghours of
financial analysts1
1 Employed at a major bank with completed studies (university, technical institute, possibly also an institute of higher technical education) and at least 5 years of work experience; about 30 to 35 years old, single
City
Gross income
per yearin USD
Net income
per yearin USD
Weeklyworking
hours
Amsterdam 64,600 41,800 39Athens 34,100 25,100 40Auckland 56,300 44,200 42Bangkok 24,600 21,500 43Barcelona 43,100 33,000 40Beijing 10,700 8,800 40Berlin 72,100 47,400 39Bogotá 19,700 17,200 40Bratislava 22,800 17,100 42Brussels 67,100 35,600 38Bucharest 11,400 8,200 43Budapest 23,300 15,400 40Buenos Aires 19,200 15,700 40Cairo 9,600 8,000 48Caracas 22,800 21,000 40Chicago 88,200 65,400 40Copenhagen 89,200 51,800 37Delhi 9,600 7,900 46Doha 32,900 32,900 48Dubai 64,800 64,800 48Dublin 54,300 42,300 36Frankfurt 77,700 51,700 40Geneva 89,400 67,500 40Helsinki 69,200 44,900 39Hong Kong 44,600 39,900 45Istanbul 34,100 26,300 47Jakarta 10,700 9,800 36Johannesburg 74,900 46,200 40Kiev 6,700 5,400 40Kuala Lumpur 23,600 18,000 40Lima 24,300 19,700 48Lisbon 36,100 24,300 37Ljubljana 35,000 23,700 40London 65,900 48,200 40Los Angeles 90,500 64,000 40Luxembourg 66,800 57,000 40Lyon 45,100 34,200 38Madrid 52,700 38,300 41Manama 34,400 34,400 40Manila 9,800 7,300 43Mexico City 13,600 11,500 48Miami 95,100 66,200 40Milan 57,900 37,400 39Montreal 61,600 40,300 39Moscow 25,500 22,400 41Mumbai 15,400 14,000 54Munich 79,500 50,900 41Nairobi 21,000 16,400 45New York 107,400 80,300 46Nicosia 47,700 40,400 39Oslo 79,400 51,000 39Paris 67,100 47,800 35Prague 21,000 17,100 40Riga 16,800 11,700 40Rio de Janeiro 37,600 23,100 39Rome 28,000 21,100 42Santiago de Chile 32,000 21,000 44São Paulo 28,200 20,700 38Seoul 82,900 47,100 43Shanghai 15,800 13,000 40Sofia 10,400 7,800 43Stockholm 72,500 50,600 40Sydney 79,000 60,400 40Taipei 29,300 26,400 42Tallinn 27,300 21,200 40Tel Aviv 56,200 40,400 41Tokyo 77,200 58,500 44Toronto 84,800 51,700 38Vienna 69,800 43,800 43Vilnius 16,600 12,700 40Warsaw 17,900 12,700 40Zurich 115,700 91,700 41
Income and workinghours of engineers2
2 Employed by an industrial firm in the electrical engineering sector, university ortechnical college gradu-ate with at least 5 years’ work experience; about 35 years old, married, two children

Prices and earnings 2012 41
City
Gross income
per yearin USD
Net income
per yearin USD
Weeklyworking
hours
Amsterdam 39,800 27,800 39Athens 24,200 18,300 43Auckland 31,100 26,000 42Bangkok 10,900 10,400 54Barcelona 32,100 25,000 42Beijing 11,900 9,700 40Berlin 57,600 38,600 44Bogotá 11,900 10,700 40Bratislava 18,900 14,200 42Brussels 43,600 24,600 38Bucharest 14,900 10,500 40Budapest 16,800 11,300 44Buenos Aires 15,800 13,100 40Cairo 48,800 41,400 60Caracas 25,400 20,700 40Chicago 48,300 36,900 43Copenhagen 61,000 36,100 38Delhi 10,200 8,700 54Doha 13,700 13,700 51Dubai 58,100 58,100 48Dublin 42,100 32,400 36Frankfurt 40,000 26,900 40Geneva 76,500 56,700 45Helsinki 41,200 30,300 36Hong Kong 40,800 36,000 58Istanbul 51,300 40,900 48Jakarta 4,400 3,800 51Johannesburg 18,000 14,500 45Kiev 10,500 8,500 37Kuala Lumpur 17,100 12,800 47Lima 12,200 10,200 48Lisbon 33,700 24,300 40Ljubljana 28,000 18,100 40London 36,400 27,300 41Los Angeles 51,900 35,400 41Luxembourg 35,500 29,000 40Lyon 43,500 34,300 38Madrid 35,900 27,600 40Manama 11,500 11,500 56Manila 8,900 8,000 48Mexico City 19,800 16,200 49Miami 46,200 36,500 40Milan 51,000 33,300 43Montreal 44,600 29,700 39Moscow 30,300 26,700 41Mumbai 7,900 6,100 51Munich 55,200 33,800 45Nairobi 16,200 12,300 48New York 85,500 67,300 43Nicosia 52,700 49,000 40Oslo 59,800 38,300 39Paris 36,800 26,800 40Prague 17,100 13,100 40Riga 14,400 10,000 40Rio de Janeiro 21,200 17,400 44Rome 74,200 44,800 54Santiago de Chile 12,300 9,700 43São Paulo 25,500 12,600 44Seoul 69,800 47,300 52Shanghai 23,700 17,900 45Sofia 11,100 8,400 45Stockholm 45,800 34,400 40Sydney 55,900 45,200 39Taipei 41,300 40,100 49Tallinn 21,400 16,700 40Tel Aviv 33,500 25,400 48Tokyo 70,200 55,900 46Toronto 53,000 40,100 42Vienna 49,000 32,900 43Vilnius 21,900 14,400 40Warsaw 20,500 14,500 40Zurich 69,900 57,500 42
Income and workinghours of cooks
(Chef de Partie)1
1 Commis chef or chef departie in a good restau-rant, supervising about 2 or 3 people, completed vocational training as cook and around 10 years’ experience; about 30 years old, single; salary data includevalue of free board andlodging where provided
City
Gross income
per yearin USD
Net income
per yearin USD
Weeklyworking
hours
Amsterdam 49,200 32,000 36Athens 30,700 22,700 40Auckland 37,300 32,200 40Bangkok 14,500 13,900 45Barcelona 38,900 30,200 38Beijing 18,300 11,800 40Berlin 51,700 36,100 39Bogotá 14,600 13,100 40Bratislava 15,800 12,000 42Brussels 56,900 36,000 38Bucharest 8,800 6,200 40Budapest 21,400 14,000 42Buenos Aires 17,100 14,600 40Cairo 3,200 2,800 45Caracas 15,800 14,400 40Chicago 40,300 31,000 40Copenhagen 72,900 44,600 38Delhi 6,700 6,000 44Doha 27,100 27,100 44Dubai 26,200 26,200 44Dublin 45,800 37,800 36Frankfurt 61,600 43,000 39Geneva 110,900 76,500 40Helsinki 44,700 32,100 37Hong Kong 22,300 21,000 43Istanbul 19,300 14,900 40Jakarta 5,300 5,100 40Johannesburg 11,900 9,700 40Kiev 10,000 8,200 40Kuala Lumpur 11,400 9,700 40Lima 10,100 8,700 42Lisbon 32,400 23,300 35Ljubljana 23,400 17,000 40London 46,600 35,500 39Los Angeles 46,100 34,400 40Luxembourg 93,900 76,300 40Lyon 55,200 41,700 38Madrid 53,500 40,000 37Manama 15,000 14,900 40Manila 3,500 2,600 40Mexico City 7,100 6,600 44Miami 49,300 39,600 40Milan 43,500 30,000 38Montreal 58,900 41,700 37Moscow 19,200 16,800 40Mumbai 7,500 5,800 40Munich 78,200 50,400 40Nairobi 7,500 5,800 45New York 68,400 53,000 41Nicosia 45,600 38,200 35Oslo 69,300 44,600 39Paris 80,700 56,200 35Prague 20,100 15,500 40Riga 18,900 12,700 40Rio de Janeiro 10,900 9,100 43Rome 34,300 24,900 40Santiago de Chile 21,600 16,600 41São Paulo 14,600 12,700 35Seoul 34,100 26,200 43Shanghai 28,900 20,700 40Sofia 10,700 8,200 40Stockholm 48,600 36,300 39Sydney 52,200 42,900 40Taipei 20,600 18,800 42Tallinn 11,800 9,500 40Tel Aviv 28,900 23,100 41Tokyo 79,400 60,400 44Toronto 32,900 24,500 36Vienna 49,100 33,700 39Vilnius 20,200 15,400 40Warsaw 11,900 8,500 40Zurich 96,900 76,300 42
Income and workinghours of bank creditclerks2
2 Completed bank training or apprenticeship and around 10 years’ ex-perience in a bank; about 35 years old, married, two children
Appendix
App
endi
x

Prices and earnings 201242
Appendix
City
Gross income
per yearin USD
Net income
per yearin USD
Weeklyworking
hours
Amsterdam 58,700 36,900 38Athens 44,000 30,300 40Auckland 55,000 43,500 42Bangkok 22,400 20,100 43Barcelona 67,000 47,300 40Beijing 11,700 9,500 40Berlin 74,500 45,500 40Bogotá 65,800 27,700 40Bratislava 43,300 32,500 42Brussels 73,700 39,000 38Bucharest 22,000 15,500 40Budapest 21,100 13,900 46Buenos Aires 17,600 14,600 40Cairo 20,500 17,400 58Caracas 30,600 25,500 40Chicago 88,500 67,900 38Copenhagen 94,500 51,800 40Delhi 11,100 8,900 43Doha 47,000 47,000 45Dubai 91,400 91,400 44Dublin 86,100 61,300 37Frankfurt 77,700 49,700 41Geneva 113,300 82,200 40Helsinki 60,500 40,400 39Hong Kong 63,700 56,200 47Istanbul 39,100 29,000 45Jakarta 13,000 11,400 43Johannesburg 36,800 28,100 40Kiev 14,100 11,800 40Kuala Lumpur 31,200 22,700 40Lima 40,700 29,900 44Lisbon 35,200 24,500 37Ljubljana 41,700 24,900 40London 75,000 52,100 40Los Angeles 69,200 52,200 41Luxembourg 58,300 48,700 40Lyon 70,600 55,000 43Madrid 63,500 46,000 40Manama 33,700 33,500 40Manila 18,800 13,600 40Mexico City 21,200 17,400 49Miami 101,500 68,500 40Milan 60,400 38,700 39Montreal 65,100 42,200 36Moscow 29,500 25,900 40Mumbai 21,100 16,300 45Munich 115,500 65,400 42Nairobi 16,600 11,900 41New York 119,300 90,400 47Nicosia 48,600 40,700 40Oslo 97,400 47,300 39Paris 71,100 48,400 35Prague 25,300 18,600 40Riga 30,400 20,500 40Rio de Janeiro 33,300 24,700 43Rome 65,100 39,200 43Santiago de Chile 36,700 26,500 41São Paulo 67,000 50,400 41Seoul 52,300 35,500 45Shanghai 24,700 18,400 41Sofia 15,200 11,400 43Stockholm 81,900 52,200 40Sydney 93,400 69,500 40Taipei 44,400 39,000 42Tallinn 16,600 13,100 40Tel Aviv 56,200 37,600 43Tokyo 102,100 79,400 45Toronto 47,300 33,200 40Vienna 82,900 50,900 43Vilnius 18,500 14,600 40Warsaw 27,600 19,400 40Zurich 130,000 94,200 41
Income and workinghours of
product managers1
1 Employed in the phar-maceuticals, chemicals or food industry, middle-management position, university or technical college graduate with at least 5 years’ experience in the field; about 35 years old, married, no children
City
Gross income
per yearin USD
Net income
per yearin USD
Weeklyworking
hours
Amsterdam 40,300 29,000 38Athens 21,000 16,200 40Auckland 33,400 28,000 40Bangkok 7,800 7,500 47Barcelona 28,900 22,300 40Beijing 17,100 14,100 42Berlin 38,100 26,500 40Bogotá 12,300 11,100 40Bratislava 16,100 12,200 41Brussels 42,300 24,200 38Bucharest 6,000 4,300 40Budapest 11,100 7,800 40Buenos Aires 15,800 13,200 40Cairo 6,200 5,200 45Caracas 8,400 7,900 40Chicago 42,600 31,700 39Copenhagen 61,900 36,500 38Delhi 5,400 4,400 44Doha 19,800 19,800 40Dubai 22,900 22,900 44Dublin 31,700 25,600 36Frankfurt 50,600 32,900 39Geneva 64,900 49,100 40Helsinki 38,600 28,800 38Hong Kong 25,100 22,400 44Istanbul 13,500 10,600 45Jakarta 4,800 4,400 43Johannesburg 22,400 16,700 40Kiev 4,900 4,000 40Kuala Lumpur 13,200 10,700 40Lima 18,900 15,200 40Lisbon 17,500 14,200 37Ljubljana 16,300 11,300 40London 40,700 30,300 39Los Angeles 44,900 30,600 41Luxembourg 45,700 36,400 40Lyon 26,000 19,900 35Madrid 26,900 22,100 39Manama 15,300 15,300 44Manila 4,000 3,200 48Mexico City 15,500 13,200 47Miami 46,800 36,500 39Milan 32,000 22,400 39Montreal 40,800 27,300 37Moscow 16,800 14,800 40Mumbai 3,800 3,200 49Munich 50,100 31,500 42Nairobi 4,300 3,200 42New York 54,800 42,100 43Nicosia 23,100 20,600 40Oslo 64,900 41,700 39Paris 34,700 25,500 35Prague 13,200 10,400 40Riga 13,700 9,300 40Rio de Janeiro 10,700 9,700 43Rome 34,800 23,700 40Santiago de Chile 11,300 8,900 41São Paulo 13,900 12,400 40Seoul 27,100 20,900 43Shanghai 12,300 10,700 40Sofia 7,400 5,600 40Stockholm 41,100 31,100 40Sydney 50,500 41,800 40Taipei 15,500 14,400 42Tallinn 14,200 11,300 40Tel Aviv 18,400 15,500 42Tokyo 48,800 36,000 42Toronto 26,300 19,200 38Vienna 49,900 33,800 40Vilnius 10,400 7,900 40Warsaw 11,700 8,300 40Zurich 71,100 54,300 42
Income and workinghours of secretaries/personal assistants2
2 Secretary/personal assistant to a department head in an industrial or service company,around 5 years’ expe-rience (PC skills, 1 foreign language); about 25 years old, single

Prices and earnings 2012 43
City
Gross income
per yearin USD
Net income
per yearin USD
Weeklyworking
hours
Amsterdam 31,100 23,200 38Athens 17,700 14,000 42Auckland 26,900 22,700 40Bangkok 6,000 5,800 46Barcelona 25,500 19,400 40Beijing 8,900 7,100 40Berlin 28,200 19,900 35Bogotá 7,400 6,900 45Bratislava 9,600 7,600 42Brussels 35,200 21,800 38Bucharest 8,200 6,000 40Budapest 8,200 5,600 43Buenos Aires 14,600 12,200 40Cairo 5,400 4,700 51Caracas 9,500 9,100 40Chicago 23,200 17,100 31Copenhagen 46,000 28,200 38Delhi 3,000 2,700 47Doha 10,900 10,900 48Dubai 13,600 13,600 48Dublin 25,300 20,700 36Frankfurt 37,900 26,200 38Geneva 49,200 37,800 43Helsinki 34,600 26,500 37Hong Kong 22,100 20,100 52Istanbul 9,500 7,800 45Jakarta 2,700 2,600 41Johannesburg 10,500 8,500 45Kiev 4,100 3,400 43Kuala Lumpur 7,400 6,300 40Lima 6,700 6,000 48Lisbon 15,000 12,400 37Ljubljana 12,800 9,100 40London 26,300 20,500 38Los Angeles 36,500 24,900 40Luxembourg 28,500 24,100 40Lyon 22,500 17,900 35Madrid 17,500 14,500 40Manama 19,900 19,900 45Manila 3,100 2,700 50Mexico City 4,800 4,400 47Miami 30,700 24,500 39Milan 29,700 20,900 36Montreal 25,900 17,600 36Moscow 12,200 10,600 41Mumbai 2,700 2,300 46Munich 40,300 26,000 40Nairobi 3,400 2,700 49New York 42,300 33,400 39Nicosia 20,200 17,900 40Oslo 49,500 31,900 39Paris 25,300 19,000 35Prague 12,200 9,600 40Riga 8,700 6,200 40Rio de Janeiro 6,600 6,100 44Rome 22,100 16,200 40Santiago de Chile 8,200 6,500 45São Paulo 8,700 6,900 44Seoul 21,800 17,400 55Shanghai 7,400 6,100 40Sofia 7,400 5,600 40Stockholm 37,400 28,500 40Sydney 40,400 33,500 40Taipei 12,700 11,700 42Tallinn 8,800 7,300 40Tel Aviv 12,300 10,600 36Tokyo 35,100 26,000 43Toronto 28,000 22,700 39Vienna 30,000 23,100 39Vilnius 6,500 5,100 40Warsaw 11,000 7,900 40Zurich 61,400 48,200 41
Income and workinghours of
female salesassistants1
1 Employed in the women’s clothing section of a large department store; sales training plus several years’ sales experience, about 20 to 25 years old, single
City
Gross income
per yearin USD
Net income
per yearin USD
Weeklyworking
hours2
Amsterdam 48,400 32,600 39Athens 26,200 19,400 30Auckland 35,700 30,300 40Bangkok 8,300 8,000 43Barcelona 41,300 31,300 38Beijing 11,400 9,100 40Berlin 56,900 39,800 40Bogotá 11,100 10,200 43Bratislava 11,300 8,900 41Brussels 44,000 26,700 38Bucharest 5,600 4,000 40Budapest 8,900 7,100 40Buenos Aires 8,700 7,100 40Cairo 1,600 1,300 36Caracas 10,500 9,800 36Chicago 49,300 38,500 39Copenhagen 86,500 52,200 38Delhi 4,500 3,900 41Doha 22,300 22,300 47Dubai 35,900 35,900 37Dublin 57,100 45,700 32Frankfurt 60,900 46,100 39Geneva 89,600 66,700 36Helsinki 48,000 33,800 37Hong Kong 52,500 47,800 44Istanbul 14,800 11,000 40Jakarta 2,700 2,600 43Johannesburg 17,700 14,400 40Kiev 3,800 3,500 32Kuala Lumpur 10,400 8,700 35Lima 6,300 5,300 44Lisbon 32,000 23,100 31Ljubljana 29,000 20,500 40London 55,700 39,800 36Los Angeles 55,700 46,600 38Luxembourg 113,300 88,200 26Lyon 33,900 26,700 35Madrid 29,100 22,800 28Manama 19,800 19,600 40Manila 3,400 2,300 43Mexico City 8,400 7,400 40Miami 63,500 51,700 43Milan 32,800 21,800 23Montreal 56,700 38,500 35Moscow 11,900 10,500 40Mumbai 3,800 3,500 36Munich 51,200 38,500 40Nairobi 4,000 3,200 45New York 62,900 50,400 43Nicosia 47,400 40,800 33Oslo 61,500 39,500 36Paris 38,700 29,500 31Prague 13,200 10,700 40Riga 8,400 6,000 40Rio de Janeiro 13,700 12,200 40Rome 30,600 22,100 25Santiago de Chile 15,400 12,300 38São Paulo 10,600 9,500 33Seoul 65,400 44,300 43Shanghai 12,200 10,100 40Sofia 4,700 3,500 34Stockholm 46,600 34,800 40Sydney 57,400 46,200 39Taipei 25,600 23,100 42Tallinn 11,400 9,200 35Tel Aviv 20,700 17,700 40Tokyo 78,200 59,800 44Toronto 82,900 49,900 38Vienna 44,700 31,900 39Vilnius 10,500 8,000 38Warsaw 11,900 8,500 25Zurich 104,600 81,600 42
Income and workinghours ofprimary school teachers3
2 Only comparable to a limited extent; as a rule, number of teaching hours plus average number of hours required for preparation, but in some cases teaching hours only3 Teaching in the state school system (not private schools) for around 10 years; about 35 years old, married, two children
Appendix
App
endi
x

Prices and earnings 201244
UBS CIO WM Research is published by Wealth Management & Swiss Bank and Wealth Management Americas, Business Divisions of UBS AG (UBS) or an affiliate thereof. In certain countries UBS AG is referred to as UBS SA. This publication is for your information only and is not intended as an offer, or a solicitation of an offer, to buy or sell any investment or other specific product. The analysis contained herein is based on numerous assumptions. Different assumptions could result in materially different results. Certain services and products are subject to legal restrictions and cannot be offered worldwide on an unrestricted basis and/or may not be eligible for sale to all investors� All information and opinions expressed in this document were obtained from sources believed to be reliable and in good faith, but no representation or warranty, express or implied, is made as to its accuracy or completeness (other than disclosures relating to UBS and its affiliates). All information and opinions as well as any prices indicated are current as of the date of this report, and are subject to change without notice. Opinions expressed herein may differ or be contrary to those expressed by other business areas or divisions of UBS as a result of using different assumptions and/or criteria. At any time UBS AG and other companies in the UBS group (or employees thereof) may have a long or short position, or deal as principal or agent, in relevant securities or provide advisory or other services to the issuer of relevant securities or to a company connected with an issuer� Some investments may not be readily realizable since the market in the securities is illiquid and therefore valuing the investment and identifying the risk to which you are exposed may be difficult to quantify. UBS relies on information barriers to control the flow of information contained in one or more areas within UBS, into other areas, units, divisions or affiliates of UBS. Futures and options trading is considered risky. Past performance of an investment is no guarantee for its future performance� Some investments may be subject to sudden and large falls in value and on realization you may receive back less than you invested or may be required to pay more. Changes in FX rates may have an adverse effect on the price, value or income of an investment. We are of necessity unable to take into account the particular investment objectives, financial situation and needs of our individual clients and we would recommend that you take financial and/or tax advice as to the implications (including tax) of investing in any of the products mentioned herein. This document may not be reproduced or copies circulated without prior authority of UBS or a subsidiary of UBS� UBS expressly prohibits the distribution and transfer of this document to third parties for any reason� UBS will not be liable for any claims or lawsuits from any third parties arising from the use or distribution of this document� This report is for distribution only under such circumstances as may be permitted by applicable law. In developing the Chief Investment Office economic forecasts, CIO economists worked in collaboration with economists employed by UBS Investment Research� Forecasts and estimates are current only as of the date of this publication and may change without notice�
External Asset Managers / External Financial Consultants: In case this research or publication is provided to an External Asset Manager or an External Financial Consultant, UBS expressly prohibits that it is redistributed by the External Asset Manager or the External Financial Consultant and is made available to their clients and/or third parties� Australia: 1) Clients of UBS Wealth Management Australia Ltd: This notice is distributed to clients of UBS Wealth Management Australia Ltd ABN 50 005 311 937 (Holder of Australian Financial Services Licence No. 231127), Chifley Tower, 2 Chifley Square, Sydney, New South Wales, NSW 2000, by UBS Wealth Management Australia Ltd.: This Document contains general information and/or general advice only and does not constitute personal financial product advice. As such the content of the Document was prepared without taking into account the objectives, financial situation or needs of any specific recipient. Prior to making any investment decision, a recipient should obtain personal financial product advice from an independent adviser and consider any relevant offer documents (including any product disclosure statement) where the acquisition of financial products is being considered. 2) Clients of UBS AG: This notice is issued by UBS AG ABN 47 088 129 613 (Holder of Australian Financial Services Licence No 231087): This Document is issued and distributed by UBS AG� This is the case despite anything to the contrary in the Document. The Document is intended for use only by “Wholesale Clients” as defined in section 761G (“Wholesale Clients”) of the Corporations Act 2001 (Cth) (“Corporations Act”). In no circumstances may the Document be made available by UBS AG to a “Retail Client” as defined in section 761G of the Corporations Act. UBS AG,s research services are only available to Wholesale Clients� The Document is general information only and does not take into account any person,s investment objectives, financial and taxation situation or particular needs. Austria: This publication is not intended to constitute a public offer or a comparable solicitation under Austrian law and will only be used under circumstances which will not be equivalent to a public offering of securities in Austria. The document may only be used by the direct recipient of this information and may under no circumstances be passed on to any other investor� Bahamas: This publication is distributed to private clients of UBS (Bahamas) Ltd and is not intended for distribution to persons designated as a Bahamian citizen or resident under the Bahamas Exchange Control Regulations� Bahrain: UBS AG is a Swiss bank not licensed, supervised or regulated in Bahrain by the Central Bank of Bahrain and does not undertake banking or investment business activities in Bahrain� Therefore, Clients have no protection under local banking and investment services laws and regulations� Belgium: This publication is not intended to constitute a public offering or a comparable solicitation under Belgian law, but might be made available for information purposes to clients of UBS Belgium NV/SA, a regulated bank under the “Commission Bancaire, Financière et des Assurances”, to which this publication has not been submitted for approval� Canada: In Canada, this publication is distributed to clients of UBS Wealth Management Canada by UBS Investment Management Canada Inc�� Dubai: Research is issued by UBS AG Dubai Branch within the DIFC, is intended for professional clients only and is not for onward distribution within the United Arab Emirates� France: This publication is distributed by UBS (France) S�A�, French “société anonyme” with share capital of € 125�726�944, 69, boulevard Haussmann F-75008 Paris, R�C�S� Paris B 421 255 670, to its clients and prospects� UBS (France) S�A� is a provider of investment services duly authorized according to the terms of the “Code Monétaire et Financier”, regulated by French banking and financial authorities as the “Banque de France” and the “Autorité des Marchés Financiers”. Germany: The issuer under German Law is UBS Deutschland AG, Bockenheimer Landstrasse 2-4, 60306 Frankfurt am Main� UBS Deutschland AG is authorized and regulated by the “Bundesanstalt für Finanzdienstleistungsaufsicht”� Hong Kong: This publication is distributed to clients of UBS AG Hong Kong Branch by UBS AG Hong Kong Branch, a licensed bank under the Hong Kong Banking Ordinance and a registered institution under the Securities and Futures Ordinance� Indonesia: This research or publication is not intended and not prepared for purposes of public offering of securities under the Indonesian Capital Market Law and its implementing regulations. Securities mentioned in this material have not been, and will not be, registered under the Indonesian Capital Market Law and Regulations� Italy: This publication is distributed to the clients of UBS (Italia) S.p.A., via del vecchio politecnico 3, Milano, an Italian bank duly authorized by Bank of Italy to the provision of financial services and supervised by „Consob“ and Bank of Italy� Jersey: UBS AG, Jersey Branch, is regulated and authorized by the Jersey Financial Services Commission for the conduct of banking, funds and investment business� Luxembourg: This publication is not intended to constitute a public offer under Luxembourg law, but might be made available for information purposes to clients of UBS (Luxembourg) S�A�, a regulated bank under the supervision of the „Commission de Surveillance du Secteur Financier“ (CSSF), to which this publication has not been submitted for approval� Mexico: This document has been distributed by UBS Asesores México, S�A� de C�V�, a company which is not subject to supervision by the National Banking and Securities Commission of Mexico and is not part of UBS Grupo Financiero, S�A� de C�V� or of any other Mexican financial group and whose obligations are not guaranteed by any third party. UBS Asesores México, S.A. de C.V. does not guarantee any yield whatsoever. Singapore: Please contact UBS AG Singapore branch, an exempt financial adviser under the Singapore Financial Advisers Act (Cap. 110) and a wholesale bank licensed under the Singapore Banking Act (Cap� 19) regulated by the Monetary Authority of Singapore, in respect of any matters arising from, or in connection with, the analysis or report� Spain: This publication is distributed to clients of UBS Bank, S�A� by UBS Bank, S�A�, a bank registered with the Bank of Spain� UAE: This research report is not intended to constitute an offer, sale or delivery of shares or other securities under the laws of the United Arab Emirates (UAE). The contents of this report have not been and will not be approved by any authority in the United Arab Emirates including the UAE Central Bank or Dubai Financial Authorities, the Emirates Securities and Commodities Authority, the Dubai Financial Market, the Abu Dhabi Securities market or any other UAE exchange� UK: Approved by UBS AG, authorized and regulated in the UK by the Financial Services Authority� A member of the London Stock Exchange� This publication is distributed to private clients of UBS London in the UK� Where products or services are provided from outside the UK, they will not be covered by the UK regulatory regime or the Financial Services Compensation Scheme� USA: This document is not intended for distribution into the US and / or to US persons. UBS Securities LLC is a subsidiary of UBS AG and an affiliate of UBS Financial Services Inc., UBS Financial Services Inc� is a subsidiary of UBS AG�
Version 05/2012�
© UBS 2012� The key symbol and UBS are among the registered and unregistered trademarks of UBS� All rights reserved�

Prices and earnings 2012 45
Prices and Earnings
Publisher: UBS AG, CIO WM Research, P�O� Box, CH-8098 Zurich, SwitzerlandChief Economist: Dr� Andreas HöfertChief Economist Switzerland: Dr� Daniel KaltHead Eurozone Economics: Ricardo GarciaProject manager: Marcel AisslingerAuthors/Analysis: Marcel Aisslinger, Rebecca KutzProduct manager: Réda MouhidEditor, translation: Andrew DeBoo, CLS Communication AG, Zurich Desktop: CIO Digital & Print PublishingFeedback/Contact: sh-prices-earnings@ubs�comPrinters: galledia ag, Flawil, SwitzerlandPhoto: ZoonarOrder from: UBS AG, P�O� Box, CH-8098 Zurich, SwitzerlandFax +41 44 238 50 21, E-Mail: sh-iz-ubs-publikationen@ubs�com
Prices and earnings is published on the Internet: www�ubs�com/research
Prices and earnings appears in German (EUR), French (EUR) and English (USD) This edition was released on 7 September 2012� The application Prices & Earnings (for iOS) can be downloaded from iTunes�
© UBS AG 2012
SAP-Nr� 80526E-1201

Until we’re perfectly in tune.
Harmony is only achieved when everyone’s in tune.
And to be in tune, you have to listen.
Really listen.
At UBS, we know all about listening.
We do it every day.
To the words. The pauses. Even the silences.
Yes, we offer investment solutions that aretailor-made to meet your needs.
And we can put the expertise and resources of a truly integrated, global firm at your disposal.
But all that would mean nothing if we didn’t listen.
To you.
We will not rest
© UBS 2012. All rights reserved.
1X_0007_UBS_WM_ShAds_Orchestra_Master_A4_e.indd 1 04.02.11 16:21
©
www.ubs.com