CoStar Office Report · Coral Gables Market Coral Way Market Cypress Creek Market Delray Beach...
74
South Florida Retail Market FIRST QUARTER 2011 The CoStar Retail Report
Transcript of CoStar Office Report · Coral Gables Market Coral Way Market Cypress Creek Market Delray Beach...
South Florida Retail MarketF I R S T Q U A R T E R 2 0 1 1
The CoStarRetail Report
South Florida Retail Market
©2011 COSTAR GROUP, INC. THE COSTAR RETAIL REPORT A
FIRST QUARTER 2011 – SOUTH FLORIDA
Table of ContentsTable of Contents . . . . . . . . . . . . . . . . . . . . . . . . . . . . . . . . . . . . . . . . . . . . . . . . . . . . . . . . . . . . . . . . . . . . A
Methodology. . . . . . . . . . . . . . . . . . . . . . . . . . . . . . . . . . . . . . . . . . . . . . . . . . . . . . . . . . . . . . . . . . . . . . . . C
Terms & Definitions. . . . . . . . . . . . . . . . . . . . . . . . . . . . . . . . . . . . . . . . . . . . . . . . . . . . . . . . . . . . . . . . . . D
Market Highlights & Overview. . . . . . . . . . . . . . . . . . . . . . . . . . . . . . . . . . . . . . . . . . . . . . . . . . . . . . . . . 1
CoStar Markets & Submarkets . . . . . . . . . . . . . . . . . . . . . . . . . . . . . . . . . . . . . . . . . . . . . . . . . . . . . . . . . 4
Inventory & Development Analysis. . . . . . . . . . . . . . . . . . . . . . . . . . . . . . . . . . . . . . . . . . . . . . . . . . . . . . 5Construction Activity MapInventory & Development AnalysisSelect Top DeliveriesSelect Top Under Construction Properties
Figures at a Glance . . . . . . . . . . . . . . . . . . . . . . . . . . . . . . . . . . . . . . . . . . . . . . . . . . . . . . . . . . . . . . . . . . 10Figures at a Glance by Building Type & MarketFigures at a Glance by Building Type & SubmarketHistorical Figures at a Glance
Leasing Activity Analysis . . . . . . . . . . . . . . . . . . . . . . . . . . . . . . . . . . . . . . . . . . . . . . . . . . . . . . . . . . . . . 24Leasing Activity MapLeasing Activity AnalysisSelect Top Lease Transactions
Sales Activity Analysis . . . . . . . . . . . . . . . . . . . . . . . . . . . . . . . . . . . . . . . . . . . . . . . . . . . . . . . . . . . . . . . 27Sales Activity AnalysisSelect Top Sales Transactions
Analysis of Individual CoStar Markets . . . . . . . . . . . . . . . . . . . . . . . . . . . . . . . . . . . . . . . . . . . . . . . . . . 29Select Same Building SalesSelect Land SalesAventura MarketBiscayne Corridor MarketBoca Raton MarketBoynton/Lantana MarketBrickell MarketCoconut Grove MarketCommercial Blvd MarketCoral Gables MarketCoral Way MarketCypress Creek MarketDelray Beach MarketDowntown Fort Lauderdale MarketDowntown Miami MarketFort Lauderdale MarketHallandale MarketHollywood MarketJupiter MarketKendall MarketMedley/Hialeah MarketMiami MarketMiami Airport MarketMiami Beach MarketMiami Lakes MarketMiami-Dade Central County MarketNorth Palm Beach MarketNortheast Dade MarketNW Broward/Coral Springs MarketOutlying Broward County Market

South Florida Retail Market
B THE COSTAR RETAIL REPORT ©2011 COSTAR GROUP, INC.
SOUTH FLORIDA – FIRST QUARTER 2011
South Florida Retail Market
©2011 COSTAR GROUP, INC. THE COSTAR RETAIL REPORT C
FIRST QUARTER 2011 – SOUTH FLORIDA
Table of Contents (Continued)
Outlying Miami-Dade Cnty MarketPalm Beach MarketPalm Springs/Lake Worth MarketPlantation MarketPompano Beach MarketRoyal Palm Bch/Wellington MarketSawgrass Park MarketSouth Dade MarketSouthwest Broward MarketWest Miami MarketWest Palm Beach Market

South Florida Retail Market
B THE COSTAR RETAIL REPORT ©2011 COSTAR GROUP, INC.
SOUTH FLORIDA – FIRST QUARTER 2011
South Florida Retail Market
©2011 COSTAR GROUP, INC. THE COSTAR RETAIL REPORT C
FIRST QUARTER 2011 – SOUTH FLORIDA
Methodology
The CoStar Retail Report calculates Retail statistics using CoStar Group's base of existing, under construction and under renovation Retail buildings in each given metropolitan area. All Retail building types are included, including Community Center, Freestanding Retail, Neighborhood Center, Power Center, Regional Mall, Specialty Center and Unanchored Strip Center, in both single-tenant and multi-tenant buildings, including owner-occupied buildings. CoStar Group's national database includes approximately 71.7 billion square feet of coverage in 3 million properties. All rental rates reported in the CoStar Retail Report are calculated using Triple Net (NNN) rental rates.
© Copyright 2010 CoStar Group, Inc. All Rights Reserved. Although CoStar makes efforts to ensure the accuracy and reliability of the information contained herein, CoStar makes no guarantee, representation or warranty regarding the quality, accuracy, timeliness or completeness of the information. The publication is provided ‘as is’ and CoStar expressly disclaims any guarantees, representations or warranties of any kind, including those of MERCHANTABILITY AND FITNESS FOR A PARTICULAR PURPOSE.
CoStar Group, Inc.
1331 L ST NW • Washington, DC USA 20005 • (800) 204-5960 • www.costar.com • NASDAQ: CSGP
For information on subscribing to CoStar’s other products and services, please contact us at
1-877-7COSTAR, or visit our web site at www.costar.com
South Florida Retail Market
D THE COSTAR RETAIL REPORT ©2011 COSTAR GROUP, INC.
SOUTH FLORIDA – FIRST QUARTER 2011
South Florida Retail Market
©2011 COSTAR GROUP, INC. THE COSTAR RETAIL REPORT E
FIRST QUARTER 2011 – SOUTH FLORIDA
Terms & DefinitionsAnchor Tenant: A large national or regional retailer that serves as a primary draw for a shopping center; a store strategically located in a retail property in order to enhance, bring attention to, or increase traffic at the property. Sometimes called a “destination” tenant, usually these tenants lease at least 25,000 SF.
Availability Rate: The ratio of available space to total rentable space, calculated by dividing the total available square feet by the total rentable square feet.
Available Space: The total amount of space that is currently being marketed as available for lease in a given time period. It includes any space that is available, regardless of whether the space is vacant, occupied, available for sublease, or available at a future date.
Buyer: The individual, group, company, or entity that has pur-chased a commercial real estate asset.
Cap Rate: Short for capitalization rate. The Cap Rate is a calcula-tion that reflects the relationship between one year’s net operating income and the current market value of a particular property. The Cap Rate is calculated by dividing the annual net operating income by the sales price (or asking sales price).
Community Center: A shopping center development that has a total square footage between 100,000 – 350,000 SF. Generally will have 2-3 large anchored tenants, but not department store anchors. Community Center typically offers a wider range of apparel and other soft goods than the Neighborhood Center. Among the more common anchors are supermarkets and super drugstores. Community Center tenants sometime contain retail-ers selling such items as apparel, home improvement/furnishings, toys, electronics or sporting goods. The center is usually config-ured as a strip, in a straight line, or an “L” or “U” shape.
Construction Starts: Buildings that began construction during a specific period of time. (See also: Deliveries)
Deliveries: Buildings that complete construction during a specified period of time. In order for space to be considered delivered, a certificate of occupancy must have been issued for the property.
Delivery Date: The date a building completes construction and receives a certificate of occupancy.
Developer: The company, entity or individual that transforms raw land to improved property by use of labor, capital and entrepre-neurial efforts.
Direct Space: Space that is being offered for lease directly from the landlord or owner of a building, as opposed to space being offered in a building by another tenant (or broker of a tenant) trying to sublet a space that has already been leased.
Existing Inventory: The square footage of buildings that have received a certificate of occupancy and are able to be occupied by tenants. It does not include space in buildings that are either planned, under construction or under renovation.
Freestanding Retail: Single tenant building with a retail tenant. Examples include video stores, fast food restaurant, etc.
Full Service Rental Rate: Rental rates that include all operating expenses such as utilities, electricity, janitorial services, taxes and insurance.
General Retail: Typically are single tenant freestanding general-purpose commercial buildings with parking. Many single retail buildings fall into this use code, especially when they don’t meet any of the more detailed use code descriptions.
Growth in Inventory: The change in size of the existing square footage in a given area over a given period of time, generally due to the construction of new buildings.
Landlord Rep: (Landlord Representative) In a typical lease trans-
action between an owner/landlord and tenant, the broker that represents the interests of the owner/landlord is referred to as the Landlord Rep.
Leased Space: All the space that has a financial lease obligation. It includes all leased space, regardless of whether the space is currently occupied by a tenant. Leased space also includes space being offered for sublease.
Leasing Activity: The volume of square footage that is commit-ted to and signed under a lease obligation for a specific building or market in a given period of time. It includes direct leases, subleases and renewals of existing leases. It also includes any pre-leasing activity in planned, under construction, or under renovation buildings.
Lifestyle Center: An upscale, specialty retail, main street concept shopping center. An open center, usually without anchors, about 300,000 SF GLA or larger, located near affluent neighborhoods, includes upscale retail, trendy restaurants and entertainment retail. Nicely landscaped with convenient parking located close to the stores.
Mall: The combined retail center types of Lifestyle Center, Regional Mall and Super Regional Mall.
Market: Geographic boundaries that serve to delineate core areas that are competitive with each other and constitute a generally accepted primary competitive set of areas. Markets are building-type specific, and are non-overlapping contiguous geographic designations having a cumulative sum that matches the boundar-ies of the entire Region (See also: Region). Markets can be further subdivided into Submarkets. (See also: Submarkets)
Multi-Tenant: Buildings that house more than one tenant at a given time. Usually, multi-tenant buildings were designed and built to accommodate many different floor plans and designs for different tenant needs. (See also: Tenancy).
Neighborhood Center: Provides for the sales of convenience goods (food, drugs, etc.) and personal services (laundry, dry cleaning, etc.) for day-to-day living needs of the immediate neigh-borhood with a supermarket being the principal tenant. In theory, the typical GLA is 50,000 square feet. In practice, the GLA may range from 30,000 to 100,000 square feet.
Net Absorption: The net change in occupied space over a given period of time. Unless otherwise noted Net Absorption includes direct and sublease space.
New Space: Sometimes called first generation space, refers to space that has never been occupied and/or leased by a tenant.
Occupied Space: Space that is physically occupied by a tenant. It does not include leased space that is not currently occupied by a tenant.
Outlet Center: Usually located in a rural or occasionally in a tour-ist location, an Outlet Center consists of manufacturer’s outlet stores selling their own brands at a discount. 50,000 – 500,000 SF. An Outlet Center does not have to be anchored. A strip con-figuration is most common, although some are enclosed malls and others can be arranged in a village cluster.
Owner: The company, entity, or individual that holds title on a given building or property.
Planned/Proposed: The status of a building that has been announced for future development but not yet started construction.
Power Center: The center typically consists of several freestand-ing (unconnected) anchors and only a minimum amount of small specialty tenants. 250,000 – 600,000 SF. A Power Center is dom-inated by several large anchors, including discount department stores, off-price stores, warehouse clubs, or "category killers," i.e.,

South Florida Retail Market
D THE COSTAR RETAIL REPORT ©2011 COSTAR GROUP, INC.
SOUTH FLORIDA – FIRST QUARTER 2011
South Florida Retail Market
©2011 COSTAR GROUP, INC. THE COSTAR RETAIL REPORT E
FIRST QUARTER 2011 – SOUTH FLORIDA
stores that offer tremendous selection in a particular merchandise category at low prices.
Preleased Space: The amount of space in a building that has been leased prior to its construction completion date, or certificate of occupancy date.
Price/SF: Calculated by dividing the price of a building (either sales price or asking sales price) by the Rentable Building Area (RBA).
Quoted Rental Rate: The asking rate per square foot for a par-ticular building or unit of space by a broker or property owner. Quoted rental rates may differ from the actual rates paid by tenants following the negotiation of all terms and conditions in a specific lease.
RBA: Abbreviation for Rentable Building Area. (See also: Rentable Building Area)
Region: Core areas containing a large population nucleus, that together with adjacent communities have a high degree of eco-nomic and social integration. Regions are further divided into market areas, called Markets. (See also: Markets)
Regional Mall: Provides shopping goods, general merchandise, apparel, and furniture, and home furnishings in full depth and variety. It is built around the full-line department store with a minimum GLA of 100,000 square feet, as the major drawing power. For even greater comparative shopping, two, three, or more department stores may be included. In theory a regional center has a GLA of 400,000 square feet, and may range from 300,000 to more than 1,000,000 square feet. Regional centers in excess of 750,000 square feet GLA with three or more depart-ment stores are considered Super Regional. (See also: Super Regional Mall).
Relet Space: Sometimes called second generation or direct space, refers to existing space that has previously been occupied by another tenant.
Rentable Building Area: (RBA) The total square footage of a building that can be occupied by, or assigned to a tenant for the purpose of determining a tenant’s rental obligation. Generally RBA includes a percentage of common areas including all hall-ways, main lobbies, bathrooms, and telephone closets.
Rental Rates: The annual costs of occupancy for a particular space quoted on a per square foot basis.
Sales Price: The total dollar amount paid for a particular property at a particular point in time.
Sales Volume: The sum of sales prices for a given group of build-ings in a given time period.
Seller: The individual, group, company, or entity that sells a par-ticular commercial real estate asset.
SF: Abbreviation for Square Feet.
Shopping Center: The combined retail center types of Community Center, Neighborhood Center and Strip Center.
Single-Tenant: Buildings that are occupied, or intended to be occupied by a single tenant. (See also: Build-to-suit and Tenancy)
Specialty Center: The combined retail center types of Airport Retail, Outlet Center and Theme/Festival Center.
Sports & Entertainment: A facility suited for recreational activi-ties, including: Amusement Facility, Aquatic Facility/Swimming Pool, Bowling Alley, Casino/Gaming Facility, Equestrian Center/Stable, Fitness, Court and Spa Facility, Golf Related, Racetrack, Skating Rink, Ski Resort, Sports Arena/Stadium, and Theatre/Performing Art Facility.
Strip Center: A strip center is an attached row of stores or service outlets managed as a coherent retail entity, with on-site parking usually located in front of the stores. Open canopies may con-nect the storefronts, but a strip center does not have enclosed walkways linking the stores. A strip center may be configured in
a straight line, or have an "L" or "U" shape.
Sublease Space: Space that has been leased by a tenant and is being offered for lease back to the market by the tenant with the lease obligation. Sublease space is sometimes referred to as sublet space.
Submarkets: Specific geographic boundaries that serve to delin-eate a core group of buildings that are competitive with each other and constitute a generally accepted primary competitive set, or peer group. Submarkets are building type specific (office, industrial, retail, etc.), with distinct boundaries dependent on different factors relevant to each building type. Submarkets are non-overlapping, contiguous geographic designations having a cumulative sum that matches the boundaries of the Market they are located within (See also: Market).
Super Regional Mall: Similar to a regional mall, but because of its larger size, a super regional mall has more anchors, a deeper selec-tion of merchandise, and draws from a larger population base. As with regional malls, the typical configuration is as an enclosed mall, frequently with multiple levels (See also: Regional Mall).
Tenancy: A term used to indicate whether or not a building is occupied by multiple tenants (See also: Multi-tenant) or a single tenant. (See also: Single-tenant)
Tenant Rep: Tenant Rep stands for Tenant Representative. In a typical lease transaction between an owner/landlord and tenant, the broker that represents the interests of the tenant is referred to as a Tenant Rep.
Theme/Festival Center: These centers typically employ a unify-ing theme that is carried out by the individual shops in their architectural design and, to an extent, in their merchandise. Sometimes the biggest appeal of these centers is to tourists; they can be anchored by restaurants and entertainment facilities. These centers, generally located in urban areas, tend to be adapted from older, sometimes historic, buildings, and can be part of mixed-use projects. 80,000 – 250,000 SF.
Under Construction: The status of a building that is in the process of being developed, assembled, built or constructed. A building is considered to be under construction after it has begun construc-tion and until it receives a certificate of occupancy.
Vacancy Rate: A measurement expressed as a percentage of the total amount of physically vacant space divided by the total amount of existing inventory. Under construction space generally is not included in vacancy calculations.
Vacant Space: Space that is not currently occupied by a tenant, regardless of any lease obligation that may be on the space. Vacant space could be space that is either available or not avail-able. For example, sublease space that is currently being paid for by a tenant but not occupied by that tenant, would be considered vacant space. Likewise, space that has been leased but not yet occupied because of finish work being done, would also be con-sidered vacant space.
Weighted Average Rental Rate: Rental rates that are calculated by factoring in, or weighting, the square footage associated with each particular rental rate. This has the effect of causing rental rates on larger spaces to affect the average more than that of smaller spaces. The weighted average rental rate is calculated by taking the ratio of the square footage associated with the rental rate on each individual available space to the square footage associated with rental rates on all available spaces, multiplying the rental rate by that ratio, and then adding together all the resulting numbers. Unless specifically specified otherwise, rental rate averages include both Direct and Sublet available spaces.
Year Built: The year in which a building completed construction and was issued a certificate of occupancy.
YTD: Abbreviation for Year-to-Date. Describes statistics that are cumulative from the beginning of a calendar year through what-ever time period is being studied.
FIRST QUARTER 2011 – SOUTH FLORIDA
South Florida Retail Market
©2011 COSTAR GROUP, INC. THE COSTAR RETAIL REPORT 1
OVERVIEW
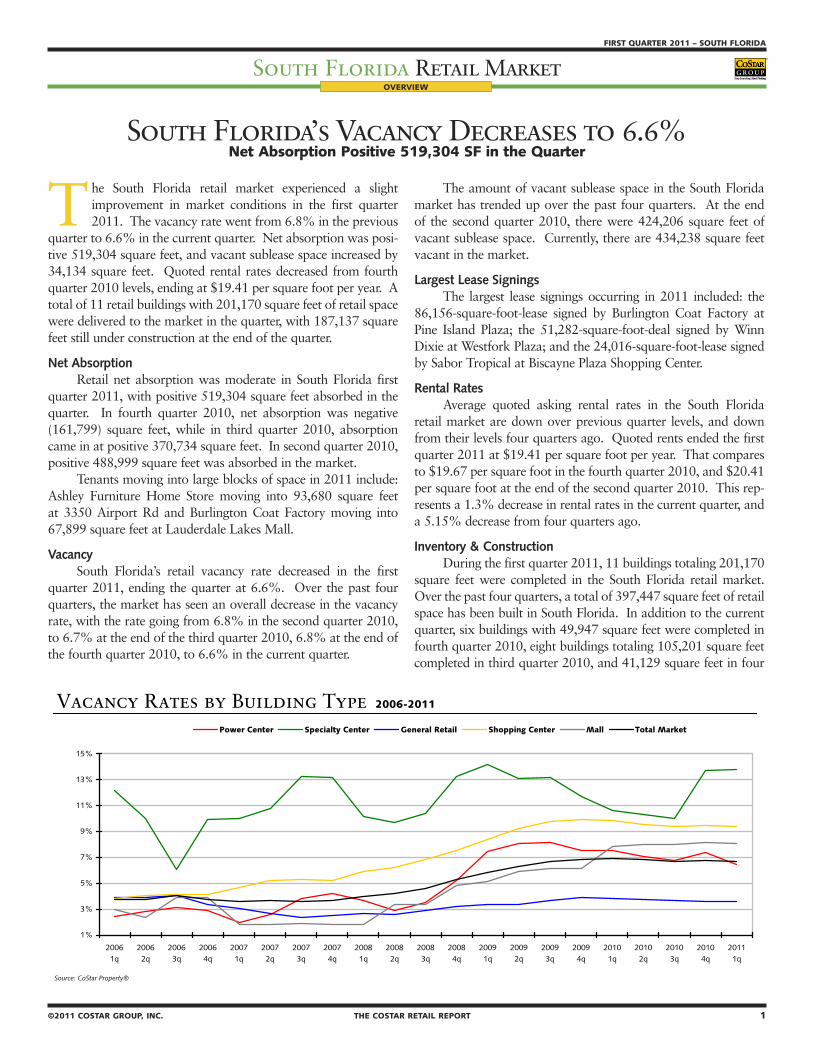
South Florida’s Vacancy Decreases to 6.6% Net Absorption Positive 519,304 SF in the Quarter
The South Florida retail market experienced a slight improvement in market conditions in the first quarter 2011. The vacancy rate went from 6.8% in the previous
quarter to 6.6% in the current quarter. Net absorption was posi-tive 519,304 square feet, and vacant sublease space increased by 34,134 square feet. Quoted rental rates decreased from fourth quarter 2010 levels, ending at $19.41 per square foot per year. A total of 11 retail buildings with 201,170 square feet of retail space were delivered to the market in the quarter, with 187,137 square feet still under construction at the end of the quarter.
Net AbsorptionRetail net absorption was moderate in South Florida first
quarter 2011, with positive 519,304 square feet absorbed in the quarter. In fourth quarter 2010, net absorption was negative (161,799) square feet, while in third quarter 2010, absorption came in at positive 370,734 square feet. In second quarter 2010, positive 488,999 square feet was absorbed in the market.
Tenants moving into large blocks of space in 2011 include: Ashley Furniture Home Store moving into 93,680 square feet at 3350 Airport Rd and Burlington Coat Factory moving into 67,899 square feet at Lauderdale Lakes Mall.
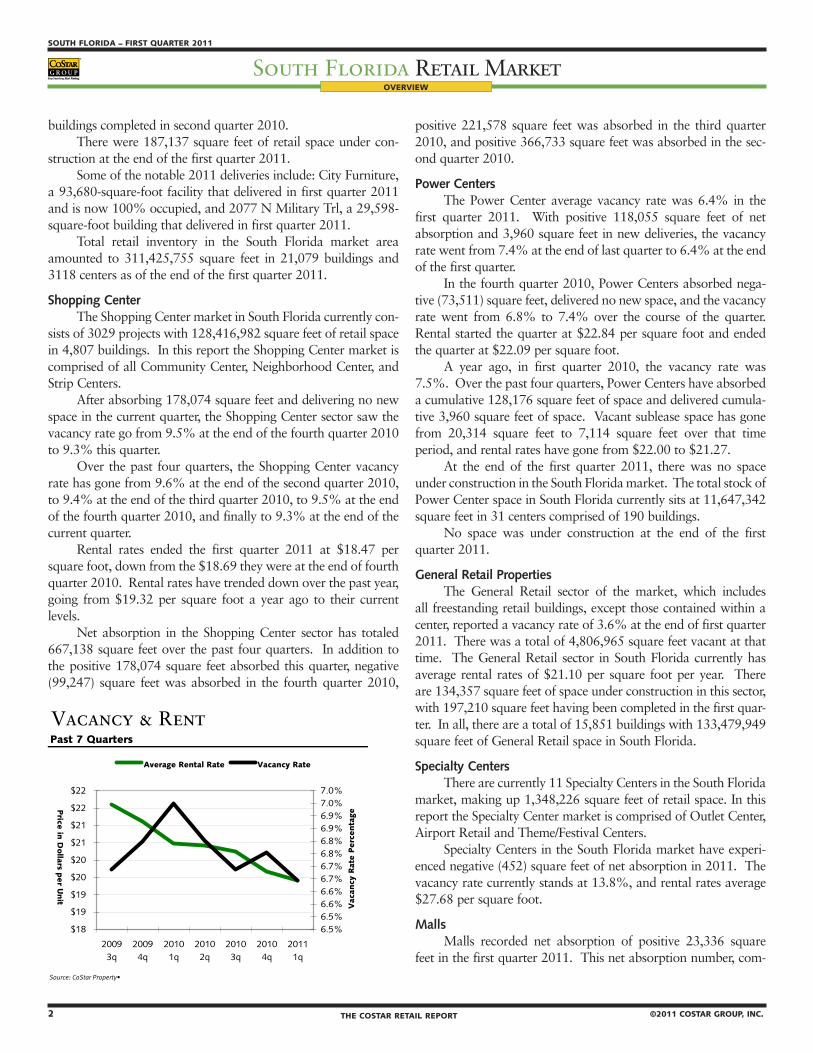
VacancySouth Florida’s retail vacancy rate decreased in the first
quarter 2011, ending the quarter at 6.6%. Over the past four quarters, the market has seen an overall decrease in the vacancy rate, with the rate going from 6.8% in the second quarter 2010, to 6.7% at the end of the third quarter 2010, 6.8% at the end of the fourth quarter 2010, to 6.6% in the current quarter.
The amount of vacant sublease space in the South Florida market has trended up over the past four quarters. At the end of the second quarter 2010, there were 424,206 square feet of vacant sublease space. Currently, there are 434,238 square feet vacant in the market.
Largest Lease SigningsThe largest lease signings occurring in 2011 included: the
86,156-square-foot-lease signed by Burlington Coat Factory at Pine Island Plaza; the 51,282-square-foot-deal signed by Winn Dixie at Westfork Plaza; and the 24,016-square-foot-lease signed by Sabor Tropical at Biscayne Plaza Shopping Center.
Rental RatesAverage quoted asking rental rates in the South Florida
retail market are down over previous quarter levels, and down from their levels four quarters ago. Quoted rents ended the first quarter 2011 at $19.41 per square foot per year. That compares to $19.67 per square foot in the fourth quarter 2010, and $20.41 per square foot at the end of the second quarter 2010. This rep-resents a 1.3% decrease in rental rates in the current quarter, and a 5.15% decrease from four quarters ago.
Inventory & ConstructionDuring the first quarter 2011, 11 buildings totaling 201,170
square feet were completed in the South Florida retail market. Over the past four quarters, a total of 397,447 square feet of retail space has been built in South Florida. In addition to the current quarter, six buildings with 49,947 square feet were completed in fourth quarter 2010, eight buildings totaling 105,201 square feet completed in third quarter 2010, and 41,129 square feet in four
Vacancy Rates by Building Type 2006-2011
Source: CoStar Property®
Absorption & Deliveries Vacancy & RentPast 7 Quarters Past 7 Quarters
Source: CoStar Property• Source: CoStar Property•
1%
3%
5%
7%
9%
11%
13%
15%
20061q
20062q
20063q
20064q
20071q
20072q
20073q
20074q
20081q
20082q
20083q
20084q
20091q
20092q
20093q
20094q
20101q
20102q
20103q
20104q
20111q
Power Center Specialty Center General Retail Shopping Center Mall Total Market
(0.21)
0.220.15
0.49
0.37
(0.16)
0.52
1.02
0.600.67
0.040.11
0.05
0.20
(0.4)
(0.2)
0.0
0.2
0.4
0.6
0.8
1.0
1.2
2009 3q 2009 4q 2010 1q 2010 2q 2010 3q 2010 4q 2011 1q
Millio
ns
SF
Net Absorption Deliveries
$18
$19
$19
$20
$20
$21
$21
$22
$22
20093q
20094q
20101q
20102q
20103q
20104q
20111q
Price
in D
ollars p
er U
nit
6.5%6.5%6.6%6.6%6.7%6.7%6.8%6.8%6.9%6.9%7.0%7.0%
Vac
ancy
Rat
e P
erc
enta
ge
Average Rental Rate Vacancy Rate
2 THE COSTAR RETAIL REPORT ©2011 COSTAR GROUP, INC.
SOUTH FLORIDA – FIRST QUARTER 2011
South Florida Retail MarketFIRST QUARTER 2011 – SOUTH FLORIDA
South Florida Retail Market
©2011 COSTAR GROUP, INC. THE COSTAR RETAIL REPORT 3
OVERVIEW
buildings completed in second quarter 2010.There were 187,137 square feet of retail space under con-
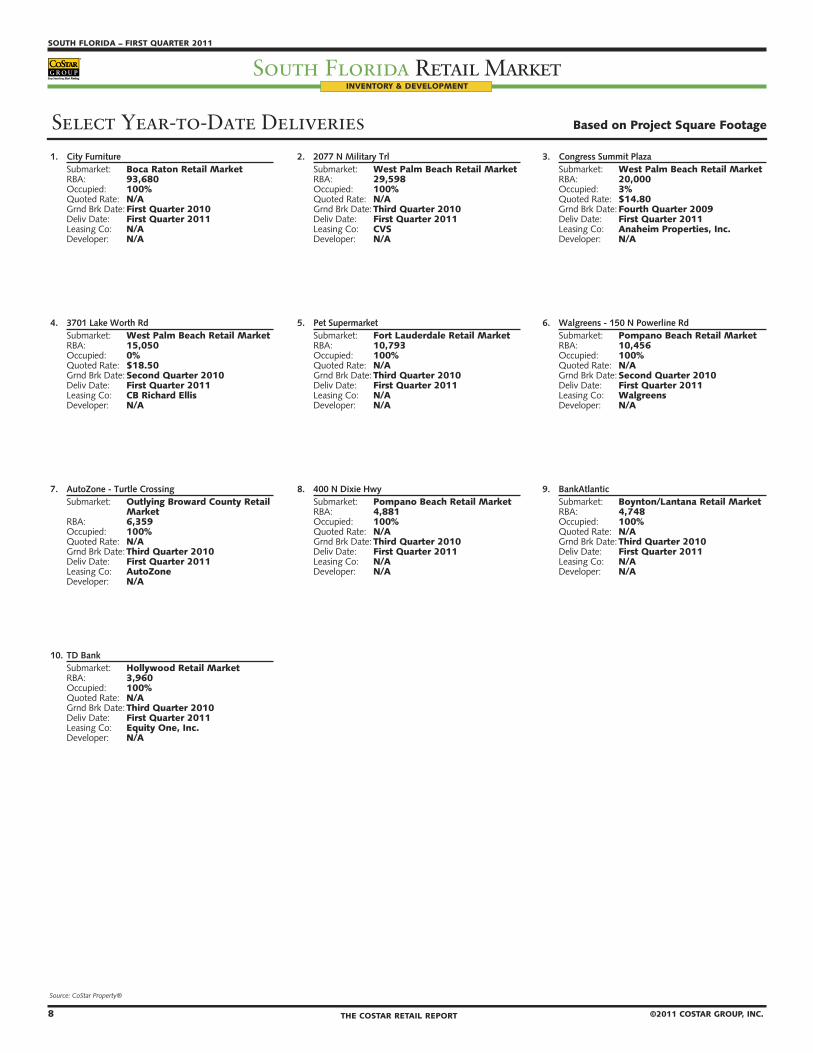
struction at the end of the first quarter 2011. Some of the notable 2011 deliveries include: City Furniture,
a 93,680-square-foot facility that delivered in first quarter 2011 and is now 100% occupied, and 2077 N Military Trl, a 29,598-square-foot building that delivered in first quarter 2011.
Total retail inventory in the South Florida market area amounted to 311,425,755 square feet in 21,079 buildings and 3118 centers as of the end of the first quarter 2011.
Shopping CenterThe Shopping Center market in South Florida currently con-
sists of 3029 projects with 128,416,982 square feet of retail space in 4,807 buildings. In this report the Shopping Center market is comprised of all Community Center, Neighborhood Center, and Strip Centers.
After absorbing 178,074 square feet and delivering no new space in the current quarter, the Shopping Center sector saw the vacancy rate go from 9.5% at the end of the fourth quarter 2010 to 9.3% this quarter.
Over the past four quarters, the Shopping Center vacancy rate has gone from 9.6% at the end of the second quarter 2010, to 9.4% at the end of the third quarter 2010, to 9.5% at the end of the fourth quarter 2010, and finally to 9.3% at the end of the current quarter.
Rental rates ended the first quarter 2011 at $18.47 per square foot, down from the $18.69 they were at the end of fourth quarter 2010. Rental rates have trended down over the past year, going from $19.32 per square foot a year ago to their current levels.
Net absorption in the Shopping Center sector has totaled 667,138 square feet over the past four quarters. In addition to the positive 178,074 square feet absorbed this quarter, negative (99,247) square feet was absorbed in the fourth quarter 2010,
positive 221,578 square feet was absorbed in the third quarter 2010, and positive 366,733 square feet was absorbed in the sec-ond quarter 2010.
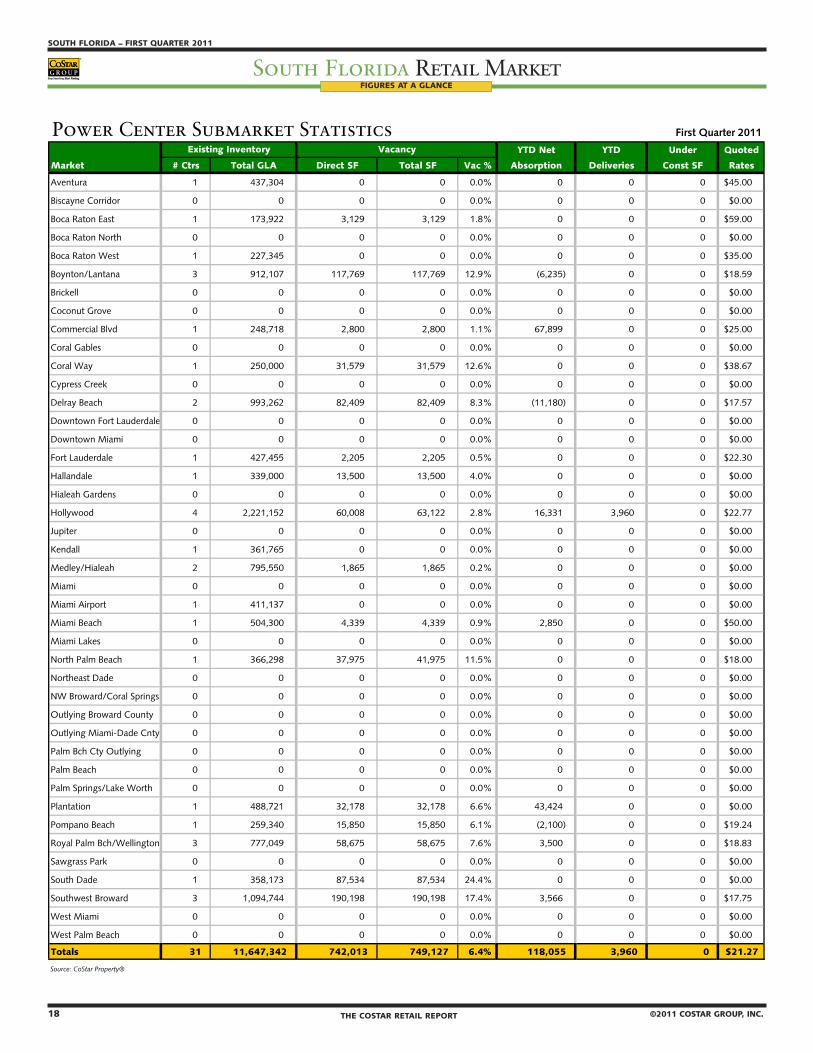
Power CentersThe Power Center average vacancy rate was 6.4% in the
first quarter 2011. With positive 118,055 square feet of net absorption and 3,960 square feet in new deliveries, the vacancy rate went from 7.4% at the end of last quarter to 6.4% at the end of the first quarter.
In the fourth quarter 2010, Power Centers absorbed nega-tive (73,511) square feet, delivered no new space, and the vacancy rate went from 6.8% to 7.4% over the course of the quarter. Rental started the quarter at $22.84 per square foot and ended the quarter at $22.09 per square foot.
A year ago, in first quarter 2010, the vacancy rate was 7.5%. Over the past four quarters, Power Centers have absorbed a cumulative 128,176 square feet of space and delivered cumula-tive 3,960 square feet of space. Vacant sublease space has gone from 20,314 square feet to 7,114 square feet over that time period, and rental rates have gone from $22.00 to $21.27.
At the end of the first quarter 2011, there was no space under construction in the South Florida market. The total stock of Power Center space in South Florida currently sits at 11,647,342 square feet in 31 centers comprised of 190 buildings.
No space was under construction at the end of the first quarter 2011.
General Retail PropertiesThe General Retail sector of the market, which includes
all freestanding retail buildings, except those contained within a center, reported a vacancy rate of 3.6% at the end of first quarter 2011. There was a total of 4,806,965 square feet vacant at that time. The General Retail sector in South Florida currently has average rental rates of $21.10 per square foot per year. There are 134,357 square feet of space under construction in this sector, with 197,210 square feet having been completed in the first quar-ter. In all, there are a total of 15,851 buildings with 133,479,949 square feet of General Retail space in South Florida.
Specialty CentersThere are currently 11 Specialty Centers in the South Florida
market, making up 1,348,226 square feet of retail space. In this report the Specialty Center market is comprised of Outlet Center, Airport Retail and Theme/Festival Centers.
Specialty Centers in the South Florida market have experi-enced negative (452) square feet of net absorption in 2011. The vacancy rate currently stands at 13.8%, and rental rates average $27.68 per square foot.
MallsMalls recorded net absorption of positive 23,336 square
feet in the first quarter 2011. This net absorption number, com-
Vacancy Rates by Building Type 2006-2011
Source: CoStar Property®
Absorption & Deliveries Vacancy & RentPast 7 Quarters Past 7 Quarters
Source: CoStar Property• Source: CoStar Property•
1%
3%
5%
7%
9%
11%
13%
15%
20061q
20062q
20063q
20064q
20071q
20072q
20073q
20074q
20081q
20082q
20083q
20084q
20091q
20092q
20093q
20094q
20101q
20102q
20103q
20104q
20111q
Power Center Specialty Center General Retail Shopping Center Mall Total Market
(0.21)
0.220.15
0.49
0.37
(0.16)
0.52
1.02
0.600.67
0.040.11
0.05
0.20
(0.4)
(0.2)
0.0
0.2
0.4
0.6
0.8
1.0
1.2
2009 3q 2009 4q 2010 1q 2010 2q 2010 3q 2010 4q 2011 1q
Millio
ns
SF
Net Absorption Deliveries
$18
$19
$19
$20
$20
$21
$21
$22
$22
20093q
20094q
20101q
20102q
20103q
20104q
20111q
Price
in D
ollars p
er U
nit
6.5%6.5%6.6%6.6%6.7%6.7%6.8%6.8%6.9%6.9%7.0%7.0%
Vac
ancy
Rat
e P
erc
enta
ge
Average Rental Rate Vacancy Rate

2 THE COSTAR RETAIL REPORT ©2011 COSTAR GROUP, INC.
SOUTH FLORIDA – FIRST QUARTER 2011
South Florida Retail MarketFIRST QUARTER 2011 – SOUTH FLORIDA
South Florida Retail Market
©2011 COSTAR GROUP, INC. THE COSTAR RETAIL REPORT 3
OVERVIEW
bined with no new space that was built in the quarter, caused the vacancy rate to go from 8.1% a quarter ago to 8.1% at the end of the first quarter 2011. Rental rates went from $22.15 per square foot to $22.27 per square foot during that time. In this report the Mall market is comprised of 47 Lifestyle Center, Regional Mall and Super Regional Malls.
Sales ActivityTallying retail building sales of 15,000 square feet or larger,
South Florida retail sales figures fell during the fourth quarter 2010 in terms of dollar volume compared to the third quarter of 2010.
In the fourth quarter, 20 retail transactions closed with a total volume of $158,999,897. The 20 buildings totaled 1,549,289 square feet and the average price per square foot equated to $102.63 per square foot. That compares to 18 trans-actions totaling $206,912,603 in the third quarter 2010. The total square footage in the third quarter was 1,631,465 square feet for an average price per square foot of $126.83.
Total retail center sales activity in 2010 was up compared to 2009. In the twelve months of 2010, the market saw 68 retail sales transactions with a total volume of $606,982,878. The price per square foot averaged $129.26. In the same twelve months of 2009, the market posted 42 transactions with a total volume of $381,100,249. The price per square foot averaged $180.86.
Cap rates have been higher in 2010, averaging 8.17% com-
pared to the same period in 2009 when they averaged 6.94%.One of the largest transactions that has occurred within
the last four quarters in the South Florida market is the multi-property sale including 723 N Lincoln Ln, 741-749 Lincoln Rd and 600-612 Lincoln Rd Miami Beach. This 61,762 square foot portfolio sold for $52,000,000, or $841.94 per square foot. The property sold on 2/17/2011.
Reports compiled by: Matt Burdette, CoStar Research Manager.
Vacancy Rates by Building Type 2006-2011
Source: CoStar Property®
Absorption & Deliveries Vacancy & RentPast 7 Quarters Past 7 Quarters
Source: CoStar Property• Source: CoStar Property•
1%
3%
5%
7%
9%
11%
13%
15%
20061q
20062q
20063q
20064q
20071q
20072q
20073q
20074q
20081q
20082q
20083q
20084q
20091q
20092q
20093q
20094q
20101q
20102q
20103q
20104q
20111q
Power Center Specialty Center General Retail Shopping Center Mall Total Market
(0.21)
0.220.15
0.49
0.37
(0.16)
0.52
1.02
0.600.67
0.040.11
0.05
0.20
(0.4)
(0.2)
0.0
0.2
0.4
0.6
0.8
1.0
1.2
2009 3q 2009 4q 2010 1q 2010 2q 2010 3q 2010 4q 2011 1q
Millio
ns
SF
Net Absorption Deliveries
$18
$19
$19
$20
$20
$21
$21
$22
$22
20093q
20094q
20101q
20102q
20103q
20104q
20111q
Price
in D
ollars p
er U
nit
6.5%6.5%6.6%6.6%6.7%6.7%6.8%6.8%6.9%6.9%7.0%7.0%
Vac
ancy
Rat
e P
erc
enta
ge
Average Rental Rate Vacancy Rate

4 THE COSTAR RETAIL REPORT ©2011 COSTAR GROUP, INC.
SOUTH FLORIDA – FIRST QUARTER 2011
South Florida Retail MarketFIRST QUARTER 2011 – SOUTH FLORIDA
South Florida Retail Market
©2011 COSTAR GROUP, INC. THE COSTAR RETAIL REPORT 5
CoStar Markets & Submarkets
In analyzing metropolitan areas in the U.S., CoStar has developed geographic designations to help group properties together, called Regions, Markets and Submarkets. Regions are the equivalent of metropolitan areas, or areas containing a large population nucleus, that together with adjacent communities have a high degree of economic and social integration. Regions are then divided into Markets, which are core areas within a metropolitan area that are known to be competitive with each other in terms of attracting and keeping tenants. Markets are then further subdivided into smaller units called Submarkets, which serve to delineate a core group of buildings that are competitive with each other and constitute a generally accepted competitive set, or peer group.
MARKETS
Markets Submarkets
Aventura Aventura
Biscayne Corridor Biscayne Corridor
Boca Raton Boca Raton East Boca Raton North Boca Raton West
Boynton/Lantana Boynton/Lantana
Brickell Brickell
Coconut Grove Coconut Grove
Commercial Blvd Commercial Blvd
Coral Gables Coral Gables
Coral Way Coral Way
Cypress Creek Cypress Creek
Delray Beach Delray Beach
Downtown Fort Lauderdale Downtown Fort Lauderdale
Downtown Miami Downtown Miami
Fort Lauderdale Fort Lauderdale
Hallandale Hallandale
Hollywood Hollywood
Jupiter Jupiter
Kendall Kendall
Medley/Hialeah Medley/Hialeah
Miami Miami
Miami Airport Miami Airport
Miami Beach Miami Beach
Miami Lakes Miami Lakes
North Palm Beach North Palm Beach
Northeast Dade Northeast Dade
NW Broward/Coral Springs NW Broward/Coral Springs
Palm Beach Palm Beach Palm Bch Cty Outlying
Palm Springs/Lake Worth Palm Springs/Lake Worth
Plantation Plantation
Pompano Beach Pompano Beach
Royal Palm Bch/Wellington Royal Palm Bch/Wellington
Sawgrass Park Sawgrass Park
South Dade South Dade
Southwest Broward Southwest Broward
West Miami West Miami
West Palm Beach West Palm Beach
Outlying Broward County Outlying Broward County
Miami-Dade Central County Hialeah Gardens
Outlying Miami-Dade Cnty Outlying Miami-Dade Cnty

4 THE COSTAR RETAIL REPORT ©2011 COSTAR GROUP, INC.
SOUTH FLORIDA – FIRST QUARTER 2011
South Florida Retail MarketFIRST QUARTER 2011 – SOUTH FLORIDA
South Florida Retail Market
©2011 COSTAR GROUP, INC. THE COSTAR RETAIL REPORT 5
Construction Highlights in Select CoStar MarketsColor Coded by Under Construction Square Footage as a Percentage of Existing Inventory
INVENTORY & DEVELOPMENT
��
���
�����
��
��
��
��
���
���
���� ���� �����
��� ���������� ���� � ������� ������ ��� ����������� �� ��
���� �����
��� ���������� ���� � ������� ������ ��� ����������� �� ��
�����
��� ���������� ��� ������� ������ ���� � ����������� �� ���
����� �������
��� ���������� ��� ������� ������ ��� ����������� �� ��
�� �������
��� ���������� ��� ������� ������ ��� ����������� �� ��
����� ����
��� ���������� ��� � ������� ������ ��� ����������� �� ��
�������
��� ���������� ��� ������� ������ ��� ����������� �� ��
����������
��� ���������� ��� ������� ������ ��� ����������� �� ��
������� �����
��� ���������� ���� � ������� ������ ��� ����������� �� ��
��� ����������
��� ���������� ���� � ������� ������ ���� � ����������� �� ����
������������ ������ ���� ���������� �� ���������� �� ���������� �� ��������� ���� �����
Source: CoStar Property®

6 THE COSTAR RETAIL REPORT ©2011 COSTAR GROUP, INC.
SOUTH FLORIDA – FIRST QUARTER 2011
South Florida Retail MarketFIRST QUARTER 2011 – SOUTH FLORIDA
South Florida Retail Market
©2011 COSTAR GROUP, INC. THE COSTAR RETAIL REPORT 7
Historical Deliveries 1982 - 2011
Source: CoStar Property® * Future deliveries based on current under construction buildings.
Construction Activity Markets Ranked by Under Construction Square Footage
# Bldgs Preleased SF Preleased % All Existing U/C
Miami 3 53,665 71.1% 5,964 25,147
Medley/Hialeah 1 52,780 100.0% 14,078 52,780
Fort Lauderdale 4 46,758 100.0% 9,380 11,689
Miami Beach 1 8,006 100.0% 14,408 8,006
Cypress Creek 1 4,152 100.0% 12,543 4,152
West Palm Beach 0 0 0.0% 13,315 0
Hollywood 0 0 0.0% 11,008 0
NW Broward/Coral Springs 0 0 0.0% 21,607 0
Outlying Broward County 0 0 0.0% 22,139 0
Plantation 0 0 0.0% 23,487 0
All Other 0 0 0.0% 17,286 0
Totals 10 165,361 88.4% 14,774 18,714
Source: CoStar Property®
Recent Deliveries Future Deliveries Leased & Un-Leased SF in Deliveries Since 2007 Preleased & Un-Leased SF in Properties Scheduled to Deliver
Source: CoStar Property® Source: CoStar Property®
0
0
0
Market
Under Construction Inventory Average Bldg Size
Total GLA
0
75,441
187,137
52,780
46,758
8,006
4,152
0
0
5.3
7.9
6.2
8.99.4
9.0 9.0
6.5
9.1
4.5 4.5
2.63.0
3.9
5.1
4.2
5.04.6
8.2
5.3
6.2
3.9
6.5 6.4 6.46.9 7.1
2.8
0.90.3
0.0
1.0
2.0
3.0
4.0
5.0
6.0
7.0
8.0
9.0
10.0
1982 1983 1984 1985 1986 1987 1988 1989 1990 1991 1992 1993 1994 1995 1996 1997 1998 1999 2000 2001 2002 2003 2004 2005 2006 2007 2008 2009 2010 2011
Millio
ns
of
SF
Deliveries Average Delivered SF
0.0
1.0
2.0
3.0
4.0
5.0
6.0
7.0
8.0
2007 2008 2009 2010 2011
Millio
ns
of
SF
Leased Un-Leased
0
10
20
30
40
50
60
70
80
90
2011 2q 2011 3q 2011 4q 2012 1q
T
Thousa
nds
of
SF
Preleased Un-Leased
INVENTORY & DEVELOPMENT

6 THE COSTAR RETAIL REPORT ©2011 COSTAR GROUP, INC.
SOUTH FLORIDA – FIRST QUARTER 2011
South Florida Retail MarketFIRST QUARTER 2011 – SOUTH FLORIDA
South Florida Retail Market
©2011 COSTAR GROUP, INC. THE COSTAR RETAIL REPORT 7
Historical Construction Starts & DeliveriesSquare Footage Per Quarter Starting and Completing Construction
Source: CoStar Property®
Recent Deliveries by Project Size of Year-to-Date DevelopmentBuilding Size # Bldgs GLA SF Leased % Leased Avg Rate Single-Tenant Multi-Tenant
< 50,000 SF 10 107,490 73,040 68.0% $16.42 70,795 36,695
50,000 SF - 99,999 SF 1 93,680 93,680 100.0% $0.00 0 93,680
100,000 SF - 249,999 SF 0 0 0 0.0% $0.00 0 0
250,000 SF - 499,999 SF 0 0 0 0.0% $0.00 0 0
>= 500,000 SF 0 0 0 0.0% $0.00 0 0
Source: CoStar Property®
Recent Development by Tenancy Existing Inventory ComparisonBased on GLA Developed for Single & Multi Tenant Use Based on Total GLA
2011 Deliveries
Source: CoStar Property® Source: CoStar Property®
Currently Under Construction
1.32
0.91
1.27
0.39 0.440.28
0.05 0.070.19
0.050.17
0.000.10
2.44
1.19
1.58
1.84
1.05
0.17
1.02
0.60 0.67
0.04 0.11 0.050.20
0.0
0.5
1.0
1.5
2.0
2.5
3.0
2008 1q 2008 2q 2008 3q 2008 4q 2009 1q 2009 2q 2009 3q 2009 4q 2010 1q 2010 2q 2010 3q 2010 4q 2011 1q
Millio
ns
of
SF
Construction Starts Deliveries
45%55%
Multi Single
35%
65%
Multi Single 0 20 40 60 80 100 120 140 160
Specialty Center
Power Center
Mall
Shopping Center
General Retail
Millions of Square Feet
INVENTORY & DEVELOPMENT
8 THE COSTAR RETAIL REPORT ©2011 COSTAR GROUP, INC.
SOUTH FLORIDA – FIRST QUARTER 2011
South Florida Retail MarketFIRST QUARTER 2011 – SOUTH FLORIDA
South Florida Retail Market
©2011 COSTAR GROUP, INC. THE COSTAR RETAIL REPORT 9
������������������������������ �������������������������������
������������������������
���� ������������������������� ����������������������������� ���������������� ����������������� ������������������������������������������������ ������������������������������ �������������� ����
���� ������������������������������ ���������������������������������� ���������������� ����������������� ������������������������������������������������ ������������������������������ �������������� ����
���� �������������������������������� ���������������������������������� ���������������� ��������������� ���������������������������������������������������� ������������������������������ ����������������������������������� ����
���� ����������������������������� ���������������������������������� ���������������� ��������������� ���������������������������������������������������� ������������������������������ ��������������������������� ����
���� �������������������������� ���������������������������������� ���������������� ����������������� ������������������������������������������������ ������������������������������ �������������� ����
���� ����������������������������������������� �������������������������������� ���������������� ����������������� ������������������������������������������������� ������������������������������ �������������������� ����
���� ������������������������������������� �������������������������������
����������� ��������������� ����������������� ������������������������������������������������ ������������������������������ ������������������� ����
���� �������������������������� �������������������������������� ��������������� ����������������� ������������������������������������������������ ������������������������������ �������������� ����
���� ����������������������� ���������������������������������� ��������������� ����������������� ������������������������������������������������ ������������������������������ �������������� ����
����������������������� ���������������������������� ��������������� ����������������� ������������������������������������������������ ������������������������������ ��������������������������� ����
INVENTORY & DEVELOPMENT

8 THE COSTAR RETAIL REPORT ©2011 COSTAR GROUP, INC.
SOUTH FLORIDA – FIRST QUARTER 2011
South Florida Retail MarketFIRST QUARTER 2011 – SOUTH FLORIDA
South Florida Retail Market
©2011 COSTAR GROUP, INC. THE COSTAR RETAIL REPORT 9
INVENTORY & DEVELOPMENT
���������������������������������������� �������������������������������
������������������������
���� ��������������������� ��������������������������������� ����������������� ����������������� ������������������������������������������������ ������������������������������� �������������� ����
���� ������������������������������������� ������������������������ ����������������� ����������������� ������������������������������������������������ ������������������������������ ������������������������������������� ����
���� ���������������������������������������������� ���������������������������������� ����������������� ����������������� ������������������������������������������������ ������������������������������ ������������������������������������ �������������������������������
���� �������������������������������������������������������� ������������������������ ����������������� ��������������� ������������������������������������������������������� ������������������������������ ��������������������������
�������������������� ����
���� ��������������������������������������� ���������������������������������� ���������������� ����������������� ������������������������������������������������ ������������������������������� �������������� ����
���� ��������������������������� ������������������������������ ���������������� ����������������� ������������������������������������������������ ������������������������������� �������������������������������������� ����
���� ������������������������� ������������������������ ���������������� ����������������� ������������������������������������������������ ������������������������������ �������������� ����
���� ����������������������������� ���������������������������������� ���������������� ����������������� ������������������������������������������������ ������������������������������� �������������� ����
���� ������������������ �������������������������������� ���������������� ����������������� ������������������������������������������������ ������������������������������� �������������� ����
������������������������������������������ ���������������������������������� ���������������� ����������������� ������������������������������������������������ ������������������������������ �������������� ����

10 THE COSTAR RETAIL REPORT ©2011 COSTAR GROUP, INC.
SOUTH FLORIDA – FIRST QUARTER 2011
South Florida Retail MarketFIRST QUARTER 2011 – SOUTH FLORIDA
South Florida Retail Market
©2011 COSTAR GROUP, INC. THE COSTAR RETAIL REPORT 11
General Retail Market Statistics First Quarter 2011
YTD Net YTD Under Quoted
Market # Blds Total GLA Direct SF Total SF Vac % Absorption Deliveries Const SF Rates
Aventura 63 618,745 1,845 1,845 0.3% 2,024 0 0 $25.00
Biscayne Corridor 186 1,181,990 67,905 67,905 5.7% 25,126 0 0 $21.79
Boca Raton 271 4,447,591 121,136 121,136 2.7% 95,848 93,680 0 $20.37
Boynton/Lantana 354 3,016,463 59,280 59,280 2.0% 3,265 4,748 0 $22.54
Brickell 56 964,737 70,824 70,824 7.3% 3,477 0 0 $40.89
Coconut Grove 112 805,298 45,874 48,374 6.0% (2,098) 0 0 $26.00
Commercial Blvd 75 638,757 29,518 29,518 4.6% 0 0 0 $13.00
Coral Gables 335 2,236,846 114,573 114,573 5.1% 7,890 0 0 $31.12
Coral Way 183 1,430,348 18,535 18,535 1.3% (3,206) 0 0 $20.09
Cypress Creek 163 1,319,764 35,404 35,404 2.7% (4,300) 0 4,152 $19.30
Delray Beach 399 3,216,898 114,035 114,035 3.5% (4,915) 0 0 $20.69
Downtown Fort Lauderdale 382 3,312,760 181,349 183,374 5.5% (28,303) 0 0 $23.36
Downtown Miami 136 5,214,913 171,486 171,486 3.3% 18,075 0 0 $32.98
Fort Lauderdale 1,651 11,626,790 363,966 386,166 3.3% 8,430 10,793 46,758 $18.36
Hallandale 390 1,837,765 46,400 46,400 2.5% 15,468 0 0 $18.60
Hollywood 868 5,353,546 254,777 254,777 4.8% 15,142 0 0 $19.99
Jupiter 179 1,526,818 43,043 43,043 2.8% 6,400 0 0 $18.90
Kendall 445 4,604,932 45,542 45,542 1.0% (7,336) 0 0 $23.72
Medley/Hialeah 627 5,221,134 130,897 132,497 2.5% (850) 0 0 $20.66
Miami 2,100 11,279,540 469,531 494,031 4.4% (32,354) 0 75,441 $16.21
Miami Airport 343 3,041,420 34,268 37,068 1.2% (4,140) 0 0 $31.84
Miami Beach 514 6,110,130 209,177 234,067 3.8% 5,539 0 8,006 $49.42
Miami Lakes 116 2,119,701 67,639 67,639 3.2% 50 0 0 $22.05
Miami-Dade Central County 273 1,053,459 72,887 72,887 6.9% 3,187 0 0 $19.41
North Palm Beach 507 5,086,256 180,252 196,297 3.9% 29,644 0 0 $18.26
Northeast Dade 774 4,580,241 167,989 167,989 3.7% (1,097) 0 0 $15.91
NW Broward/Coral Springs 293 3,196,016 101,818 108,418 3.4% 16,855 0 0 $19.68
Outlying Broward County 39 541,957 4,400 4,400 0.8% 8,159 6,359 0 $20.00
Outlying Miami-Dade Cnty 11 78,408 18,068 18,068 23.0% 0 0 0 $18.00
Palm Beach 142 1,601,037 38,294 38,294 2.4% (6,458) 0 0 $44.63
Palm Springs/Lake Worth 206 1,339,748 45,826 45,826 3.4% (6,960) 0 0 $16.96
Plantation 300 3,091,134 117,605 117,605 3.8% 2,921 0 0 $16.80
Pompano Beach 727 7,444,070 234,811 234,811 3.2% 18,125 15,337 0 $15.98
Royal Palm Bch/Wellington 92 1,286,242 37,721 37,721 2.9% (3,750) 0 0 $21.29
Sawgrass Park 37 893,319 0 0 0.0% 0 0 0 $16.84
South Dade 642 5,435,302 236,097 254,070 4.7% (1,877) 1,645 0 $13.62
Southwest Broward 262 4,915,934 49,014 59,922 1.2% (6,915) 0 0 $15.94
West Miami 474 2,564,142 63,268 63,268 2.5% (2,878) 0 0 $27.27
West Palm Beach 1,124 9,245,798 602,248 609,870 6.6% 32,103 64,648 0 $15.96
Totals 15,851 133,479,949 4,667,302 4,806,965 3.6% 200,291 197,210 134,357 $21.10
Source: CoStar Property®
Existing Inventory Vacancy
FIGURES AT A GLANCE

10 THE COSTAR RETAIL REPORT ©2011 COSTAR GROUP, INC.
SOUTH FLORIDA – FIRST QUARTER 2011
South Florida Retail MarketFIRST QUARTER 2011 – SOUTH FLORIDA
South Florida Retail Market
©2011 COSTAR GROUP, INC. THE COSTAR RETAIL REPORT 11
Mall Market Statistics First Quarter 2011
YTD Net YTD Under Quoted
Market # Ctrs Total GLA Direct SF Total SF Vac % Absorption Deliveries Const SF Rates
Aventura 3 3,117,322 39,765 39,765 1.3% 0 0 0 $34.51
Biscayne Corridor 0 0 0 0 0.0% 0 0 0 $0.00
Boca Raton 4 2,436,505 68,374 69,354 2.8% 7,071 0 0 $22.97
Boynton/Lantana 2 1,265,979 33,556 33,556 2.7% 3,600 0 0 $25.60
Brickell 0 0 0 0 0.0% 0 0 0 $0.00
Coconut Grove 1 199,683 27,483 27,483 13.8% 0 0 0 $33.07
Commercial Blvd 0 0 0 0 0.0% 0 0 0 $0.00
Coral Gables 1 1,194,168 33,275 33,275 2.8% 0 0 0 $0.00
Coral Way 0 0 0 0 0.0% 0 0 0 $0.00
Cypress Creek 0 0 0 0 0.0% 0 0 0 $0.00
Delray Beach 0 0 0 0 0.0% 0 0 0 $0.00
Downtown Fort Lauderdale 2 1,301,775 160,000 160,000 12.3% 0 0 0 $0.00
Downtown Miami 1 537,247 72,120 72,120 13.4% 0 0 0 $0.00
Fort Lauderdale 1 608,241 285,919 285,919 47.0% 0 0 0 $13.52
Hallandale 1 420,000 375,000 375,000 89.3% 0 0 0 $0.00
Hollywood 1 163,179 76,770 76,770 47.0% (5,639) 0 0 $16.00
Jupiter 0 0 0 0 0.0% 0 0 0 $0.00
Kendall 4 3,549,623 107,310 113,810 3.2% 0 0 0 $45.06
Medley/Hialeah 1 786,466 0 0 0.0% 0 0 0 $0.00
Miami 0 33,432 0 0 0.0% 0 0 0 $0.00
Miami Airport 4 4,172,977 46,235 90,304 2.2% 900 0 0 $0.00
Miami Beach 1 500,000 0 0 0.0% 0 0 0 $0.00
Miami Lakes 0 0 0 0 0.0% 0 0 0 $0.00
Miami-Dade Central County 1 454,672 89,556 89,556 19.7% 69 0 0 $14.00
North Palm Beach 4 2,063,849 83,783 83,783 4.1% 23,590 0 0 $28.00
Northeast Dade 1 681,469 36,338 36,338 5.3% 0 0 0 $21.60
NW Broward/Coral Springs 1 1,037,203 12,600 12,600 1.2% 0 0 0 $30.00
Outlying Broward County 0 0 0 0 0.0% 0 0 0 $0.00
Outlying Miami-Dade Cnty 0 0 0 0 0.0% 0 0 0 $0.00
Palm Beach 1 147,832 0 0 0.0% 2,207 0 0 $0.00
Palm Springs/Lake Worth 0 0 0 0 0.0% 0 0 0 $0.00
Plantation 2 2,095,372 652,062 652,062 31.1% (2,400) 0 0 $0.00
Pompano Beach 2 1,107,653 72,814 72,814 6.6% (5,913) 0 0 $28.52
Royal Palm Bch/Wellington 1 1,273,000 0 0 0.0% 0 0 0 $0.00
Sawgrass Park 1 2,252,068 0 0 0.0% 0 0 0 $0.00
South Dade 1 1,165,353 38,607 38,607 3.3% (149) 0 0 $28.59
Southwest Broward 3 1,471,706 24,826 24,826 1.7% 0 0 0 $23.83
West Miami 0 0 0 0 0.0% 0 0 0 $0.00
West Palm Beach 2 2,496,482 562,032 562,032 22.5% 0 0 0 $0.00
Totals 47 36,533,256 2,898,425 2,949,974 8.1% 23,336 0 0 $22.27
Source: CoStar Property®
Existing Inventory Vacancy
FIGURES AT A GLANCE

12 THE COSTAR RETAIL REPORT ©2011 COSTAR GROUP, INC.
SOUTH FLORIDA – FIRST QUARTER 2011
South Florida Retail MarketFIRST QUARTER 2011 – SOUTH FLORIDA
South Florida Retail Market
©2011 COSTAR GROUP, INC. THE COSTAR RETAIL REPORT 13
Power Center Market Statistics First Quarter 2011
YTD Net YTD Under Quoted
Market # Ctrs Total GLA Direct SF Total SF Vac % Absorption Deliveries Const SF Rates
Aventura 1 437,304 0 0 0.0% 0 0 0 $45.00
Biscayne Corridor 0 0 0 0 0.0% 0 0 0 $0.00
Boca Raton 2 401,267 3,129 3,129 0.8% 0 0 0 $49.64
Boynton/Lantana 3 912,107 117,769 117,769 12.9% (6,235) 0 0 $18.59
Brickell 0 0 0 0 0.0% 0 0 0 $0.00
Coconut Grove 0 0 0 0 0.0% 0 0 0 $0.00
Commercial Blvd 1 248,718 2,800 2,800 1.1% 67,899 0 0 $25.00
Coral Gables 0 0 0 0 0.0% 0 0 0 $0.00
Coral Way 1 250,000 31,579 31,579 12.6% 0 0 0 $38.67
Cypress Creek 0 0 0 0 0.0% 0 0 0 $0.00
Delray Beach 2 993,262 82,409 82,409 8.3% (11,180) 0 0 $17.57
Downtown Fort Lauderdale 0 0 0 0 0.0% 0 0 0 $0.00
Downtown Miami 0 0 0 0 0.0% 0 0 0 $0.00
Fort Lauderdale 1 427,455 2,205 2,205 0.5% 0 0 0 $22.30
Hallandale 1 339,000 13,500 13,500 4.0% 0 0 0 $0.00
Hollywood 4 2,221,152 60,008 63,122 2.8% 16,331 3,960 0 $22.77
Jupiter 0 0 0 0 0.0% 0 0 0 $0.00
Kendall 1 361,765 0 0 0.0% 0 0 0 $0.00
Medley/Hialeah 2 795,550 1,865 1,865 0.2% 0 0 0 $0.00
Miami 0 0 0 0 0.0% 0 0 0 $0.00
Miami Airport 1 411,137 0 0 0.0% 0 0 0 $0.00
Miami Beach 1 504,300 4,339 4,339 0.9% 2,850 0 0 $50.00
Miami Lakes 0 0 0 0 0.0% 0 0 0 $0.00
Miami-Dade Central County 0 0 0 0 0.0% 0 0 0 $0.00
North Palm Beach 1 366,298 37,975 41,975 11.5% 0 0 0 $18.00
Northeast Dade 0 0 0 0 0.0% 0 0 0 $0.00
NW Broward/Coral Springs 0 0 0 0 0.0% 0 0 0 $0.00
Outlying Broward County 0 0 0 0 0.0% 0 0 0 $0.00
Outlying Miami-Dade Cnty 0 0 0 0 0.0% 0 0 0 $0.00
Palm Beach 0 0 0 0 0.0% 0 0 0 $0.00
Palm Springs/Lake Worth 0 0 0 0 0.0% 0 0 0 $0.00
Plantation 1 488,721 32,178 32,178 6.6% 43,424 0 0 $0.00
Pompano Beach 1 259,340 15,850 15,850 6.1% (2,100) 0 0 $19.24
Royal Palm Bch/Wellington 3 777,049 58,675 58,675 7.6% 3,500 0 0 $18.83
Sawgrass Park 0 0 0 0 0.0% 0 0 0 $0.00
South Dade 1 358,173 87,534 87,534 24.4% 0 0 0 $0.00
Southwest Broward 3 1,094,744 190,198 190,198 17.4% 3,566 0 0 $17.75
West Miami 0 0 0 0 0.0% 0 0 0 $0.00
West Palm Beach 0 0 0 0 0.0% 0 0 0 $0.00
Totals 31 11,647,342 742,013 749,127 6.4% 118,055 3,960 0 $21.27
Source: CoStar Property®
Existing Inventory Vacancy
FIGURES AT A GLANCE

12 THE COSTAR RETAIL REPORT ©2011 COSTAR GROUP, INC.
SOUTH FLORIDA – FIRST QUARTER 2011
South Florida Retail MarketFIRST QUARTER 2011 – SOUTH FLORIDA
South Florida Retail Market
©2011 COSTAR GROUP, INC. THE COSTAR RETAIL REPORT 13
Shopping Center Market Statistics First Quarter 2011
YTD Net YTD Under Quoted
Market # Ctrs Total GLA Direct SF Total SF Vac % Absorption Deliveries Const SF Rates
Aventura 24 1,921,577 63,898 63,898 3.3% 42,502 0 0 $30.19
Biscayne Corridor 15 336,645 66,905 66,905 19.9% 11,056 0 0 $16.15
Boca Raton 104 4,905,304 423,010 423,010 8.6% (3,421) 0 0 $23.24
Boynton/Lantana 75 5,384,207 697,550 697,550 13.0% 16,541 0 0 $16.88
Brickell 6 136,102 0 0 0.0% 0 0 0 $51.47
Coconut Grove 20 440,714 8,995 8,995 2.0% (151) 0 0 $27.85
Commercial Blvd 17 1,010,184 63,478 63,478 6.3% 3,730 0 0 $6.22
Coral Gables 57 454,375 20,713 20,713 4.6% 2,406 0 0 $35.56
Coral Way 41 481,603 13,928 13,928 2.9% (10,628) 0 0 $20.72
Cypress Creek 37 1,364,458 160,354 161,654 11.8% 691 0 0 $12.17
Delray Beach 64 3,060,757 401,408 404,808 13.2% 4,621 0 0 $16.07
Downtown Fort Lauderdale 24 1,076,253 37,819 37,819 3.5% (2,480) 0 0 $22.66
Downtown Miami 5 276,988 114,608 114,608 41.4% 0 0 0 $15.00
Fort Lauderdale 217 5,649,221 498,957 538,734 9.5% (5,976) 0 0 $19.46
Hallandale 89 1,518,890 144,864 148,769 9.8% 15,208 0 0 $15.39
Hollywood 153 4,326,392 428,523 464,801 10.7% 14,947 0 0 $17.73
Jupiter 53 2,900,472 222,850 225,328 7.8% 5,666 0 0 $21.58
Kendall 129 8,479,908 598,872 602,572 7.1% 51,929 0 0 $25.80
Medley/Hialeah 147 4,810,922 216,328 237,528 4.9% (7,211) 0 52,780 $19.43
Miami 172 2,213,503 115,093 115,093 5.2% (5,472) 0 0 $13.87
Miami Airport 118 5,326,136 389,034 389,034 7.3% (10,392) 0 0 $19.14
Miami Beach 28 774,827 33,921 33,921 4.4% 1,805 0 0 $38.97
Miami Lakes 38 2,255,382 139,898 139,898 6.2% 4,561 0 0 $20.32
Miami-Dade Central County 32 1,052,385 70,340 70,340 6.7% (1,659) 0 0 $15.32
North Palm Beach 84 4,175,808 493,241 508,581 12.2% 15,864 0 0 $15.31
Northeast Dade 236 5,588,183 298,756 298,756 5.3% 19,298 0 0 $20.32
NW Broward/Coral Springs 125 7,283,316 1,028,380 1,061,396 14.6% 1,233 0 0 $15.54
Outlying Broward County 26 2,159,030 214,298 214,298 9.9% (6,658) 0 0 $19.27
Outlying Miami-Dade Cnty 5 239,829 31,810 31,810 13.3% 0 0 0 $22.26
Palm Beach 29 2,889,264 396,187 396,187 13.7% 7,588 0 0 $20.08
Palm Springs/Lake Worth 24 1,383,745 90,914 90,914 6.6% 12,187 0 0 $12.70
Plantation 107 7,148,543 1,022,626 1,038,445 14.5% (93,090) 0 0 $15.42
Pompano Beach 177 8,042,558 776,263 804,063 10.0% (55,094) 0 0 $18.06
Royal Palm Bch/Wellington 35 3,875,001 369,463 379,543 9.8% 2,218 0 0 $17.50
Sawgrass Park 14 1,291,500 84,934 90,008 7.0% 1,638 0 0 $14.45
South Dade 104 5,471,603 366,719 379,964 6.9% 23,595 0 0 $19.69
Southwest Broward 100 7,522,518 685,193 685,193 9.1% 41,460 0 0 $21.31
West Miami 145 4,037,881 97,588 97,588 2.4% 31,987 0 0 $26.82
West Palm Beach 153 7,150,998 880,415 883,915 12.4% 47,575 0 0 $15.71
Totals 3,029 128,416,982 11,768,133 12,004,045 9.3% 178,074 0 52,780 $18.47
Source: CoStar Property®
Existing Inventory Vacancy
FIGURES AT A GLANCE

14 THE COSTAR RETAIL REPORT ©2011 COSTAR GROUP, INC.
SOUTH FLORIDA – FIRST QUARTER 2011
South Florida Retail MarketFIRST QUARTER 2011 – SOUTH FLORIDA
South Florida Retail Market
©2011 COSTAR GROUP, INC. THE COSTAR RETAIL REPORT 15
Specialty Center Market Statistics First Quarter 2011
YTD Net YTD Under Quoted
Market # Ctrs Total GLA Direct SF Total SF Vac % Absorption Deliveries Const SF Rates
Aventura 0 0 0 0 0.0% 0 0 0 $0.00
Biscayne Corridor 0 0 0 0 0.0% 0 0 0 $0.00
Boca Raton 0 0 0 0 0.0% 0 0 0 $0.00
Boynton/Lantana 0 0 0 0 0.0% 0 0 0 $0.00
Brickell 1 194,000 2,000 2,000 1.0% 0 0 0 $0.00
Coconut Grove 1 289,996 46,065 46,065 15.9% 0 0 0 $23.50
Commercial Blvd 0 0 0 0 0.0% 0 0 0 $0.00
Coral Gables 0 0 0 0 0.0% 0 0 0 $0.00
Coral Way 0 0 0 0 0.0% 0 0 0 $0.00
Cypress Creek 0 0 0 0 0.0% 0 0 0 $0.00
Delray Beach 0 0 0 0 0.0% 0 0 0 $0.00
Downtown Fort Lauderdale 0 0 0 0 0.0% 0 0 0 $0.00
Downtown Miami 1 37,600 36,500 36,500 97.1% 0 0 0 $22.50
Fort Lauderdale 1 167,180 2,855 2,855 1.7% 0 0 0 $0.00
Hallandale 1 60,000 0 0 0.0% 0 0 0 $0.00
Hollywood 0 0 0 0 0.0% 0 0 0 $0.00
Jupiter 0 0 0 0 0.0% 0 0 0 $0.00
Kendall 0 0 0 0 0.0% 0 0 0 $0.00
Medley/Hialeah 0 0 0 0 0.0% 0 0 0 $0.00
Miami 1 106,640 26,994 26,994 25.3% 948 0 0 $35.00
Miami Airport 1 50,000 0 0 0.0% 0 0 0 $0.00
Miami Beach 1 49,768 3,233 3,233 6.5% 0 0 0 $100.00
Miami Lakes 0 0 0 0 0.0% 0 0 0 $0.00
Miami-Dade Central County 0 0 0 0 0.0% 0 0 0 $0.00
North Palm Beach 0 0 0 0 0.0% 0 0 0 $0.00
Northeast Dade 0 0 0 0 0.0% 0 0 0 $0.00
NW Broward/Coral Springs 0 0 0 0 0.0% 0 0 0 $0.00
Outlying Broward County 0 0 0 0 0.0% 0 0 0 $0.00
Outlying Miami-Dade Cnty 0 0 0 0 0.0% 0 0 0 $0.00
Palm Beach 0 0 0 0 0.0% 0 0 0 $0.00
Palm Springs/Lake Worth 0 0 0 0 0.0% 0 0 0 $0.00
Plantation 0 0 0 0 0.0% 0 0 0 $0.00
Pompano Beach 1 137,860 67,918 67,918 49.3% (1,400) 0 0 $12.00
Royal Palm Bch/Wellington 1 47,309 0 0 0.0% 0 0 0 $0.00
Sawgrass Park 0 0 0 0 0.0% 0 0 0 $0.00
South Dade 1 207,873 0 0 0.0% 0 0 0 $0.00
Southwest Broward 0 0 0 0 0.0% 0 0 0 $0.00
West Miami 0 0 0 0 0.0% 0 0 0 $0.00
West Palm Beach 0 0 0 0 0.0% 0 0 0 $0.00
Totals 11 1,348,226 185,565 185,565 13.8% (452) 0 0 $27.68
Source: CoStar Property®
Existing Inventory Vacancy
FIGURES AT A GLANCE

14 THE COSTAR RETAIL REPORT ©2011 COSTAR GROUP, INC.
SOUTH FLORIDA – FIRST QUARTER 2011
South Florida Retail MarketFIRST QUARTER 2011 – SOUTH FLORIDA
South Florida Retail Market
©2011 COSTAR GROUP, INC. THE COSTAR RETAIL REPORT 15
Total Retail Market Statistics First Quarter 2011
YTD Net YTD Under Quoted
Market # Blds Total GLA Direct SF Total SF Vac % Absorption Deliveries Const SF Rates
Aventura 121 6,094,948 105,508 105,508 1.7% 44,526 0 0 $30.68
Biscayne Corridor 202 1,518,635 134,810 134,810 8.9% 36,182 0 0 $20.69
Boca Raton 484 12,190,667 615,649 616,629 5.1% 99,498 93,680 0 $22.54
Boynton/Lantana 559 10,578,756 908,155 908,155 8.6% 17,171 4,748 0 $17.96
Brickell 63 1,294,839 72,824 72,824 5.6% 3,477 0 0 $42.11
Coconut Grove 138 1,735,691 128,417 130,917 7.5% (2,249) 0 0 $27.41
Commercial Blvd 109 1,897,659 95,796 95,796 5.0% 71,629 0 0 $7.58
Coral Gables 395 3,885,389 168,561 168,561 4.3% 10,296 0 0 $31.56
Coral Way 227 2,161,951 64,042 64,042 3.0% (13,834) 0 0 $30.11
Cypress Creek 214 2,684,222 195,758 197,058 7.3% (3,609) 0 4,152 $13.59
Delray Beach 526 7,270,917 597,852 601,252 8.3% (11,474) 0 0 $16.86
Downtown Fort Lauderdale 421 5,690,788 379,168 381,193 6.7% (30,783) 0 0 $23.02
Downtown Miami 150 6,066,748 394,714 394,714 6.5% 18,075 0 0 $28.60
Fort Lauderdale 1,970 18,478,887 1,153,902 1,215,879 6.6% 2,454 10,793 46,758 $17.79
Hallandale 491 4,175,655 579,764 583,669 14.0% 30,676 0 0 $16.52
Hollywood 1,096 12,064,269 820,078 859,470 7.1% 40,781 3,960 0 $18.50
Jupiter 294 4,427,290 265,893 268,371 6.1% 12,066 0 0 $20.93
Kendall 696 16,996,228 751,724 761,924 4.5% 44,593 0 0 $28.19
Medley/Hialeah 825 11,614,072 349,090 371,890 3.2% (8,061) 0 52,780 $19.73
Miami 2,286 13,633,115 611,618 636,118 4.7% (36,878) 0 75,441 $16.99
Miami Airport 551 13,001,670 469,537 516,406 4.0% (13,632) 0 0 $20.14
Miami Beach 551 7,939,025 250,670 275,560 3.5% 10,194 0 8,006 $49.12
Miami Lakes 174 4,375,083 207,537 207,537 4.7% 4,611 0 0 $20.89
Miami-Dade Central County 319 2,560,516 232,783 232,783 9.1% 1,597 0 0 $14.88
North Palm Beach 700 11,692,211 795,251 830,636 7.1% 69,098 0 0 $16.17
Northeast Dade 1,066 10,849,893 503,083 503,083 4.6% 18,201 0 0 $19.20
NW Broward/Coral Springs 533 11,516,535 1,142,798 1,182,414 10.3% 18,088 0 0 $16.07
Outlying Broward County 122 2,700,987 218,698 218,698 8.1% 1,501 6,359 0 $19.29
Outlying Miami-Dade Cnty 21 318,237 49,878 49,878 15.7% 0 0 0 $21.26
Palm Beach 212 4,638,133 434,481 434,481 9.4% 3,337 0 0 $22.59
Palm Springs/Lake Worth 242 2,723,493 136,740 136,740 5.0% 5,227 0 0 $14.58
Plantation 546 12,823,770 1,824,471 1,840,290 14.4% (49,145) 0 0 $15.48
Pompano Beach 1,083 16,991,481 1,167,656 1,195,456 7.0% (46,382) 15,337 0 $18.06
Royal Palm Bch/Wellington 215 7,258,601 465,859 475,939 6.6% 1,968 0 0 $18.05
Sawgrass Park 75 4,436,887 84,934 90,008 2.0% 1,638 0 0 $15.19
South Dade 821 12,638,304 728,957 760,175 6.0% 21,569 1,645 0 $18.62
Southwest Broward 517 15,004,902 949,231 960,139 6.4% 38,111 0 0 $20.38
West Miami 645 6,602,023 160,856 160,856 2.4% 29,109 0 0 $26.84
West Palm Beach 1,419 18,893,278 2,044,695 2,055,817 10.9% 79,678 64,648 0 $15.80
Totals 21,079 311,425,755 20,261,438 20,695,676 6.6% 519,304 201,170 187,137 $19.41
Source: CoStar Property®
Existing Inventory Vacancy
FIGURES AT A GLANCE

16 THE COSTAR RETAIL REPORT ©2011 COSTAR GROUP, INC.
SOUTH FLORIDA – FIRST QUARTER 2011
South Florida Retail MarketFIRST QUARTER 2011 – SOUTH FLORIDA
South Florida Retail Market
©2011 COSTAR GROUP, INC. THE COSTAR RETAIL REPORT 17
FIGURES AT A GLANCE
General Retail Submarket Statistics First Quarter 2011
YTD Net YTD Under Quoted
Market # Blds Total GLA Direct SF Total SF Vac % Absorption Deliveries Const SF Rates
Aventura 63 618,745 1,845 1,845 0.3% 2,024 0 0 $25.00
Biscayne Corridor 186 1,181,990 67,905 67,905 5.7% 25,126 0 0 $21.79
Boca Raton East 215 2,683,078 119,411 119,411 4.5% 93,304 93,680 0 $19.56
Boca Raton North 15 540,651 1,725 1,725 0.3% 1,104 0 0 $20.00
Boca Raton West 41 1,223,862 0 0 0.0% 1,440 0 0 $31.58
Boynton/Lantana 354 3,016,463 59,280 59,280 2.0% 3,265 4,748 0 $22.54
Brickell 56 964,737 70,824 70,824 7.3% 3,477 0 0 $40.89
Coconut Grove 112 805,298 45,874 48,374 6.0% (2,098) 0 0 $26.00
Commercial Blvd 75 638,757 29,518 29,518 4.6% 0 0 0 $13.00
Coral Gables 335 2,236,846 114,573 114,573 5.1% 7,890 0 0 $31.12
Coral Way 183 1,430,348 18,535 18,535 1.3% (3,206) 0 0 $20.09
Cypress Creek 163 1,319,764 35,404 35,404 2.7% (4,300) 0 4,152 $19.30
Delray Beach 399 3,216,898 114,035 114,035 3.5% (4,915) 0 0 $20.69
Downtown Fort Lauderdale 382 3,312,760 181,349 183,374 5.5% (28,303) 0 0 $23.36
Downtown Miami 136 5,214,913 171,486 171,486 3.3% 18,075 0 0 $32.98
Fort Lauderdale 1,651 11,626,790 363,966 386,166 3.3% 8,430 10,793 46,758 $18.36
Hallandale 390 1,837,765 46,400 46,400 2.5% 15,468 0 0 $18.60
Hialeah Gardens 273 1,053,459 72,887 72,887 6.9% 3,187 0 0 $19.41
Hollywood 868 5,353,546 254,777 254,777 4.8% 15,142 0 0 $19.99
Jupiter 179 1,526,818 43,043 43,043 2.8% 6,400 0 0 $18.90
Kendall 445 4,604,932 45,542 45,542 1.0% (7,336) 0 0 $23.72
Medley/Hialeah 627 5,221,134 130,897 132,497 2.5% (850) 0 0 $20.66
Miami 2,100 11,279,540 469,531 494,031 4.4% (32,354) 0 75,441 $16.21
Miami Airport 343 3,041,420 34,268 37,068 1.2% (4,140) 0 0 $31.84
Miami Beach 514 6,110,130 209,177 234,067 3.8% 5,539 0 8,006 $49.42
Miami Lakes 116 2,119,701 67,639 67,639 3.2% 50 0 0 $22.05
North Palm Beach 507 5,086,256 180,252 196,297 3.9% 29,644 0 0 $18.26
Northeast Dade 774 4,580,241 167,989 167,989 3.7% (1,097) 0 0 $15.91
NW Broward/Coral Springs 293 3,196,016 101,818 108,418 3.4% 16,855 0 0 $19.68
Outlying Broward County 39 541,957 4,400 4,400 0.8% 8,159 6,359 0 $20.00
Outlying Miami-Dade Cnty 11 78,408 18,068 18,068 23.0% 0 0 0 $18.00
Palm Bch Cty Outlying 98 977,171 16,208 16,208 1.7% (6,458) 0 0 $21.36
Palm Beach 44 623,866 22,086 22,086 3.5% 0 0 0 $58.43
Palm Springs/Lake Worth 206 1,339,748 45,826 45,826 3.4% (6,960) 0 0 $16.96
Plantation 300 3,091,134 117,605 117,605 3.8% 2,921 0 0 $16.80
Pompano Beach 727 7,444,070 234,811 234,811 3.2% 18,125 15,337 0 $15.98
Royal Palm Bch/Wellington 92 1,286,242 37,721 37,721 2.9% (3,750) 0 0 $21.29
Sawgrass Park 37 893,319 0 0 0.0% 0 0 0 $16.84
South Dade 642 5,435,302 236,097 254,070 4.7% (1,877) 1,645 0 $13.62
Southwest Broward 262 4,915,934 49,014 59,922 1.2% (6,915) 0 0 $15.94
West Miami 474 2,564,142 63,268 63,268 2.5% (2,878) 0 0 $27.27
West Palm Beach 1,124 9,245,798 602,248 609,870 6.6% 32,103 64,648 0 $15.96
Totals 15,851 133,479,949 4,667,302 4,806,965 3.6% 200,291 197,210 134,357 $21.10
Source: CoStar Property®
Existing Inventory Vacancy

16 THE COSTAR RETAIL REPORT ©2011 COSTAR GROUP, INC.
SOUTH FLORIDA – FIRST QUARTER 2011
South Florida Retail MarketFIRST QUARTER 2011 – SOUTH FLORIDA
South Florida Retail Market
©2011 COSTAR GROUP, INC. THE COSTAR RETAIL REPORT 17
FIGURES AT A GLANCE
Mall Submarket Statistics First Quarter 2011
YTD Net YTD Under Quoted
Market # Ctrs Total GLA Direct SF Total SF Vac % Absorption Deliveries Const SF Rates
Aventura 3 3,117,322 39,765 39,765 1.3% 0 0 0 $34.51
Biscayne Corridor 0 0 0 0 0.0% 0 0 0 $0.00
Boca Raton East 2 724,845 57,182 57,182 7.9% 7,716 0 0 $22.97
Boca Raton North 0 0 0 0 0.0% 0 0 0 $0.00
Boca Raton West 2 1,711,660 11,192 12,172 0.7% (645) 0 0 $0.00
Boynton/Lantana 2 1,265,979 33,556 33,556 2.7% 3,600 0 0 $25.60
Brickell 0 0 0 0 0.0% 0 0 0 $0.00
Coconut Grove 1 199,683 27,483 27,483 13.8% 0 0 0 $33.07
Commercial Blvd 0 0 0 0 0.0% 0 0 0 $0.00
Coral Gables 1 1,194,168 33,275 33,275 2.8% 0 0 0 $0.00
Coral Way 0 0 0 0 0.0% 0 0 0 $0.00
Cypress Creek 0 0 0 0 0.0% 0 0 0 $0.00
Delray Beach 0 0 0 0 0.0% 0 0 0 $0.00
Downtown Fort Lauderdale 2 1,301,775 160,000 160,000 12.3% 0 0 0 $0.00
Downtown Miami 1 537,247 72,120 72,120 13.4% 0 0 0 $0.00
Fort Lauderdale 1 608,241 285,919 285,919 47.0% 0 0 0 $13.52
Hallandale 1 420,000 375,000 375,000 89.3% 0 0 0 $0.00
Hialeah Gardens 1 454,672 89,556 89,556 19.7% 69 0 0 $14.00
Hollywood 1 163,179 76,770 76,770 47.0% (5,639) 0 0 $16.00
Jupiter 0 0 0 0 0.0% 0 0 0 $0.00
Kendall 4 3,549,623 107,310 113,810 3.2% 0 0 0 $45.06
Medley/Hialeah 1 786,466 0 0 0.0% 0 0 0 $0.00
Miami 0 33,432 0 0 0.0% 0 0 0 $0.00
Miami Airport 4 4,172,977 46,235 90,304 2.2% 900 0 0 $0.00
Miami Beach 1 500,000 0 0 0.0% 0 0 0 $0.00
Miami Lakes 0 0 0 0 0.0% 0 0 0 $0.00
North Palm Beach 4 2,063,849 83,783 83,783 4.1% 23,590 0 0 $28.00
Northeast Dade 1 681,469 36,338 36,338 5.3% 0 0 0 $21.60
NW Broward/Coral Springs 1 1,037,203 12,600 12,600 1.2% 0 0 0 $30.00
Outlying Broward County 0 0 0 0 0.0% 0 0 0 $0.00
Outlying Miami-Dade Cnty 0 0 0 0 0.0% 0 0 0 $0.00
Palm Bch Cty Outlying 0 0 0 0 0.0% 0 0 0 $0.00
Palm Beach 1 147,832 0 0 0.0% 2,207 0 0 $0.00
Palm Springs/Lake Worth 0 0 0 0 0.0% 0 0 0 $0.00
Plantation 2 2,095,372 652,062 652,062 31.1% (2,400) 0 0 $0.00
Pompano Beach 2 1,107,653 72,814 72,814 6.6% (5,913) 0 0 $28.52
Royal Palm Bch/Wellington 1 1,273,000 0 0 0.0% 0 0 0 $0.00
Sawgrass Park 1 2,252,068 0 0 0.0% 0 0 0 $0.00
South Dade 1 1,165,353 38,607 38,607 3.3% (149) 0 0 $28.59
Southwest Broward 3 1,471,706 24,826 24,826 1.7% 0 0 0 $23.83
West Miami 0 0 0 0 0.0% 0 0 0 $0.00
West Palm Beach 2 2,496,482 562,032 562,032 22.5% 0 0 0 $0.00
Totals 47 36,533,256 2,898,425 2,949,974 8.1% 23,336 0 0 $22.27
Source: CoStar Property®
Existing Inventory Vacancy
18 THE COSTAR RETAIL REPORT ©2011 COSTAR GROUP, INC.
SOUTH FLORIDA – FIRST QUARTER 2011
South Florida Retail MarketFIRST QUARTER 2011 – SOUTH FLORIDA
South Florida Retail Market
©2011 COSTAR GROUP, INC. THE COSTAR RETAIL REPORT 19
FIGURES AT A GLANCE
Power Center Submarket Statistics First Quarter 2011
YTD Net YTD Under Quoted
Market # Ctrs Total GLA Direct SF Total SF Vac % Absorption Deliveries Const SF Rates
Aventura 1 437,304 0 0 0.0% 0 0 0 $45.00
Biscayne Corridor 0 0 0 0 0.0% 0 0 0 $0.00
Boca Raton East 1 173,922 3,129 3,129 1.8% 0 0 0 $59.00
Boca Raton North 0 0 0 0 0.0% 0 0 0 $0.00
Boca Raton West 1 227,345 0 0 0.0% 0 0 0 $35.00
Boynton/Lantana 3 912,107 117,769 117,769 12.9% (6,235) 0 0 $18.59
Brickell 0 0 0 0 0.0% 0 0 0 $0.00
Coconut Grove 0 0 0 0 0.0% 0 0 0 $0.00
Commercial Blvd 1 248,718 2,800 2,800 1.1% 67,899 0 0 $25.00
Coral Gables 0 0 0 0 0.0% 0 0 0 $0.00
Coral Way 1 250,000 31,579 31,579 12.6% 0 0 0 $38.67
Cypress Creek 0 0 0 0 0.0% 0 0 0 $0.00
Delray Beach 2 993,262 82,409 82,409 8.3% (11,180) 0 0 $17.57
Downtown Fort Lauderdale 0 0 0 0 0.0% 0 0 0 $0.00
Downtown Miami 0 0 0 0 0.0% 0 0 0 $0.00
Fort Lauderdale 1 427,455 2,205 2,205 0.5% 0 0 0 $22.30
Hallandale 1 339,000 13,500 13,500 4.0% 0 0 0 $0.00
Hialeah Gardens 0 0 0 0 0.0% 0 0 0 $0.00
Hollywood 4 2,221,152 60,008 63,122 2.8% 16,331 3,960 0 $22.77
Jupiter 0 0 0 0 0.0% 0 0 0 $0.00
Kendall 1 361,765 0 0 0.0% 0 0 0 $0.00
Medley/Hialeah 2 795,550 1,865 1,865 0.2% 0 0 0 $0.00
Miami 0 0 0 0 0.0% 0 0 0 $0.00
Miami Airport 1 411,137 0 0 0.0% 0 0 0 $0.00
Miami Beach 1 504,300 4,339 4,339 0.9% 2,850 0 0 $50.00
Miami Lakes 0 0 0 0 0.0% 0 0 0 $0.00
North Palm Beach 1 366,298 37,975 41,975 11.5% 0 0 0 $18.00
Northeast Dade 0 0 0 0 0.0% 0 0 0 $0.00
NW Broward/Coral Springs 0 0 0 0 0.0% 0 0 0 $0.00
Outlying Broward County 0 0 0 0 0.0% 0 0 0 $0.00
Outlying Miami-Dade Cnty 0 0 0 0 0.0% 0 0 0 $0.00
Palm Bch Cty Outlying 0 0 0 0 0.0% 0 0 0 $0.00
Palm Beach 0 0 0 0 0.0% 0 0 0 $0.00
Palm Springs/Lake Worth 0 0 0 0 0.0% 0 0 0 $0.00
Plantation 1 488,721 32,178 32,178 6.6% 43,424 0 0 $0.00
Pompano Beach 1 259,340 15,850 15,850 6.1% (2,100) 0 0 $19.24
Royal Palm Bch/Wellington 3 777,049 58,675 58,675 7.6% 3,500 0 0 $18.83
Sawgrass Park 0 0 0 0 0.0% 0 0 0 $0.00
South Dade 1 358,173 87,534 87,534 24.4% 0 0 0 $0.00
Southwest Broward 3 1,094,744 190,198 190,198 17.4% 3,566 0 0 $17.75
West Miami 0 0 0 0 0.0% 0 0 0 $0.00
West Palm Beach 0 0 0 0 0.0% 0 0 0 $0.00
Totals 31 11,647,342 742,013 749,127 6.4% 118,055 3,960 0 $21.27
Source: CoStar Property®
Existing Inventory Vacancy

18 THE COSTAR RETAIL REPORT ©2011 COSTAR GROUP, INC.
SOUTH FLORIDA – FIRST QUARTER 2011
South Florida Retail MarketFIRST QUARTER 2011 – SOUTH FLORIDA
South Florida Retail Market
©2011 COSTAR GROUP, INC. THE COSTAR RETAIL REPORT 19
FIGURES AT A GLANCE
Shopping Center Submarket Statistics First Quarter 2011
YTD Net YTD Under Quoted
Market # Ctrs Total GLA Direct SF Total SF Vac % Absorption Deliveries Const SF Rates
Aventura 24 1,921,577 63,898 63,898 3.3% 42,502 0 0 $30.19
Biscayne Corridor 15 336,645 66,905 66,905 19.9% 11,056 0 0 $16.15
Boca Raton East 64 1,785,398 178,548 178,548 10.0% 6,599 0 0 $20.61
Boca Raton North 4 116,581 7,381 7,381 6.3% 716 0 0 $31.28
Boca Raton West 36 3,003,325 237,081 237,081 7.9% (10,736) 0 0 $24.96
Boynton/Lantana 75 5,384,207 697,550 697,550 13.0% 16,541 0 0 $16.88
Brickell 6 136,102 0 0 0.0% 0 0 0 $51.47
Coconut Grove 20 440,714 8,995 8,995 2.0% (151) 0 0 $27.85
Commercial Blvd 17 1,010,184 63,478 63,478 6.3% 3,730 0 0 $6.22
Coral Gables 57 454,375 20,713 20,713 4.6% 2,406 0 0 $35.56
Coral Way 41 481,603 13,928 13,928 2.9% (10,628) 0 0 $20.72
Cypress Creek 37 1,364,458 160,354 161,654 11.8% 691 0 0 $12.17
Delray Beach 64 3,060,757 401,408 404,808 13.2% 4,621 0 0 $16.07
Downtown Fort Lauderdale 24 1,076,253 37,819 37,819 3.5% (2,480) 0 0 $22.66
Downtown Miami 5 276,988 114,608 114,608 41.4% 0 0 0 $15.00
Fort Lauderdale 217 5,649,221 498,957 538,734 9.5% (5,976) 0 0 $19.46
Hallandale 89 1,518,890 144,864 148,769 9.8% 15,208 0 0 $15.39
Hialeah Gardens 32 1,052,385 70,340 70,340 6.7% (1,659) 0 0 $15.32
Hollywood 153 4,326,392 428,523 464,801 10.7% 14,947 0 0 $17.73
Jupiter 53 2,900,472 222,850 225,328 7.8% 5,666 0 0 $21.58
Kendall 129 8,479,908 598,872 602,572 7.1% 51,929 0 0 $25.80
Medley/Hialeah 147 4,810,922 216,328 237,528 4.9% (7,211) 0 52,780 $19.43
Miami 172 2,213,503 115,093 115,093 5.2% (5,472) 0 0 $13.87
Miami Airport 118 5,326,136 389,034 389,034 7.3% (10,392) 0 0 $19.14
Miami Beach 28 774,827 33,921 33,921 4.4% 1,805 0 0 $38.97
Miami Lakes 38 2,255,382 139,898 139,898 6.2% 4,561 0 0 $20.32
North Palm Beach 84 4,175,808 493,241 508,581 12.2% 15,864 0 0 $15.31
Northeast Dade 236 5,588,183 298,756 298,756 5.3% 19,298 0 0 $20.32
NW Broward/Coral Springs 125 7,283,316 1,028,380 1,061,396 14.6% 1,233 0 0 $15.54
Outlying Broward County 26 2,159,030 214,298 214,298 9.9% (6,658) 0 0 $19.27
Outlying Miami-Dade Cnty 5 239,829 31,810 31,810 13.3% 0 0 0 $22.26
Palm Bch Cty Outlying 26 2,658,685 361,416 361,416 13.6% 5,701 0 0 $17.56
Palm Beach 3 230,579 34,771 34,771 15.1% 1,887 0 0 $41.08
Palm Springs/Lake Worth 24 1,383,745 90,914 90,914 6.6% 12,187 0 0 $12.70
Plantation 107 7,148,543 1,022,626 1,038,445 14.5% (93,090) 0 0 $15.42
Pompano Beach 177 8,042,558 776,263 804,063 10.0% (55,094) 0 0 $18.06
Royal Palm Bch/Wellington 35 3,875,001 369,463 379,543 9.8% 2,218 0 0 $17.50
Sawgrass Park 14 1,291,500 84,934 90,008 7.0% 1,638 0 0 $14.45
South Dade 104 5,471,603 366,719 379,964 6.9% 23,595 0 0 $19.69
Southwest Broward 100 7,522,518 685,193 685,193 9.1% 41,460 0 0 $21.31
West Miami 145 4,037,881 97,588 97,588 2.4% 31,987 0 0 $26.82
West Palm Beach 153 7,150,998 880,415 883,915 12.4% 47,575 0 0 $15.71
Totals 3,029 128,416,982 11,768,133 12,004,045 9.3% 178,074 0 52,780 $18.47
Source: CoStar Property®
Existing Inventory Vacancy

20 THE COSTAR RETAIL REPORT ©2011 COSTAR GROUP, INC.
SOUTH FLORIDA – FIRST QUARTER 2011
South Florida Retail MarketFIRST QUARTER 2011 – SOUTH FLORIDA
South Florida Retail Market
©2011 COSTAR GROUP, INC. THE COSTAR RETAIL REPORT 21
FIGURES AT A GLANCE
Specialty Center Submarket Statistics First Quarter 2011
YTD Net YTD Under Quoted
Market # Ctrs Total GLA Direct SF Total SF Vac % Absorption Deliveries Const SF Rates
Aventura 0 0 0 0 0.0% 0 0 0 $0.00
Biscayne Corridor 0 0 0 0 0.0% 0 0 0 $0.00
Boca Raton East 0 0 0 0 0.0% 0 0 0 $0.00
Boca Raton North 0 0 0 0 0.0% 0 0 0 $0.00
Boca Raton West 0 0 0 0 0.0% 0 0 0 $0.00
Boynton/Lantana 0 0 0 0 0.0% 0 0 0 $0.00
Brickell 1 194,000 2,000 2,000 1.0% 0 0 0 $0.00
Coconut Grove 1 289,996 46,065 46,065 15.9% 0 0 0 $23.50
Commercial Blvd 0 0 0 0 0.0% 0 0 0 $0.00
Coral Gables 0 0 0 0 0.0% 0 0 0 $0.00
Coral Way 0 0 0 0 0.0% 0 0 0 $0.00
Cypress Creek 0 0 0 0 0.0% 0 0 0 $0.00
Delray Beach 0 0 0 0 0.0% 0 0 0 $0.00
Downtown Fort Lauderdale 0 0 0 0 0.0% 0 0 0 $0.00
Downtown Miami 1 37,600 36,500 36,500 97.1% 0 0 0 $22.50
Fort Lauderdale 1 167,180 2,855 2,855 1.7% 0 0 0 $0.00
Hallandale 1 60,000 0 0 0.0% 0 0 0 $0.00
Hialeah Gardens 0 0 0 0 0.0% 0 0 0 $0.00
Hollywood 0 0 0 0 0.0% 0 0 0 $0.00
Jupiter 0 0 0 0 0.0% 0 0 0 $0.00
Kendall 0 0 0 0 0.0% 0 0 0 $0.00
Medley/Hialeah 0 0 0 0 0.0% 0 0 0 $0.00
Miami 1 106,640 26,994 26,994 25.3% 948 0 0 $35.00
Miami Airport 1 50,000 0 0 0.0% 0 0 0 $0.00
Miami Beach 1 49,768 3,233 3,233 6.5% 0 0 0 $100.00
Miami Lakes 0 0 0 0 0.0% 0 0 0 $0.00
North Palm Beach 0 0 0 0 0.0% 0 0 0 $0.00
Northeast Dade 0 0 0 0 0.0% 0 0 0 $0.00
NW Broward/Coral Springs 0 0 0 0 0.0% 0 0 0 $0.00
Outlying Broward County 0 0 0 0 0.0% 0 0 0 $0.00
Outlying Miami-Dade Cnty 0 0 0 0 0.0% 0 0 0 $0.00
Palm Bch Cty Outlying 0 0 0 0 0.0% 0 0 0 $0.00
Palm Beach 0 0 0 0 0.0% 0 0 0 $0.00
Palm Springs/Lake Worth 0 0 0 0 0.0% 0 0 0 $0.00
Plantation 0 0 0 0 0.0% 0 0 0 $0.00
Pompano Beach 1 137,860 67,918 67,918 49.3% (1,400) 0 0 $12.00
Royal Palm Bch/Wellington 1 47,309 0 0 0.0% 0 0 0 $0.00
Sawgrass Park 0 0 0 0 0.0% 0 0 0 $0.00
South Dade 1 207,873 0 0 0.0% 0 0 0 $0.00
Southwest Broward 0 0 0 0 0.0% 0 0 0 $0.00
West Miami 0 0 0 0 0.0% 0 0 0 $0.00
West Palm Beach 0 0 0 0 0.0% 0 0 0 $0.00
Totals 11 1,348,226 185,565 185,565 13.8% (452) 0 0 $27.68
Source: CoStar Property®
Existing Inventory Vacancy
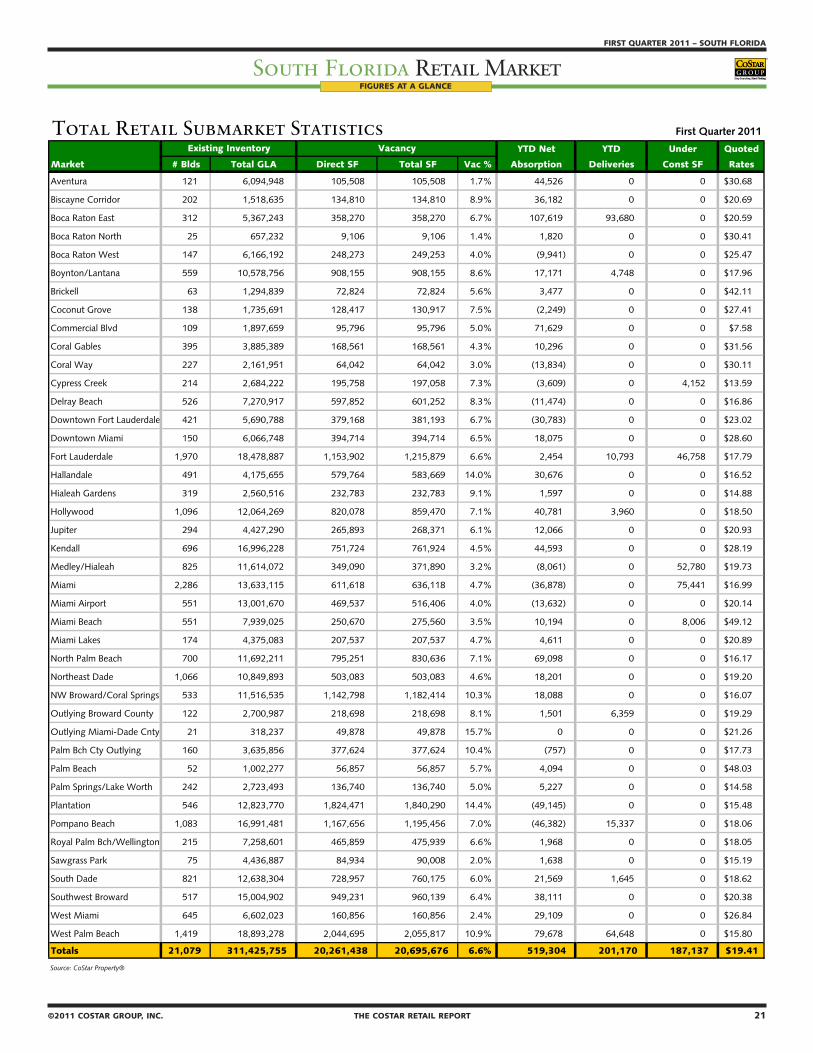
20 THE COSTAR RETAIL REPORT ©2011 COSTAR GROUP, INC.
SOUTH FLORIDA – FIRST QUARTER 2011
South Florida Retail MarketFIRST QUARTER 2011 – SOUTH FLORIDA
South Florida Retail Market
©2011 COSTAR GROUP, INC. THE COSTAR RETAIL REPORT 21
FIGURES AT A GLANCE
Total Retail Submarket Statistics First Quarter 2011
YTD Net YTD Under Quoted
Market # Blds Total GLA Direct SF Total SF Vac % Absorption Deliveries Const SF Rates
Aventura 121 6,094,948 105,508 105,508 1.7% 44,526 0 0 $30.68
Biscayne Corridor 202 1,518,635 134,810 134,810 8.9% 36,182 0 0 $20.69
Boca Raton East 312 5,367,243 358,270 358,270 6.7% 107,619 93,680 0 $20.59
Boca Raton North 25 657,232 9,106 9,106 1.4% 1,820 0 0 $30.41
Boca Raton West 147 6,166,192 248,273 249,253 4.0% (9,941) 0 0 $25.47
Boynton/Lantana 559 10,578,756 908,155 908,155 8.6% 17,171 4,748 0 $17.96
Brickell 63 1,294,839 72,824 72,824 5.6% 3,477 0 0 $42.11
Coconut Grove 138 1,735,691 128,417 130,917 7.5% (2,249) 0 0 $27.41
Commercial Blvd 109 1,897,659 95,796 95,796 5.0% 71,629 0 0 $7.58
Coral Gables 395 3,885,389 168,561 168,561 4.3% 10,296 0 0 $31.56
Coral Way 227 2,161,951 64,042 64,042 3.0% (13,834) 0 0 $30.11
Cypress Creek 214 2,684,222 195,758 197,058 7.3% (3,609) 0 4,152 $13.59
Delray Beach 526 7,270,917 597,852 601,252 8.3% (11,474) 0 0 $16.86
Downtown Fort Lauderdale 421 5,690,788 379,168 381,193 6.7% (30,783) 0 0 $23.02
Downtown Miami 150 6,066,748 394,714 394,714 6.5% 18,075 0 0 $28.60
Fort Lauderdale 1,970 18,478,887 1,153,902 1,215,879 6.6% 2,454 10,793 46,758 $17.79
Hallandale 491 4,175,655 579,764 583,669 14.0% 30,676 0 0 $16.52
Hialeah Gardens 319 2,560,516 232,783 232,783 9.1% 1,597 0 0 $14.88
Hollywood 1,096 12,064,269 820,078 859,470 7.1% 40,781 3,960 0 $18.50
Jupiter 294 4,427,290 265,893 268,371 6.1% 12,066 0 0 $20.93
Kendall 696 16,996,228 751,724 761,924 4.5% 44,593 0 0 $28.19
Medley/Hialeah 825 11,614,072 349,090 371,890 3.2% (8,061) 0 52,780 $19.73
Miami 2,286 13,633,115 611,618 636,118 4.7% (36,878) 0 75,441 $16.99
Miami Airport 551 13,001,670 469,537 516,406 4.0% (13,632) 0 0 $20.14
Miami Beach 551 7,939,025 250,670 275,560 3.5% 10,194 0 8,006 $49.12
Miami Lakes 174 4,375,083 207,537 207,537 4.7% 4,611 0 0 $20.89
North Palm Beach 700 11,692,211 795,251 830,636 7.1% 69,098 0 0 $16.17
Northeast Dade 1,066 10,849,893 503,083 503,083 4.6% 18,201 0 0 $19.20
NW Broward/Coral Springs 533 11,516,535 1,142,798 1,182,414 10.3% 18,088 0 0 $16.07
Outlying Broward County 122 2,700,987 218,698 218,698 8.1% 1,501 6,359 0 $19.29
Outlying Miami-Dade Cnty 21 318,237 49,878 49,878 15.7% 0 0 0 $21.26
Palm Bch Cty Outlying 160 3,635,856 377,624 377,624 10.4% (757) 0 0 $17.73
Palm Beach 52 1,002,277 56,857 56,857 5.7% 4,094 0 0 $48.03
Palm Springs/Lake Worth 242 2,723,493 136,740 136,740 5.0% 5,227 0 0 $14.58
Plantation 546 12,823,770 1,824,471 1,840,290 14.4% (49,145) 0 0 $15.48
Pompano Beach 1,083 16,991,481 1,167,656 1,195,456 7.0% (46,382) 15,337 0 $18.06
Royal Palm Bch/Wellington 215 7,258,601 465,859 475,939 6.6% 1,968 0 0 $18.05
Sawgrass Park 75 4,436,887 84,934 90,008 2.0% 1,638 0 0 $15.19
South Dade 821 12,638,304 728,957 760,175 6.0% 21,569 1,645 0 $18.62
Southwest Broward 517 15,004,902 949,231 960,139 6.4% 38,111 0 0 $20.38
West Miami 645 6,602,023 160,856 160,856 2.4% 29,109 0 0 $26.84
West Palm Beach 1,419 18,893,278 2,044,695 2,055,817 10.9% 79,678 64,648 0 $15.80
Totals 21,079 311,425,755 20,261,438 20,695,676 6.6% 519,304 201,170 187,137 $19.41
Source: CoStar Property®
Existing Inventory Vacancy

22 THE COSTAR RETAIL REPORT ©2011 COSTAR GROUP, INC.
SOUTH FLORIDA – FIRST QUARTER 2011
South Florida Retail MarketFIRST QUARTER 2011 – SOUTH FLORIDA
South Florida Retail Market
©2011 COSTAR GROUP, INC. THE COSTAR RETAIL REPORT 23
FIGURES AT A GLANCE
General Retail Market Statistics First Quarter 2011
Net Quoted
Period # Blds Total GLA Direct SF Total SF Vac % Absorption # Blds Total GLA # Blds Total GLA Rates
2011 1q 15,851 133,479,949 4,667,302 4,806,965 3.6% 200,291 10 197,210 9 134,357 $21.10 2010 4q 15,843 133,290,386 4,712,830 4,817,693 3.6% 104,631 5 42,847 14 235,922 $21.58 2010 3q 15,838 133,247,539 4,768,226 4,879,477 3.7% 121,641 6 75,581 19 278,769 $23.38 2010 2q 15,836 133,265,127 4,907,555 5,018,706 3.8% 127,159 4 41,129 14 240,689 $23.60 2010 1q 15,832 133,223,998 5,004,848 5,104,736 3.8% 219,938 10 173,460 13 232,597 $23.75 2009 4q 15,823 133,056,989 5,035,807 5,157,665 3.9% (180,187) 6 65,183 18 248,439 $24.08 2009 3q 15,818 132,994,606 4,798,436 4,915,095 3.7% (252,033) 10 163,004 19 248,381 $24.09 2009 2q 15,808 132,831,602 4,329,321 4,500,058 3.4% 67,946 8 79,125 20 366,026 $23.62 2009 1q 15,801 132,753,798 4,292,479 4,490,200 3.4% 300,872 14 523,942 23 383,574 $24.36 2008 4q 15,787 132,229,856 4,113,831 4,267,130 3.2% (76,343) 19 403,819 27 716,657 $23.94 2008 3q 15,768 131,826,037 3,715,668 3,786,968 2.9% (118,208) 18 321,211 41 1,072,275 $24.08 2008 2q 15,752 131,542,233 3,342,770 3,384,956 2.6% 382,092 17 326,843 53 1,294,641 $25.34 2008 1q 15,736 131,220,290 3,406,874 3,445,105 2.6% 744,350 29 898,648 49 899,370 $24.92 2007 4q 15,709 130,347,068 3,301,100 3,316,233 2.5% 141,293 16 482,880 53 1,361,476 $25.70 2007 3q 15,696 129,942,931 3,038,256 3,053,389 2.3% 775,588 10 382,154 60 1,712,427 $25.45 2007 2q 15,686 129,560,777 3,426,715 3,446,823 2.7% 716,854 22 239,960 39 1,658,078 $24.94
Source: CoStar Property®
Mall Market Statistics First Quarter 2011
Net Quoted
Period # Ctrs Total GLA Direct SF Total SF Vac % Absorption # Blds Total GLA # Blds Total GLA Rates
2011 1q 47 36,533,256 2,898,425 2,949,974 8.1% 23,336 0 0 0 0 $22.27 2010 4q 47 36,533,256 2,921,761 2,973,310 8.1% (42,879) 0 0 0 0 $22.15 2010 3q 47 36,533,256 2,878,882 2,930,431 8.0% (15,671) 0 0 0 0 $20.28 2010 2q 47 36,533,256 2,863,211 2,914,760 8.0% (54,381) 0 0 0 0 $21.07 2010 1q 47 36,533,256 2,808,830 2,860,379 7.8% (250,849) 1 400,000 0 0 $20.66 2009 4q 47 36,133,256 2,157,981 2,209,530 6.1% 319,918 2 329,051 1 400,000 $21.05 2009 3q 46 35,804,205 2,148,857 2,200,397 6.1% 35,281 3 133,212 3 729,051 $21.66 2009 2q 46 35,670,993 2,048,291 2,102,466 5.9% (272,896) 0 0 6 862,263 $21.26 2009 1q 46 35,670,993 1,744,811 1,829,570 5.1% 20,143 6 143,933 5 842,257 $24.11 2008 4q 45 35,527,060 1,664,227 1,705,780 4.8% (79,961) 13 435,961 10 877,130 $24.68 2008 3q 44 35,091,099 1,188,305 1,189,858 3.4% (17,962) 0 0 21 999,894 $25.80 2008 2q 44 35,091,099 1,171,896 1,171,896 3.3% (525,830) 0 0 16 913,750 $26.93 2008 1q 44 35,091,099 646,066 646,066 1.8% 48,706 5 66,613 16 913,750 $23.49 2007 4q 43 35,024,486 628,159 628,159 1.8% 38,627 0 0 20 884,227 $24.16 2007 3q 43 35,024,486 666,786 666,786 1.9% (21,232) 0 0 16 309,454 $23.85 2007 2q 43 35,024,486 642,173 645,554 1.8% (20,673) 0 0 14 244,179 $23.29
Source: CoStar Property®
Power Center Market Statistics First Quarter 2011
Net Quoted
Period # Ctrs Total GLA Direct SF Total SF Vac % Absorption # Blds Total GLA # Blds Total GLA Rates
2011 1q 31 11,647,342 742,013 749,127 6.4% 118,055 1 3,960 0 0 $21.27 2010 4q 31 11,643,382 856,108 863,222 7.4% (73,511) 0 0 1 3,960 $22.09 2010 3q 31 11,643,382 782,597 789,711 6.8% 37,961 0 0 1 3,960 $22.84 2010 2q 31 11,643,382 819,158 827,672 7.1% 45,671 0 0 0 0 $21.20 2010 1q 31 11,643,382 853,029 873,343 7.5% 4,335 0 0 0 0 $22.00 2009 4q 31 11,643,382 855,808 877,678 7.5% 66,936 0 0 0 0 $21.96 2009 3q 31 11,643,382 906,544 944,614 8.1% 461,418 2 504,300 0 0 $23.55 2009 2q 30 11,139,082 829,364 901,732 8.1% (68,162) 0 0 2 504,300 $22.27 2009 1q 30 11,139,082 730,609 833,570 7.5% (255,576) 0 0 2 504,300 $22.47 2008 4q 30 11,139,082 476,428 577,994 5.2% 55,125 2 248,822 2 504,300 $23.87 2008 3q 30 10,890,260 359,118 384,297 3.5% (73,033) 0 0 4 753,122 $23.33 2008 2q 30 10,890,260 286,085 311,264 2.9% 86,603 0 0 3 428,822 $24.70 2008 1q 30 10,890,260 335,889 397,867 3.7% 369,706 12 321,634 3 428,822 $25.47 2007 4q 29 10,568,626 383,961 445,939 4.2% 144,891 3 193,682 14 671,841 $24.49 2007 3q 29 10,374,944 310,092 397,148 3.8% (129,309) 0 0 16 695,316 $24.28 2007 2q 29 10,374,944 220,696 267,839 2.6% (35,643) 1 28,000 12 497,276 $19.34
Source: CoStar Property®
UC Inventory
Existing Inventory Vacancy Deliveries UC Inventory
Existing Inventory Vacancy Deliveries UC Inventory
Existing Inventory Vacancy Deliveries

22 THE COSTAR RETAIL REPORT ©2011 COSTAR GROUP, INC.
SOUTH FLORIDA – FIRST QUARTER 2011
South Florida Retail MarketFIRST QUARTER 2011 – SOUTH FLORIDA
South Florida Retail Market
©2011 COSTAR GROUP, INC. THE COSTAR RETAIL REPORT 23
FIGURES AT A GLANCE
Shopping Center Market Statistics First Quarter 2011
Net Quoted
Period # Ctrs Total GLA Direct SF Total SF Vac % Absorption # Blds Total GLA # Blds Total GLA Rates
2011 1q 3,029 128,416,982 11,768,133 12,004,045 9.3% 178,074 0 0 1 52,780 $18.47 2010 4q 3,029 128,416,982 11,945,541 12,182,119 9.5% (99,247) 1 7,100 1 52,780 $18.69 2010 3q 3,029 128,409,882 11,827,568 12,075,772 9.4% 221,578 2 29,620 2 59,880 $19.01 2010 2q 3,029 128,380,262 12,014,738 12,267,730 9.6% 366,733 0 0 3 36,720 $19.20 2010 1q 3,029 128,380,262 12,386,987 12,634,463 9.8% 163,722 4 98,341 3 36,720 $19.32 2009 4q 3,026 128,281,921 12,301,580 12,699,844 9.9% (11,590) 6 207,461 4 98,341 $20.11 2009 3q 3,024 128,074,460 12,102,975 12,480,793 9.7% (449,877) 6 214,771 9 304,708 $20.66 2009 2q 3,022 127,859,689 11,395,386 11,816,145 9.2% (1,062,378) 5 88,412 15 519,479 $21.22 2009 1q 3,019 127,771,277 10,273,241 10,665,355 8.3% (681,143) 12 386,529 15 413,879 $21.62 2008 4q 3,013 127,384,748 9,248,966 9,597,683 7.5% (226,367) 19 755,818 23 665,073 $21.69 2008 3q 3,007 126,628,930 8,458,772 8,615,498 6.8% 466,510 36 1,258,594 39 1,392,298 $21.83 2008 2q 2,995 125,370,336 7,667,330 7,823,414 6.2% 441,842 18 863,642 60 1,890,093 $21.71 2008 1q 2,990 124,506,694 7,293,268 7,401,614 5.9% 158,721 36 1,157,072 70 2,561,077 $21.99 2007 4q 2,977 123,349,622 6,351,267 6,403,263 5.2% 996,394 21 951,762 70 3,006,599 $21.37 2007 3q 2,970 122,397,860 6,266,380 6,447,895 5.3% 880,952 19 976,138 77 3,437,195 $21.23 2007 2q 2,959 121,421,722 6,143,612 6,352,709 5.2% (554,012) 11 138,303 73 3,947,708 $21.01
Source: CoStar Property®
Specialty Center Market Statistics First Quarter 2011
Net Quoted
Period # Ctrs Total GLA Direct SF Total SF Vac % Absorption # Blds Total GLA # Blds Total GLA Rates
2011 1q 11 1,348,226 185,565 185,565 13.8% (452) 0 0 0 0 $27.68 2010 4q 11 1,348,226 185,113 185,113 13.7% (50,793) 0 0 0 0 $27.92 2010 3q 11 1,348,226 134,320 134,320 10.0% 5,225 0 0 0 0 $27.49 2010 2q 11 1,348,226 139,545 139,545 10.4% 3,817 0 0 0 0 $27.57 2010 1q 11 1,348,226 143,362 143,362 10.6% 14,650 0 0 0 0 $23.51 2009 4q 11 1,348,226 158,012 158,012 11.7% 20,036 0 0 0 0 $22.90 2009 3q 11 1,348,226 178,048 178,048 13.2% (2,000) 0 0 0 0 $20.54 2009 2q 11 1,348,226 176,048 176,048 13.1% 15,427 0 0 0 0 $21.00 2009 1q 11 1,348,226 191,475 191,475 14.2% (12,693) 0 0 0 0 $22.89 2008 4q 11 1,348,226 178,782 178,782 13.3% (38,584) 0 0 0 0 $24.99 2008 3q 11 1,348,226 140,198 140,198 10.4% (8,927) 0 0 0 0 $23.39 2008 2q 11 1,348,226 131,271 131,271 9.7% 5,644 0 0 0 0 $22.27 2008 1q 11 1,348,226 136,915 136,915 10.2% 40,669 0 0 0 0 $24.14 2007 4q 11 1,348,226 177,584 177,584 13.2% 900 0 0 0 0 $10.00 2007 3q 11 1,348,226 178,484 178,484 13.2% (33,162) 0 0 0 0 $10.00 2007 2q 11 1,348,226 145,322 145,322 10.8% 65,820 1 84,836 0 0 $10.00
Source: CoStar Property®
Total Retail Market Statistics First Quarter 2011
Net Quoted
Period # Blds Total GLA Direct SF Total SF Vac % Absorption # Blds Total GLA # Blds Total GLA Rates
2011 1q 21,079 311,425,755 20,261,438 20,695,676 6.6% 519,304 11 201,170 10 187,137 $19.41 2010 4q 21,070 311,232,232 20,621,353 21,021,457 6.8% (161,799) 6 49,947 16 292,662 $19.67 2010 3q 21,064 311,182,285 20,391,593 20,809,711 6.7% 370,734 8 105,201 22 342,609 $20.24 2010 2q 21,060 311,170,253 20,744,207 21,168,413 6.8% 488,999 4 41,129 17 277,409 $20.41 2010 1q 21,056 311,129,124 21,197,056 21,616,283 6.9% 151,796 15 671,801 16 269,317 $20.48 2009 4q 21,042 310,463,774 20,509,188 21,102,729 6.8% 215,113 14 601,695 23 746,780 $21.10 2009 3q 21,029 309,864,879 20,134,860 20,718,947 6.7% (207,211) 21 1,015,287 31 1,282,140 $21.61 2009 2q 21,008 308,849,592 18,778,410 19,496,449 6.3% (1,320,063) 13 167,537 43 2,252,068 $21.80 2009 1q 20,996 308,683,376 17,232,615 18,010,170 5.8% (628,397) 32 1,054,404 45 2,144,010 $22.38 2008 4q 20,964 307,628,972 15,682,234 16,327,369 5.3% (366,130) 53 1,844,420 62 2,763,160 $22.41 2008 3q 20,911 305,784,552 13,862,061 14,116,819 4.6% 248,380 54 1,579,805 105 4,217,589 $22.51 2008 2q 20,859 304,242,154 12,599,352 12,822,801 4.2% 390,351 35 1,190,485 132 4,527,306 $22.77 2008 1q 20,825 303,056,569 11,819,012 12,027,567 4.0% 1,362,152 82 2,443,967 138 4,803,019 $22.76 2007 4q 20,745 300,638,028 10,842,071 10,971,178 3.6% 1,322,105 40 1,628,324 157 5,924,143 $22.45 2007 3q 20,708 299,088,447 10,459,998 10,743,702 3.6% 1,472,837 29 1,358,292 169 6,154,392 $22.26 2007 2q 20,679 297,730,155 10,578,518 10,858,247 3.6% 172,346 35 491,099 138 6,347,241 $21.83
Source: CoStar Property®
UC Inventory
Existing Inventory Vacancy Deliveries UC Inventory
Existing Inventory Vacancy Deliveries UC Inventory
Existing Inventory Vacancy Deliveries
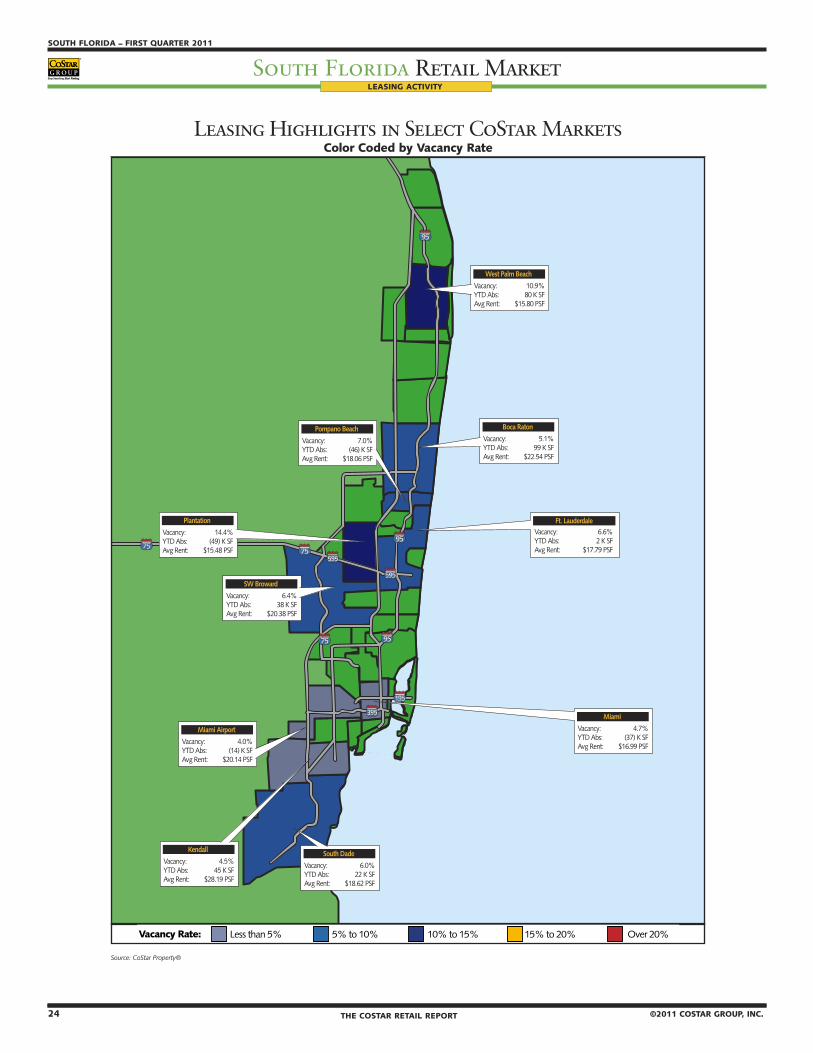
24 THE COSTAR RETAIL REPORT ©2011 COSTAR GROUP, INC.
SOUTH FLORIDA – FIRST QUARTER 2011
South Florida Retail MarketFIRST QUARTER 2011 – SOUTH FLORIDA
South Florida Retail Market
©2011 COSTAR GROUP, INC. THE COSTAR RETAIL REPORT 25
LEASING ACTIVITY
Leasing Highlights in Select CoStar MarketsColor Coded by Vacancy Rate
��
���
�����
��
��
��
��
���
���
���� ���� �����
�������� ������������ �� � ����� ����� ������ ���
���� �����
�������� ����������� �� � ����� ����� ������ ���
�����
�������� ����������� ���� � ����� ����� ������ ���
����� �������
�������� ����������� ���� � ����� ����� ������ ���
�� �������
�������� ����������� �� � ����� ����� ������ ���
����� ����
�������� ����������� �� � ����� ����� ������ ���
�������
�������� ����������� �� � ����� ����� ������ ���
����������
�������� ������������ ���� � ����� ����� ������ ���
������� �����
�������� ����������� ���� � ����� ����� ������ ���
��� ����������
�������� ����������� � � ����� ����� ������ ���
������� ����� ���� ������ �� ������ �� ����� �� ������� ���� ��
Source: CoStar Property®
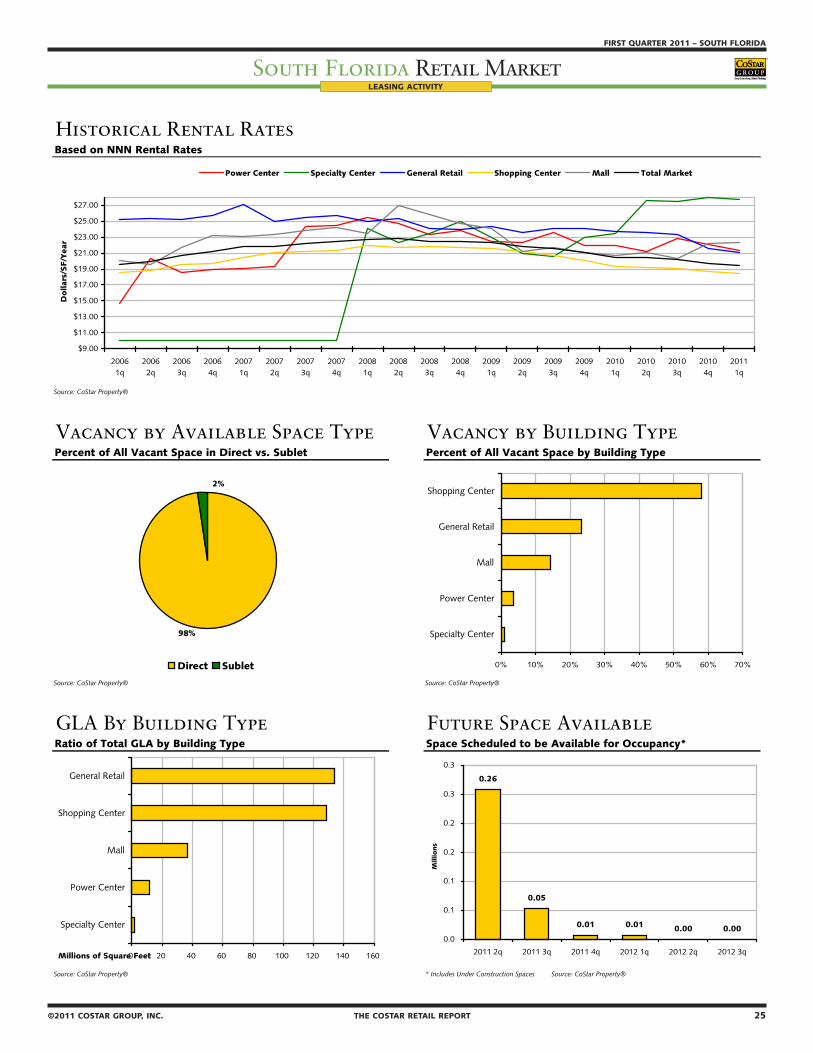
24 THE COSTAR RETAIL REPORT ©2011 COSTAR GROUP, INC.
SOUTH FLORIDA – FIRST QUARTER 2011
South Florida Retail MarketFIRST QUARTER 2011 – SOUTH FLORIDA
South Florida Retail Market
©2011 COSTAR GROUP, INC. THE COSTAR RETAIL REPORT 25
Historical Rental RatesBased on NNN Rental Rates
Source: CoStar Property®
Vacancy by Available Space Type Vacancy by Building TypePercent of All Vacant Space in Direct vs. Sublet Percent of All Vacant Space by Building Type
Source: CoStar Property® Source: CoStar Property®
GLA By Building Type Future Space AvailableRatio of Total GLA by Building Type Space Scheduled to be Available for Occupancy*
Source: CoStar Property® * Includes Under Construction Spaces Source: CoStar Property®
$9.00
$11.00
$13.00
$15.00
$17.00
$19.00
$21.00
$23.00
$25.00
$27.00
20061q
20062q
20063q
20064q
20071q
20072q
20073q
20074q
20081q
20082q
20083q
20084q
20091q
20092q
20093q
20094q
20101q
20102q
20103q
20104q
20111q
Dollar
s/SF/Y
ear
Power Center Specialty Center General Retail Shopping Center Mall Total Market
0 20 40 60 80 100 120 140 160
Specialty Center
Power Center
Mall
Shopping Center
General Retail
Millions of Square Feet
2%
98%
Direct Sublet 0% 10% 20% 30% 40% 50% 60% 70%
Specialty Center
Power Center
Mall
General Retail
Shopping Center
0.26
0.05
0.01 0.01 0.00 0.000.0
0.1
0.1
0.2
0.2
0.3
0.3
2011 2q 2011 3q 2011 4q 2012 1q 2012 2q 2012 3q
Mill
ions
LEASING ACTIVITY

26 THE COSTAR RETAIL REPORT ©2011 COSTAR GROUP, INC.
SOUTH FLORIDA – FIRST QUARTER 2011
South Florida Retail MarketFIRST QUARTER 2011 – SOUTH FLORIDA
South Florida Retail Market
©2011 COSTAR GROUP, INC. THE COSTAR RETAIL REPORT 27
LEASING ACTIVITY
Source: CoStar Property®
* Renewal
Building Submarket SF Qtr Tenant Name Tenant Rep Company Landlord Rep Company
1 Pine Island Plaza Plantation 86,156 1st Burlington Coat Factory The Rotella Group, Inc. Equity One, Inc.
2 Westfork Plaza Southwest Broward 51,282 1st Winn Dixie N/A Terranova Corporation
3 Palm Springs Mile Medley/Hialeah 32,500 1st N/A N/A Philips International Holding Corp.
4 Biscayne Plaza Shopping Center Biscayne Corridor 24,016 1st Sabor Tropical N/A Terranova Corporation
5 Biscayne Plaza Shopping Center Biscayne Corridor 22,220 1st DD’s Discount N/A Terranova Corporation
6 4354 Okeechobee Blvd West Palm Beach 18,000 1st N/A N/A Atlantic Retail Properties
7 Homestead Pavilion South Dade 16,000 1st Planet Fitness N/A Developers Diversified Realty
8 13130 Biscayne Blvd Northeast Dade 14,000 1st Navarro Discount Pharmacy Direct Deal N/A
9 2785 N Andrews Ave Fort Lauderdale 13,336 1st N/A N/A Atlantic Commercial Group
10 1011 5th St Miami Beach 12,500 1st N/A N/A Koniver Stern Group
11 The Plaza At Delray Delray Beach 11,180 1st Anna’s Linens N/A Cohen Commercial Realty, Inc.
12 Laroc Shopping Center Miami Airport 11,113 1st N/A N/A Horizon Properties
13 Laroc Shopping Center Miami Airport 10,124 1st N/A N/A Horizon Properties
14 Biscayne Plaza Shopping Center Biscayne Corridor 10,000 1st Konbit For Haiti, Inc N/A Terranova Corporation
15 Pasadena Plaza Hollywood 10,000 1st Kiddie City Early Education Center Direct Deal Neal Realty & Investments, Inc.,
16 Bal Harbor Square Fort Lauderdale 9,450 1st N/A N/A Retail Property Group, Inc.
17 Miami Gardens Miami Lakes 9,000 1st Anna’s Linens Terranova Corporation N/A
18 Downtown Dadeland - Building E Kendall 8,809 1st Play Aulait Jones Lang LaSalle Centre-Line Real Estate
19 Bird Galloway Center West Miami 8,421 1st Locatel Health & Wellness Stone Miller CJM Real Estate & Mgmt. Group, Inc
20 Shops at Boca Center Boca Raton West 8,405 1st Brio Tuscan Grille Koniver Stern Group CB Richard Ellis
21 12655 S Dixie Hwy Kendall 7,997 1st Back-To-Back Woman’s Clothing Direct Deal American Commercial Realty Corp.
22 Downtown At The Gardens North Palm Beach 7,963 1st N/A N/A Berman Enterprises
23 8221 W Flagler St Miami Airport 7,900 1st Anna’s Linens Terranova Corporation BEHAR Real Estate Group
24 Westfork Plaza Southwest Broward 7,636 1st N/A N/A Terranova Corporation
25 Miramar Square Bldg 1 Southwest Broward 7,037 1st The Beauty Mall N/A Woolbright Development, Inc.
26 3852 SW 137th Ave Miami Airport 7,000 1st BV Therapro Direct Deal Stefano Group Inc, The
27 101 Miracle Mile Coral Gables 7,000 1st Miller’s Ale House N/A Koniver Stern Group
28 2465 State Road 7 Royal Palm Bch/Wellington 7,000 1st N/A N/A Newman Commercial Properties, Inc
29 2515 N State Road 7 NW Broward/Coral Springs 7,000 1st N/A N/A Wiz Realty, Inc.
30 Shoppes At Jupiter Jupiter 6,352 1st Holly Costumes & Party N/A Menin Realty Services, Inc.
31 Downtown At The Gardens North Palm Beach 6,254 1st N/A N/A Berman Enterprises
32 1600 NE 163rd St Northeast Dade 6,200 1st Humana Health Insurance N/A B H International Realty, LLC.
33 Sunbelts Rentals Inc. Northeast Dade 6,165 1st Amazing Wheels Direct Deal Game Properties, Inc.
34 Southland Mall South Dade 6,110 1st N/A N/A Gumberg Asset Management
35 The Crossroads Palm Bch Cty Outlying 6,020 1st Mattress Comfort Direct Deal Ramco-Gershenson Properties Trust
36 743 Washington Ave Miami Beach 6,000 1st N/A Direct Deal SRC Properties, LLC
37 9040 Kimberly Blvd* Boca Raton West 6,000 1st Chabad Lubavitch Community Center N/A N/A
38 710 N University Hollywood 6,000 1st N/A N/A Weingarten Realty Investors
39 Greenery Mall Kendall 6,000 1st N/A N/A Green Companies
40 8320 Biscayne Blvd Biscayne Corridor 5,500 1st N/A N/A Don Bailey Carpets, Inc.
Select Top Retail Leases Based on Leased Square Footage For Deals Signed in 2011

26 THE COSTAR RETAIL REPORT ©2011 COSTAR GROUP, INC.
SOUTH FLORIDA – FIRST QUARTER 2011
South Florida Retail MarketFIRST QUARTER 2011 – SOUTH FLORIDA
South Florida Retail Market
©2011 COSTAR GROUP, INC. THE COSTAR RETAIL REPORT 27
SALES ACTIVITY
The Optimist Sales Index Average of Two Highest Price/SF's and Two Lowest Cap Rates
Source: CoStar COMPS®
Sales Volume & Price Sales Analysis by Building SizeBased on Retail Building Sales of 15,000 SF and Larger Based on Retail Building Sales From Jan. 2010 - Dec. 2010
Bldg Size # RBA $ Volume Price/SF Cap Rate
< 25,000 SF 263 1,837,697 487,920,684$ 265.51$ 7.95%
25K-99K SF 31 1,500,918 232,838,097$ 155.13$ 7.72%
100K-249K SF 12 1,639,524 226,744,743$ 138.30$ 6.99%
>250K SF 3 1,153,525 63,795,000$ 55.30$ 13.89%
Source: CoStar COMPS® Source: CoStar COMPS®
U.S. Price/SF Comparison U.S. Cap Rate ComparisonBased on Retail Building Sales of 15,000 SF and Larger Based on Retail Building Sales of 15,000 SF and Larger
Source: CoStar COMPS® Source: CoStar COMPS®
$30
$80
$130
$180
$230
$280
$330
20071q
20073q
20081q
20083q
20091q
20093q
20101q
20103q
Dollar
s per
SF
South Florida US
$0
$100
$200
$300
$400
$500
$600
$700
2007 1q 2007 3q 2008 1q 2008 3q 2009 1q 2009 3q 2010 1q 2010 3q
Millio
ns
of
Sal
es V
olu
me
Do
llar
s
$0
$50
$100
$150
$200
$250
$300
$350
Price
/SF
Sales Volume Price/SF
0.0%
1.0%
2.0%
3.0%
4.0%
5.0%
6.0%
7.0%
8.0%
9.0%
2008 1q 2008 2q 2008 3q 2008 4q 2009 1q 2009 2q 2009 3q 2009 4q 2010 1q 2010 2q 2010 3q 2010 4q
Cap
Rat
e P
erc
enta
ge
$0
$100
$200
$300
$400
$500
$600
$700
$800
Dollars/S
F
Cap Rate Price/SF
3.0%
4.0%
5.0%
6.0%
7.0%
8.0%
9.0%
10.0%
20071q
20073q
20081q
20083q
20091q
20093q
20101q
20103q
Cap
Rat
e P
erc
enta
ge
South Florida US

28 THE COSTAR RETAIL REPORT ©2011 COSTAR GROUP, INC.
SOUTH FLORIDA – FIRST QUARTER 2011
South Florida Retail MarketFIRST QUARTER 2011 – SOUTH FLORIDA
South Florida Retail Market
©2011 COSTAR GROUP, INC. THE COSTAR RETAIL REPORT 29
SALES ACTIVITY
���������������� ���������������������������������������������������
���������������������
���������������������������������������������������������
������������������������������������������������������������������������������������
��������������������
�����������
���������������������������������������������������������
����������������������������������������������������������������������������������������
����������������
������������������
���������������������������������������������������������
���������������������������������������������������������������������������������������
����������������������
�����
���������������������������������������������������������
����������������������������������������������������������������������������������������
�������������������
�������������
���������������������������������������������������������
���������������������������������������������������������������������������������������
�������������������
���������������
���������������������������������������������������������
�������������������������������������������������������������������������������������������
�������������������
��������������
���������������������������������������������������������
�������������������������������������������������������������������������������
���������������������������
�����
���������������������������������������������������������
�����������������������������������������������������������������������������������������������
��������������������
�������������
���������������������������������������������������������
���������������������������������������������������������������������������������������������������
�����������������������������
�����

28 THE COSTAR RETAIL REPORT ©2011 COSTAR GROUP, INC.
SOUTH FLORIDA – FIRST QUARTER 2011
South Florida Retail MarketFIRST QUARTER 2011 – SOUTH FLORIDA
South Florida Retail Market
©2011 COSTAR GROUP, INC. THE COSTAR RETAIL REPORT 29
�������������������������� �����������������������������������������������������
�����������������������������������������������������������������������������
����������������������������������������������������������
��������������������������������������������������������������������������
�������������������������������������������������������������������������������
������������������������������������������������������������������
����������������������������������������������������������������������������������������������������������������������������
������������������������������
�����������������������������������������������������������������������������
������������������������������������������������������
����������������������������������������������������������������������
�������������������������������������������������������������������������
������������������������������������������������������������������
�������������������������������������������������������������������
������������������������������
�����������������������������������������������������������������������������
������������������������������������������������
�����������������������������������������������������������������
�������������������������������������������������������������������������
������������������������������������������������������������������
����������������������������������������������������������
������������������������������
�����������������������������������������������������������������������������
������������������������������������������������
����������������������������������������������������������������������������
����������������������������������������������������������������������������
������������������������������������������������������������������
����������������������������������������������������������������������
������������������������������
�����������������������������������������������������������������������������
������������������������������������������������������
������������������������������������������������������������������������������
�������������������������������������������������������������������������
������������������������������������������������������������������
��������������������������������������������������������������������������
������������������������������
�����������������������������������������������������������������������������
�������������������������������������������������������������
������������������������������������������������������������������������
����������������������������������������������������������������������������������������������������
������������������������������������������������������������������
��������������������������������������������������������������������������������������������
������������������������������
���������������������
SALES ACTIVITY
Select Land Sales Based on Commercially Zoned Land Sales Occurring From Jan. 2010 - March 2011
1420 SW 1st Ct, Miami 3629 S Federal Hwy, Delray Beach 1776 Biscayne Blvd, Miami
Sale Price: $14,775,000 Sale Price: $10,881,000 Sale Price: $7,450,000Acres: 3.02 Acres: 9.32 Acres: 1.89Price/SF: $112.31 Price/SF: $26.80 Price/SF: $90.35Closing Date: 03/02/2011 Closing Date: 08/09/2010 Closing Date: 09/28/2010Zoning: SD-7 Zoning: C3 Zoning: T6-24-O, formerly C-1Intended Use: Hospitality Intended Use: Retail Intended Use: CommercialBuyer: South Miami Avenue LLC Buyer: Wal-Mart Stores, Inc. Buyer: Stiles Capital GroupSeller: BVT Equity Holdings, Inc. Seller: Roschman Enterprises Seller: The Hanover Company
2765 10th Ave N, Palm Springs 3601 N Miami Ave, Miami 2200 NE 7th Ave, Dania
Sale Price: $7,347,200 Sale Price: $5,320,000 Sale Price: $4,600,000Acres: 17.44 Acres: 0.99 Acres: 22.39Price/SF: $9.67 Price/SF: $123.84 Price/SF: $4.72Closing Date: 01/31/2011 Closing Date: 11/18/2010 Closing Date: 01/15/2010Zoning: RH Zoning: SD-8 Zoning: PEDD,DaniaIntended Use: Strip Center Intended Use: Storefrnt Retail/Residntl Intended Use: Parking LotBuyer: Wal-Mart Stores, Inc. Buyer: Fifteen Group Buyer: BV FLL LLCSeller: Cornerstone Group Seller: Forkosh Development Group, Llc Seller: Park N Fly Inc
Source: CoStar COMPS®
Source: CoStar COMPS®

30 THE COSTAR RETAIL REPORT ©2011 COSTAR GROUP, INC.
SOUTH FLORIDA – FIRST QUARTER 2011
South Florida Retail MarketMARKET HIGHLIGHTS – CLASS “A, B & C”
©2011 COSTAR GROUP, INC. THE COSTAR RETAIL REPORT 31
FIRST QUARTER 2011 – SOUTH FLORIDA
South Florida Retail MarketMARKET HIGHLIGHTS – CLASS “A, B & C”
A V E N T U R A M A R K E T
Deliveries, Absorption & Vacancy Historical Analysis, All Classes
Source: CoStar Property®
Vacant Space Quoted Rental RatesHistorical Analysis, All Classes Historical Analysis, All Classes
Source: CoStar Property® Source: CoStar Property®
Net QuotedPeriod # Bldgs Total RBA Vacant SF Vacancy % Absorption # Bldgs Total RBA # Bldgs Total RBA Rates2011 1q 121 6,094,948 105,508 1.7% 44,526 0 0 0 0 $30.68
2010 4q 121 6,094,948 150,034 2.5% 490 0 0 0 0 $32.22
2010 3q 121 6,094,948 150,524 2.5% 3,733 0 0 0 0 $26.50
2010 2q 121 6,094,948 154,257 2.5% 11,621 0 0 0 0 $27.58
2010 1q 121 6,094,948 165,878 2.7% (20,760) 0 0 0 0 $23.06
2009 4q 121 6,094,948 145,118 2.4% (11,893) 0 0 0 0 $20.35
2009 3q 121 6,094,948 133,225 2.2% (21,158) 0 0 0 0 $25.89
2009 2q 121 6,094,948 112,067 1.8% (16,105) 0 0 0 0 $25.53
2009 1q 121 6,094,948 95,962 1.6% (50,146) 0 0 0 0 $24.93
2008 4q 121 6,094,948 45,816 0.8% (6,692) 0 0 0 0 $33.35
2008 3q 121 6,094,948 39,124 0.6% (15,326) 0 0 0 0 $34.35
2008 2q 121 6,094,948 23,798 0.4% 24,590 0 0 0 0 $33.11
2008 1q 121 6,094,948 48,388 0.8% 7,073 0 0 0 0 $43.07
2007 4q 121 6,094,948 55,461 0.9% (5,079) 0 0 0 0 $43.85
2007 3q 121 6,094,948 50,382 0.8% (32,482) 0 0 0 0 $44.07
2007 2q 121 6,094,948 17,900 0.3% 2,004 0 0 0 0 $52.94
Source: CoStar Property®
UC InventoryDelivered InventoryExisting Inventory Vacancy
(0.060)
(0.040)
(0.020)
0.000
0.020
0.040
0.060
2008 1q 2008 2q 2008 3q 2008 4q 2009 1q 2009 2q 2009 3q 2009 4q 2010 1q 2010 2q 2010 3q 2010 4q 2011 1q
Millio
ns
SF
0.0%
0.5%
1.0%
1.5%
2.0%
2.5%
3.0%
Perce
nt V
acant
Delivered SF Absorption SF Vacancy
$0.00
$5.00
$10.00
$15.00
$20.00
$25.00
$30.00
$35.00
2010 1q 2010 2q 2010 3q 2010 4q 2011 1q
Dollar
s/SF/Y
ear
0.00
0.02
0.04
0.06
0.08
0.10
0.12
0.14
0.16
0.18
2010 1q 2010 2q 2010 3q 2010 4q 2011 1q
Millio
ns
SF
Direct SF Sublet SF
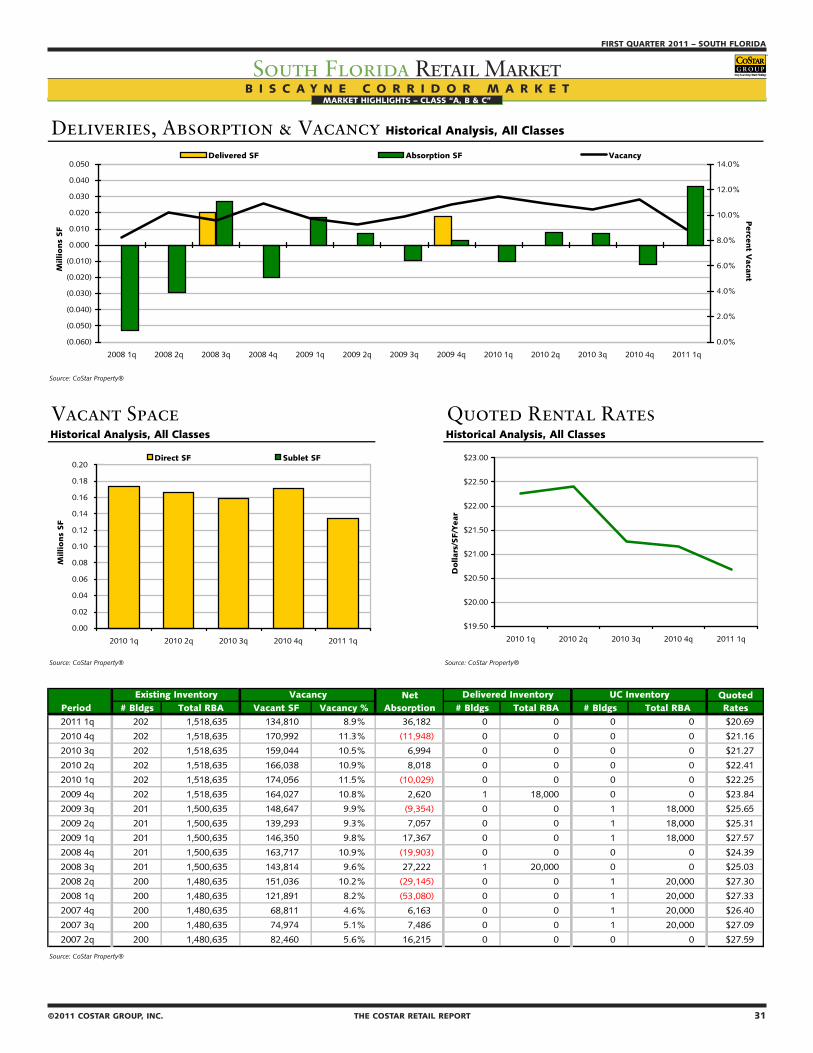
30 THE COSTAR RETAIL REPORT ©2011 COSTAR GROUP, INC.
SOUTH FLORIDA – FIRST QUARTER 2011
South Florida Retail MarketMARKET HIGHLIGHTS – CLASS “A, B & C”
©2011 COSTAR GROUP, INC. THE COSTAR RETAIL REPORT 31
FIRST QUARTER 2011 – SOUTH FLORIDA
South Florida Retail MarketMARKET HIGHLIGHTS – CLASS “A, B & C”
B I S C A Y N E C O R R I D O R M A R K E T
Deliveries, Absorption & Vacancy Historical Analysis, All Classes
Source: CoStar Property®
Vacant Space Quoted Rental RatesHistorical Analysis, All Classes Historical Analysis, All Classes
Source: CoStar Property® Source: CoStar Property®
Net QuotedPeriod # Bldgs Total RBA Vacant SF Vacancy % Absorption # Bldgs Total RBA # Bldgs Total RBA Rates2011 1q 202 1,518,635 134,810 8.9% 36,182 0 0 0 0 $20.69
2010 4q 202 1,518,635 170,992 11.3% (11,948) 0 0 0 0 $21.16
2010 3q 202 1,518,635 159,044 10.5% 6,994 0 0 0 0 $21.27
2010 2q 202 1,518,635 166,038 10.9% 8,018 0 0 0 0 $22.41
2010 1q 202 1,518,635 174,056 11.5% (10,029) 0 0 0 0 $22.25
2009 4q 202 1,518,635 164,027 10.8% 2,620 1 18,000 0 0 $23.84
2009 3q 201 1,500,635 148,647 9.9% (9,354) 0 0 1 18,000 $25.65
2009 2q 201 1,500,635 139,293 9.3% 7,057 0 0 1 18,000 $25.31
2009 1q 201 1,500,635 146,350 9.8% 17,367 0 0 1 18,000 $27.57
2008 4q 201 1,500,635 163,717 10.9% (19,903) 0 0 0 0 $24.39
2008 3q 201 1,500,635 143,814 9.6% 27,222 1 20,000 0 0 $25.03
2008 2q 200 1,480,635 151,036 10.2% (29,145) 0 0 1 20,000 $27.30
2008 1q 200 1,480,635 121,891 8.2% (53,080) 0 0 1 20,000 $27.33
2007 4q 200 1,480,635 68,811 4.6% 6,163 0 0 1 20,000 $26.40
2007 3q 200 1,480,635 74,974 5.1% 7,486 0 0 1 20,000 $27.09
2007 2q 200 1,480,635 82,460 5.6% 16,215 0 0 0 0 $27.59
Source: CoStar Property®
UC InventoryDelivered InventoryExisting Inventory Vacancy
(0.060)
(0.050)
(0.040)
(0.030)
(0.020)
(0.010)
0.000
0.010
0.020
0.030
0.040
0.050
2008 1q 2008 2q 2008 3q 2008 4q 2009 1q 2009 2q 2009 3q 2009 4q 2010 1q 2010 2q 2010 3q 2010 4q 2011 1q
Millio
ns
SF
0.0%
2.0%
4.0%
6.0%
8.0%
10.0%
12.0%
14.0%
Perce
nt V
acant
Delivered SF Absorption SF Vacancy
$19.50
$20.00
$20.50
$21.00
$21.50
$22.00
$22.50
$23.00
2010 1q 2010 2q 2010 3q 2010 4q 2011 1q
Dollar
s/SF/Y
ear
0.00
0.02
0.04
0.06
0.08
0.10
0.12
0.14
0.16
0.18
0.20
2010 1q 2010 2q 2010 3q 2010 4q 2011 1q
Millio
ns
SF
Direct SF Sublet SF

32 THE COSTAR RETAIL REPORT ©2011 COSTAR GROUP, INC.
SOUTH FLORIDA – FIRST QUARTER 2011
South Florida Retail MarketMARKET HIGHLIGHTS – CLASS “A, B & C”
©2011 COSTAR GROUP, INC. THE COSTAR RETAIL REPORT 33
FIRST QUARTER 2011 – SOUTH FLORIDA
South Florida Retail MarketMARKET HIGHLIGHTS – CLASS “A, B & C”
B O C A R A T O N M A R K E T
Deliveries, Absorption & Vacancy Historical Analysis, All Classes
Source: CoStar Property®
Vacant Space Quoted Rental RatesHistorical Analysis, All Classes Historical Analysis, All Classes
Source: CoStar Property® Source: CoStar Property®
Net QuotedPeriod # Bldgs Total RBA Vacant SF Vacancy % Absorption # Bldgs Total RBA # Bldgs Total RBA Rates2011 1q 484 12,190,667 616,629 5.1% 99,498 1 93,680 0 0 $22.54
2010 4q 483 12,096,987 622,447 5.1% 9,293 1 2,720 1 93,680 $22.86
2010 3q 482 12,094,267 629,020 5.2% 7,515 0 0 2 96,400 $23.79
2010 2q 482 12,094,267 636,535 5.3% (35,862) 0 0 2 96,400 $24.36
2010 1q 482 12,094,267 600,673 5.0% (10,234) 0 0 1 93,680 $24.63
2009 4q 482 12,094,267 590,439 4.9% 8,457 1 13,650 0 0 $25.24
2009 3q 481 12,080,617 585,246 4.8% (5,196) 0 0 1 13,650 $25.01
2009 2q 481 12,080,617 580,050 4.8% (23,481) 1 8,464 1 13,650 $24.23
2009 1q 480 12,072,153 548,105 4.5% (98,792) 2 17,635 1 8,464 $25.32
2008 4q 478 12,054,518 431,678 3.6% 71,303 1 10,512 2 17,635 $23.56
2008 3q 477 12,044,006 492,469 4.1% (7,249) 1 10,512 3 28,147 $23.63
2008 2q 476 12,033,494 474,708 3.9% 87,323 2 49,000 3 35,446 $24.30
2008 1q 474 11,984,494 513,031 4.3% (46,109) 2 13,400 4 73,934 $23.52
2007 4q 472 11,971,094 453,522 3.8% (28,816) 0 0 5 76,822 $23.18
2007 3q 472 11,971,094 424,706 3.5% 27,665 0 0 2 13,400 $22.49
2007 2q 472 11,971,094 452,371 3.8% (63,447) 1 19,500 0 0 $24.82
Source: CoStar Property®
UC InventoryDelivered InventoryExisting Inventory Vacancy
(0.150)
(0.100)
(0.050)
0.000
0.050
0.100
0.150
2008 1q 2008 2q 2008 3q 2008 4q 2009 1q 2009 2q 2009 3q 2009 4q 2010 1q 2010 2q 2010 3q 2010 4q 2011 1q
Millio
ns
SF
0.0%
1.0%
2.0%
3.0%
4.0%
5.0%
6.0%
Perce
nt V
acant
Delivered SF Absorption SF Vacancy
$21.00
$21.50
$22.00
$22.50
$23.00
$23.50
$24.00
$24.50
$25.00
2010 1q 2010 2q 2010 3q 2010 4q 2011 1q
Dollar
s/SF/Y
ear
0.58
0.59
0.60
0.61
0.62
0.63
0.64
2010 1q 2010 2q 2010 3q 2010 4q 2011 1q
Millio
ns
SF
Direct SF Sublet SF
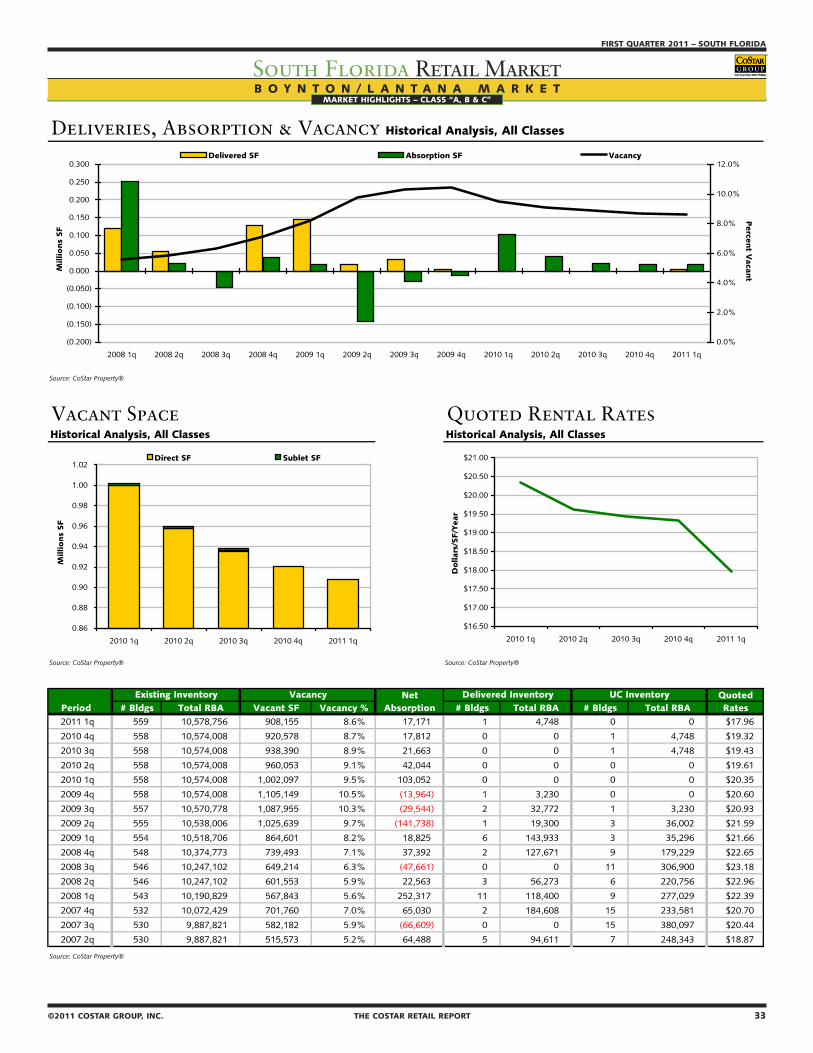
32 THE COSTAR RETAIL REPORT ©2011 COSTAR GROUP, INC.
SOUTH FLORIDA – FIRST QUARTER 2011
South Florida Retail MarketMARKET HIGHLIGHTS – CLASS “A, B & C”
©2011 COSTAR GROUP, INC. THE COSTAR RETAIL REPORT 33
FIRST QUARTER 2011 – SOUTH FLORIDA
South Florida Retail MarketMARKET HIGHLIGHTS – CLASS “A, B & C”
B O Y N T O N / L A N T A N A M A R K E TMARKET HIGHLIGHTS – CLASS “A, B & C”
Deliveries, Absorption & Vacancy Historical Analysis, All Classes
Source: CoStar Property®
Vacant Space Quoted Rental RatesHistorical Analysis, All Classes Historical Analysis, All Classes
Source: CoStar Property® Source: CoStar Property®
Net QuotedPeriod # Bldgs Total RBA Vacant SF Vacancy % Absorption # Bldgs Total RBA # Bldgs Total RBA Rates2011 1q 559 10,578,756 908,155 8.6% 17,171 1 4,748 0 0 $17.96
2010 4q 558 10,574,008 920,578 8.7% 17,812 0 0 1 4,748 $19.32
2010 3q 558 10,574,008 938,390 8.9% 21,663 0 0 1 4,748 $19.43
2010 2q 558 10,574,008 960,053 9.1% 42,044 0 0 0 0 $19.61
2010 1q 558 10,574,008 1,002,097 9.5% 103,052 0 0 0 0 $20.35
2009 4q 558 10,574,008 1,105,149 10.5% (13,964) 1 3,230 0 0 $20.60
2009 3q 557 10,570,778 1,087,955 10.3% (29,544) 2 32,772 1 3,230 $20.93
2009 2q 555 10,538,006 1,025,639 9.7% (141,738) 1 19,300 3 36,002 $21.59
2009 1q 554 10,518,706 864,601 8.2% 18,825 6 143,933 3 35,296 $21.66
2008 4q 548 10,374,773 739,493 7.1% 37,392 2 127,671 9 179,229 $22.65
2008 3q 546 10,247,102 649,214 6.3% (47,661) 0 0 11 306,900 $23.18
2008 2q 546 10,247,102 601,553 5.9% 22,563 3 56,273 6 220,756 $22.96
2008 1q 543 10,190,829 567,843 5.6% 252,317 11 118,400 9 277,029 $22.39
2007 4q 532 10,072,429 701,760 7.0% 65,030 2 184,608 15 233,581 $20.70
2007 3q 530 9,887,821 582,182 5.9% (66,609) 0 0 15 380,097 $20.44
2007 2q 530 9,887,821 515,573 5.2% 64,488 5 94,611 7 248,343 $18.87
Source: CoStar Property®
UC InventoryDelivered InventoryExisting Inventory Vacancy
(0.200)
(0.150)
(0.100)
(0.050)
0.000
0.050
0.100
0.150
0.200
0.250
0.300
2008 1q 2008 2q 2008 3q 2008 4q 2009 1q 2009 2q 2009 3q 2009 4q 2010 1q 2010 2q 2010 3q 2010 4q 2011 1q
Millio
ns
SF
0.0%
2.0%
4.0%
6.0%
8.0%
10.0%
12.0%
Perce
nt V
acant
Delivered SF Absorption SF Vacancy
$16.50
$17.00
$17.50
$18.00
$18.50
$19.00
$19.50
$20.00
$20.50
$21.00
2010 1q 2010 2q 2010 3q 2010 4q 2011 1q
Dollar
s/SF/Y
ear
0.86
0.88
0.90
0.92
0.94
0.96
0.98
1.00
1.02
2010 1q 2010 2q 2010 3q 2010 4q 2011 1q
Millio
ns
SF
Direct SF Sublet SF
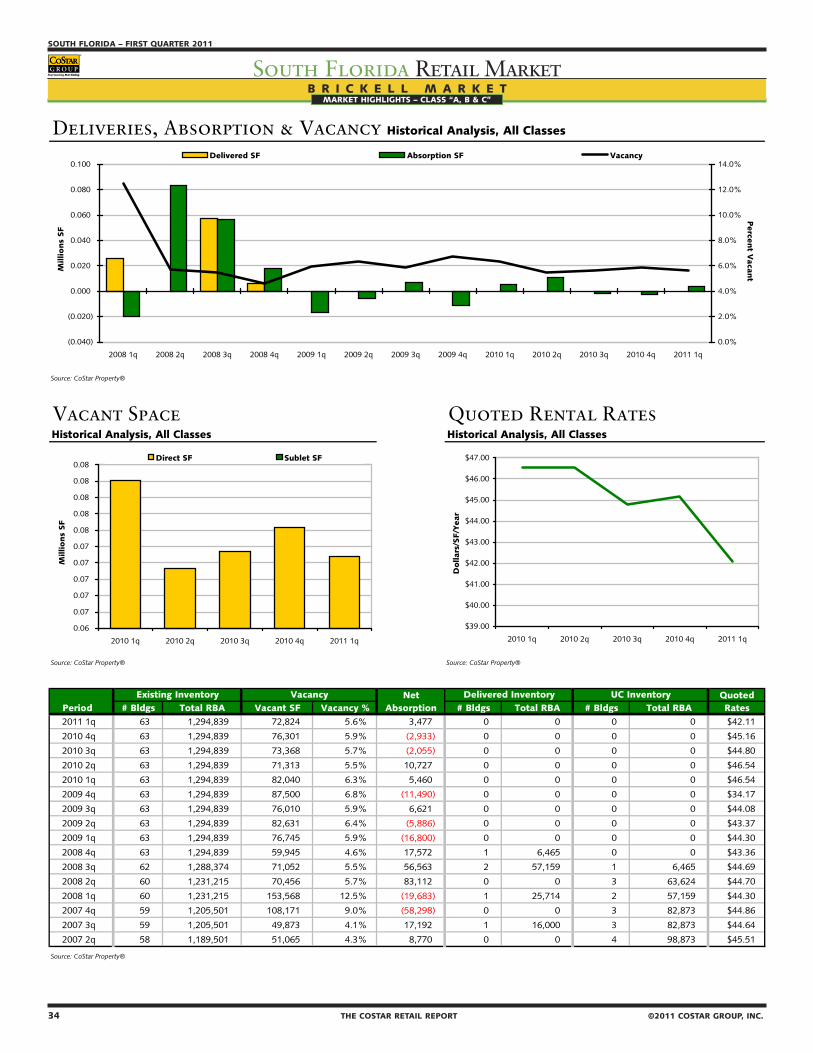
34 THE COSTAR RETAIL REPORT ©2011 COSTAR GROUP, INC.
SOUTH FLORIDA – FIRST QUARTER 2011
South Florida Retail MarketMARKET HIGHLIGHTS – CLASS “A, B & C”
©2011 COSTAR GROUP, INC. THE COSTAR RETAIL REPORT 35
FIRST QUARTER 2011 – SOUTH FLORIDA
South Florida Retail MarketMARKET HIGHLIGHTS – CLASS “A, B & C”
B R I C K E L L M A R K E TMARKET HIGHLIGHTS – CLASS “A, B & C”
Deliveries, Absorption & Vacancy Historical Analysis, All Classes
Source: CoStar Property®
Vacant Space Quoted Rental RatesHistorical Analysis, All Classes Historical Analysis, All Classes
Source: CoStar Property® Source: CoStar Property®
Net QuotedPeriod # Bldgs Total RBA Vacant SF Vacancy % Absorption # Bldgs Total RBA # Bldgs Total RBA Rates2011 1q 63 1,294,839 72,824 5.6% 3,477 0 0 0 0 $42.11
2010 4q 63 1,294,839 76,301 5.9% (2,933) 0 0 0 0 $45.16
2010 3q 63 1,294,839 73,368 5.7% (2,055) 0 0 0 0 $44.80
2010 2q 63 1,294,839 71,313 5.5% 10,727 0 0 0 0 $46.54
2010 1q 63 1,294,839 82,040 6.3% 5,460 0 0 0 0 $46.54
2009 4q 63 1,294,839 87,500 6.8% (11,490) 0 0 0 0 $34.17
2009 3q 63 1,294,839 76,010 5.9% 6,621 0 0 0 0 $44.08
2009 2q 63 1,294,839 82,631 6.4% (5,886) 0 0 0 0 $43.37
2009 1q 63 1,294,839 76,745 5.9% (16,800) 0 0 0 0 $44.30
2008 4q 63 1,294,839 59,945 4.6% 17,572 1 6,465 0 0 $43.36
2008 3q 62 1,288,374 71,052 5.5% 56,563 2 57,159 1 6,465 $44.69
2008 2q 60 1,231,215 70,456 5.7% 83,112 0 0 3 63,624 $44.70
2008 1q 60 1,231,215 153,568 12.5% (19,683) 1 25,714 2 57,159 $44.30
2007 4q 59 1,205,501 108,171 9.0% (58,298) 0 0 3 82,873 $44.86
2007 3q 59 1,205,501 49,873 4.1% 17,192 1 16,000 3 82,873 $44.64
2007 2q 58 1,189,501 51,065 4.3% 8,770 0 0 4 98,873 $45.51
Source: CoStar Property®
UC InventoryDelivered InventoryExisting Inventory Vacancy
(0.040)
(0.020)
0.000
0.020
0.040
0.060
0.080
0.100
2008 1q 2008 2q 2008 3q 2008 4q 2009 1q 2009 2q 2009 3q 2009 4q 2010 1q 2010 2q 2010 3q 2010 4q 2011 1q
Millio
ns
SF
0.0%
2.0%
4.0%
6.0%
8.0%
10.0%
12.0%
14.0%
Perce
nt V
acant
Delivered SF Absorption SF Vacancy
$39.00
$40.00
$41.00
$42.00
$43.00
$44.00
$45.00
$46.00
$47.00
2010 1q 2010 2q 2010 3q 2010 4q 2011 1q
Dollar
s/SF/Y
ear
0.06
0.07
0.07
0.07
0.07
0.07
0.08
0.08
0.08
0.08
0.08
2010 1q 2010 2q 2010 3q 2010 4q 2011 1q
Millio
ns
SF
Direct SF Sublet SF
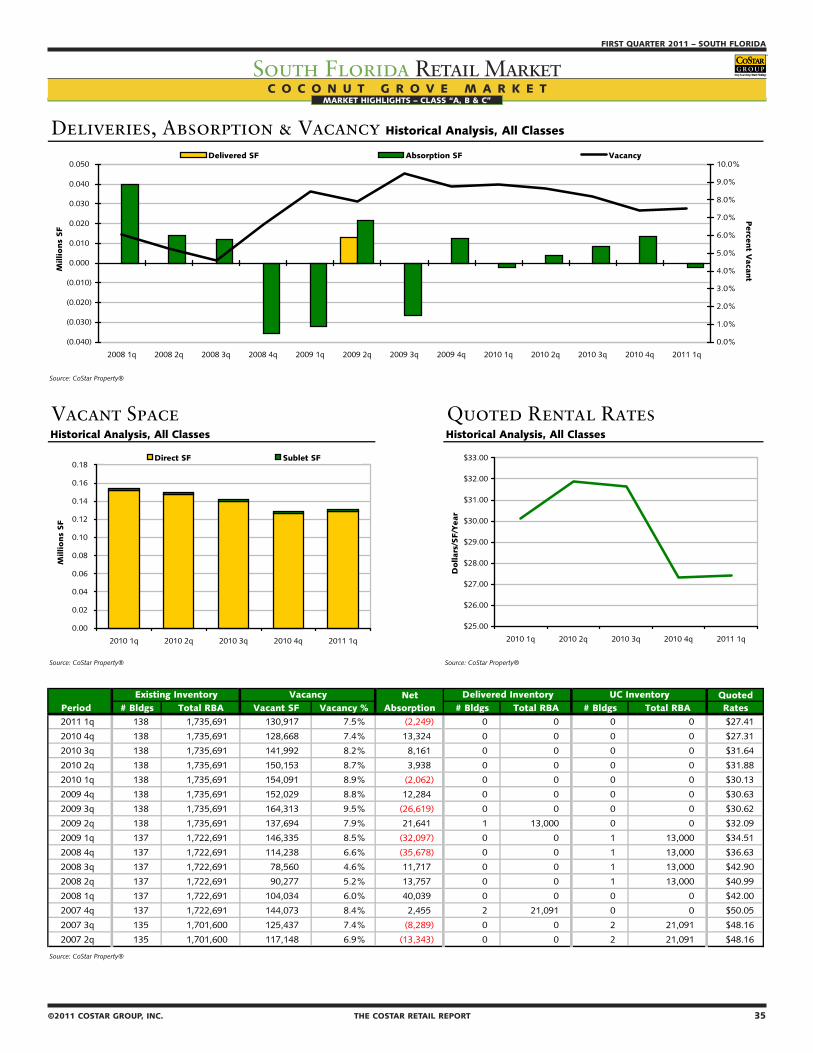
34 THE COSTAR RETAIL REPORT ©2011 COSTAR GROUP, INC.
SOUTH FLORIDA – FIRST QUARTER 2011
South Florida Retail MarketMARKET HIGHLIGHTS – CLASS “A, B & C”
©2011 COSTAR GROUP, INC. THE COSTAR RETAIL REPORT 35
FIRST QUARTER 2011 – SOUTH FLORIDA
South Florida Retail MarketMARKET HIGHLIGHTS – CLASS “A, B & C”
C O C O N U T G R O V E M A R K E T
Deliveries, Absorption & Vacancy Historical Analysis, All Classes
Source: CoStar Property®
Vacant Space Quoted Rental RatesHistorical Analysis, All Classes Historical Analysis, All Classes
Source: CoStar Property® Source: CoStar Property®
Net QuotedPeriod # Bldgs Total RBA Vacant SF Vacancy % Absorption # Bldgs Total RBA # Bldgs Total RBA Rates2011 1q 138 1,735,691 130,917 7.5% (2,249) 0 0 0 0 $27.41
2010 4q 138 1,735,691 128,668 7.4% 13,324 0 0 0 0 $27.31
2010 3q 138 1,735,691 141,992 8.2% 8,161 0 0 0 0 $31.64
2010 2q 138 1,735,691 150,153 8.7% 3,938 0 0 0 0 $31.88
2010 1q 138 1,735,691 154,091 8.9% (2,062) 0 0 0 0 $30.13
2009 4q 138 1,735,691 152,029 8.8% 12,284 0 0 0 0 $30.63
2009 3q 138 1,735,691 164,313 9.5% (26,619) 0 0 0 0 $30.62
2009 2q 138 1,735,691 137,694 7.9% 21,641 1 13,000 0 0 $32.09
2009 1q 137 1,722,691 146,335 8.5% (32,097) 0 0 1 13,000 $34.51
2008 4q 137 1,722,691 114,238 6.6% (35,678) 0 0 1 13,000 $36.63
2008 3q 137 1,722,691 78,560 4.6% 11,717 0 0 1 13,000 $42.90
2008 2q 137 1,722,691 90,277 5.2% 13,757 0 0 1 13,000 $40.99
2008 1q 137 1,722,691 104,034 6.0% 40,039 0 0 0 0 $42.00
2007 4q 137 1,722,691 144,073 8.4% 2,455 2 21,091 0 0 $50.05
2007 3q 135 1,701,600 125,437 7.4% (8,289) 0 0 2 21,091 $48.16
2007 2q 135 1,701,600 117,148 6.9% (13,343) 0 0 2 21,091 $48.16
Source: CoStar Property®
UC InventoryDelivered InventoryExisting Inventory Vacancy
(0.040)
(0.030)
(0.020)
(0.010)
0.000
0.010
0.020
0.030
0.040
0.050
2008 1q 2008 2q 2008 3q 2008 4q 2009 1q 2009 2q 2009 3q 2009 4q 2010 1q 2010 2q 2010 3q 2010 4q 2011 1q
Millio
ns
SF
0.0%
1.0%
2.0%
3.0%
4.0%
5.0%
6.0%
7.0%
8.0%
9.0%
10.0%
Perce
nt V
acant
Delivered SF Absorption SF Vacancy
$25.00
$26.00
$27.00
$28.00
$29.00
$30.00
$31.00
$32.00
$33.00
2010 1q 2010 2q 2010 3q 2010 4q 2011 1q
Dollar
s/SF/Y
ear
0.00
0.02
0.04
0.06
0.08
0.10
0.12
0.14
0.16
0.18
2010 1q 2010 2q 2010 3q 2010 4q 2011 1q
Millio
ns
SF
Direct SF Sublet SF
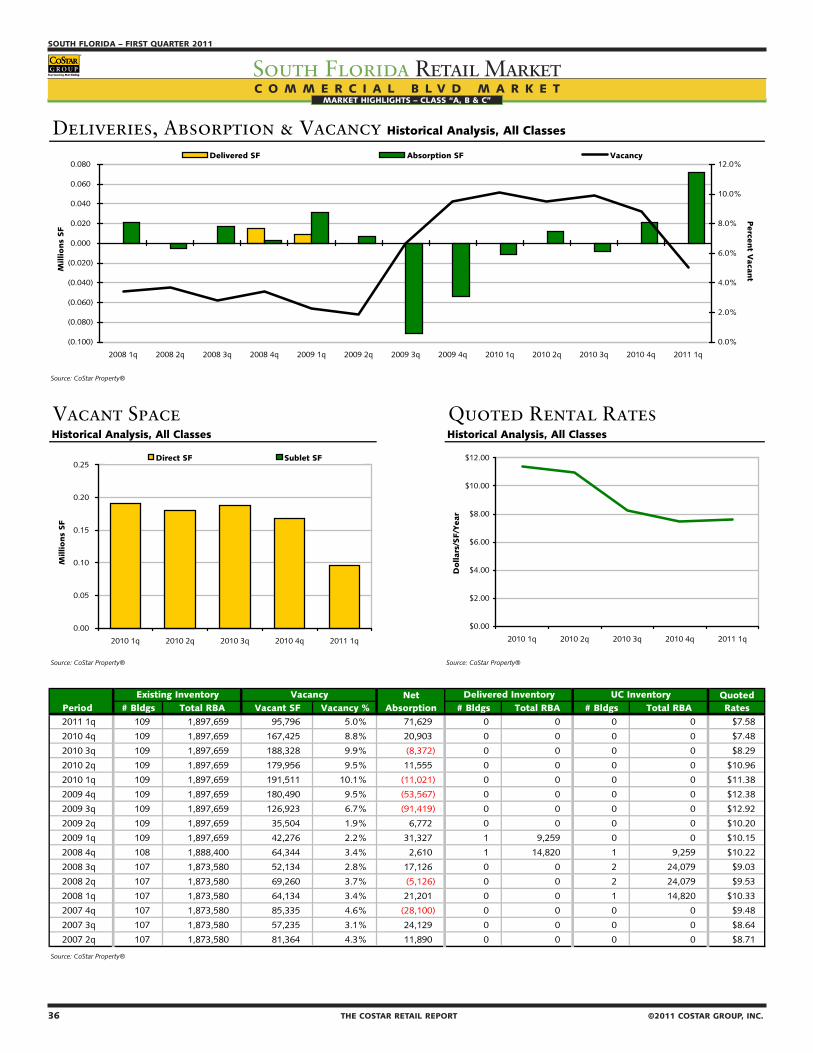
36 THE COSTAR RETAIL REPORT ©2011 COSTAR GROUP, INC.
SOUTH FLORIDA – FIRST QUARTER 2011
South Florida Retail MarketMARKET HIGHLIGHTS – CLASS “A, B & C”
©2011 COSTAR GROUP, INC. THE COSTAR RETAIL REPORT 37
FIRST QUARTER 2011 – SOUTH FLORIDA
South Florida Retail MarketMARKET HIGHLIGHTS – CLASS “A, B & C”
C O M M E R C I A L B L V D M A R K E T
Deliveries, Absorption & Vacancy Historical Analysis, All Classes
Source: CoStar Property®
Vacant Space Quoted Rental RatesHistorical Analysis, All Classes Historical Analysis, All Classes
Source: CoStar Property® Source: CoStar Property®
Net QuotedPeriod # Bldgs Total RBA Vacant SF Vacancy % Absorption # Bldgs Total RBA # Bldgs Total RBA Rates2011 1q 109 1,897,659 95,796 5.0% 71,629 0 0 0 0 $7.58
2010 4q 109 1,897,659 167,425 8.8% 20,903 0 0 0 0 $7.48
2010 3q 109 1,897,659 188,328 9.9% (8,372) 0 0 0 0 $8.29
2010 2q 109 1,897,659 179,956 9.5% 11,555 0 0 0 0 $10.96
2010 1q 109 1,897,659 191,511 10.1% (11,021) 0 0 0 0 $11.38
2009 4q 109 1,897,659 180,490 9.5% (53,567) 0 0 0 0 $12.38
2009 3q 109 1,897,659 126,923 6.7% (91,419) 0 0 0 0 $12.92
2009 2q 109 1,897,659 35,504 1.9% 6,772 0 0 0 0 $10.20
2009 1q 109 1,897,659 42,276 2.2% 31,327 1 9,259 0 0 $10.15
2008 4q 108 1,888,400 64,344 3.4% 2,610 1 14,820 1 9,259 $10.22
2008 3q 107 1,873,580 52,134 2.8% 17,126 0 0 2 24,079 $9.03
2008 2q 107 1,873,580 69,260 3.7% (5,126) 0 0 2 24,079 $9.53
2008 1q 107 1,873,580 64,134 3.4% 21,201 0 0 1 14,820 $10.33
2007 4q 107 1,873,580 85,335 4.6% (28,100) 0 0 0 0 $9.48
2007 3q 107 1,873,580 57,235 3.1% 24,129 0 0 0 0 $8.64
2007 2q 107 1,873,580 81,364 4.3% 11,890 0 0 0 0 $8.71
Source: CoStar Property®
UC InventoryDelivered InventoryExisting Inventory Vacancy
(0.100)
(0.080)
(0.060)
(0.040)
(0.020)
0.000
0.020
0.040
0.060
0.080
2008 1q 2008 2q 2008 3q 2008 4q 2009 1q 2009 2q 2009 3q 2009 4q 2010 1q 2010 2q 2010 3q 2010 4q 2011 1q
Millio
ns
SF
0.0%
2.0%
4.0%
6.0%
8.0%
10.0%
12.0%
Perce
nt V
acant
Delivered SF Absorption SF Vacancy
$0.00
$2.00
$4.00
$6.00
$8.00
$10.00
$12.00
2010 1q 2010 2q 2010 3q 2010 4q 2011 1q
Dollar
s/SF/Y
ear
0.00
0.05
0.10
0.15
0.20
0.25
2010 1q 2010 2q 2010 3q 2010 4q 2011 1q
Millio
ns
SF
Direct SF Sublet SF
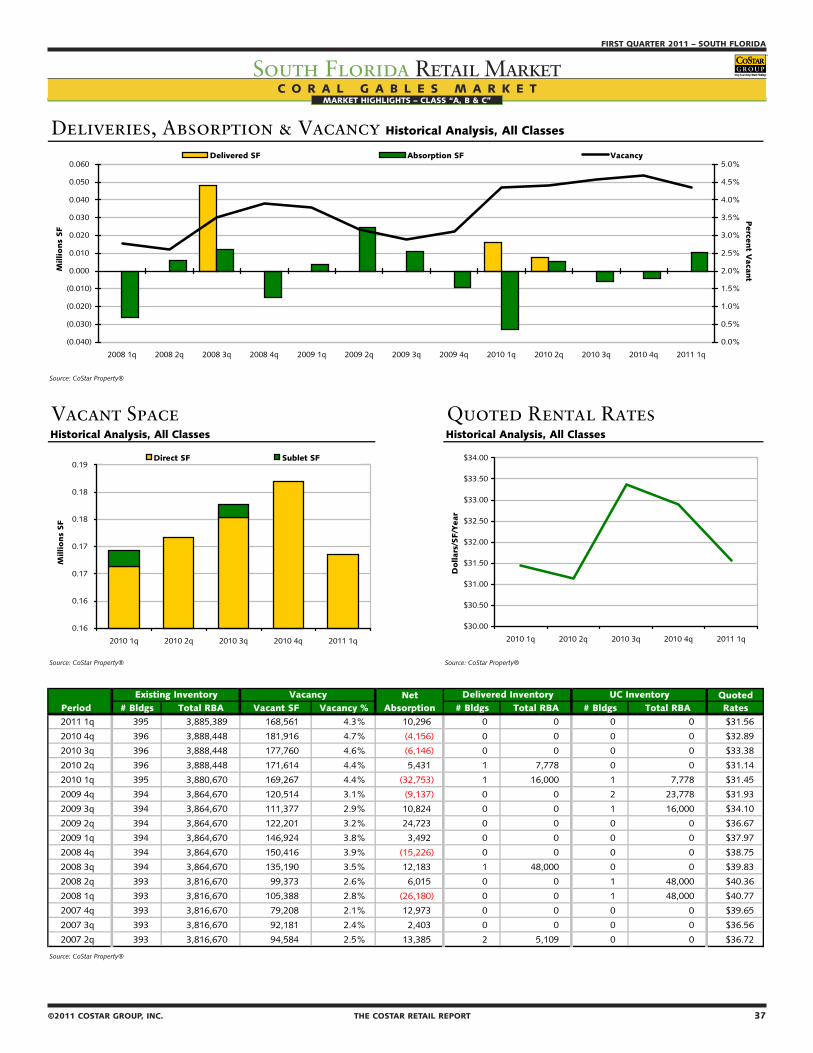
36 THE COSTAR RETAIL REPORT ©2011 COSTAR GROUP, INC.
SOUTH FLORIDA – FIRST QUARTER 2011
South Florida Retail MarketMARKET HIGHLIGHTS – CLASS “A, B & C”
©2011 COSTAR GROUP, INC. THE COSTAR RETAIL REPORT 37
FIRST QUARTER 2011 – SOUTH FLORIDA
South Florida Retail MarketMARKET HIGHLIGHTS – CLASS “A, B & C”
C O R A L G A B L E S M A R K E T
Deliveries, Absorption & Vacancy Historical Analysis, All Classes
Source: CoStar Property®
Vacant Space Quoted Rental RatesHistorical Analysis, All Classes Historical Analysis, All Classes
Source: CoStar Property® Source: CoStar Property®
Net QuotedPeriod # Bldgs Total RBA Vacant SF Vacancy % Absorption # Bldgs Total RBA # Bldgs Total RBA Rates2011 1q 395 3,885,389 168,561 4.3% 10,296 0 0 0 0 $31.56
2010 4q 396 3,888,448 181,916 4.7% (4,156) 0 0 0 0 $32.89
2010 3q 396 3,888,448 177,760 4.6% (6,146) 0 0 0 0 $33.38
2010 2q 396 3,888,448 171,614 4.4% 5,431 1 7,778 0 0 $31.14
2010 1q 395 3,880,670 169,267 4.4% (32,753) 1 16,000 1 7,778 $31.45
2009 4q 394 3,864,670 120,514 3.1% (9,137) 0 0 2 23,778 $31.93
2009 3q 394 3,864,670 111,377 2.9% 10,824 0 0 1 16,000 $34.10
2009 2q 394 3,864,670 122,201 3.2% 24,723 0 0 0 0 $36.67
2009 1q 394 3,864,670 146,924 3.8% 3,492 0 0 0 0 $37.97
2008 4q 394 3,864,670 150,416 3.9% (15,226) 0 0 0 0 $38.75
2008 3q 394 3,864,670 135,190 3.5% 12,183 1 48,000 0 0 $39.83
2008 2q 393 3,816,670 99,373 2.6% 6,015 0 0 1 48,000 $40.36
2008 1q 393 3,816,670 105,388 2.8% (26,180) 0 0 1 48,000 $40.77
2007 4q 393 3,816,670 79,208 2.1% 12,973 0 0 0 0 $39.65
2007 3q 393 3,816,670 92,181 2.4% 2,403 0 0 0 0 $36.56
2007 2q 393 3,816,670 94,584 2.5% 13,385 2 5,109 0 0 $36.72
Source: CoStar Property®
UC InventoryDelivered InventoryExisting Inventory Vacancy
(0.040)
(0.030)
(0.020)
(0.010)
0.000
0.010
0.020
0.030
0.040
0.050
0.060
2008 1q 2008 2q 2008 3q 2008 4q 2009 1q 2009 2q 2009 3q 2009 4q 2010 1q 2010 2q 2010 3q 2010 4q 2011 1q
Millio
ns
SF
0.0%
0.5%
1.0%
1.5%
2.0%
2.5%
3.0%
3.5%
4.0%
4.5%
5.0%
Perce
nt V
acant
Delivered SF Absorption SF Vacancy
$30.00
$30.50
$31.00
$31.50
$32.00
$32.50
$33.00
$33.50
$34.00
2010 1q 2010 2q 2010 3q 2010 4q 2011 1q
Dollar
s/SF/Y
ear
0.16
0.16
0.17
0.17
0.18
0.18
0.19
2010 1q 2010 2q 2010 3q 2010 4q 2011 1q
Millio
ns
SF
Direct SF Sublet SF
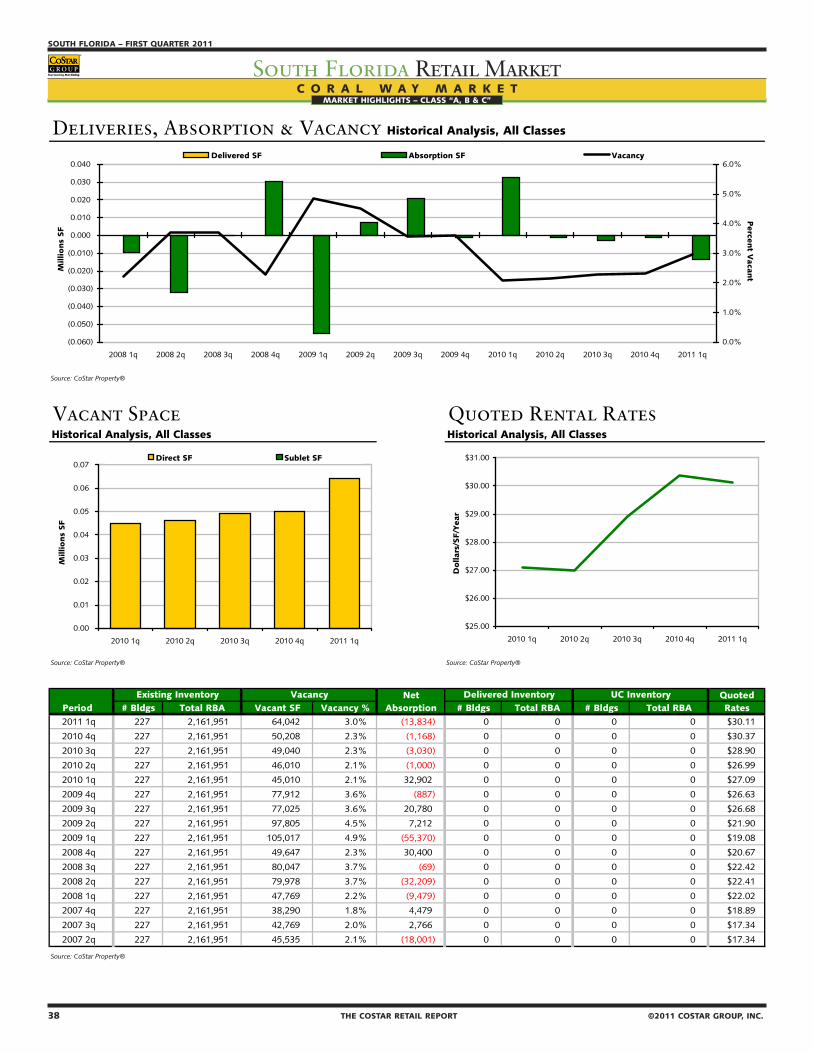
38 THE COSTAR RETAIL REPORT ©2011 COSTAR GROUP, INC.
SOUTH FLORIDA – FIRST QUARTER 2011
South Florida Retail MarketMARKET HIGHLIGHTS – CLASS “A, B & C”
©2011 COSTAR GROUP, INC. THE COSTAR RETAIL REPORT 39
FIRST QUARTER 2011 – SOUTH FLORIDA
South Florida Retail MarketMARKET HIGHLIGHTS – CLASS “A, B & C”
C O R A L W A Y M A R K E T
Deliveries, Absorption & Vacancy Historical Analysis, All Classes
Source: CoStar Property®
Vacant Space Quoted Rental RatesHistorical Analysis, All Classes Historical Analysis, All Classes
Source: CoStar Property® Source: CoStar Property®
Net QuotedPeriod # Bldgs Total RBA Vacant SF Vacancy % Absorption # Bldgs Total RBA # Bldgs Total RBA Rates2011 1q 227 2,161,951 64,042 3.0% (13,834) 0 0 0 0 $30.11
2010 4q 227 2,161,951 50,208 2.3% (1,168) 0 0 0 0 $30.37
2010 3q 227 2,161,951 49,040 2.3% (3,030) 0 0 0 0 $28.90
2010 2q 227 2,161,951 46,010 2.1% (1,000) 0 0 0 0 $26.99
2010 1q 227 2,161,951 45,010 2.1% 32,902 0 0 0 0 $27.09
2009 4q 227 2,161,951 77,912 3.6% (887) 0 0 0 0 $26.63
2009 3q 227 2,161,951 77,025 3.6% 20,780 0 0 0 0 $26.68
2009 2q 227 2,161,951 97,805 4.5% 7,212 0 0 0 0 $21.90
2009 1q 227 2,161,951 105,017 4.9% (55,370) 0 0 0 0 $19.08
2008 4q 227 2,161,951 49,647 2.3% 30,400 0 0 0 0 $20.67
2008 3q 227 2,161,951 80,047 3.7% (69) 0 0 0 0 $22.42
2008 2q 227 2,161,951 79,978 3.7% (32,209) 0 0 0 0 $22.41
2008 1q 227 2,161,951 47,769 2.2% (9,479) 0 0 0 0 $22.02
2007 4q 227 2,161,951 38,290 1.8% 4,479 0 0 0 0 $18.89
2007 3q 227 2,161,951 42,769 2.0% 2,766 0 0 0 0 $17.34
2007 2q 227 2,161,951 45,535 2.1% (18,001) 0 0 0 0 $17.34
Source: CoStar Property®
UC InventoryDelivered InventoryExisting Inventory Vacancy
(0.060)
(0.050)
(0.040)
(0.030)
(0.020)
(0.010)
0.000
0.010
0.020
0.030
0.040
2008 1q 2008 2q 2008 3q 2008 4q 2009 1q 2009 2q 2009 3q 2009 4q 2010 1q 2010 2q 2010 3q 2010 4q 2011 1q
Millio
ns
SF
0.0%
1.0%
2.0%
3.0%
4.0%
5.0%
6.0%
Perce
nt V
acant
Delivered SF Absorption SF Vacancy
$25.00
$26.00
$27.00
$28.00
$29.00
$30.00
$31.00
2010 1q 2010 2q 2010 3q 2010 4q 2011 1q
Dollar
s/SF/Y
ear
0.00
0.01
0.02
0.03
0.04
0.05
0.06
0.07
2010 1q 2010 2q 2010 3q 2010 4q 2011 1q
Millio
ns
SF
Direct SF Sublet SF

38 THE COSTAR RETAIL REPORT ©2011 COSTAR GROUP, INC.
SOUTH FLORIDA – FIRST QUARTER 2011
South Florida Retail MarketMARKET HIGHLIGHTS – CLASS “A, B & C”
©2011 COSTAR GROUP, INC. THE COSTAR RETAIL REPORT 39
FIRST QUARTER 2011 – SOUTH FLORIDA
South Florida Retail MarketMARKET HIGHLIGHTS – CLASS “A, B & C”
C Y P R E S S C R E E K M A R K E T
Deliveries, Absorption & Vacancy Historical Analysis, All Classes
Source: CoStar Property®
Vacant Space Quoted Rental RatesHistorical Analysis, All Classes Historical Analysis, All Classes
Source: CoStar Property® Source: CoStar Property®
Net QuotedPeriod # Bldgs Total RBA Vacant SF Vacancy % Absorption # Bldgs Total RBA # Bldgs Total RBA Rates2011 1q 214 2,684,222 197,058 7.3% (3,609) 0 0 1 4,152 $13.59
2010 4q 214 2,684,222 193,449 7.2% (12,381) 0 0 1 4,152 $13.07
2010 3q 214 2,684,222 181,068 6.7% 11,477 0 0 1 4,152 $13.85
2010 2q 214 2,684,222 192,545 7.2% 4,066 0 0 0 0 $14.41
2010 1q 214 2,684,222 196,611 7.3% 22,401 0 0 0 0 $16.26
2009 4q 214 2,684,222 219,012 8.2% 7,948 0 0 0 0 $16.10
2009 3q 214 2,684,222 226,960 8.5% 3,135 0 0 0 0 $14.53
2009 2q 214 2,684,222 230,095 8.6% (19,147) 0 0 0 0 $14.71
2009 1q 214 2,684,222 210,948 7.9% (17,119) 0 0 0 0 $15.60
2008 4q 214 2,684,222 193,829 7.2% (15,545) 0 0 0 0 $15.58
2008 3q 214 2,684,222 178,284 6.6% (9,685) 0 0 0 0 $15.34
2008 2q 214 2,684,222 168,599 6.3% (13,869) 0 0 0 0 $14.17
2008 1q 214 2,684,222 154,730 5.8% 95,265 1 124,015 0 0 $12.51
2007 4q 213 2,560,207 125,980 4.9% 5,558 0 0 1 124,015 $15.14
2007 3q 213 2,560,207 131,538 5.1% (4,092) 0 0 1 124,015 $14.99
2007 2q 213 2,560,207 127,446 5.0% 45,567 0 0 1 124,015 $16.54
Source: CoStar Property®
UC InventoryDelivered InventoryExisting Inventory Vacancy
(0.040)
(0.020)
0.000
0.020
0.040
0.060
0.080
0.100
0.120
0.140
2008 1q 2008 2q 2008 3q 2008 4q 2009 1q 2009 2q 2009 3q 2009 4q 2010 1q 2010 2q 2010 3q 2010 4q 2011 1q
Millio
ns
SF
0.0%
1.0%
2.0%
3.0%
4.0%
5.0%
6.0%
7.0%
8.0%
9.0%
10.0%
Perce
nt V
acant
Delivered SF Absorption SF Vacancy
$0.00
$2.00
$4.00
$6.00
$8.00
$10.00
$12.00
$14.00
$16.00
$18.00
2010 1q 2010 2q 2010 3q 2010 4q 2011 1q
Dollar
s/SF/Y
ear
0.17
0.18
0.18
0.19
0.19
0.20
0.20
2010 1q 2010 2q 2010 3q 2010 4q 2011 1q
Millio
ns
SF
Direct SF Sublet SF

40 THE COSTAR RETAIL REPORT ©2011 COSTAR GROUP, INC.
SOUTH FLORIDA – FIRST QUARTER 2011
South Florida Retail MarketMARKET HIGHLIGHTS – CLASS “A, B & C”
©2011 COSTAR GROUP, INC. THE COSTAR RETAIL REPORT 41
FIRST QUARTER 2011 – SOUTH FLORIDA
South Florida Retail MarketMARKET HIGHLIGHTS – CLASS “A, B & C”
D E L R A Y B E A C H M A R K E T
Deliveries, Absorption & Vacancy Historical Analysis, All Classes
Source: CoStar Property®
Vacant Space Quoted Rental RatesHistorical Analysis, All Classes Historical Analysis, All Classes
Source: CoStar Property® Source: CoStar Property®
Net QuotedPeriod # Bldgs Total RBA Vacant SF Vacancy % Absorption # Bldgs Total RBA # Bldgs Total RBA Rates2011 1q 526 7,270,917 601,252 8.3% (11,474) 0 0 0 0 $16.86
2010 4q 526 7,270,917 589,778 8.1% (2,479) 0 0 0 0 $17.05
2010 3q 526 7,270,917 587,299 8.1% 27,039 0 0 0 0 $20.73
2010 2q 529 7,357,924 701,345 9.5% (89,000) 0 0 0 0 $21.15
2010 1q 529 7,357,924 612,345 8.3% 45,375 1 65,642 0 0 $23.13
2009 4q 528 7,292,282 592,078 8.1% 65,853 2 26,690 1 65,642 $23.81
2009 3q 526 7,265,592 631,241 8.7% (58,424) 0 0 3 92,332 $24.65
2009 2q 526 7,265,592 572,817 7.9% 22,353 0 0 3 92,332 $20.99
2009 1q 526 7,265,592 595,170 8.2% 52,146 0 0 2 85,817 $22.72
2008 4q 526 7,265,592 647,316 8.9% (192,716) 1 25,436 2 85,817 $22.90
2008 3q 525 7,240,156 429,164 5.9% 56,794 2 124,346 3 111,253 $21.45
2008 2q 523 7,115,810 361,612 5.1% 57,431 0 0 5 235,599 $25.30
2008 1q 523 7,115,810 419,043 5.9% 46,145 4 81,321 5 235,599 $24.64
2007 4q 519 7,034,489 383,867 5.5% 31,864 0 0 4 81,321 $22.58
2007 3q 519 7,034,489 415,731 5.9% 77,579 2 67,585 4 81,321 $22.42
2007 2q 517 6,966,904 425,725 6.1% (83,065) 0 0 2 67,585 $23.09
Source: CoStar Property®
UC InventoryDelivered InventoryExisting Inventory Vacancy
(0.250)
(0.200)
(0.150)
(0.100)
(0.050)
0.000
0.050
0.100
0.150
2008 1q 2008 2q 2008 3q 2008 4q 2009 1q 2009 2q 2009 3q 2009 4q 2010 1q 2010 2q 2010 3q 2010 4q 2011 1q
Millio
ns
SF
0.0%
2.0%
4.0%
6.0%
8.0%
10.0%
12.0%
Perce
nt V
acant
Delivered SF Absorption SF Vacancy
$0.00
$5.00
$10.00
$15.00
$20.00
$25.00
2010 1q 2010 2q 2010 3q 2010 4q 2011 1q
Dollar
s/SF/Y
ear
0.00
0.10
0.20
0.30
0.40
0.50
0.60
0.70
0.80
2010 1q 2010 2q 2010 3q 2010 4q 2011 1q
Millio
ns
SF
Direct SF Sublet SF

40 THE COSTAR RETAIL REPORT ©2011 COSTAR GROUP, INC.
SOUTH FLORIDA – FIRST QUARTER 2011
South Florida Retail MarketMARKET HIGHLIGHTS – CLASS “A, B & C”
©2011 COSTAR GROUP, INC. THE COSTAR RETAIL REPORT 41
FIRST QUARTER 2011 – SOUTH FLORIDA
South Florida Retail MarketMARKET HIGHLIGHTS – CLASS “A, B & C”
D O W N T O W N F O R T L A U D E R D A L E M A R K E T
Deliveries, Absorption & Vacancy Historical Analysis, All Classes
Source: CoStar Property®
Vacant Space Quoted Rental RatesHistorical Analysis, All Classes Historical Analysis, All Classes
Source: CoStar Property® Source: CoStar Property®
Net QuotedPeriod # Bldgs Total RBA Vacant SF Vacancy % Absorption # Bldgs Total RBA # Bldgs Total RBA Rates2011 1q 421 5,690,788 381,193 6.7% (30,783) 0 0 0 0 $23.02
2010 4q 421 5,690,788 350,410 6.2% (5,697) 0 0 0 0 $23.05
2010 3q 421 5,690,788 344,713 6.1% 9,389 1 1,635 0 0 $23.40
2010 2q 420 5,689,153 352,467 6.2% (5,703) 0 0 1 1,635 $25.15
2010 1q 420 5,689,153 346,764 6.1% 7,240 0 0 1 1,635 $26.63
2009 4q 420 5,689,153 354,004 6.2% (3,975) 0 0 0 0 $27.88
2009 3q 420 5,689,153 350,029 6.2% (31,035) 1 19,600 0 0 $28.60
2009 2q 419 5,669,553 299,394 5.3% (6,722) 0 0 1 19,600 $29.85
2009 1q 419 5,669,553 292,672 5.2% (625) 0 0 1 19,600 $32.61
2008 4q 419 5,669,553 292,047 5.2% (154,783) 0 0 0 0 $28.81
2008 3q 419 5,669,553 137,264 2.4% (5,693) 0 0 0 0 $29.01
2008 2q 420 5,690,073 152,091 2.7% (21,453) 0 0 0 0 $29.14
2008 1q 420 5,690,073 130,638 2.3% 31,124 1 2,636 0 0 $33.26
2007 4q 419 5,687,437 159,126 2.8% (31,058) 1 2,431 1 2,636 $33.08
2007 3q 418 5,685,006 125,637 2.2% 61,473 0 0 2 5,067 $32.71
2007 2q 418 5,685,006 187,110 3.3% (10,349) 1 10,664 1 2,431 $30.48
Source: CoStar Property®
UC InventoryDelivered InventoryExisting Inventory Vacancy
(0.200)
(0.150)
(0.100)
(0.050)
0.000
0.050
2008 1q 2008 2q 2008 3q 2008 4q 2009 1q 2009 2q 2009 3q 2009 4q 2010 1q 2010 2q 2010 3q 2010 4q 2011 1q
Millio
ns
SF
0.0%
1.0%
2.0%
3.0%
4.0%
5.0%
6.0%
7.0%
8.0%
Perce
nt V
acant
Delivered SF Absorption SF Vacancy
$21.00
$22.00
$23.00
$24.00
$25.00
$26.00
$27.00
2010 1q 2010 2q 2010 3q 2010 4q 2011 1q
Dollar
s/SF/Y
ear
0.32
0.33
0.34
0.35
0.36
0.37
0.38
0.39
2010 1q 2010 2q 2010 3q 2010 4q 2011 1q
Millio
ns
SF
Direct SF Sublet SF

42 THE COSTAR RETAIL REPORT ©2011 COSTAR GROUP, INC.
SOUTH FLORIDA – FIRST QUARTER 2011
South Florida Retail MarketMARKET HIGHLIGHTS – CLASS “A, B & C”
©2011 COSTAR GROUP, INC. THE COSTAR RETAIL REPORT 43
FIRST QUARTER 2011 – SOUTH FLORIDA
South Florida Retail MarketMARKET HIGHLIGHTS – CLASS “A, B & C”
D O W N T O W N M I A M I M A R K E T
Deliveries, Absorption & Vacancy Historical Analysis, All Classes
Source: CoStar Property®
Vacant Space Quoted Rental RatesHistorical Analysis, All Classes Historical Analysis, All Classes
Source: CoStar Property® Source: CoStar Property®
Net QuotedPeriod # Bldgs Total RBA Vacant SF Vacancy % Absorption # Bldgs Total RBA # Bldgs Total RBA Rates2011 1q 150 6,066,748 394,714 6.5% 18,075 0 0 0 0 $28.60
2010 4q 150 6,066,748 412,789 6.8% 3,800 0 0 0 0 $28.42
2010 3q 150 6,066,748 416,589 6.9% (19,284) 0 0 0 0 $28.61
2010 2q 150 6,066,748 397,305 6.5% (39,515) 0 0 0 0 $22.17
2010 1q 150 6,066,748 357,790 5.9% (20,995) 0 0 0 0 $22.05
2009 4q 150 6,066,748 336,795 5.6% (16,954) 0 0 0 0 $22.42
2009 3q 150 6,066,748 319,841 5.3% 45,203 0 0 0 0 $22.74
2009 2q 150 6,066,748 365,044 6.0% 42,735 0 0 0 0 $23.62
2009 1q 150 6,066,748 407,779 6.7% (23,658) 0 0 0 0 $23.51
2008 4q 150 6,066,748 384,121 6.3% (39,310) 0 0 0 0 $23.70
2008 3q 150 6,066,748 344,811 5.7% (57,300) 0 0 0 0 $26.21
2008 2q 150 6,066,748 287,511 4.7% 93,815 0 0 0 0 $30.47
2008 1q 150 6,066,748 381,326 6.3% (32,782) 0 0 0 0 $27.75
2007 4q 150 6,066,748 348,544 5.7% (46,336) 1 58,000 0 0 $30.44
2007 3q 149 6,008,748 244,208 4.1% (24,442) 0 0 1 58,000 $26.17
2007 2q 149 6,008,748 219,766 3.7% (20,589) 0 0 1 58,000 $22.96
Source: CoStar Property®
UC InventoryDelivered InventoryExisting Inventory Vacancy
(0.080)
(0.060)
(0.040)
(0.020)
0.000
0.020
0.040
0.060
0.080
0.100
0.120
2008 1q 2008 2q 2008 3q 2008 4q 2009 1q 2009 2q 2009 3q 2009 4q 2010 1q 2010 2q 2010 3q 2010 4q 2011 1q
Millio
ns
SF
0.0%
1.0%
2.0%
3.0%
4.0%
5.0%
6.0%
7.0%
8.0%
Perce
nt V
acant
Delivered SF Absorption SF Vacancy
$0.00
$5.00
$10.00
$15.00
$20.00
$25.00
$30.00
$35.00
2010 1q 2010 2q 2010 3q 2010 4q 2011 1q
Dollar
s/SF/Y
ear
0.32
0.33
0.34
0.35
0.36
0.37
0.38
0.39
0.40
0.41
0.42
0.43
2010 1q 2010 2q 2010 3q 2010 4q 2011 1q
Millio
ns
SF
Direct SF Sublet SF
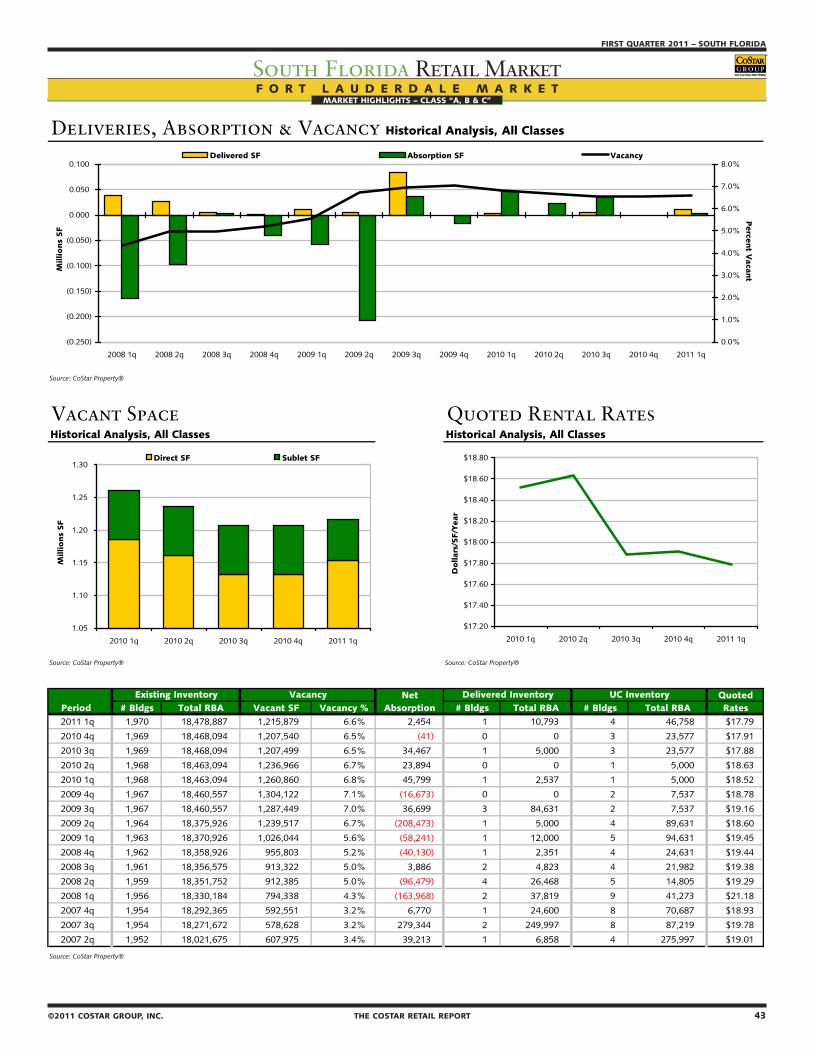
42 THE COSTAR RETAIL REPORT ©2011 COSTAR GROUP, INC.
SOUTH FLORIDA – FIRST QUARTER 2011
South Florida Retail MarketMARKET HIGHLIGHTS – CLASS “A, B & C”
©2011 COSTAR GROUP, INC. THE COSTAR RETAIL REPORT 43
FIRST QUARTER 2011 – SOUTH FLORIDA
South Florida Retail MarketMARKET HIGHLIGHTS – CLASS “A, B & C”
F O R T L A U D E R D A L E M A R K E T
Deliveries, Absorption & Vacancy Historical Analysis, All Classes
Source: CoStar Property®
Vacant Space Quoted Rental RatesHistorical Analysis, All Classes Historical Analysis, All Classes
Source: CoStar Property® Source: CoStar Property®
Net QuotedPeriod # Bldgs Total RBA Vacant SF Vacancy % Absorption # Bldgs Total RBA # Bldgs Total RBA Rates2011 1q 1,970 18,478,887 1,215,879 6.6% 2,454 1 10,793 4 46,758 $17.79
2010 4q 1,969 18,468,094 1,207,540 6.5% (41) 0 0 3 23,577 $17.91
2010 3q 1,969 18,468,094 1,207,499 6.5% 34,467 1 5,000 3 23,577 $17.88
2010 2q 1,968 18,463,094 1,236,966 6.7% 23,894 0 0 1 5,000 $18.63
2010 1q 1,968 18,463,094 1,260,860 6.8% 45,799 1 2,537 1 5,000 $18.52
2009 4q 1,967 18,460,557 1,304,122 7.1% (16,673) 0 0 2 7,537 $18.78
2009 3q 1,967 18,460,557 1,287,449 7.0% 36,699 3 84,631 2 7,537 $19.16
2009 2q 1,964 18,375,926 1,239,517 6.7% (208,473) 1 5,000 4 89,631 $18.60
2009 1q 1,963 18,370,926 1,026,044 5.6% (58,241) 1 12,000 5 94,631 $19.45
2008 4q 1,962 18,358,926 955,803 5.2% (40,130) 1 2,351 4 24,631 $19.44
2008 3q 1,961 18,356,575 913,322 5.0% 3,886 2 4,823 4 21,982 $19.38
2008 2q 1,959 18,351,752 912,385 5.0% (96,479) 4 26,468 5 14,805 $19.29
2008 1q 1,956 18,330,184 794,338 4.3% (163,968) 2 37,819 9 41,273 $21.18
2007 4q 1,954 18,292,365 592,551 3.2% 6,770 1 24,600 8 70,687 $18.93
2007 3q 1,954 18,271,672 578,628 3.2% 279,344 2 249,997 8 87,219 $19.78
2007 2q 1,952 18,021,675 607,975 3.4% 39,213 1 6,858 4 275,997 $19.01
Source: CoStar Property®
UC InventoryDelivered InventoryExisting Inventory Vacancy
(0.250)
(0.200)
(0.150)
(0.100)
(0.050)
0.000
0.050
0.100
2008 1q 2008 2q 2008 3q 2008 4q 2009 1q 2009 2q 2009 3q 2009 4q 2010 1q 2010 2q 2010 3q 2010 4q 2011 1q
Millio
ns
SF
0.0%
1.0%
2.0%
3.0%
4.0%
5.0%
6.0%
7.0%
8.0%
Perce
nt V
acant
Delivered SF Absorption SF Vacancy
$17.20
$17.40
$17.60
$17.80
$18.00
$18.20
$18.40
$18.60
$18.80
2010 1q 2010 2q 2010 3q 2010 4q 2011 1q
Dollar
s/SF/Y
ear
1.05
1.10
1.15
1.20
1.25
1.30
2010 1q 2010 2q 2010 3q 2010 4q 2011 1q
Millio
ns
SF
Direct SF Sublet SF
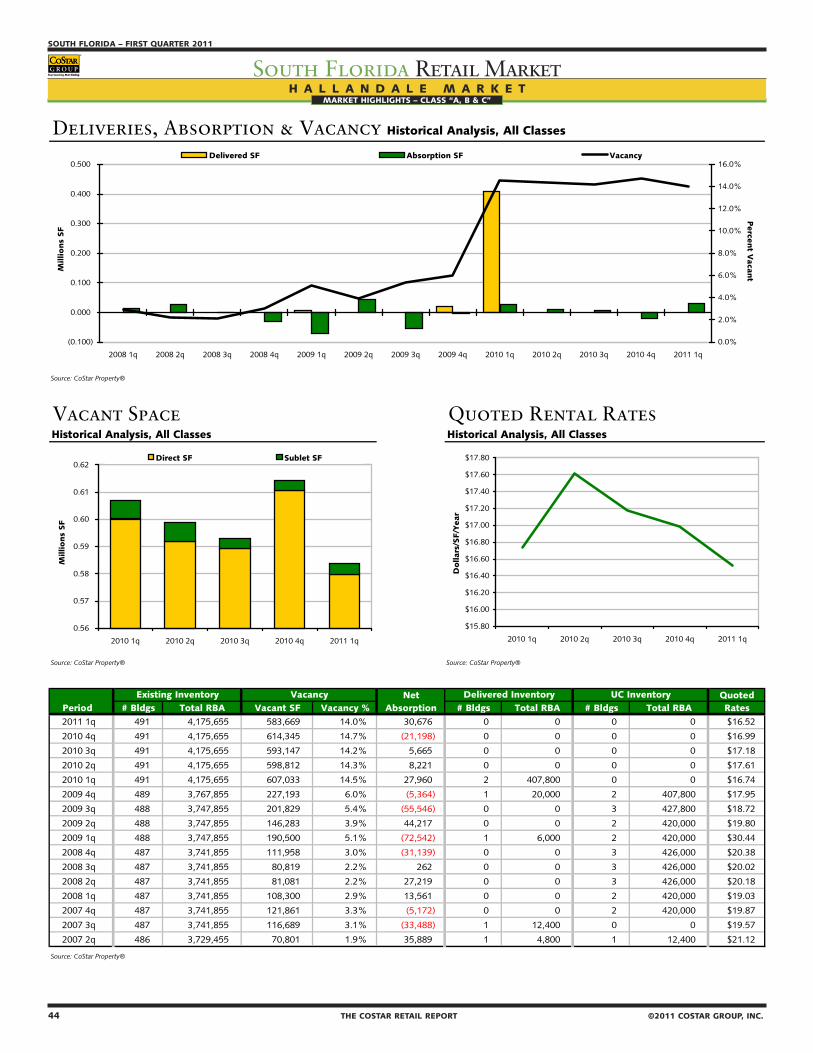
44 THE COSTAR RETAIL REPORT ©2011 COSTAR GROUP, INC.
SOUTH FLORIDA – FIRST QUARTER 2011
South Florida Retail MarketMARKET HIGHLIGHTS – CLASS “A, B & C”
©2011 COSTAR GROUP, INC. THE COSTAR RETAIL REPORT 45
FIRST QUARTER 2011 – SOUTH FLORIDA
South Florida Retail MarketMARKET HIGHLIGHTS – CLASS “A, B & C”
H A L L A N D A L E M A R K E T
Deliveries, Absorption & Vacancy Historical Analysis, All Classes
Source: CoStar Property®
Vacant Space Quoted Rental RatesHistorical Analysis, All Classes Historical Analysis, All Classes
Source: CoStar Property® Source: CoStar Property®
Net QuotedPeriod # Bldgs Total RBA Vacant SF Vacancy % Absorption # Bldgs Total RBA # Bldgs Total RBA Rates2011 1q 491 4,175,655 583,669 14.0% 30,676 0 0 0 0 $16.52
2010 4q 491 4,175,655 614,345 14.7% (21,198) 0 0 0 0 $16.99
2010 3q 491 4,175,655 593,147 14.2% 5,665 0 0 0 0 $17.18
2010 2q 491 4,175,655 598,812 14.3% 8,221 0 0 0 0 $17.61
2010 1q 491 4,175,655 607,033 14.5% 27,960 2 407,800 0 0 $16.74
2009 4q 489 3,767,855 227,193 6.0% (5,364) 1 20,000 2 407,800 $17.95
2009 3q 488 3,747,855 201,829 5.4% (55,546) 0 0 3 427,800 $18.72
2009 2q 488 3,747,855 146,283 3.9% 44,217 0 0 2 420,000 $19.80
2009 1q 488 3,747,855 190,500 5.1% (72,542) 1 6,000 2 420,000 $30.44
2008 4q 487 3,741,855 111,958 3.0% (31,139) 0 0 3 426,000 $20.38
2008 3q 487 3,741,855 80,819 2.2% 262 0 0 3 426,000 $20.02
2008 2q 487 3,741,855 81,081 2.2% 27,219 0 0 3 426,000 $20.18
2008 1q 487 3,741,855 108,300 2.9% 13,561 0 0 2 420,000 $19.03
2007 4q 487 3,741,855 121,861 3.3% (5,172) 0 0 2 420,000 $19.87
2007 3q 487 3,741,855 116,689 3.1% (33,488) 1 12,400 0 0 $19.57
2007 2q 486 3,729,455 70,801 1.9% 35,889 1 4,800 1 12,400 $21.12
Source: CoStar Property®
UC InventoryDelivered InventoryExisting Inventory Vacancy
(0.100)
0.000
0.100
0.200
0.300
0.400
0.500
2008 1q 2008 2q 2008 3q 2008 4q 2009 1q 2009 2q 2009 3q 2009 4q 2010 1q 2010 2q 2010 3q 2010 4q 2011 1q
Millio
ns
SF
0.0%
2.0%
4.0%
6.0%
8.0%
10.0%
12.0%
14.0%
16.0%
Perce
nt V
acant
Delivered SF Absorption SF Vacancy
$15.80
$16.00
$16.20
$16.40
$16.60
$16.80
$17.00
$17.20
$17.40
$17.60
$17.80
2010 1q 2010 2q 2010 3q 2010 4q 2011 1q
Dollar
s/SF/Y
ear
0.56
0.57
0.58
0.59
0.60
0.61
0.62
2010 1q 2010 2q 2010 3q 2010 4q 2011 1q
Millio
ns
SF
Direct SF Sublet SF

44 THE COSTAR RETAIL REPORT ©2011 COSTAR GROUP, INC.
SOUTH FLORIDA – FIRST QUARTER 2011
South Florida Retail MarketMARKET HIGHLIGHTS – CLASS “A, B & C”
©2011 COSTAR GROUP, INC. THE COSTAR RETAIL REPORT 45
FIRST QUARTER 2011 – SOUTH FLORIDA
South Florida Retail MarketMARKET HIGHLIGHTS – CLASS “A, B & C”
H O L L Y W O O D M A R K E T
Deliveries, Absorption & Vacancy Historical Analysis, All Classes
Source: CoStar Property®
Vacant Space Quoted Rental RatesHistorical Analysis, All Classes Historical Analysis, All Classes
Source: CoStar Property® Source: CoStar Property®
Net QuotedPeriod # Bldgs Total RBA Vacant SF Vacancy % Absorption # Bldgs Total RBA # Bldgs Total RBA Rates2011 1q 1,096 12,064,269 859,470 7.1% 40,781 1 3,960 0 0 $18.50
2010 4q 1,095 12,060,309 896,291 7.4% (89,465) 0 0 1 3,960 $18.43
2010 3q 1,095 12,060,309 806,826 6.7% (47,718) 0 0 1 3,960 $18.14
2010 2q 1,095 12,060,309 759,108 6.3% 2,419 0 0 0 0 $17.86
2010 1q 1,095 12,060,309 761,527 6.3% 18,421 0 0 0 0 $18.23
2009 4q 1,095 12,060,309 779,948 6.5% (37,005) 1 4,200 0 0 $19.08
2009 3q 1,094 12,056,109 738,743 6.1% (131,870) 1 8,000 1 4,200 $19.83
2009 2q 1,093 12,048,109 598,873 5.0% 222 1 33,000 2 12,200 $19.98
2009 1q 1,092 12,015,109 566,095 4.7% (14,423) 1 5,430 2 41,000 $19.59
2008 4q 1,091 12,009,679 546,242 4.5% 46,238 0 0 3 46,430 $19.33
2008 3q 1,091 12,009,679 592,480 4.9% (25,730) 0 0 3 46,430 $19.48
2008 2q 1,092 12,026,566 583,637 4.9% 21,766 2 49,892 2 41,000 $18.48
2008 1q 1,090 11,976,674 555,511 4.6% 25,659 0 0 4 90,892 $19.04
2007 4q 1,090 11,976,674 581,170 4.9% 218,658 5 237,042 3 82,892 $18.42
2007 3q 1,085 11,739,632 562,786 4.8% (88,728) 1 10,000 8 319,934 $20.02
2007 2q 1,084 11,729,632 464,058 4.0% (31,222) 2 18,724 9 329,934 $20.01
Source: CoStar Property®
UC InventoryDelivered InventoryExisting Inventory Vacancy
(0.160)
(0.140)
(0.120)
(0.100)
(0.080)
(0.060)
(0.040)
(0.020)
0.000
0.020
0.040
0.060
2008 1q 2008 2q 2008 3q 2008 4q 2009 1q 2009 2q 2009 3q 2009 4q 2010 1q 2010 2q 2010 3q 2010 4q 2011 1q
Millio
ns
SF
0.0%
1.0%
2.0%
3.0%
4.0%
5.0%
6.0%
7.0%
8.0%
Perce
nt V
acant
Delivered SF Absorption SF Vacancy
$17.40
$17.60
$17.80
$18.00
$18.20
$18.40
$18.60
2010 1q 2010 2q 2010 3q 2010 4q 2011 1q
Dollar
s/SF/Y
ear
0.00
0.10
0.20
0.30
0.40
0.50
0.60
0.70
0.80
0.90
1.00
2010 1q 2010 2q 2010 3q 2010 4q 2011 1q
Millio
ns
SF
Direct SF Sublet SF

46 THE COSTAR RETAIL REPORT ©2011 COSTAR GROUP, INC.
SOUTH FLORIDA – FIRST QUARTER 2011
South Florida Retail MarketMARKET HIGHLIGHTS – CLASS “A, B & C”
©2011 COSTAR GROUP, INC. THE COSTAR RETAIL REPORT 47
FIRST QUARTER 2011 – SOUTH FLORIDA
South Florida Retail MarketMARKET HIGHLIGHTS – CLASS “A, B & C”
J U P I T E R M A R K E T
Deliveries, Absorption & Vacancy Historical Analysis, All Classes
Source: CoStar Property®
Vacant Space Quoted Rental RatesHistorical Analysis, All Classes Historical Analysis, All Classes
Source: CoStar Property® Source: CoStar Property®
Net QuotedPeriod # Bldgs Total RBA Vacant SF Vacancy % Absorption # Bldgs Total RBA # Bldgs Total RBA Rates2011 1q 294 4,427,290 268,371 6.1% 12,066 0 0 0 0 $20.93
2010 4q 294 4,427,290 280,437 6.3% 33,557 0 0 0 0 $21.26
2010 3q 294 4,427,290 313,994 7.1% (8,224) 0 0 0 0 $21.21
2010 2q 294 4,427,290 305,770 6.9% 33,905 0 0 0 0 $21.09
2010 1q 294 4,427,290 339,675 7.7% 8,243 0 0 0 0 $21.05
2009 4q 294 4,427,290 347,918 7.9% (6,037) 0 0 0 0 $22.30
2009 3q 294 4,427,290 341,881 7.7% 33,253 0 0 0 0 $20.80
2009 2q 294 4,427,290 375,134 8.5% (14,547) 0 0 0 0 $21.01
2009 1q 294 4,427,290 360,587 8.1% (58,883) 0 0 0 0 $21.47
2008 4q 294 4,427,290 301,704 6.8% (38,121) 1 7,702 0 0 $21.14
2008 3q 293 4,419,588 255,881 5.8% 31,152 0 0 1 7,702 $21.35
2008 2q 293 4,419,588 287,033 6.5% 15,881 1 25,000 1 7,702 $22.17
2008 1q 292 4,394,588 277,914 6.3% (200) 0 0 1 25,000 $21.71
2007 4q 292 4,394,588 277,714 6.3% 15,702 0 0 1 25,000 $21.61
2007 3q 292 4,394,588 293,416 6.7% 8,311 3 37,279 1 25,000 $21.47
2007 2q 289 4,357,309 264,448 6.1% (10,123) 0 0 4 62,279 $21.68
Source: CoStar Property®
UC InventoryDelivered InventoryExisting Inventory Vacancy
(0.080)
(0.060)
(0.040)
(0.020)
0.000
0.020
0.040
2008 1q 2008 2q 2008 3q 2008 4q 2009 1q 2009 2q 2009 3q 2009 4q 2010 1q 2010 2q 2010 3q 2010 4q 2011 1q
Millio
ns
SF
0.0%
1.0%
2.0%
3.0%
4.0%
5.0%
6.0%
7.0%
8.0%
9.0%
Perce
nt V
acant
Delivered SF Absorption SF Vacancy
$20.70
$20.80
$20.90
$21.00
$21.10
$21.20
$21.30
2010 1q 2010 2q 2010 3q 2010 4q 2011 1q
Dollar
s/SF/Y
ear
0.00
0.05
0.10
0.15
0.20
0.25
0.30
0.35
0.40
2010 1q 2010 2q 2010 3q 2010 4q 2011 1q
Millio
ns
SF
Direct SF Sublet SF

46 THE COSTAR RETAIL REPORT ©2011 COSTAR GROUP, INC.
SOUTH FLORIDA – FIRST QUARTER 2011
South Florida Retail MarketMARKET HIGHLIGHTS – CLASS “A, B & C”
©2011 COSTAR GROUP, INC. THE COSTAR RETAIL REPORT 47
FIRST QUARTER 2011 – SOUTH FLORIDA
South Florida Retail MarketMARKET HIGHLIGHTS – CLASS “A, B & C”
K E N D A L L M A R K E T
Deliveries, Absorption & Vacancy Historical Analysis, All Classes
Source: CoStar Property®
Vacant Space Quoted Rental RatesHistorical Analysis, All Classes Historical Analysis, All Classes
Source: CoStar Property® Source: CoStar Property®
Net QuotedPeriod # Bldgs Total RBA Vacant SF Vacancy % Absorption # Bldgs Total RBA # Bldgs Total RBA Rates2011 1q 696 16,996,228 761,924 4.5% 44,593 0 0 0 0 $28.19
2010 4q 696 16,996,228 806,517 4.7% (20,078) 0 0 0 0 $28.04
2010 3q 696 16,996,228 786,439 4.6% 5,342 0 0 0 0 $26.58
2010 2q 696 16,996,228 791,781 4.7% 44,083 1 2,531 0 0 $26.68
2010 1q 695 16,993,697 833,333 4.9% (42,142) 1 5,170 1 2,531 $27.30
2009 4q 694 16,988,527 786,021 4.6% 332,017 1 309,051 2 7,701 $27.87
2009 3q 694 16,682,276 811,787 4.9% (20,845) 0 0 3 316,752 $28.97
2009 2q 694 16,682,276 790,942 4.7% (82,053) 1 9,697 1 309,051 $29.81
2009 1q 693 16,672,579 699,192 4.2% (123,491) 0 0 2 318,748 $31.28
2008 4q 693 16,672,579 575,701 3.5% 139,855 3 134,997 2 318,748 $33.67
2008 3q 690 16,537,582 580,559 3.5% 68,081 9 226,818 3 134,997 $34.04
2008 2q 681 16,310,764 421,822 2.6% 405,857 6 440,904 12 361,815 $32.39
2008 1q 675 15,869,860 386,775 2.4% (60,701) 3 97,490 18 802,719 $29.65
2007 4q 672 15,772,370 228,584 1.4% 45,164 0 0 14 725,265 $30.23
2007 3q 672 15,772,370 273,748 1.7% 100,868 1 67,370 10 639,967 $31.03
2007 2q 671 15,705,000 307,246 2.0% 23,385 1 14,820 7 575,989 $27.58
Source: CoStar Property®
UC InventoryDelivered InventoryExisting Inventory Vacancy
(0.200)
(0.100)
0.000
0.100
0.200
0.300
0.400
0.500
2008 1q 2008 2q 2008 3q 2008 4q 2009 1q 2009 2q 2009 3q 2009 4q 2010 1q 2010 2q 2010 3q 2010 4q 2011 1q
Millio
ns
SF
0.0%
1.0%
2.0%
3.0%
4.0%
5.0%
6.0%
Perce
nt V
acant
Delivered SF Absorption SF Vacancy
$25.50
$26.00
$26.50
$27.00
$27.50
$28.00
$28.50
2010 1q 2010 2q 2010 3q 2010 4q 2011 1q
Dollar
s/SF/Y
ear
0.70
0.72
0.74
0.76
0.78
0.80
0.82
0.84
2010 1q 2010 2q 2010 3q 2010 4q 2011 1q
Millio
ns
SF
Direct SF Sublet SF

48 THE COSTAR RETAIL REPORT ©2011 COSTAR GROUP, INC.
SOUTH FLORIDA – FIRST QUARTER 2011
South Florida Retail MarketMARKET HIGHLIGHTS – CLASS “A, B & C”
©2011 COSTAR GROUP, INC. THE COSTAR RETAIL REPORT 49
FIRST QUARTER 2011 – SOUTH FLORIDA
South Florida Retail MarketMARKET HIGHLIGHTS – CLASS “A, B & C”
M E D L E Y / H I A L E A H M A R K E T
Deliveries, Absorption & Vacancy Historical Analysis, All Classes
Source: CoStar Property®
Vacant Space Quoted Rental RatesHistorical Analysis, All Classes Historical Analysis, All Classes
Source: CoStar Property® Source: CoStar Property®
Net QuotedPeriod # Bldgs Total RBA Vacant SF Vacancy % Absorption # Bldgs Total RBA # Bldgs Total RBA Rates2011 1q 825 11,614,072 371,890 3.2% (8,061) 0 0 1 52,780 $19.73
2010 4q 825 11,614,072 363,829 3.1% (2,667) 0 0 1 52,780 $20.47
2010 3q 825 11,614,072 361,162 3.1% 20,904 0 0 1 52,780 $20.15
2010 2q 825 11,614,072 382,066 3.3% 61,451 0 0 0 0 $20.12
2010 1q 825 11,614,072 443,517 3.8% 36,033 0 0 0 0 $19.92
2009 4q 825 11,614,072 479,550 4.1% (42,134) 0 0 0 0 $19.33
2009 3q 825 11,614,072 437,416 3.8% (30,160) 1 1,800 0 0 $22.31
2009 2q 824 11,612,272 405,456 3.5% (39,990) 2 34,483 1 1,800 $23.15
2009 1q 822 11,577,789 330,983 2.9% 14,324 1 6,000 3 36,283 $25.08
2008 4q 821 11,571,789 339,307 2.9% (66,877) 0 0 3 40,483 $24.74
2008 3q 821 11,571,789 272,430 2.4% 114,775 2 161,774 2 32,819 $24.72
2008 2q 819 11,410,015 225,431 2.0% 49,339 1 7,403 3 167,774 $24.33
2008 1q 818 11,402,612 267,367 2.3% 5,434 2 71,494 4 175,177 $25.32
2007 4q 817 11,336,677 206,866 1.8% 569,920 9 547,959 3 216,468 $25.44
2007 3q 808 10,788,718 228,827 2.1% 35,169 0 0 12 764,427 $27.58
2007 2q 808 10,788,718 263,996 2.4% 83,391 0 0 11 760,933 $24.45
Source: CoStar Property®
UC InventoryDelivered InventoryExisting Inventory Vacancy
(0.100)
(0.050)
0.000
0.050
0.100
0.150
0.200
2008 1q 2008 2q 2008 3q 2008 4q 2009 1q 2009 2q 2009 3q 2009 4q 2010 1q 2010 2q 2010 3q 2010 4q 2011 1q
Millio
ns
SF
0.0%
0.5%
1.0%
1.5%
2.0%
2.5%
3.0%
3.5%
4.0%
4.5%
Perce
nt V
acant
Delivered SF Absorption SF Vacancy
$19.20
$19.40
$19.60
$19.80
$20.00
$20.20
$20.40
$20.60
2010 1q 2010 2q 2010 3q 2010 4q 2011 1q
Dollar
s/SF/Y
ear
0.00
0.05
0.10
0.15
0.20
0.25
0.30
0.35
0.40
0.45
0.50
2010 1q 2010 2q 2010 3q 2010 4q 2011 1q
Millio
ns
SF
Direct SF Sublet SF
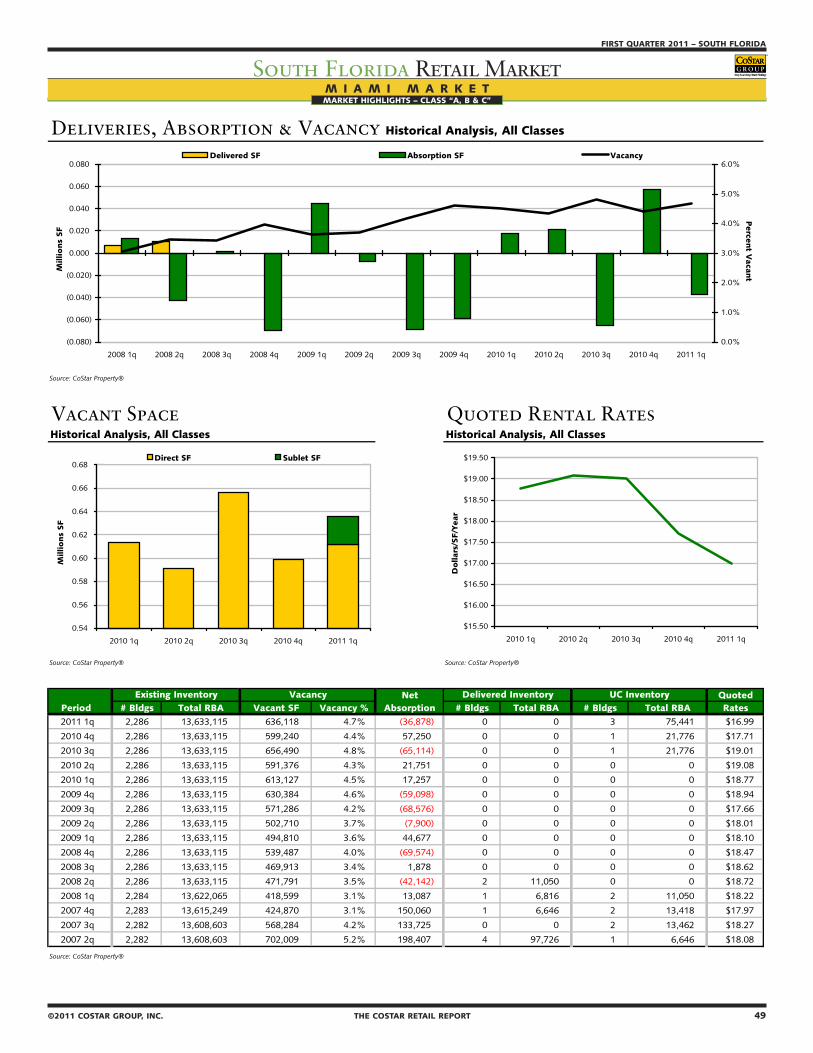
48 THE COSTAR RETAIL REPORT ©2011 COSTAR GROUP, INC.
SOUTH FLORIDA – FIRST QUARTER 2011
South Florida Retail MarketMARKET HIGHLIGHTS – CLASS “A, B & C”
©2011 COSTAR GROUP, INC. THE COSTAR RETAIL REPORT 49
FIRST QUARTER 2011 – SOUTH FLORIDA
South Florida Retail MarketMARKET HIGHLIGHTS – CLASS “A, B & C”M I A M I M A R K E T
Deliveries, Absorption & Vacancy Historical Analysis, All Classes
Source: CoStar Property®
Vacant Space Quoted Rental RatesHistorical Analysis, All Classes Historical Analysis, All Classes
Source: CoStar Property® Source: CoStar Property®
Net QuotedPeriod # Bldgs Total RBA Vacant SF Vacancy % Absorption # Bldgs Total RBA # Bldgs Total RBA Rates2011 1q 2,286 13,633,115 636,118 4.7% (36,878) 0 0 3 75,441 $16.99
2010 4q 2,286 13,633,115 599,240 4.4% 57,250 0 0 1 21,776 $17.71
2010 3q 2,286 13,633,115 656,490 4.8% (65,114) 0 0 1 21,776 $19.01
2010 2q 2,286 13,633,115 591,376 4.3% 21,751 0 0 0 0 $19.08
2010 1q 2,286 13,633,115 613,127 4.5% 17,257 0 0 0 0 $18.77
2009 4q 2,286 13,633,115 630,384 4.6% (59,098) 0 0 0 0 $18.94
2009 3q 2,286 13,633,115 571,286 4.2% (68,576) 0 0 0 0 $17.66
2009 2q 2,286 13,633,115 502,710 3.7% (7,900) 0 0 0 0 $18.01
2009 1q 2,286 13,633,115 494,810 3.6% 44,677 0 0 0 0 $18.10
2008 4q 2,286 13,633,115 539,487 4.0% (69,574) 0 0 0 0 $18.47
2008 3q 2,286 13,633,115 469,913 3.4% 1,878 0 0 0 0 $18.62
2008 2q 2,286 13,633,115 471,791 3.5% (42,142) 2 11,050 0 0 $18.72
2008 1q 2,284 13,622,065 418,599 3.1% 13,087 1 6,816 2 11,050 $18.22
2007 4q 2,283 13,615,249 424,870 3.1% 150,060 1 6,646 2 13,418 $17.97
2007 3q 2,282 13,608,603 568,284 4.2% 133,725 0 0 2 13,462 $18.27
2007 2q 2,282 13,608,603 702,009 5.2% 198,407 4 97,726 1 6,646 $18.08
Source: CoStar Property®
UC InventoryDelivered InventoryExisting Inventory Vacancy
(0.080)
(0.060)
(0.040)
(0.020)
0.000
0.020
0.040
0.060
0.080
2008 1q 2008 2q 2008 3q 2008 4q 2009 1q 2009 2q 2009 3q 2009 4q 2010 1q 2010 2q 2010 3q 2010 4q 2011 1q
Millio
ns
SF
0.0%
1.0%
2.0%
3.0%
4.0%
5.0%
6.0%
Perce
nt V
acant
Delivered SF Absorption SF Vacancy
$15.50
$16.00
$16.50
$17.00
$17.50
$18.00
$18.50
$19.00
$19.50
2010 1q 2010 2q 2010 3q 2010 4q 2011 1q
Dollar
s/SF/Y
ear
0.54
0.56
0.58
0.60
0.62
0.64
0.66
0.68
2010 1q 2010 2q 2010 3q 2010 4q 2011 1q
Millio
ns
SF
Direct SF Sublet SF

50 THE COSTAR RETAIL REPORT ©2011 COSTAR GROUP, INC.
SOUTH FLORIDA – FIRST QUARTER 2011
South Florida Retail MarketMARKET HIGHLIGHTS – CLASS “A, B & C”
©2011 COSTAR GROUP, INC. THE COSTAR RETAIL REPORT 51
FIRST QUARTER 2011 – SOUTH FLORIDA
South Florida Retail MarketMARKET HIGHLIGHTS – CLASS “A, B & C”
M I A M I A I R P O R T M A R K E T
Deliveries, Absorption & Vacancy Historical Analysis, All Classes
Source: CoStar Property®
Vacant Space Quoted Rental RatesHistorical Analysis, All Classes Historical Analysis, All Classes
Source: CoStar Property® Source: CoStar Property®
Net QuotedPeriod # Bldgs Total RBA Vacant SF Vacancy % Absorption # Bldgs Total RBA # Bldgs Total RBA Rates2011 1q 551 13,001,670 516,406 4.0% (13,632) 0 0 0 0 $20.14
2010 4q 551 13,001,670 502,774 3.9% 5,807 0 0 0 0 $20.46
2010 3q 551 13,001,670 508,581 3.9% (1,880) 0 0 0 0 $19.91
2010 2q 551 13,001,670 506,701 3.9% 21,609 0 0 0 0 $20.76
2010 1q 551 13,001,670 528,310 4.1% 31,681 1 13,000 0 0 $21.37
2009 4q 550 12,988,670 546,991 4.2% 24,989 0 0 1 13,000 $26.19
2009 3q 550 12,988,670 571,980 4.4% 21,319 0 0 1 13,000 $27.75
2009 2q 550 12,988,670 593,299 4.6% (13,178) 0 0 1 13,000 $27.79
2009 1q 550 12,988,670 580,121 4.5% (73,937) 0 0 0 0 $27.21
2008 4q 550 12,988,670 506,184 3.9% (66,955) 3 61,420 0 0 $26.92
2008 3q 547 12,927,250 377,809 2.9% (11,682) 0 0 3 61,420 $26.74
2008 2q 547 12,927,250 366,127 2.8% 116,051 4 211,843 3 61,420 $27.15
2008 1q 543 12,715,407 270,335 2.1% 60,766 4 66,514 4 211,843 $26.47
2007 4q 539 12,648,893 264,587 2.1% 46,831 0 0 8 278,357 $26.10
2007 3q 539 12,648,893 311,418 2.5% 16,153 0 0 7 272,557 $25.81
2007 2q 539 12,648,893 327,571 2.6% 20,143 0 0 5 221,447 $26.61
Source: CoStar Property®
UC InventoryDelivered InventoryExisting Inventory Vacancy
(0.100)
(0.050)
0.000
0.050
0.100
0.150
0.200
0.250
2008 1q 2008 2q 2008 3q 2008 4q 2009 1q 2009 2q 2009 3q 2009 4q 2010 1q 2010 2q 2010 3q 2010 4q 2011 1q
Millio
ns
SF
0.0%
0.5%
1.0%
1.5%
2.0%
2.5%
3.0%
3.5%
4.0%
4.5%
5.0%
Perce
nt V
acant
Delivered SF Absorption SF Vacancy
$19.00
$19.50
$20.00
$20.50
$21.00
$21.50
2010 1q 2010 2q 2010 3q 2010 4q 2011 1q
Dollar
s/SF/Y
ear
0.42
0.44
0.46
0.48
0.50
0.52
0.54
2010 1q 2010 2q 2010 3q 2010 4q 2011 1q
Millio
ns
SF
Direct SF Sublet SF

50 THE COSTAR RETAIL REPORT ©2011 COSTAR GROUP, INC.
SOUTH FLORIDA – FIRST QUARTER 2011
South Florida Retail MarketMARKET HIGHLIGHTS – CLASS “A, B & C”
©2011 COSTAR GROUP, INC. THE COSTAR RETAIL REPORT 51
FIRST QUARTER 2011 – SOUTH FLORIDA
South Florida Retail MarketMARKET HIGHLIGHTS – CLASS “A, B & C”
M I A M I B E A C H M A R K E T
Deliveries, Absorption & Vacancy Historical Analysis, All Classes
Source: CoStar Property®
Vacant Space Quoted Rental RatesHistorical Analysis, All Classes Historical Analysis, All Classes
Source: CoStar Property® Source: CoStar Property®
Net QuotedPeriod # Bldgs Total RBA Vacant SF Vacancy % Absorption # Bldgs Total RBA # Bldgs Total RBA Rates2011 1q 551 7,939,025 275,560 3.5% 10,194 0 0 1 8,006 $49.12
2010 4q 551 7,939,025 285,754 3.6% 1,594 0 0 0 0 $50.40
2010 3q 551 7,939,025 287,348 3.6% (1,730) 0 0 0 0 $58.54
2010 2q 551 7,939,025 285,618 3.6% (4,323) 0 0 0 0 $62.76
2010 1q 551 7,939,025 281,295 3.5% 56,162 0 0 0 0 $61.64
2009 4q 551 7,939,025 337,457 4.3% (32,965) 0 0 0 0 $61.43
2009 3q 551 7,939,025 304,492 3.8% 525,735 2 504,300 0 0 $55.20
2009 2q 549 7,434,725 325,927 4.4% 2,807 2 16,000 2 504,300 $56.88
2009 1q 547 7,418,725 312,734 4.2% (39,337) 0 0 4 520,300 $58.53
2008 4q 547 7,418,725 273,397 3.7% (2,310) 1 11,936 4 520,300 $55.26
2008 3q 546 7,406,789 259,151 3.5% 3,807 1 29,012 4 522,236 $49.09
2008 2q 545 7,377,777 233,946 3.2% 30,495 0 0 4 226,948 $55.08
2008 1q 545 7,377,777 264,441 3.6% (18,739) 0 0 3 220,948 $54.46
2007 4q 545 7,377,777 245,702 3.3% 1,326 0 0 1 180,000 $52.59
2007 3q 545 7,377,777 247,028 3.3% 66,206 0 0 1 180,000 $50.15
2007 2q 545 7,377,777 313,234 4.2% 161,250 1 4,445 0 0 $43.91
Source: CoStar Property®
UC InventoryDelivered InventoryExisting Inventory Vacancy
(0.100)
0.000
0.100
0.200
0.300
0.400
0.500
0.600
2008 1q 2008 2q 2008 3q 2008 4q 2009 1q 2009 2q 2009 3q 2009 4q 2010 1q 2010 2q 2010 3q 2010 4q 2011 1q
Millio
ns
SF
0.0%
0.5%
1.0%
1.5%
2.0%
2.5%
3.0%
3.5%
4.0%
4.5%
5.0%
Perce
nt V
acant
Delivered SF Absorption SF Vacancy
$0.00
$10.00
$20.00
$30.00
$40.00
$50.00
$60.00
$70.00
2010 1q 2010 2q 2010 3q 2010 4q 2011 1q
Dollar
s/SF/Y
ear
0.23
0.24
0.25
0.26
0.27
0.28
0.29
0.30
2010 1q 2010 2q 2010 3q 2010 4q 2011 1q
Millio
ns
SF
Direct SF Sublet SF
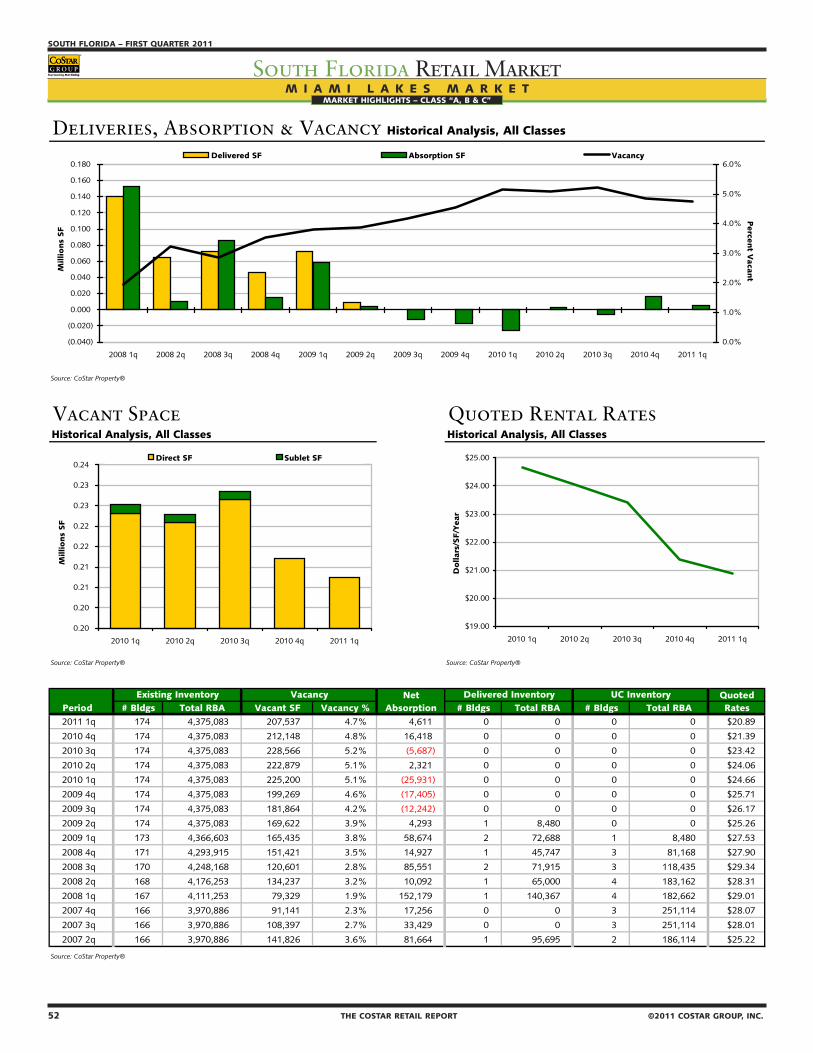
52 THE COSTAR RETAIL REPORT ©2011 COSTAR GROUP, INC.
SOUTH FLORIDA – FIRST QUARTER 2011
South Florida Retail MarketMARKET HIGHLIGHTS – CLASS “A, B & C”
©2011 COSTAR GROUP, INC. THE COSTAR RETAIL REPORT 53
FIRST QUARTER 2011 – SOUTH FLORIDA
South Florida Retail MarketMARKET HIGHLIGHTS – CLASS “A, B & C”
M I A M I L A K E S M A R K E T
Deliveries, Absorption & Vacancy Historical Analysis, All Classes
Source: CoStar Property®
Vacant Space Quoted Rental RatesHistorical Analysis, All Classes Historical Analysis, All Classes
Source: CoStar Property® Source: CoStar Property®
Net QuotedPeriod # Bldgs Total RBA Vacant SF Vacancy % Absorption # Bldgs Total RBA # Bldgs Total RBA Rates2011 1q 174 4,375,083 207,537 4.7% 4,611 0 0 0 0 $20.89
2010 4q 174 4,375,083 212,148 4.8% 16,418 0 0 0 0 $21.39
2010 3q 174 4,375,083 228,566 5.2% (5,687) 0 0 0 0 $23.42
2010 2q 174 4,375,083 222,879 5.1% 2,321 0 0 0 0 $24.06
2010 1q 174 4,375,083 225,200 5.1% (25,931) 0 0 0 0 $24.66
2009 4q 174 4,375,083 199,269 4.6% (17,405) 0 0 0 0 $25.71
2009 3q 174 4,375,083 181,864 4.2% (12,242) 0 0 0 0 $26.17
2009 2q 174 4,375,083 169,622 3.9% 4,293 1 8,480 0 0 $25.26
2009 1q 173 4,366,603 165,435 3.8% 58,674 2 72,688 1 8,480 $27.53
2008 4q 171 4,293,915 151,421 3.5% 14,927 1 45,747 3 81,168 $27.90
2008 3q 170 4,248,168 120,601 2.8% 85,551 2 71,915 3 118,435 $29.34
2008 2q 168 4,176,253 134,237 3.2% 10,092 1 65,000 4 183,162 $28.31
2008 1q 167 4,111,253 79,329 1.9% 152,179 1 140,367 4 182,662 $29.01
2007 4q 166 3,970,886 91,141 2.3% 17,256 0 0 3 251,114 $28.07
2007 3q 166 3,970,886 108,397 2.7% 33,429 0 0 3 251,114 $28.01
2007 2q 166 3,970,886 141,826 3.6% 81,664 1 95,695 2 186,114 $25.22
Source: CoStar Property®
UC InventoryDelivered InventoryExisting Inventory Vacancy
(0.040)
(0.020)
0.000
0.020
0.040
0.060
0.080
0.100
0.120
0.140
0.160
0.180
2008 1q 2008 2q 2008 3q 2008 4q 2009 1q 2009 2q 2009 3q 2009 4q 2010 1q 2010 2q 2010 3q 2010 4q 2011 1q
Millio
ns
SF
0.0%
1.0%
2.0%
3.0%
4.0%
5.0%
6.0%
Perce
nt V
acant
Delivered SF Absorption SF Vacancy
$19.00
$20.00
$21.00
$22.00
$23.00
$24.00
$25.00
2010 1q 2010 2q 2010 3q 2010 4q 2011 1q
Dollar
s/SF/Y
ear
0.20
0.20
0.21
0.21
0.22
0.22
0.23
0.23
0.24
2010 1q 2010 2q 2010 3q 2010 4q 2011 1q
Millio
ns
SF
Direct SF Sublet SF

52 THE COSTAR RETAIL REPORT ©2011 COSTAR GROUP, INC.
SOUTH FLORIDA – FIRST QUARTER 2011
South Florida Retail MarketMARKET HIGHLIGHTS – CLASS “A, B & C”
©2011 COSTAR GROUP, INC. THE COSTAR RETAIL REPORT 53
FIRST QUARTER 2011 – SOUTH FLORIDA
South Florida Retail MarketMARKET HIGHLIGHTS – CLASS “A, B & C”
M I A M I - D A D E C E N T R A L C O U N T Y M A R K E T
Deliveries, Absorption & Vacancy Historical Analysis, All Classes
Source: CoStar Property®
Vacant Space Quoted Rental RatesHistorical Analysis, All Classes Historical Analysis, All Classes
Source: CoStar Property® Source: CoStar Property®
Net QuotedPeriod # Bldgs Total RBA Vacant SF Vacancy % Absorption # Bldgs Total RBA # Bldgs Total RBA Rates2011 1q 319 2,560,516 232,783 9.1% 1,597 0 0 0 0 $14.88
2010 4q 319 2,560,516 234,380 9.2% 15,400 0 0 0 0 $15.05
2010 3q 319 2,560,516 249,780 9.8% 2,265 0 0 0 0 $14.91
2010 2q 319 2,560,516 252,045 9.8% (633) 0 0 0 0 $14.90
2010 1q 319 2,560,516 251,412 9.8% (25,630) 1 7,866 0 0 $14.77
2009 4q 318 2,552,650 217,916 8.5% (2,299) 0 0 1 7,866 $14.92
2009 3q 318 2,552,650 215,617 8.4% 18,947 0 0 1 7,866 $15.37
2009 2q 318 2,552,650 234,564 9.2% (42,047) 0 0 1 7,866 $15.31
2009 1q 318 2,552,650 192,517 7.5% (16,916) 0 0 1 7,866 $15.71
2008 4q 318 2,552,650 175,601 6.9% (37,476) 1 13,600 0 0 $15.37
2008 3q 317 2,539,050 124,525 4.9% 51,845 1 17,832 1 13,600 $15.82
2008 2q 316 2,521,218 158,538 6.3% (9,155) 0 0 1 17,832 $15.34
2008 1q 316 2,521,218 149,383 5.9% 32,513 2 47,810 1 17,832 $15.28
2007 4q 314 2,473,408 134,086 5.4% (23,086) 0 0 2 47,810 $14.54
2007 3q 315 2,544,544 182,136 7.2% (65,527) 0 0 2 47,810 $14.43
2007 2q 315 2,544,544 116,609 4.6% 9,000 0 0 1 20,810 $14.43
Source: CoStar Property®
UC InventoryDelivered InventoryExisting Inventory Vacancy
(0.060)
(0.040)
(0.020)
0.000
0.020
0.040
0.060
2008 1q 2008 2q 2008 3q 2008 4q 2009 1q 2009 2q 2009 3q 2009 4q 2010 1q 2010 2q 2010 3q 2010 4q 2011 1q
Millio
ns
SF
0.0%
2.0%
4.0%
6.0%
8.0%
10.0%
12.0%
Perce
nt V
acant
Delivered SF Absorption SF Vacancy
$14.60
$14.65
$14.70
$14.75
$14.80
$14.85
$14.90
$14.95
$15.00
$15.05
$15.10
2010 1q 2010 2q 2010 3q 2010 4q 2011 1q
Dollar
s/SF/Y
ear
0.22
0.23
0.23
0.24
0.24
0.25
0.25
0.26
2010 1q 2010 2q 2010 3q 2010 4q 2011 1q
Millio
ns
SF
Direct SF Sublet SF

54 THE COSTAR RETAIL REPORT ©2011 COSTAR GROUP, INC.
SOUTH FLORIDA – FIRST QUARTER 2011
South Florida Retail MarketMARKET HIGHLIGHTS – CLASS “A, B & C”
©2011 COSTAR GROUP, INC. THE COSTAR RETAIL REPORT 55
FIRST QUARTER 2011 – SOUTH FLORIDA
South Florida Retail MarketMARKET HIGHLIGHTS – CLASS “A, B & C”
N O R T H P A L M B E A C H M A R K E T
Deliveries, Absorption & Vacancy Historical Analysis, All Classes
Source: CoStar Property®
Vacant Space Quoted Rental RatesHistorical Analysis, All Classes Historical Analysis, All Classes
Source: CoStar Property® Source: CoStar Property®
Net QuotedPeriod # Bldgs Total RBA Vacant SF Vacancy % Absorption # Bldgs Total RBA # Bldgs Total RBA Rates2011 1q 700 11,692,211 830,636 7.1% 69,098 0 0 0 0 $16.17
2010 4q 700 11,692,211 899,734 7.7% 24,116 0 0 0 0 $16.40
2010 3q 700 11,692,211 923,850 7.9% (37,207) 0 0 0 0 $17.58
2010 2q 700 11,692,211 886,643 7.6% 41,057 0 0 0 0 $18.14
2010 1q 700 11,692,211 927,700 7.9% 550 1 41,000 0 0 $18.72
2009 4q 699 11,651,211 887,250 7.6% (55,910) 3 40,000 1 41,000 $20.09
2009 3q 696 11,611,211 791,340 6.8% (675) 1 24,212 4 81,000 $21.28
2009 2q 695 11,586,999 766,453 6.6% 50,185 0 0 5 105,212 $21.17
2009 1q 695 11,586,999 816,638 7.0% 234,315 2 305,932 1 41,000 $21.50
2008 4q 693 11,281,067 745,021 6.6% 101,147 5 121,603 2 305,932 $22.00
2008 3q 688 11,159,464 724,565 6.5% 2,092 2 55,824 7 427,535 $20.53
2008 2q 686 11,103,640 670,833 6.0% 51,356 0 0 8 478,565 $20.08
2008 1q 686 11,103,640 722,189 6.5% 331,888 11 225,204 4 21,850 $19.12
2007 4q 675 10,878,436 828,873 7.6% (128,760) 1 9,960 14 244,904 $19.12
2007 3q 674 10,868,476 690,153 6.4% (9,108) 0 0 15 254,864 $18.80
2007 2q 674 10,868,476 681,045 6.3% (112,159) 0 0 10 228,787 $19.58
Source: CoStar Property®
UC InventoryDelivered InventoryExisting Inventory Vacancy
(0.100)
(0.050)
0.000
0.050
0.100
0.150
0.200
0.250
0.300
0.350
0.400
2008 1q 2008 2q 2008 3q 2008 4q 2009 1q 2009 2q 2009 3q 2009 4q 2010 1q 2010 2q 2010 3q 2010 4q 2011 1q
Millio
ns
SF
0.0%
1.0%
2.0%
3.0%
4.0%
5.0%
6.0%
7.0%
8.0%
9.0%
Perce
nt V
acant
Delivered SF Absorption SF Vacancy
$14.50
$15.00
$15.50
$16.00
$16.50
$17.00
$17.50
$18.00
$18.50
$19.00
2010 1q 2010 2q 2010 3q 2010 4q 2011 1q
Dollar
s/SF/Y
ear
0.70
0.75
0.80
0.85
0.90
0.95
2010 1q 2010 2q 2010 3q 2010 4q 2011 1q
Millio
ns
SF
Direct SF Sublet SF

54 THE COSTAR RETAIL REPORT ©2011 COSTAR GROUP, INC.
SOUTH FLORIDA – FIRST QUARTER 2011
South Florida Retail MarketMARKET HIGHLIGHTS – CLASS “A, B & C”
©2011 COSTAR GROUP, INC. THE COSTAR RETAIL REPORT 55
FIRST QUARTER 2011 – SOUTH FLORIDA
South Florida Retail MarketMARKET HIGHLIGHTS – CLASS “A, B & C”
N O R T H E A S T D A D E M A R K E T
Deliveries, Absorption & Vacancy Historical Analysis, All Classes
Source: CoStar Property®
Vacant Space Quoted Rental RatesHistorical Analysis, All Classes Historical Analysis, All Classes
Source: CoStar Property® Source: CoStar Property®
Net QuotedPeriod # Bldgs Total RBA Vacant SF Vacancy % Absorption # Bldgs Total RBA # Bldgs Total RBA Rates2011 1q 1,066 10,849,893 503,083 4.6% 18,201 0 0 0 0 $19.20
2010 4q 1,067 10,854,481 525,872 4.8% 14,076 0 0 0 0 $18.74
2010 3q 1,067 10,854,481 539,948 5.0% 87,383 0 0 0 0 $19.06
2010 2q 1,067 10,854,481 627,331 5.8% 15,813 1 14,550 0 0 $19.35
2010 1q 1,066 10,839,931 628,594 5.8% 15,161 0 0 1 14,550 $18.50
2009 4q 1,066 10,839,931 643,755 5.9% 8,152 0 0 1 14,550 $18.87
2009 3q 1,066 10,839,931 651,907 6.0% (83,086) 0 0 0 0 $19.68
2009 2q 1,066 10,839,931 568,821 5.2% (151,144) 0 0 0 0 $20.21
2009 1q 1,067 10,841,252 418,998 3.9% (36,736) 0 0 0 0 $19.88
2008 4q 1,067 10,841,252 382,262 3.5% 4,652 1 2,200 0 0 $21.01
2008 3q 1,066 10,839,052 384,714 3.5% (117,478) 1 7,000 1 2,200 $20.57
2008 2q 1,065 10,832,052 260,236 2.4% (993) 0 0 2 9,200 $22.26
2008 1q 1,065 10,832,052 259,243 2.4% (15,320) 0 0 1 7,000 $23.44
2007 4q 1,065 10,832,052 243,923 2.3% 23,912 0 0 0 0 $23.75
2007 3q 1,065 10,832,052 267,835 2.5% 89,920 2 41,762 0 0 $21.53
2007 2q 1,063 10,790,290 315,993 2.9% (14,983) 1 3,285 2 41,762 $21.46
Source: CoStar Property®
UC InventoryDelivered InventoryExisting Inventory Vacancy
(0.200)
(0.150)
(0.100)
(0.050)
0.000
0.050
0.100
2008 1q 2008 2q 2008 3q 2008 4q 2009 1q 2009 2q 2009 3q 2009 4q 2010 1q 2010 2q 2010 3q 2010 4q 2011 1q
Millio
ns
SF
0.0%
1.0%
2.0%
3.0%
4.0%
5.0%
6.0%
7.0%
Perce
nt V
acant
Delivered SF Absorption SF Vacancy
$18.00
$18.20
$18.40
$18.60
$18.80
$19.00
$19.20
$19.40
$19.60
2010 1q 2010 2q 2010 3q 2010 4q 2011 1q
Dollar
s/SF/Y
ear
0.00
0.10
0.20
0.30
0.40
0.50
0.60
0.70
2010 1q 2010 2q 2010 3q 2010 4q 2011 1q
Millio
ns
SF
Direct SF Sublet SF

56 THE COSTAR RETAIL REPORT ©2011 COSTAR GROUP, INC.
SOUTH FLORIDA – FIRST QUARTER 2011
South Florida Retail MarketMARKET HIGHLIGHTS – CLASS “A, B & C”
©2011 COSTAR GROUP, INC. THE COSTAR RETAIL REPORT 57
FIRST QUARTER 2011 – SOUTH FLORIDA
South Florida Retail MarketMARKET HIGHLIGHTS – CLASS “A, B & C”
N W B R O W A R D / C O R A L S P R I N G S M A R K E T
Deliveries, Absorption & Vacancy Historical Analysis, All Classes
Source: CoStar Property®
Vacant Space Quoted Rental RatesHistorical Analysis, All Classes Historical Analysis, All Classes
Source: CoStar Property® Source: CoStar Property®
Net QuotedPeriod # Bldgs Total RBA Vacant SF Vacancy % Absorption # Bldgs Total RBA # Bldgs Total RBA Rates2011 1q 533 11,516,535 1,182,414 10.3% 18,088 0 0 0 0 $16.07
2010 4q 533 11,516,535 1,200,502 10.4% (71,346) 0 0 0 0 $17.47
2010 3q 533 11,516,535 1,129,156 9.8% (6,446) 1 14,820 0 0 $18.68
2010 2q 533 11,507,877 1,114,052 9.7% 62,592 0 0 1 14,820 $18.78
2010 1q 533 11,507,877 1,176,644 10.2% 123,073 0 0 1 14,820 $18.09
2009 4q 533 11,507,877 1,299,717 11.3% (9,588) 0 0 0 0 $18.24
2009 3q 533 11,507,877 1,290,129 11.2% 186 1 7,708 0 0 $18.61
2009 2q 532 11,500,169 1,282,607 11.2% (317,193) 0 0 1 7,708 $19.26
2009 1q 532 11,500,169 965,414 8.4% (140,534) 0 0 1 7,708 $20.11
2008 4q 532 11,500,169 824,880 7.2% (147,121) 0 0 0 0 $20.47
2008 3q 532 11,500,169 677,759 5.9% 3,127 3 129,061 0 0 $19.98
2008 2q 529 11,371,108 551,825 4.9% (80,936) 0 0 3 129,061 $21.66
2008 1q 529 11,371,108 470,889 4.1% 101,524 6 149,041 3 129,061 $21.20
2007 4q 523 11,222,067 423,372 3.8% (6,918) 2 49,599 7 230,990 $20.01
2007 3q 522 11,176,168 370,555 3.3% 294,742 1 307,266 9 280,589 $19.45
2007 2q 521 10,868,902 358,031 3.3% (70,323) 2 18,574 7 553,112 $19.30
Source: CoStar Property®
UC InventoryDelivered InventoryExisting Inventory Vacancy
(0.400)
(0.300)
(0.200)
(0.100)
0.000
0.100
0.200
2008 1q 2008 2q 2008 3q 2008 4q 2009 1q 2009 2q 2009 3q 2009 4q 2010 1q 2010 2q 2010 3q 2010 4q 2011 1q
Millio
ns
SF
0.0%
2.0%
4.0%
6.0%
8.0%
10.0%
12.0%
Perce
nt V
acant
Delivered SF Absorption SF Vacancy
$14.50
$15.00
$15.50
$16.00
$16.50
$17.00
$17.50
$18.00
$18.50
$19.00
2010 1q 2010 2q 2010 3q 2010 4q 2011 1q
Dollar
s/SF/Y
ear
1.00
1.02
1.04
1.06
1.08
1.10
1.12
1.14
1.16
1.18
1.20
1.22
2010 1q 2010 2q 2010 3q 2010 4q 2011 1q
Millio
ns
SF
Direct SF Sublet SF

56 THE COSTAR RETAIL REPORT ©2011 COSTAR GROUP, INC.
SOUTH FLORIDA – FIRST QUARTER 2011
South Florida Retail MarketMARKET HIGHLIGHTS – CLASS “A, B & C”
©2011 COSTAR GROUP, INC. THE COSTAR RETAIL REPORT 57
FIRST QUARTER 2011 – SOUTH FLORIDA
South Florida Retail MarketMARKET HIGHLIGHTS – CLASS “A, B & C”
O U T L Y I N G B R O W A R D C O U N T Y M A R K E T
Deliveries, Absorption & Vacancy Historical Analysis, All Classes
Source: CoStar Property®
Vacant Space Quoted Rental RatesHistorical Analysis, All Classes Historical Analysis, All Classes
Source: CoStar Property® Source: CoStar Property®
Net QuotedPeriod # Bldgs Total RBA Vacant SF Vacancy % Absorption # Bldgs Total RBA # Bldgs Total RBA Rates2011 1q 122 2,700,987 218,698 8.1% 1,501 1 6,359 0 0 $19.29
2010 4q 121 2,694,628 213,840 7.9% 15,543 1 7,100 1 6,359 $19.89
2010 3q 120 2,687,528 222,283 8.3% 32,964 0 0 2 13,459 $19.80
2010 2q 120 2,687,528 255,247 9.5% 2,970 0 0 1 7,100 $19.34
2010 1q 120 2,687,528 258,217 9.6% (3,830) 0 0 1 7,100 $19.61
2009 4q 120 2,687,528 254,387 9.5% (6,000) 0 0 0 0 $23.20
2009 3q 120 2,687,528 248,387 9.2% (7,122) 0 0 0 0 $26.25
2009 2q 120 2,687,528 241,265 9.0% (61,342) 0 0 0 0 $28.26
2009 1q 120 2,687,528 179,923 6.7% (14,225) 0 0 0 0 $29.96
2008 4q 120 2,687,528 165,698 6.2% (10,235) 0 0 0 0 $30.27
2008 3q 120 2,687,528 155,463 5.8% 128,274 12 173,105 0 0 $33.15
2008 2q 108 2,514,423 110,632 4.4% 191,085 1 174,059 12 173,105 $34.04
2008 1q 107 2,340,364 127,658 5.5% 79,048 2 141,257 13 347,164 $34.70
2007 4q 105 2,199,107 65,449 3.0% 3,126 0 0 5 372,868 $36.37
2007 3q 105 2,199,107 68,575 3.1% 31,402 1 40,350 4 322,868 $36.83
2007 2q 104 2,158,757 59,627 2.8% 6,922 1 8,620 4 189,159 $36.98
Source: CoStar Property®
UC InventoryDelivered InventoryExisting Inventory Vacancy
(0.100)
(0.050)
0.000
0.050
0.100
0.150
0.200
0.250
2008 1q 2008 2q 2008 3q 2008 4q 2009 1q 2009 2q 2009 3q 2009 4q 2010 1q 2010 2q 2010 3q 2010 4q 2011 1q
Millio
ns
SF
0.0%
2.0%
4.0%
6.0%
8.0%
10.0%
12.0%
Perce
nt V
acant
Delivered SF Absorption SF Vacancy
$18.90
$19.00
$19.10
$19.20
$19.30
$19.40
$19.50
$19.60
$19.70
$19.80
$19.90
$20.00
2010 1q 2010 2q 2010 3q 2010 4q 2011 1q
Dollar
s/SF/Y
ear
0.00
0.05
0.10
0.15
0.20
0.25
0.30
2010 1q 2010 2q 2010 3q 2010 4q 2011 1q
Millio
ns
SF
Direct SF Sublet SF

58 THE COSTAR RETAIL REPORT ©2011 COSTAR GROUP, INC.
SOUTH FLORIDA – FIRST QUARTER 2011
South Florida Retail MarketMARKET HIGHLIGHTS – CLASS “A, B & C”
©2011 COSTAR GROUP, INC. THE COSTAR RETAIL REPORT 59
FIRST QUARTER 2011 – SOUTH FLORIDA
South Florida Retail MarketMARKET HIGHLIGHTS – CLASS “A, B & C”
O U T L Y I N G M I A M I - D A D E C N T Y M A R K E T
Deliveries, Absorption & Vacancy Historical Analysis, All Classes
Source: CoStar Property®
Vacant Space Quoted Rental RatesHistorical Analysis, All Classes Historical Analysis, All Classes
Source: CoStar Property® Source: CoStar Property®
Net QuotedPeriod # Bldgs Total RBA Vacant SF Vacancy % Absorption # Bldgs Total RBA # Bldgs Total RBA Rates2011 1q 21 318,237 49,878 15.7% 0 0 0 0 0 $21.26
2010 4q 21 318,237 49,878 15.7% 400 0 0 0 0 $21.36
2010 3q 21 318,237 50,278 15.8% (386) 0 0 0 0 $21.36
2010 2q 21 318,237 49,892 15.7% (1,716) 0 0 0 0 $21.34
2010 1q 21 318,237 48,176 15.1% (1,000) 0 0 0 0 $21.24
2009 4q 21 318,237 47,176 14.8% 49,830 0 0 0 0 $21.11
2009 3q 21 318,237 97,006 30.5% (13,230) 0 0 0 0 $21.19
2009 2q 21 318,237 83,776 26.3% 7,700 0 0 0 0 $22.17
2009 1q 21 318,237 91,476 28.7% 724 1 56,000 0 0 $22.14
2008 4q 20 262,237 36,200 13.8% 7,000 0 0 1 56,000 $22.14
2008 3q 20 262,237 43,200 16.5% 6,800 0 0 1 56,000 $20.20
2008 2q 20 262,237 50,000 19.1% (3,200) 0 0 1 56,000 $20.18
2008 1q 20 262,237 46,800 17.8% 0 0 0 0 0 $24.56
2007 4q 20 262,237 46,800 17.8% (5,300) 0 0 0 0 $24.56
2007 3q 20 262,237 41,500 15.8% 10,950 1 50,000 0 0 $25.00
2007 2q 19 212,237 2,450 1.2% 1,200 0 0 1 50,000 $25.00
Source: CoStar Property®
UC InventoryDelivered InventoryExisting Inventory Vacancy
(0.020)
(0.010)
0.000
0.010
0.020
0.030
0.040
0.050
0.060
2008 1q 2008 2q 2008 3q 2008 4q 2009 1q 2009 2q 2009 3q 2009 4q 2010 1q 2010 2q 2010 3q 2010 4q 2011 1q
Millio
ns
SF
0.0%
5.0%
10.0%
15.0%
20.0%
25.0%
30.0%
35.0%
Perce
nt V
acant
Delivered SF Absorption SF Vacancy
$21.16
$21.18
$21.20
$21.22
$21.24
$21.26
$21.28
$21.30
$21.32
$21.34
$21.36
$21.38
2010 1q 2010 2q 2010 3q 2010 4q 2011 1q
Dollar
s/SF/Y
ear
0.05
0.05
0.05
0.05
0.05
0.05
0.05
0.05
2010 1q 2010 2q 2010 3q 2010 4q 2011 1q
Millio
ns
SF
Direct SF Sublet SF

58 THE COSTAR RETAIL REPORT ©2011 COSTAR GROUP, INC.
SOUTH FLORIDA – FIRST QUARTER 2011
South Florida Retail MarketMARKET HIGHLIGHTS – CLASS “A, B & C”
©2011 COSTAR GROUP, INC. THE COSTAR RETAIL REPORT 59
FIRST QUARTER 2011 – SOUTH FLORIDA
South Florida Retail MarketMARKET HIGHLIGHTS – CLASS “A, B & C”
P A L M B E A C H M A R K E T
Deliveries, Absorption & Vacancy Historical Analysis, All Classes
Source: CoStar Property®
Vacant Space Quoted Rental RatesHistorical Analysis, All Classes Historical Analysis, All Classes
Source: CoStar Property® Source: CoStar Property®
Net QuotedPeriod # Bldgs Total RBA Vacant SF Vacancy % Absorption # Bldgs Total RBA # Bldgs Total RBA Rates2011 1q 212 4,638,133 434,481 9.4% 3,337 0 0 0 0 $22.59
2010 4q 212 4,638,133 437,818 9.4% (43,906) 1 16,925 0 0 $23.87
2010 3q 211 4,621,208 376,987 8.2% 25,169 2 29,340 1 16,925 $24.64
2010 2q 209 4,591,868 372,816 8.1% 48,160 0 0 2 29,340 $26.66
2010 1q 209 4,591,868 420,976 9.2% (71,838) 0 0 2 29,340 $27.13
2009 4q 209 4,591,868 349,138 7.6% (10,337) 0 0 0 0 $27.22
2009 3q 209 4,591,868 338,801 7.4% (34,422) 0 0 0 0 $27.00
2009 2q 209 4,591,868 304,379 6.6% 8,406 1 7,934 0 0 $25.83
2009 1q 208 4,583,934 304,851 6.7% (54,327) 0 0 1 7,934 $20.76
2008 4q 208 4,583,934 250,524 5.5% (52,791) 0 0 1 7,934 $21.77
2008 3q 208 4,583,934 197,733 4.3% (17,397) 1 4,000 0 0 $20.67
2008 2q 207 4,579,934 176,336 3.9% (25,724) 0 0 1 4,000 $20.47
2008 1q 207 4,579,934 150,612 3.3% (8,740) 0 0 1 4,000 $24.35
2007 4q 207 4,579,934 141,872 3.1% (3,837) 0 0 0 0 $23.24
2007 3q 207 4,579,934 138,035 3.0% (6,570) 0 0 0 0 $23.20
2007 2q 207 4,579,934 131,465 2.9% 31,254 0 0 0 0 $19.24
Source: CoStar Property®
UC InventoryDelivered InventoryExisting Inventory Vacancy
(0.080)
(0.060)
(0.040)
(0.020)
0.000
0.020
0.040
0.060
2008 1q 2008 2q 2008 3q 2008 4q 2009 1q 2009 2q 2009 3q 2009 4q 2010 1q 2010 2q 2010 3q 2010 4q 2011 1q
Millio
ns
SF
0.0%
1.0%
2.0%
3.0%
4.0%
5.0%
6.0%
7.0%
8.0%
9.0%
10.0%
Perce
nt V
acant
Delivered SF Absorption SF Vacancy
$0.00
$5.00
$10.00
$15.00
$20.00
$25.00
$30.00
2010 1q 2010 2q 2010 3q 2010 4q 2011 1q
Dollar
s/SF/Y
ear
0.34
0.36
0.38
0.40
0.42
0.44
0.46
2010 1q 2010 2q 2010 3q 2010 4q 2011 1q
Millio
ns
SF
Direct SF Sublet SF
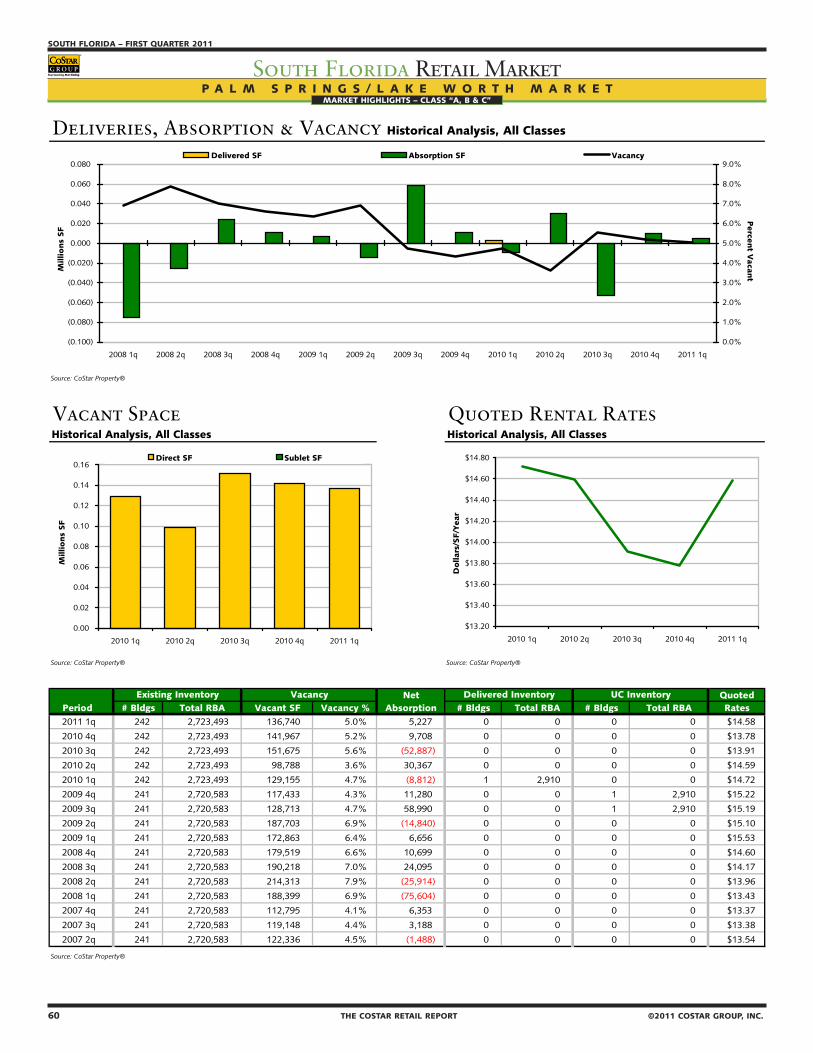
60 THE COSTAR RETAIL REPORT ©2011 COSTAR GROUP, INC.
SOUTH FLORIDA – FIRST QUARTER 2011
South Florida Retail MarketMARKET HIGHLIGHTS – CLASS “A, B & C”
©2011 COSTAR GROUP, INC. THE COSTAR RETAIL REPORT 61
FIRST QUARTER 2011 – SOUTH FLORIDA
South Florida Retail MarketMARKET HIGHLIGHTS – CLASS “A, B & C”
P A L M S P R I N G S / L A K E W O R T H M A R K E T
Deliveries, Absorption & Vacancy Historical Analysis, All Classes
Source: CoStar Property®
Vacant Space Quoted Rental RatesHistorical Analysis, All Classes Historical Analysis, All Classes
Source: CoStar Property® Source: CoStar Property®
Net QuotedPeriod # Bldgs Total RBA Vacant SF Vacancy % Absorption # Bldgs Total RBA # Bldgs Total RBA Rates2011 1q 242 2,723,493 136,740 5.0% 5,227 0 0 0 0 $14.58
2010 4q 242 2,723,493 141,967 5.2% 9,708 0 0 0 0 $13.78
2010 3q 242 2,723,493 151,675 5.6% (52,887) 0 0 0 0 $13.91
2010 2q 242 2,723,493 98,788 3.6% 30,367 0 0 0 0 $14.59
2010 1q 242 2,723,493 129,155 4.7% (8,812) 1 2,910 0 0 $14.72
2009 4q 241 2,720,583 117,433 4.3% 11,280 0 0 1 2,910 $15.22
2009 3q 241 2,720,583 128,713 4.7% 58,990 0 0 1 2,910 $15.19
2009 2q 241 2,720,583 187,703 6.9% (14,840) 0 0 0 0 $15.10
2009 1q 241 2,720,583 172,863 6.4% 6,656 0 0 0 0 $15.53
2008 4q 241 2,720,583 179,519 6.6% 10,699 0 0 0 0 $14.60
2008 3q 241 2,720,583 190,218 7.0% 24,095 0 0 0 0 $14.17
2008 2q 241 2,720,583 214,313 7.9% (25,914) 0 0 0 0 $13.96
2008 1q 241 2,720,583 188,399 6.9% (75,604) 0 0 0 0 $13.43
2007 4q 241 2,720,583 112,795 4.1% 6,353 0 0 0 0 $13.37
2007 3q 241 2,720,583 119,148 4.4% 3,188 0 0 0 0 $13.38
2007 2q 241 2,720,583 122,336 4.5% (1,488) 0 0 0 0 $13.54
Source: CoStar Property®
UC InventoryDelivered InventoryExisting Inventory Vacancy
(0.100)
(0.080)
(0.060)
(0.040)
(0.020)
0.000
0.020
0.040
0.060
0.080
2008 1q 2008 2q 2008 3q 2008 4q 2009 1q 2009 2q 2009 3q 2009 4q 2010 1q 2010 2q 2010 3q 2010 4q 2011 1q
Millio
ns
SF
0.0%
1.0%
2.0%
3.0%
4.0%
5.0%
6.0%
7.0%
8.0%
9.0%
Perce
nt V
acant
Delivered SF Absorption SF Vacancy
$13.20
$13.40
$13.60
$13.80
$14.00
$14.20
$14.40
$14.60
$14.80
2010 1q 2010 2q 2010 3q 2010 4q 2011 1q
Dollar
s/SF/Y
ear
0.00
0.02
0.04
0.06
0.08
0.10
0.12
0.14
0.16
2010 1q 2010 2q 2010 3q 2010 4q 2011 1q
Millio
ns
SF
Direct SF Sublet SF

60 THE COSTAR RETAIL REPORT ©2011 COSTAR GROUP, INC.
SOUTH FLORIDA – FIRST QUARTER 2011
South Florida Retail MarketMARKET HIGHLIGHTS – CLASS “A, B & C”
©2011 COSTAR GROUP, INC. THE COSTAR RETAIL REPORT 61
FIRST QUARTER 2011 – SOUTH FLORIDA
South Florida Retail MarketMARKET HIGHLIGHTS – CLASS “A, B & C”
P L A N T A T I O N M A R K E T
Deliveries, Absorption & Vacancy Historical Analysis, All Classes
Source: CoStar Property®
Vacant Space Quoted Rental RatesHistorical Analysis, All Classes Historical Analysis, All Classes
Source: CoStar Property® Source: CoStar Property®
Net QuotedPeriod # Bldgs Total RBA Vacant SF Vacancy % Absorption # Bldgs Total RBA # Bldgs Total RBA Rates2011 1q 546 12,823,770 1,840,290 14.4% (49,145) 0 0 0 0 $15.48
2010 4q 546 12,823,770 1,791,145 14.0% (105,411) 0 0 0 0 $14.66
2010 3q 546 12,823,770 1,685,734 13.1% (7,823) 0 0 0 0 $14.94
2010 2q 546 12,823,770 1,677,911 13.1% (26,883) 0 0 0 0 $14.93
2010 1q 546 12,823,770 1,651,028 12.9% (9,531) 0 0 0 0 $15.52
2009 4q 546 12,823,770 1,641,497 12.8% 74,863 0 0 0 0 $16.25
2009 3q 546 12,823,770 1,716,360 13.4% 5,017 2 113,060 0 0 $17.07
2009 2q 544 12,710,710 1,608,317 12.7% (130,965) 0 0 2 113,060 $17.02
2009 1q 544 12,710,710 1,477,352 11.6% (188,309) 0 0 2 113,060 $17.71
2008 4q 544 12,710,710 1,289,043 10.1% (66,181) 2 34,900 0 0 $17.60
2008 3q 542 12,675,810 1,187,962 9.4% (113,347) 1 26,992 2 34,900 $17.94
2008 2q 541 12,648,818 1,047,623 8.3% (583,536) 0 0 3 61,892 $18.19
2008 1q 541 12,648,818 464,087 3.7% (50,693) 2 42,875 1 26,992 $17.44
2007 4q 539 12,605,943 370,519 2.9% 65,398 1 4,898 2 42,875 $17.13
2007 3q 538 12,601,045 431,019 3.4% 26,647 0 0 3 47,773 $17.27
2007 2q 538 12,601,045 457,666 3.6% (23,348) 0 0 1 4,898 $17.76
Source: CoStar Property®
UC InventoryDelivered InventoryExisting Inventory Vacancy
(0.700)
(0.600)
(0.500)
(0.400)
(0.300)
(0.200)
(0.100)
0.000
0.100
0.200
2008 1q 2008 2q 2008 3q 2008 4q 2009 1q 2009 2q 2009 3q 2009 4q 2010 1q 2010 2q 2010 3q 2010 4q 2011 1q
Millio
ns
SF
0.0%
2.0%
4.0%
6.0%
8.0%
10.0%
12.0%
14.0%
16.0%
Perce
nt V
acant
Delivered SF Absorption SF Vacancy
$14.20
$14.40
$14.60
$14.80
$15.00
$15.20
$15.40
$15.60
2010 1q 2010 2q 2010 3q 2010 4q 2011 1q
Dollar
s/SF/Y
ear
1.50
1.55
1.60
1.65
1.70
1.75
1.80
1.85
1.90
2010 1q 2010 2q 2010 3q 2010 4q 2011 1q
Millio
ns
SF
Direct SF Sublet SF

62 THE COSTAR RETAIL REPORT ©2011 COSTAR GROUP, INC.
SOUTH FLORIDA – FIRST QUARTER 2011
South Florida Retail MarketMARKET HIGHLIGHTS – CLASS “A, B & C”
©2011 COSTAR GROUP, INC. THE COSTAR RETAIL REPORT 63
FIRST QUARTER 2011 – SOUTH FLORIDA
South Florida Retail MarketMARKET HIGHLIGHTS – CLASS “A, B & C”
P O M P A N O B E A C H M A R K E T
Deliveries, Absorption & Vacancy Historical Analysis, All Classes
Source: CoStar Property®
Vacant Space Quoted Rental RatesHistorical Analysis, All Classes Historical Analysis, All Classes
Source: CoStar Property® Source: CoStar Property®
Net QuotedPeriod # Bldgs Total RBA Vacant SF Vacancy % Absorption # Bldgs Total RBA # Bldgs Total RBA Rates2011 1q 1,083 16,991,481 1,195,456 7.0% (46,382) 2 15,337 0 0 $18.06
2010 4q 1,081 16,976,144 1,133,737 6.7% 24,912 2 20,995 2 15,337 $17.93
2010 3q 1,079 16,955,149 1,137,654 6.7% 61,198 0 0 4 36,332 $18.12
2010 2q 1,079 16,955,149 1,198,852 7.1% (1,445) 1 16,270 3 31,451 $17.34
2010 1q 1,078 16,938,879 1,181,137 7.0% (37,201) 1 8,300 1 16,270 $17.34
2009 4q 1,077 16,930,579 1,135,636 6.7% (49,516) 0 0 2 24,570 $17.79
2009 3q 1,077 16,930,579 1,086,120 6.4% (76,559) 1 4,146 1 8,300 $18.24
2009 2q 1,076 16,926,433 1,005,415 5.9% (111,847) 0 0 2 12,446 $17.31
2009 1q 1,076 16,926,433 893,568 5.3% 114,513 1 50,031 2 12,446 $17.10
2008 4q 1,075 16,876,402 958,050 5.7% 269,653 9 413,801 3 62,477 $17.01
2008 3q 1,066 16,462,601 813,902 4.9% 4,572 2 35,210 11 472,132 $17.33
2008 2q 1,064 16,427,391 783,264 4.8% (74,010) 1 10,500 10 208,862 $17.82
2008 1q 1,063 16,416,891 698,754 4.3% 122,046 3 214,928 11 219,362 $18.97
2007 4q 1,061 16,221,830 625,739 3.9% 33,387 4 63,546 11 390,780 $18.83
2007 3q 1,057 16,158,284 595,580 3.7% 82,252 4 55,080 15 454,326 $18.52
2007 2q 1,053 16,103,204 622,752 3.9% 6,051 4 40,869 18 503,228 $18.08
Source: CoStar Property®
UC InventoryDelivered InventoryExisting Inventory Vacancy
(0.200)
(0.100)
0.000
0.100
0.200
0.300
0.400
0.500
2008 1q 2008 2q 2008 3q 2008 4q 2009 1q 2009 2q 2009 3q 2009 4q 2010 1q 2010 2q 2010 3q 2010 4q 2011 1q
Millio
ns
SF
0.0%
1.0%
2.0%
3.0%
4.0%
5.0%
6.0%
7.0%
8.0%
Perce
nt V
acant
Delivered SF Absorption SF Vacancy
$16.80
$17.00
$17.20
$17.40
$17.60
$17.80
$18.00
$18.20
2010 1q 2010 2q 2010 3q 2010 4q 2011 1q
Dollar
s/SF/Y
ear
1.04
1.06
1.08
1.10
1.12
1.14
1.16
1.18
1.20
1.22
2010 1q 2010 2q 2010 3q 2010 4q 2011 1q
Millio
ns
SF
Direct SF Sublet SF
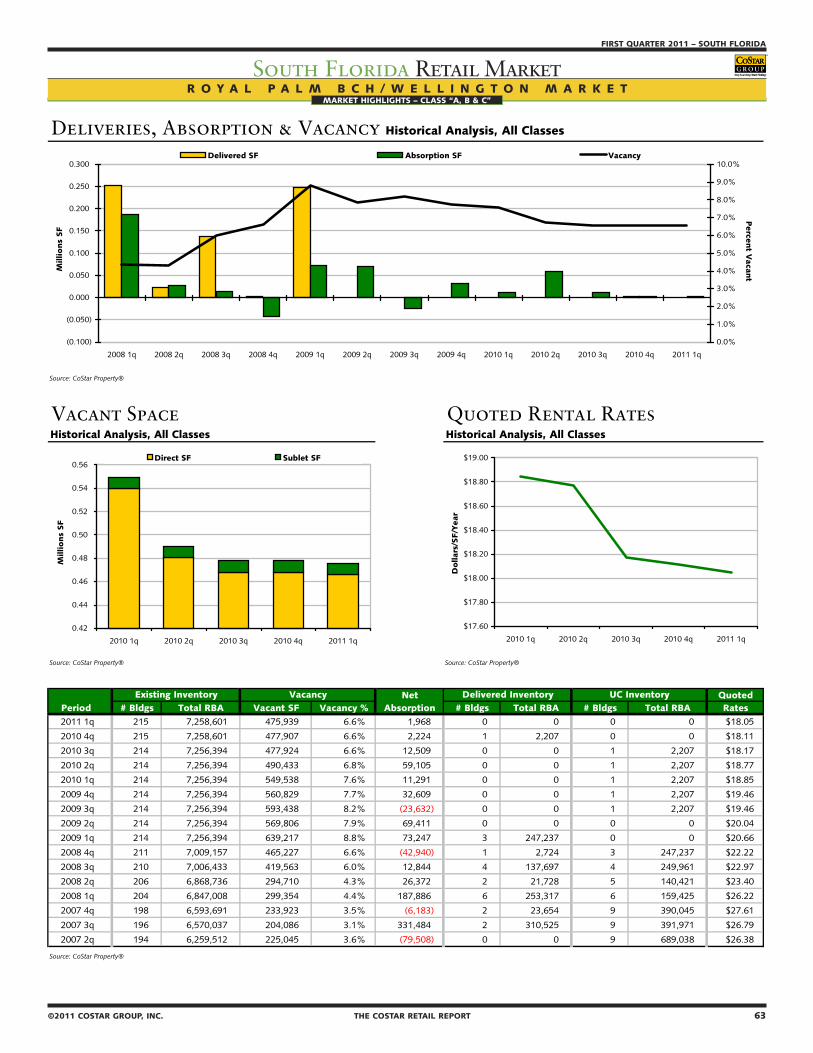
62 THE COSTAR RETAIL REPORT ©2011 COSTAR GROUP, INC.
SOUTH FLORIDA – FIRST QUARTER 2011
South Florida Retail MarketMARKET HIGHLIGHTS – CLASS “A, B & C”
©2011 COSTAR GROUP, INC. THE COSTAR RETAIL REPORT 63
FIRST QUARTER 2011 – SOUTH FLORIDA
South Florida Retail MarketMARKET HIGHLIGHTS – CLASS “A, B & C”
R O Y A L P A L M B C H / W E L L I N G T O N M A R K E T
Deliveries, Absorption & Vacancy Historical Analysis, All Classes
Source: CoStar Property®
Vacant Space Quoted Rental RatesHistorical Analysis, All Classes Historical Analysis, All Classes
Source: CoStar Property® Source: CoStar Property®
Net QuotedPeriod # Bldgs Total RBA Vacant SF Vacancy % Absorption # Bldgs Total RBA # Bldgs Total RBA Rates2011 1q 215 7,258,601 475,939 6.6% 1,968 0 0 0 0 $18.05
2010 4q 215 7,258,601 477,907 6.6% 2,224 1 2,207 0 0 $18.11
2010 3q 214 7,256,394 477,924 6.6% 12,509 0 0 1 2,207 $18.17
2010 2q 214 7,256,394 490,433 6.8% 59,105 0 0 1 2,207 $18.77
2010 1q 214 7,256,394 549,538 7.6% 11,291 0 0 1 2,207 $18.85
2009 4q 214 7,256,394 560,829 7.7% 32,609 0 0 1 2,207 $19.46
2009 3q 214 7,256,394 593,438 8.2% (23,632) 0 0 1 2,207 $19.46
2009 2q 214 7,256,394 569,806 7.9% 69,411 0 0 0 0 $20.04
2009 1q 214 7,256,394 639,217 8.8% 73,247 3 247,237 0 0 $20.66
2008 4q 211 7,009,157 465,227 6.6% (42,940) 1 2,724 3 247,237 $22.22
2008 3q 210 7,006,433 419,563 6.0% 12,844 4 137,697 4 249,961 $22.97
2008 2q 206 6,868,736 294,710 4.3% 26,372 2 21,728 5 140,421 $23.40
2008 1q 204 6,847,008 299,354 4.4% 187,886 6 253,317 6 159,425 $26.22
2007 4q 198 6,593,691 233,923 3.5% (6,183) 2 23,654 9 390,045 $27.61
2007 3q 196 6,570,037 204,086 3.1% 331,484 2 310,525 9 391,971 $26.79
2007 2q 194 6,259,512 225,045 3.6% (79,508) 0 0 9 689,038 $26.38
Source: CoStar Property®
UC InventoryDelivered InventoryExisting Inventory Vacancy
(0.100)
(0.050)
0.000
0.050
0.100
0.150
0.200
0.250
0.300
2008 1q 2008 2q 2008 3q 2008 4q 2009 1q 2009 2q 2009 3q 2009 4q 2010 1q 2010 2q 2010 3q 2010 4q 2011 1q
Millio
ns
SF
0.0%
1.0%
2.0%
3.0%
4.0%
5.0%
6.0%
7.0%
8.0%
9.0%
10.0%
Perce
nt V
acant
Delivered SF Absorption SF Vacancy
$17.60
$17.80
$18.00
$18.20
$18.40
$18.60
$18.80
$19.00
2010 1q 2010 2q 2010 3q 2010 4q 2011 1q
Dollar
s/SF/Y
ear
0.42
0.44
0.46
0.48
0.50
0.52
0.54
0.56
2010 1q 2010 2q 2010 3q 2010 4q 2011 1q
Millio
ns
SF
Direct SF Sublet SF
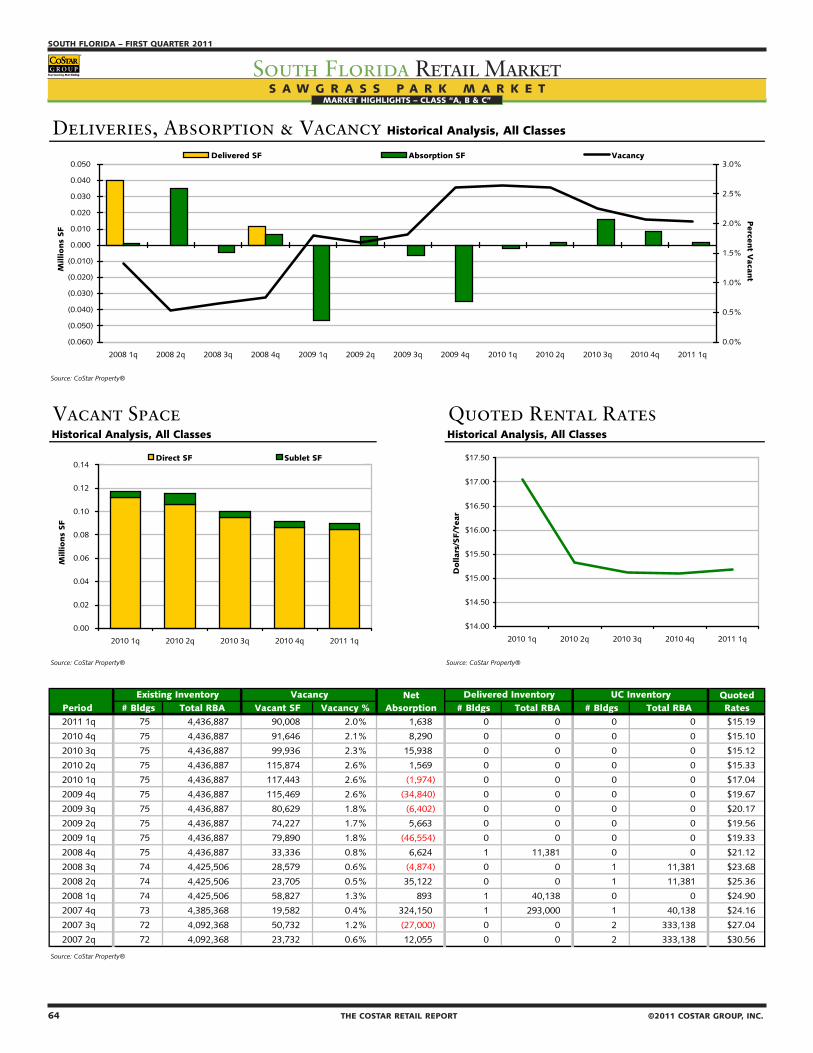
64 THE COSTAR RETAIL REPORT ©2011 COSTAR GROUP, INC.
SOUTH FLORIDA – FIRST QUARTER 2011
South Florida Retail MarketMARKET HIGHLIGHTS – CLASS “A, B & C”
©2011 COSTAR GROUP, INC. THE COSTAR RETAIL REPORT 65
FIRST QUARTER 2011 – SOUTH FLORIDA
South Florida Retail MarketMARKET HIGHLIGHTS – CLASS “A, B & C”
S A W G R A S S P A R K M A R K E T
Deliveries, Absorption & Vacancy Historical Analysis, All Classes
Source: CoStar Property®
Vacant Space Quoted Rental RatesHistorical Analysis, All Classes Historical Analysis, All Classes
Source: CoStar Property® Source: CoStar Property®
Net QuotedPeriod # Bldgs Total RBA Vacant SF Vacancy % Absorption # Bldgs Total RBA # Bldgs Total RBA Rates2011 1q 75 4,436,887 90,008 2.0% 1,638 0 0 0 0 $15.19
2010 4q 75 4,436,887 91,646 2.1% 8,290 0 0 0 0 $15.10
2010 3q 75 4,436,887 99,936 2.3% 15,938 0 0 0 0 $15.12
2010 2q 75 4,436,887 115,874 2.6% 1,569 0 0 0 0 $15.33
2010 1q 75 4,436,887 117,443 2.6% (1,974) 0 0 0 0 $17.04
2009 4q 75 4,436,887 115,469 2.6% (34,840) 0 0 0 0 $19.67
2009 3q 75 4,436,887 80,629 1.8% (6,402) 0 0 0 0 $20.17
2009 2q 75 4,436,887 74,227 1.7% 5,663 0 0 0 0 $19.56
2009 1q 75 4,436,887 79,890 1.8% (46,554) 0 0 0 0 $19.33
2008 4q 75 4,436,887 33,336 0.8% 6,624 1 11,381 0 0 $21.12
2008 3q 74 4,425,506 28,579 0.6% (4,874) 0 0 1 11,381 $23.68
2008 2q 74 4,425,506 23,705 0.5% 35,122 0 0 1 11,381 $25.36
2008 1q 74 4,425,506 58,827 1.3% 893 1 40,138 0 0 $24.90
2007 4q 73 4,385,368 19,582 0.4% 324,150 1 293,000 1 40,138 $24.16
2007 3q 72 4,092,368 50,732 1.2% (27,000) 0 0 2 333,138 $27.04
2007 2q 72 4,092,368 23,732 0.6% 12,055 0 0 2 333,138 $30.56
Source: CoStar Property®
UC InventoryDelivered InventoryExisting Inventory Vacancy
(0.060)
(0.050)
(0.040)
(0.030)
(0.020)
(0.010)
0.000
0.010
0.020
0.030
0.040
0.050
2008 1q 2008 2q 2008 3q 2008 4q 2009 1q 2009 2q 2009 3q 2009 4q 2010 1q 2010 2q 2010 3q 2010 4q 2011 1q
Millio
ns
SF
0.0%
0.5%
1.0%
1.5%
2.0%
2.5%
3.0%
Perce
nt V
acant
Delivered SF Absorption SF Vacancy
$14.00
$14.50
$15.00
$15.50
$16.00
$16.50
$17.00
$17.50
2010 1q 2010 2q 2010 3q 2010 4q 2011 1q
Dollar
s/SF/Y
ear
0.00
0.02
0.04
0.06
0.08
0.10
0.12
0.14
2010 1q 2010 2q 2010 3q 2010 4q 2011 1q
Millio
ns
SF
Direct SF Sublet SF
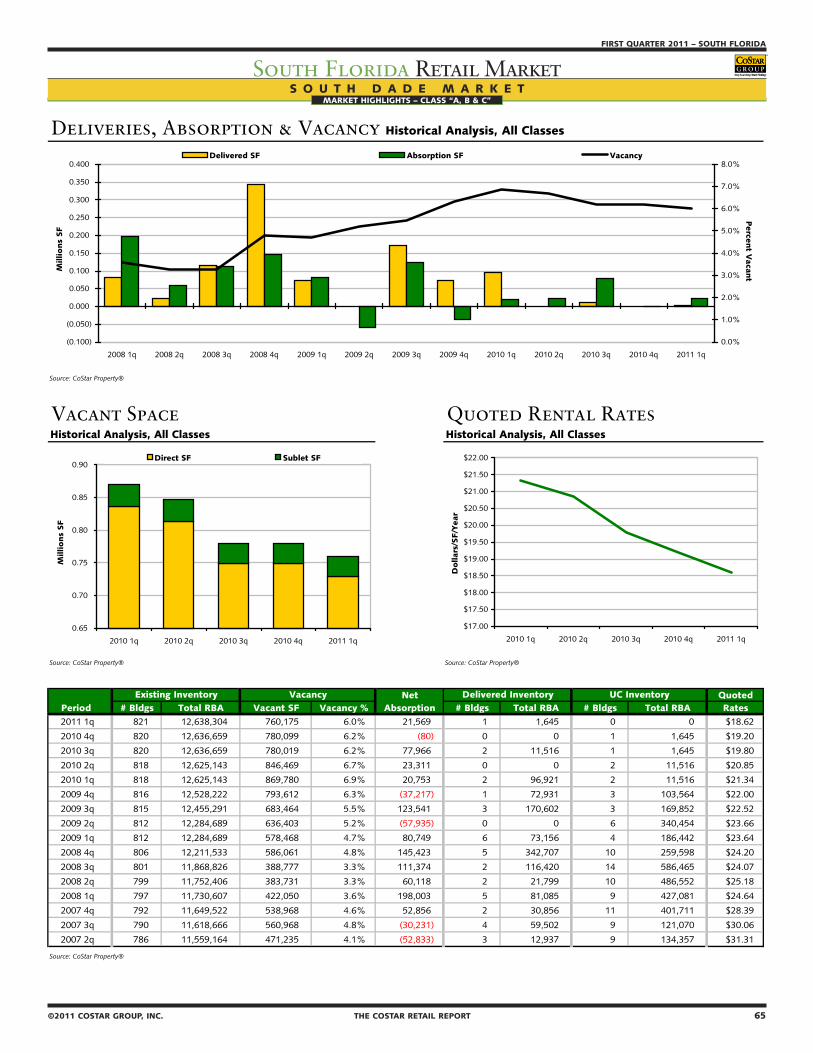
64 THE COSTAR RETAIL REPORT ©2011 COSTAR GROUP, INC.
SOUTH FLORIDA – FIRST QUARTER 2011
South Florida Retail MarketMARKET HIGHLIGHTS – CLASS “A, B & C”
©2011 COSTAR GROUP, INC. THE COSTAR RETAIL REPORT 65
FIRST QUARTER 2011 – SOUTH FLORIDA
South Florida Retail MarketMARKET HIGHLIGHTS – CLASS “A, B & C”
S O U T H D A D E M A R K E T
Deliveries, Absorption & Vacancy Historical Analysis, All Classes
Source: CoStar Property®
Vacant Space Quoted Rental RatesHistorical Analysis, All Classes Historical Analysis, All Classes
Source: CoStar Property® Source: CoStar Property®
Net QuotedPeriod # Bldgs Total RBA Vacant SF Vacancy % Absorption # Bldgs Total RBA # Bldgs Total RBA Rates2011 1q 821 12,638,304 760,175 6.0% 21,569 1 1,645 0 0 $18.62
2010 4q 820 12,636,659 780,099 6.2% (80) 0 0 1 1,645 $19.20
2010 3q 820 12,636,659 780,019 6.2% 77,966 2 11,516 1 1,645 $19.80
2010 2q 818 12,625,143 846,469 6.7% 23,311 0 0 2 11,516 $20.85
2010 1q 818 12,625,143 869,780 6.9% 20,753 2 96,921 2 11,516 $21.34
2009 4q 816 12,528,222 793,612 6.3% (37,217) 1 72,931 3 103,564 $22.00
2009 3q 815 12,455,291 683,464 5.5% 123,541 3 170,602 3 169,852 $22.52
2009 2q 812 12,284,689 636,403 5.2% (57,935) 0 0 6 340,454 $23.66
2009 1q 812 12,284,689 578,468 4.7% 80,749 6 73,156 4 186,442 $23.64
2008 4q 806 12,211,533 586,061 4.8% 145,423 5 342,707 10 259,598 $24.20
2008 3q 801 11,868,826 388,777 3.3% 111,374 2 116,420 14 586,465 $24.07
2008 2q 799 11,752,406 383,731 3.3% 60,118 2 21,799 10 486,552 $25.18
2008 1q 797 11,730,607 422,050 3.6% 198,003 5 81,085 9 427,081 $24.64
2007 4q 792 11,649,522 538,968 4.6% 52,856 2 30,856 11 401,711 $28.39
2007 3q 790 11,618,666 560,968 4.8% (30,231) 4 59,502 9 121,070 $30.06
2007 2q 786 11,559,164 471,235 4.1% (52,833) 3 12,937 9 134,357 $31.31
Source: CoStar Property®
UC InventoryDelivered InventoryExisting Inventory Vacancy
(0.100)
(0.050)
0.000
0.050
0.100
0.150
0.200
0.250
0.300
0.350
0.400
2008 1q 2008 2q 2008 3q 2008 4q 2009 1q 2009 2q 2009 3q 2009 4q 2010 1q 2010 2q 2010 3q 2010 4q 2011 1q
Millio
ns
SF
0.0%
1.0%
2.0%
3.0%
4.0%
5.0%
6.0%
7.0%
8.0%
Perce
nt V
acant
Delivered SF Absorption SF Vacancy
$17.00
$17.50
$18.00
$18.50
$19.00
$19.50
$20.00
$20.50
$21.00
$21.50
$22.00
2010 1q 2010 2q 2010 3q 2010 4q 2011 1q
Dollar
s/SF/Y
ear
0.65
0.70
0.75
0.80
0.85
0.90
2010 1q 2010 2q 2010 3q 2010 4q 2011 1q
Millio
ns
SF
Direct SF Sublet SF

66 THE COSTAR RETAIL REPORT ©2011 COSTAR GROUP, INC.
SOUTH FLORIDA – FIRST QUARTER 2011
South Florida Retail MarketMARKET HIGHLIGHTS – CLASS “A, B & C”
©2011 COSTAR GROUP, INC. THE COSTAR RETAIL REPORT 67
FIRST QUARTER 2011 – SOUTH FLORIDA
South Florida Retail MarketMARKET HIGHLIGHTS – CLASS “A, B & C”
S O U T H W E S T B R O W A R D M A R K E T
Deliveries, Absorption & Vacancy Historical Analysis, All Classes
Source: CoStar Property®
Vacant Space Quoted Rental RatesHistorical Analysis, All Classes Historical Analysis, All Classes
Source: CoStar Property® Source: CoStar Property®
Net QuotedPeriod # Bldgs Total RBA Vacant SF Vacancy % Absorption # Bldgs Total RBA # Bldgs Total RBA Rates2011 1q 517 15,004,902 960,139 6.4% 38,111 0 0 0 0 $20.38
2010 4q 517 15,004,902 998,250 6.7% (30,358) 0 0 0 0 $20.99
2010 3q 517 15,004,902 967,892 6.5% 54,998 0 0 0 0 $21.11
2010 2q 517 15,004,902 1,022,890 6.8% (33,646) 0 0 0 0 $21.11
2010 1q 517 15,004,902 989,244 6.6% 32,309 0 0 0 0 $21.59
2009 4q 517 15,004,902 1,021,553 6.8% (12,794) 0 0 0 0 $22.72
2009 3q 517 15,004,902 1,008,759 6.7% 84,666 1 32,169 0 0 $22.83
2009 2q 516 14,972,733 1,061,256 7.1% 25,484 1 12,179 1 32,169 $23.29
2009 1q 515 14,960,554 1,074,561 7.2% (98,362) 3 39,103 2 44,348 $22.30
2008 4q 512 14,921,451 937,096 6.3% 169,801 9 431,083 4 51,282 $24.01
2008 3q 503 14,490,368 675,814 4.7% 5,248 1 98,305 12 470,186 $23.45
2008 2q 502 14,392,063 582,757 4.0% 133,700 1 13,614 12 553,941 $25.00
2008 1q 501 14,378,449 702,843 4.9% 179,824 5 425,526 9 488,829 $23.94
2007 4q 496 13,952,923 457,141 3.3% 42,546 3 44,534 11 810,821 $23.58
2007 3q 493 13,908,389 455,153 3.3% 7,444 2 30,376 8 470,060 $23.82
2007 2q 491 13,878,013 432,221 3.1% 4,638 4 33,862 6 474,910 $23.88
Source: CoStar Property®
UC InventoryDelivered InventoryExisting Inventory Vacancy
(0.200)
(0.100)
0.000
0.100
0.200
0.300
0.400
0.500
2008 1q 2008 2q 2008 3q 2008 4q 2009 1q 2009 2q 2009 3q 2009 4q 2010 1q 2010 2q 2010 3q 2010 4q 2011 1q
Millio
ns
SF
0.0%
1.0%
2.0%
3.0%
4.0%
5.0%
6.0%
7.0%
8.0%
Perce
nt V
acant
Delivered SF Absorption SF Vacancy
$19.60
$19.80
$20.00
$20.20
$20.40
$20.60
$20.80
$21.00
$21.20
$21.40
$21.60
$21.80
2010 1q 2010 2q 2010 3q 2010 4q 2011 1q
Dollar
s/SF/Y
ear
0.90
0.92
0.94
0.96
0.98
1.00
1.02
1.04
2010 1q 2010 2q 2010 3q 2010 4q 2011 1q
Millio
ns
SF
Direct SF Sublet SF

66 THE COSTAR RETAIL REPORT ©2011 COSTAR GROUP, INC.
SOUTH FLORIDA – FIRST QUARTER 2011
South Florida Retail MarketMARKET HIGHLIGHTS – CLASS “A, B & C”
©2011 COSTAR GROUP, INC. THE COSTAR RETAIL REPORT 67
FIRST QUARTER 2011 – SOUTH FLORIDA
South Florida Retail MarketMARKET HIGHLIGHTS – CLASS “A, B & C”
W E S T M I A M I M A R K E T
Deliveries, Absorption & Vacancy Historical Analysis, All Classes
Source: CoStar Property®
Vacant Space Quoted Rental RatesHistorical Analysis, All Classes Historical Analysis, All Classes
Source: CoStar Property® Source: CoStar Property®
Net QuotedPeriod # Bldgs Total RBA Vacant SF Vacancy % Absorption # Bldgs Total RBA # Bldgs Total RBA Rates2011 1q 645 6,602,023 160,856 2.4% 29,109 0 0 0 0 $26.84
2010 4q 645 6,602,023 189,965 2.9% 9,235 0 0 0 0 $26.21
2010 3q 645 6,602,023 199,200 3.0% (14,853) 0 0 0 0 $25.30
2010 2q 645 6,602,023 184,347 2.8% 23,931 0 0 0 0 $23.42
2010 1q 645 6,602,023 208,278 3.2% 4,166 0 0 0 0 $23.18
2009 4q 645 6,602,023 212,444 3.2% 92,705 1 91,300 0 0 $25.64
2009 3q 644 6,510,723 213,849 3.3% (10,193) 0 0 1 91,300 $25.18
2009 2q 644 6,510,723 203,656 3.1% (15,009) 0 0 1 91,300 $28.04
2009 1q 644 6,510,723 188,647 2.9% 21,441 0 0 1 91,300 $28.20
2008 4q 644 6,510,723 210,088 3.2% 10,042 1 5,966 0 0 $25.10
2008 3q 643 6,504,757 214,164 3.3% (38,902) 0 0 1 5,966 $25.94
2008 2q 643 6,504,757 175,262 2.7% (46,016) 0 0 1 5,966 $24.25
2008 1q 643 6,504,757 129,246 2.0% 14,958 2 19,265 1 5,966 $25.62
2007 4q 641 6,485,492 124,939 1.9% 27,104 0 0 2 19,265 $26.51
2007 3q 641 6,485,492 152,043 2.3% (21,327) 0 0 2 19,265 $27.02
2007 2q 641 6,485,492 130,716 2.0% (1,623) 0 0 2 19,265 $26.62
Source: CoStar Property®
UC InventoryDelivered InventoryExisting Inventory Vacancy
(0.060)
(0.040)
(0.020)
0.000
0.020
0.040
0.060
0.080
0.100
2008 1q 2008 2q 2008 3q 2008 4q 2009 1q 2009 2q 2009 3q 2009 4q 2010 1q 2010 2q 2010 3q 2010 4q 2011 1q
Millio
ns
SF
0.0%
0.5%
1.0%
1.5%
2.0%
2.5%
3.0%
3.5%
Perce
nt V
acant
Delivered SF Absorption SF Vacancy
$21.00
$22.00
$23.00
$24.00
$25.00
$26.00
$27.00
$28.00
2010 1q 2010 2q 2010 3q 2010 4q 2011 1q
Dollar
s/SF/Y
ear
0.00
0.05
0.10
0.15
0.20
0.25
2010 1q 2010 2q 2010 3q 2010 4q 2011 1q
Millio
ns
SF
Direct SF Sublet SF
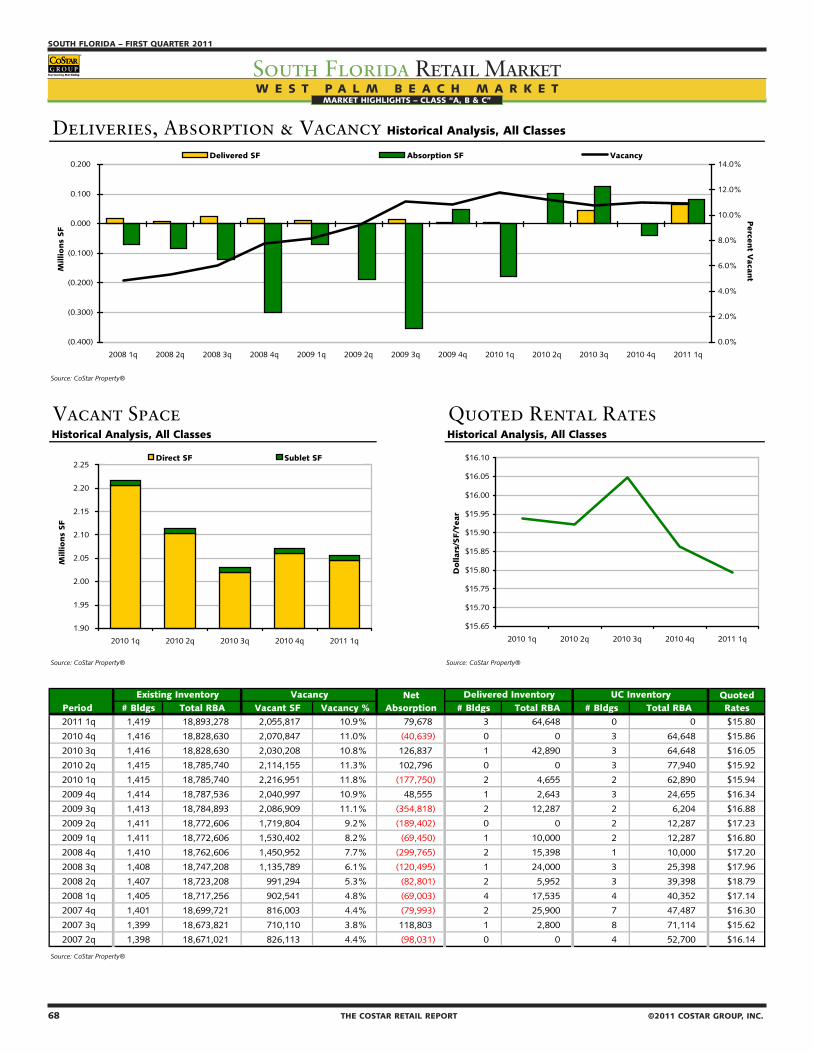
68 THE COSTAR RETAIL REPORT ©2011 COSTAR GROUP, INC.
SOUTH FLORIDA – FIRST QUARTER 2011
South Florida Retail MarketMARKET HIGHLIGHTS – CLASS “A, B & C”
W E S T P A L M B E A C H M A R K E T
Deliveries, Absorption & Vacancy Historical Analysis, All Classes
Source: CoStar Property®
Vacant Space Quoted Rental RatesHistorical Analysis, All Classes Historical Analysis, All Classes
Source: CoStar Property® Source: CoStar Property®
Net QuotedPeriod # Bldgs Total RBA Vacant SF Vacancy % Absorption # Bldgs Total RBA # Bldgs Total RBA Rates2011 1q 1,419 18,893,278 2,055,817 10.9% 79,678 3 64,648 0 0 $15.80
2010 4q 1,416 18,828,630 2,070,847 11.0% (40,639) 0 0 3 64,648 $15.86
2010 3q 1,416 18,828,630 2,030,208 10.8% 126,837 1 42,890 3 64,648 $16.05
2010 2q 1,415 18,785,740 2,114,155 11.3% 102,796 0 0 3 77,940 $15.92
2010 1q 1,415 18,785,740 2,216,951 11.8% (177,750) 2 4,655 2 62,890 $15.94
2009 4q 1,414 18,787,536 2,040,997 10.9% 48,555 1 2,643 3 24,655 $16.34
2009 3q 1,413 18,784,893 2,086,909 11.1% (354,818) 2 12,287 2 6,204 $16.88
2009 2q 1,411 18,772,606 1,719,804 9.2% (189,402) 0 0 2 12,287 $17.23
2009 1q 1,411 18,772,606 1,530,402 8.2% (69,450) 1 10,000 2 12,287 $16.80
2008 4q 1,410 18,762,606 1,450,952 7.7% (299,765) 2 15,398 1 10,000 $17.20
2008 3q 1,408 18,747,208 1,135,789 6.1% (120,495) 1 24,000 3 25,398 $17.96
2008 2q 1,407 18,723,208 991,294 5.3% (82,801) 2 5,952 3 39,398 $18.79
2008 1q 1,405 18,717,256 902,541 4.8% (69,003) 4 17,535 4 40,352 $17.14
2007 4q 1,401 18,699,721 816,003 4.4% (79,993) 2 25,900 7 47,487 $16.30
2007 3q 1,399 18,673,821 710,110 3.8% 118,803 1 2,800 8 71,114 $15.62
2007 2q 1,398 18,671,021 826,113 4.4% (98,031) 0 0 4 52,700 $16.14
Source: CoStar Property®
UC InventoryDelivered InventoryExisting Inventory Vacancy
(0.400)
(0.300)
(0.200)
(0.100)
0.000
0.100
0.200
2008 1q 2008 2q 2008 3q 2008 4q 2009 1q 2009 2q 2009 3q 2009 4q 2010 1q 2010 2q 2010 3q 2010 4q 2011 1q
Millio
ns
SF
0.0%
2.0%
4.0%
6.0%
8.0%
10.0%
12.0%
14.0%
Perce
nt V
acant
Delivered SF Absorption SF Vacancy
$15.65
$15.70
$15.75
$15.80
$15.85
$15.90
$15.95
$16.00
$16.05
$16.10
2010 1q 2010 2q 2010 3q 2010 4q 2011 1q
Dollar
s/SF/Y
ear
1.90
1.95
2.00
2.05
2.10
2.15
2.20
2.25
2010 1q 2010 2q 2010 3q 2010 4q 2011 1q
Millio
ns
SF
Direct SF Sublet SF