Costa Group Holdings Limited – Annual Report...
104
Costa Group Holdings Limited Strength in Diversity Annual Report 2017
Transcript of Costa Group Holdings Limited – Annual Report...
Costa Group Holdings Limited
Strength in Diversity
Annual Report 2017
Co
sta G
rou
p H
old
ing
s Limite
d – A
nnu
al Re
po
rt 2017
Contents
02 Chairman’s Report
04 Managing Director’s Review
06 Company Profile
10 Harvest Calendar
12 Sustainability Report
23 Directors’ Report
48 Auditor’s Independence Declaration
49 Consolidated Statement of Profit and Loss and Other Comprehensive Income
50 Consolidated Statement of Financial Position
51 Consolidated Statement of Changes in Equity
52 Consolidated Statement of Cash Flows
53 Notes to the Consolidated Financial Report
91 Directors’ Declaration
92 Independent Auditor’s Report
98 Shareholder Information
100 Corporate Directory
Corporate Governance StatementCosta Group’s 2017 Corporate Governance Statement is located at http://investors.costagroup.com.au/investor-centre/?page=corporate-governance
Costa is Australia’s leading grower, packer and marketer of premium quality fresh fruit and vegetables.
Costa Group Holdings Limited ABN 68 151 363 129
Costa Group Holdings Limited – Annual Report 2017 01
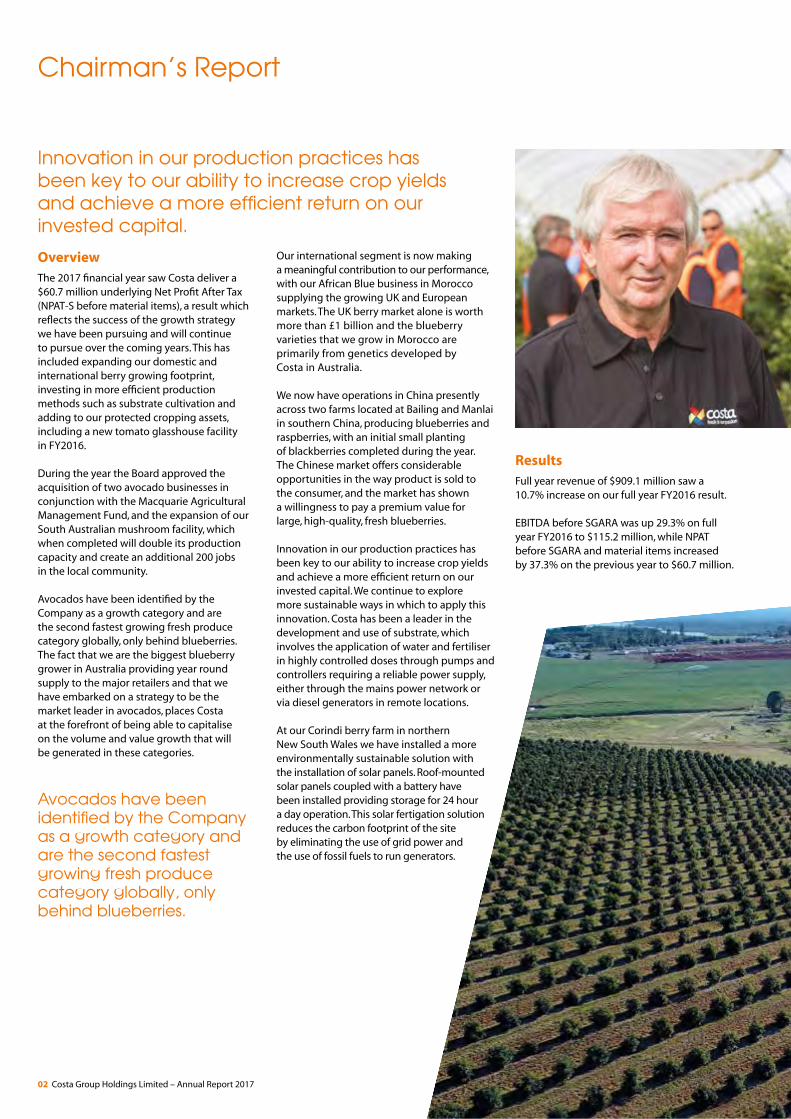
Chairman’s Report
OverviewThe 2017 financial year saw Costa deliver a $60.7 million underlying Net Profit After Tax (NPAT-S before material items), a result which reflects the success of the growth strategy we have been pursuing and will continue to pursue over the coming years. This has included expanding our domestic and international berry growing footprint, investing in more efficient production methods such as substrate cultivation and adding to our protected cropping assets, including a new tomato glasshouse facility in FY2016.
During the year the Board approved the acquisition of two avocado businesses in conjunction with the Macquarie Agricultural Management Fund, and the expansion of our South Australian mushroom facility, which when completed will double its production capacity and create an additional 200 jobs in the local community.
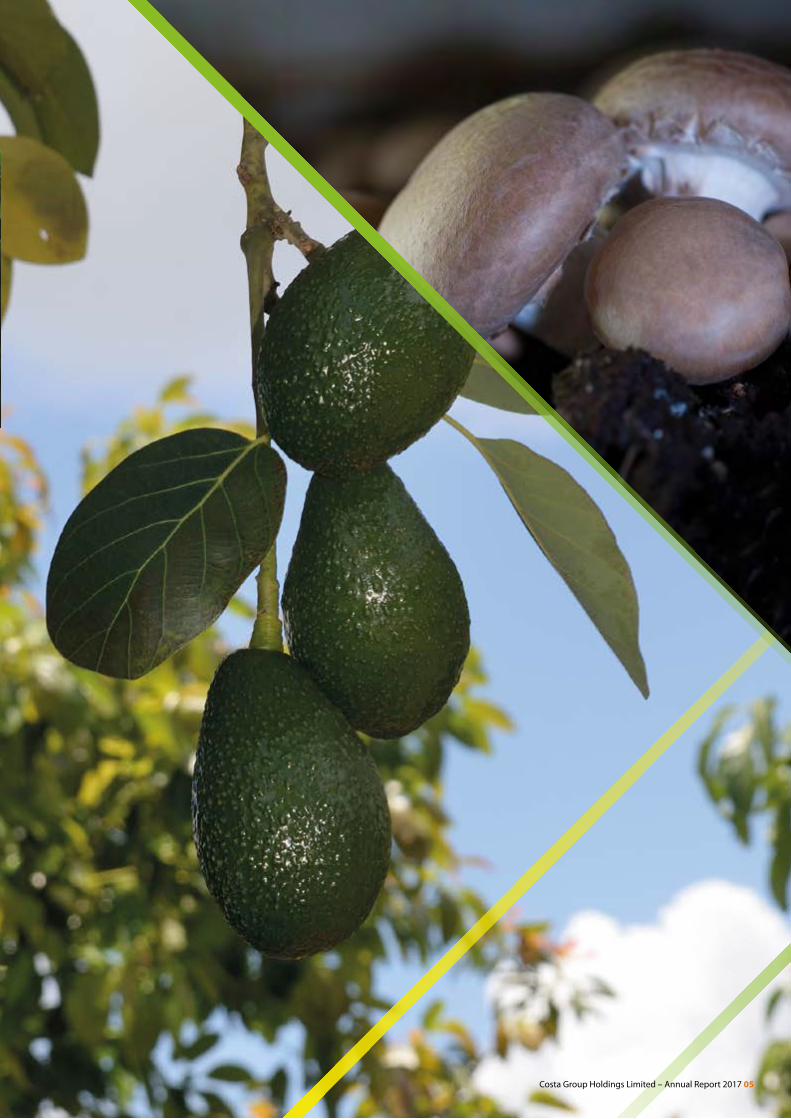
Avocados have been identified by the Company as a growth category and are the second fastest growing fresh produce category globally, only behind blueberries. The fact that we are the biggest blueberry grower in Australia providing year round supply to the major retailers and that we have embarked on a strategy to be the market leader in avocados, places Costa at the forefront of being able to capitalise on the volume and value growth that will be generated in these categories.
Our international segment is now making a meaningful contribution to our performance, with our African Blue business in Morocco supplying the growing UK and European markets. The UK berry market alone is worth more than £1 billion and the blueberry varieties that we grow in Morocco are primarily from genetics developed by Costa in Australia. We now have operations in China presently across two farms located at Bailing and Manlai in southern China, producing blueberries and raspberries, with an initial small planting of blackberries completed during the year. The Chinese market offers considerable opportunities in the way product is sold to the consumer, and the market has shown a willingness to pay a premium value for large, high-quality, fresh blueberries.
Innovation in our production practices has been key to our ability to increase crop yields and achieve a more efficient return on our invested capital. We continue to explore more sustainable ways in which to apply this innovation. Costa has been a leader in the development and use of substrate, which involves the application of water and fertiliser in highly controlled doses through pumps and controllers requiring a reliable power supply, either through the mains power network or via diesel generators in remote locations.
At our Corindi berry farm in northern New South Wales we have installed a more environmentally sustainable solution with the installation of solar panels. Roof-mounted solar panels coupled with a battery have been installed providing storage for 24 hour a day operation. This solar fertigation solution reduces the carbon footprint of the site by eliminating the use of grid power and the use of fossil fuels to run generators.
ResultsFull year revenue of $909.1 million saw a 10.7% increase on our full year FY2016 result.
EBITDA before SGARA was up 29.3% on full year FY2016 to $115.2 million, while NPAT before SGARA and material items increased by 37.3% on the previous year to $60.7 million.
Avocados have been identified by the Company as a growth category and are the second fastest growing fresh produce category globally, only behind blueberries.
Innovation in our production practices has been key to our ability to increase crop yields and achieve a more efficient return on our invested capital.
02 Costa Group Holdings Limited – Annual Report 2017
DividendsThe Board declared a fully franked final dividend of 7.0 cents per share resulting in a full year fully franked dividend total of 11.0 cents per share in respect of FY2017. This was an increase of 22% over the previous year.
Our PeopleOur FTE workforce, of approximately 3,700, swells to more than 6,000 during peak harvest times. To illustrate just how extensive our regional employment footprint is, at our tomato glasshouses in northern New South Wales, we provide employment for 600 people. The workforce at our mushroom farm at Mernda in northern Melbourne also totals more than 600 people and in the north-west of Tasmania during the peak of the harvest season, our labour requirements exceed more than 1,100 people.
As our Company continues to grow through acquisitions, investing in new plantings and increased production capacity, we now have operations across nearly 50 sites Australia- wide. This highlights not only the importance of Costa in its role as a major employer in
regional Australia, but also the part we can and do play in these communities through the support we provide to local sporting clubs, schools and food charities. Just one example of this is the more than 100 kilograms of strawberries per week our Tasmanian berry farms donated to the ‘Produce for the People’ food charity during the harvest season. This equated to 650 serves of fruit per week for people in need.
BoardThe Board welcomed Janette Kendall as a Non-Executive Independent Director. Janette brings extensive experience from marketing and operational roles across a diverse range of industries, including retail, and has a deep understanding of digital marketing as well as brand development, innovation and management.
The Board and management remain focused on growing shareholder value, executing our strategy and continuing to earn the trust of our shareholders by getting long-term results. Our management team has done an excellent job in delivering not only a strong financial
performance for the year but also putting the business on a firm footing so as to maximise the benefits that will come from future growth.
OutlookTaking into account FY2017 results which have exceeded expectations, the Company currently expects to generate around a 10% NPAT pre-SGARA and material items growth in FY2018.
The Company aims to drive future performance focused on generating long- term superior shareholder returns through targeting early double digit annual earnings growth across a three-to five-year horizon.
Neil ChatfieldChairman
Costa Group Holdings Limited – Annual Report 2017 03
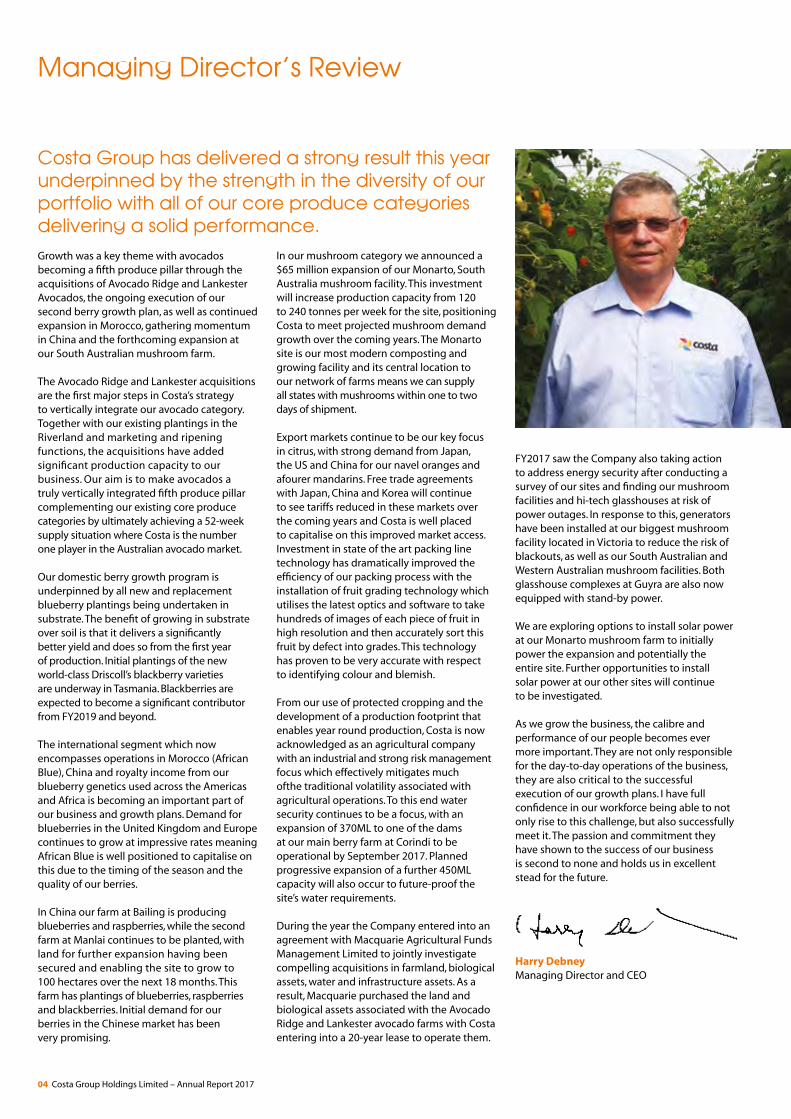
Managing Director’s Review
Growth was a key theme with avocados becoming a fifth produce pillar through the acquisitions of Avocado Ridge and Lankester Avocados, the ongoing execution of our second berry growth plan, as well as continued expansion in Morocco, gathering momentum in China and the forthcoming expansion at our South Australian mushroom farm.
The Avocado Ridge and Lankester acquisitions are the first major steps in Costa’s strategy to vertically integrate our avocado category. Together with our existing plantings in the Riverland and marketing and ripening functions, the acquisitions have added significant production capacity to our business. Our aim is to make avocados a truly vertically integrated fifth produce pillar complementing our existing core produce categories by ultimately achieving a 52-week supply situation where Costa is the number one player in the Australian avocado market.
Our domestic berry growth program is underpinned by all new and replacement blueberry plantings being undertaken in substrate. The benefit of growing in substrate over soil is that it delivers a significantly better yield and does so from the first year of production. Initial plantings of the new world-class Driscoll’s blackberry varieties are underway in Tasmania. Blackberries are expected to become a significant contributor from FY2019 and beyond.
The international segment which now encompasses operations in Morocco (African Blue), China and royalty income from our blueberry genetics used across the Americas and Africa is becoming an important part of our business and growth plans. Demand for blueberries in the United Kingdom and Europe continues to grow at impressive rates meaning African Blue is well positioned to capitalise on this due to the timing of the season and the quality of our berries.
In China our farm at Bailing is producing blueberries and raspberries, while the second farm at Manlai continues to be planted, with land for further expansion having been secured and enabling the site to grow to 100 hectares over the next 18 months. This farm has plantings of blueberries, raspberries and blackberries. Initial demand for our berries in the Chinese market has been very promising.
In our mushroom category we announced a $65 million expansion of our Monarto, South Australia mushroom facility. This investment will increase production capacity from 120 to 240 tonnes per week for the site, positioning Costa to meet projected mushroom demand growth over the coming years. The Monarto site is our most modern composting and growing facility and its central location to our network of farms means we can supply all states with mushrooms within one to two days of shipment.
Export markets continue to be our key focus in citrus, with strong demand from Japan, the US and China for our navel oranges and afourer mandarins. Free trade agreements with Japan, China and Korea will continue to see tariffs reduced in these markets over the coming years and Costa is well placed to capitalise on this improved market access. Investment in state of the art packing line technology has dramatically improved the efficiency of our packing process with the installation of fruit grading technology which utilises the latest optics and software to take hundreds of images of each piece of fruit in high resolution and then accurately sort this fruit by defect into grades. This technology has proven to be very accurate with respect to identifying colour and blemish.
From our use of protected cropping and the development of a production footprint that enables year round production, Costa is now acknowledged as an agricultural company with an industrial and strong risk management focus which effectively mitigates much ofthe traditional volatility associated with agricultural operations. To this end water security continues to be a focus, with an expansion of 370ML to one of the dams at our main berry farm at Corindi to be operational by September 2017. Planned progressive expansion of a further 450ML capacity will also occur to future-proof the site’s water requirements.
During the year the Company entered into an agreement with Macquarie Agricultural Funds Management Limited to jointly investigate compelling acquisitions in farmland, biological assets, water and infrastructure assets. As a result, Macquarie purchased the land and biological assets associated with the Avocado Ridge and Lankester avocado farms with Costa entering into a 20-year lease to operate them.
FY2017 saw the Company also taking action to address energy security after conducting a survey of our sites and finding our mushroom facilities and hi-tech glasshouses at risk of power outages. In response to this, generators have been installed at our biggest mushroom facility located in Victoria to reduce the risk of blackouts, as well as our South Australian and Western Australian mushroom facilities. Both glasshouse complexes at Guyra are also now equipped with stand-by power.
We are exploring options to install solar power at our Monarto mushroom farm to initially power the expansion and potentially the entire site. Further opportunities to install solar power at our other sites will continue to be investigated.
As we grow the business, the calibre and performance of our people becomes ever more important. They are not only responsible for the day-to-day operations of the business, they are also critical to the successful execution of our growth plans. I have full confidence in our workforce being able to not only rise to this challenge, but also successfully meet it. The passion and commitment they have shown to the success of our business is second to none and holds us in excellent stead for the future.
Harry DebneyManaging Director and CEO
Costa Group has delivered a strong result this year underpinned by the strength in the diversity of our portfolio with all of our core produce categories delivering a solid performance.
04 Costa Group Holdings Limited – Annual Report 2017
Costa Group Holdings Limited – Annual Report 2017 05
Company Profile
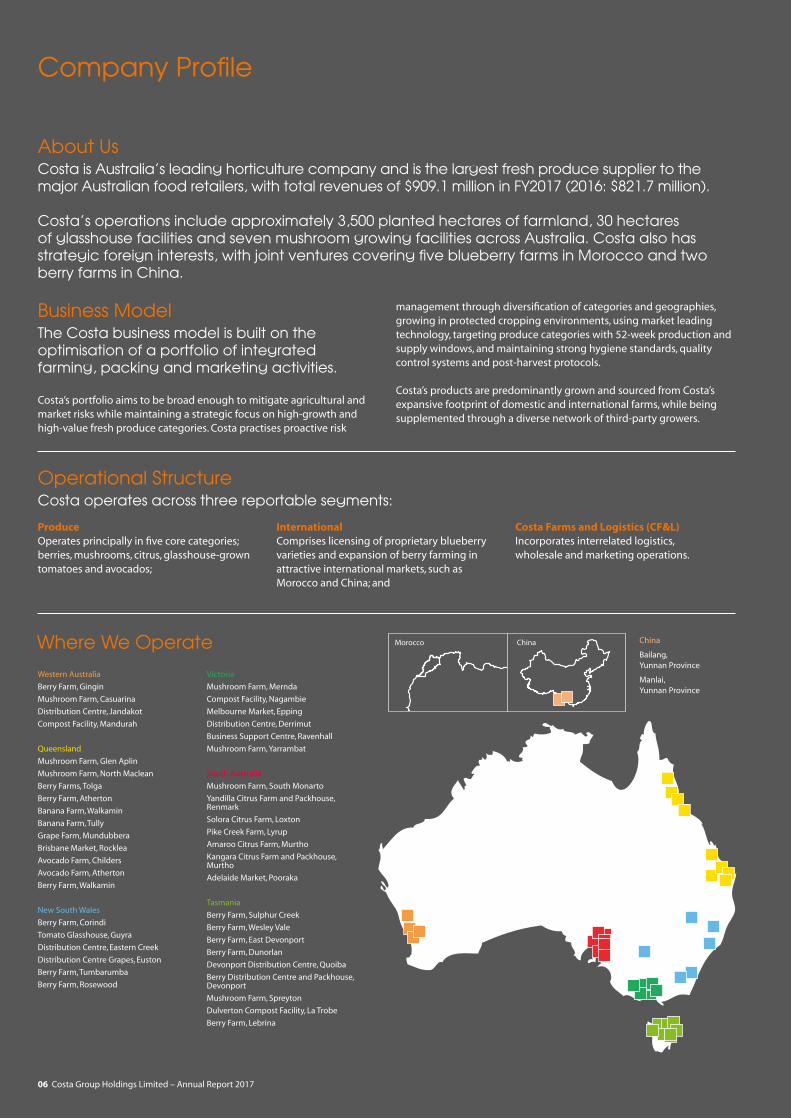
About UsCosta is Australia’s leading horticulture company and is the largest fresh produce supplier to the major Australian food retailers, with total revenues of $909.1 million in FY2017 (2016: $821.7 million).
Costa’s operations include approximately 3,500 planted hectares of farmland, 30 hectares of glasshouse facilities and seven mushroom growing facilities across Australia. Costa also has strategic foreign interests, with joint ventures covering five blueberry farms in Morocco and two berry farms in China.
Operational StructureCosta operates across three reportable segments:
Western Australia
Berry Farm, Gingin
Mushroom Farm, Casuarina
Distribution Centre, Jandakot
Compost Facility, Mandurah
Queensland
Mushroom Farm, Glen Aplin
Mushroom Farm, North Maclean
Berry Farms, Tolga
Berry Farm, Atherton
Banana Farm, Walkamin
Banana Farm, Tully
Grape Farm, Mundubbera
Brisbane Market, Rocklea
Avocado Farm, Childers
Avocado Farm, Atherton
Berry Farm, Walkamin
New South Wales
Berry Farm, Corindi
Tomato Glasshouse, Guyra
Distribution Centre, Eastern Creek
Distribution Centre Grapes, Euston
Berry Farm, Tumbarumba
Berry Farm, Rosewood
Victoria
Mushroom Farm, Mernda
Compost Facility, Nagambie
Melbourne Market, Epping
Distribution Centre, Derrimut
Business Support Centre, Ravenhall
Mushroom Farm, Yarrambat
South Australia
Mushroom Farm, South Monarto
Yandilla Citrus Farm and Packhouse, Renmark
Solora Citrus Farm, Loxton
Pike Creek Farm, Lyrup
Amaroo Citrus Farm, Murtho
Kangara Citrus Farm and Packhouse, Murtho
Adelaide Market, Pooraka
Tasmania
Berry Farm, Sulphur Creek
Berry Farm, Wesley Vale
Berry Farm, East Devonport
Berry Farm, Dunorlan
Devonport Distribution Centre, Quoiba
Berry Distribution Centre and Packhouse, Devonport
Mushroom Farm, Spreyton
Dulverton Compost Facility, La Trobe
Berry Farm, Lebrina
ProduceOperates principally in five core categories; berries, mushrooms, citrus, glasshouse-grown tomatoes and avocados;
InternationalComprises licensing of proprietary blueberry varieties and expansion of berry farming in attractive international markets, such as Morocco and China; and
Costa Farms and Logistics (CF&L)Incorporates interrelated logistics, wholesale and marketing operations.
Costa’s portfolio aims to be broad enough to mitigate agricultural and market risks while maintaining a strategic focus on high-growth and high-value fresh produce categories. Costa practises proactive risk
management through diversification of categories and geographies, growing in protected cropping environments, using market leading technology, targeting produce categories with 52-week production and supply windows, and maintaining strong hygiene standards, quality control systems and post-harvest protocols.
Costa’s products are predominantly grown and sourced from Costa’s expansive footprint of domestic and international farms, while being supplemented through a diverse network of third-party growers.
Business ModelThe Costa business model is built on the optimisation of a portfolio of integrated farming, packing and marketing activities.
Morocco China China
Bailang, Yunnan Province
Manlai, Yunnan Province
Where We Operate
06 Costa Group Holdings Limited – Annual Report 2017
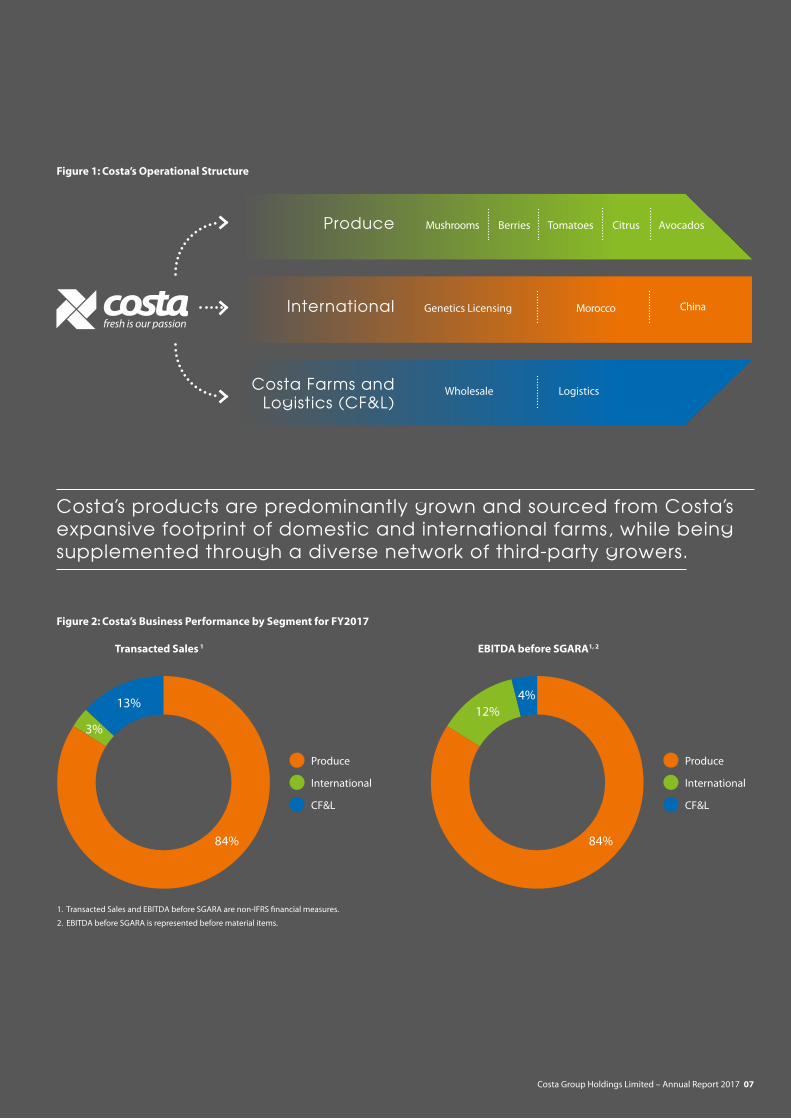
Figure 1: Costa’s Operational Structure
Costa’s products are predominantly grown and sourced from Costa’s expansive footprint of domestic and international farms, while being supplemented through a diverse network of third-party growers.
Produce
International
Costa Farms and Logistics (CF&L)
Berries
Genetics Licensing
Wholesale
Mushrooms
Logistics
Tomatoes AvocadosCitrus
Morocco
Transacted Sales 1 EBITDA before SGARA1, 2
Figure 2: Costa’s Business Performance by Segment for FY2017
1. Transacted Sales and EBITDA before SGARA are non-IFRS financial measures.
2. EBITDA before SGARA is represented before material items.
Produce
84%
13%
International
CF&L
Produce
International
CF&L
3%12%
4%
84%
China
Costa Group Holdings Limited – Annual Report 2017 07
Company Profile continued
Transacted Sales ($m)
EBITDA-S Before Material Items ($m)
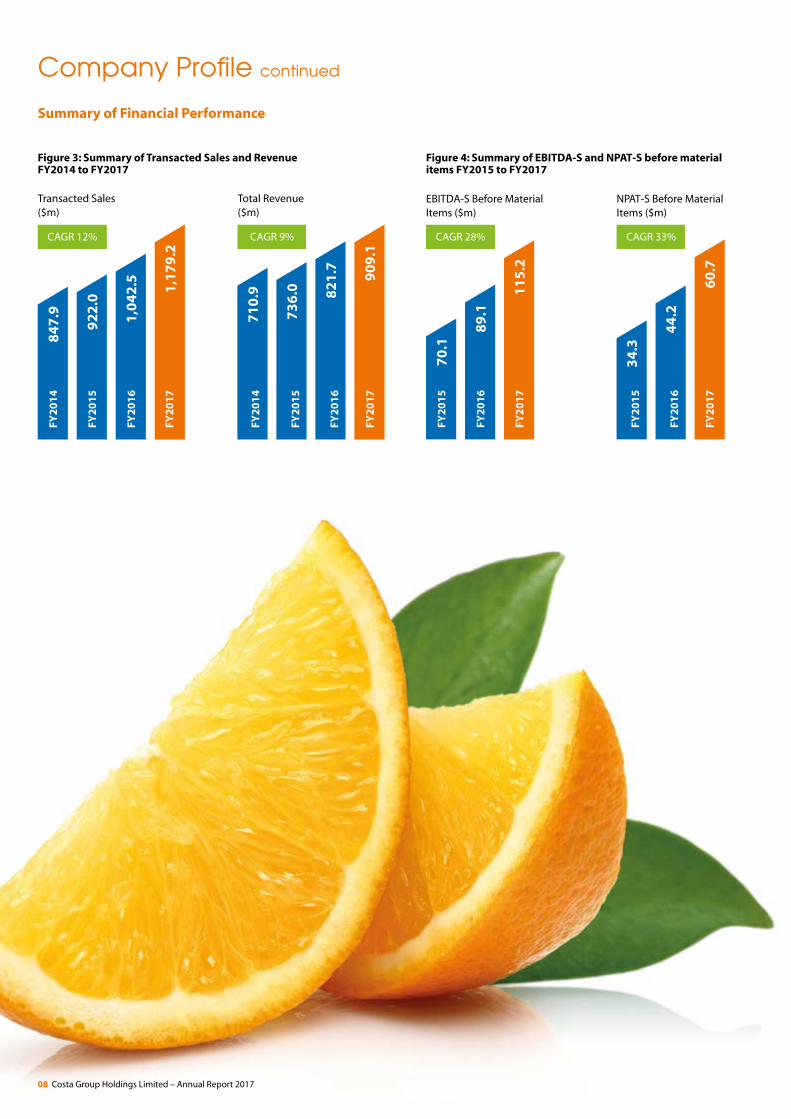
CAGR 12%
FY2
01
4
FY2
01
5
FY2
01
5
FY2
01
6
FY2
01
6
FY2
01
7
FY2
01
7
84
7.9
92
2.0
70
.1
1,0
42
.5
89
.1
1,1
79
.2
11
5.2
Figure 3: Summary of Transacted Sales and Revenue FY2014 to FY2017
Figure 4: Summary of EBITDA-S and NPAT-S before material items FY2015 to FY2017
Summary of Financial Performance
FY2
01
4
FY2
01
5
FY2
01
6
FY2
01
7
Total Revenue ($m)
CAGR 9% CAGR 28% CAGR 33%
71
0.9
73
6.0 82
1.7 90
9.1
FY2
01
5
FY2
01
6
FY2
01
7
NPAT-S Before Material Items ($m)
34
.3
44
.2
60
.7
08 Costa Group Holdings Limited – Annual Report 2017
Strategy and Growth
Australian Berry Expansion
• Further expansion across FNQ, TAS, WA and NSW inclusive of 10.8 hectares of blackberry varieties to be planted in FY2018.
• 31 hectares new blueberry plantings, 31 hectares blueberry substrate conversion, 18 hectares raspberry plantings.
Avocado Vertical Integration
• Avocado Ridge farm acquired in 2017.¹
• Lankester farm acquired July 2017¹ bringing Costa’s total farming footprint to approximately 500 hectares.
International – Morocco
• Planning for a further 63 hectares to be planted in FY2018 will bring total plantings to 316 hectares.
• New packing shed to be completed in time for the 2018 season to support new production from the northern farms.
International – China
• A further 58 hectares to be planted in FY2018.
• Local organisational capability established with addition of technical, farm management, safety and project management roles.
Mushroom Expansion
• Monarto farm expansion announced February 2017 with intention of doubling current production capacity from 120 tonnes to 240 tonnes per week.
• Additional production is expected to commence from December 2018 reaching full capacity by July 2019.
Costa’s corporate strategy involves a number of initiatives aimed at sustaining long-term growth, which include:
• continuing to build Costa’s market position and expansion of farming footprints;
• expanding global licensing of Costa’s blueberry varieties;
• continuing to invest in and expand research and development (R&D) capabilities; and
• developing new channels to market through product innovation, new customer development and expansion of export markets.
Costa maintains a prudent and disciplined approach to capital deployment and continues to invest in growth opportunities in the medium to long term that are expected to maximise value and return for shareholders.
Growth and Future ProspectsCosta aims to generate growth by investing in its core categories and strategically growing its offshore exposure in highly attractive international markets. During the year Costa continued to deliver on its growth initiatives through the following key activities:
• completion of a further 70 hectares in new berry plantings across Australian farms;
• acquisition of existing avocado farms¹ resulting in the vertical integration of the avocado category as it becomes the fifth pillar complementing existing core produce categories;
• further expansion of African Blue berry operations in Morocco; and
• continued development of its Manlai berry farm in China.
Notes:
1. Acquisition of Avocado Ridge and Lankester avocado orchards have been completed in conjunction with Macquarie Agriculture Funds Management (Macquarie). Under the agreement, Macquarie purchased the land, biological assets, water and infrastructure assets with Costa entering into a 20-year lease with Macquarie to operate the orchards.
Costa’s current position, operating platform and world-class practices provide it with multiple growth drivers in the Australian domestic market and in highly attractive international markets.
FY2018 will see continued execution of the domestic and international growth initiatives.
Costa Group Holdings Limited – Annual Report 2017 09
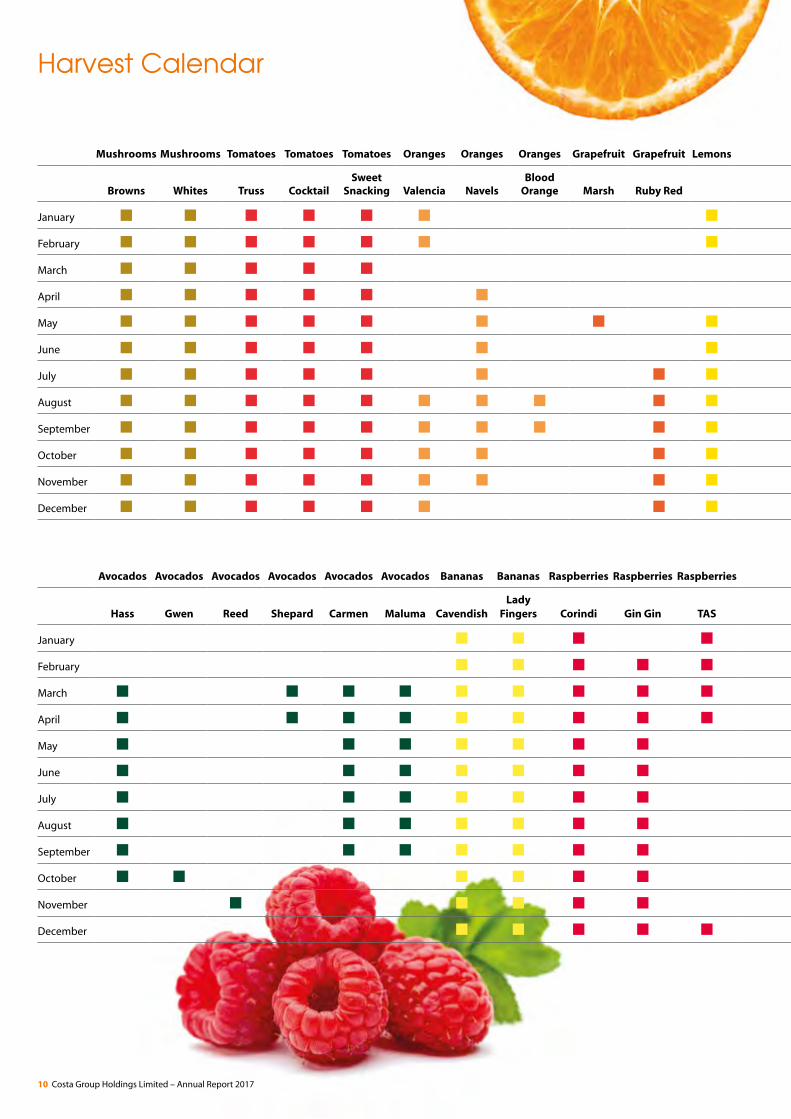
Harvest Calendar
Avocados Avocados Avocados Avocados Avocados Avocados Bananas Bananas Raspberries Raspberries Raspberries Blackberries Blueberries Blueberries Blueberries Blueberries Blueberries Strawberries Grapes Grapes Grapes
Hass Gwen Reed Shepard Carmen Maluma CavendishLady
Fingers Corindi Gin Gin TAS TAS Corindi FNQ WA NSW TAS TAS Flames MenindeeMidnight and Sable
January
February
March
April
May
June
July
August
September
October
November
December
Mushrooms Mushrooms Tomatoes Tomatoes Tomatoes Oranges Oranges Oranges Grapefruit Grapefruit Lemons Limes Mandarins Mandarins Mandarins Mandarins Mandarins Mandarins Mandarins Mandarins Persimmons Persimmons Tangelos
Browns Whites Truss CocktailSweet
Snacking Valencia NavelsBlood
Orange Marsh Ruby Red Satsuma Clementines Daisy Imperial Afourer EllendaleHoney
Murcott Ortanique Jiro Fuyu
January
February
March
April
May
June
July
August
September
October
November
December
10 Costa Group Holdings Limited – Annual Report 2017
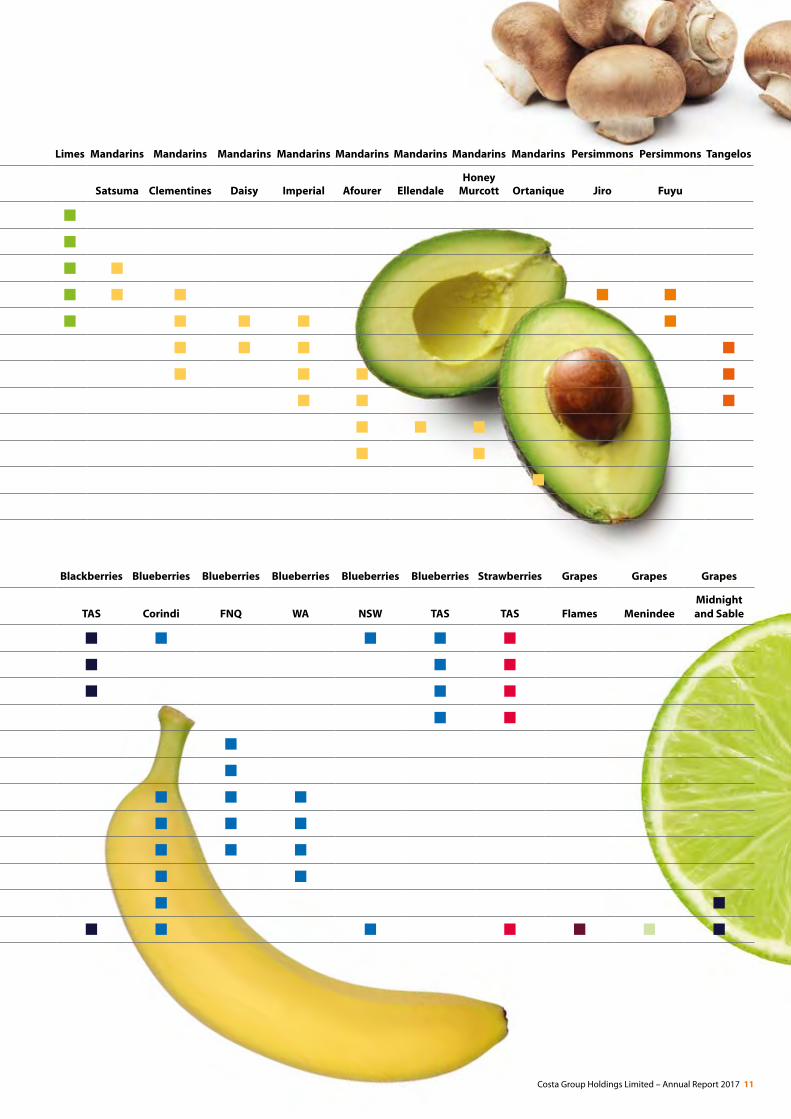
Avocados Avocados Avocados Avocados Avocados Avocados Bananas Bananas Raspberries Raspberries Raspberries Blackberries Blueberries Blueberries Blueberries Blueberries Blueberries Strawberries Grapes Grapes Grapes
Hass Gwen Reed Shepard Carmen Maluma CavendishLady
Fingers Corindi Gin Gin TAS TAS Corindi FNQ WA NSW TAS TAS Flames MenindeeMidnight and Sable
January
February
March
April
May
June
July
August
September
October
November
December
Mushrooms Mushrooms Tomatoes Tomatoes Tomatoes Oranges Oranges Oranges Grapefruit Grapefruit Lemons Limes Mandarins Mandarins Mandarins Mandarins Mandarins Mandarins Mandarins Mandarins Persimmons Persimmons Tangelos
Browns Whites Truss CocktailSweet
Snacking Valencia NavelsBlood
Orange Marsh Ruby Red Satsuma Clementines Daisy Imperial Afourer EllendaleHoney
Murcott Ortanique Jiro Fuyu
January
February
March
April
May
June
July
August
September
October
November
December
Costa Group Holdings Limited – Annual Report 2017 11
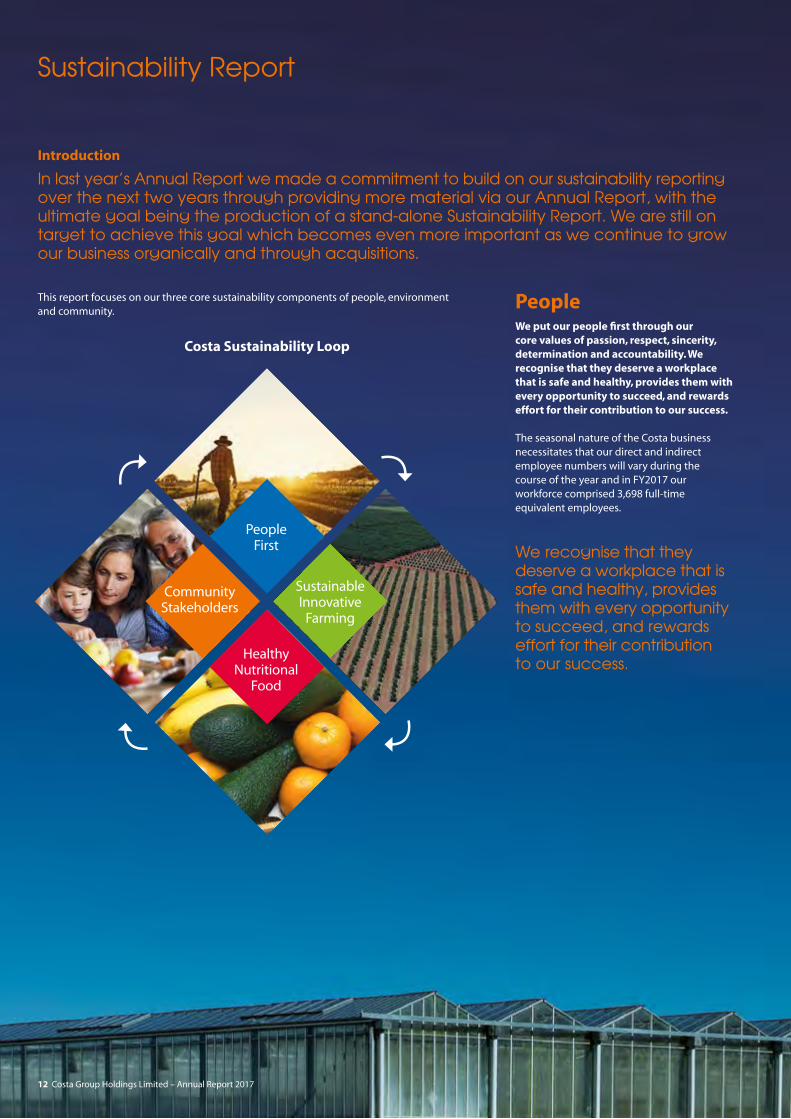
Sustainability Report
PeopleWe put our people first through our core values of passion, respect, sincerity, determination and accountability. We recognise that they deserve a workplace that is safe and healthy, provides them with every opportunity to succeed, and rewards effort for their contribution to our success.
The seasonal nature of the Costa business necessitates that our direct and indirect employee numbers will vary during the course of the year and in FY2017 our workforce comprised 3,698 full-time equivalent employees.
Introduction
In last year’s Annual Report we made a commitment to build on our sustainability reporting over the next two years through providing more material via our Annual Report, with the ultimate goal being the production of a stand-alone Sustainability Report. We are still on target to achieve this goal which becomes even more important as we continue to grow our business organically and through acquisitions.
This report focuses on our three core sustainability components of people, environment and community.
Costa Sustainability Loop
We recognise that they deserve a workplace that is safe and healthy, provides them with every opportunity to succeed, and rewards effort for their contribution to our success.
People First
Healthy Nutritional
Food
SustainableInnovative
Farming
CommunityStakeholders
12 Costa Group Holdings Limited – Annual Report 2017
Our People
Bryony Hackett As Operations Manager for the Costa tomato category Bryony Hackett is proud to have contributed to the recent 10 hectare expansion of Costa’s tomato operations at Guyra in the New England region of New South Wales. Bryony oversaw the growth of the total workforce from 400 to 600 people and was responsible for sourcing all of the new workers required for the expansion, while also restructuring her existing team to ensure that the business’s increased production from 20 hectares to 30 hectares went as smoothly as possible.
Bryony has been with Costa for 11 years, originally starting out as a crop pruner then progressing through various supervisory and growing roles to her current position of Operations Manager with responsibility for 600 workers. During this time, with the support of Costa, Bryony completed an agricultural degree at the University of New England.
Bryony is particularly proud of the strong safety culture she has instilled in her people and the improvements her site has achieved in both safety and quality. Safety is the priority in everything that Bryony and her team do, with health and safety being the first topic covered in all team meetings.
Using the skills and knowledge she has acquired during her time with Costa, Bryony participated in the horticultural industry’s ‘Growing Leaders’ program which aims to encourage and develop the next generation of industry leaders. On a regular basis Bryony also hosts site tours for local students who have an interest in pursuing a career in horticulture in which she seeks to promote the uniqueness of glasshouse horticulture and the many career opportunities there are in this innovative area.
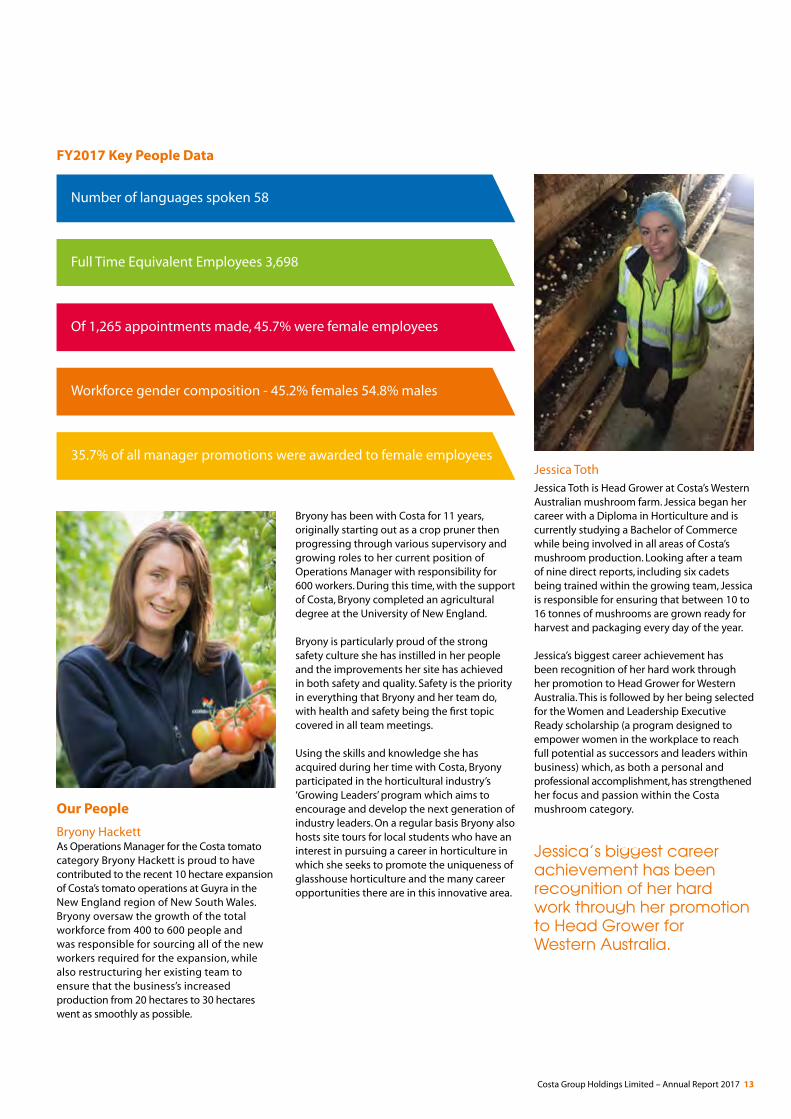
Jessica TothJessica Toth is Head Grower at Costa’s Western Australian mushroom farm. Jessica began her career with a Diploma in Horticulture and is currently studying a Bachelor of Commerce while being involved in all areas of Costa’s mushroom production. Looking after a team of nine direct reports, including six cadets being trained within the growing team, Jessica is responsible for ensuring that between 10 to 16 tonnes of mushrooms are grown ready for harvest and packaging every day of the year.
Jessica’s biggest career achievement has been recognition of her hard work through her promotion to Head Grower for Western Australia. This is followed by her being selected for the Women and Leadership Executive Ready scholarship (a program designed to empower women in the workplace to reach full potential as successors and leaders within business) which, as both a personal and professional accomplishment, has strengthened her focus and passion within the Costa mushroom category.
FY2017 Key People Data
Jessica’s biggest career achievement has been recognition of her hard work through her promotion to Head Grower for Western Australia.
Number of languages spoken 58
Full Time Equivalent Employees 3,698
Of 1,265 appointments made, 45.7% were female employees
Workforce gender composition - 45.2% females 54.8% males
35.7% of all manager promotions were awarded to female employees
Costa Group Holdings Limited – Annual Report 2017 13
Education and Training
Emma NightingaleThe inaugural recipient of the University of Tasmania Costa Honours Scholarship in Agricultural Science, Emma Nightingale completed her studies in 2016 achieving first class honours for her work on an independent research project which investigated the impact of mirids (insects) on Costa’s Wesley Vale and Dunorlan raspberry farms in Tasmania.
Emma investigated two main aspects as part of her research, including identification of the species of mirids that were present on the farms and conducting field trials to determine what impact there was on berry quality. The results of Emma’s research are now being used in the design of future pest management programs for raspberry farming.
As a local from the north-west of Tasmania, Emma’s interest in pursuing agricultural science studies was sparked after participating in a local industry run field excursion in which she experienced practical and field-based learning with a focus on horticulture and entomology. From there Emma went on to undertake agricultural science studies at the University of Tasmania.
Emma enjoys the diversity of the horticulture industry and the opportunities that this brings. Since completing her studies Emma has commenced in the role of Horticulture Technical Assistant working across the Costa berry category’s Tasmanian farms. Emma is particularly pleased that she is able to pursue a career in horticulture while continuing to live and work in the beautiful north-west region of Tasmania.
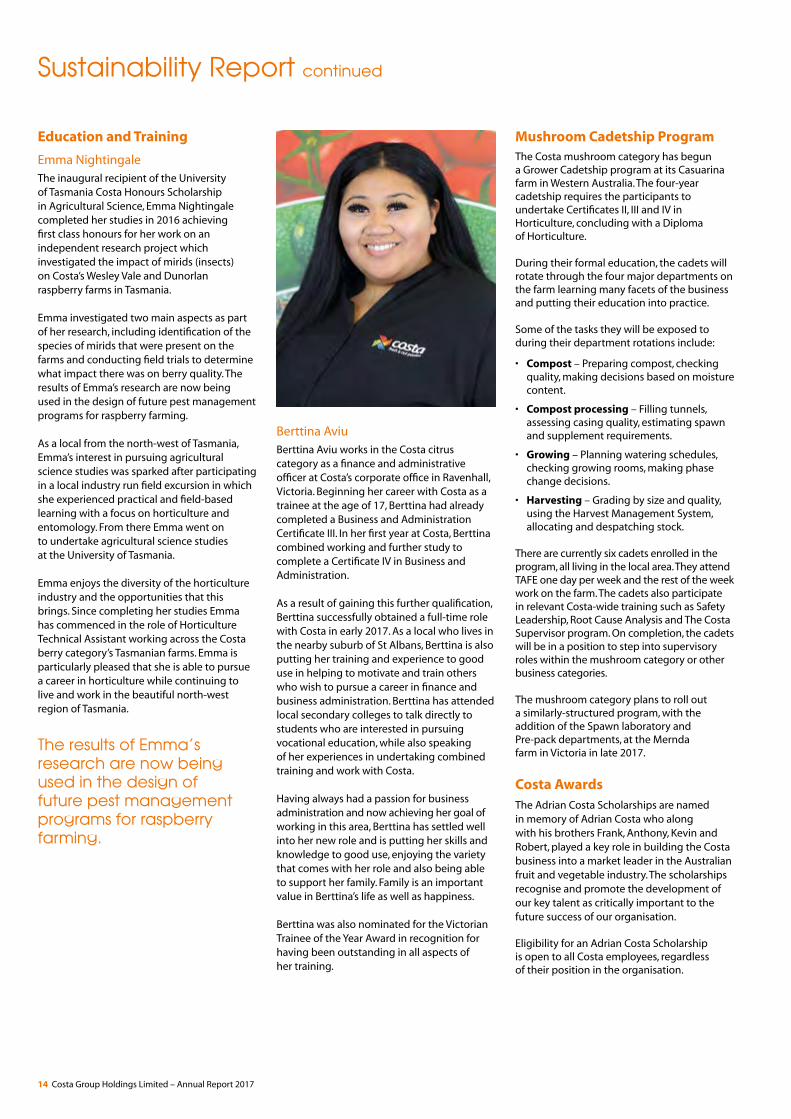
Berttina AviuBerttina Aviu works in the Costa citrus category as a finance and administrative officer at Costa’s corporate office in Ravenhall, Victoria. Beginning her career with Costa as a trainee at the age of 17, Berttina had already completed a Business and Administration Certificate III. In her first year at Costa, Berttina combined working and further study to complete a Certificate IV in Business and Administration.
As a result of gaining this further qualification, Berttina successfully obtained a full-time role with Costa in early 2017. As a local who lives in the nearby suburb of St Albans, Berttina is also putting her training and experience to good use in helping to motivate and train others who wish to pursue a career in finance and business administration. Berttina has attended local secondary colleges to talk directly to students who are interested in pursuing vocational education, while also speaking of her experiences in undertaking combined training and work with Costa.
Having always had a passion for business administration and now achieving her goal of working in this area, Berttina has settled well into her new role and is putting her skills and knowledge to good use, enjoying the variety that comes with her role and also being able to support her family. Family is an important value in Berttina’s life as well as happiness.
Berttina was also nominated for the Victorian Trainee of the Year Award in recognition for having been outstanding in all aspects of her training.
Mushroom Cadetship ProgramThe Costa mushroom category has begun a Grower Cadetship program at its Casuarina farm in Western Australia. The four-year cadetship requires the participants to undertake Certificates II, III and IV in Horticulture, concluding with a Diploma of Horticulture.
During their formal education, the cadets will rotate through the four major departments on the farm learning many facets of the business and putting their education into practice.
Some of the tasks they will be exposed to during their department rotations include:
• Compost – Preparing compost, checking quality, making decisions based on moisture content.
• Compost processing – Filling tunnels, assessing casing quality, estimating spawn and supplement requirements.
• Growing – Planning watering schedules, checking growing rooms, making phase change decisions.
• Harvesting – Grading by size and quality, using the Harvest Management System, allocating and despatching stock.
There are currently six cadets enrolled in the program, all living in the local area. They attend TAFE one day per week and the rest of the week work on the farm. The cadets also participate in relevant Costa-wide training such as Safety Leadership, Root Cause Analysis and The Costa Supervisor program. On completion, the cadets will be in a position to step into supervisory roles within the mushroom category or other business categories.
The mushroom category plans to roll out a similarly-structured program, with the addition of the Spawn laboratory and Pre-pack departments, at the Mernda farm in Victoria in late 2017.
Costa AwardsThe Adrian Costa Scholarships are named in memory of Adrian Costa who along with his brothers Frank, Anthony, Kevin and Robert, played a key role in building the Costa business into a market leader in the Australian fruit and vegetable industry. The scholarships recognise and promote the development of our key talent as critically important to the future success of our organisation.
Eligibility for an Adrian Costa Scholarship is open to all Costa employees, regardless of their position in the organisation.
Sustainability Report continued
The results of Emma’s research are now being used in the design of future pest management programs for raspberry farming.
14 Costa Group Holdings Limited – Annual Report 2017
Individuals demonstrating the key Costa values of determination and passion in their respective duties are nominated for consideration. If successful, they are given a valuable opportunity to pursue a wide range of personal or professional development activities that not only benefits the individual but also contributes to the growth of the Costa business.
Peter VuPeter Vu is a Project Manager at Costa’s Victorian Mernda mushroom facility and was awarded an Adrian Costa Scholarship in 2016. Since beginning work on the grading line seven years ago, Peter has worked in various roles across the site, providing him with a detailed understanding of the business. One of the first projects he worked on as a then Business Improvement Analyst was the national ‘Speed to Fridge’ quality improvement project, which received a Costa Chairman’s Award.
Since taking on the role of Project Manager, Peter has worked on many and varied projects including the installation of power generators, a waste water recycling plant and pre-packing upgrades. Peter brings to his role a keen eye for detail and the ability to quickly grasp the commercial imperatives of the capital projects that he has responsibility for.
Peter plans to utilise his scholarship to complete the ‘Lean Six Sigma Black Belt’ course, which he believes will greatly assist him to continue to improve his effectiveness and project management skills.
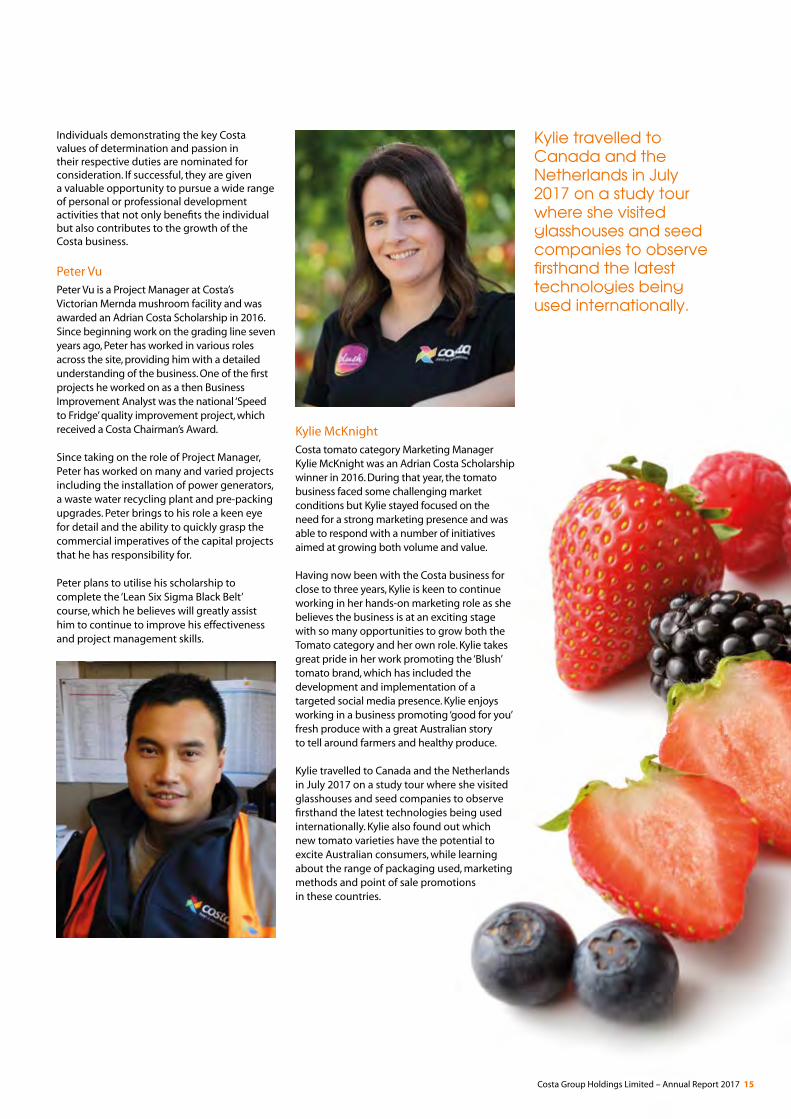
Kylie McKnightCosta tomato category Marketing Manager Kylie McKnight was an Adrian Costa Scholarship winner in 2016. During that year, the tomato business faced some challenging market conditions but Kylie stayed focused on the need for a strong marketing presence and was able to respond with a number of initiatives aimed at growing both volume and value.
Having now been with the Costa business for close to three years, Kylie is keen to continue working in her hands-on marketing role as she believes the business is at an exciting stage with so many opportunities to grow both the Tomato category and her own role. Kylie takes great pride in her work promoting the ‘Blush’ tomato brand, which has included the development and implementation of a targeted social media presence. Kylie enjoys working in a business promoting ‘good for you’ fresh produce with a great Australian story to tell around farmers and healthy produce.
Kylie travelled to Canada and the Netherlands in July 2017 on a study tour where she visited glasshouses and seed companies to observe firsthand the latest technologies being used internationally. Kylie also found out which new tomato varieties have the potential to excite Australian consumers, while learning about the range of packaging used, marketing methods and point of sale promotions in these countries.
Kylie travelled to Canada and the Netherlands in July 2017 on a study tour where she visited glasshouses and seed companies to observe firsthand the latest technologies being used internationally.
Costa Group Holdings Limited – Annual Report 2017 15
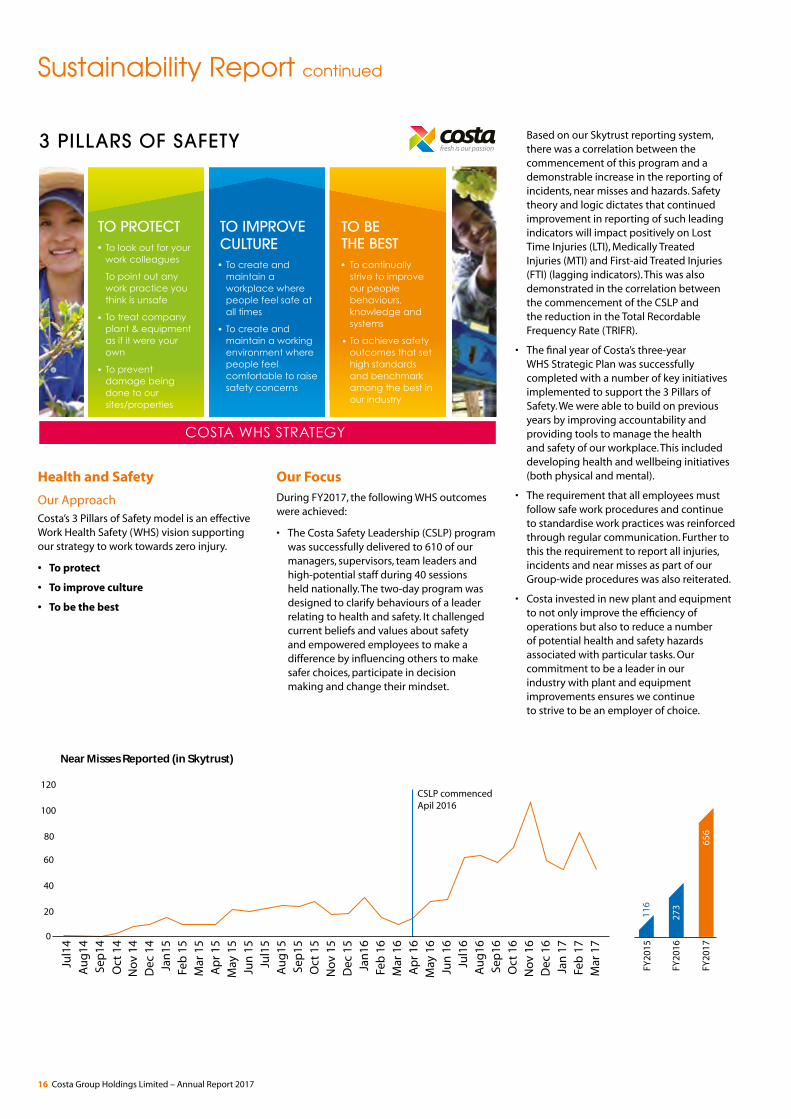
Health and Safety
Our ApproachCosta’s 3 Pillars of Safety model is an effective Work Health Safety (WHS) vision supporting our strategy to work towards zero injury.
• To protect
• To improve culture
• To be the best
Our FocusDuring FY2017, the following WHS outcomes were achieved:
• The Costa Safety Leadership (CSLP) program was successfully delivered to 610 of our managers, supervisors, team leaders and high-potential staff during 40 sessions held nationally. The two-day program was designed to clarify behaviours of a leader relating to health and safety. It challenged current beliefs and values about safety and empowered employees to make a difference by influencing others to make safer choices, participate in decision making and change their mindset.
Based on our Skytrust reporting system, there was a correlation between the commencement of this program and a demonstrable increase in the reporting of incidents, near misses and hazards. Safety theory and logic dictates that continued improvement in reporting of such leading indicators will impact positively on Lost Time Injuries (LTI), Medically Treated Injuries (MTI) and First-aid Treated Injuries (FTI) (lagging indicators). This was also demonstrated in the correlation between the commencement of the CSLP and the reduction in the Total Recordable Frequency Rate (TRIFR).
• The final year of Costa’s three-year WHS Strategic Plan was successfully completed with a number of key initiatives implemented to support the 3 Pillars of Safety. We were able to build on previous years by improving accountability and providing tools to manage the health and safety of our workplace. This included developing health and wellbeing initiatives (both physical and mental).
• The requirement that all employees must follow safe work procedures and continue to standardise work practices was reinforced through regular communication. Further to this the requirement to report all injuries, incidents and near misses as part of our Group-wide procedures was also reiterated.
• Costa invested in new plant and equipment to not only improve the efficiency of operations but also to reduce a number of potential health and safety hazards associated with particular tasks. Our commitment to be a leader in our industry with plant and equipment improvements ensures we continue to strive to be an employer of choice.
Sustainability Report continuedJu
l14
Au
g14
Sep
14
Oct
14
CSLP commenced Apil 2016
Nov
14
Dec
14
Jul1
5A
ug
15Se
p15
Oct
15
Nov
15
Dec
15
Jan
15Fe
b 1
5M
ar 1
5A
pr 1
5M
ay 1
5Ju
n 1
5
Jul1
6A
ug
16Se
p16
Oct
16
Nov
16
Dec
16
Jan
17
Feb
17
Mar
17
Jan
16Fe
b 1
6M
ar 1
6A
pr 1
6M
ay 1
6Ju
n 1
6
Near Misses Reported (in Skytrust)
0
20
40
60
80
100
120
FY20
15
FY20
16
FY20
17
273
116
656
16 Costa Group Holdings Limited – Annual Report 2017
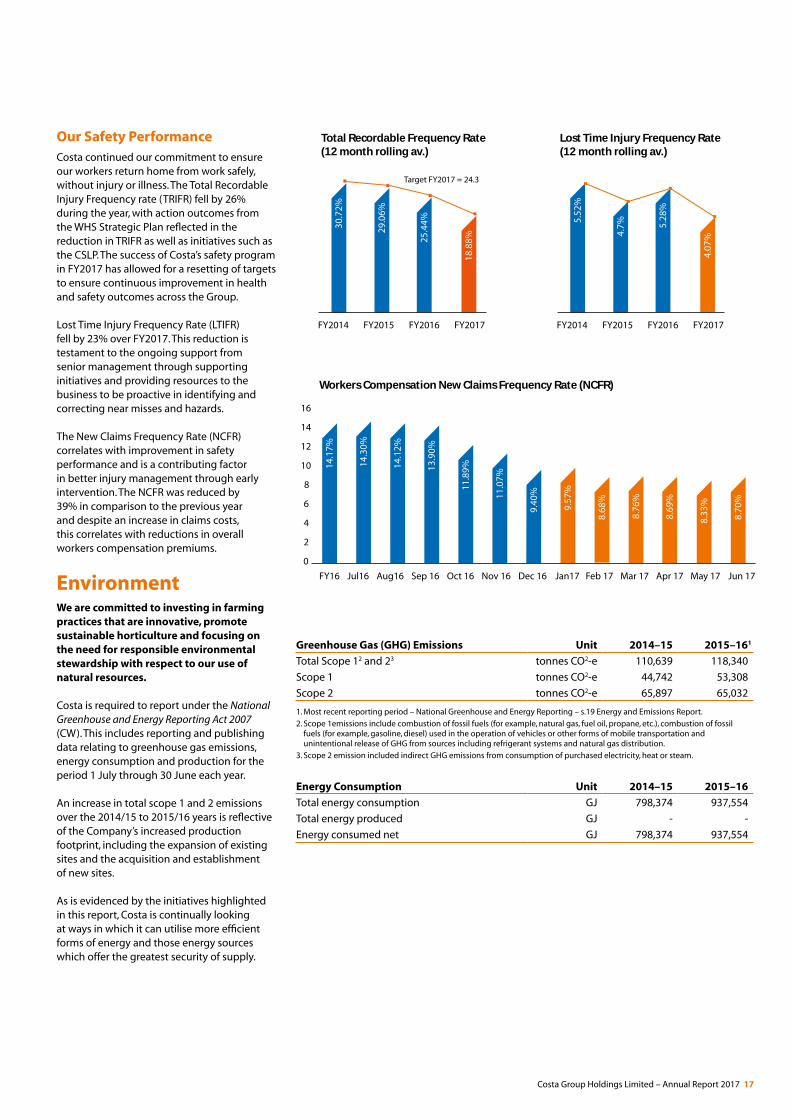
Our Safety PerformanceCosta continued our commitment to ensure our workers return home from work safely, without injury or illness. The Total Recordable Injury Frequency rate (TRIFR) fell by 26% during the year, with action outcomes from the WHS Strategic Plan reflected in the reduction in TRIFR as well as initiatives such as the CSLP. The success of Costa’s safety program in FY2017 has allowed for a resetting of targets to ensure continuous improvement in health and safety outcomes across the Group.
Lost Time Injury Frequency Rate (LTIFR) fell by 23% over FY2017. This reduction is testament to the ongoing support from senior management through supporting initiatives and providing resources to the business to be proactive in identifying and correcting near misses and hazards.
The New Claims Frequency Rate (NCFR) correlates with improvement in safety performance and is a contributing factor in better injury management through early intervention. The NCFR was reduced by 39% in comparison to the previous year and despite an increase in claims costs, this correlates with reductions in overall workers compensation premiums.
EnvironmentWe are committed to investing in farming practices that are innovative, promote sustainable horticulture and focusing on the need for responsible environmental stewardship with respect to our use of natural resources.
Costa is required to report under the National Greenhouse and Energy Reporting Act 2007 (CW). This includes reporting and publishing data relating to greenhouse gas emissions, energy consumption and production for the period 1 July through 30 June each year.
An increase in total scope 1 and 2 emissions over the 2014/15 to 2015/16 years is reflective of the Company’s increased production footprint, including the expansion of existing sites and the acquisition and establishment of new sites.
As is evidenced by the initiatives highlighted in this report, Costa is continually looking at ways in which it can utilise more efficient forms of energy and those energy sources which offer the greatest security of supply.
FY2014 FY2015 FY2016 FY2017
Target FY2017 = 24.3
Total Recordable Frequency Rate (12 month rolling av.)
30.7
2%
29.0
6%
25.4
4%
18.8
8%
0
10
20
30
40
50
FY2014 FY2015 FY2016 FY2017
Lost Time Injury Frequency Rate (12 month rolling av.)
5.52
%
4.7% 5.
28%
4.07
%
0
10
20
30
40
50
FY16 Jul16 Aug16 Sep 16 Oct 16 Nov 16 Dec 16 Jan17 Feb 17 Mar 17 Apr 17 May 17 Jun 17
Workers Compensation New Claims Frequency Rate (NCFR)
14.1
7%
14.3
0%
14.1
2%
13.9
0%
11.8
9%
11.0
7%
9.40
%
9.57
%
8.68
%
8.76
%
8.69
%
8.33
%
8.70
%
0
2
4
6
8
10
12
14
16
Greenhouse Gas (GHG) Emissions Unit 2014–15 2015–161
Total Scope 12 and 23 tonnes CO2-e 110,639 118,340
Scope 1 tonnes CO2-e 44,742 53,308
Scope 2 tonnes CO2-e 65,897 65,032
1. Most recent reporting period – National Greenhouse and Energy Reporting – s.19 Energy and Emissions Report.
2. Scope 1emissions include combustion of fossil fuels (for example, natural gas, fuel oil, propane, etc.), combustion of fossil fuels (for example, gasoline, diesel) used in the operation of vehicles or other forms of mobile transportation and unintentional release of GHG from sources including refrigerant systems and natural gas distribution.
3. Scope 2 emission included indirect GHG emissions from consumption of purchased electricity, heat or steam.
Energy Consumption Unit 2014–15 2015–16
Total energy consumption GJ 798,374 937,554
Total energy produced GJ - -
Energy consumed net GJ 798,374 937,554
Costa Group Holdings Limited – Annual Report 2017 17
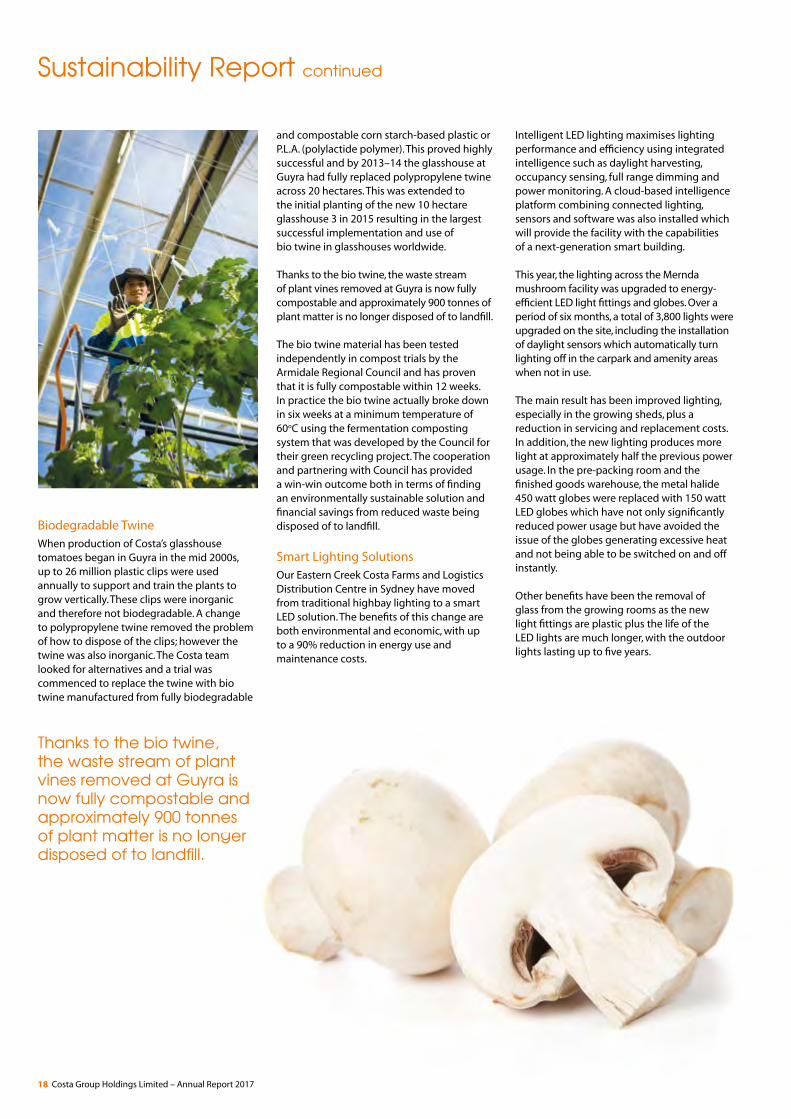
Biodegradable TwineWhen production of Costa’s glasshouse tomatoes began in Guyra in the mid 2000s, up to 26 million plastic clips were used annually to support and train the plants to grow vertically. These clips were inorganic and therefore not biodegradable. A change to polypropylene twine removed the problem of how to dispose of the clips; however the twine was also inorganic. The Costa team looked for alternatives and a trial was commenced to replace the twine with bio twine manufactured from fully biodegradable
and compostable corn starch-based plastic or P.L.A. (polylactide polymer). This proved highly successful and by 2013–14 the glasshouse at Guyra had fully replaced polypropylene twine across 20 hectares. This was extended to the initial planting of the new 10 hectare glasshouse 3 in 2015 resulting in the largest successful implementation and use of bio twine in glasshouses worldwide.
Thanks to the bio twine, the waste stream of plant vines removed at Guyra is now fully compostable and approximately 900 tonnes of plant matter is no longer disposed of to landfill.
The bio twine material has been tested independently in compost trials by the Armidale Regional Council and has proven that it is fully compostable within 12 weeks. In practice the bio twine actually broke down in six weeks at a minimum temperature of 60oC using the fermentation composting system that was developed by the Council for their green recycling project. The cooperation and partnering with Council has provided a win-win outcome both in terms of finding an environmentally sustainable solution and financial savings from reduced waste being disposed of to landfill.
Smart Lighting SolutionsOur Eastern Creek Costa Farms and Logistics Distribution Centre in Sydney have moved from traditional highbay lighting to a smart LED solution. The benefits of this change are both environmental and economic, with up to a 90% reduction in energy use and maintenance costs.
Intelligent LED lighting maximises lighting performance and efficiency using integrated intelligence such as daylight harvesting, occupancy sensing, full range dimming and power monitoring. A cloud-based intelligence platform combining connected lighting, sensors and software was also installed which will provide the facility with the capabilities of a next-generation smart building.
This year, the lighting across the Mernda mushroom facility was upgraded to energy-efficient LED light fittings and globes. Over a period of six months, a total of 3,800 lights were upgraded on the site, including the installation of daylight sensors which automatically turn lighting off in the carpark and amenity areas when not in use.
The main result has been improved lighting, especially in the growing sheds, plus a reduction in servicing and replacement costs. In addition, the new lighting produces more light at approximately half the previous power usage. In the pre-packing room and the finished goods warehouse, the metal halide 450 watt globes were replaced with 150 watt LED globes which have not only significantly reduced power usage but have avoided the issue of the globes generating excessive heat and not being able to be switched on and off instantly.
Other benefits have been the removal of glass from the growing rooms as the new light fittings are plastic plus the life of the LED lights are much longer, with the outdoor lights lasting up to five years.
Sustainability Report continued
Thanks to the bio twine, the waste stream of plant vines removed at Guyra is now fully compostable and approximately 900 tonnes of plant matter is no longer disposed of to landfill.
18 Costa Group Holdings Limited – Annual Report 2017
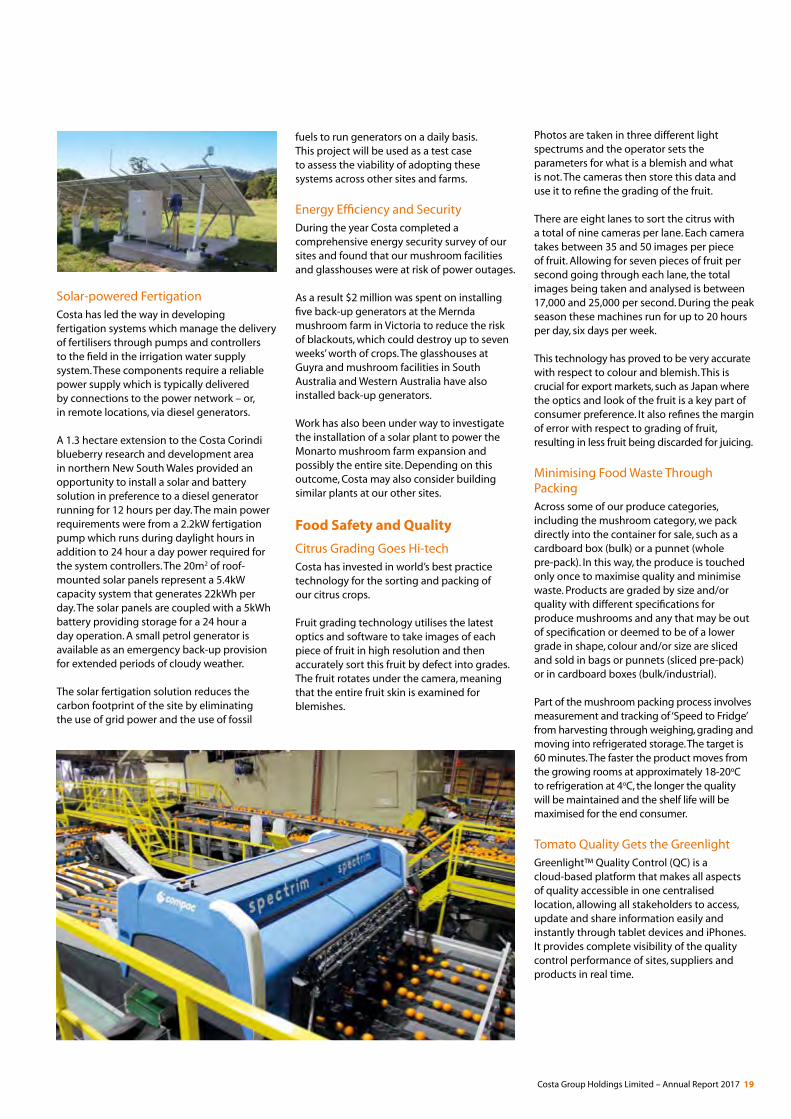
Solar-powered FertigationCosta has led the way in developing fertigation systems which manage the delivery of fertilisers through pumps and controllers to the field in the irrigation water supply system. These components require a reliable power supply which is typically delivered by connections to the power network – or, in remote locations, via diesel generators.
A 1.3 hectare extension to the Costa Corindi blueberry research and development area in northern New South Wales provided an opportunity to install a solar and battery solution in preference to a diesel generator running for 12 hours per day. The main power requirements were from a 2.2kW fertigation pump which runs during daylight hours in addition to 24 hour a day power required for the system controllers. The 20m2 of roof-mounted solar panels represent a 5.4kW capacity system that generates 22kWh per day. The solar panels are coupled with a 5kWh battery providing storage for a 24 hour a day operation. A small petrol generator is available as an emergency back-up provision for extended periods of cloudy weather.
The solar fertigation solution reduces the carbon footprint of the site by eliminating the use of grid power and the use of fossil
fuels to run generators on a daily basis. This project will be used as a test case to assess the viability of adopting these systems across other sites and farms.
Energy Efficiency and SecurityDuring the year Costa completed a comprehensive energy security survey of our sites and found that our mushroom facilities and glasshouses were at risk of power outages.
As a result $2 million was spent on installing five back-up generators at the Mernda mushroom farm in Victoria to reduce the risk of blackouts, which could destroy up to seven weeks’ worth of crops. The glasshouses at Guyra and mushroom facilities in South Australia and Western Australia have also installed back-up generators.
Work has also been under way to investigate the installation of a solar plant to power the Monarto mushroom farm expansion and possibly the entire site. Depending on this outcome, Costa may also consider building similar plants at our other sites.
Food Safety and Quality
Citrus Grading Goes Hi-techCosta has invested in world’s best practice technology for the sorting and packing of our citrus crops.
Fruit grading technology utilises the latest optics and software to take images of each piece of fruit in high resolution and then accurately sort this fruit by defect into grades. The fruit rotates under the camera, meaning that the entire fruit skin is examined for blemishes.
Photos are taken in three different light spectrums and the operator sets the parameters for what is a blemish and what is not. The cameras then store this data and use it to refine the grading of the fruit.
There are eight lanes to sort the citrus with a total of nine cameras per lane. Each camera takes between 35 and 50 images per piece of fruit. Allowing for seven pieces of fruit per second going through each lane, the total images being taken and analysed is between 17,000 and 25,000 per second. During the peak season these machines run for up to 20 hours per day, six days per week.
This technology has proved to be very accurate with respect to colour and blemish. This is crucial for export markets, such as Japan where the optics and look of the fruit is a key part of consumer preference. It also refines the margin of error with respect to grading of fruit, resulting in less fruit being discarded for juicing.
Minimising Food Waste Through PackingAcross some of our produce categories, including the mushroom category, we pack directly into the container for sale, such as a cardboard box (bulk) or a punnet (whole pre-pack). In this way, the produce is touched only once to maximise quality and minimise waste. Products are graded by size and/or quality with different specifications for produce mushrooms and any that may be out of specification or deemed to be of a lower grade in shape, colour and/or size are sliced and sold in bags or punnets (sliced pre-pack) or in cardboard boxes (bulk/industrial).
Part of the mushroom packing process involves measurement and tracking of ‘Speed to Fridge’ from harvesting through weighing, grading and moving into refrigerated storage. The target is 60 minutes. The faster the product moves from the growing rooms at approximately 18-20oC to refrigeration at 4oC, the longer the quality will be maintained and the shelf life will be maximised for the end consumer.
Tomato Quality Gets the GreenlightGreenlight™ Quality Control (QC) is a cloud-based platform that makes all aspects of quality accessible in one centralised location, allowing all stakeholders to access, update and share information easily and instantly through tablet devices and iPhones. It provides complete visibility of the quality control performance of sites, suppliers and products in real time.
Costa Group Holdings Limited – Annual Report 2017 19
Costa’s Guyra-based tomato glasshouses began using the Greenlight™ QC system in December 2016. Supporting the technology is a daily quality stand-up action board which includes metrics on incoming fruit quality and post grading results verifying actions taken for the fruit to meet customer requirements. Results are emailed as soon as the assessment is completed to the Operations and Technical teams.
The combination of Greenlight™ QC reporting and the action board has dramatically improved the effectiveness of communication, problem solving and responsiveness to quality issues.
The implementation of Greenlight™ QC has driven consistency and accuracy through centralised management of specifications including fruit quality, labelling and on screen guidance and instructions for QC staff.
The system provides immediate notification of batches or consignments found to not meet specification and also provides detailed information about the quality issue, including photos. This allows for an immediate response to the issue and staff can make informed decisions on those corrective actions required for batches or consignments found to be out of specification.
Accuracy the Key to Avocado QualityCosta’s recent acquisition of avocado farms in Queensland means we are now building our production footprint and we are focused on producing premium quality avocados. Our packing facility at Childers in Central Queensland operates a QC program that utilises state -of the-art grading equipment to grade each individual piece of fruit, relying on specialised calibrated cameras that use a range of the colour and infrared spectrum and highly sensitive scales. In addition, point-of-pack labelling ensures accurate labelling of every tray, capable of tracing the product back to individual blocks they are picked from.
Once the avocados are packed, samples are also taken to further check that the grading is accurate, which includes weighing and visually assessing the quality. Photographic images are taken, stored and used to prepare QC Check Reports for our retail partners, growing staff and third-party growers. If the fruit has been downgraded, the reasons are listed in the report, such as blemishes, sun bleach, nutrient deficiency or insect stings. The growers are then able to use this information to target appropriate remedies on the farm to reduce the incidence of downgrades and improve quality.
This all occurs prior to the ripening process and ensures only the most suitable fruit is being ripened and then sold to the end customer.
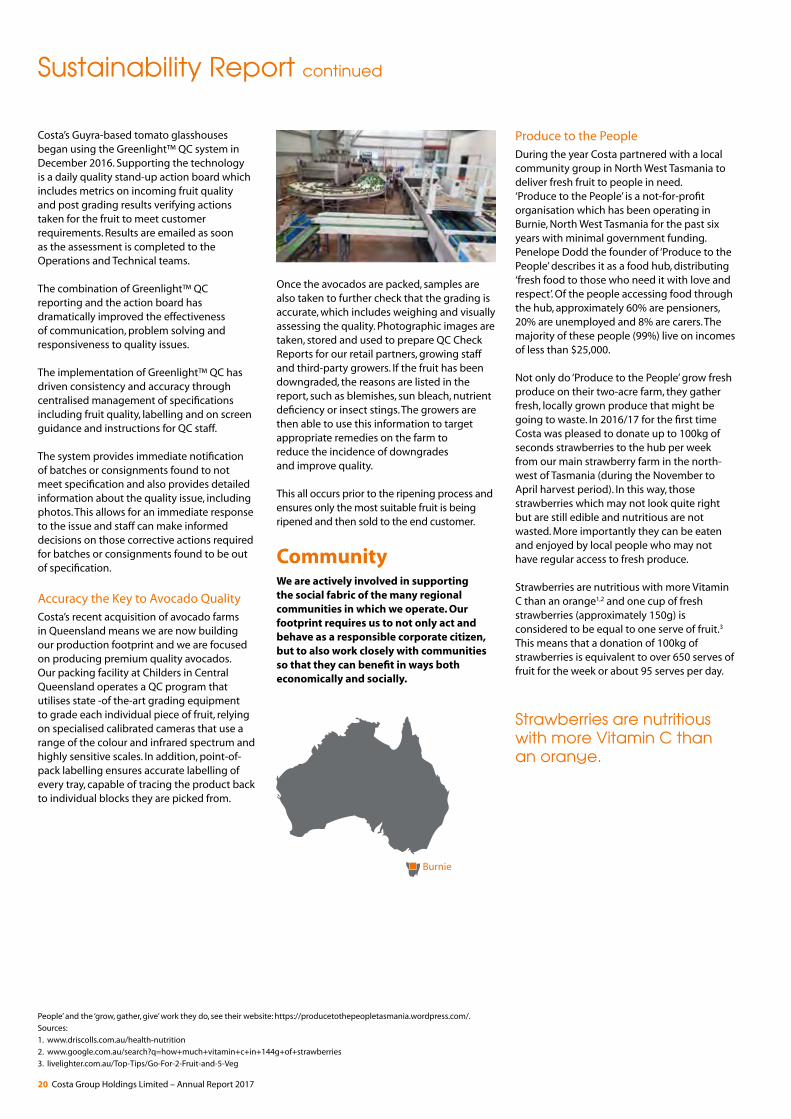
CommunityWe are actively involved in supporting the social fabric of the many regional communities in which we operate. Our footprint requires us to not only act and behave as a responsible corporate citizen, but to also work closely with communities so that they can benefit in ways both economically and socially.
Sustainability Report continued
Produce to the PeopleDuring the year Costa partnered with a local community group in North West Tasmania to deliver fresh fruit to people in need. ‘Produce to the People’ is a not-for-profit organisation which has been operating in Burnie, North West Tasmania for the past six years with minimal government funding. Penelope Dodd the founder of ‘Produce to the People’ describes it as a food hub, distributing ‘fresh food to those who need it with love and respect’. Of the people accessing food through the hub, approximately 60% are pensioners, 20% are unemployed and 8% are carers. The majority of these people (99%) live on incomes of less than $25,000.
Not only do ‘Produce to the People’ grow fresh produce on their two-acre farm, they gather fresh, locally grown produce that might be going to waste. In 2016/17 for the first time Costa was pleased to donate up to 100kg of seconds strawberries to the hub per week from our main strawberry farm in the north- west of Tasmania (during the November to April harvest period). In this way, those strawberries which may not look quite right but are still edible and nutritious are not wasted. More importantly they can be eaten and enjoyed by local people who may not have regular access to fresh produce.
Strawberries are nutritious with more Vitamin C than an orange1,2 and one cup of fresh strawberries (approximately 150g) is considered to be equal to one serve of fruit.3 This means that a donation of 100kg of strawberries is equivalent to over 650 serves of fruit for the week or about 95 serves per day.
People’ and the ‘grow, gather, give’ work they do, see their website: https://producetothepeopletasmania.wordpress.com/.
Sources:
1. www.driscolls.com.au/health-nutrition
2. www.google.com.au/search?q=how+much+vitamin+c+in+144g+of+strawberries
3. livelighter.com.au/Top-Tips/Go-For-2-Fruit-and-5-Veg
Burnie
Strawberries are nutritious with more Vitamin C than an orange.
20 Costa Group Holdings Limited – Annual Report 2017
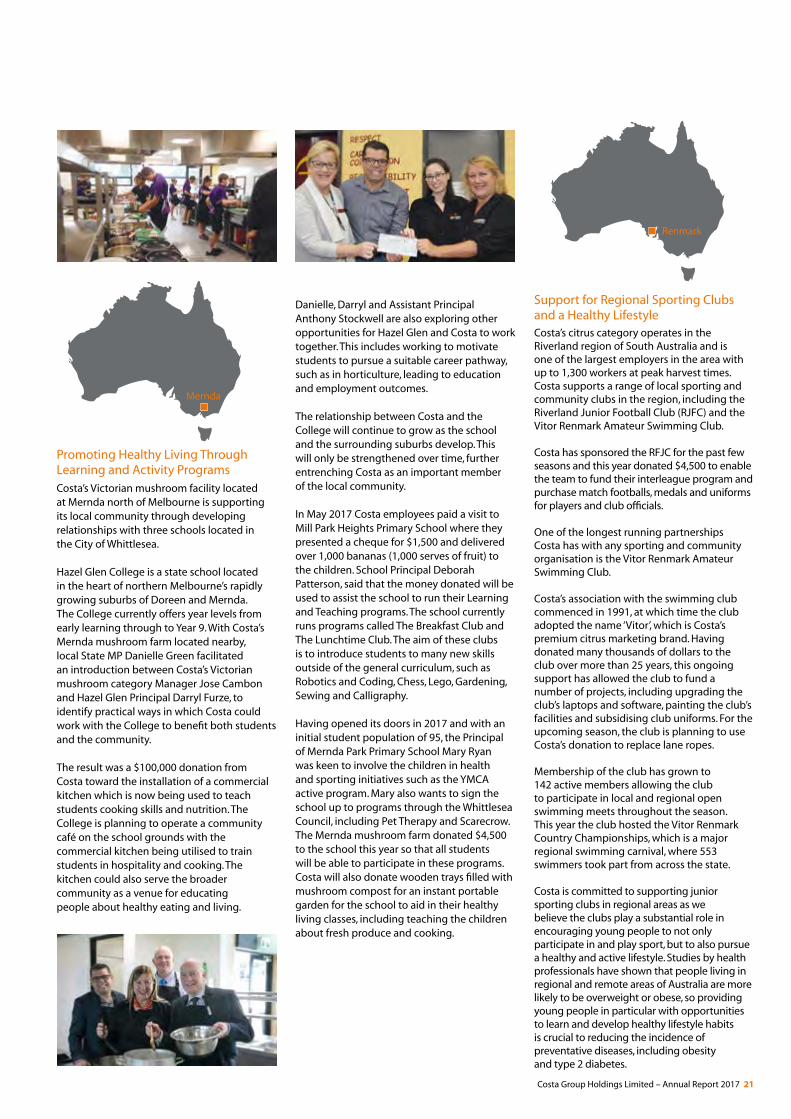
Promoting Healthy Living Through Learning and Activity ProgramsCosta’s Victorian mushroom facility located at Mernda north of Melbourne is supporting its local community through developing relationships with three schools located in the City of Whittlesea.
Hazel Glen College is a state school located in the heart of northern Melbourne’s rapidly growing suburbs of Doreen and Mernda. The College currently offers year levels from early learning through to Year 9. With Costa’s Mernda mushroom farm located nearby, local State MP Danielle Green facilitated an introduction between Costa’s Victorian mushroom category Manager Jose Cambon and Hazel Glen Principal Darryl Furze, to identify practical ways in which Costa could work with the College to benefit both students and the community.
The result was a $100,000 donation from Costa toward the installation of a commercial kitchen which is now being used to teach students cooking skills and nutrition. The College is planning to operate a community café on the school grounds with the commercial kitchen being utilised to train students in hospitality and cooking. The kitchen could also serve the broader community as a venue for educating people about healthy eating and living.
Danielle, Darryl and Assistant Principal Anthony Stockwell are also exploring other opportunities for Hazel Glen and Costa to work together. This includes working to motivate students to pursue a suitable career pathway, such as in horticulture, leading to education and employment outcomes.
The relationship between Costa and the College will continue to grow as the school and the surrounding suburbs develop. This will only be strengthened over time, further entrenching Costa as an important member of the local community.
In May 2017 Costa employees paid a visit to Mill Park Heights Primary School where they presented a cheque for $1,500 and delivered over 1,000 bananas (1,000 serves of fruit) to the children. School Principal Deborah Patterson, said that the money donated will be used to assist the school to run their Learning and Teaching programs. The school currently runs programs called The Breakfast Club and The Lunchtime Club. The aim of these clubs is to introduce students to many new skills outside of the general curriculum, such as Robotics and Coding, Chess, Lego, Gardening, Sewing and Calligraphy.
Having opened its doors in 2017 and with an initial student population of 95, the Principal of Mernda Park Primary School Mary Ryan was keen to involve the children in health and sporting initiatives such as the YMCA active program. Mary also wants to sign the school up to programs through the Whittlesea Council, including Pet Therapy and Scarecrow. The Mernda mushroom farm donated $4,500 to the school this year so that all students will be able to participate in these programs. Costa will also donate wooden trays filled with mushroom compost for an instant portable garden for the school to aid in their healthy living classes, including teaching the children about fresh produce and cooking.
Support for Regional Sporting Clubs and a Healthy LifestyleCosta’s citrus category operates in the Riverland region of South Australia and is one of the largest employers in the area with up to 1,300 workers at peak harvest times. Costa supports a range of local sporting and community clubs in the region, including the Riverland Junior Football Club (RJFC) and the Vitor Renmark Amateur Swimming Club.
Costa has sponsored the RFJC for the past few seasons and this year donated $4,500 to enable the team to fund their interleague program and purchase match footballs, medals and uniforms for players and club officials.
One of the longest running partnerships Costa has with any sporting and community organisation is the Vitor Renmark Amateur Swimming Club.
Costa’s association with the swimming club commenced in 1991, at which time the club adopted the name ‘Vitor’, which is Costa’s premium citrus marketing brand. Having donated many thousands of dollars to the club over more than 25 years, this ongoing support has allowed the club to fund a number of projects, including upgrading the club’s laptops and software, painting the club’s facilities and subsidising club uniforms. For the upcoming season, the club is planning to use Costa’s donation to replace lane ropes.
Membership of the club has grown to 142 active members allowing the club to participate in local and regional open swimming meets throughout the season. This year the club hosted the Vitor Renmark Country Championships, which is a major regional swimming carnival, where 553 swimmers took part from across the state.
Costa is committed to supporting junior sporting clubs in regional areas as we believe the clubs play a substantial role in encouraging young people to not only participate in and play sport, but to also pursue a healthy and active lifestyle. Studies by health professionals have shown that people living in regional and remote areas of Australia are more likely to be overweight or obese, so providing young people in particular with opportunities to learn and develop healthy lifestyle habits is crucial to reducing the incidence of preventative diseases, including obesity and type 2 diabetes.
Mernda
Renmark
Costa Group Holdings Limited – Annual Report 2017 21
22 Costa Group Holdings Limited – Annual Report 201722 Costa Group Holdings Limited – Annual Report 2017
Directors’ Report
The Directors of Costa Group Holdings Ltd and its controlled entities (‘the Group’) present their report together with the financial report of the Group for the financial year ended 25 June 2017.
1. DirectorsThe Directors of the Company at any time during or since the end of the financial year are:
Neil Chatfield M.Bus, FCPA, FAICD Chairman and Independent Non-Executive Director
Director since 7 October 2011 and Chairman since 24 June 2015. Member of the Remuneration Committee and Nomination Committee. Neil ceased to be a member of the Audit and Risk Committee on 17 November 2016.
Neil is an established executive and Non-Executive Director with extensive experience across all facets of company management, and with specific expertise in financial management, capital markets, mergers and acquisitions, and risk management.
Neil is currently the Chair and Non-Executive Director of Seek Limited. Neil is also a Non-Executive Director of Transurban Ltd, Iron Mountain Inc and Launch Housing, a not-for-profit organisation. He was previously a Non-Executive Director of Recall Holdings Ltd (to May 2016), Chair and Non-Executive Director of Virgin Australia Holdings Ltd (to May 2015) and Non-Executive Director of Grange Resources Ltd (to April 2014).
Neil previously served as an Executive Director and Chief Financial Officer of Toll Holdings Ltd (from 1997–2008).
Frank Costa AO OAMNon-Executive Director
Director since 8 June 2011. Member of the Remuneration Committee and Nomination Committee.
Frank has been at the forefront of developing and building the Costa Group into a major horticultural and logistics company for more than 50 years. He has previously served as President of the Geelong Football Club (1998 - 2010) and tirelessly promotes the development of the City of Geelong and surrounding community. Frank has been honoured with an Order of Australia Medal for his services to youth and the community.
During the past four years, Frank has not served as a Director of any other listed company.
Harry Debney BAppSc (Hons)Managing Director and Chief Executive Officer
Director since 5 January 2012 and Managing Director since 24 July 2015.
Since his appointment as CEO in 2010, Harry has overseen the transition of the business from a privately owned company to its listing on the Australian Securities Exchange. Prior to joining Costa, Harry spent 24 years at Visy Industries, including eight years as Chief Executive Officer. During this time, he substantially grew the Visy business, both organically and through acquisitions.
Harry is currently a Non-Executive Director of Kogan.com Ltd.
Kevin Schwartz BSc (Accountancy)Non-Executive Director
Director since 7 October 2011. Member of the Nomination Committee.
Kevin is the Chief Executive Officer of Paine Schwartz Partners (since February 2017) which he co-founded in 2006. He was a Managing Director at the predecessor firm, Fox Paine & Company, which he joined in 2002.
Kevin serves on the Boards of Directors of AgBiTech, Global ID, Verdesian Life Sciences, and Wawona Delaware Holdings, LLC (since April 2017). He is also a member of the Rush Associates Board of the Rush University Medical Center. Kevin has previously served as a Director of Advanta, Seminis, Inc., Sunrise Holdings (Delaware), Inc. and on the Board of United American Energy Corp.
During the past four years, Kevin has not served as a Director of any other listed company.
Costa Group Holdings Limited – Annual Report 2017 23
Directors’ Report continued
Peter Margin BSc (Hons), MBAIndependent Non-Executive Director
Director since 24 June 2015. Chair of the Remuneration Committee and member of the Audit and Risk Committee, and Nomination Committee.
Peter has many years of leadership experience in major Australian and international food companies, including Chief Executive of Goodman Fielder Ltd and before that Chief Executive and Chief Operating Officer of National Foods Ltd. Peter has also held senior executive roles in Simplot Australia Pty Ltd, Pacific Brands Ltd, East Asiatic Company and HJ Heinz Company Australia Ltd and is currently Executive Chairman of Asahi Beverages ANZ.
Peter currently serves as a Non-Executive Director of PACT Group Holdings Ltd, Nufarm Ltd and Bega Cheese Ltd. Peter was previously a Non-Executive Director of the NSX-listed company Ricegrowers Ltd (to August 2015), Chairman and Non-Executive Director of Huon Aquaculture Ltd (to August 2016), and a Non-Executive Director of PMP Ltd (to August 2016).
Tiffany Fuller B.Com, GAICD, ACAIndependent Non-Executive Director
Director since 1 October 2015. Chair of the Audit and Risk Committee and member of the Nomination Committee.
Tiffany has held various accounting, corporate finance, financial advisory and management consulting positions with Arthur Anderson in Australia, the United States and in England and subsequently held roles in investment banking and private equity with Rothschild Australia. Tiffany is an experienced public company Director with broad expertise in finance, strategy, M&A, risk and governance.
Tiffany currently serves as Non-Executive Director of Computershare Ltd and Smart Parking Ltd and is the Chair of the Audit and Risk Committee of both companies.
Janette Kendall B.Bus (Marketing), FAICDIndependent Non-Executive Director
Director since 11 October 2016. Member of the Audit and Risk Committee (from 17 November 2016), and Nomination Committee.
Janette has held various senior management roles in her career including Senior Vice President of Marketing at Galaxy Entertainment Group in Macau, China; Executive General Manager of Marketing at Crown Melbourne; General Manager, Pacific Brands; Managing Director of emitch Limited; and Managing Director of Clemenger Digital and Clemenger Proximity.
Janette is currently a Non-Executive Director of Wellcom Group (ASX: WLL), Nine Entertainment (ASX: NEC) and the Melbourne Theatre Company.
2. Company SecretaryDavid Thomas LLB, BSc (Hons)Mr Thomas joined the Company as General Counsel in July 2012 and was appointed to the position of Company Secretary in October 2012. In addition to being the Company Secretary, Mr Thomas oversees the Group’s legal department and advises the Group on legal, risk and compliance matters. Prior to joining the Company, Mr Thomas was a Partner of Middletons (now K&L Gates), practising in corporate and commercial law. He has over 24 years’ experience in legal practice.
3. Officers Who Were Previously Partners of the Audit Firm There are no officers of the Company during the financial year that were previously partners of the current audit firm, KPMG, at a time when KPMG undertook an audit of the Group.
24 Costa Group Holdings Limited – Annual Report 2017
4. Directors’ MeetingsThe number of Directors’ meetings (including meetings of committees of Directors) and number of meetings attended by each of the Directors of the Company during the financial year are:
Board MeetingsAudit and Risk
Committee MeetingsRemuneration
Committee MeetingsNomination
Committee Meetings
Director Held Attended Held Attended Held Attended Held Attended
Neil Chatfield 1 7 7 4 4 3 3 2 2
Frank Costa 7 7 - - 3 3 2 2
Harry Debney 7 7 - - - - - -
Kevin Schwartz 7 5 - - - - 2 2
Peter Margin 7 7 7 6 3 3 2 2
Tiffany Fuller 7 7 7 7 - - 2 2
Janette Kendall ² 4 4 4 4 - - 2 2
1. Mr Chatfield was a member of the Audit and Risk Committee until 17 November 2016.
2. Ms Kendall joined the Audit and Risk Committee on 17 November 2016.
5. Principal ActivitiesCosta Group is Australia’s leading horticulture group and is the largest fresh produce supplier to the major Australian food retailers. The Group’s principal activities during the year were:
• the growing of mushrooms, blueberries, raspberries, glasshouse grown tomatoes, citrus, avocados and other selected fruits within Australia;
• the packing, marketing and distribution of fruit and vegetables within Australia and to export markets;
• provision of chilled logistics warehousing and services within Australia; and
• licensing of proprietary blueberry varieties and berry farming in international markets.
No significant change in the nature of these activities occurred during the year.
6. Significant Changes in State of Affairs During the Year During the year, the Group entered into a strategic relationship with Macquarie Agriculture Funds Management (Macquarie) to jointly investigate compelling M&A projects in farmland, biological assets, water and infrastructure assets to enable Costa to extend its capacity to gain significant economic benefit for its shareholders.
Under the agreement, Macquarie will purchase the assets and enter into a 20-year lease with Costa to operate them, with an option for Costa to extend a further 10 years. Costa maintains the full horticultural income from these assets.
Costa Group Holdings Limited – Annual Report 2017 25
Directors’ Report continued
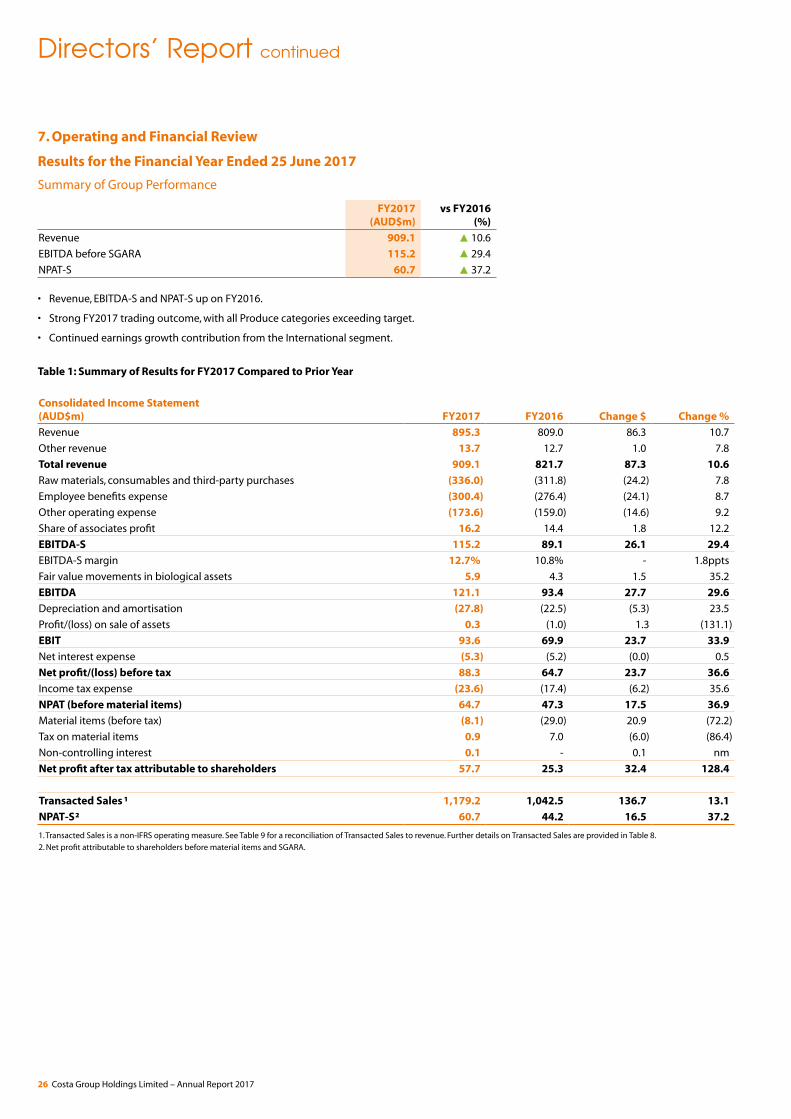
7. Operating and Financial Review
Results for the Financial Year Ended 25 June 2017
Summary of Group Performance
FY2017 (AUD$m)
vs FY2016(%)
Revenue 909.1 10.6
EBITDA before SGARA 115.2 29.4
NPAT-S 60.7 37.2
• Revenue, EBITDA-S and NPAT-S up on FY2016.
• Strong FY2017 trading outcome, with all Produce categories exceeding target.
• Continued earnings growth contribution from the International segment.
Table 1: Summary of Results for FY2017 Compared to Prior Year
Consolidated Income Statement (AUD$m) FY2017 FY2016 Change $ Change %
Revenue 895.3 809.0 86.3 10.7
Other revenue 13.7 12.7 1.0 7.8
Total revenue 909.1 821.7 87.3 10.6
Raw materials, consumables and third-party purchases (336.0) (311.8) (24.2) 7.8
Employee benefits expense (300.4) (276.4) (24.1) 8.7
Other operating expense (173.6) (159.0) (14.6) 9.2
Share of associates profit 16.2 14.4 1.8 12.2
EBITDA-S 115.2 89.1 26.1 29.4
EBITDA-S margin 12.7% 10.8% - 1.8ppts
Fair value movements in biological assets 5.9 4.3 1.5 35.2
EBITDA 121.1 93.4 27.7 29.6
Depreciation and amortisation (27.8) (22.5) (5.3) 23.5
Profit/(loss) on sale of assets 0.3 (1.0) 1.3 (131.1)
EBIT 93.6 69.9 23.7 33.9
Net interest expense (5.3) (5.2) (0.0) 0.5
Net profit/(loss) before tax 88.3 64.7 23.7 36.6
Income tax expense (23.6) (17.4) (6.2) 35.6
NPAT (before material items) 64.7 47.3 17.5 36.9
Material items (before tax) (8.1) (29.0) 20.9 (72.2)
Tax on material items 0.9 7.0 (6.0) (86.4)
Non-controlling interest 0.1 - 0.1 nm
Net profit after tax attributable to shareholders 57.7 25.3 32.4 128.4
Transacted Sales ¹ 1,179.2 1,042.5 136.7 13.1
NPAT-S² 60.7 44.2 16.5 37.2
1. Transacted Sales is a non-IFRS operating measure. See Table 9 for a reconciliation of Transacted Sales to revenue. Further details on Transacted Sales are provided in Table 8.
2. Net profit attributable to shareholders before material items and SGARA.
26 Costa Group Holdings Limited – Annual Report 2017
Financial highlights
RevenueRevenue increased by $87.3 million from the prior year with all reportable segments achieving growth. The Produce segment recorded strong growth with notable contributions from the berry and avocado categories.
Operating ExpensesRaw materials, consumables and third-party purchases and employee benefits expenses increased in line with the growth across the domestic and international businesses.
Other operating expenses increased $14.6 million. This includes a $5 million onerous lease provision taken up for the Eastern Creek DC.
Share of Associates ProfitProfits from joint ventures grew by $1.8 million driven by increased contribution from the African Blue and Driscoll’s JVs. This was partially offset by a reduction in the Polar Fresh earnings contribution following the exit from the Parkinson and Eastern Creek sites.
EBITDA Before SGARAEBITDA before SGARA increased by $26.1 million from prior year driven by the Produce and International segments. The increase in Produce was predominantly led by strong growth in the berry category, excellent citrus performance and recovery in the tomato category from the challenging 2016 market conditions. This was partially offset by the $5 million onerous lease provision recognised in the CF&L segment.
Fair Value Movements in Biological AssetsSGARA movement was $5.9 million largely driven by the strong yields and pricing for the 2017 season citrus crop together with crop timing.
Depreciation and AmortisationDepreciation and amortisation increased by $5.3 million in line with increased capital expenditure on the berry domestic growth projects as well as the China farming operations.
Net Interest ExpenseNet finance cost up $0.1 million from FY2016, primarily due to write-off of capitalised borrowing costs as the Group refinanced its banking facilities in June 2017.
Tax Expense Higher tax expense due to increased earnings. Effective tax rate of 26.7%, down from 26.9% in FY2016. This was due to higher contribution from the International segment (as Costa’s foreign operations yield a lower effective tax rate than the domestic business), offset partially by higher non-deductible expenditure in FY2017.
Material ItemsMaterial items for FY2017 were $8.1 million which related to the wind-up of the Polar Fresh joint venture and finalisation of pre-IPO site closure provisions.
NPAT-SNPAT-S increased by $16.5 million from prior year due to factors described above. Higher EBITDA-S was offset by an increase in depreciation and amortisation expense.
DividendsThe Board declared a final dividend of 7.0 cents per share on 23 August 2017. This brings the total dividend payment for FY2017 to 11.0 cents per share which equates to approximately 58% of NPAT-S before material items. Dividends are expected to be fully franked.
Costa Group Holdings Limited – Annual Report 2017 27
Directors’ Report continued
Segment Information
Produce
Highlights of financial results:
FY2017 (AUD$m)
vs FY2016(%)
Transacted Sales 1,028.5 12.6
Revenue 786.2 9.4
EBITDA-S 96.7 38.6
Figure 1: Revenue, Transacted Sales and EBITDA before SGARA Results
69.8m
96.7m
EBITDAbeforeSGARA
Revenue
TransactedSales
FY2016 FY2017
718.9m
786.2m
913.6m
1,028.5m
Table 2: Selected Financial Information for the Produce Segment
Produce AUD$m FY2017 FY2016 Change
Transacted Sales 1,028.5 913.6 115.0
Revenue 786.2 718.9 67.3
EBTIDA-S 96.7 69.8 26.9
EBITDA-S margin 12.3% 9.7% 2.6%
Produce revenue increased by $67.3 million on FY2016. The drivers for the increase include:
• strong growth in the berry category driven by expanded planted area and strong blueberry performance, partially offset by a raspberry season impacted by cooler weather resulting in lower than expected yields;
• contribution from the avocado category with the addition of the Childers farm acquired in January 2017¹; and
• market recovery in tomatoes from a poor 2016 season and improved sales mix with better correlation of growing areas with demand.
This was partially offset by lower citrus category revenue due to the calendar 2016 season being an ‘off-year’ cycle with lower volume of production.
EBITDA before SGARA increased by $26.9 million against FY2016. This was predominantly driven by revenue growth in the berry, tomato and avocado categories as well as strong export demand in the citrus category.
1. Acquisition of the Childers avocado orchards has been completed in conjunction with Macquarie Agriculture Funds Management (Macquarie). Under the agreement, Macquarie purchased the land, biological assets, water and infrastructure assets with Costa entering into a 20-year lease with Macquarie to operate the orchards. Mushroom
-10.0%
0.0%
10%
20%
30%
Revenue Growth % on FY2016
Berry Tomato Citrus Avocado
3%
26.8
%
13.4
%
25.5
%
2.2%
-4.0
%
28 Costa Group Holdings Limited – Annual Report 2017
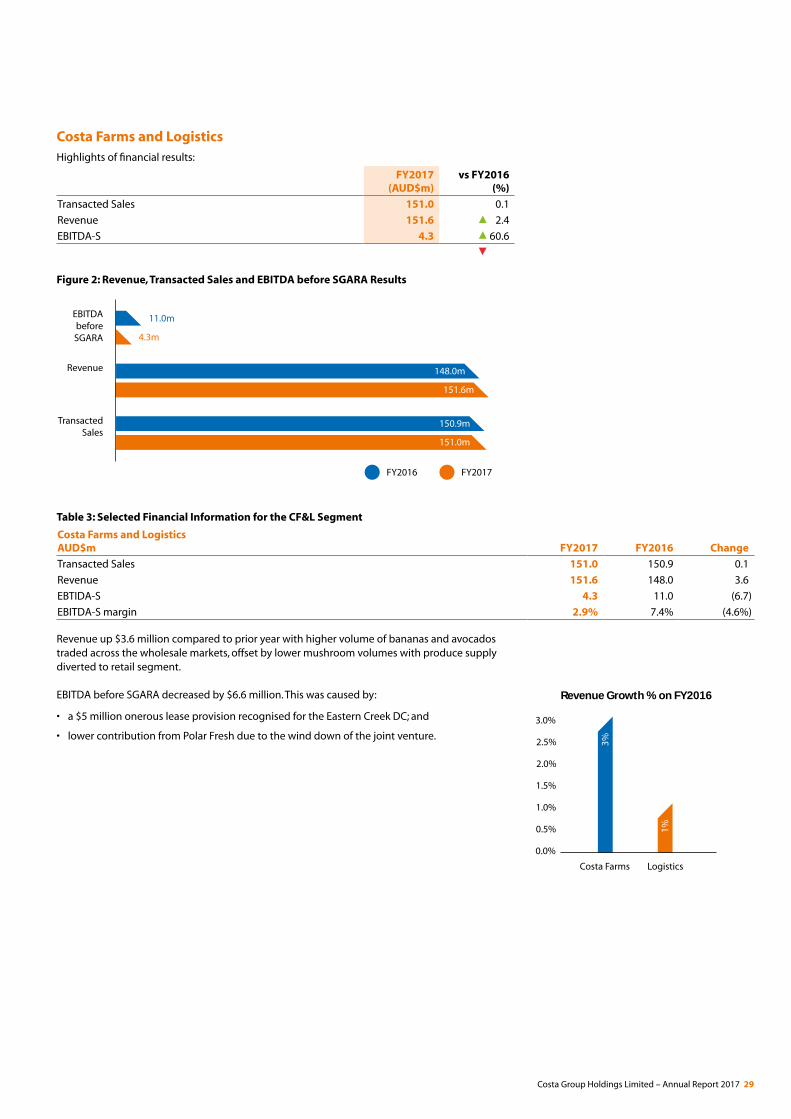
Costa Farms and LogisticsHighlights of financial results:
FY2017 (AUD$m)
vs FY2016(%)
Transacted Sales 151.0 0.1
Revenue 151.6 2.4
EBITDA-S 4.3 60.6
Figure 2: Revenue, Transacted Sales and EBITDA before SGARA Results
11.0m
4.3m
EBITDAbeforeSGARA
Revenue
TransactedSales
148.0m
151.6m
150.9m
151.0m
FY2016 FY2017
Table 3: Selected Financial Information for the CF&L Segment
Costa Farms and Logistics AUD$m FY2017 FY2016 Change
Transacted Sales 151.0 150.9 0.1
Revenue 151.6 148.0 3.6
EBTIDA-S 4.3 11.0 (6.7)
EBITDA-S margin 2.9% 7.4% (4.6%)
Revenue up $3.6 million compared to prior year with higher volume of bananas and avocados traded across the wholesale markets, offset by lower mushroom volumes with produce supply diverted to retail segment.
EBITDA before SGARA decreased by $6.6 million. This was caused by:
• a $5 million onerous lease provision recognised for the Eastern Creek DC; and
• lower contribution from Polar Fresh due to the wind down of the joint venture.
Costa Farms
Revenue Growth % on FY2016
Logistics
3%
1%
0.0%
0.5%
1.0%
1.5%
2.0%
2.5%
3.0%
Costa Group Holdings Limited – Annual Report 2017 29
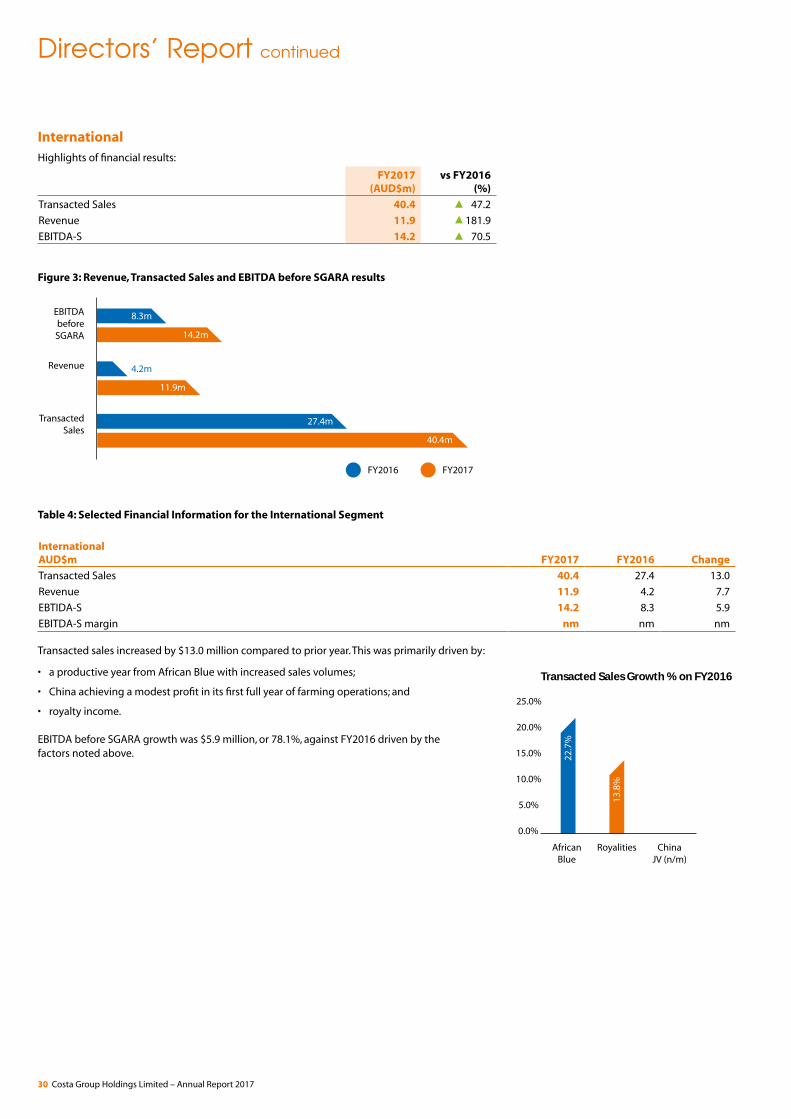
Directors’ Report continued
InternationalHighlights of financial results:
FY2017 (AUD$m)
vs FY2016(%)
Transacted Sales 40.4 47.2
Revenue 11.9 181.9
EBITDA-S 14.2 70.5
Figure 3: Revenue, Transacted Sales and EBITDA before SGARA results
EBITDAbeforeSGARA
Revenue
TransactedSales
4.2m
11.9m
27.4m
40.4m
FY2016 FY2017
8.3m
14.2m
Table 4: Selected Financial Information for the International Segment
International AUD$m FY2017 FY2016 Change
Transacted Sales 40.4 27.4 13.0
Revenue 11.9 4.2 7.7
EBTIDA-S 14.2 8.3 5.9
EBITDA-S margin nm nm nm
Transacted sales increased by $13.0 million compared to prior year. This was primarily driven by:
• a productive year from African Blue with increased sales volumes;
• China achieving a modest profit in its first full year of farming operations; and
• royalty income.
EBITDA before SGARA growth was $5.9 million, or 78.1%, against FY2016 driven by the factors noted above.
AfricanBlue
Royalities ChinaJV (n/m)
Transacted Sales Growth % on FY2016
0.0%
5.0%
10.0%
15.0%
20.0%
25.0%
13.8
%
22.7
%
30 Costa Group Holdings Limited – Annual Report 2017
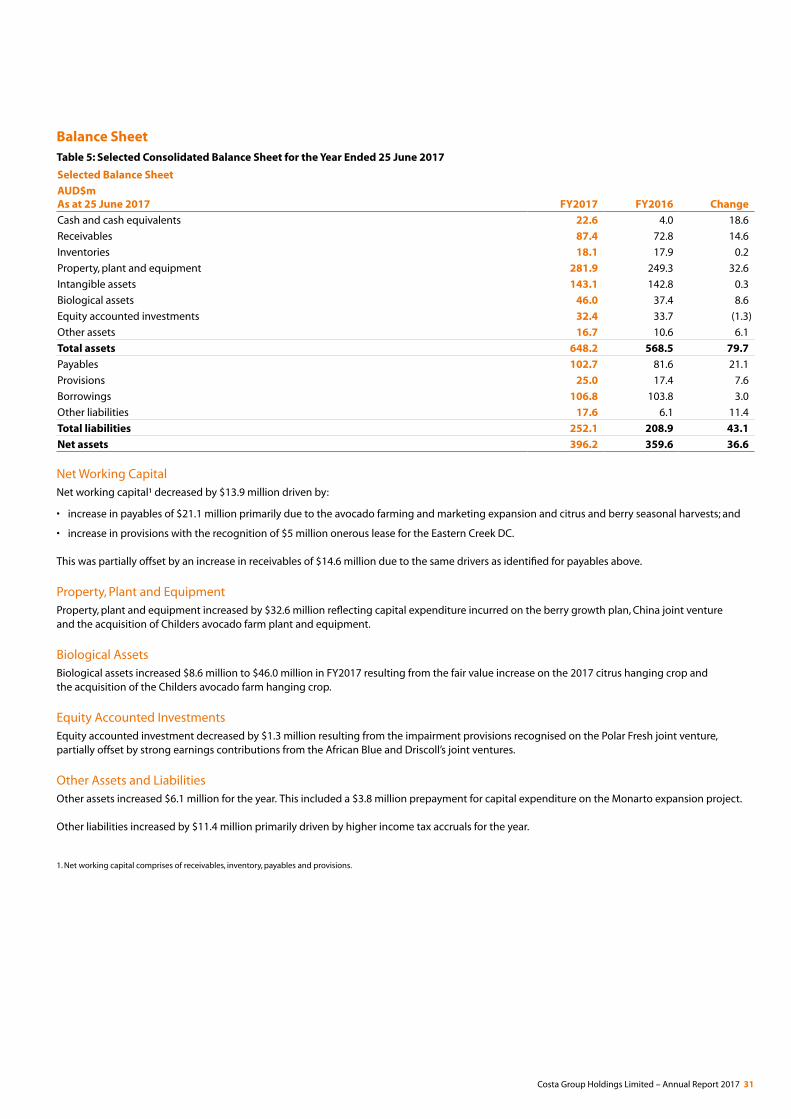
Balance SheetTable 5: Selected Consolidated Balance Sheet for the Year Ended 25 June 2017
Selected Balance Sheet
AUD$mAs at 25 June 2017 FY2017 FY2016 Change
Cash and cash equivalents 22.6 4.0 18.6
Receivables 87.4 72.8 14.6
Inventories 18.1 17.9 0.2
Property, plant and equipment 281.9 249.3 32.6
Intangible assets 143.1 142.8 0.3
Biological assets 46.0 37.4 8.6
Equity accounted investments 32.4 33.7 (1.3)
Other assets 16.7 10.6 6.1
Total assets 648.2 568.5 79.7
Payables 102.7 81.6 21.1
Provisions 25.0 17.4 7.6
Borrowings 106.8 103.8 3.0
Other liabilities 17.6 6.1 11.4
Total liabilities 252.1 208.9 43.1
Net assets 396.2 359.6 36.6
Net Working CapitalNet working capital¹ decreased by $13.9 million driven by:
• increase in payables of $21.1 million primarily due to the avocado farming and marketing expansion and citrus and berry seasonal harvests; and
• increase in provisions with the recognition of $5 million onerous lease for the Eastern Creek DC.
This was partially offset by an increase in receivables of $14.6 million due to the same drivers as identified for payables above.
Property, Plant and EquipmentProperty, plant and equipment increased by $32.6 million reflecting capital expenditure incurred on the berry growth plan, China joint venture and the acquisition of Childers avocado farm plant and equipment.
Biological AssetsBiological assets increased $8.6 million to $46.0 million in FY2017 resulting from the fair value increase on the 2017 citrus hanging crop and the acquisition of the Childers avocado farm hanging crop.
Equity Accounted InvestmentsEquity accounted investment decreased by $1.3 million resulting from the impairment provisions recognised on the Polar Fresh joint venture, partially offset by strong earnings contributions from the African Blue and Driscoll’s joint ventures.
Other Assets and LiabilitiesOther assets increased $6.1 million for the year. This included a $3.8 million prepayment for capital expenditure on the Monarto expansion project.
Other liabilities increased by $11.4 million primarily driven by higher income tax accruals for the year.
1. Net working capital comprises of receivables, inventory, payables and provisions.
Costa Group Holdings Limited – Annual Report 2017 31
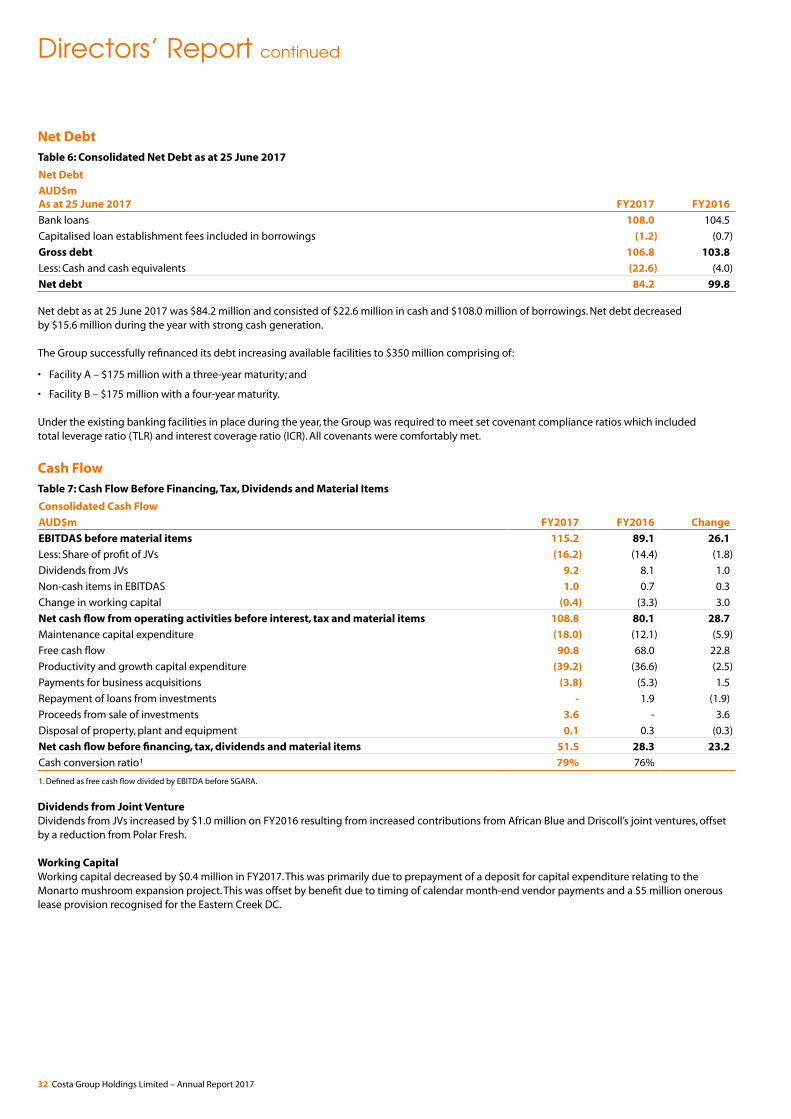
Directors’ Report continued
Net DebtTable 6: Consolidated Net Debt as at 25 June 2017
Net Debt
AUD$mAs at 25 June 2017 FY2017 FY2016
Bank loans 108.0 104.5
Capitalised loan establishment fees included in borrowings (1.2) (0.7)
Gross debt 106.8 103.8
Less: Cash and cash equivalents (22.6) (4.0)
Net debt 84.2 99.8
Net debt as at 25 June 2017 was $84.2 million and consisted of $22.6 million in cash and $108.0 million of borrowings. Net debt decreased by $15.6 million during the year with strong cash generation.
The Group successfully refinanced its debt increasing available facilities to $350 million comprising of:
• Facility A – $175 million with a three-year maturity; and
• Facility B – $175 million with a four-year maturity.
Under the existing banking facilities in place during the year, the Group was required to meet set covenant compliance ratios which included total leverage ratio (TLR) and interest coverage ratio (ICR). All covenants were comfortably met.
Cash FlowTable 7: Cash Flow Before Financing, Tax, Dividends and Material Items
Consolidated Cash Flow
AUD$m FY2017 FY2016 Change
EBITDAS before material items 115.2 89.1 26.1
Less: Share of profit of JVs (16.2) (14.4) (1.8)
Dividends from JVs 9.2 8.1 1.0
Non-cash items in EBITDAS 1.0 0.7 0.3
Change in working capital (0.4) (3.3) 3.0
Net cash flow from operating activities before interest, tax and material items 108.8 80.1 28.7
Maintenance capital expenditure (18.0) (12.1) (5.9)
Free cash flow 90.8 68.0 22.8
Productivity and growth capital expenditure (39.2) (36.6) (2.5)
Payments for business acquisitions (3.8) (5.3) 1.5
Repayment of loans from investments - 1.9 (1.9)
Proceeds from sale of investments 3.6 - 3.6
Disposal of property, plant and equipment 0.1 0.3 (0.3)
Net cash flow before financing, tax, dividends and material items 51.5 28.3 23.2
Cash conversion ratio¹ 79% 76%
1. Defined as free cash flow divided by EBITDA before SGARA.
Dividends from Joint VentureDividends from JVs increased by $1.0 million on FY2016 resulting from increased contributions from African Blue and Driscoll’s joint ventures, offset by a reduction from Polar Fresh.
Working CapitalWorking capital decreased by $0.4 million in FY2017. This was primarily due to prepayment of a deposit for capital expenditure relating to the Monarto mushroom expansion project. This was offset by benefit due to timing of calendar month-end vendor payments and a $5 million onerous lease provision recognised for the Eastern Creek DC.
32 Costa Group Holdings Limited – Annual Report 2017
Capital ExpenditureOperating capital expenditure increased by $5.9 million against FY2016. This includes investment in back-up generators and part payment for the Murtho citrus pack-house upgrade.
Productivity and growth capital expenditure was $46.1 million for the year and comprises of:
• $3.0 million plant and equipment for the Childers avocado farm;
• $8.7 million for China including the asset transfer from Driscoll’s; and
• domestic berry expansion projects.
Other Material Items in Cash FlowPayments for business acquisitions comprises of a purchase of a small berry farm in Tasmania. Proceeds from sale of investments relates to the sale of the River Rain irrigation business (non-core asset).
Material Business RisksThe material business risks faced by the Company that are likely to have an effect on the financial prospects of the Company are:
• Production risks: Changes in weather, climate or water availability can cause price and yield volatility for Costa. Prices can also be negatively impacted by excess supply. Costa partially mitigates against weather risk by investing in weather protective growing environments and equipment. Approximately 75% of Costa’s produce-related EBITDA before SGARA is derived from crops currently grown under cover indoors or under permanent tunnels. While protected cropping reduces the risk of disease, this risk is still apparent. If Costa’s existing water rights are reduced by regulatory changes or if Costa is unable to secure sufficient water for the implementation of its growth projects, this could negatively impact on Costa’s operational and financial performance.
• Brand risk: Quality issues, product recall, contamination, public health issues, disputes or adverse media coverage could damage Costa’s brands or their image which could adversely impact Costa’s financial performance.
• Customer risk: Costa’s top three customers comprised approximately 70% of FY2016 produce sales. Most customer arrangements are uncontracted and supplied at market prices which are subject to fluctuation. Any contractual agreements have supply periods typically for one season or one to two years.
• Regulatory changes: Costa is a significant beneficiary of the import restrictions in place for fresh fruits and vegetables including mushrooms, bananas, tomatoes and berries. Any changes to these import restrictions could have an adverse impact on margins and volumes. However, the perishable nature of certain produce also acts as a natural barrier against imports. As Costa operates in the food sector, it is also required to comply with a wide range of other laws and regulations which include food standards, labelling and packaging, fair trading and consumer protection, environment, quarantine rules, customs, etc. Any change to the rules could adversely impact Costa’s operations in the form of higher costs and lower margins for the business.
• Competition from new market entrants: While Costa’s operations currently benefit from scale and access to superior genetics, this competitive landscape may change over time. If one or more competitors or new market entrants obtained access to favourable genetic varieties which compete in the same categories as those of Costa, or if they achieve greater scale, this could have a material adverse impact on the financial performance and prospects of Costa.
• Foreign exchange risk: Costa is exposed to foreign exchange risk from a number of sources, namely from the export of produce to various countries including Japan and the United States, and through the earnings it generates from its international operations, including the African Blue and China joint ventures. Unfavourable movements in the foreign exchange rates between the Australian dollar and other currencies such as the US dollar, Japanese yen and Moroccan dirham can have a material adverse impact on the overall financial performance of Costa.
• Sovereign risk associated with foreign operations: Costa has significant interests in the African Blue JV in Morocco and its joint venture with Driscoll’s Strawberry Associates Inc. in China. A change in the laws, regulations, policies, government or political and legal system in Morocco or China could materially and adversely impact Costa’s net assets or profitability.
Costa Group Holdings Limited – Annual Report 2017 33
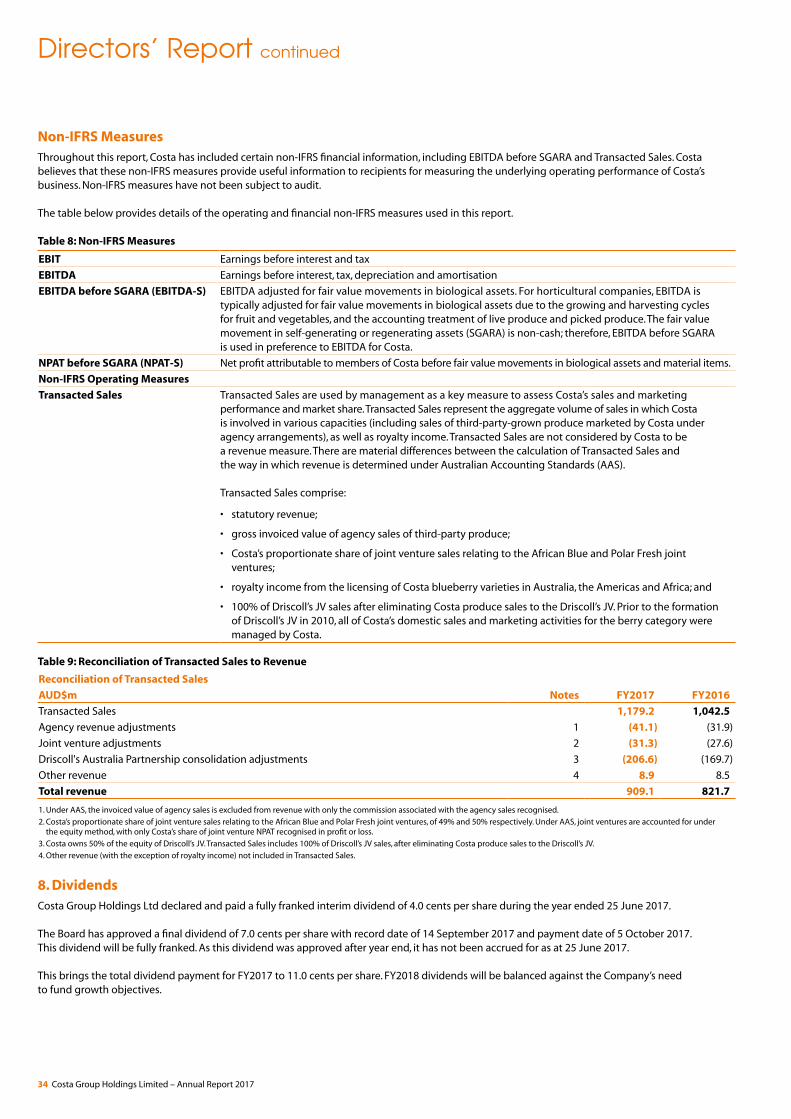
Directors’ Report continued
Non-IFRS MeasuresThroughout this report, Costa has included certain non-IFRS financial information, including EBITDA before SGARA and Transacted Sales. Costa believes that these non-IFRS measures provide useful information to recipients for measuring the underlying operating performance of Costa’s business. Non-IFRS measures have not been subject to audit.
The table below provides details of the operating and financial non-IFRS measures used in this report.
Table 8: Non-IFRS Measures
EBIT Earnings before interest and tax
EBITDA Earnings before interest, tax, depreciation and amortisation
EBITDA before SGARA (EBITDA-S) EBITDA adjusted for fair value movements in biological assets. For horticultural companies, EBITDA is typically adjusted for fair value movements in biological assets due to the growing and harvesting cycles for fruit and vegetables, and the accounting treatment of live produce and picked produce. The fair value movement in self-generating or regenerating assets (SGARA) is non-cash; therefore, EBITDA before SGARA is used in preference to EBITDA for Costa.
NPAT before SGARA (NPAT-S) Net profit attributable to members of Costa before fair value movements in biological assets and material items.
Non-IFRS Operating Measures
Transacted Sales Transacted Sales are used by management as a key measure to assess Costa’s sales and marketing performance and market share. Transacted Sales represent the aggregate volume of sales in which Costa is involved in various capacities (including sales of third-party-grown produce marketed by Costa under agency arrangements), as well as royalty income. Transacted Sales are not considered by Costa to be a revenue measure. There are material differences between the calculation of Transacted Sales and the way in which revenue is determined under Australian Accounting Standards (AAS).
Transacted Sales comprise:
• statutory revenue;
• gross invoiced value of agency sales of third-party produce;
• Costa’s proportionate share of joint venture sales relating to the African Blue and Polar Fresh joint ventures;
• royalty income from the licensing of Costa blueberry varieties in Australia, the Americas and Africa; and
• 100% of Driscoll’s JV sales after eliminating Costa produce sales to the Driscoll’s JV. Prior to the formation of Driscoll’s JV in 2010, all of Costa’s domestic sales and marketing activities for the berry category were managed by Costa.
Table 9: Reconciliation of Transacted Sales to Revenue
Reconciliation of Transacted Sales
AUD$m Notes FY2017 FY2016
Transacted Sales 1,179.2 1,042.5
Agency revenue adjustments 1 (41.1) (31.9)
Joint venture adjustments 2 (31.3) (27.6)
Driscoll's Australia Partnership consolidation adjustments 3 (206.6) (169.7)
Other revenue 4 8.9 8.5
Total revenue 909.1 821.7
1. Under AAS, the invoiced value of agency sales is excluded from revenue with only the commission associated with the agency sales recognised.
2. Costa’s proportionate share of joint venture sales relating to the African Blue and Polar Fresh joint ventures, of 49% and 50% respectively. Under AAS, joint ventures are accounted for under the equity method, with only Costa’s share of joint venture NPAT recognised in profit or loss.
3. Costa owns 50% of the equity of Driscoll’s JV. Transacted Sales includes 100% of Driscoll’s JV sales, after eliminating Costa produce sales to the Driscoll’s JV.
4. Other revenue (with the exception of royalty income) not included in Transacted Sales.
8. DividendsCosta Group Holdings Ltd declared and paid a fully franked interim dividend of 4.0 cents per share during the year ended 25 June 2017.
The Board has approved a final dividend of 7.0 cents per share with record date of 14 September 2017 and payment date of 5 October 2017. This dividend will be fully franked. As this dividend was approved after year end, it has not been accrued for as at 25 June 2017.
This brings the total dividend payment for FY2017 to 11.0 cents per share. FY2018 dividends will be balanced against the Company’s need to fund growth objectives.
34 Costa Group Holdings Limited – Annual Report 2017
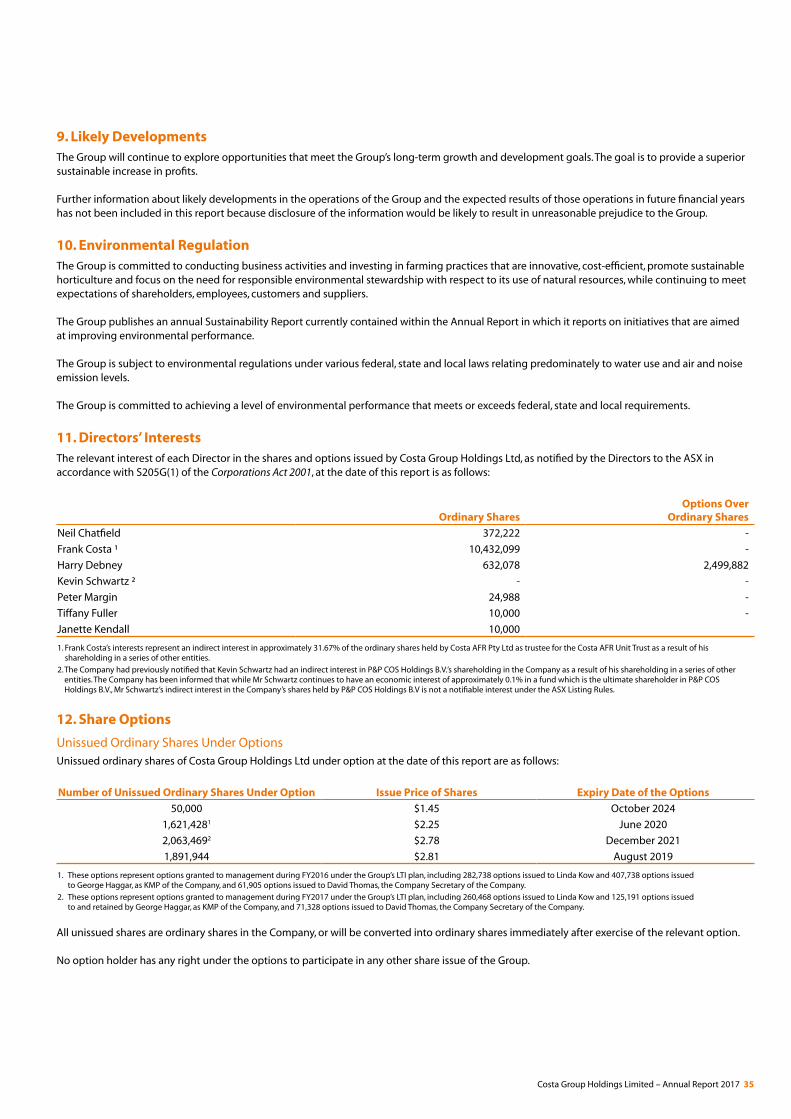
9. Likely DevelopmentsThe Group will continue to explore opportunities that meet the Group’s long-term growth and development goals. The goal is to provide a superior sustainable increase in profits.
Further information about likely developments in the operations of the Group and the expected results of those operations in future financial years has not been included in this report because disclosure of the information would be likely to result in unreasonable prejudice to the Group.
10. Environmental Regulation The Group is committed to conducting business activities and investing in farming practices that are innovative, cost-efficient, promote sustainable horticulture and focus on the need for responsible environmental stewardship with respect to its use of natural resources, while continuing to meet expectations of shareholders, employees, customers and suppliers.
The Group publishes an annual Sustainability Report currently contained within the Annual Report in which it reports on initiatives that are aimed at improving environmental performance.
The Group is subject to environmental regulations under various federal, state and local laws relating predominately to water use and air and noise emission levels.
The Group is committed to achieving a level of environmental performance that meets or exceeds federal, state and local requirements.
11. Directors’ InterestsThe relevant interest of each Director in the shares and options issued by Costa Group Holdings Ltd, as notified by the Directors to the ASX in accordance with S205G(1) of the Corporations Act 2001, at the date of this report is as follows:
Ordinary SharesOptions Over
Ordinary Shares
Neil Chatfield 372,222 -
Frank Costa ¹ 10,432,099 -
Harry Debney 632,078 2,499,882
Kevin Schwartz ² - -
Peter Margin 24,988 -
Tiffany Fuller 10,000 -
Janette Kendall 10,000
1. Frank Costa’s interests represent an indirect interest in approximately 31.67% of the ordinary shares held by Costa AFR Pty Ltd as trustee for the Costa AFR Unit Trust as a result of his shareholding in a series of other entities.
2. The Company had previously notified that Kevin Schwartz had an indirect interest in P&P COS Holdings B.V.’s shareholding in the Company as a result of his shareholding in a series of other entities. The Company has been informed that while Mr Schwartz continues to have an economic interest of approximately 0.1% in a fund which is the ultimate shareholder in P&P COS Holdings B.V., Mr Schwartz’s indirect interest in the Company’s shares held by P&P COS Holdings B.V is not a notifiable interest under the ASX Listing Rules.
12. Share Options
Unissued Ordinary Shares Under OptionsUnissued ordinary shares of Costa Group Holdings Ltd under option at the date of this report are as follows:
Number of Unissued Ordinary Shares Under Option Issue Price of Shares Expiry Date of the Options
50,000 $1.45 October 2024
1,621,4281 $2.25 June 2020
2,063,4692 $2.78 December 2021
1,891,944 $2.81 August 2019
1. These options represent options granted to management during FY2016 under the Group’s LTI plan, including 282,738 options issued to Linda Kow and 407,738 options issued to George Haggar, as KMP of the Company, and 61,905 options issued to David Thomas, the Company Secretary of the Company.
2. These options represent options granted to management during FY2017 under the Group’s LTI plan, including 260,468 options issued to Linda Kow and 125,191 options issued to and retained by George Haggar, as KMP of the Company, and 71,328 options issued to David Thomas, the Company Secretary of the Company.
All unissued shares are ordinary shares in the Company, or will be converted into ordinary shares immediately after exercise of the relevant option.
No option holder has any right under the options to participate in any other share issue of the Group.
Costa Group Holdings Limited – Annual Report 2017 35
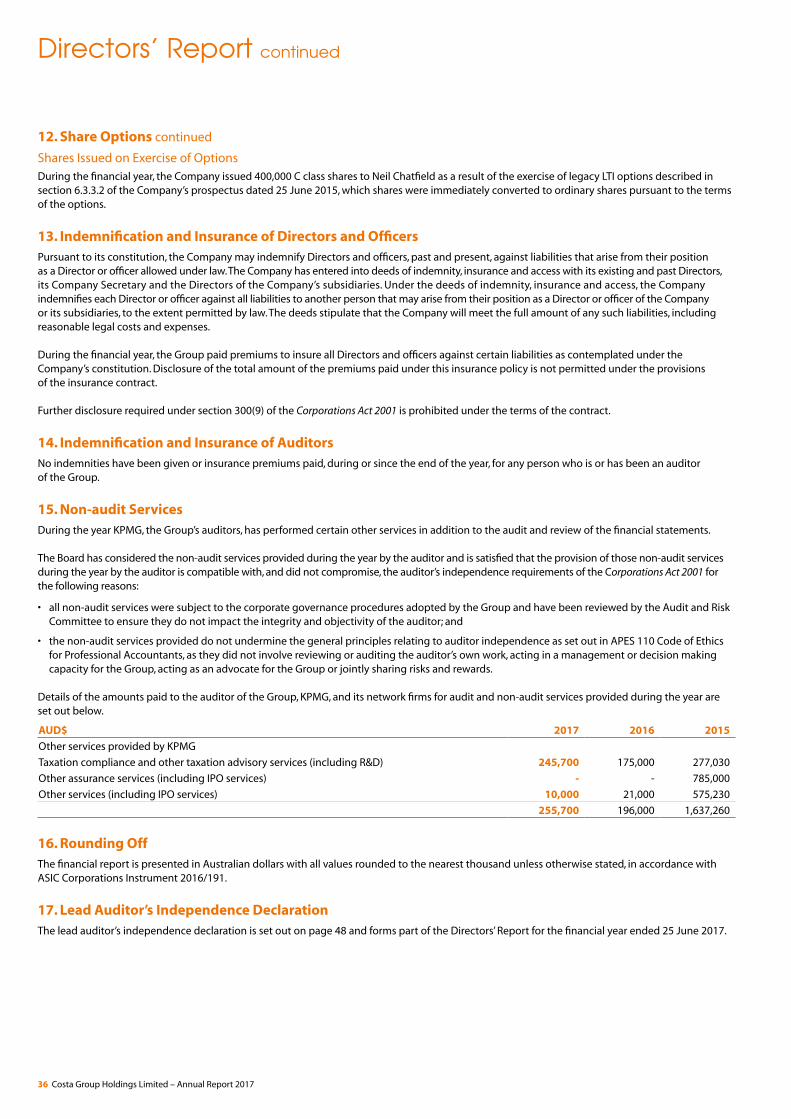
Directors’ Report continued
12. Share Options continued
Shares Issued on Exercise of OptionsDuring the financial year, the Company issued 400,000 C class shares to Neil Chatfield as a result of the exercise of legacy LTI options described in section 6.3.3.2 of the Company’s prospectus dated 25 June 2015, which shares were immediately converted to ordinary shares pursuant to the terms of the options.
13. Indemnification and Insurance of Directors and Officers Pursuant to its constitution, the Company may indemnify Directors and officers, past and present, against liabilities that arise from their position as a Director or officer allowed under law. The Company has entered into deeds of indemnity, insurance and access with its existing and past Directors, its Company Secretary and the Directors of the Company’s subsidiaries. Under the deeds of indemnity, insurance and access, the Company indemnifies each Director or officer against all liabilities to another person that may arise from their position as a Director or officer of the Company or its subsidiaries, to the extent permitted by law. The deeds stipulate that the Company will meet the full amount of any such liabilities, including reasonable legal costs and expenses.
During the financial year, the Group paid premiums to insure all Directors and officers against certain liabilities as contemplated under the Company’s constitution. Disclosure of the total amount of the premiums paid under this insurance policy is not permitted under the provisions of the insurance contract.
Further disclosure required under section 300(9) of the Corporations Act 2001 is prohibited under the terms of the contract.
14. Indemnification and Insurance of AuditorsNo indemnities have been given or insurance premiums paid, during or since the end of the year, for any person who is or has been an auditor of the Group.
15. Non-audit ServicesDuring the year KPMG, the Group’s auditors, has performed certain other services in addition to the audit and review of the financial statements.
The Board has considered the non-audit services provided during the year by the auditor and is satisfied that the provision of those non-audit services during the year by the auditor is compatible with, and did not compromise, the auditor’s independence requirements of the Corporations Act 2001 for the following reasons:
• all non-audit services were subject to the corporate governance procedures adopted by the Group and have been reviewed by the Audit and Risk Committee to ensure they do not impact the integrity and objectivity of the auditor; and
• the non-audit services provided do not undermine the general principles relating to auditor independence as set out in APES 110 Code of Ethics for Professional Accountants, as they did not involve reviewing or auditing the auditor’s own work, acting in a management or decision making capacity for the Group, acting as an advocate for the Group or jointly sharing risks and rewards.
Details of the amounts paid to the auditor of the Group, KPMG, and its network firms for audit and non-audit services provided during the year are set out below.
AUD$ 2017 2016 2015
Other services provided by KPMG
Taxation compliance and other taxation advisory services (including R&D) 245,700 175,000 277,030
Other assurance services (including IPO services) - - 785,000
Other services (including IPO services) 10,000 21,000 575,230
255,700 196,000 1,637,260
16. Rounding OffThe financial report is presented in Australian dollars with all values rounded to the nearest thousand unless otherwise stated, in accordance with ASIC Corporations Instrument 2016/191.
17. Lead Auditor’s Independence DeclarationThe lead auditor’s independence declaration is set out on page 48 and forms part of the Directors’ Report for the financial year ended 25 June 2017.
36 Costa Group Holdings Limited – Annual Report 2017
Remuneration Report (Audited) 1. Introduction The Directors are pleased to present the FY2017 Remuneration Report, outlining the Board’s approach to the remuneration for key management personnel (KMP).
KMP are individuals who have authority and responsibility for planning, directing and controlling the activities of the Group, directly or indirectly, and comprise the Directors and the senior executives of the Group, as listed below.
Name Position Held
Directors
Neil Chatfield Chairman Non-Executive Director
Frank Costa Non-Executive Director
Kevin Schwartz Non-Executive director
Peter Margin Non-Executive Director
Tiffany Fuller Non-Executive Director
Janette Kendall Non-Executive Director (Appointed 11 October 2016)
Harry Debney Chief Executive Officer, Managing Director
Executives
Linda Kow Chief Financial Officer
George Haggar Chief Operating Officer
The information in this report has been audited as required by section 308(3C) of the Corporations Act 2001 (Cth).
2. Corporate Governance
2.1 Remuneration and Human Resources CommitteeThe Group has established a Remuneration and Human Resources Committee that is comprised of Non-Executive Directors, the majority of whom are independent in accordance with the Remuneration and Human Resources Committee Charter.
The Remuneration and Human Resources Committee is responsible for assisting and advising the Board on:
• remuneration policies and practices for executives and employees of the Group;
• incentive schemes and equity-based remuneration plans;
• diversity;
• human resources practices; and
• shareholder and other stakeholder engagement in relation to the Group’s remuneration policies and practices.
A full charter outlining the Remuneration and Human Resources Committee’s responsibilities is available at: http://investors.costagroup.com.au/investor-centre/?page=corporate-governance.
2.2 Use of Remuneration ConsultantsThe Remuneration and Human Resources Committee can engage remuneration consultants to provide it with information on current market practice, and other matters to assist the Committee in the performance of its duties. The Remuneration and Human Resources Committee engaged Ernst & Young to undertake a review of the Long Term Incentive Plan (‘LTIP’) for FY2017. The objectives in the review included benchmarking and market positioning of the LTIP to align participant performance with the long-term growth and business strategy delivering shareholder value. During 2017 the Remuneration and Human Resources Committee engaged Ernst & Young specifically to undertake market data analysis benchmarking executive remuneration. The Remuneration and Human Resources Committee sought market data from the consultants from appropriate comparator groups within Australia.
The Remuneration and Human Resources Committee is satisfied that no remuneration recommendations (as defined in the Corporations Act 2001) were provided by Ernst & Young.
Costa Group Holdings Limited – Annual Report 2017 37
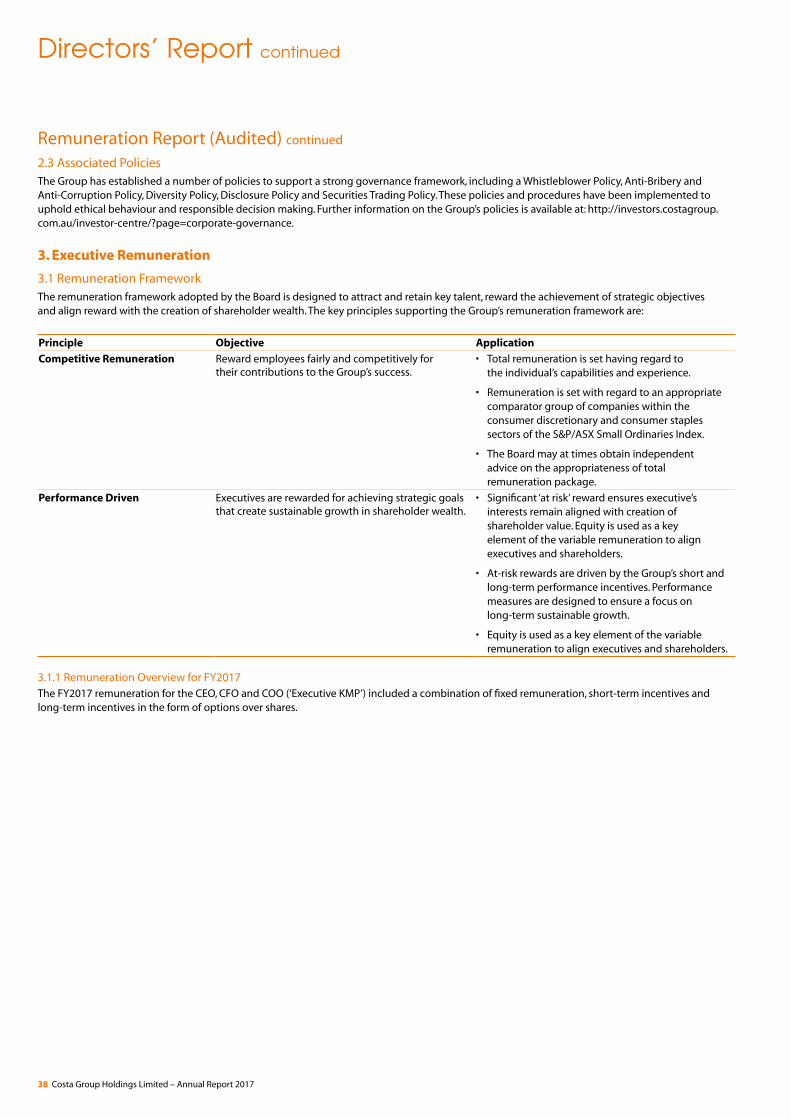
Directors’ Report continued
Remuneration Report (Audited) continued
2.3 Associated PoliciesThe Group has established a number of policies to support a strong governance framework, including a Whistleblower Policy, Anti-Bribery and Anti-Corruption Policy, Diversity Policy, Disclosure Policy and Securities Trading Policy. These policies and procedures have been implemented to uphold ethical behaviour and responsible decision making. Further information on the Group’s policies is available at: http://investors.costagroup.com.au/investor-centre/?page=corporate-governance.
3. Executive Remuneration
3.1 Remuneration FrameworkThe remuneration framework adopted by the Board is designed to attract and retain key talent, reward the achievement of strategic objectives and align reward with the creation of shareholder wealth. The key principles supporting the Group’s remuneration framework are:
Principle Objective Application
Competitive Remuneration Reward employees fairly and competitively for their contributions to the Group’s success.
• Total remuneration is set having regard to the individual’s capabilities and experience.
• Remuneration is set with regard to an appropriate comparator group of companies within the consumer discretionary and consumer staples sectors of the S&P/ASX Small Ordinaries Index.
• The Board may at times obtain independent advice on the appropriateness of total remuneration package.
Performance Driven Executives are rewarded for achieving strategic goals that create sustainable growth in shareholder wealth.
• Significant ‘at risk’ reward ensures executive’s interests remain aligned with creation of shareholder value. Equity is used as a key element of the variable remuneration to align executives and shareholders.
• At-risk rewards are driven by the Group’s short and long-term performance incentives. Performance measures are designed to ensure a focus on long-term sustainable growth.
• Equity is used as a key element of the variable remuneration to align executives and shareholders.
3.1.1 Remuneration Overview for FY2017 The FY2017 remuneration for the CEO, CFO and COO (‘Executive KMP’) included a combination of fixed remuneration, short-term incentives and long-term incentives in the form of options over shares.
38 Costa Group Holdings Limited – Annual Report 2017
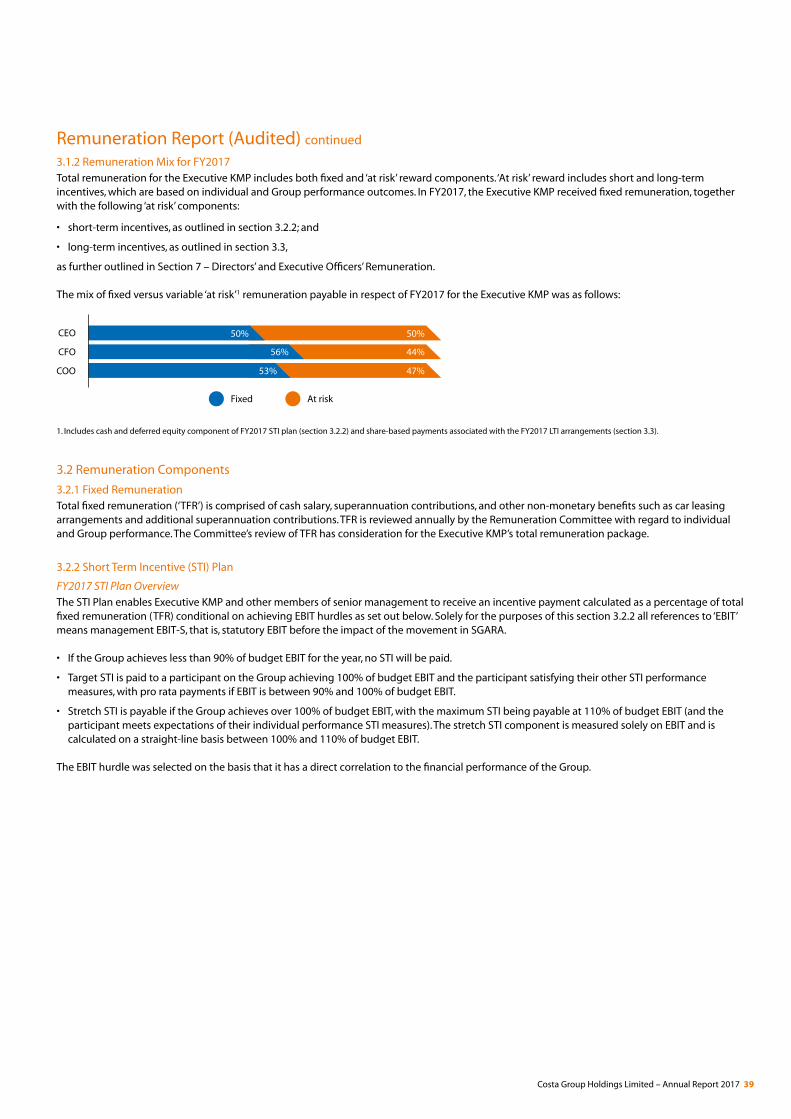
Remuneration Report (Audited) continued
3.1.2 Remuneration Mix for FY2017Total remuneration for the Executive KMP includes both fixed and ‘at risk’ reward components. ‘At risk’ reward includes short and long-term incentives, which are based on individual and Group performance outcomes. In FY2017, the Executive KMP received fixed remuneration, together with the following ‘at risk’ components:
• short-term incentives, as outlined in section 3.2.2; and
• long-term incentives, as outlined in section 3.3,
as further outlined in Section 7 – Directors’ and Executive Officers’ Remuneration.
The mix of fixed versus variable ‘at risk’1 remuneration payable in respect of FY2017 for the Executive KMP was as follows:
50% 50%
56% 44%
53% 47%
Fixed At risk
CEO
CFO
COO
1. Includes cash and deferred equity component of FY2017 STI plan (section 3.2.2) and share-based payments associated with the FY2017 LTI arrangements (section 3.3).
3.2 Remuneration Components
3.2.1 Fixed RemunerationTotal fixed remuneration (‘TFR’) is comprised of cash salary, superannuation contributions, and other non-monetary benefits such as car leasing arrangements and additional superannuation contributions. TFR is reviewed annually by the Remuneration Committee with regard to individual and Group performance. The Committee’s review of TFR has consideration for the Executive KMP’s total remuneration package.
3.2.2 Short Term Incentive (STI) Plan
FY2017 STI Plan OverviewThe STI Plan enables Executive KMP and other members of senior management to receive an incentive payment calculated as a percentage of total fixed remuneration (TFR) conditional on achieving EBIT hurdles as set out below. Solely for the purposes of this section 3.2.2 all references to ‘EBIT’ means management EBIT-S, that is, statutory EBIT before the impact of the movement in SGARA.
• If the Group achieves less than 90% of budget EBIT for the year, no STI will be paid.
• Target STI is paid to a participant on the Group achieving 100% of budget EBIT and the participant satisfying their other STI performance measures, with pro rata payments if EBIT is between 90% and 100% of budget EBIT.
• Stretch STI is payable if the Group achieves over 100% of budget EBIT, with the maximum STI being payable at 110% of budget EBIT (and the participant meets expectations of their individual performance STI measures). The stretch STI component is measured solely on EBIT and is calculated on a straight-line basis between 100% and 110% of budget EBIT.
The EBIT hurdle was selected on the basis that it has a direct correlation to the financial performance of the Group.
Costa Group Holdings Limited – Annual Report 2017 39

Directors’ Report continued
Remuneration Report (Audited) continued
2017 Short Term Incentive Plan FeaturesThe table below outlines the key features of the FY2017 STI Plan, as it applied to the Executive KMP and other members of senior management:
Objective To reward participants for achieving goals directly linked with the Group’s business strategy
Participants All Executive KMP and selected senior management
Performance Period Financial year ending 25 June 2017
Opportunity • CEO – Target STI is 45% of TFR, with a maximum opportunity of 70% TFR for exceeding stretch targets.
• CFO, COO – Target STI is 35% of TFR, with a maximum opportunity of 60% TFR for exceeding stretch targets.
Performance Measures Consistent with FY2016, STI was assessed against both financial and non-financial measures, and was weighted as follows:
Measure Weighting
EBIT 50%
Cash Flow 30%
Individual Performance 20%
Individual Performance was measured against KPIs appropriate for the Executive’s role and included key business measures such as safety, project execution, innovation, quality, customer satisfaction and people.
Cash Flow is based on EBITDA-S cash conversion, which includes EBITDA-S adjusted for joint ventures, operational working capital movements, and operating capex.
Payment Method • Cash – Two-thirds will be paid in cash following the end of the performance year; and
• Deferred – One-third of the STI benefit payable will be delivered in the form of performance rights. No dividends or voting rights are attached to performance rights, but cash payments equivalent to dividends will be paid to holders of performance rights. A participant’s performance rights will vest on 1 September 2018 and the participant will receive an equivalent number of shares, if the participant remains employed by the Group at that time (or has ceased employment in circumstances where they are regarded as a ‘good leaver’).
Calculation Methodology The STI incentive is assessed annually at the end of the financial year.
The stretch opportunity is based on the overachievement against the Group EBIT only, with the opportunity capped at 25% of the participant’s TFR. Every 1% of Actual Group EBIT over Budget increases the incentive by 2.5%.
The stretch STI component is measured solely on EBIT and is calculated on a straight-line basis between 100% and 110% of budgeted EBIT.
Calculations Each of the three measures EBIT, Cash flow and Individual Performance has been evaluated.
Each of the participants has been determined to have met the requirements of the performance measure.
Group EBIT before SGARA:Budgeted Group EBIT before SGARA for FY2017 was $72.0 million. The actual Group EBIT before SGARA for FY2017 was $79.7 million including material items, which is greater than the 10% hurdle enabling the full STI stretch opportunity to be exercised.
40 Costa Group Holdings Limited – Annual Report 2017
Remuneration Report (Audited) continued
The performance against the key targets identified under the STI Plan resulted in each KMP receiving an incentive as follows:
KMP Target STI % of target STI Achieved in the Year
CEO $437,715 156%
CFO $170,184 171%
COO $245,375 171%
3.3 LTIP for FY2017The FY2017 LTIP is designed to reward the Executive KMP (including the CEO) and other senior executives for long-term performance and long-term value creation for shareholders.
Term Description
Eligibility CEO, CFO, COO and selected members of the senior management team
Consideration for grant Nil
Instrument Options to acquire ordinary shares in Costa Group Holdings Limited
Number of options granted The number of options was determined based on a set percentage of the participant’s TFR (‘LTI Incentive Amount’), being 35% for the CEO and 30% for each of the CFO and COO. The options were indicatively valued by an independent external valuer (Ernst & Young), prior to seeking shareholder approval for the issue of options to the CEO. The number of options issued to each participant was determined by dividing that participant’s LTI Incentive Amount by the indicative value per option as determined by the independent valuer. The final fair value of the options was determined on the grant date following shareholder approval of the issuance of options to the CEO.
Exercise price $2.78 per share, being the volume weighted average price of an ordinary fully paid share in the capital of the Company recorded on the ASX over 10 ASX trading days ending on 30 June 2016.
Performance period The FY2017 LTI performance period will be the three-year period commencing on 27 June 2016 and ending on 30 June 2019
Performance measure (GEPS) 75% of the options (‘EPS Options’) will be subject to a performance hurdle based on the Company’s Earnings Per Share (basic) compound annual growth rate (‘CAGR’) over the performance period, with performance and vesting outcomes as follows:
Company’s EPS CAGR over performance period Percentage of LTIP Options (subject to the EPS hurdle) that will vest
Less than 8% 0%
8% 50%
Between 8% and 11% (inclusive) 50% –100%, on a straight-line sliding scale
Above 11% 100%
The Board retains discretion to adjust the calculation of EPS (for example, to exclude the impact of significant events that may occur during the performance period).The Board will continue to assess the appropriateness of this metric over time.
Performance measure (Growth) 25% of the options (‘Growth Target Options’) will be subject to a performance hurdle based on geographic and category diversification and growth designed to support sustainable long- term value creation. Diversification includes two new geographic locations, which may include domestic and/or international locations and one new major category pillar. Growth includes the scaling up of the avocado category from its establishment position as well as continuing the China and Morocco Joint Ventures growth trajectory. In addition to the performance hurdles the Company investment hurdles will be applied.
The number of growth target options that vest will be determined by the Board (with the Managing Director not voting) based on an assessment of the Company’s performance during the performance period against the growth and diversification targets set by the Board.
The Company considers the performance targets for this hurdle to be commercially sensitive, with the result that publication of that information prior to the end of the Performance Period may be prejudicial to the interests of the Company. Accordingly, complete details regarding the outcomes of vesting will be disclosed at the end of the performance period in the 2019 Remuneration Report.
Entitlements Options will not carry rights to dividends or voting rights prior to vesting.
Costa Group Holdings Limited – Annual Report 2017 41
Directors’ Report continued
Remuneration Report (Audited) continued
Term Description
Option exercise Vested options must be exercised within five years from the grant date of the options (‘expiry date’). Prior to the expiry date, an optionholder can exercise by either:
• providing the Company with an exercise notice that specifies the number of options to be exercised, together with the exercise price in respect of those exercised options; or
• electing a cashless exercise in respect of some or all of his options.
If an optionholder provides the exercise price, he/she will be issued with one share per exercised option. If an optionholder elects a cashless exercise, he/she will be issued with a lower number of shares, calculated in accordance with the following formula:
(A minus B) divided by C, where:
A = Number of shares to which each vested option relates (ie. 1) x number of vested options exercised x market price per share
B = Number of vested options exercised x exercise price per option
C = Market price per share, being an amount equal to the volume weighted average price of a share recorded on the ASX over 10 ASX trading days immediately preceding the date on which the market price is to be calculated or, if no sale occurred during such period, the last sale price of a share recorded on the ASX.
Restrictions on dealing Participants must not sell, transfer, encumber, hedge or otherwise deal with their options granted under the LTIP.
Shares delivered on the exercise of 50% of the options will be subject to a restriction period (during which the shares cannot be sold or otherwise dealt with) for 12 months following vesting.
Service conditions Any unvested options granted under the LTIP will be forfeited where the participant is dismissed during the performance period, or resigns in circumstances where they are not considered to be a ‘good leaver’. Where the participant is considered a ‘good leaver’ (which includes death, disability or redundancy), the unvested options and/or performance rights will remain on foot subject to Board discretion and be tested at the end of the original vesting date against the relevant performance conditions.
4 Executive Remuneration Disclosure
4.1 Executives’ Contract TermsA summary of the key terms of employment for executives as at 25 June 2017 is presented in the below table:
Executive Role Notice by the Group Notice on Resignation
Harry Debney Chief Executive Officer 6 Months 6 Months
Linda Kow Chief Financial Officer 3 Months 3 Months
George Haggar1 Chief Operating Officer 3 Months 3 Months
1. George Haggar resigned during the reporting period and ceased to be employed after 25 June 2017. His replacement will commence employment with the Group during FY2018.
42 Costa Group Holdings Limited – Annual Report 2017
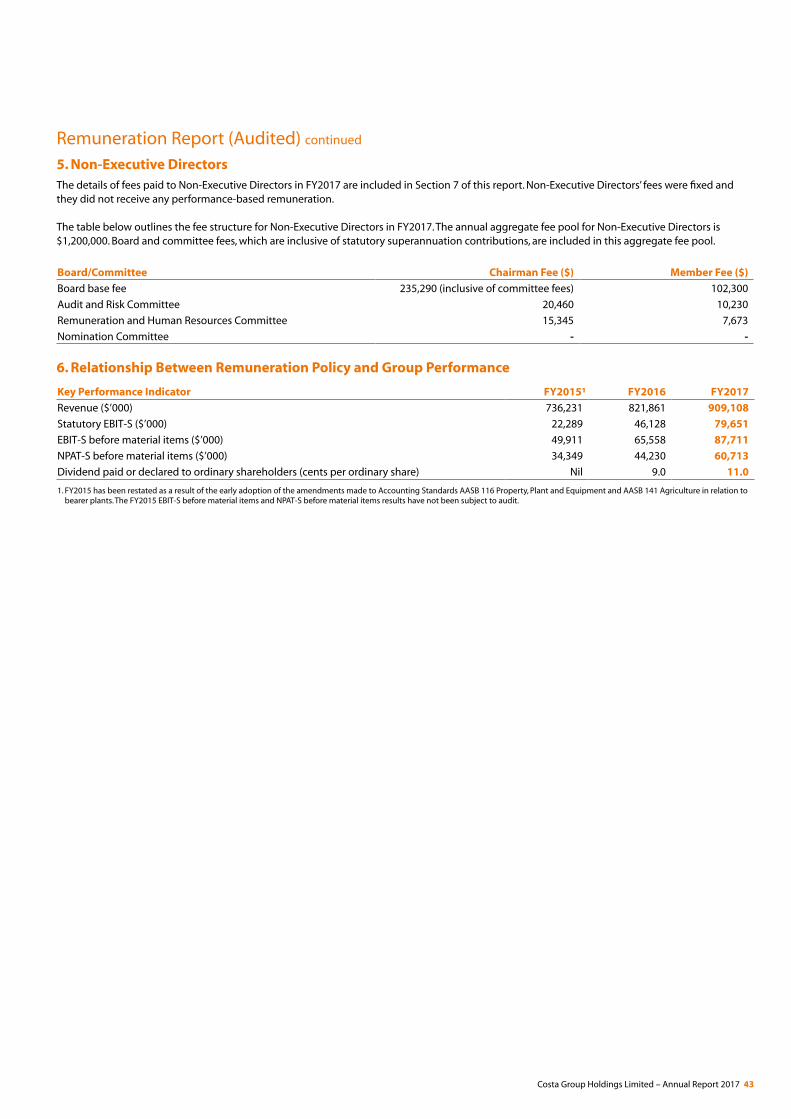
Remuneration Report (Audited) continued
5. Non-Executive Directors The details of fees paid to Non-Executive Directors in FY2017 are included in Section 7 of this report. Non-Executive Directors’ fees were fixed and they did not receive any performance-based remuneration.
The table below outlines the fee structure for Non-Executive Directors in FY2017. The annual aggregate fee pool for Non-Executive Directors is $1,200,000. Board and committee fees, which are inclusive of statutory superannuation contributions, are included in this aggregate fee pool.
Board/Committee Chairman Fee ($) Member Fee ($)
Board base fee 235,290 (inclusive of committee fees) 102,300
Audit and Risk Committee 20,460 10,230
Remuneration and Human Resources Committee 15,345 7,673
Nomination Committee - -
6. Relationship Between Remuneration Policy and Group Performance
Key Performance Indicator FY2015¹ FY2016 FY2017
Revenue ($’000) 736,231 821,861 909,108
Statutory EBIT-S ($’000) 22,289 46,128 79,651
EBIT-S before material items ($’000) 49,911 65,558 87,711
NPAT-S before material items ($’000) 34,349 44,230 60,713
Dividend paid or declared to ordinary shareholders (cents per ordinary share) Nil 9.0 11.0
1. FY2015 has been restated as a result of the early adoption of the amendments made to Accounting Standards AASB 116 Property, Plant and Equipment and AASB 141 Agriculture in relation to bearer plants. The FY2015 EBIT-S before material items and NPAT-S before material items results have not been subject to audit.
Costa Group Holdings Limited – Annual Report 2017 43
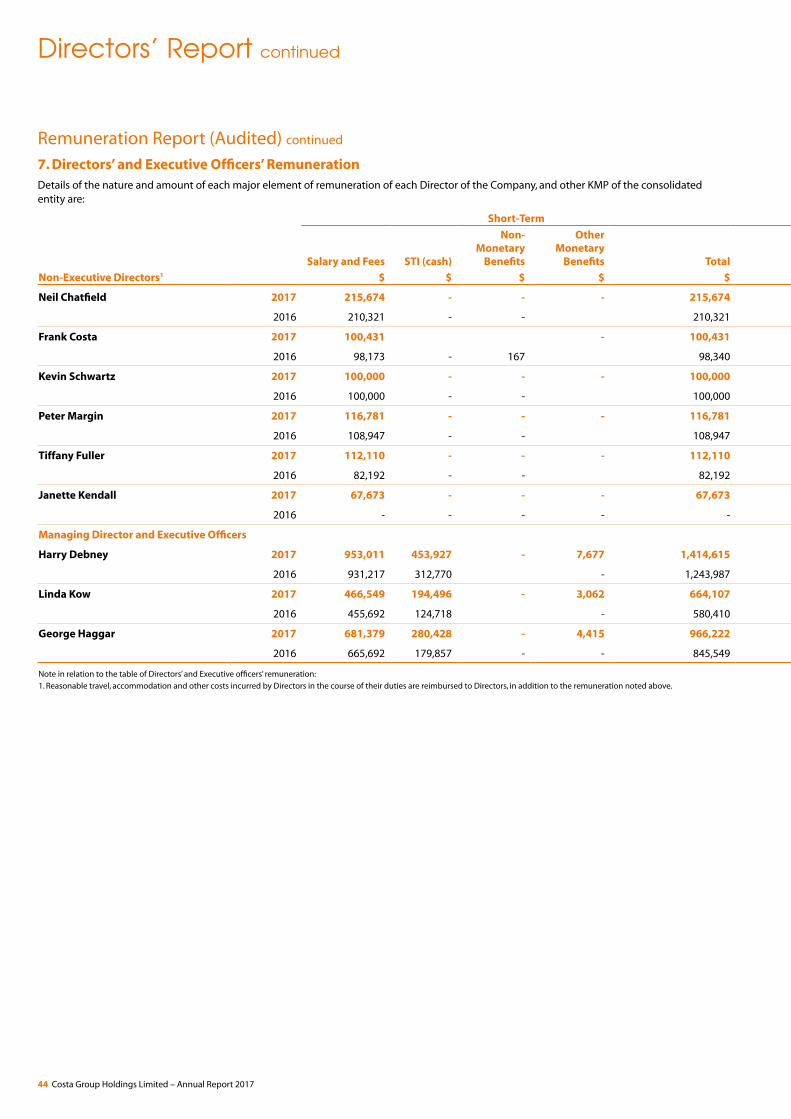
Directors’ Report continued
Remuneration Report (Audited) continued
7. Directors’ and Executive Officers’ Remuneration Details of the nature and amount of each major element of remuneration of each Director of the Company, and other KMP of the consolidated entity are:
Short-Term Post-employment Long-Term Benefits Termination Share-Based Payments Total
Salary and Fees STI (cash)
Non-Monetary
Benefits
Other Monetary
Benefits TotalSuperannuation
Benefits Long Service LeaveTermination
Benefits
Non-Executive Directors1 $ $ $ $ $ $ $ $ $ $
Neil Chatfield 2017 215,674 - - - 215,674 19,616 - - - 235,290
2016 210,321 - - 210,321 19,679 - - - 230,000
Frank Costa 2017 100,431 - 100,431 9,541 - - - 109,972
2016 98,173 - 167 98,340 9,327 - - - 107,667
Kevin Schwartz 2017 100,000 - - - 100,000 - - - - 100,000
2016 100,000 - - 100,000 - - - - 100,000
Peter Margin 2017 116,781 - - - 116,781 11,094 - - - 127,875
2016 108,947 - - 108,947 11,053 - - - 120,000
Tiffany Fuller 2017 112,110 - - - 112,110 10,650 - - - 122,760
2016 82,192 - - 82,192 7,808 - - - 90,000
Janette Kendall 2017 67,673 - - - 67,673 6,429 - - - 74,102
2016 - - - - - - - - - -
Managing Director and Executive Officers
Harry Debney 2017 953,011 453,927 - 7,677 1,414,615 19,616 13,164 - 508,168 1,955,563
2016 931,217 312,770 - 1,243,987 19,308 15,547 - 272,275 1,551,117
Linda Kow 2017 466,549 194,496 - 3,062 664,107 19,616 8,767 - 194,014 886,504
2016 455,692 124,718 - 580,410 19,308 11,295 - 75,071 686,084
George Haggar 2017 681,379 280,428 - 4,415 966,222 19,616 17,984 - 364,778 1,368,600
2016 665,692 179,857 - - 845,549 19,308 15,990 - 108,260 989,107
Note in relation to the table of Directors’ and Executive officers’ remuneration:
1. Reasonable travel, accommodation and other costs incurred by Directors in the course of their duties are reimbursed to Directors, in addition to the remuneration noted above.
44 Costa Group Holdings Limited – Annual Report 2017
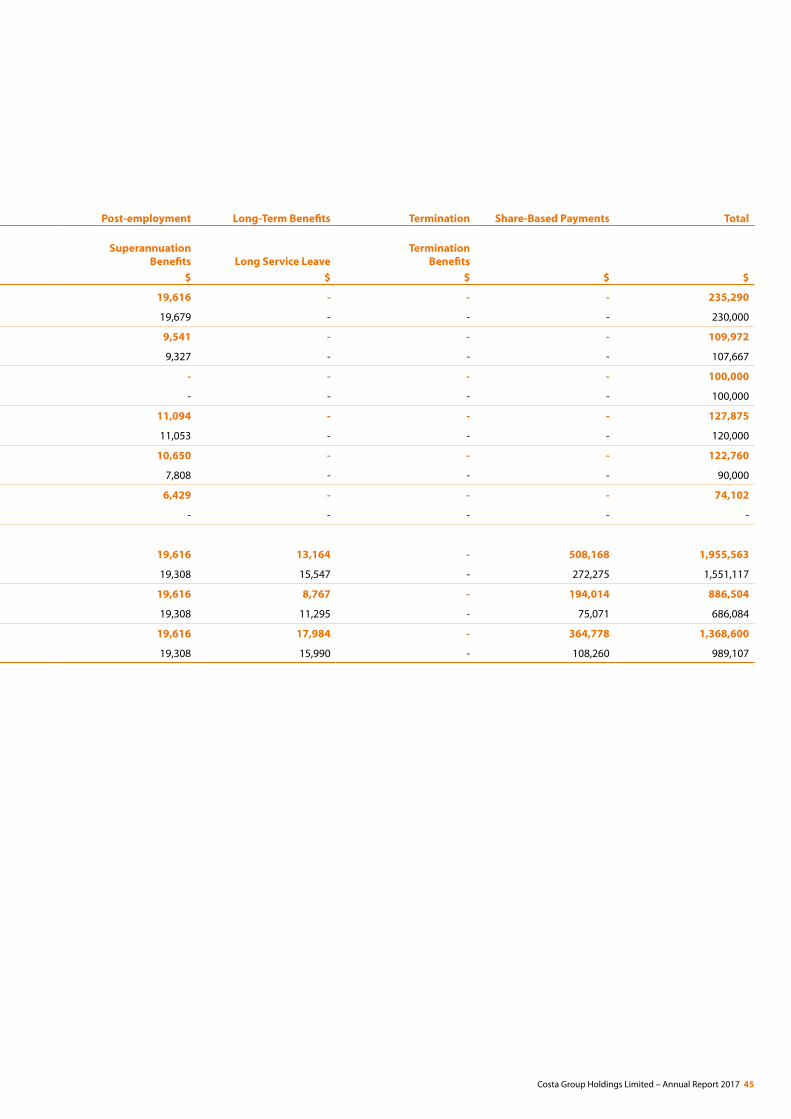
Remuneration Report (Audited) continued
7. Directors’ and Executive Officers’ Remuneration Details of the nature and amount of each major element of remuneration of each Director of the Company, and other KMP of the consolidated entity are:
Short-Term Post-employment Long-Term Benefits Termination Share-Based Payments Total
Salary and Fees STI (cash)
Non-Monetary
Benefits
Other Monetary
Benefits TotalSuperannuation
Benefits Long Service LeaveTermination
Benefits
Non-Executive Directors1 $ $ $ $ $ $ $ $ $ $
Neil Chatfield 2017 215,674 - - - 215,674 19,616 - - - 235,290
2016 210,321 - - 210,321 19,679 - - - 230,000
Frank Costa 2017 100,431 - 100,431 9,541 - - - 109,972
2016 98,173 - 167 98,340 9,327 - - - 107,667
Kevin Schwartz 2017 100,000 - - - 100,000 - - - - 100,000
2016 100,000 - - 100,000 - - - - 100,000
Peter Margin 2017 116,781 - - - 116,781 11,094 - - - 127,875
2016 108,947 - - 108,947 11,053 - - - 120,000
Tiffany Fuller 2017 112,110 - - - 112,110 10,650 - - - 122,760
2016 82,192 - - 82,192 7,808 - - - 90,000
Janette Kendall 2017 67,673 - - - 67,673 6,429 - - - 74,102
2016 - - - - - - - - - -
Managing Director and Executive Officers
Harry Debney 2017 953,011 453,927 - 7,677 1,414,615 19,616 13,164 - 508,168 1,955,563
2016 931,217 312,770 - 1,243,987 19,308 15,547 - 272,275 1,551,117
Linda Kow 2017 466,549 194,496 - 3,062 664,107 19,616 8,767 - 194,014 886,504
2016 455,692 124,718 - 580,410 19,308 11,295 - 75,071 686,084
George Haggar 2017 681,379 280,428 - 4,415 966,222 19,616 17,984 - 364,778 1,368,600
2016 665,692 179,857 - - 845,549 19,308 15,990 - 108,260 989,107
Note in relation to the table of Directors’ and Executive officers’ remuneration:
1. Reasonable travel, accommodation and other costs incurred by Directors in the course of their duties are reimbursed to Directors, in addition to the remuneration noted above.
Costa Group Holdings Limited – Annual Report 2017 45
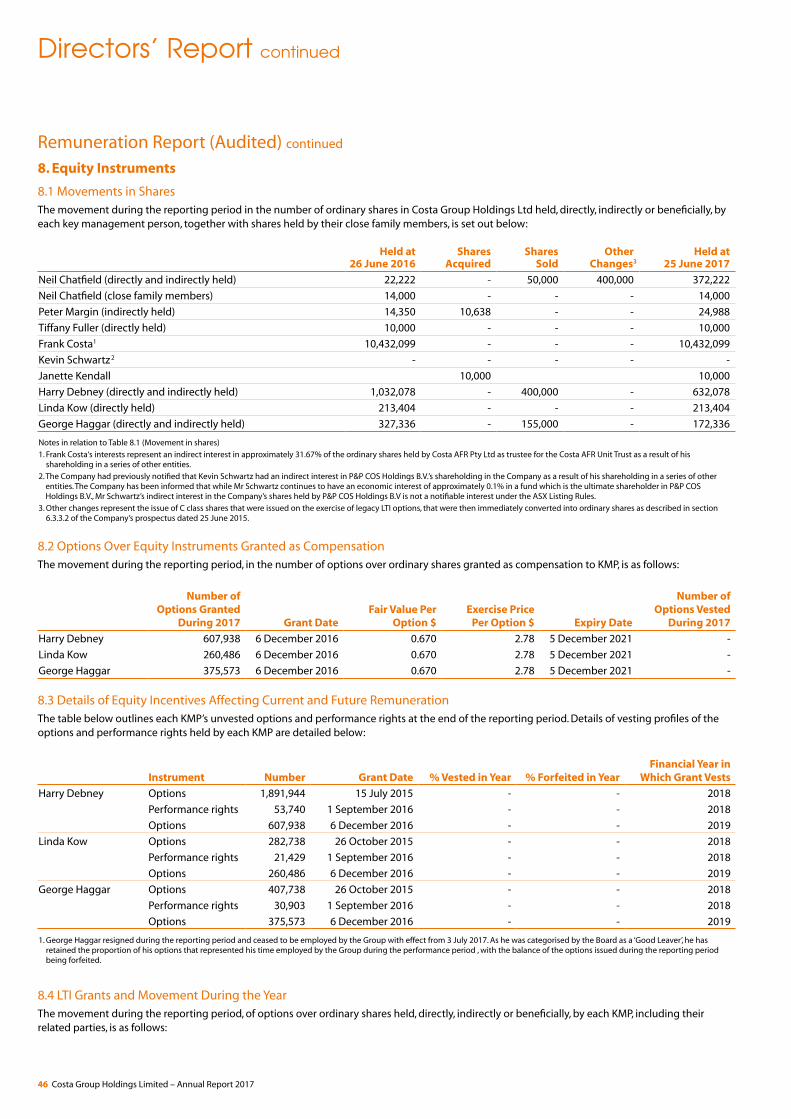
Directors’ Report continued
Remuneration Report (Audited) continued
8. Equity Instruments
8.1 Movements in Shares The movement during the reporting period in the number of ordinary shares in Costa Group Holdings Ltd held, directly, indirectly or beneficially, by each key management person, together with shares held by their close family members, is set out below:
Held at Shares Shares Other Held at26 June 2016 Acquired Sold Changes3 25 June 2017
Neil Chatfield (directly and indirectly held) 22,222 - 50,000 400,000 372,222
Neil Chatfield (close family members) 14,000 - - - 14,000
Peter Margin (indirectly held) 14,350 10,638 - - 24,988
Tiffany Fuller (directly held) 10,000 - - - 10,000
Frank Costa1 10,432,099 - - - 10,432,099
Kevin Schwartz2 - - - - -
Janette Kendall 10,000 10,000
Harry Debney (directly and indirectly held) 1,032,078 - 400,000 - 632,078
Linda Kow (directly held) 213,404 - - - 213,404
George Haggar (directly and indirectly held) 327,336 - 155,000 - 172,336
Notes in relation to Table 8.1 (Movement in shares)
1. Frank Costa‘s interests represent an indirect interest in approximately 31.67% of the ordinary shares held by Costa AFR Pty Ltd as trustee for the Costa AFR Unit Trust as a result of his shareholding in a series of other entities.
2. The Company had previously notified that Kevin Schwartz had an indirect interest in P&P COS Holdings B.V.’s shareholding in the Company as a result of his shareholding in a series of other entities. The Company has been informed that while Mr Schwartz continues to have an economic interest of approximately 0.1% in a fund which is the ultimate shareholder in P&P COS Holdings B.V., Mr Schwartz’s indirect interest in the Company’s shares held by P&P COS Holdings B.V is not a notifiable interest under the ASX Listing Rules.
3. Other changes represent the issue of C class shares that were issued on the exercise of legacy LTI options, that were then immediately converted into ordinary shares as described in section 6.3.3.2 of the Company’s prospectus dated 25 June 2015.
8.2 Options Over Equity Instruments Granted as Compensation The movement during the reporting period, in the number of options over ordinary shares granted as compensation to KMP, is as follows:
Number of Options Granted
During 2017 Grant DateFair Value Per
Option $Exercise Price
Per Option $ Expiry Date
Number of Options Vested
During 2017
Harry Debney 607,938 6 December 2016 0.670 2.78 5 December 2021 -
Linda Kow 260,486 6 December 2016 0.670 2.78 5 December 2021 -
George Haggar 375,573 6 December 2016 0.670 2.78 5 December 2021 -
8.3 Details of Equity Incentives Affecting Current and Future Remuneration The table below outlines each KMP’s unvested options and performance rights at the end of the reporting period. Details of vesting profiles of the options and performance rights held by each KMP are detailed below:
Instrument Number Grant Date % Vested in Year % Forfeited in YearFinancial Year in
Which Grant Vests
Harry Debney Options 1,891,944 15 July 2015 - - 2018
Performance rights 53,740 1 September 2016 - - 2018
Options 607,938 6 December 2016 - - 2019
Linda Kow Options 282,738 26 October 2015 - - 2018
Performance rights 21,429 1 September 2016 - - 2018
Options 260,486 6 December 2016 - - 2019
George Haggar Options 407,738 26 October 2015 - - 2018
Performance rights 30,903 1 September 2016 - - 2018
Options 375,573 6 December 2016 - - 2019
1. George Haggar resigned during the reporting period and ceased to be employed by the Group with effect from 3 July 2017. As he was categorised by the Board as a ‘Good Leaver’, he has retained the proportion of his options that represented his time employed by the Group during the performance period , with the balance of the options issued during the reporting period being forfeited.
8.4 LTI Grants and Movement During the YearThe movement during the reporting period, of options over ordinary shares held, directly, indirectly or beneficially, by each KMP, including their related parties, is as follows:
46 Costa Group Holdings Limited – Annual Report 2017
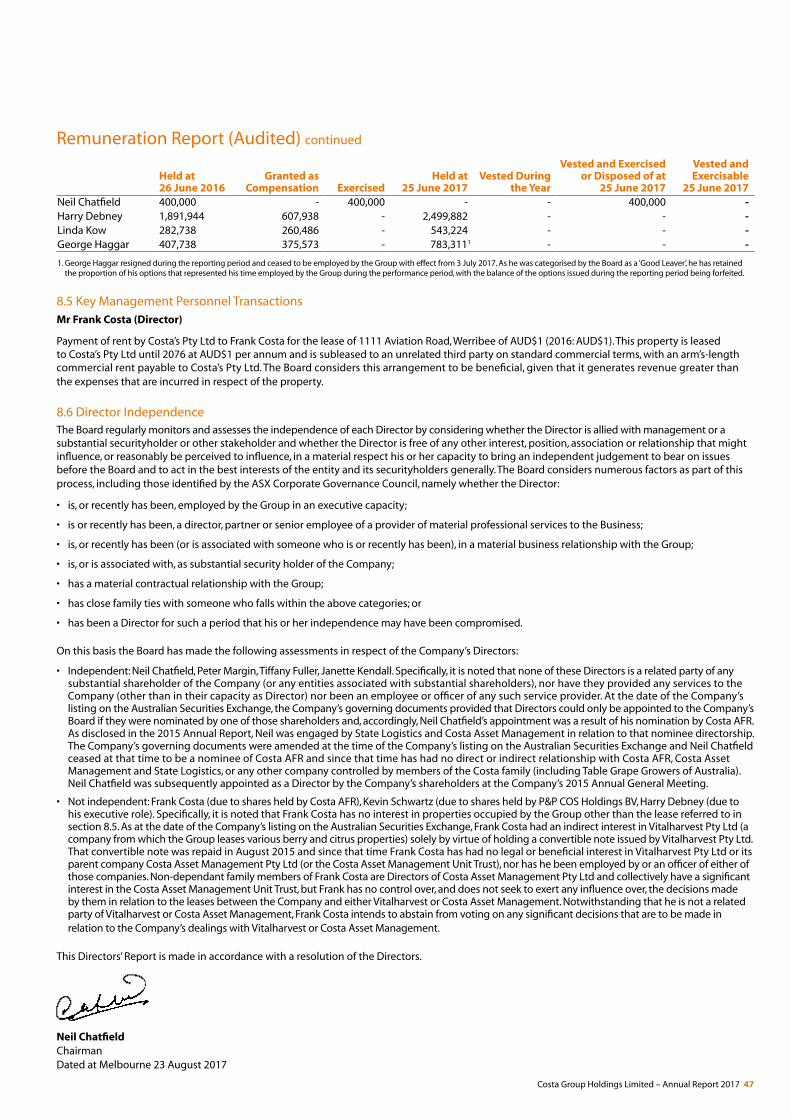
Remuneration Report (Audited) continued
Held at26 June 2016
Granted as Compensation Exercised
Held at25 June 2017
Vested During the Year
Vested and Exercised or Disposed of at
25 June 2017
Vested and Exercisable
25 June 2017Neil Chatfield 400,000 - 400,000 - - 400,000 -Harry Debney 1,891,944 607,938 - 2,499,882 - - -Linda Kow 282,738 260,486 - 543,224 - - -George Haggar 407,738 375,573 - 783,3111 - - -
1. George Haggar resigned during the reporting period and ceased to be employed by the Group with effect from 3 July 2017. As he was categorised by the Board as a ‘Good Leaver’, he has retained the proportion of his options that represented his time employed by the Group during the performance period, with the balance of the options issued during the reporting period being forfeited.
8.5 Key Management Personnel Transactions Mr Frank Costa (Director)
Payment of rent by Costa’s Pty Ltd to Frank Costa for the lease of 1111 Aviation Road, Werribee of AUD$1 (2016: AUD$1). This property is leased to Costa’s Pty Ltd until 2076 at AUD$1 per annum and is subleased to an unrelated third party on standard commercial terms, with an arm’s-length commercial rent payable to Costa’s Pty Ltd. The Board considers this arrangement to be beneficial, given that it generates revenue greater than the expenses that are incurred in respect of the property.
8.6 Director IndependenceThe Board regularly monitors and assesses the independence of each Director by considering whether the Director is allied with management or a substantial securityholder or other stakeholder and whether the Director is free of any other interest, position, association or relationship that might influence, or reasonably be perceived to influence, in a material respect his or her capacity to bring an independent judgement to bear on issues before the Board and to act in the best interests of the entity and its securityholders generally. The Board considers numerous factors as part of this process, including those identified by the ASX Corporate Governance Council, namely whether the Director:
• is, or recently has been, employed by the Group in an executive capacity;
• is or recently has been, a director, partner or senior employee of a provider of material professional services to the Business;
• is, or recently has been (or is associated with someone who is or recently has been), in a material business relationship with the Group;
• is, or is associated with, as substantial security holder of the Company;
• has a material contractual relationship with the Group;
• has close family ties with someone who falls within the above categories; or
• has been a Director for such a period that his or her independence may have been compromised.
On this basis the Board has made the following assessments in respect of the Company’s Directors:
• Independent: Neil Chatfield, Peter Margin, Tiffany Fuller, Janette Kendall. Specifically, it is noted that none of these Directors is a related party of any substantial shareholder of the Company (or any entities associated with substantial shareholders), nor have they provided any services to the Company (other than in their capacity as Director) nor been an employee or officer of any such service provider. At the date of the Company’s listing on the Australian Securities Exchange, the Company’s governing documents provided that Directors could only be appointed to the Company’s Board if they were nominated by one of those shareholders and, accordingly, Neil Chatfield’s appointment was a result of his nomination by Costa AFR. As disclosed in the 2015 Annual Report, Neil was engaged by State Logistics and Costa Asset Management in relation to that nominee directorship. The Company’s governing documents were amended at the time of the Company’s listing on the Australian Securities Exchange and Neil Chatfield ceased at that time to be a nominee of Costa AFR and since that time has had no direct or indirect relationship with Costa AFR, Costa Asset Management and State Logistics, or any other company controlled by members of the Costa family (including Table Grape Growers of Australia). Neil Chatfield was subsequently appointed as a Director by the Company’s shareholders at the Company’s 2015 Annual General Meeting.
• Not independent: Frank Costa (due to shares held by Costa AFR), Kevin Schwartz (due to shares held by P&P COS Holdings BV, Harry Debney (due to his executive role). Specifically, it is noted that Frank Costa has no interest in properties occupied by the Group other than the lease referred to in section 8.5. As at the date of the Company’s listing on the Australian Securities Exchange, Frank Costa had an indirect interest in Vitalharvest Pty Ltd (a company from which the Group leases various berry and citrus properties) solely by virtue of holding a convertible note issued by Vitalharvest Pty Ltd. That convertible note was repaid in August 2015 and since that time Frank Costa has had no legal or beneficial interest in Vitalharvest Pty Ltd or its parent company Costa Asset Management Pty Ltd (or the Costa Asset Management Unit Trust), nor has he been employed by or an officer of either of those companies. Non-dependant family members of Frank Costa are Directors of Costa Asset Management Pty Ltd and collectively have a significant interest in the Costa Asset Management Unit Trust, but Frank has no control over, and does not seek to exert any influence over, the decisions made by them in relation to the leases between the Company and either Vitalharvest or Costa Asset Management. Notwithstanding that he is not a related party of Vitalharvest or Costa Asset Management, Frank Costa intends to abstain from voting on any significant decisions that are to be made in relation to the Company’s dealings with Vitalharvest or Costa Asset Management.
This Directors’ Report is made in accordance with a resolution of the Directors.
Neil ChatfieldChairmanDated at Melbourne 23 August 2017
Costa Group Holdings Limited – Annual Report 2017 47
34
Liability limited by a scheme approved under Professional Standards Legislation.
KPMG, an Australian partnership and a member firm of the KPMG network of independent member firms affiliated with KPMG International Cooperative (“KPMG International”), a Swiss entity.
Lead Auditor’s Independence Declaration under
Section 307C of the Corporations Act 2001
To the Directors of Costa Group Holdings Limited
I declare that, to the best of my knowledge and belief, in relation to the audit of Costa Group Holdings Limited for the financial year ended 25 June 2017 there have been:
i. no contraventions of the auditor independence requirements as set out in the Corporations Act 2001 in relation to the audit; and
ii. no contraventions of any applicable code of professional conduct in relation to the audit.
KPMG
Paul J McDonald
Partner
Melbourne
23 August 2017
Auditor’s Independence Declaration
48 Costa Group Holdings Limited – Annual Report 2017
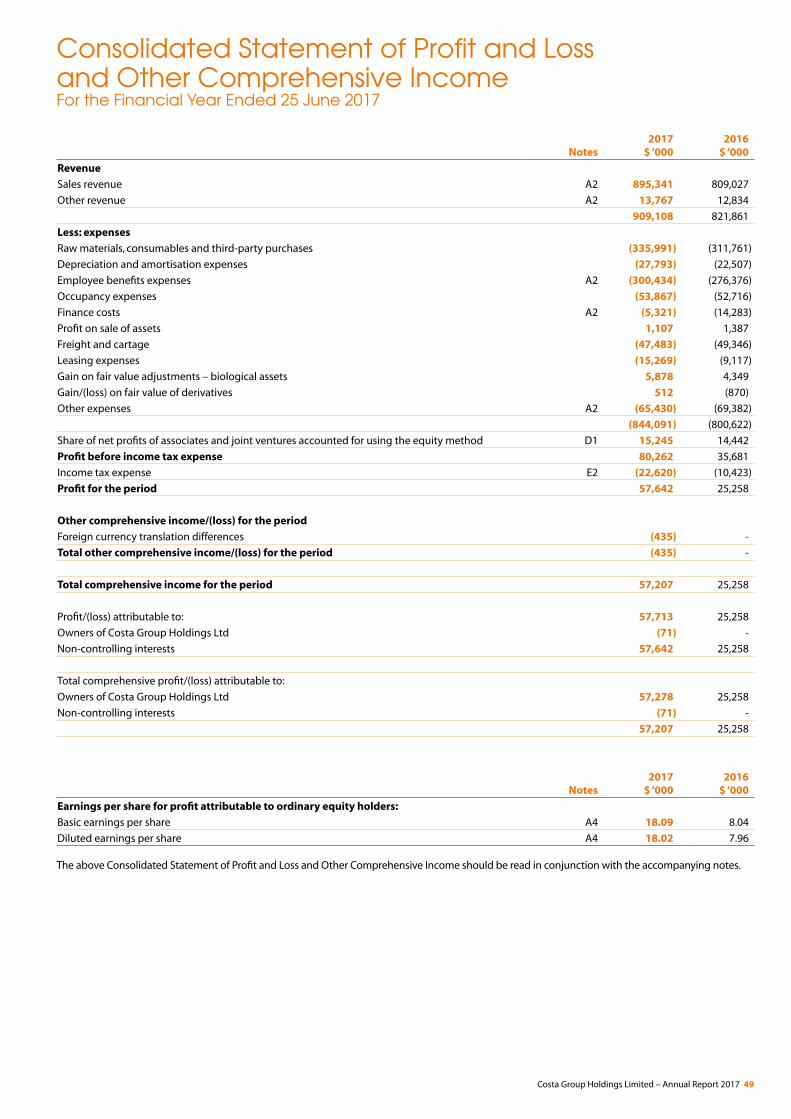
Consolidated Statement of Profit and Loss and Other Comprehensive IncomeFor the Financial Year Ended 25 June 2017
Notes2017
$ ‘0002016
$ ‘000
Revenue
Sales revenue A2 895,341 809,027
Other revenue A2 13,767 12,834
909,108 821,861
Less: expenses
Raw materials, consumables and third-party purchases (335,991) (311,761)
Depreciation and amortisation expenses (27,793) (22,507)
Employee benefits expenses A2 (300,434) (276,376)
Occupancy expenses (53,867) (52,716)
Finance costs A2 (5,321) (14,283)
Profit on sale of assets 1,107 1,387
Freight and cartage (47,483) (49,346)
Leasing expenses (15,269) (9,117)
Gain on fair value adjustments – biological assets 5,878 4,349
Gain/(loss) on fair value of derivatives 512 (870)
Other expenses A2 (65,430) (69,382)
(844,091) (800,622)
Share of net profits of associates and joint ventures accounted for using the equity method D1 15,245 14,442
Profit before income tax expense 80,262 35,681
Income tax expense E2 (22,620) (10,423)
Profit for the period 57,642 25,258
Other comprehensive income/(loss) for the period
Foreign currency translation differences (435) -
Total other comprehensive income/(loss) for the period (435) -
Total comprehensive income for the period 57,207 25,258
Profit/(loss) attributable to: 57,713 25,258
Owners of Costa Group Holdings Ltd (71) -
Non-controlling interests 57,642 25,258
Total comprehensive profit/(loss) attributable to:
Owners of Costa Group Holdings Ltd 57,278 25,258
Non-controlling interests (71) -
57,207 25,258
Notes2017
$ ‘0002016
$ ‘000
Earnings per share for profit attributable to ordinary equity holders:
Basic earnings per share A4 18.09 8.04
Diluted earnings per share A4 18.02 7.96
The above Consolidated Statement of Profit and Loss and Other Comprehensive Income should be read in conjunction with the accompanying notes.
Costa Group Holdings Limited – Annual Report 2017 49
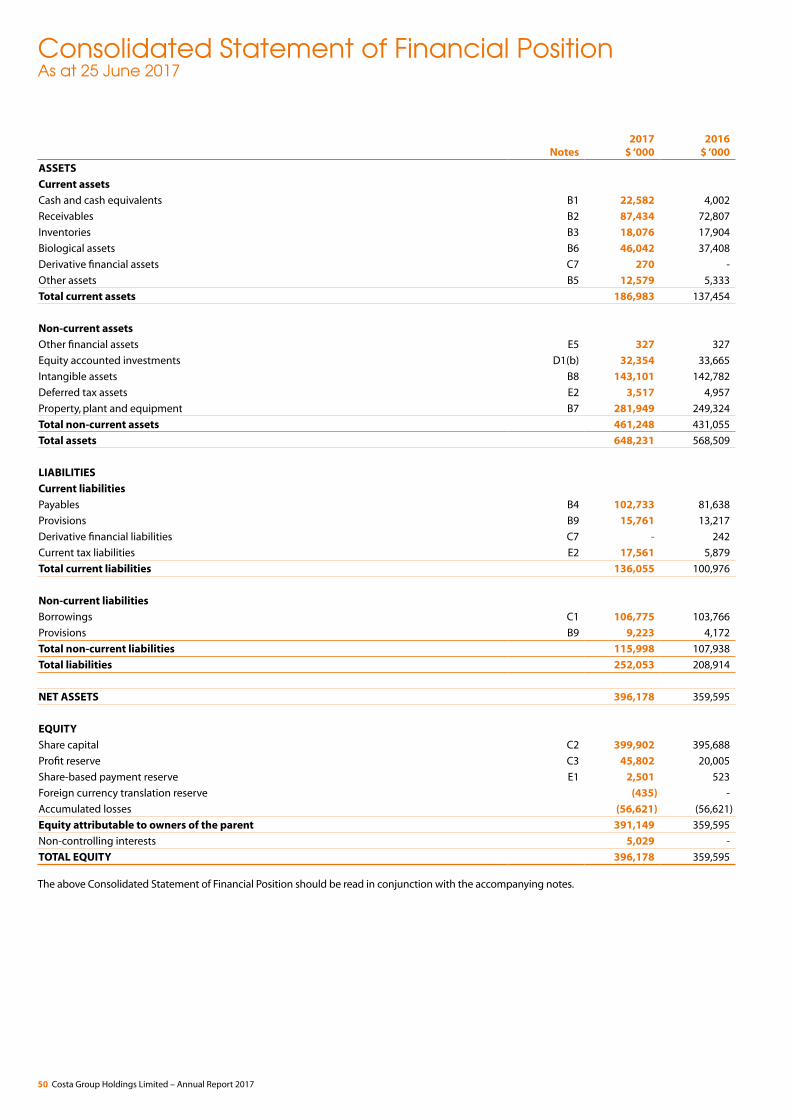
Consolidated Statement of Financial PositionAs at 25 June 2017
Notes2017
$ ‘0002016
$ ‘000
ASSETS
Current assets
Cash and cash equivalents B1 22,582 4,002
Receivables B2 87,434 72,807
Inventories B3 18,076 17,904
Biological assets B6 46,042 37,408
Derivative financial assets C7 270 -
Other assets B5 12,579 5,333
Total current assets 186,983 137,454
Non-current assets
Other financial assets E5 327 327
Equity accounted investments D1(b) 32,354 33,665
Intangible assets B8 143,101 142,782
Deferred tax assets E2 3,517 4,957
Property, plant and equipment B7 281,949 249,324
Total non-current assets 461,248 431,055
Total assets 648,231 568,509
LIABILITIES
Current liabilities
Payables B4 102,733 81,638
Provisions B9 15,761 13,217
Derivative financial liabilities C7 - 242
Current tax liabilities E2 17,561 5,879
Total current liabilities 136,055 100,976
Non-current liabilities
Borrowings C1 106,775 103,766
Provisions B9 9,223 4,172
Total non-current liabilities 115,998 107,938
Total liabilities 252,053 208,914
NET ASSETS 396,178 359,595
EQUITY
Share capital C2 399,902 395,688
Profit reserve C3 45,802 20,005
Share-based payment reserve E1 2,501 523
Foreign currency translation reserve (435) -
Accumulated losses (56,621) (56,621)
Equity attributable to owners of the parent 391,149 359,595
Non-controlling interests 5,029 -
TOTAL EQUITY 396,178 359,595
The above Consolidated Statement of Financial Position should be read in conjunction with the accompanying notes.
50 Costa Group Holdings Limited – Annual Report 2017
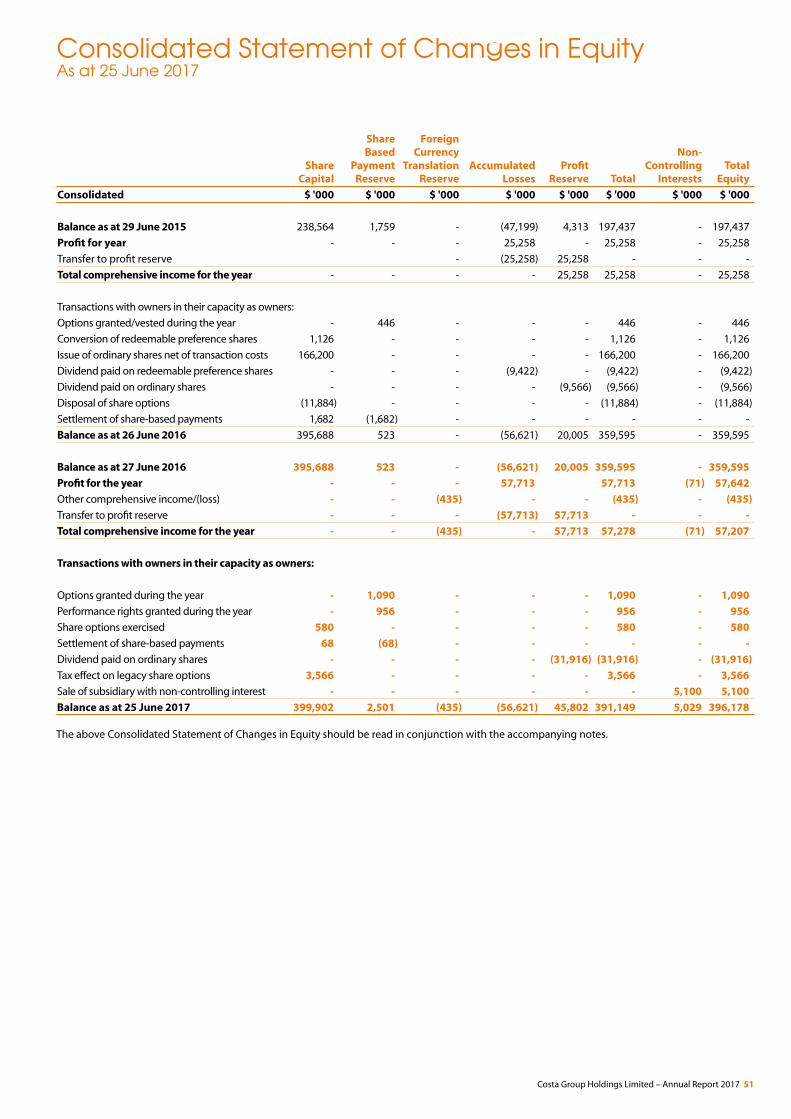
Consolidated Statement of Changes in EquityAs at 25 June 2017
Share Capital
Share Based
Payment Reserve
Foreign Currency
Translation Reserve
Accumulated Losses
Profit Reserve Total
Non-Controlling
InterestsTotal
Equity
Consolidated $ '000 $ '000 $ '000 $ '000 $ '000 $ '000 $ '000 $ '000
Balance as at 29 June 2015 238,564 1,759 - (47,199) 4,313 197,437 - 197,437
Profit for year - - - 25,258 - 25,258 - 25,258
Transfer to profit reserve - (25,258) 25,258 - - -
Total comprehensive income for the year - - - - 25,258 25,258 - 25,258
Transactions with owners in their capacity as owners:
Options granted/vested during the year - 446 - - - 446 - 446
Conversion of redeemable preference shares 1,126 - - - - 1,126 - 1,126
Issue of ordinary shares net of transaction costs 166,200 - - - - 166,200 - 166,200
Dividend paid on redeemable preference shares - - - (9,422) - (9,422) - (9,422)
Dividend paid on ordinary shares - - - - (9,566) (9,566) - (9,566)
Disposal of share options (11,884) - - - - (11,884) - (11,884)
Settlement of share-based payments 1,682 (1,682) - - - - - -
Balance as at 26 June 2016 395,688 523 - (56,621) 20,005 359,595 - 359,595
Balance as at 27 June 2016 395,688 523 - (56,621) 20,005 359,595 - 359,595
Profit for the year - - - 57,713 57,713 (71) 57,642
Other comprehensive income/(loss) - - (435) - - (435) - (435)
Transfer to profit reserve - - - (57,713) 57,713 - - -
Total comprehensive income for the year - - (435) - 57,713 57,278 (71) 57,207
Transactions with owners in their capacity as owners:
Options granted during the year - 1,090 - - - 1,090 - 1,090
Performance rights granted during the year - 956 - - - 956 - 956
Share options exercised 580 - - - - 580 - 580
Settlement of share-based payments 68 (68) - - - - - -
Dividend paid on ordinary shares - - - - (31,916) (31,916) - (31,916)
Tax effect on legacy share options 3,566 - - - - 3,566 - 3,566
Sale of subsidiary with non-controlling interest - - - - - - 5,100 5,100
Balance as at 25 June 2017 399,902 2,501 (435) (56,621) 45,802 391,149 5,029 396,178
The above Consolidated Statement of Changes in Equity should be read in conjunction with the accompanying notes.
Costa Group Holdings Limited – Annual Report 2017 51
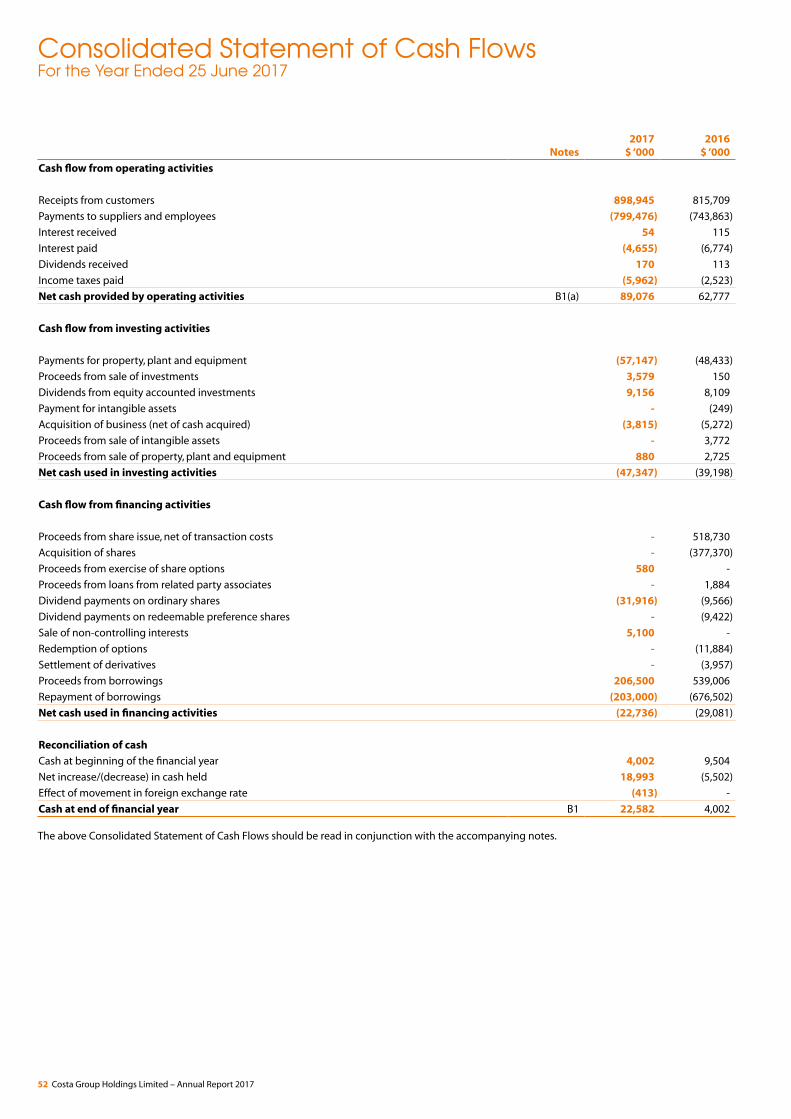
Consolidated Statement of Cash FlowsFor the Year Ended 25 June 2017
Notes2017
$ ‘0002016
$ ‘000
Cash flow from operating activities
Receipts from customers 898,945 815,709
Payments to suppliers and employees (799,476) (743,863)
Interest received 54 115
Interest paid (4,655) (6,774)
Dividends received 170 113
Income taxes paid (5,962) (2,523)
Net cash provided by operating activities B1(a) 89,076 62,777
Cash flow from investing activities
Payments for property, plant and equipment (57,147) (48,433)
Proceeds from sale of investments 3,579 150
Dividends from equity accounted investments 9,156 8,109
Payment for intangible assets - (249)
Acquisition of business (net of cash acquired) (3,815) (5,272)
Proceeds from sale of intangible assets - 3,772
Proceeds from sale of property, plant and equipment 880 2,725
Net cash used in investing activities (47,347) (39,198)
Cash flow from financing activities
Proceeds from share issue, net of transaction costs - 518,730
Acquisition of shares - (377,370)
Proceeds from exercise of share options 580 -
Proceeds from loans from related party associates - 1,884
Dividend payments on ordinary shares (31,916) (9,566)
Dividend payments on redeemable preference shares - (9,422)
Sale of non-controlling interests 5,100 -
Redemption of options - (11,884)
Settlement of derivatives - (3,957)
Proceeds from borrowings 206,500 539,006
Repayment of borrowings (203,000) (676,502)
Net cash used in financing activities (22,736) (29,081)
Reconciliation of cash
Cash at beginning of the financial year 4,002 9,504
Net increase/(decrease) in cash held 18,993 (5,502)
Effect of movement in foreign exchange rate (413) -
Cash at end of financial year B1 22,582 4,002
The above Consolidated Statement of Cash Flows should be read in conjunction with the accompanying notes.
52 Costa Group Holdings Limited – Annual Report 2017
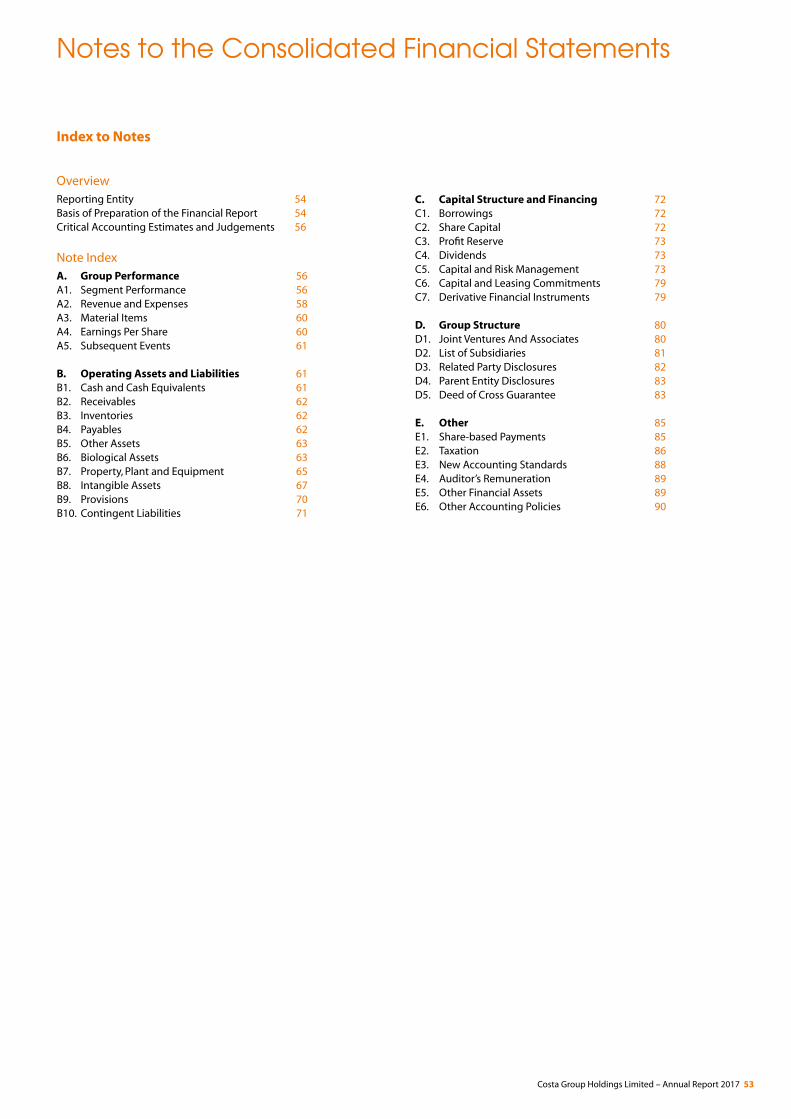
Notes to the Consolidated Financial Statements
Index to Notes
OverviewReporting Entity 54Basis of Preparation of the Financial Report 54Critical Accounting Estimates and Judgements 56
Note IndexA. Group Performance 56A1. Segment Performance 56A2. Revenue and Expenses 58A3. Material Items 60A4. Earnings Per Share 60A5. Subsequent Events 61
B. Operating Assets and Liabilities 61B1. Cash and Cash Equivalents 61B2. Receivables 62B3. Inventories 62B4. Payables 62B5. Other Assets 63B6. Biological Assets 63B7. Property, Plant and Equipment 65B8. Intangible Assets 67B9. Provisions 70B10. Contingent Liabilities 71
C. Capital Structure and Financing 72C1. Borrowings 72C2. Share Capital 72C3. Profit Reserve 73C4. Dividends 73C5. Capital and Risk Management 73C6. Capital and Leasing Commitments 79C7. Derivative Financial Instruments 79
D. Group Structure 80D1. Joint Ventures And Associates 80D2. List of Subsidiaries 81D3. Related Party Disclosures 82D4. Parent Entity Disclosures 83D5. Deed of Cross Guarantee 83
E. Other 85E1. Share-based Payments 85E2. Taxation 86E3. New Accounting Standards 88E4. Auditor’s Remuneration 89E5. Other Financial Assets 89E6. Other Accounting Policies 90
Costa Group Holdings Limited – Annual Report 2017 53
Notes to the Consolidated Financial Statements
Overview Reporting Entity The financial report is for Costa Group Holdings Ltd and its controlled entities (the ‘Group’). Costa Group Holdings Ltd (the ‘Company’) is a company limited by shares, incorporated and domiciled in Australia. Costa Group Holdings Ltd is a for profit entity for the purpose of preparing the financial statements.
The Group’s registered office is Unit 1, 275 Robinsons Road, Ravenhall, VIC, Australia, 3023.
The financial report is a general purpose financial report which has been prepared in accordance with Australian Accounting Standards (AASBs) adopted by the Australian Accounting Standards Board (AASB) and the Corporations Act 2001. The financial report complies with International Financial Reporting Standards (IFRS) adopted by the International Accounting Standards Board (IASB).
The financial report was authorised for issue by the Directors as at 23 August 2017.
Basis of Preparation of the Financial ReportThe notes to the financial report include additional information required to understand the Group’s financial statements that is material and relevant to its operations, financial position and performance. Information is considered material and relevant if the amount in question is significant because of its size or nature or it helps to explain the impact of significant changes in the business, for example, acquisitions and asset write-downs.The notes are organised into the following sections:
Group Performance: focuses on the Group’s financial results and performance. It provides disclosures relating to income, expenses, segment information, material items and earnings per share.
Operating assets and liabilities: provides information regarding the physical assets and non-physical assets used by the Group to generate revenues and profits. This section also explains the accounting policies applied and specific judgements and estimates made by management in arriving at the value of these assets and liabilities.
Capital structure and financing: provides information about capital management practices. Particularly, how much capital is raised from shareholders (equity) and how much is borrowed from financial institutions (debt) in order to finance our activities both now and in the future.
Group structure: explains aspects of the Group’s structure.
Other: provides information on other items relevant to the financial report.
Historical Cost ConventionThe financial report has been prepared under the historical cost convention, except for revaluations to fair value for certain classes of assets and liabilities as described in the accounting policies.
RoundingThe financial report is presented in Australian dollars with all values rounded to the nearest thousand unless otherwise stated, in accordance with ASIC Corporations Instrument 2016/191.
Going ConcernThe financial report has been prepared on a going concern basis.
Goods and Services Tax (GST) Revenues, expenses, liabilities and assets are recognised net of the amount of GST, except where the amount of GST incurred is not recoverable from the Tax Office. In these circumstances the GST is recognised as part of the cost of acquisition of the asset or as part of an item of the expense. Receivables and payables in the statement of financial position are shown inclusive of GST.
Cash flows are presented in the Statement of Cash Flows on a gross basis.
54 Costa Group Holdings Limited – Annual Report 2017
Basis of Consolidation
SubsidiariesSubsidiaries are entities controlled by the Group. The Group controls an entity when it is exposed to, or has rights to variable returns from its involvement with the entity and has the ability to affect those returns through its power over the entity. The financial statements of subsidiaries are included in the financial report from the date that control commences until the date that control ceases.
Investments in Associates and Joint Ventures (Equity Accounted Investments)Associates are those entities in which the Group has significant influence, but not control or joint control, over the financial and operating policies. Significant influence is presumed to exist when the Group holds between 20 and 50 per cent of the voting power of another entity. Joint ventures are those entities over whose activities the Group has joint control established by contractual agreement and requiring unanimous consent for strategic, financial and operating activities.
Investments in associates and joint ventures are accounted for under the equity method and are initially recognised at cost. The cost of the investment includes transaction costs. The financial report includes the Group’s share of the profit or loss and other comprehensive income of equity accounted investments after adjustments to align the accounting policies with those of the Group, from the date that significant influence commences until the date that significant influence ceases.
Transactions Eliminated on ConsolidationIntercompany balances and transactions, and any unrealised income and expenses arising from intercompany transactions, are eliminated in preparing the financial report. Unrealised gains arising from transactions with equity accounted investments are eliminated against the investment to the extent of the Group’s interest in the investments. Unrealised losses are eliminated in the same way as unrealised gains, but only to the extent that there is no evidence of impairment.
Foreign Currency Translations and Balances
Functional and Presentation CurrencyThe financial statements of each entity within the Group are measured using the currency of the primary economic environment in which that entity operates (the functional currency). The financial report is presented in Australian dollars which is the Group’s functional and presentation currency.
Transactions and BalancesTransactions in foreign currencies of entities within the consolidated Group are translated into functional currency at the applicable exchange rate at the date of the transaction.
Foreign currency monetary items that are outstanding at the reporting date (other than monetary items arising under foreign currency contracts where the exchange rate for that monetary item is fixed in the contract) are translated using the spot rate at the end of the reporting period.
All resulting exchange differences arising on settlement or restatement are recognised as revenues and expenses for the reporting period.
Entities that have a functional currency different from the presentation currency are translated as follows:
• assets and liabilities are translated at reporting period end exchange rates prevailing at that reporting date;
• income and expenses are translated at actual exchange rates or average exchange rates for the reporting period, where appropriate; and
• all resulting exchange differences are recognised as a separate component of equity.
Costa Group Holdings Limited – Annual Report 2017 55
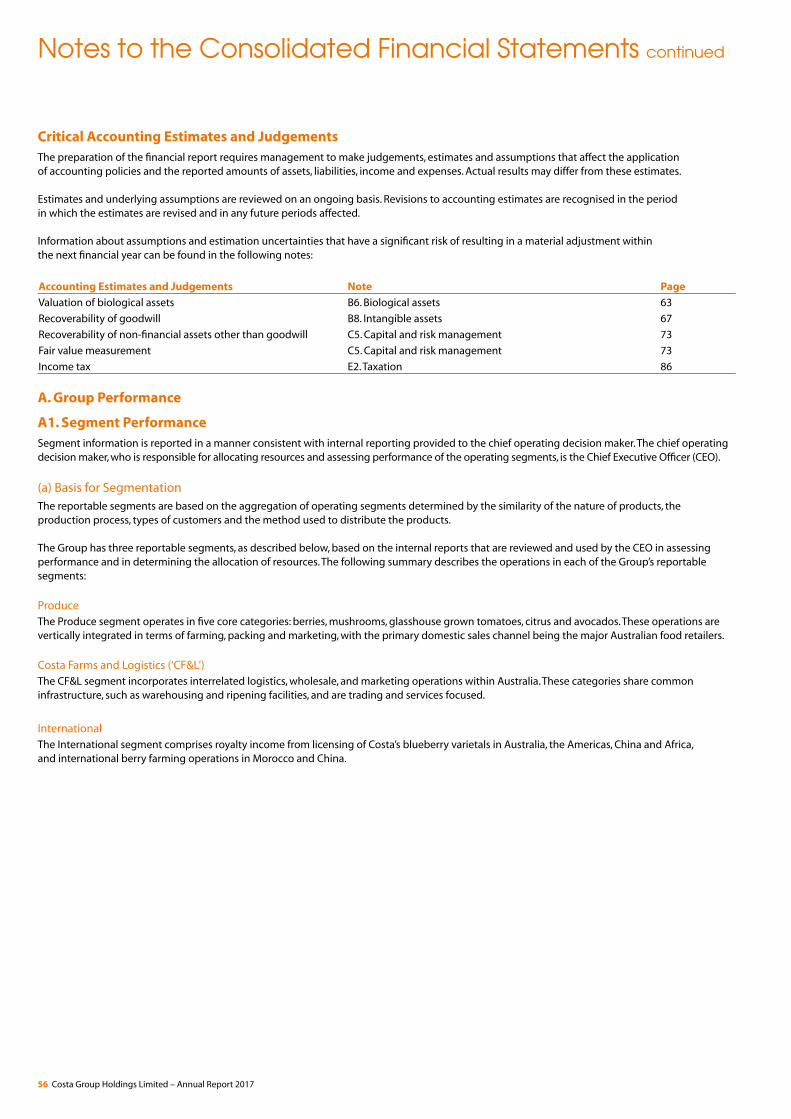
Notes to the Consolidated Financial Statements continued
Critical Accounting Estimates and Judgements The preparation of the financial report requires management to make judgements, estimates and assumptions that affect the application of accounting policies and the reported amounts of assets, liabilities, income and expenses. Actual results may differ from these estimates.
Estimates and underlying assumptions are reviewed on an ongoing basis. Revisions to accounting estimates are recognised in the period in which the estimates are revised and in any future periods affected.
Information about assumptions and estimation uncertainties that have a significant risk of resulting in a material adjustment within the next financial year can be found in the following notes:
Accounting Estimates and Judgements Note Page
Valuation of biological assets B6. Biological assets 63
Recoverability of goodwill B8. Intangible assets 67
Recoverability of non-financial assets other than goodwill C5. Capital and risk management 73
Fair value measurement C5. Capital and risk management 73
Income tax E2. Taxation 86
A. Group Performance
A1. Segment Performance Segment information is reported in a manner consistent with internal reporting provided to the chief operating decision maker. The chief operating decision maker, who is responsible for allocating resources and assessing performance of the operating segments, is the Chief Executive Officer (CEO).
(a) Basis for SegmentationThe reportable segments are based on the aggregation of operating segments determined by the similarity of the nature of products, the production process, types of customers and the method used to distribute the products.
The Group has three reportable segments, as described below, based on the internal reports that are reviewed and used by the CEO in assessing performance and in determining the allocation of resources. The following summary describes the operations in each of the Group’s reportable segments:
ProduceThe Produce segment operates in five core categories: berries, mushrooms, glasshouse grown tomatoes, citrus and avocados. These operations are vertically integrated in terms of farming, packing and marketing, with the primary domestic sales channel being the major Australian food retailers.
Costa Farms and Logistics (‘CF&L’)The CF&L segment incorporates interrelated logistics, wholesale, and marketing operations within Australia. These categories share common infrastructure, such as warehousing and ripening facilities, and are trading and services focused.
InternationalThe International segment comprises royalty income from licensing of Costa’s blueberry varietals in Australia, the Americas, China and Africa, and international berry farming operations in Morocco and China.
56 Costa Group Holdings Limited – Annual Report 2017
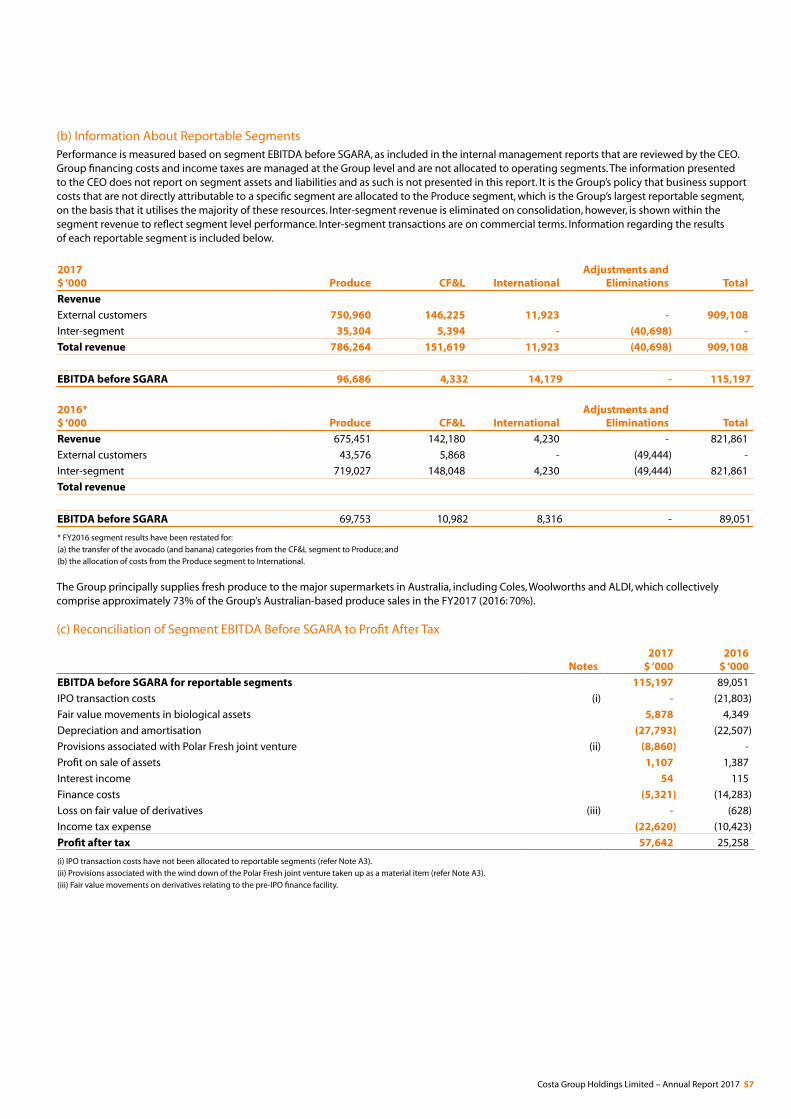
(b) Information About Reportable SegmentsPerformance is measured based on segment EBITDA before SGARA, as included in the internal management reports that are reviewed by the CEO. Group financing costs and income taxes are managed at the Group level and are not allocated to operating segments. The information presented to the CEO does not report on segment assets and liabilities and as such is not presented in this report. It is the Group’s policy that business support costs that are not directly attributable to a specific segment are allocated to the Produce segment, which is the Group’s largest reportable segment, on the basis that it utilises the majority of these resources. Inter-segment revenue is eliminated on consolidation, however, is shown within the segment revenue to reflect segment level performance. Inter-segment transactions are on commercial terms. Information regarding the results of each reportable segment is included below.
2017 $ ‘000 Produce CF&L International
Adjustments and Eliminations Total
Revenue
External customers 750,960 146,225 11,923 - 909,108
Inter-segment 35,304 5,394 - (40,698) -
Total revenue 786,264 151,619 11,923 (40,698) 909,108
EBITDA before SGARA 96,686 4,332 14,179 - 115,197
2016* $ ‘000 Produce CF&L International
Adjustments and Eliminations Total
Revenue 675,451 142,180 4,230 - 821,861
External customers 43,576 5,868 - (49,444) -
Inter-segment 719,027 148,048 4,230 (49,444) 821,861
Total revenue
EBITDA before SGARA 69,753 10,982 8,316 - 89,051
* FY2016 segment results have been restated for:
(a) the transfer of the avocado (and banana) categories from the CF&L segment to Produce; and
(b) the allocation of costs from the Produce segment to International.
The Group principally supplies fresh produce to the major supermarkets in Australia, including Coles, Woolworths and ALDI, which collectively comprise approximately 73% of the Group’s Australian-based produce sales in the FY2017 (2016: 70%).
(c) Reconciliation of Segment EBITDA Before SGARA to Profit After Tax
Notes2017
$ ‘0002016
$ ‘000
EBITDA before SGARA for reportable segments 115,197 89,051
IPO transaction costs (i) - (21,803)
Fair value movements in biological assets 5,878 4,349
Depreciation and amortisation (27,793) (22,507)
Provisions associated with Polar Fresh joint venture (ii) (8,860) -
Profit on sale of assets 1,107 1,387
Interest income 54 115
Finance costs (5,321) (14,283)
Loss on fair value of derivatives (iii) - (628)
Income tax expense (22,620) (10,423)
Profit after tax 57,642 25,258
(i) IPO transaction costs have not been allocated to reportable segments (refer Note A3).
(ii) Provisions associated with the wind down of the Polar Fresh joint venture taken up as a material item (refer Note A3).
(iii) Fair value movements on derivatives relating to the pre-IPO finance facility.
Costa Group Holdings Limited – Annual Report 2017 57
Notes to the Consolidated Financial Statements continued
A2. Revenue and Expenses
Revenue2017
$ ‘0002016
$ ‘000
Sales revenue
Sale of goods and commissions received 873,595 781,477
Rebates and discounts provided (14,244) (13,308)
Rendering of services 35,990 40,858
Total sales revenue 895,341 809,027
Total other revenue 13,767 12,834
Total revenue 909,108 821,861
Recognition and Measurement
Sale of Goods and Commissions ReceivedRevenue from sale of goods is recognised when the significant risks and rewards of ownership of the goods have passed to the buyer and the costs incurred or to be incurred in respect of the transaction can be measured reliably. Revenue is usually recognised when goods are despatched or at the time of delivery of the goods to the customer when the title is transferred.
Certain sales undertaken by the Group are performed in their capacity as an agent, and not merchant relationship. In these instances, the revenue recognised is the commissions payable to the Group.
Rendering of ServicesRevenue from the rendering of services is recognised upon the delivery of the service to the customers.
DividendsDividend income is recognised when the right to receive a dividend has been established. Dividends received from associates and joint ventures are accounted for in accordance with the equity method of accounting.
Interest IncomeInterest income is recognised when it becomes receivable on a proportional basis taking into account the interest rates applicable to the financial assets.
Rental IncomeRental income is recognised on a straight-line basis over the rental term.
Royalty IncomeRoyalty income is recognised on an accrual basis in accordance with the substance of the relevant agreements. Royalty income is recognised in relation to rights provided to entities external to the Group to sell plants and produce that arise from the Group’s operations.
Commission IncomeCommission income is recognised by the Group for sale of goods undertaken by the Group in its capacity as an agent of the transaction. In respect of commissions, management considers that the following factor indicates that the Group acts as an agent:
• the Group neither takes title to nor is exposed to inventory risk related to the goods, and has no significant responsibility in respect of the goods sold;
All revenue is stated net of the amount of goods and services tax (GST).
58 Costa Group Holdings Limited – Annual Report 2017
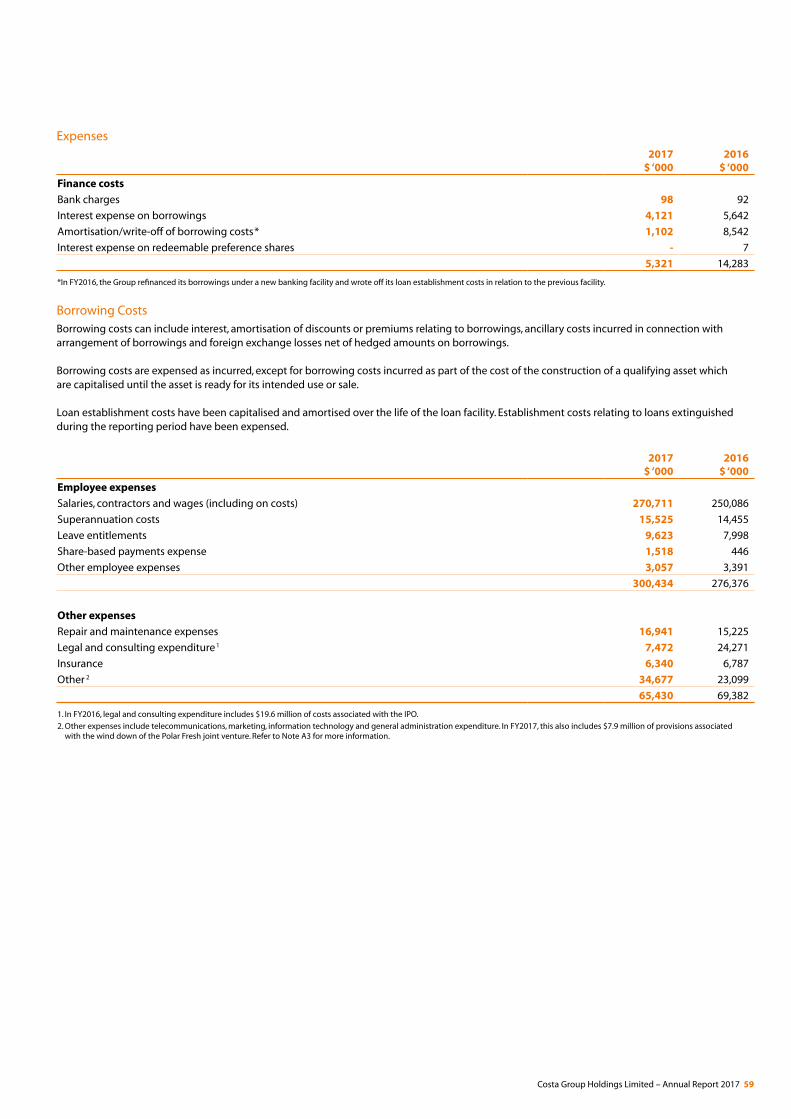
Expenses2017
$ ‘0002016
$ ‘000
Finance costs
Bank charges 98 92
Interest expense on borrowings 4,121 5,642
Amortisation/write-off of borrowing costs* 1,102 8,542
Interest expense on redeemable preference shares - 7
5,321 14,283
*In FY2016, the Group refinanced its borrowings under a new banking facility and wrote off its loan establishment costs in relation to the previous facility.
Borrowing CostsBorrowing costs can include interest, amortisation of discounts or premiums relating to borrowings, ancillary costs incurred in connection with arrangement of borrowings and foreign exchange losses net of hedged amounts on borrowings.
Borrowing costs are expensed as incurred, except for borrowing costs incurred as part of the cost of the construction of a qualifying asset which are capitalised until the asset is ready for its intended use or sale.
Loan establishment costs have been capitalised and amortised over the life of the loan facility. Establishment costs relating to loans extinguished during the reporting period have been expensed.
2017 $ ‘000
2016 $ ‘000
Employee expenses
Salaries, contractors and wages (including on costs) 270,711 250,086
Superannuation costs 15,525 14,455
Leave entitlements 9,623 7,998
Share-based payments expense 1,518 446
Other employee expenses 3,057 3,391
300,434 276,376
Other expenses
Repair and maintenance expenses 16,941 15,225
Legal and consulting expenditure1 7,472 24,271
Insurance 6,340 6,787
Other 2 34,677 23,099
65,430 69,382
1. In FY2016, legal and consulting expenditure includes $19.6 million of costs associated with the IPO.
2. Other expenses include telecommunications, marketing, information technology and general administration expenditure. In FY2017, this also includes $7.9 million of provisions associated with the wind down of the Polar Fresh joint venture. Refer to Note A3 for more information.
Costa Group Holdings Limited – Annual Report 2017 59
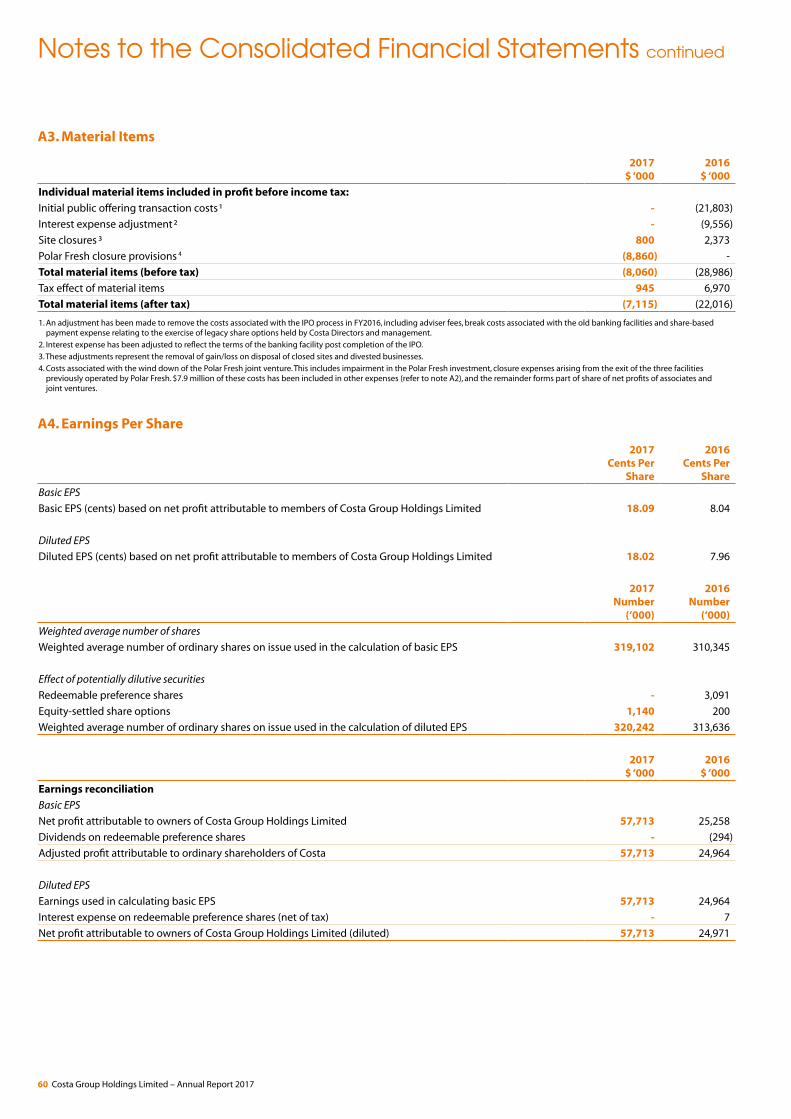
Notes to the Consolidated Financial Statements continued
A3. Material Items
2017 $ ‘000
2016 $ ‘000
Individual material items included in profit before income tax:
Initial public offering transaction costs¹ - (21,803)
Interest expense adjustment² - (9,556)
Site closures ³ 800 2,373
Polar Fresh closure provisions 4 (8,860) -
Total material items (before tax) (8,060) (28,986)
Tax effect of material items 945 6,970
Total material items (after tax) (7,115) (22,016)
1. An adjustment has been made to remove the costs associated with the IPO process in FY2016, including adviser fees, break costs associated with the old banking facilities and share-based payment expense relating to the exercise of legacy share options held by Costa Directors and management.
2. Interest expense has been adjusted to reflect the terms of the banking facility post completion of the IPO.
3. These adjustments represent the removal of gain/loss on disposal of closed sites and divested businesses.
4. Costs associated with the wind down of the Polar Fresh joint venture. This includes impairment in the Polar Fresh investment, closure expenses arising from the exit of the three facilities previously operated by Polar Fresh. $7.9 million of these costs has been included in other expenses (refer to note A2), and the remainder forms part of share of net profits of associates and joint ventures.
A4. Earnings Per Share
2017Cents Per
Share
2016Cents Per
Share
Basic EPS
Basic EPS (cents) based on net profit attributable to members of Costa Group Holdings Limited 18.09 8.04
Diluted EPS
Diluted EPS (cents) based on net profit attributable to members of Costa Group Holdings Limited 18.02 7.96
2017Number
(‘000)
2016Number
(‘000)
Weighted average number of shares
Weighted average number of ordinary shares on issue used in the calculation of basic EPS 319,102 310,345
Effect of potentially dilutive securities
Redeemable preference shares - 3,091
Equity-settled share options 1,140 200
Weighted average number of ordinary shares on issue used in the calculation of diluted EPS 320,242 313,636
2017$ ‘000
2016$ ‘000
Earnings reconciliation
Basic EPS
Net profit attributable to owners of Costa Group Holdings Limited 57,713 25,258
Dividends on redeemable preference shares - (294)
Adjusted profit attributable to ordinary shareholders of Costa 57,713 24,964
Diluted EPS
Earnings used in calculating basic EPS 57,713 24,964
Interest expense on redeemable preference shares (net of tax) - 7
Net profit attributable to owners of Costa Group Holdings Limited (diluted) 57,713 24,971
60 Costa Group Holdings Limited – Annual Report 2017
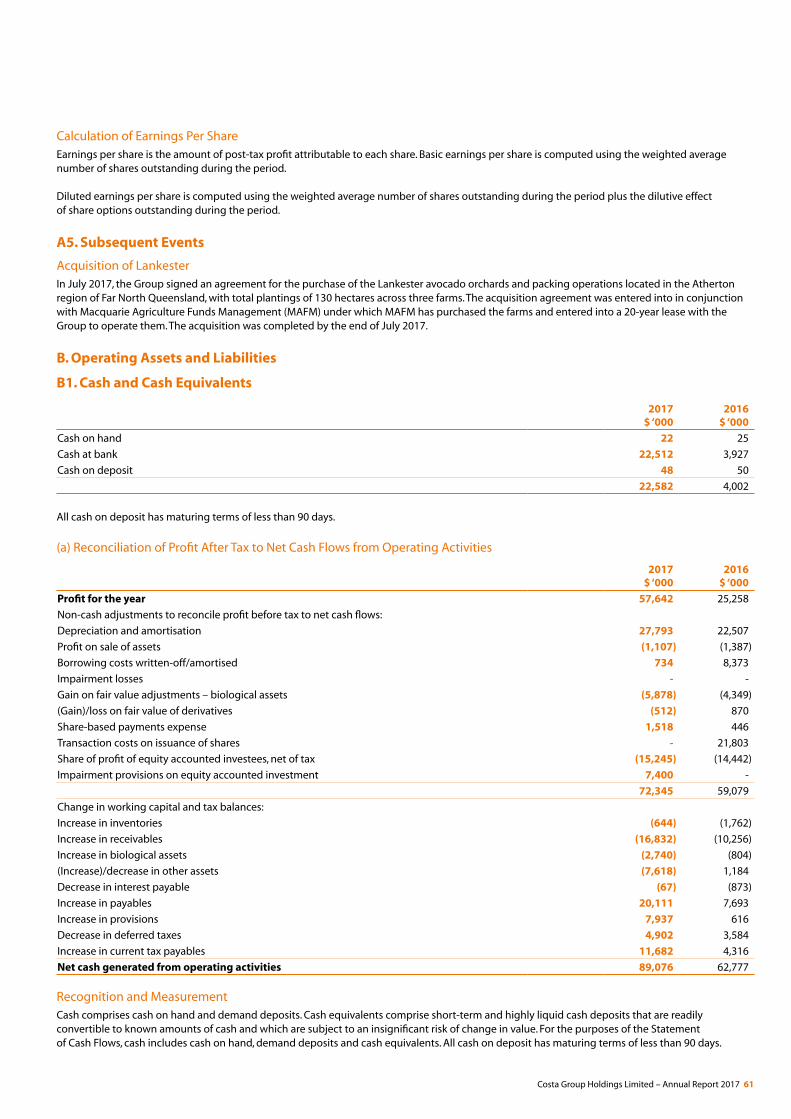
Calculation of Earnings Per ShareEarnings per share is the amount of post-tax profit attributable to each share. Basic earnings per share is computed using the weighted average number of shares outstanding during the period.
Diluted earnings per share is computed using the weighted average number of shares outstanding during the period plus the dilutive effect of share options outstanding during the period.
A5. Subsequent Events
Acquisition of LankesterIn July 2017, the Group signed an agreement for the purchase of the Lankester avocado orchards and packing operations located in the Atherton region of Far North Queensland, with total plantings of 130 hectares across three farms. The acquisition agreement was entered into in conjunction with Macquarie Agriculture Funds Management (MAFM) under which MAFM has purchased the farms and entered into a 20-year lease with the Group to operate them. The acquisition was completed by the end of July 2017.
B. Operating Assets and Liabilities
B1. Cash and Cash Equivalents
2017 $ ‘000
2016 $ ‘000
Cash on hand 22 25
Cash at bank 22,512 3,927
Cash on deposit 48 50
22,582 4,002
All cash on deposit has maturing terms of less than 90 days.
(a) Reconciliation of Profit After Tax to Net Cash Flows from Operating Activities
2017 $ ‘000
2016 $ ‘000
Profit for the year 57,642 25,258
Non-cash adjustments to reconcile profit before tax to net cash flows:
Depreciation and amortisation 27,793 22,507
Profit on sale of assets (1,107) (1,387)
Borrowing costs written-off/amortised 734 8,373
Impairment losses - -
Gain on fair value adjustments – biological assets (5,878) (4,349)
(Gain)/loss on fair value of derivatives (512) 870
Share-based payments expense 1,518 446
Transaction costs on issuance of shares - 21,803
Share of profit of equity accounted investees, net of tax (15,245) (14,442)
Impairment provisions on equity accounted investment 7,400 -
72,345 59,079
Change in working capital and tax balances:
Increase in inventories (644) (1,762)
Increase in receivables (16,832) (10,256)
Increase in biological assets (2,740) (804)
(Increase)/decrease in other assets (7,618) 1,184
Decrease in interest payable (67) (873)
Increase in payables 20,111 7,693
Increase in provisions 7,937 616
Decrease in deferred taxes 4,902 3,584
Increase in current tax payables 11,682 4,316
Net cash generated from operating activities 89,076 62,777
Recognition and Measurement Cash comprises cash on hand and demand deposits. Cash equivalents comprise short-term and highly liquid cash deposits that are readily convertible to known amounts of cash and which are subject to an insignificant risk of change in value. For the purposes of the Statement of Cash Flows, cash includes cash on hand, demand deposits and cash equivalents. All cash on deposit has maturing terms of less than 90 days.
Costa Group Holdings Limited – Annual Report 2017 61
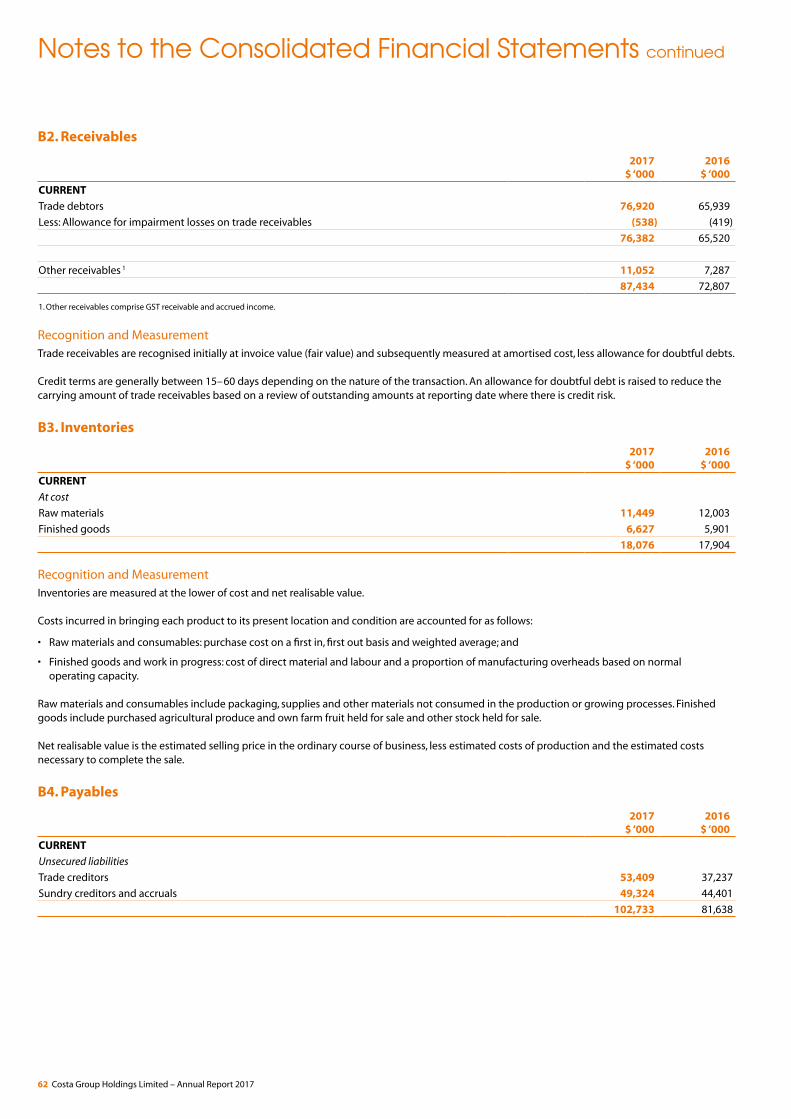
Notes to the Consolidated Financial Statements continued
B2. Receivables
2017 $ ‘000
2016 $ ‘000
CURRENT
Trade debtors 76,920 65,939
Less: Allowance for impairment losses on trade receivables (538) (419)
76,382 65,520
Other receivables 1 11,052 7,287
87,434 72,807
1. Other receivables comprise GST receivable and accrued income.
Recognition and MeasurementTrade receivables are recognised initially at invoice value (fair value) and subsequently measured at amortised cost, less allowance for doubtful debts. Credit terms are generally between 15–60 days depending on the nature of the transaction. An allowance for doubtful debt is raised to reduce the carrying amount of trade receivables based on a review of outstanding amounts at reporting date where there is credit risk.
B3. Inventories
2017 $ ‘000
2016 $ ‘000
CURRENT
At cost
Raw materials 11,449 12,003
Finished goods 6,627 5,901
18,076 17,904
Recognition and MeasurementInventories are measured at the lower of cost and net realisable value.
Costs incurred in bringing each product to its present location and condition are accounted for as follows:
• Raw materials and consumables: purchase cost on a first in, first out basis and weighted average; and
• Finished goods and work in progress: cost of direct material and labour and a proportion of manufacturing overheads based on normal operating capacity.
Raw materials and consumables include packaging, supplies and other materials not consumed in the production or growing processes. Finished goods include purchased agricultural produce and own farm fruit held for sale and other stock held for sale.
Net realisable value is the estimated selling price in the ordinary course of business, less estimated costs of production and the estimated costs necessary to complete the sale.
B4. Payables
2017 $ ‘000
2016 $ ‘000
CURRENT
Unsecured liabilities
Trade creditors 53,409 37,237
Sundry creditors and accruals 49,324 44,401
102,733 81,638
62 Costa Group Holdings Limited – Annual Report 2017
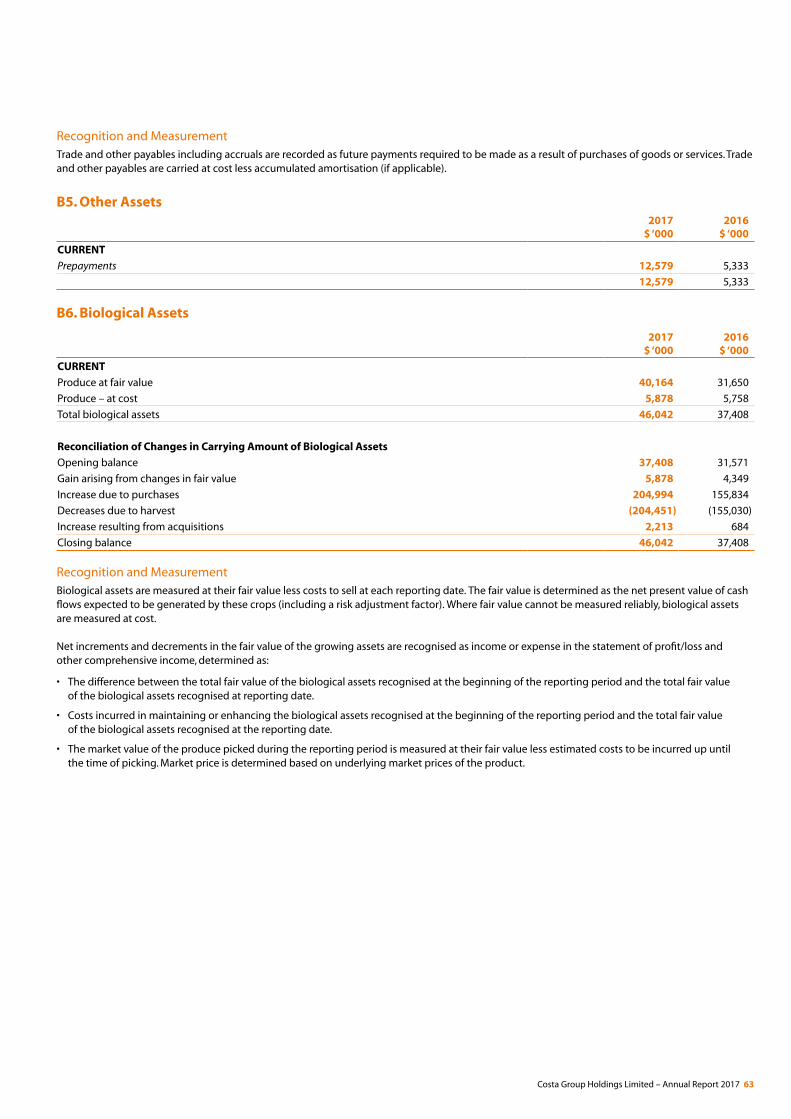
Recognition and MeasurementTrade and other payables including accruals are recorded as future payments required to be made as a result of purchases of goods or services. Trade and other payables are carried at cost less accumulated amortisation (if applicable).
B5. Other Assets 2017
$ ‘0002016
$ ‘000
CURRENT
Prepayments 12,579 5,333
12,579 5,333
B6. Biological Assets
2017 $ ‘000
2016 $ ‘000
CURRENT
Produce at fair value 40,164 31,650
Produce – at cost 5,878 5,758
Total biological assets 46,042 37,408
Reconciliation of Changes in Carrying Amount of Biological Assets
Opening balance 37,408 31,571
Gain arising from changes in fair value 5,878 4,349
Increase due to purchases 204,994 155,834
Decreases due to harvest (204,451) (155,030)
Increase resulting from acquisitions 2,213 684
Closing balance 46,042 37,408
Recognition and MeasurementBiological assets are measured at their fair value less costs to sell at each reporting date. The fair value is determined as the net present value of cash flows expected to be generated by these crops (including a risk adjustment factor). Where fair value cannot be measured reliably, biological assets are measured at cost.
Net increments and decrements in the fair value of the growing assets are recognised as income or expense in the statement of profit/loss and other comprehensive income, determined as:
• The difference between the total fair value of the biological assets recognised at the beginning of the reporting period and the total fair value of the biological assets recognised at reporting date.
• Costs incurred in maintaining or enhancing the biological assets recognised at the beginning of the reporting period and the total fair value of the biological assets recognised at the reporting date.
• The market value of the produce picked during the reporting period is measured at their fair value less estimated costs to be incurred up until the time of picking. Market price is determined based on underlying market prices of the product.
Costa Group Holdings Limited – Annual Report 2017 63
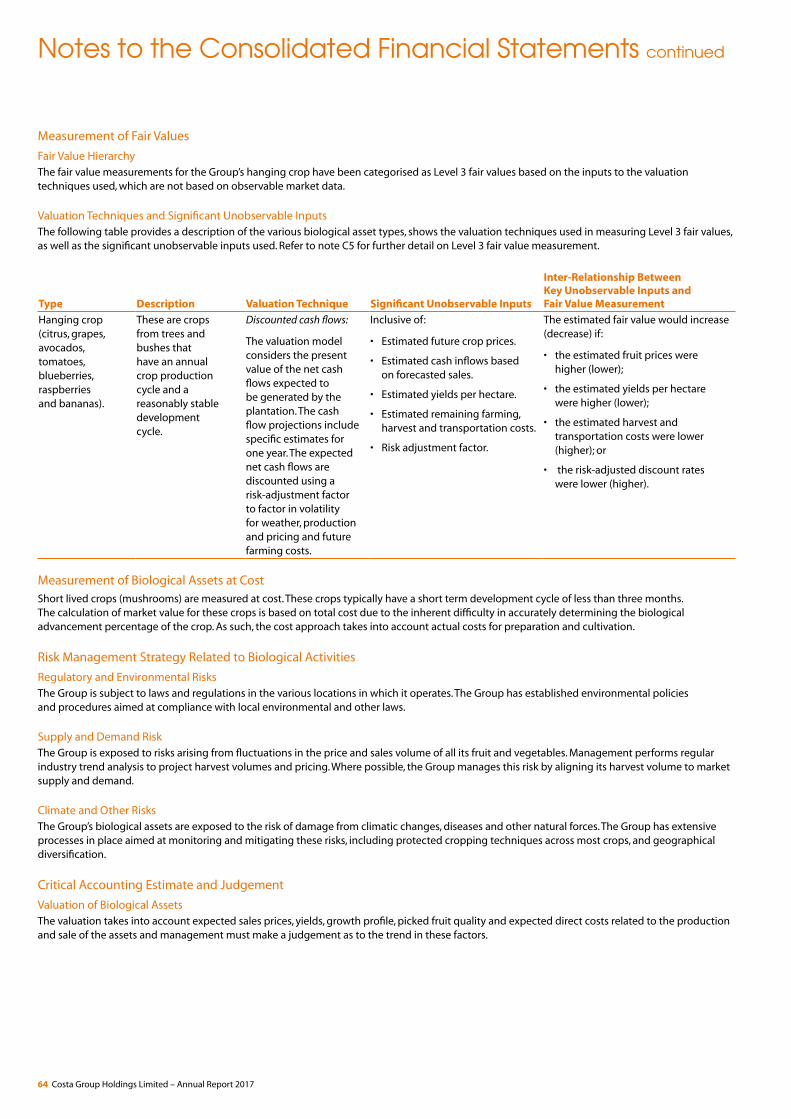
Notes to the Consolidated Financial Statements continued
Measurement of Fair Values
Fair Value Hierarchy The fair value measurements for the Group’s hanging crop have been categorised as Level 3 fair values based on the inputs to the valuation techniques used, which are not based on observable market data.
Valuation Techniques and Significant Unobservable InputsThe following table provides a description of the various biological asset types, shows the valuation techniques used in measuring Level 3 fair values, as well as the significant unobservable inputs used. Refer to note C5 for further detail on Level 3 fair value measurement.
Type Description Valuation Technique Significant Unobservable Inputs
Inter-Relationship Between Key Unobservable Inputs and Fair Value Measurement
Hanging crop (citrus, grapes, avocados, tomatoes, blueberries, raspberries and bananas).
These are crops from trees and bushes that have an annual crop production cycle and a reasonably stable development cycle.
Discounted cash flows:
The valuation model considers the present value of the net cash flows expected to be generated by the plantation. The cash flow projections include specific estimates for one year. The expected net cash flows are discounted using a risk-adjustment factor to factor in volatility for weather, production and pricing and future farming costs.
Inclusive of:
• Estimated future crop prices.
• Estimated cash inflows based on forecasted sales.
• Estimated yields per hectare.
• Estimated remaining farming, harvest and transportation costs.
• Risk adjustment factor.
The estimated fair value would increase (decrease) if:
• the estimated fruit prices were higher (lower);
• the estimated yields per hectare were higher (lower);
• the estimated harvest and transportation costs were lower (higher); or
• the risk-adjusted discount rates were lower (higher).
Measurement of Biological Assets at CostShort lived crops (mushrooms) are measured at cost. These crops typically have a short term development cycle of less than three months. The calculation of market value for these crops is based on total cost due to the inherent difficulty in accurately determining the biological advancement percentage of the crop. As such, the cost approach takes into account actual costs for preparation and cultivation.
Risk Management Strategy Related to Biological Activities
Regulatory and Environmental RisksThe Group is subject to laws and regulations in the various locations in which it operates. The Group has established environmental policies and procedures aimed at compliance with local environmental and other laws.
Supply and Demand RiskThe Group is exposed to risks arising from fluctuations in the price and sales volume of all its fruit and vegetables. Management performs regular industry trend analysis to project harvest volumes and pricing. Where possible, the Group manages this risk by aligning its harvest volume to market supply and demand.
Climate and Other RisksThe Group’s biological assets are exposed to the risk of damage from climatic changes, diseases and other natural forces. The Group has extensive processes in place aimed at monitoring and mitigating these risks, including protected cropping techniques across most crops, and geographical diversification.
Critical Accounting Estimate and Judgement
Valuation of Biological AssetsThe valuation takes into account expected sales prices, yields, growth profile, picked fruit quality and expected direct costs related to the production and sale of the assets and management must make a judgement as to the trend in these factors.
64 Costa Group Holdings Limited – Annual Report 2017
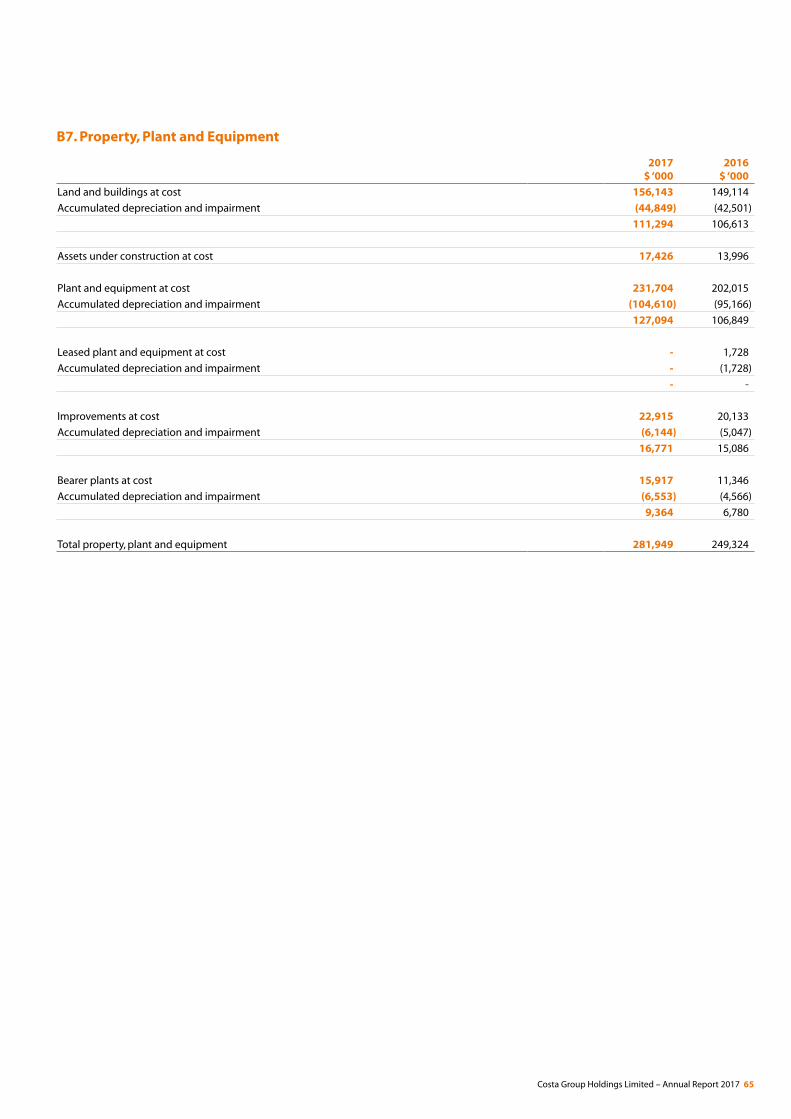
B7. Property, Plant and Equipment
2017 $ ‘000
2016 $ ‘000
Land and buildings at cost 156,143 149,114
Accumulated depreciation and impairment (44,849) (42,501)
111,294 106,613
Assets under construction at cost 17,426 13,996
Plant and equipment at cost 231,704 202,015
Accumulated depreciation and impairment (104,610) (95,166)
127,094 106,849
Leased plant and equipment at cost - 1,728
Accumulated depreciation and impairment - (1,728)
- -
Improvements at cost 22,915 20,133
Accumulated depreciation and impairment (6,144) (5,047)
16,771 15,086
Bearer plants at cost 15,917 11,346
Accumulated depreciation and impairment (6,553) (4,566)
9,364 6,780
Total property, plant and equipment 281,949 249,324
Costa Group Holdings Limited – Annual Report 2017 65
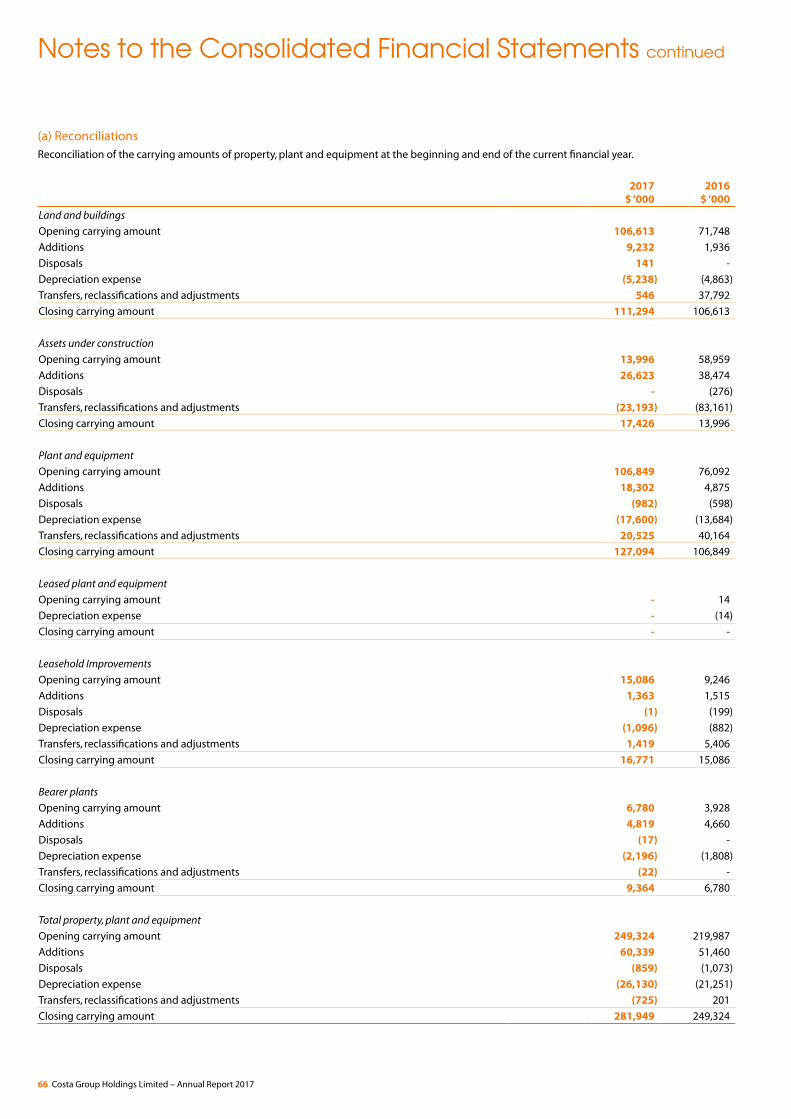
Notes to the Consolidated Financial Statements continued
(a) ReconciliationsReconciliation of the carrying amounts of property, plant and equipment at the beginning and end of the current financial year.
2017 $ ‘000
2016 $ ‘000
Land and buildings
Opening carrying amount 106,613 71,748
Additions 9,232 1,936
Disposals 141 -
Depreciation expense (5,238) (4,863)
Transfers, reclassifications and adjustments 546 37,792
Closing carrying amount 111,294 106,613
Assets under construction
Opening carrying amount 13,996 58,959
Additions 26,623 38,474
Disposals - (276)
Transfers, reclassifications and adjustments (23,193) (83,161)
Closing carrying amount 17,426 13,996
Plant and equipment
Opening carrying amount 106,849 76,092
Additions 18,302 4,875
Disposals (982) (598)
Depreciation expense (17,600) (13,684)
Transfers, reclassifications and adjustments 20,525 40,164
Closing carrying amount 127,094 106,849
Leased plant and equipment
Opening carrying amount - 14
Depreciation expense - (14)
Closing carrying amount - -
Leasehold Improvements
Opening carrying amount 15,086 9,246
Additions 1,363 1,515
Disposals (1) (199)
Depreciation expense (1,096) (882)
Transfers, reclassifications and adjustments 1,419 5,406
Closing carrying amount 16,771 15,086
Bearer plants
Opening carrying amount 6,780 3,928
Additions 4,819 4,660
Disposals (17) -
Depreciation expense (2,196) (1,808)
Transfers, reclassifications and adjustments (22) -
Closing carrying amount 9,364 6,780
Total property, plant and equipment
Opening carrying amount 249,324 219,987
Additions 60,339 51,460
Disposals (859) (1,073)
Depreciation expense (26,130) (21,251)
Transfers, reclassifications and adjustments (725) 201
Closing carrying amount 281,949 249,324
66 Costa Group Holdings Limited – Annual Report 2017
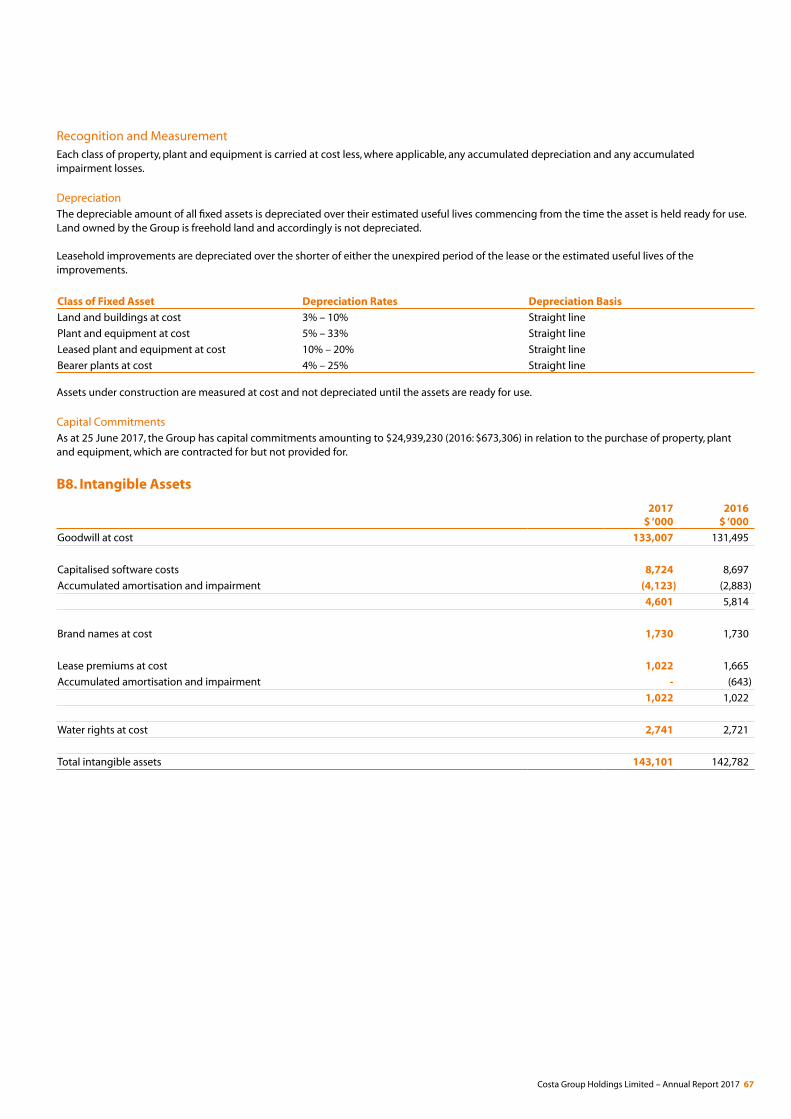
Recognition and Measurement Each class of property, plant and equipment is carried at cost less, where applicable, any accumulated depreciation and any accumulated impairment losses.
DepreciationThe depreciable amount of all fixed assets is depreciated over their estimated useful lives commencing from the time the asset is held ready for use. Land owned by the Group is freehold land and accordingly is not depreciated.
Leasehold improvements are depreciated over the shorter of either the unexpired period of the lease or the estimated useful lives of the improvements.
Class of Fixed Asset Depreciation Rates Depreciation Basis
Land and buildings at cost 3% – 10% Straight line
Plant and equipment at cost 5% – 33% Straight line
Leased plant and equipment at cost 10% – 20% Straight line
Bearer plants at cost 4% – 25% Straight line
Assets under construction are measured at cost and not depreciated until the assets are ready for use.
Capital CommitmentsAs at 25 June 2017, the Group has capital commitments amounting to $24,939,230 (2016: $673,306) in relation to the purchase of property, plant and equipment, which are contracted for but not provided for.
B8. Intangible Assets
2017 $ ‘000
2016 $ ‘000
Goodwill at cost 133,007 131,495
Capitalised software costs 8,724 8,697
Accumulated amortisation and impairment (4,123) (2,883)
4,601 5,814
Brand names at cost 1,730 1,730
Lease premiums at cost 1,022 1,665
Accumulated amortisation and impairment - (643)
1,022 1,022
Water rights at cost 2,741 2,721
Total intangible assets 143,101 142,782
Costa Group Holdings Limited – Annual Report 2017 67
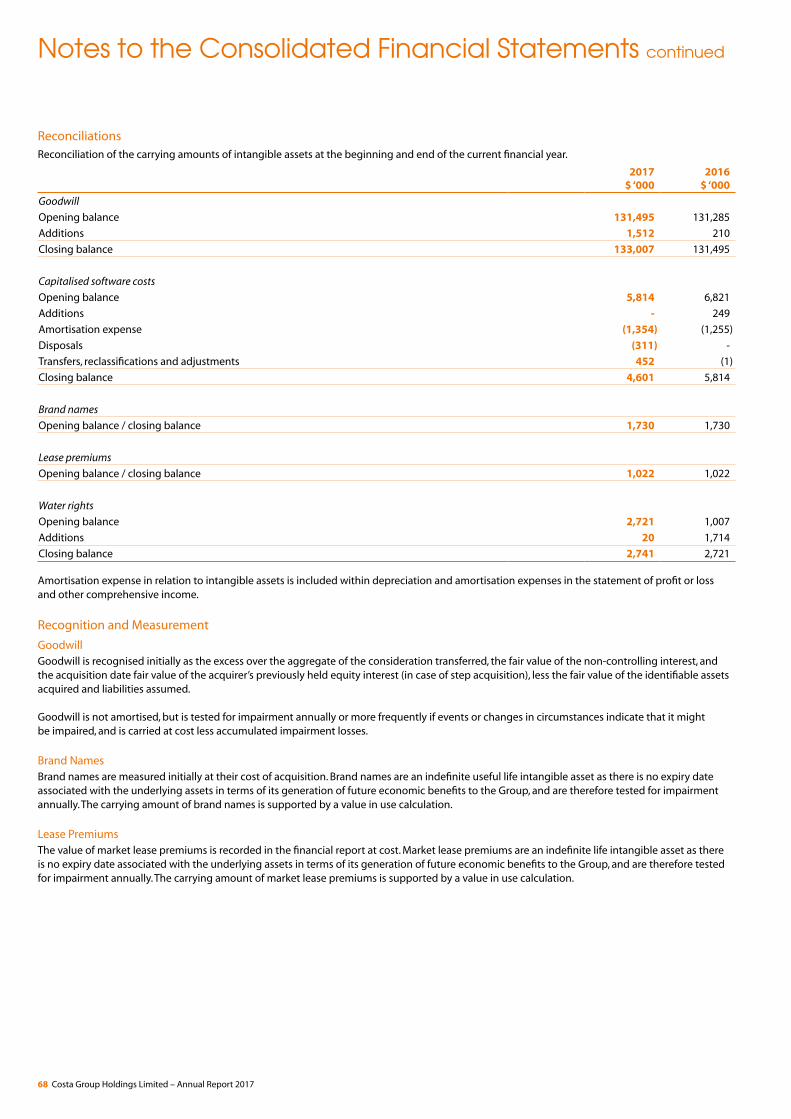
ReconciliationsReconciliation of the carrying amounts of intangible assets at the beginning and end of the current financial year.
2017 $ ‘000
2016 $ ‘000
Goodwill
Opening balance 131,495 131,285
Additions 1,512 210
Closing balance 133,007 131,495
Capitalised software costs
Opening balance 5,814 6,821
Additions - 249
Amortisation expense (1,354) (1,255)
Disposals (311) -
Transfers, reclassifications and adjustments 452 (1)
Closing balance 4,601 5,814
Brand names
Opening balance / closing balance 1,730 1,730
Lease premiums
Opening balance / closing balance 1,022 1,022
Water rights
Opening balance 2,721 1,007
Additions 20 1,714
Closing balance 2,741 2,721
Amortisation expense in relation to intangible assets is included within depreciation and amortisation expenses in the statement of profit or loss and other comprehensive income.
Recognition and Measurement
GoodwillGoodwill is recognised initially as the excess over the aggregate of the consideration transferred, the fair value of the non-controlling interest, and the acquisition date fair value of the acquirer’s previously held equity interest (in case of step acquisition), less the fair value of the identifiable assets acquired and liabilities assumed.
Goodwill is not amortised, but is tested for impairment annually or more frequently if events or changes in circumstances indicate that it might be impaired, and is carried at cost less accumulated impairment losses.
Brand NamesBrand names are measured initially at their cost of acquisition. Brand names are an indefinite useful life intangible asset as there is no expiry date associated with the underlying assets in terms of its generation of future economic benefits to the Group, and are therefore tested for impairment annually. The carrying amount of brand names is supported by a value in use calculation.
Lease PremiumsThe value of market lease premiums is recorded in the financial report at cost. Market lease premiums are an indefinite life intangible asset as there is no expiry date associated with the underlying assets in terms of its generation of future economic benefits to the Group, and are therefore tested for impairment annually. The carrying amount of market lease premiums is supported by a value in use calculation.
Notes to the Consolidated Financial Statements continued
68 Costa Group Holdings Limited – Annual Report 2017
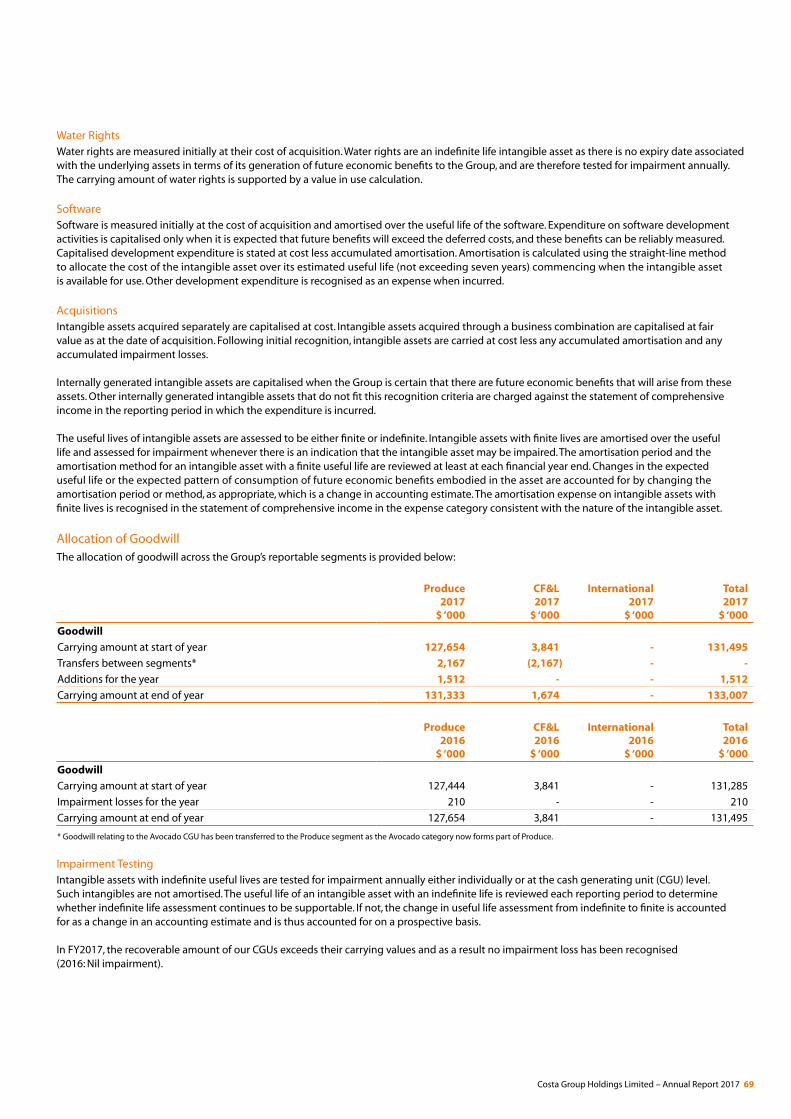
Water RightsWater rights are measured initially at their cost of acquisition. Water rights are an indefinite life intangible asset as there is no expiry date associated with the underlying assets in terms of its generation of future economic benefits to the Group, and are therefore tested for impairment annually. The carrying amount of water rights is supported by a value in use calculation.
SoftwareSoftware is measured initially at the cost of acquisition and amortised over the useful life of the software. Expenditure on software development activities is capitalised only when it is expected that future benefits will exceed the deferred costs, and these benefits can be reliably measured. Capitalised development expenditure is stated at cost less accumulated amortisation. Amortisation is calculated using the straight-line method to allocate the cost of the intangible asset over its estimated useful life (not exceeding seven years) commencing when the intangible asset is available for use. Other development expenditure is recognised as an expense when incurred.
AcquisitionsIntangible assets acquired separately are capitalised at cost. Intangible assets acquired through a business combination are capitalised at fair value as at the date of acquisition. Following initial recognition, intangible assets are carried at cost less any accumulated amortisation and any accumulated impairment losses.
Internally generated intangible assets are capitalised when the Group is certain that there are future economic benefits that will arise from these assets. Other internally generated intangible assets that do not fit this recognition criteria are charged against the statement of comprehensive income in the reporting period in which the expenditure is incurred.
The useful lives of intangible assets are assessed to be either finite or indefinite. Intangible assets with finite lives are amortised over the useful life and assessed for impairment whenever there is an indication that the intangible asset may be impaired. The amortisation period and the amortisation method for an intangible asset with a finite useful life are reviewed at least at each financial year end. Changes in the expected useful life or the expected pattern of consumption of future economic benefits embodied in the asset are accounted for by changing the amortisation period or method, as appropriate, which is a change in accounting estimate. The amortisation expense on intangible assets with finite lives is recognised in the statement of comprehensive income in the expense category consistent with the nature of the intangible asset.
Allocation of GoodwillThe allocation of goodwill across the Group’s reportable segments is provided below:
Produce2017
$ ‘000
CF&L2017
$ ‘000
International2017
$ ‘000
Total2017
$ ‘000
Goodwill
Carrying amount at start of year 127,654 3,841 - 131,495
Transfers between segments* 2,167 (2,167) - -
Additions for the year 1,512 - - 1,512
Carrying amount at end of year 131,333 1,674 - 133,007
Produce2016
$ ‘000
CF&L2016
$ ‘000
International2016
$ ‘000
Total2016
$ ‘000
Goodwill
Carrying amount at start of year 127,444 3,841 - 131,285
Impairment losses for the year 210 - - 210
Carrying amount at end of year 127,654 3,841 - 131,495
* Goodwill relating to the Avocado CGU has been transferred to the Produce segment as the Avocado category now forms part of Produce.
Impairment Testing Intangible assets with indefinite useful lives are tested for impairment annually either individually or at the cash generating unit (CGU) level. Such intangibles are not amortised. The useful life of an intangible asset with an indefinite life is reviewed each reporting period to determine whether indefinite life assessment continues to be supportable. If not, the change in useful life assessment from indefinite to finite is accounted for as a change in an accounting estimate and is thus accounted for on a prospective basis.
In FY2017, the recoverable amount of our CGUs exceeds their carrying values and as a result no impairment loss has been recognised (2016: Nil impairment).
Costa Group Holdings Limited – Annual Report 2017 69
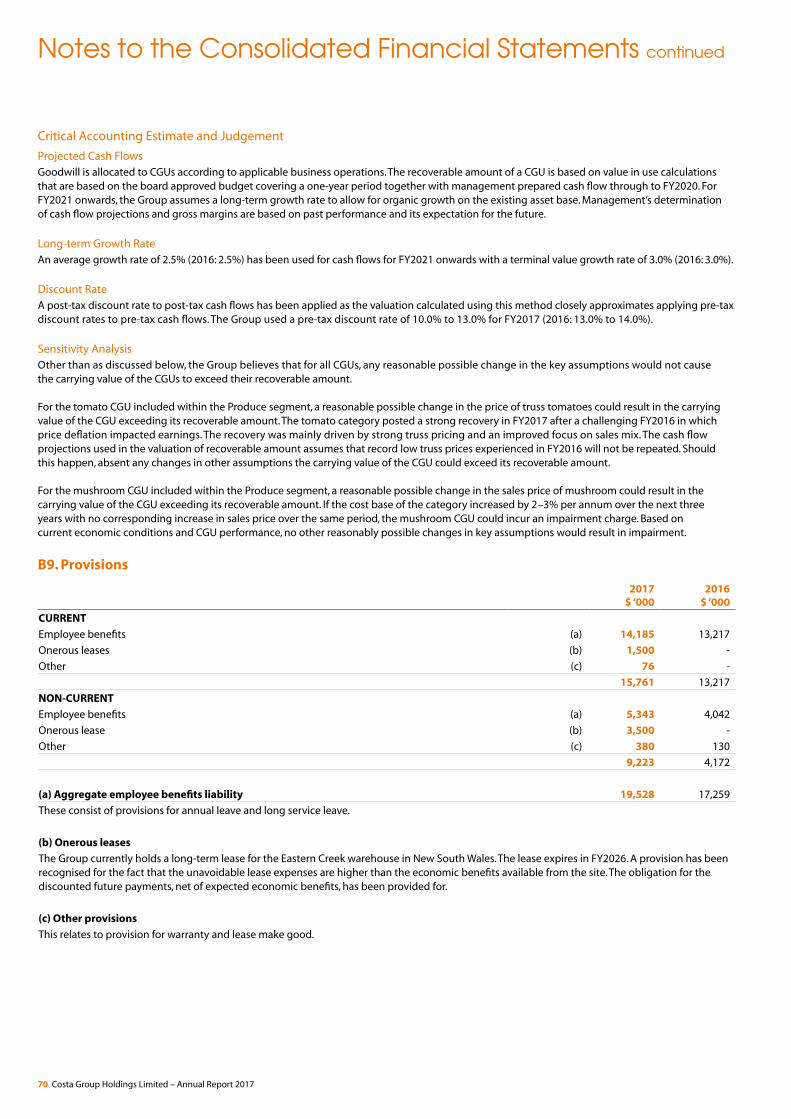
Critical Accounting Estimate and Judgement
Projected Cash FlowsGoodwill is allocated to CGUs according to applicable business operations. The recoverable amount of a CGU is based on value in use calculations that are based on the board approved budget covering a one-year period together with management prepared cash flow through to FY2020. For FY2021 onwards, the Group assumes a long-term growth rate to allow for organic growth on the existing asset base. Management’s determination of cash flow projections and gross margins are based on past performance and its expectation for the future.
Long-term Growth RateAn average growth rate of 2.5% (2016: 2.5%) has been used for cash flows for FY2021 onwards with a terminal value growth rate of 3.0% (2016: 3.0%).
Discount RateA post-tax discount rate to post-tax cash flows has been applied as the valuation calculated using this method closely approximates applying pre-tax discount rates to pre-tax cash flows. The Group used a pre-tax discount rate of 10.0% to 13.0% for FY2017 (2016: 13.0% to 14.0%).
Sensitivity Analysis Other than as discussed below, the Group believes that for all CGUs, any reasonable possible change in the key assumptions would not cause the carrying value of the CGUs to exceed their recoverable amount.
For the tomato CGU included within the Produce segment, a reasonable possible change in the price of truss tomatoes could result in the carrying value of the CGU exceeding its recoverable amount. The tomato category posted a strong recovery in FY2017 after a challenging FY2016 in which price deflation impacted earnings. The recovery was mainly driven by strong truss pricing and an improved focus on sales mix. The cash flow projections used in the valuation of recoverable amount assumes that record low truss prices experienced in FY2016 will not be repeated. Should this happen, absent any changes in other assumptions the carrying value of the CGU could exceed its recoverable amount.
For the mushroom CGU included within the Produce segment, a reasonable possible change in the sales price of mushroom could result in the carrying value of the CGU exceeding its recoverable amount. If the cost base of the category increased by 2–3% per annum over the next three years with no corresponding increase in sales price over the same period, the mushroom CGU could incur an impairment charge. Based on current economic conditions and CGU performance, no other reasonably possible changes in key assumptions would result in impairment.
B9. Provisions
2017 $ ‘000
2016 $ ‘000
CURRENT
Employee benefits (a) 14,185 13,217
Onerous leases (b) 1,500 -
Other (c) 76 -
15,761 13,217
NON-CURRENT
Employee benefits (a) 5,343 4,042
Onerous lease (b) 3,500 -
Other (c) 380 130
9,223 4,172
(a) Aggregate employee benefits liability 19,528 17,259
These consist of provisions for annual leave and long service leave.
(b) Onerous leases
The Group currently holds a long-term lease for the Eastern Creek warehouse in New South Wales. The lease expires in FY2026. A provision has been recognised for the fact that the unavoidable lease expenses are higher than the economic benefits available from the site. The obligation for the discounted future payments, net of expected economic benefits, has been provided for.
(c) Other provisions
This relates to provision for warranty and lease make good.
Notes to the Consolidated Financial Statements continued
70 Costa Group Holdings Limited – Annual Report 2017
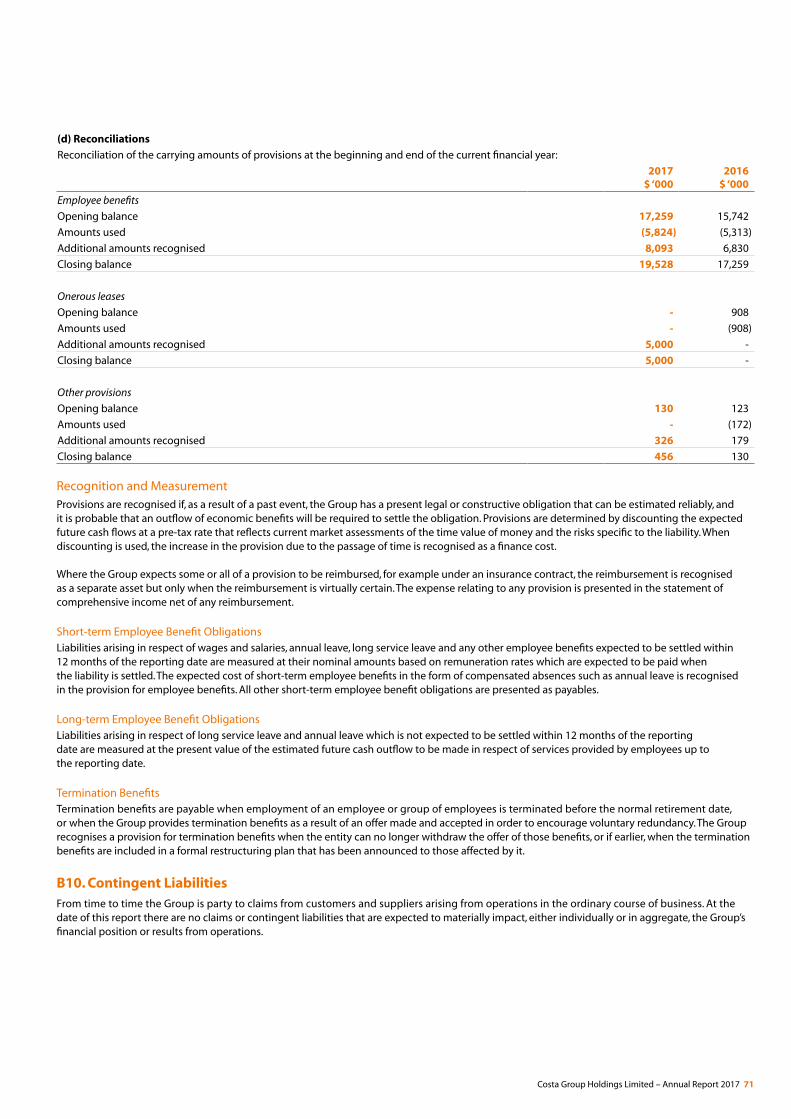
(d) Reconciliations
Reconciliation of the carrying amounts of provisions at the beginning and end of the current financial year:
2017 $ ‘000
2016 $ ‘000
Employee benefits
Opening balance 17,259 15,742
Amounts used (5,824) (5,313)
Additional amounts recognised 8,093 6,830
Closing balance 19,528 17,259
Onerous leases
Opening balance - 908
Amounts used - (908)
Additional amounts recognised 5,000 -
Closing balance 5,000 -
Other provisions
Opening balance 130 123
Amounts used - (172)
Additional amounts recognised 326 179
Closing balance 456 130
Recognition and MeasurementProvisions are recognised if, as a result of a past event, the Group has a present legal or constructive obligation that can be estimated reliably, and it is probable that an outflow of economic benefits will be required to settle the obligation. Provisions are determined by discounting the expected future cash flows at a pre-tax rate that reflects current market assessments of the time value of money and the risks specific to the liability. When discounting is used, the increase in the provision due to the passage of time is recognised as a finance cost.
Where the Group expects some or all of a provision to be reimbursed, for example under an insurance contract, the reimbursement is recognised as a separate asset but only when the reimbursement is virtually certain. The expense relating to any provision is presented in the statement of comprehensive income net of any reimbursement.
Short-term Employee Benefit ObligationsLiabilities arising in respect of wages and salaries, annual leave, long service leave and any other employee benefits expected to be settled within 12 months of the reporting date are measured at their nominal amounts based on remuneration rates which are expected to be paid when the liability is settled. The expected cost of short-term employee benefits in the form of compensated absences such as annual leave is recognised in the provision for employee benefits. All other short-term employee benefit obligations are presented as payables.
Long-term Employee Benefit ObligationsLiabilities arising in respect of long service leave and annual leave which is not expected to be settled within 12 months of the reporting date are measured at the present value of the estimated future cash outflow to be made in respect of services provided by employees up to the reporting date.
Termination BenefitsTermination benefits are payable when employment of an employee or group of employees is terminated before the normal retirement date, or when the Group provides termination benefits as a result of an offer made and accepted in order to encourage voluntary redundancy. The Group recognises a provision for termination benefits when the entity can no longer withdraw the offer of those benefits, or if earlier, when the termination benefits are included in a formal restructuring plan that has been announced to those affected by it.
B10. Contingent Liabilities From time to time the Group is party to claims from customers and suppliers arising from operations in the ordinary course of business. At the date of this report there are no claims or contingent liabilities that are expected to materially impact, either individually or in aggregate, the Group’s financial position or results from operations.
Costa Group Holdings Limited – Annual Report 2017 71
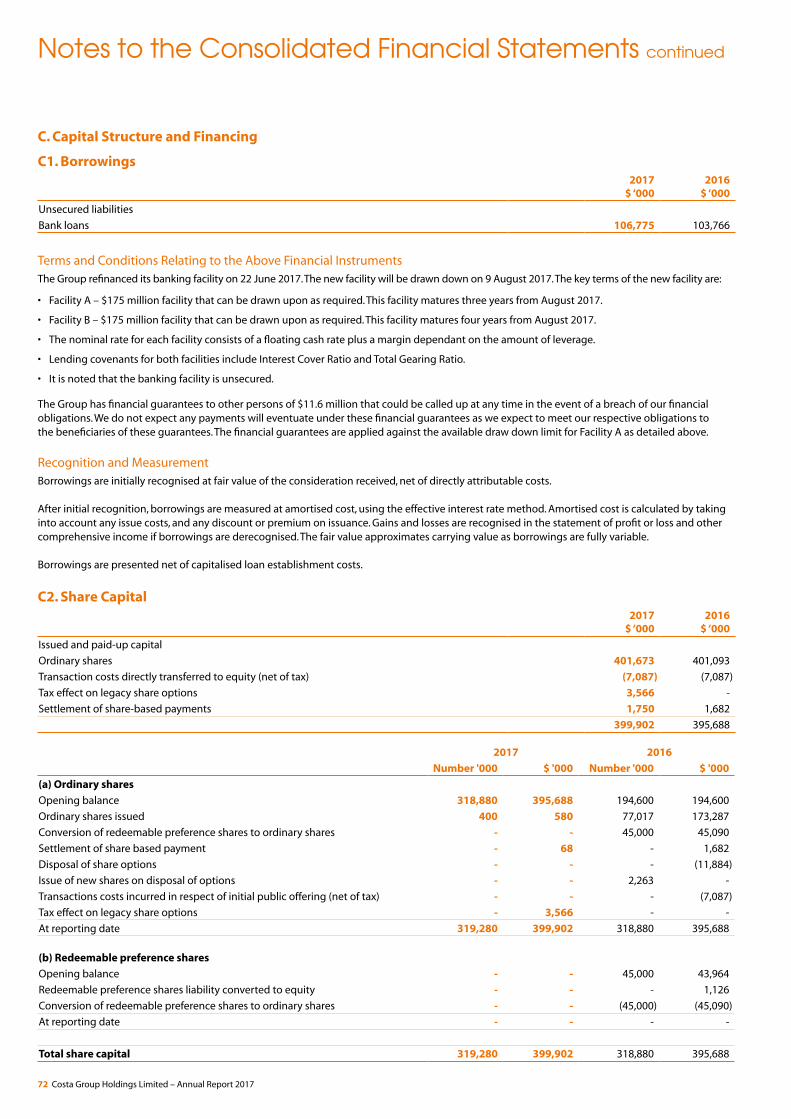
C. Capital Structure and Financing
C1. Borrowings2017
$ ‘0002016
$ ‘000
Unsecured liabilities
Bank loans 106,775 103,766
Terms and Conditions Relating to the Above Financial InstrumentsThe Group refinanced its banking facility on 22 June 2017. The new facility will be drawn down on 9 August 2017. The key terms of the new facility are:
• Facility A – $175 million facility that can be drawn upon as required. This facility matures three years from August 2017.
• Facility B – $175 million facility that can be drawn upon as required. This facility matures four years from August 2017.
• The nominal rate for each facility consists of a floating cash rate plus a margin dependant on the amount of leverage.
• Lending covenants for both facilities include Interest Cover Ratio and Total Gearing Ratio.
• It is noted that the banking facility is unsecured.
The Group has financial guarantees to other persons of $11.6 million that could be called up at any time in the event of a breach of our financial obligations. We do not expect any payments will eventuate under these financial guarantees as we expect to meet our respective obligations to the beneficiaries of these guarantees. The financial guarantees are applied against the available draw down limit for Facility A as detailed above.
Recognition and MeasurementBorrowings are initially recognised at fair value of the consideration received, net of directly attributable costs.
After initial recognition, borrowings are measured at amortised cost, using the effective interest rate method. Amortised cost is calculated by taking into account any issue costs, and any discount or premium on issuance. Gains and losses are recognised in the statement of profit or loss and other comprehensive income if borrowings are derecognised. The fair value approximates carrying value as borrowings are fully variable.
Borrowings are presented net of capitalised loan establishment costs.
C2. Share Capital 2017
$ ‘0002016
$ ‘000
Issued and paid-up capital
Ordinary shares 401,673 401,093
Transaction costs directly transferred to equity (net of tax) (7,087) (7,087)
Tax effect on legacy share options 3,566 -
Settlement of share-based payments 1,750 1,682
399,902 395,688
2017 2016
Number '000 $ '000 Number '000 $ '000
(a) Ordinary shares
Opening balance 318,880 395,688 194,600 194,600
Ordinary shares issued 400 580 77,017 173,287
Conversion of redeemable preference shares to ordinary shares - - 45,000 45,090
Settlement of share based payment - 68 - 1,682
Disposal of share options - - - (11,884)
Issue of new shares on disposal of options - - 2,263 -
Transactions costs incurred in respect of initial public offering (net of tax) - - - (7,087)
Tax effect on legacy share options - 3,566 - -
At reporting date 319,280 399,902 318,880 395,688
(b) Redeemable preference shares
Opening balance - - 45,000 43,964
Redeemable preference shares liability converted to equity - - - 1,126
Conversion of redeemable preference shares to ordinary shares - - (45,000) (45,090)
At reporting date - - - -
Total share capital 319,280 399,902 318,880 395,688
Notes to the Consolidated Financial Statements continued
72 Costa Group Holdings Limited – Annual Report 2017
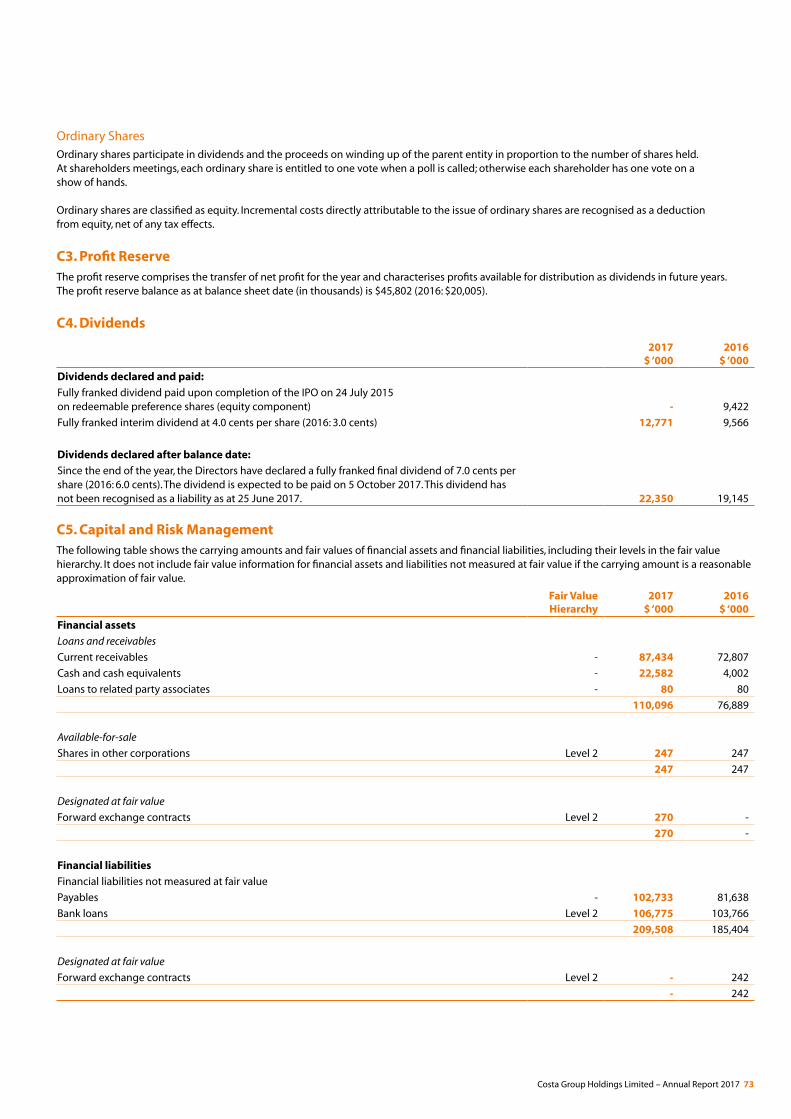
Ordinary Shares Ordinary shares participate in dividends and the proceeds on winding up of the parent entity in proportion to the number of shares held.At shareholders meetings, each ordinary share is entitled to one vote when a poll is called; otherwise each shareholder has one vote on a show of hands.
Ordinary shares are classified as equity. Incremental costs directly attributable to the issue of ordinary shares are recognised as a deduction from equity, net of any tax effects.
C3. Profit ReserveThe profit reserve comprises the transfer of net profit for the year and characterises profits available for distribution as dividends in future years. The profit reserve balance as at balance sheet date (in thousands) is $45,802 (2016: $20,005).
C4. Dividends
2017 $ ‘000
2016 $ ‘000
Dividends declared and paid:
Fully franked dividend paid upon completion of the IPO on 24 July 2015 on redeemable preference shares (equity component) - 9,422
Fully franked interim dividend at 4.0 cents per share (2016: 3.0 cents) 12,771 9,566
Dividends declared after balance date:
Since the end of the year, the Directors have declared a fully franked final dividend of 7.0 cents per share (2016: 6.0 cents). The dividend is expected to be paid on 5 October 2017. This dividend has not been recognised as a liability as at 25 June 2017. 22,350 19,145
C5. Capital and Risk ManagementThe following table shows the carrying amounts and fair values of financial assets and financial liabilities, including their levels in the fair value hierarchy. It does not include fair value information for financial assets and liabilities not measured at fair value if the carrying amount is a reasonable approximation of fair value.
Fair Value Hierarchy
2017 $ ‘000
2016 $ ‘000
Financial assets
Loans and receivables
Current receivables - 87,434 72,807
Cash and cash equivalents - 22,582 4,002
Loans to related party associates - 80 80
110,096 76,889
Available-for-sale
Shares in other corporations Level 2 247 247
247 247
Designated at fair value
Forward exchange contracts Level 2 270 -
270 -
Financial liabilities
Financial liabilities not measured at fair value
Payables - 102,733 81,638
Bank loans Level 2 106,775 103,766
209,508 185,404
Designated at fair value
Forward exchange contracts Level 2 - 242
- 242
Costa Group Holdings Limited – Annual Report 2017 73
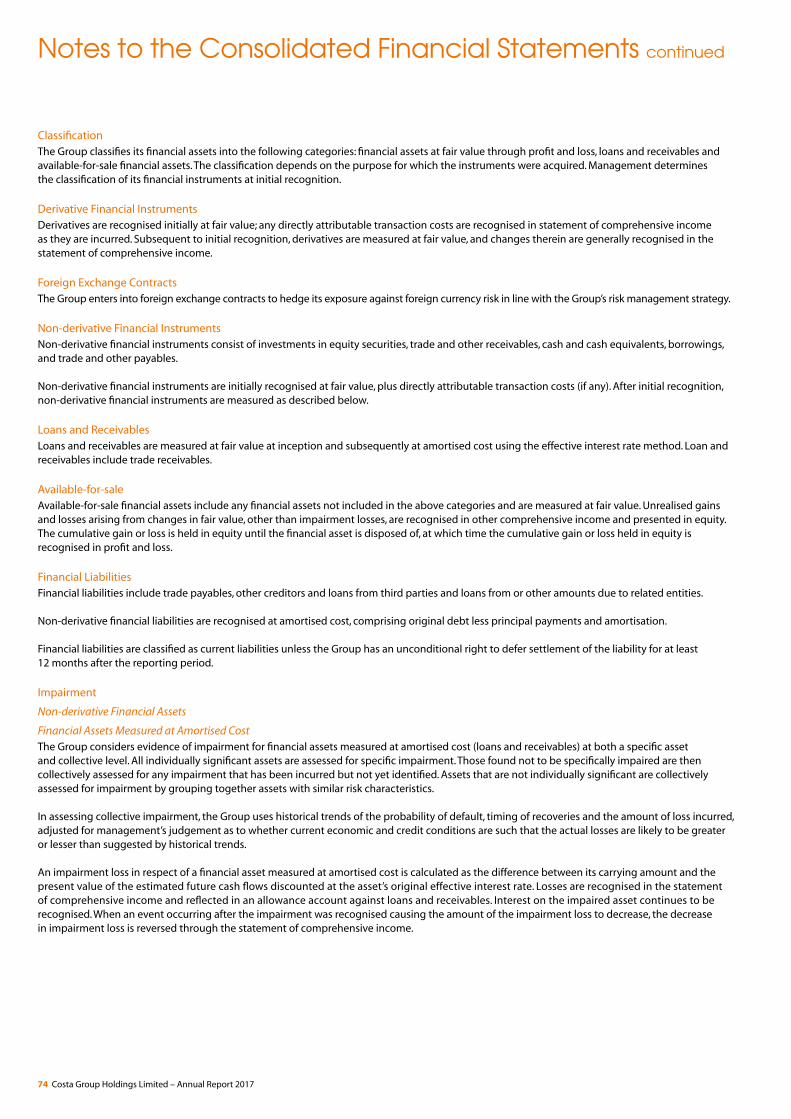
ClassificationThe Group classifies its financial assets into the following categories: financial assets at fair value through profit and loss, loans and receivables and available-for-sale financial assets. The classification depends on the purpose for which the instruments were acquired. Management determines the classification of its financial instruments at initial recognition.
Derivative Financial InstrumentsDerivatives are recognised initially at fair value; any directly attributable transaction costs are recognised in statement of comprehensive income as they are incurred. Subsequent to initial recognition, derivatives are measured at fair value, and changes therein are generally recognised in the statement of comprehensive income.
Foreign Exchange ContractsThe Group enters into foreign exchange contracts to hedge its exposure against foreign currency risk in line with the Group’s risk management strategy.
Non-derivative Financial InstrumentsNon-derivative financial instruments consist of investments in equity securities, trade and other receivables, cash and cash equivalents, borrowings, and trade and other payables.
Non-derivative financial instruments are initially recognised at fair value, plus directly attributable transaction costs (if any). After initial recognition, non-derivative financial instruments are measured as described below.
Loans and ReceivablesLoans and receivables are measured at fair value at inception and subsequently at amortised cost using the effective interest rate method. Loan and receivables include trade receivables.
Available-for-saleAvailable-for-sale financial assets include any financial assets not included in the above categories and are measured at fair value. Unrealised gains and losses arising from changes in fair value, other than impairment losses, are recognised in other comprehensive income and presented in equity. The cumulative gain or loss is held in equity until the financial asset is disposed of, at which time the cumulative gain or loss held in equity is recognised in profit and loss.
Financial LiabilitiesFinancial liabilities include trade payables, other creditors and loans from third parties and loans from or other amounts due to related entities.
Non-derivative financial liabilities are recognised at amortised cost, comprising original debt less principal payments and amortisation.
Financial liabilities are classified as current liabilities unless the Group has an unconditional right to defer settlement of the liability for at least 12 months after the reporting period.
Impairment
Non-derivative Financial Assets
Financial Assets Measured at Amortised CostThe Group considers evidence of impairment for financial assets measured at amortised cost (loans and receivables) at both a specific asset and collective level. All individually significant assets are assessed for specific impairment. Those found not to be specifically impaired are then collectively assessed for any impairment that has been incurred but not yet identified. Assets that are not individually significant are collectively assessed for impairment by grouping together assets with similar risk characteristics.
In assessing collective impairment, the Group uses historical trends of the probability of default, timing of recoveries and the amount of loss incurred, adjusted for management’s judgement as to whether current economic and credit conditions are such that the actual losses are likely to be greater or lesser than suggested by historical trends.
An impairment loss in respect of a financial asset measured at amortised cost is calculated as the difference between its carrying amount and the present value of the estimated future cash flows discounted at the asset’s original effective interest rate. Losses are recognised in the statement of comprehensive income and reflected in an allowance account against loans and receivables. Interest on the impaired asset continues to be recognised. When an event occurring after the impairment was recognised causing the amount of the impairment loss to decrease, the decrease in impairment loss is reversed through the statement of comprehensive income.
Notes to the Consolidated Financial Statements continued
74 Costa Group Holdings Limited – Annual Report 2017
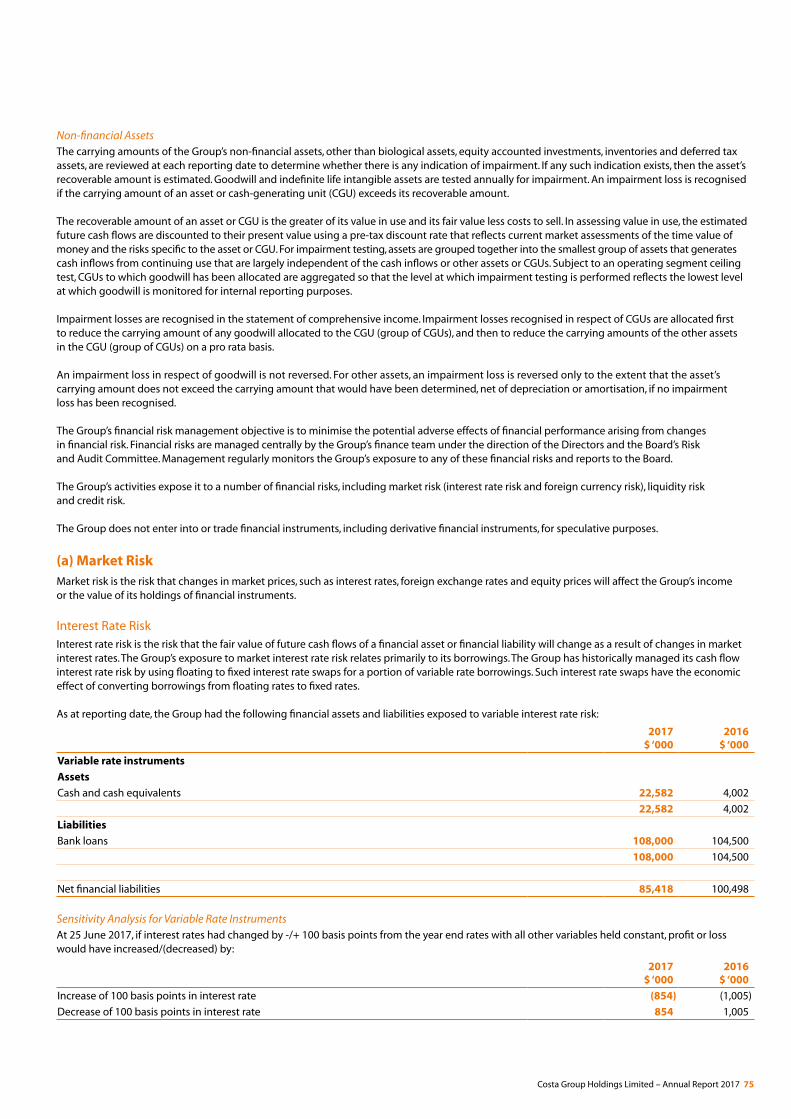
Non-financial AssetsThe carrying amounts of the Group’s non-financial assets, other than biological assets, equity accounted investments, inventories and deferred tax assets, are reviewed at each reporting date to determine whether there is any indication of impairment. If any such indication exists, then the asset’s recoverable amount is estimated. Goodwill and indefinite life intangible assets are tested annually for impairment. An impairment loss is recognised if the carrying amount of an asset or cash-generating unit (CGU) exceeds its recoverable amount.
The recoverable amount of an asset or CGU is the greater of its value in use and its fair value less costs to sell. In assessing value in use, the estimated future cash flows are discounted to their present value using a pre-tax discount rate that reflects current market assessments of the time value of money and the risks specific to the asset or CGU. For impairment testing, assets are grouped together into the smallest group of assets that generates cash inflows from continuing use that are largely independent of the cash inflows or other assets or CGUs. Subject to an operating segment ceiling test, CGUs to which goodwill has been allocated are aggregated so that the level at which impairment testing is performed reflects the lowest level at which goodwill is monitored for internal reporting purposes.
Impairment losses are recognised in the statement of comprehensive income. Impairment losses recognised in respect of CGUs are allocated first to reduce the carrying amount of any goodwill allocated to the CGU (group of CGUs), and then to reduce the carrying amounts of the other assets in the CGU (group of CGUs) on a pro rata basis.
An impairment loss in respect of goodwill is not reversed. For other assets, an impairment loss is reversed only to the extent that the asset’s carrying amount does not exceed the carrying amount that would have been determined, net of depreciation or amortisation, if no impairment loss has been recognised.
The Group’s financial risk management objective is to minimise the potential adverse effects of financial performance arising from changes in financial risk. Financial risks are managed centrally by the Group’s finance team under the direction of the Directors and the Board’s Risk and Audit Committee. Management regularly monitors the Group’s exposure to any of these financial risks and reports to the Board.
The Group’s activities expose it to a number of financial risks, including market risk (interest rate risk and foreign currency risk), liquidity risk and credit risk.
The Group does not enter into or trade financial instruments, including derivative financial instruments, for speculative purposes.
(a) Market RiskMarket risk is the risk that changes in market prices, such as interest rates, foreign exchange rates and equity prices will affect the Group’s income or the value of its holdings of financial instruments.
Interest Rate RiskInterest rate risk is the risk that the fair value of future cash flows of a financial asset or financial liability will change as a result of changes in market interest rates. The Group’s exposure to market interest rate risk relates primarily to its borrowings. The Group has historically managed its cash flow interest rate risk by using floating to fixed interest rate swaps for a portion of variable rate borrowings. Such interest rate swaps have the economic effect of converting borrowings from floating rates to fixed rates.
As at reporting date, the Group had the following financial assets and liabilities exposed to variable interest rate risk:
2017 $ ‘000
2016 $ ‘000
Variable rate instruments
Assets
Cash and cash equivalents 22,582 4,002
22,582 4,002
Liabilities
Bank loans 108,000 104,500
108,000 104,500
Net financial liabilities 85,418 100,498
Sensitivity Analysis for Variable Rate InstrumentsAt 25 June 2017, if interest rates had changed by -/+ 100 basis points from the year end rates with all other variables held constant, profit or loss would have increased/(decreased) by:
2017 $ ‘000
2016 $ ‘000
Increase of 100 basis points in interest rate (854) (1,005)
Decrease of 100 basis points in interest rate 854 1,005
Costa Group Holdings Limited – Annual Report 2017 75
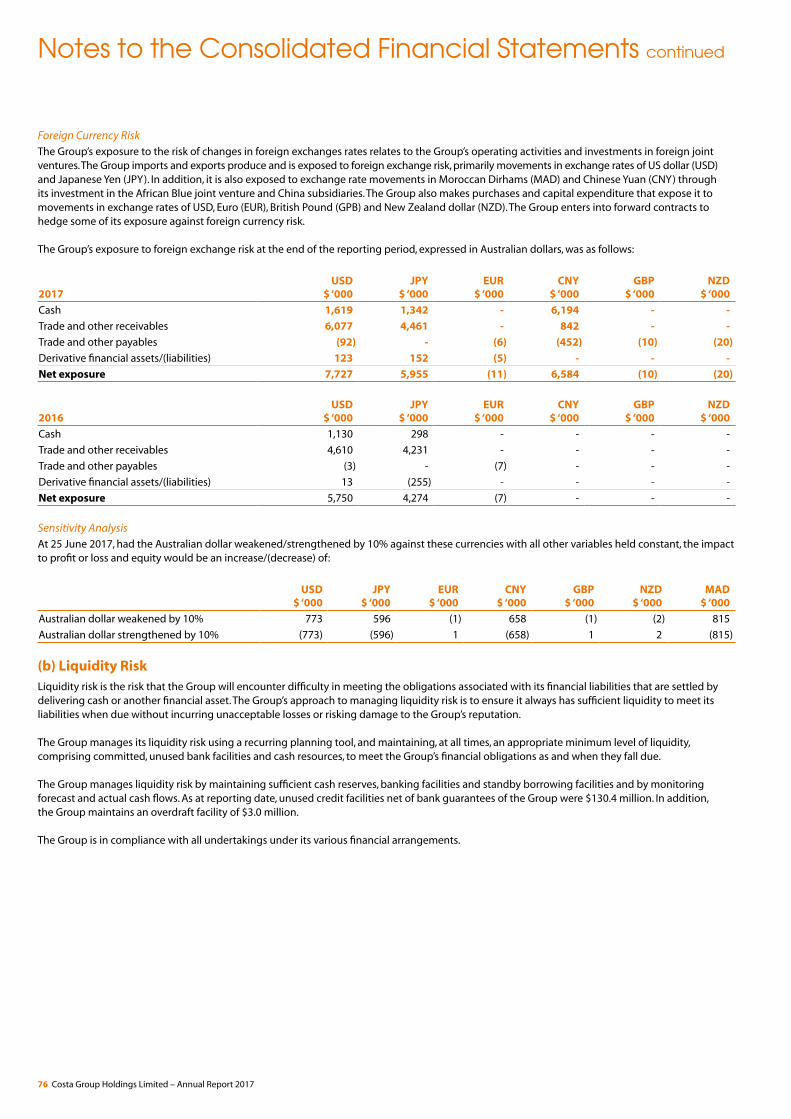
Foreign Currency RiskThe Group’s exposure to the risk of changes in foreign exchanges rates relates to the Group’s operating activities and investments in foreign joint ventures. The Group imports and exports produce and is exposed to foreign exchange risk, primarily movements in exchange rates of US dollar (USD) and Japanese Yen (JPY). In addition, it is also exposed to exchange rate movements in Moroccan Dirhams (MAD) and Chinese Yuan (CNY) through its investment in the African Blue joint venture and China subsidiaries. The Group also makes purchases and capital expenditure that expose it to movements in exchange rates of USD, Euro (EUR), British Pound (GPB) and New Zealand dollar (NZD). The Group enters into forward contracts to hedge some of its exposure against foreign currency risk.
The Group’s exposure to foreign exchange risk at the end of the reporting period, expressed in Australian dollars, was as follows:
2017USD
$ ‘000JPY
$ ‘000EUR
$ ‘000CNY
$ ‘000GBP
$ ‘000NZD
$ ‘000
Cash 1,619 1,342 - 6,194 - -
Trade and other receivables 6,077 4,461 - 842 - -
Trade and other payables (92) - (6) (452) (10) (20)
Derivative financial assets/(liabilities) 123 152 (5) - - -
Net exposure 7,727 5,955 (11) 6,584 (10) (20)
2016USD
$ ‘000JPY
$ ‘000EUR
$ ‘000CNY
$ ‘000GBP
$ ‘000NZD
$ ‘000
Cash 1,130 298 - - - -
Trade and other receivables 4,610 4,231 - - - -
Trade and other payables (3) - (7) - - -
Derivative financial assets/(liabilities) 13 (255) - - - -
Net exposure 5,750 4,274 (7) - - -
Sensitivity Analysis At 25 June 2017, had the Australian dollar weakened/strengthened by 10% against these currencies with all other variables held constant, the impact to profit or loss and equity would be an increase/(decrease) of:
USD $ ‘000
JPY $ ‘000
EUR $ ‘000
CNY $ ‘000
GBP $ ‘000
NZD $ ‘000
MAD$ ‘000
Australian dollar weakened by 10% 773 596 (1) 658 (1) (2) 815
Australian dollar strengthened by 10% (773) (596) 1 (658) 1 2 (815)
(b) Liquidity RiskLiquidity risk is the risk that the Group will encounter difficulty in meeting the obligations associated with its financial liabilities that are settled by delivering cash or another financial asset. The Group’s approach to managing liquidity risk is to ensure it always has sufficient liquidity to meet its liabilities when due without incurring unacceptable losses or risking damage to the Group’s reputation.
The Group manages its liquidity risk using a recurring planning tool, and maintaining, at all times, an appropriate minimum level of liquidity, comprising committed, unused bank facilities and cash resources, to meet the Group’s financial obligations as and when they fall due.
The Group manages liquidity risk by maintaining sufficient cash reserves, banking facilities and standby borrowing facilities and by monitoring forecast and actual cash flows. As at reporting date, unused credit facilities net of bank guarantees of the Group were $130.4 million. In addition, the Group maintains an overdraft facility of $3.0 million.
The Group is in compliance with all undertakings under its various financial arrangements.
Notes to the Consolidated Financial Statements continued
76 Costa Group Holdings Limited – Annual Report 2017
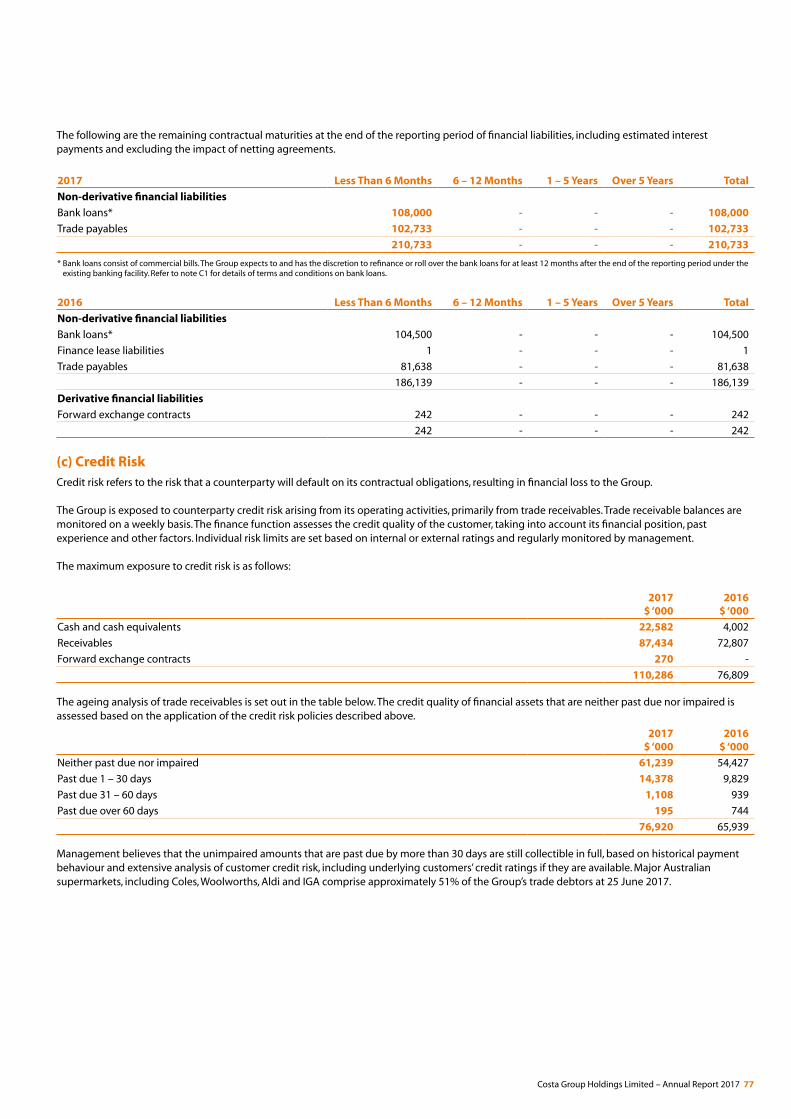
The following are the remaining contractual maturities at the end of the reporting period of financial liabilities, including estimated interest payments and excluding the impact of netting agreements.
2017 Less Than 6 Months 6 – 12 Months 1 – 5 Years Over 5 Years Total
Non-derivative financial liabilities
Bank loans* 108,000 - - - 108,000
Trade payables 102,733 - - - 102,733
210,733 - - - 210,733
* Bank loans consist of commercial bills. The Group expects to and has the discretion to refinance or roll over the bank loans for at least 12 months after the end of the reporting period under the existing banking facility. Refer to note C1 for details of terms and conditions on bank loans.
2016 Less Than 6 Months 6 – 12 Months 1 – 5 Years Over 5 Years Total
Non-derivative financial liabilities
Bank loans* 104,500 - - - 104,500
Finance lease liabilities 1 - - - 1
Trade payables 81,638 - - - 81,638
186,139 - - - 186,139
Derivative financial liabilities
Forward exchange contracts 242 - - - 242
242 - - - 242
(c) Credit RiskCredit risk refers to the risk that a counterparty will default on its contractual obligations, resulting in financial loss to the Group.
The Group is exposed to counterparty credit risk arising from its operating activities, primarily from trade receivables. Trade receivable balances are monitored on a weekly basis. The finance function assesses the credit quality of the customer, taking into account its financial position, past experience and other factors. Individual risk limits are set based on internal or external ratings and regularly monitored by management.
The maximum exposure to credit risk is as follows:
2017 $ ‘000
2016 $ ‘000
Cash and cash equivalents 22,582 4,002
Receivables 87,434 72,807
Forward exchange contracts 270 -
110,286 76,809
The ageing analysis of trade receivables is set out in the table below. The credit quality of financial assets that are neither past due nor impaired is assessed based on the application of the credit risk policies described above.
2017 $ ‘000
2016 $ ‘000
Neither past due nor impaired 61,239 54,427
Past due 1 – 30 days 14,378 9,829
Past due 31 – 60 days 1,108 939
Past due over 60 days 195 744
76,920 65,939
Management believes that the unimpaired amounts that are past due by more than 30 days are still collectible in full, based on historical payment behaviour and extensive analysis of customer credit risk, including underlying customers’ credit ratings if they are available. Major Australian supermarkets, including Coles, Woolworths, Aldi and IGA comprise approximately 51% of the Group’s trade debtors at 25 June 2017.
Costa Group Holdings Limited – Annual Report 2017 77
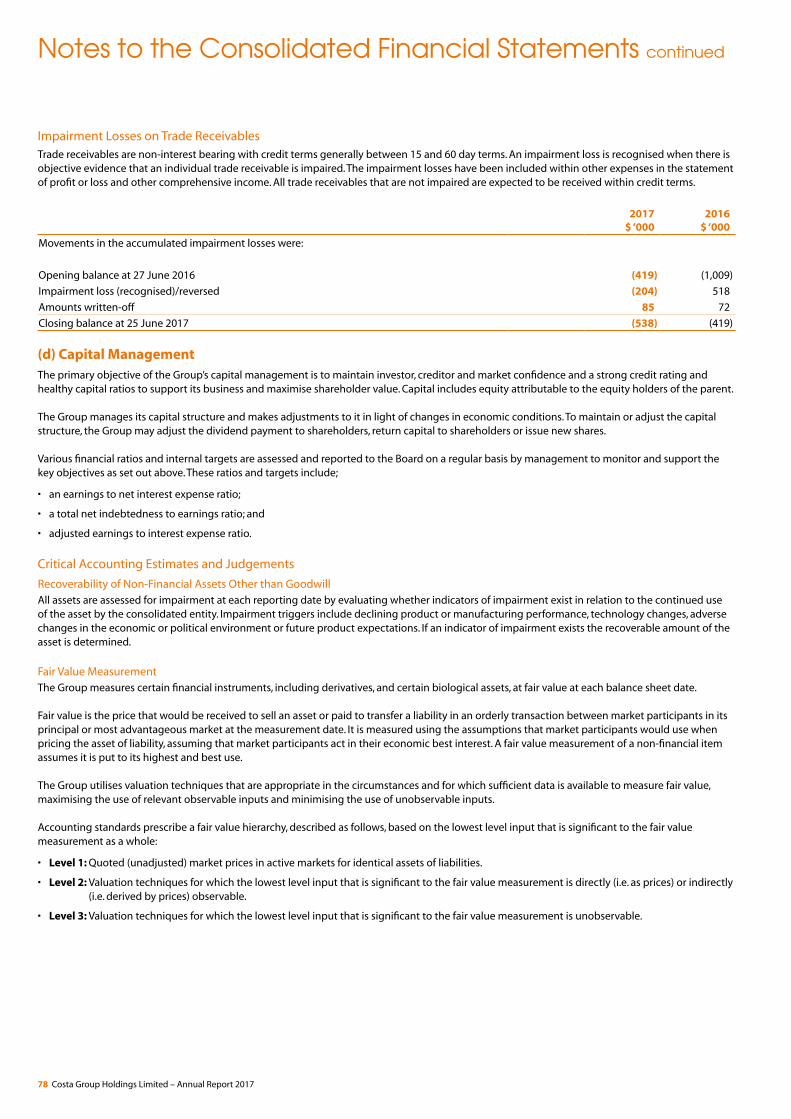
Impairment Losses on Trade ReceivablesTrade receivables are non-interest bearing with credit terms generally between 15 and 60 day terms. An impairment loss is recognised when there is objective evidence that an individual trade receivable is impaired. The impairment losses have been included within other expenses in the statement of profit or loss and other comprehensive income. All trade receivables that are not impaired are expected to be received within credit terms.
2017 $ ‘000
2016 $ ‘000
Movements in the accumulated impairment losses were:
Opening balance at 27 June 2016 (419) (1,009)
Impairment loss (recognised)/reversed (204) 518
Amounts written-off 85 72
Closing balance at 25 June 2017 (538) (419)
(d) Capital ManagementThe primary objective of the Group’s capital management is to maintain investor, creditor and market confidence and a strong credit rating and healthy capital ratios to support its business and maximise shareholder value. Capital includes equity attributable to the equity holders of the parent.
The Group manages its capital structure and makes adjustments to it in light of changes in economic conditions. To maintain or adjust the capital structure, the Group may adjust the dividend payment to shareholders, return capital to shareholders or issue new shares.
Various financial ratios and internal targets are assessed and reported to the Board on a regular basis by management to monitor and support the key objectives as set out above. These ratios and targets include;
• an earnings to net interest expense ratio;
• a total net indebtedness to earnings ratio; and
• adjusted earnings to interest expense ratio.
Critical Accounting Estimates and Judgements
Recoverability of Non-Financial Assets Other than GoodwillAll assets are assessed for impairment at each reporting date by evaluating whether indicators of impairment exist in relation to the continued use of the asset by the consolidated entity. Impairment triggers include declining product or manufacturing performance, technology changes, adverse changes in the economic or political environment or future product expectations. If an indicator of impairment exists the recoverable amount of the asset is determined.
Fair Value MeasurementThe Group measures certain financial instruments, including derivatives, and certain biological assets, at fair value at each balance sheet date.
Fair value is the price that would be received to sell an asset or paid to transfer a liability in an orderly transaction between market participants in its principal or most advantageous market at the measurement date. It is measured using the assumptions that market participants would use when pricing the asset of liability, assuming that market participants act in their economic best interest. A fair value measurement of a non-financial item assumes it is put to its highest and best use.
The Group utilises valuation techniques that are appropriate in the circumstances and for which sufficient data is available to measure fair value, maximising the use of relevant observable inputs and minimising the use of unobservable inputs.
Accounting standards prescribe a fair value hierarchy, described as follows, based on the lowest level input that is significant to the fair value measurement as a whole:
• Level 1: Quoted (unadjusted) market prices in active markets for identical assets of liabilities.
• Level 2: Valuation techniques for which the lowest level input that is significant to the fair value measurement is directly (i.e. as prices) or indirectly (i.e. derived by prices) observable.
• Level 3: Valuation techniques for which the lowest level input that is significant to the fair value measurement is unobservable.
Notes to the Consolidated Financial Statements continued
78 Costa Group Holdings Limited – Annual Report 2017
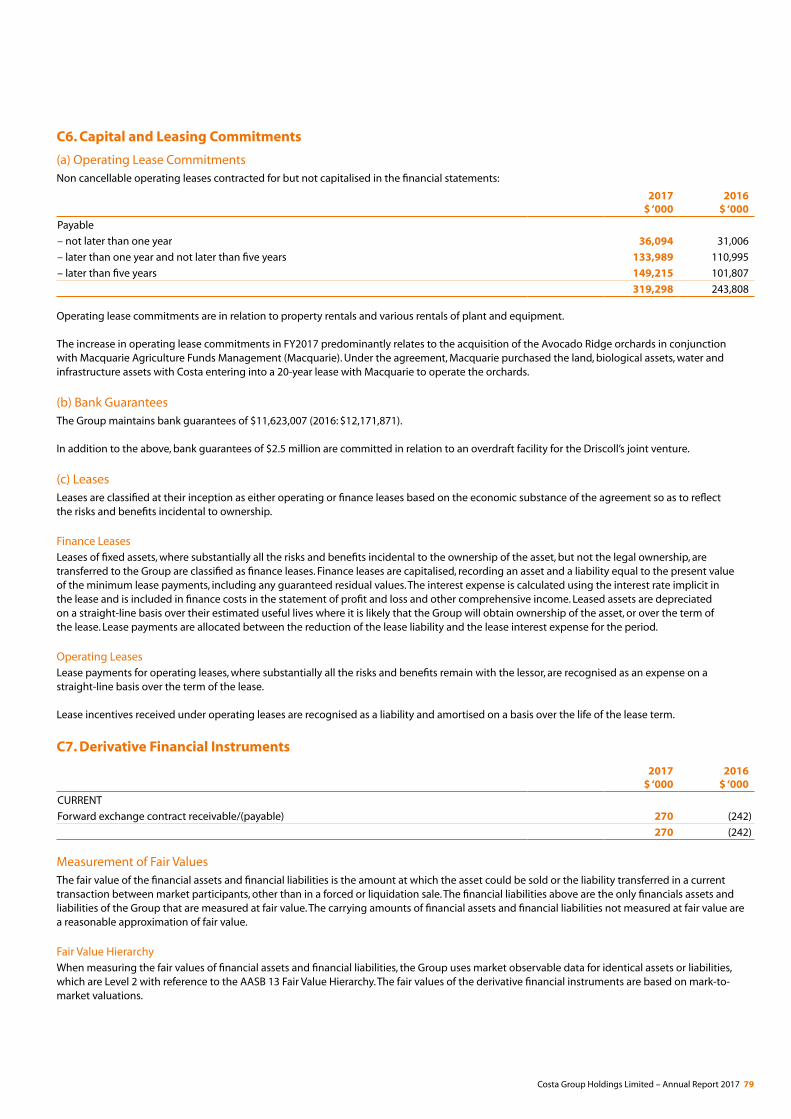
C6. Capital and Leasing Commitments
(a) Operating Lease CommitmentsNon cancellable operating leases contracted for but not capitalised in the financial statements:
2017 $ ‘000
2016 $ ‘000
Payable
– not later than one year 36,094 31,006
– later than one year and not later than five years 133,989 110,995
– later than five years 149,215 101,807
319,298 243,808
Operating lease commitments are in relation to property rentals and various rentals of plant and equipment.
The increase in operating lease commitments in FY2017 predominantly relates to the acquisition of the Avocado Ridge orchards in conjunction with Macquarie Agriculture Funds Management (Macquarie). Under the agreement, Macquarie purchased the land, biological assets, water and infrastructure assets with Costa entering into a 20-year lease with Macquarie to operate the orchards.
(b) Bank GuaranteesThe Group maintains bank guarantees of $11,623,007 (2016: $12,171,871).
In addition to the above, bank guarantees of $2.5 million are committed in relation to an overdraft facility for the Driscoll’s joint venture.
(c) LeasesLeases are classified at their inception as either operating or finance leases based on the economic substance of the agreement so as to reflect the risks and benefits incidental to ownership.
Finance LeasesLeases of fixed assets, where substantially all the risks and benefits incidental to the ownership of the asset, but not the legal ownership, are transferred to the Group are classified as finance leases. Finance leases are capitalised, recording an asset and a liability equal to the present value of the minimum lease payments, including any guaranteed residual values. The interest expense is calculated using the interest rate implicit in the lease and is included in finance costs in the statement of profit and loss and other comprehensive income. Leased assets are depreciated on a straight-line basis over their estimated useful lives where it is likely that the Group will obtain ownership of the asset, or over the term of the lease. Lease payments are allocated between the reduction of the lease liability and the lease interest expense for the period.
Operating LeasesLease payments for operating leases, where substantially all the risks and benefits remain with the lessor, are recognised as an expense on a straight-line basis over the term of the lease.
Lease incentives received under operating leases are recognised as a liability and amortised on a basis over the life of the lease term.
C7. Derivative Financial Instruments
2017 $ ‘000
2016 $ ‘000
CURRENT
Forward exchange contract receivable/(payable) 270 (242)
270 (242)
Measurement of Fair ValuesThe fair value of the financial assets and financial liabilities is the amount at which the asset could be sold or the liability transferred in a current transaction between market participants, other than in a forced or liquidation sale. The financial liabilities above are the only financials assets and liabilities of the Group that are measured at fair value. The carrying amounts of financial assets and financial liabilities not measured at fair value are a reasonable approximation of fair value.
Fair Value HierarchyWhen measuring the fair values of financial assets and financial liabilities, the Group uses market observable data for identical assets or liabilities, which are Level 2 with reference to the AASB 13 Fair Value Hierarchy. The fair values of the derivative financial instruments are based on mark-to-market valuations.
Costa Group Holdings Limited – Annual Report 2017 79
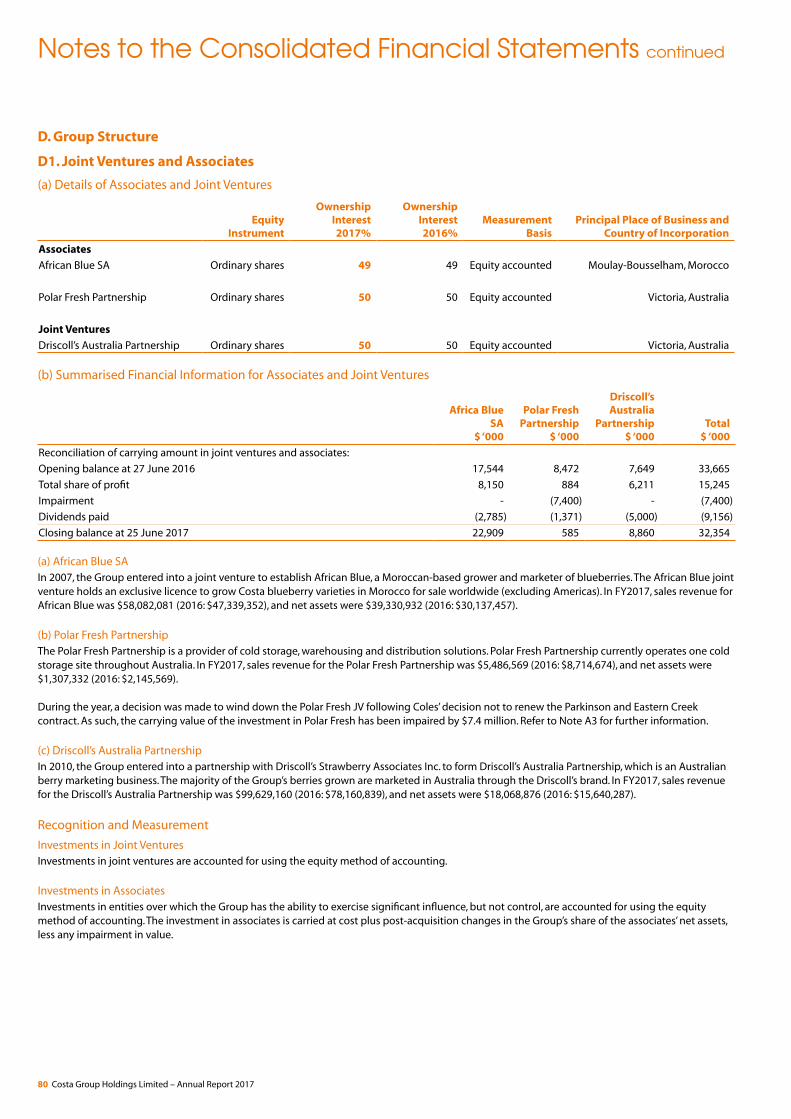
D. Group Structure
D1. Joint Ventures and Associates
(a) Details of Associates and Joint Ventures
Equity Instrument
Ownership Interest2017%
Ownership Interest2016%
Measurement Basis
Principal Place of Business and Country of Incorporation
Associates
African Blue SA Ordinary shares 49 49 Equity accounted Moulay-Bousselham, Morocco
Polar Fresh Partnership Ordinary shares 50 50 Equity accounted Victoria, Australia
Joint Ventures
Driscoll’s Australia Partnership Ordinary shares 50 50 Equity accounted Victoria, Australia
(b) Summarised Financial Information for Associates and Joint Ventures
Africa Blue SA
$ ‘000
Polar Fresh Partnership
$ ‘000
Driscoll’s Australia
Partnership $ ‘000
Total $ ‘000
Reconciliation of carrying amount in joint ventures and associates:
Opening balance at 27 June 2016 17,544 8,472 7,649 33,665
Total share of profit 8,150 884 6,211 15,245
Impairment - (7,400) - (7,400)
Dividends paid (2,785) (1,371) (5,000) (9,156)
Closing balance at 25 June 2017 22,909 585 8,860 32,354
(a) African Blue SAIn 2007, the Group entered into a joint venture to establish African Blue, a Moroccan-based grower and marketer of blueberries. The African Blue joint venture holds an exclusive licence to grow Costa blueberry varieties in Morocco for sale worldwide (excluding Americas). In FY2017, sales revenue for African Blue was $58,082,081 (2016: $47,339,352), and net assets were $39,330,932 (2016: $30,137,457).
(b) Polar Fresh PartnershipThe Polar Fresh Partnership is a provider of cold storage, warehousing and distribution solutions. Polar Fresh Partnership currently operates one cold storage site throughout Australia. In FY2017, sales revenue for the Polar Fresh Partnership was $5,486,569 (2016: $8,714,674), and net assets were $1,307,332 (2016: $2,145,569).
During the year, a decision was made to wind down the Polar Fresh JV following Coles’ decision not to renew the Parkinson and Eastern Creek contract. As such, the carrying value of the investment in Polar Fresh has been impaired by $7.4 million. Refer to Note A3 for further information.
(c) Driscoll’s Australia Partnership In 2010, the Group entered into a partnership with Driscoll’s Strawberry Associates Inc. to form Driscoll’s Australia Partnership, which is an Australian berry marketing business. The majority of the Group’s berries grown are marketed in Australia through the Driscoll’s brand. In FY2017, sales revenue for the Driscoll’s Australia Partnership was $99,629,160 (2016: $78,160,839), and net assets were $18,068,876 (2016: $15,640,287).
Recognition and Measurement
Investments in Joint VenturesInvestments in joint ventures are accounted for using the equity method of accounting.
Investments in AssociatesInvestments in entities over which the Group has the ability to exercise significant influence, but not control, are accounted for using the equity method of accounting. The investment in associates is carried at cost plus post-acquisition changes in the Group’s share of the associates’ net assets, less any impairment in value.
Notes to the Consolidated Financial Statements continued
80 Costa Group Holdings Limited – Annual Report 2017
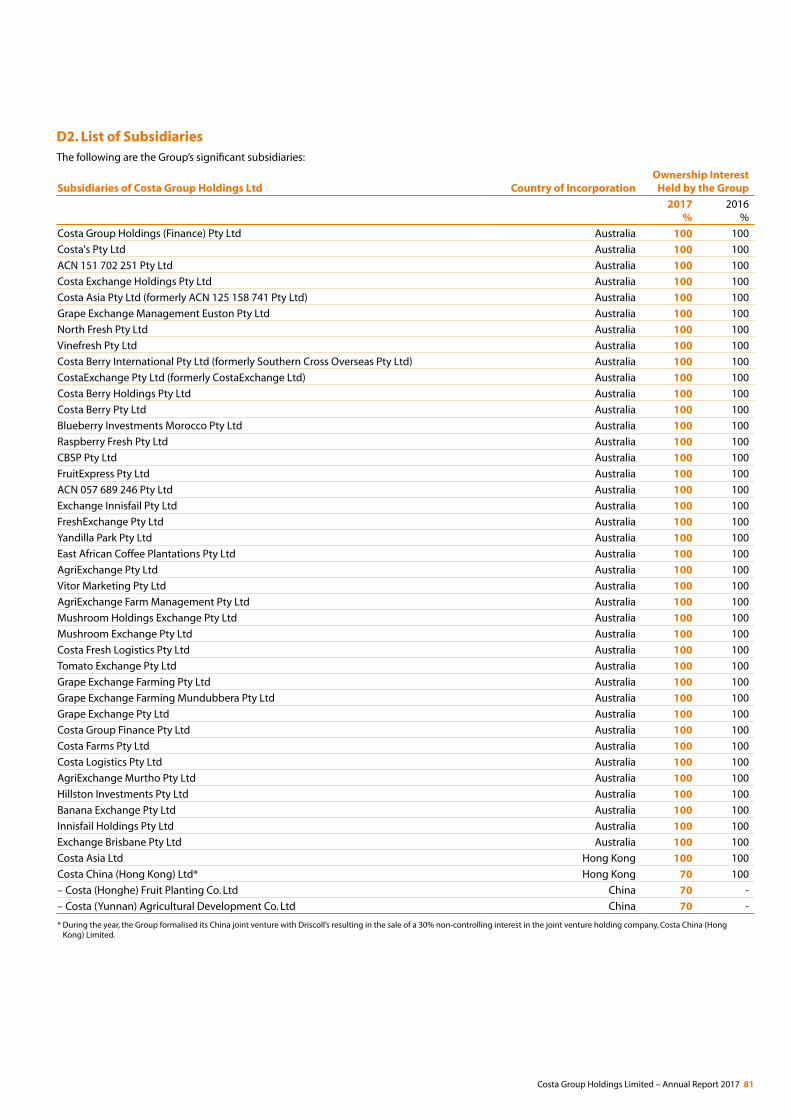
D2. List of SubsidiariesThe following are the Group’s significant subsidiaries:
Subsidiaries of Costa Group Holdings Ltd Country of IncorporationOwnership Interest
Held by the Group
2017 %
2016 %
Costa Group Holdings (Finance) Pty Ltd Australia 100 100
Costa's Pty Ltd Australia 100 100
ACN 151 702 251 Pty Ltd Australia 100 100
Costa Exchange Holdings Pty Ltd Australia 100 100
Costa Asia Pty Ltd (formerly ACN 125 158 741 Pty Ltd) Australia 100 100
Grape Exchange Management Euston Pty Ltd Australia 100 100
North Fresh Pty Ltd Australia 100 100
Vinefresh Pty Ltd Australia 100 100
Costa Berry International Pty Ltd (formerly Southern Cross Overseas Pty Ltd) Australia 100 100
CostaExchange Pty Ltd (formerly CostaExchange Ltd) Australia 100 100
Costa Berry Holdings Pty Ltd Australia 100 100
Costa Berry Pty Ltd Australia 100 100
Blueberry Investments Morocco Pty Ltd Australia 100 100
Raspberry Fresh Pty Ltd Australia 100 100
CBSP Pty Ltd Australia 100 100
FruitExpress Pty Ltd Australia 100 100
ACN 057 689 246 Pty Ltd Australia 100 100
Exchange Innisfail Pty Ltd Australia 100 100
FreshExchange Pty Ltd Australia 100 100
Yandilla Park Pty Ltd Australia 100 100
East African Coffee Plantations Pty Ltd Australia 100 100
AgriExchange Pty Ltd Australia 100 100
Vitor Marketing Pty Ltd Australia 100 100
AgriExchange Farm Management Pty Ltd Australia 100 100
Mushroom Holdings Exchange Pty Ltd Australia 100 100
Mushroom Exchange Pty Ltd Australia 100 100
Costa Fresh Logistics Pty Ltd Australia 100 100
Tomato Exchange Pty Ltd Australia 100 100
Grape Exchange Farming Pty Ltd Australia 100 100
Grape Exchange Farming Mundubbera Pty Ltd Australia 100 100
Grape Exchange Pty Ltd Australia 100 100
Costa Group Finance Pty Ltd Australia 100 100
Costa Farms Pty Ltd Australia 100 100
Costa Logistics Pty Ltd Australia 100 100
AgriExchange Murtho Pty Ltd Australia 100 100
Hillston Investments Pty Ltd Australia 100 100
Banana Exchange Pty Ltd Australia 100 100
Innisfail Holdings Pty Ltd Australia 100 100
Exchange Brisbane Pty Ltd Australia 100 100
Costa Asia Ltd Hong Kong 100 100
Costa China (Hong Kong) Ltd* Hong Kong 70 100
– Costa (Honghe) Fruit Planting Co. Ltd China 70 -
– Costa (Yunnan) Agricultural Development Co. Ltd China 70 -
* During the year, the Group formalised its China joint venture with Driscoll’s resulting in the sale of a 30% non-controlling interest in the joint venture holding company, Costa China (Hong Kong) Limited.
Costa Group Holdings Limited – Annual Report 2017 81
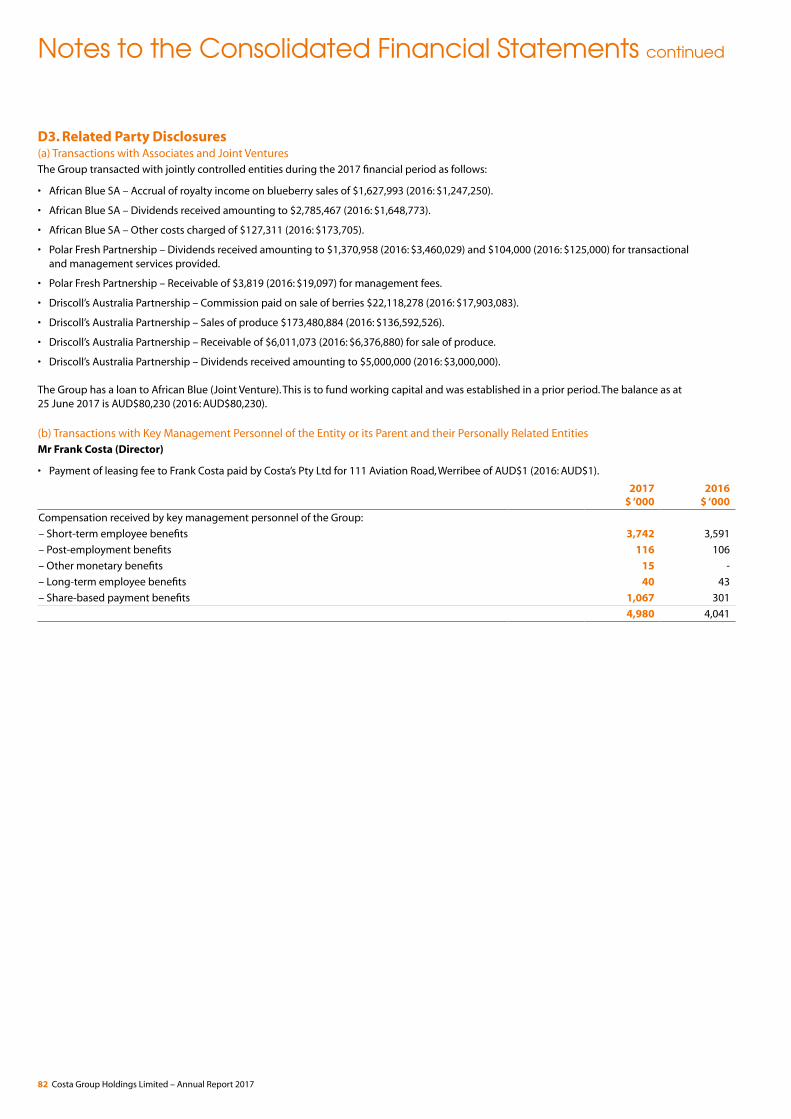
D3. Related Party Disclosures(a) Transactions with Associates and Joint VenturesThe Group transacted with jointly controlled entities during the 2017 financial period as follows:
• African Blue SA – Accrual of royalty income on blueberry sales of $1,627,993 (2016: $1,247,250).
• African Blue SA – Dividends received amounting to $2,785,467 (2016: $1,648,773).
• African Blue SA – Other costs charged of $127,311 (2016: $173,705).
• Polar Fresh Partnership – Dividends received amounting to $1,370,958 (2016: $3,460,029) and $104,000 (2016: $125,000) for transactional and management services provided.
• Polar Fresh Partnership – Receivable of $3,819 (2016: $19,097) for management fees.
• Driscoll’s Australia Partnership – Commission paid on sale of berries $22,118,278 (2016: $17,903,083).
• Driscoll’s Australia Partnership – Sales of produce $173,480,884 (2016: $136,592,526).
• Driscoll’s Australia Partnership – Receivable of $6,011,073 (2016: $6,376,880) for sale of produce.
• Driscoll’s Australia Partnership – Dividends received amounting to $5,000,000 (2016: $3,000,000).
The Group has a loan to African Blue (Joint Venture). This is to fund working capital and was established in a prior period. The balance as at 25 June 2017 is AUD$80,230 (2016: AUD$80,230).
(b) Transactions with Key Management Personnel of the Entity or its Parent and their Personally Related EntitiesMr Frank Costa (Director)
• Payment of leasing fee to Frank Costa paid by Costa’s Pty Ltd for 111 Aviation Road, Werribee of AUD$1 (2016: AUD$1).
2017 $ ‘000
2016 $ ‘000
Compensation received by key management personnel of the Group:
– Short-term employee benefits 3,742 3,591
– Post-employment benefits 116 106
– Other monetary benefits 15 -
– Long-term employee benefits 40 43
– Share-based payment benefits 1,067 301
4,980 4,041
Notes to the Consolidated Financial Statements continued
82 Costa Group Holdings Limited – Annual Report 2017
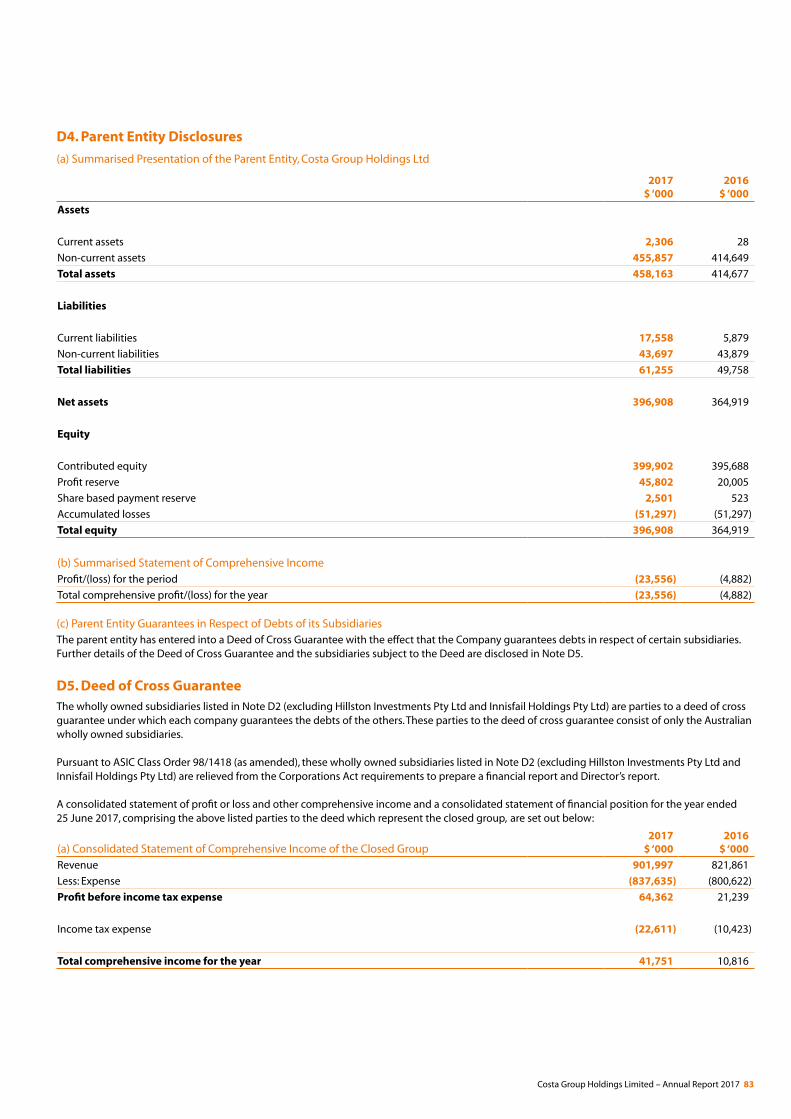
D4. Parent Entity Disclosures
(a) Summarised Presentation of the Parent Entity, Costa Group Holdings Ltd
2017 $ ‘000
2016 $ ‘000
Assets
Current assets 2,306 28
Non-current assets 455,857 414,649
Total assets 458,163 414,677
Liabilities
Current liabilities 17,558 5,879
Non-current liabilities 43,697 43,879
Total liabilities 61,255 49,758
Net assets 396,908 364,919
Equity
Contributed equity 399,902 395,688
Profit reserve 45,802 20,005
Share based payment reserve 2,501 523
Accumulated losses (51,297) (51,297)
Total equity 396,908 364,919
(b) Summarised Statement of Comprehensive IncomeProfit/(loss) for the period (23,556) (4,882)
Total comprehensive profit/(loss) for the year (23,556) (4,882)
(c) Parent Entity Guarantees in Respect of Debts of its SubsidiariesThe parent entity has entered into a Deed of Cross Guarantee with the effect that the Company guarantees debts in respect of certain subsidiaries. Further details of the Deed of Cross Guarantee and the subsidiaries subject to the Deed are disclosed in Note D5.
D5. Deed of Cross GuaranteeThe wholly owned subsidiaries listed in Note D2 (excluding Hillston Investments Pty Ltd and Innisfail Holdings Pty Ltd) are parties to a deed of cross guarantee under which each company guarantees the debts of the others. These parties to the deed of cross guarantee consist of only the Australian wholly owned subsidiaries.
Pursuant to ASIC Class Order 98/1418 (as amended), these wholly owned subsidiaries listed in Note D2 (excluding Hillston Investments Pty Ltd and Innisfail Holdings Pty Ltd) are relieved from the Corporations Act requirements to prepare a financial report and Director’s report.
A consolidated statement of profit or loss and other comprehensive income and a consolidated statement of financial position for the year ended 25 June 2017, comprising the above listed parties to the deed which represent the closed group, are set out below:
(a) Consolidated Statement of Comprehensive Income of the Closed Group2017
$ ‘0002016
$ ‘000
Revenue 901,997 821,861
Less: Expense (837,635) (800,622)
Profit before income tax expense 64,362 21,239
Income tax expense (22,611) (10,423)
Total comprehensive income for the year 41,751 10,816
Costa Group Holdings Limited – Annual Report 2017 83
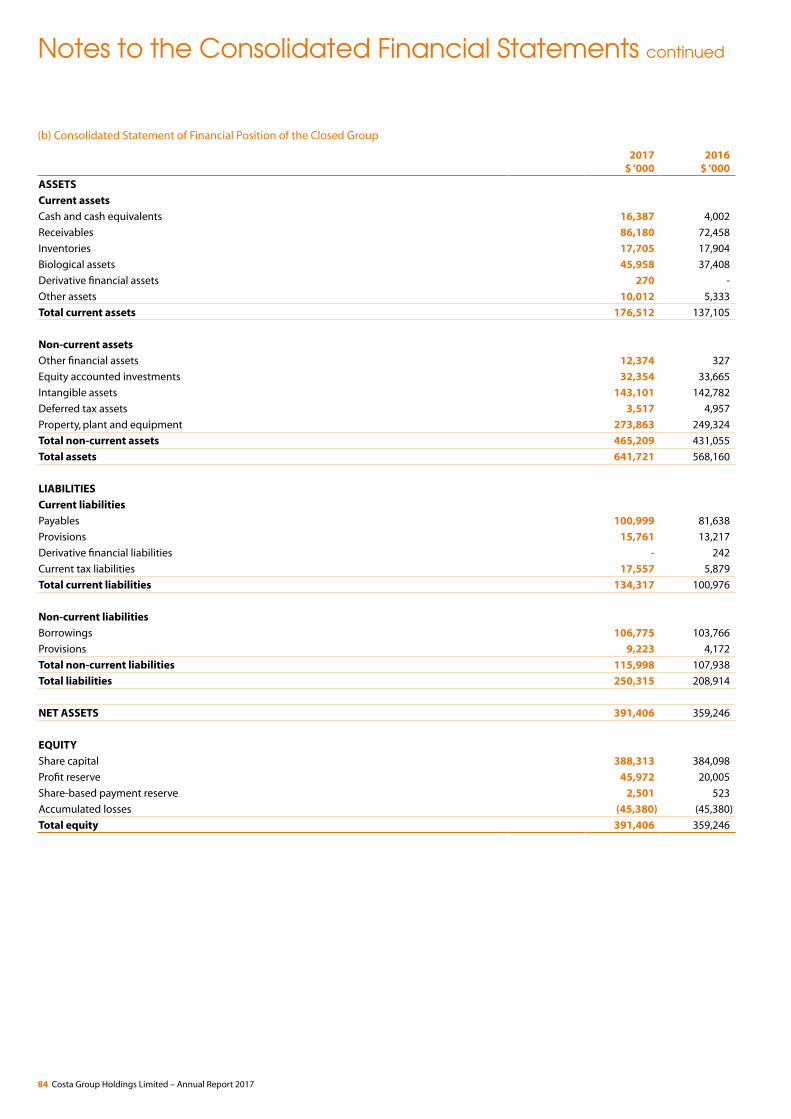
(b) Consolidated Statement of Financial Position of the Closed Group
2017 $ ‘000
2016 $ ‘000
ASSETS
Current assets
Cash and cash equivalents 16,387 4,002
Receivables 86,180 72,458
Inventories 17,705 17,904
Biological assets 45,958 37,408
Derivative financial assets 270 -
Other assets 10,012 5,333
Total current assets 176,512 137,105
Non-current assets
Other financial assets 12,374 327
Equity accounted investments 32,354 33,665
Intangible assets 143,101 142,782
Deferred tax assets 3,517 4,957
Property, plant and equipment 273,863 249,324
Total non-current assets 465,209 431,055
Total assets 641,721 568,160
LIABILITIES
Current liabilities
Payables 100,999 81,638
Provisions 15,761 13,217
Derivative financial liabilities - 242
Current tax liabilities 17,557 5,879
Total current liabilities 134,317 100,976
Non-current liabilities
Borrowings 106,775 103,766
Provisions 9,223 4,172
Total non-current liabilities 115,998 107,938
Total liabilities 250,315 208,914
NET ASSETS 391,406 359,246
EQUITY
Share capital 388,313 384,098
Profit reserve 45,972 20,005
Share-based payment reserve 2,501 523
Accumulated losses (45,380) (45,380)
Total equity 391,406 359,246
Notes to the Consolidated Financial Statements continued
84 Costa Group Holdings Limited – Annual Report 2017
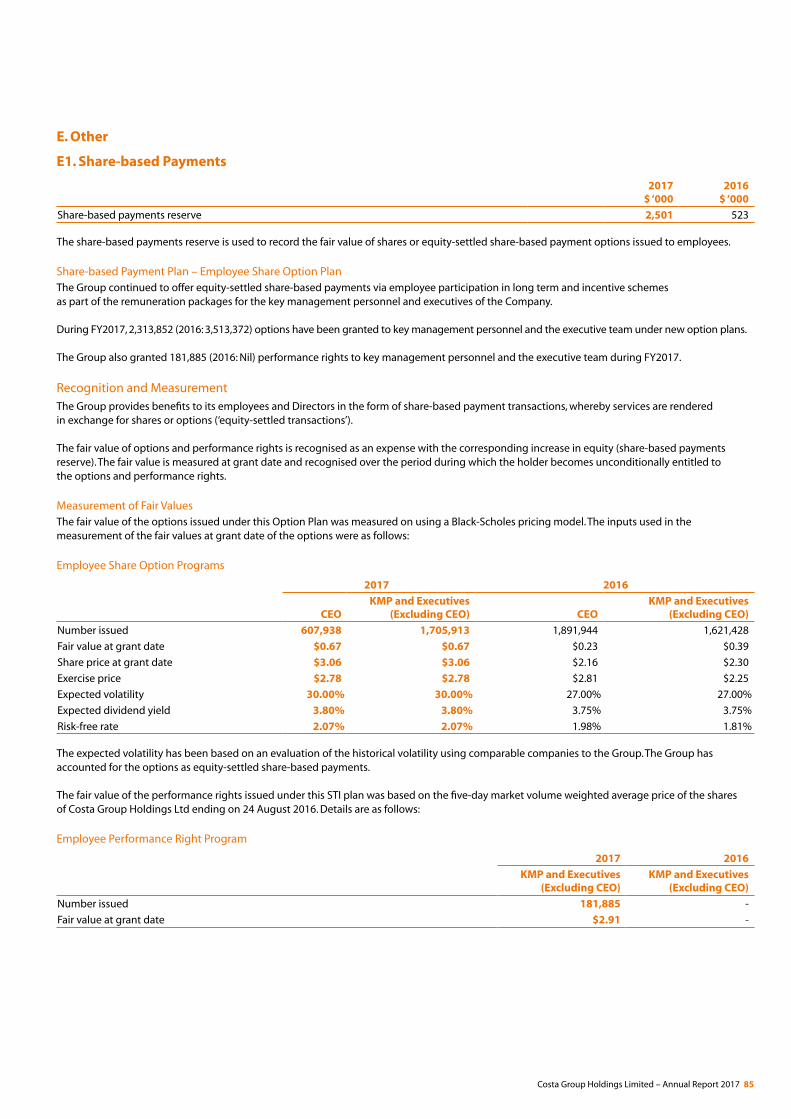
E. Other
E1. Share-based Payments
2017 $ ‘000
2016 $ ‘000
Share-based payments reserve 2,501 523
The share-based payments reserve is used to record the fair value of shares or equity-settled share-based payment options issued to employees.
Share-based Payment Plan – Employee Share Option PlanThe Group continued to offer equity-settled share-based payments via employee participation in long term and incentive schemes as part of the remuneration packages for the key management personnel and executives of the Company.
During FY2017, 2,313,852 (2016: 3,513,372) options have been granted to key management personnel and the executive team under new option plans.
The Group also granted 181,885 (2016: Nil) performance rights to key management personnel and the executive team during FY2017.
Recognition and Measurement The Group provides benefits to its employees and Directors in the form of share-based payment transactions, whereby services are rendered in exchange for shares or options (‘equity-settled transactions’).
The fair value of options and performance rights is recognised as an expense with the corresponding increase in equity (share-based payments reserve). The fair value is measured at grant date and recognised over the period during which the holder becomes unconditionally entitled to the options and performance rights.
Measurement of Fair ValuesThe fair value of the options issued under this Option Plan was measured on using a Black-Scholes pricing model. The inputs used in the measurement of the fair values at grant date of the options were as follows:
Employee Share Option Programs
2017 2016
CEOKMP and Executives
(Excluding CEO) CEOKMP and Executives
(Excluding CEO)
Number issued 607,938 1,705,913 1,891,944 1,621,428
Fair value at grant date $0.67 $0.67 $0.23 $0.39
Share price at grant date $3.06 $3.06 $2.16 $2.30
Exercise price $2.78 $2.78 $2.81 $2.25
Expected volatility 30.00% 30.00% 27.00% 27.00%
Expected dividend yield 3.80% 3.80% 3.75% 3.75%
Risk-free rate 2.07% 2.07% 1.98% 1.81%
The expected volatility has been based on an evaluation of the historical volatility using comparable companies to the Group. The Group has accounted for the options as equity-settled share-based payments.
The fair value of the performance rights issued under this STI plan was based on the five-day market volume weighted average price of the shares of Costa Group Holdings Ltd ending on 24 August 2016. Details are as follows:
Employee Performance Right Program
2017 2016
KMP and Executives (Excluding CEO)
KMP and Executives (Excluding CEO)
Number issued 181,885 -
Fair value at grant date $2.91 -
Costa Group Holdings Limited – Annual Report 2017 85
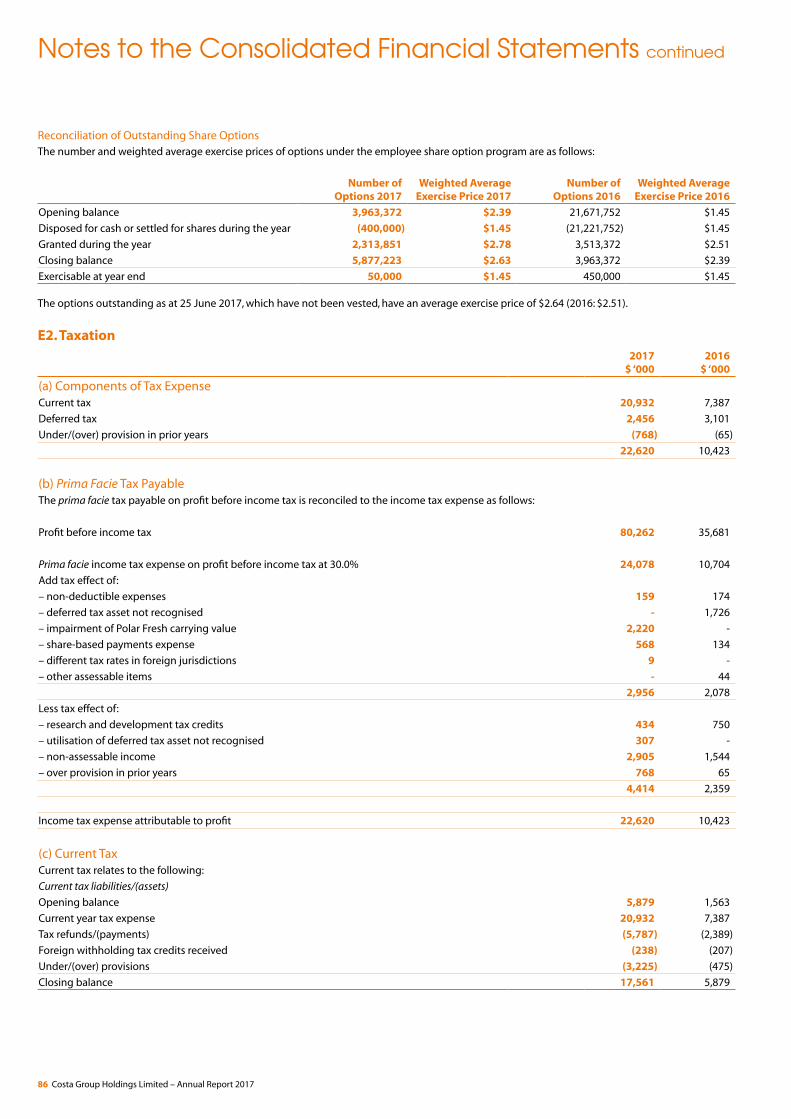
Reconciliation of Outstanding Share OptionsThe number and weighted average exercise prices of options under the employee share option program are as follows:
Number of Options 2017
Weighted Average Exercise Price 2017
Number of Options 2016
Weighted Average Exercise Price 2016
Opening balance 3,963,372 $2.39 21,671,752 $1.45
Disposed for cash or settled for shares during the year (400,000) $1.45 (21,221,752) $1.45
Granted during the year 2,313,851 $2.78 3,513,372 $2.51
Closing balance 5,877,223 $2.63 3,963,372 $2.39
Exercisable at year end 50,000 $1.45 450,000 $1.45
The options outstanding as at 25 June 2017, which have not been vested, have an average exercise price of $2.64 (2016: $2.51).
E2. Taxation2017
$ ‘0002016
$ ‘000
(a) Components of Tax ExpenseCurrent tax 20,932 7,387
Deferred tax 2,456 3,101
Under/(over) provision in prior years (768) (65)
22,620 10,423
(b) Prima Facie Tax PayableThe prima facie tax payable on profit before income tax is reconciled to the income tax expense as follows:
Profit before income tax 80,262 35,681
Prima facie income tax expense on profit before income tax at 30.0% 24,078 10,704
Add tax effect of:
– non-deductible expenses 159 174
– deferred tax asset not recognised - 1,726
– impairment of Polar Fresh carrying value 2,220 -
– share-based payments expense 568 134
– different tax rates in foreign jurisdictions 9 -
– other assessable items - 44
2,956 2,078
Less tax effect of:
– research and development tax credits 434 750
– utilisation of deferred tax asset not recognised 307 -
– non-assessable income 2,905 1,544
– over provision in prior years 768 65
4,414 2,359
Income tax expense attributable to profit 22,620 10,423
(c) Current TaxCurrent tax relates to the following:
Current tax liabilities/(assets)
Opening balance 5,879 1,563
Current year tax expense 20,932 7,387
Tax refunds/(payments) (5,787) (2,389)
Foreign withholding tax credits received (238) (207)
Under/(over) provisions (3,225) (475)
Closing balance 17,561 5,879
Notes to the Consolidated Financial Statements continued
86 Costa Group Holdings Limited – Annual Report 2017
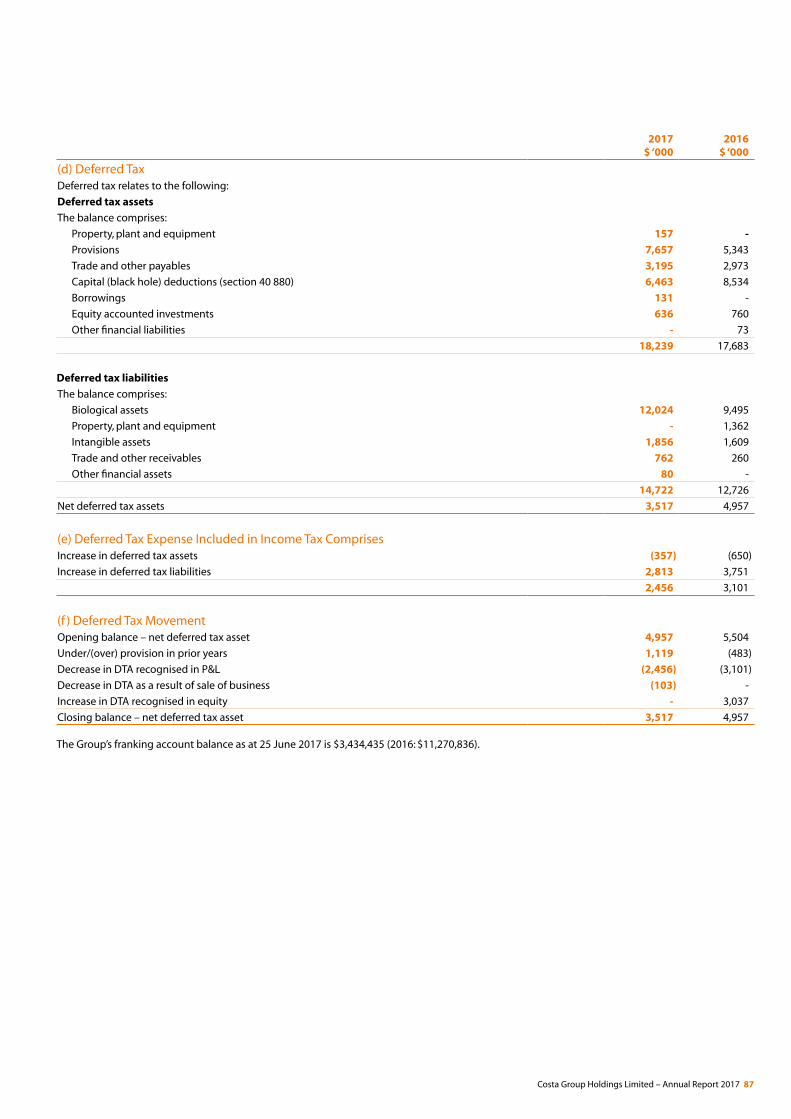
2017 $ ‘000
2016 $ ‘000
(d) Deferred TaxDeferred tax relates to the following:
Deferred tax assets
The balance comprises:
Property, plant and equipment 157 -
Provisions 7,657 5,343
Trade and other payables 3,195 2,973
Capital (black hole) deductions (section 40 880) 6,463 8,534
Borrowings 131 -
Equity accounted investments 636 760
Other financial liabilities - 73
18,239 17,683
Deferred tax liabilities
The balance comprises:
Biological assets 12,024 9,495
Property, plant and equipment - 1,362
Intangible assets 1,856 1,609
Trade and other receivables 762 260
Other financial assets 80 -
14,722 12,726
Net deferred tax assets 3,517 4,957
(e) Deferred Tax Expense Included in Income Tax ComprisesIncrease in deferred tax assets (357) (650)
Increase in deferred tax liabilities 2,813 3,751
2,456 3,101
(f ) Deferred Tax MovementOpening balance – net deferred tax asset 4,957 5,504
Under/(over) provision in prior years 1,119 (483)
Decrease in DTA recognised in P&L (2,456) (3,101)
Decrease in DTA as a result of sale of business (103) -
Increase in DTA recognised in equity - 3,037
Closing balance – net deferred tax asset 3,517 4,957
The Group’s franking account balance as at 25 June 2017 is $3,434,435 (2016: $11,270,836).
Costa Group Holdings Limited – Annual Report 2017 87
Recognition and Measurement Current income tax expense or benefit is the tax payable or receivable on the current period’s taxable income based on the applicable income tax rate adjusted by changes in deferred tax assets and liabilities.
Deferred tax assets and liabilities are recognised for temporary differences at the applicable tax rates when the assets are expected to be recovered or liabilities are settled. No deferred tax asset or liability is recognised in relation to temporary differences if they arose in a transaction, other than a business combination, that at the time of the transaction did not affect either accounting profit or taxable profit or loss.
Deferred tax assets are recognised for deductible temporary differences and unused tax losses only if it is probable that future taxable amounts will be available to utilise those temporary differences and losses.
Current and deferred tax balances attributable to amounts recognised directly in equity are also recognised directly in equity.
Tax ConsolidationThe parent entity Costa Group Holdings Ltd and its subsidiaries have implemented the tax consolidation legislation and have formed a tax consolidated Group. The parent entity and subsidiaries in the tax consolidated Group have entered into a tax funding agreement such that each entity in the tax consolidated Group recognises the assets, liabilities, expenses and revenues in relation to its own transactions, events and balances only. This means that:
• the parent entity recognises all current and deferred tax amounts relating to its own transactions, events and balances only;
• the subsidiaries recognise current or deferred tax amounts arising in respect of their own transactions, events and balances; and
• current tax liabilities and deferred tax assets arising in respect of tax losses are transferred from the subsidiary to the head entity as inter-company payables or receivables.
The tax consolidated Group also has a tax sharing agreement in place to limit the liability of subsidiaries in the tax consolidated Group arising under the joint and several liability requirements of the tax consolidation system, in the event of default by the parent entity to meet its payment obligations.
Critical Accounting Estimate and Judgement
Income TaxIncome tax benefits are based on the assumption that no adverse change will occur in the income tax legislation and the anticipation that the Group will derive sufficient future assessable income to enable the benefit to be realised and comply with the conditions of deductibility imposed by the law.
Deferred tax assets are recognised for deductible temporary differences as management considers that it is probable that future taxable profits will be available to utilise those temporary differences.
E3. New Accounting Standards
Recently Issued or Amended Accounting Standards The following relevant Australian Accounting Standards and Interpretations have been issued or amended but are not yet effective and the Group has not yet adopted them:
• AASB 16 Leases
• AASB 9 Financial Instruments
• AASB 15 Revenue from Contracts with Customers
• AASB 2014-10 Amendments to Australian Accounting Standards – Sale or Contribution of Assets between an Investor and its Associate or Joint Venture
• AAB 2016-5 Amendments to Australian Accounting Standards – Classification and Measurement of Share-based Payment Transactions
• AASB 2017-1 Amendments to Australian Accounting Standards – Transfers of Investment Property, Annual Improvements 2014–2016 Cycle and Other Amendments
• Interpretation 22 Foreign Currency Transactions and Advance Consideration
• AASB 2016-6 Amendments to Australian Accounting Standards – Applying AASB 9 Financial Instruments with AASB 4 Insurance Contracts
• AASB 2016-1 Amendments to Australian Accounting Standards – Recognition of Deferred Tax Assets for Unrealised Losses
• AASB 2016-2 Amendments to Australian Accounting Standards – Disclosure Initiative: Amendments to AASB 107
• AASB 2017-2 Amendments to Australian Accounting Standards – Further Annual Improvements 2014–2016 Cycle
The Group is currently assessing the impact of these standards on its financial position and performance.
Notes to the Consolidated Financial Statements continued
88 Costa Group Holdings Limited – Annual Report 2017
AASB 16 LeasesAASB 16 Leases will replace the current standard on lease accounting, AASB 117. AASB 16 introduces a single lessee accounting model and requires the lessee to recognise assets and liabilities of all leases with a term of more than 12 months, unless the underlying asset is of low value. A lessee is required to recognise a right-of-use asset representing its right to use the underlying leased asset and a lease liability representing its obligations to make lease payments. This standard will require the Group to bring all material leases with lease terms greater than one year on to the balance sheet (refer note C6 for further details of the Group’s operating lease commitments as at 25 June 2017). The Group has not yet determined the potential effect of this standard on its future financial report. The standard is mandatory for financial years commencing on or after 1 January 2019 and the Group expects to adopt the standard at the start of FY2020.
AASB 15 RevenueAASB 15 is based on the principle that revenue is recognised when control of a good or service transfers to a customer – so the notion of control replaces the existing notion of risks and rewards. The standard is not applicable until 1 January 2018 but is available for early adoption. The Group has not yet determined the potential effect of this standard on its future financial report. The Group expects to adopt the standard at the start of FY2019.
E4. Auditor’s Remuneration
2017 $ ‘000
2016 $ ‘000
Audit and review services
Services provided by KPMG Australia 394,756 340,700
Services provided by associate firms of KPMG Australia 17,422 -
412,178 340,700
Other services provided by KPMG Australia
Taxation compliance and other taxation advisory services (including R&D) 245,700 175,000
Other services 10,000 21,000
255,700 196,000
Total remuneration of KPMG 667,878 536,700
E5. Other Financial Assets
2017 $ ‘000
2016 $ ‘000
NON-CURRENT
Loans to related party associates 80 80
Available-for-sale financial assets
Shares in other corporations 247 247
327 327
* Refer to Note C7 for disclosure on fair valuation technique of this asset.
Costa Group Holdings Limited – Annual Report 2017 89
E6. Other Accounting Policies
Research and Development ExpenditureExpenditure on research activities is recognised as an expense when incurred.
Expenditure on development activities is capitalised only when technical feasibility studies demonstrate that the project will deliver future economic benefits and these benefits can be measured reliably. Capitalised development expenditure is stated at cost less accumulated amortisation. Amortisation is calculated using the straight-line method to allocate the cost of its estimated useful life commencing when the intangible asset is available for use.
Other development expenditure is recognised as an expense when incurred.
Bonus PlanThe Group recognises a provision when a bonus is payable in accordance with the employee’s contract of employment, and the amount can be reliably measured.
Government GrantsGovernment grants are initially recognised as deferred income at fair value when there is reasonable assurance that they will be received and that the Group will comply with the conditions associated with the grant. Subsequently, they are recognised in the statement of comprehensive income to offset the applicable expenses incurred by the Group as stated in the provisions of the government grant.
Notes to the Consolidated Financial Statements continued
90 Costa Group Holdings Limited – Annual Report 2017
Directors’ Declaration
1. In the opinion of the Directors of Costa Group Holdings Ltd (‘the Company’):
(a) the consolidated financial report and notes A1 to E6 and the Remuneration Report in the Directors’ Report, are in accordance with the Corporations Act 2001, including:
(i) giving a true and fair view of the Group’s financial position as at 25 June 2017 and of its performance, for the financial year ended on that date; and
(ii) complying with Australian Accounting Standards and the Corporations Regulations 2001; and
(b) there are reasonable grounds to believe that the Company will be able to pay its debts as and when they become due and payable.
2. There are reasonable grounds to believe that the Company and the Group entities identified in Note D5 will be able to meet any obligations or liabilities to which they are or may become subject to by virtue of the Deed of Cross Guarantee between the Company and the Group entities pursuant to ASIC Class Order 98/1418.
3. The Directors have been given the declarations required by Section 295A of the Corporations Act 2001 from the Chief Executive Officer and Chief Financial Officer for the financial year ended 25 June 2017.
4. The Directors draw attention to the ‘Overview’ section of the consolidated financial report, which includes a statement of compliance with International Financial Reporting Standards.
Signed in accordance with a resolution of the Directors:
Dated at Melbourne 23rd day of August 2017.
Harry DebneyManaging Director and CEO
Neil ChatfieldChairman
Costa Group Holdings Limited – Annual Report 2017 91
Independent Auditor’s Report
88
Liability limited by a scheme approved under Professional Standards Legislation.
KPMG, an Australian partnership and a member firm of the KPMG network of independent member firms affiliated with KPMG International Cooperative (“KPMG International”), a Swiss entity.
Independent Auditor’s Report
To the members of Costa Group Holdings Limited
Report on the audit of the Financial Report
Opinion
We have audited the Financial Report of Costa Group Holdings Limited (the Company).
In our opinion, the accompanying Financial Report of the Company is in accordance with the Corporations Act 2001, including:
• giving a true and fair view of the Group's financial position as at 25 June 2017 and of its financial performance for the financial year ended on that date; and
• complying with Australian Accounting Standards and the Corporations Regulations 2001.
The Financial Report comprises:
• Consolidated statement of financial position as at 25 June 2017
• Consolidated statement of profit or loss and other comprehensive income, Consolidated statement of changes in equity, and Consolidated statement of cash flows for the financial year then ended
• Notes including a summary of significant accounting policies
• Directors' Declaration.
The Group consists of the Company and the entities it controlled at the year end or from time to time during the financial year.
Basis for opinion
We conducted our audit in accordance with Australian Auditing Standards. We believe that the audit evidence we have obtained is sufficient and appropriate to provide a basis for our opinion.
Our responsibilities under those standards are further described in the Auditor’s responsibilities for the audit of the Financial Report section of our report.
We are independent of the Group in accordance with the Corporations Act 2001 and the ethical requirements of the Accounting Professional and Ethical Standards Board’s APES 110 Code of Ethics for Professional Accountants (the Code) that are relevant to our audit of the Financial Report in Australia. We have fulfilled our other ethical responsibilities in accordance with the Code.
This is the original version of the audit report over the financial statements signed by the Directors on 23 August 2017. Page references should be read as follows to reflect the correct references now that the financial statements have been presented in the context of the annual report in its entirety:– the Remuneration Report is now set out on pages 37 to 47 as opposed to pages 21 to 33 below.
92 Costa Group Holdings Limited – Annual Report 2017
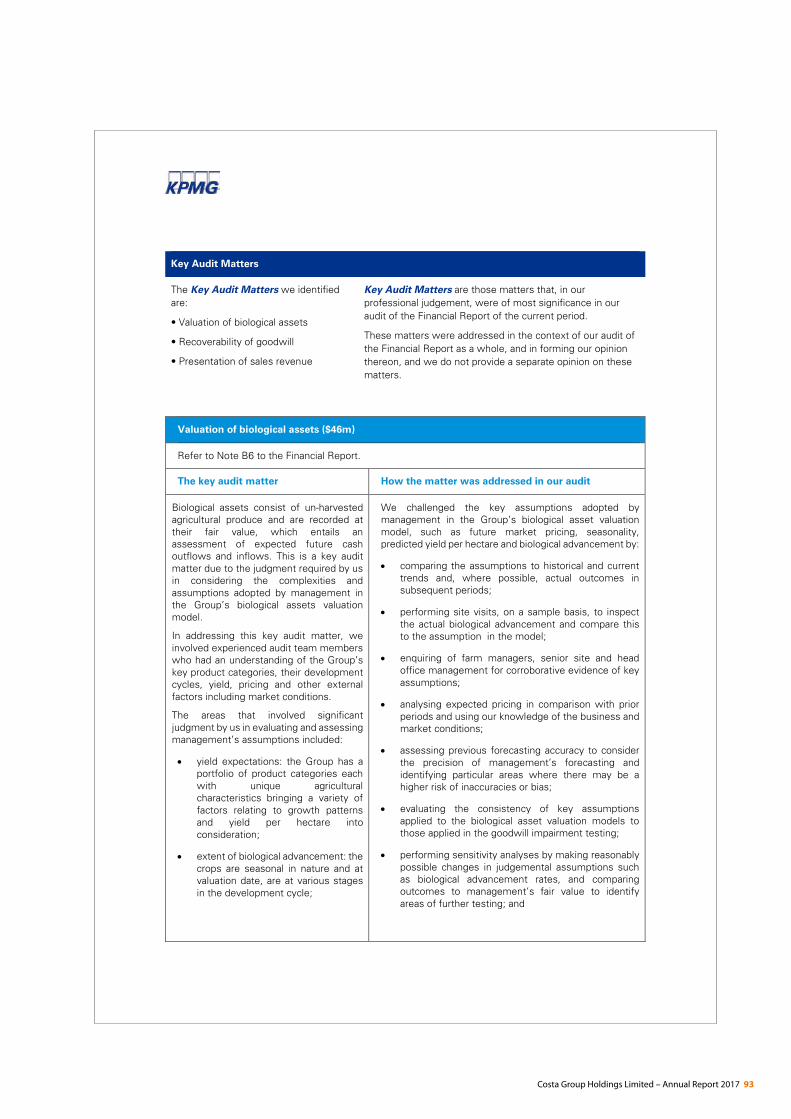
89
Key Audit Matters
The Key Audit Matters we identified are:
• Valuation of biological assets
• Recoverability of goodwill
• Presentation of sales revenue
Key Audit Matters are those matters that, in our professional judgement, were of most significance in our audit of the Financial Report of the current period.
These matters were addressed in the context of our audit of the Financial Report as a whole, and in forming our opinion thereon, and we do not provide a separate opinion on these matters.
Valuation of biological assets ($46m)
Refer to Note B6 to the Financial Report.
The key audit matter How the matter was addressed in our audit
Biological assets consist of un-harvested agricultural produce and are recorded at their fair value, which entails an assessment of expected future cash outflows and inflows. This is a key audit matter due to the judgment required by us in considering the complexities and assumptions adopted by management in the Group’s biological assets valuation model.
In addressing this key audit matter, we involved experienced audit team members who had an understanding of the Group’s key product categories, their development cycles, yield, pricing and other external factors including market conditions.
The areas that involved significant judgment by us in evaluating and assessing management’s assumptions included:
• yield expectations: the Group has a portfolio of product categories each with unique agricultural characteristics bringing a variety of factors relating to growth patterns and yield per hectare into consideration;
• extent of biological advancement: the crops are seasonal in nature and at valuation date, are at various stages in the development cycle;
We challenged the key assumptions adopted by management in the Group’s biological asset valuation model, such as future market pricing, seasonality, predicted yield per hectare and biological advancement by:
• comparing the assumptions to historical and current trends and, where possible, actual outcomes in subsequent periods;
• performing site visits, on a sample basis, to inspect the actual biological advancement and compare this to the assumption in the model;
• enquiring of farm managers, senior site and head office management for corroborative evidence of key assumptions;
• analysing expected pricing in comparison with prior periods and using our knowledge of the business and market conditions;
• assessing previous forecasting accuracy to consider the precision of management’s forecasting and identifying particular areas where there may be a higher risk of inaccuracies or bias;
• evaluating the consistency of key assumptions applied to the biological asset valuation models to those applied in the goodwill impairment testing;
• performing sensitivity analyses by making reasonably possible changes in judgemental assumptions such as biological advancement rates, and comparing outcomes to management’s fair value to identify areas of further testing; and
Costa Group Holdings Limited – Annual Report 2017 93
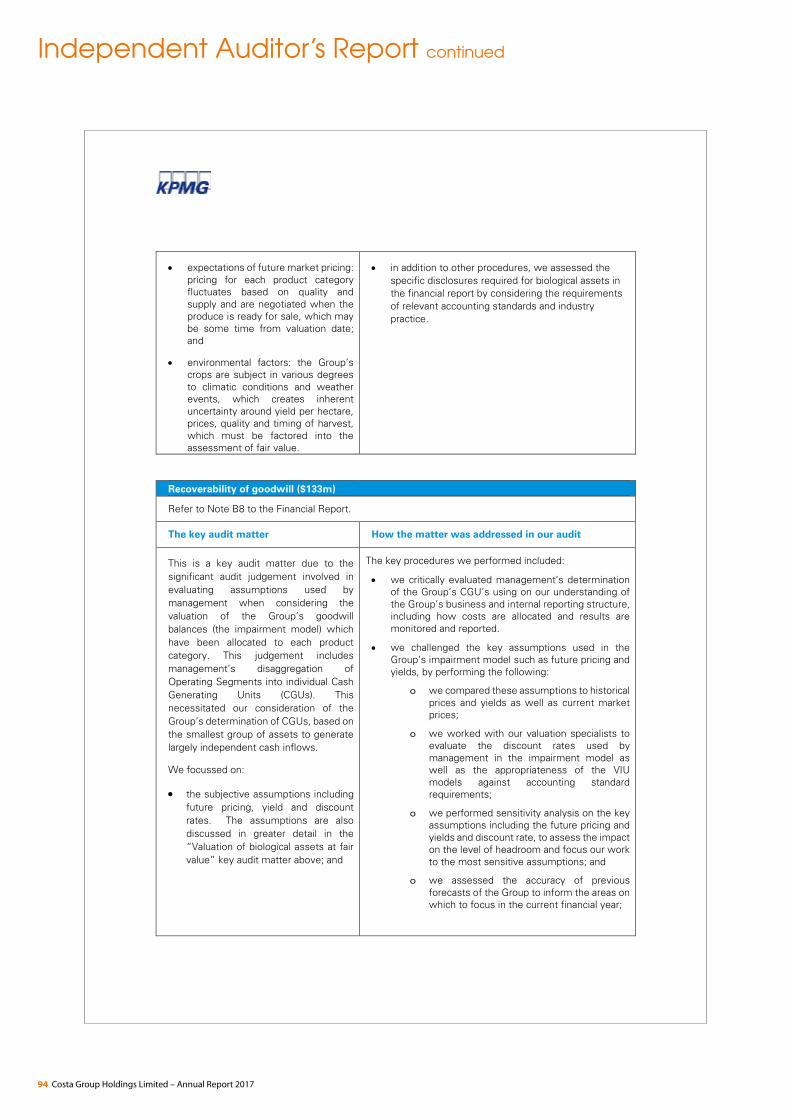
Independent Auditor’s Report continued
90
• expectations of future market pricing: pricing for each product category fluctuates based on quality and supply and are negotiated when the produce is ready for sale, which may be some time from valuation date; and
• environmental factors: the Group’s crops are subject in various degrees to climatic conditions and weather events, which creates inherent uncertainty around yield per hectare, prices, quality and timing of harvest, which must be factored into the assessment of fair value.
• in addition to other procedures, we assessed the specific disclosures required for biological assets in the financial report by considering the requirements of relevant accounting standards and industry practice.
Recoverability of goodwill ($133m)
Refer to Note B8 to the Financial Report.
The key audit matter How the matter was addressed in our audit
This is a key audit matter due to the significant audit judgement involved in evaluating assumptions used by management when considering the valuation of the Group’s goodwill balances (the impairment model) which have been allocated to each product category. This judgement includes management’s disaggregation of Operating Segments into individual Cash Generating Units (CGUs). This necessitated our consideration of the Group’s determination of CGUs, based on the smallest group of assets to generate largely independent cash inflows.
We focussed on:
• the subjective assumptions including future pricing, yield and discount rates. The assumptions are also discussed in greater detail in the “Valuation of biological assets at fair value” key audit matter above; and
The key procedures we performed included:
• we critically evaluated management’s determination of the Group’s CGU’s using on our understanding of the Group’s business and internal reporting structure, including how costs are allocated and results are monitored and reported.
• we challenged the key assumptions used in the Group’s impairment model such as future pricing and yields, by performing the following:
o we compared these assumptions to historical prices and yields as well as current market prices;
o we worked with our valuation specialists to evaluate the discount rates used by management in the impairment model as well as the appropriateness of the VIU models against accounting standard requirements;
o we performed sensitivity analysis on the key assumptions including the future pricing and yields and discount rate, to assess the impact on the level of headroom and focus our work to the most sensitive assumptions; and
o we assessed the accuracy of previous forecasts of the Group to inform the areas on which to focus in the current financial year;
94 Costa Group Holdings Limited – Annual Report 2017
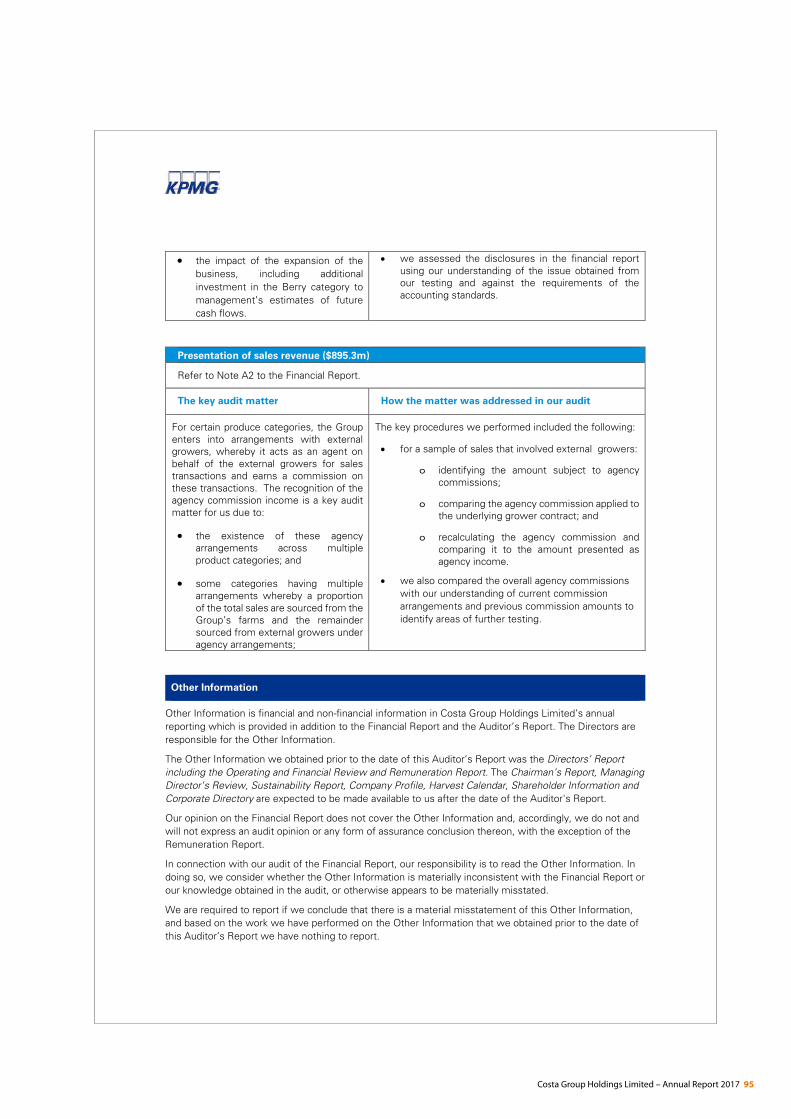
91
• the impact of the expansion of the business, including additional investment in the Berry category to management’s estimates of future cash flows.
• we assessed the disclosures in the financial report using our understanding of the issue obtained from our testing and against the requirements of the accounting standards.
Presentation of sales revenue ($895.3m)
Refer to Note A2 to the Financial Report.
The key audit matter How the matter was addressed in our audit
For certain produce categories, the Group enters into arrangements with external growers, whereby it acts as an agent on behalf of the external growers for sales transactions and earns a commission on these transactions. The recognition of the agency commission income is a key audit matter for us due to:
• the existence of these agency arrangements across multiple product categories; and
• some categories having multiple arrangements whereby a proportion of the total sales are sourced from the Group’s farms and the remainder sourced from external growers under agency arrangements;
The key procedures we performed included the following:
• for a sample of sales that involved external growers:
o identifying the amount subject to agency commissions;
o comparing the agency commission applied to the underlying grower contract; and
o recalculating the agency commission and comparing it to the amount presented as agency income.
• we also compared the overall agency commissions with our understanding of current commission arrangements and previous commission amounts to identify areas of further testing.
Other Information
Other Information is financial and non-financial information in Costa Group Holdings Limited’s annual reporting which is provided in addition to the Financial Report and the Auditor’s Report. The Directors are responsible for the Other Information.
The Other Information we obtained prior to the date of this Auditor’s Report was the Directors’ Report including the Operating and Financial Review and Remuneration Report. The Chairman’s Report, Managing Director’s Review, Sustainability Report, Company Profile, Harvest Calendar, Shareholder Information and Corporate Directory are expected to be made available to us after the date of the Auditor's Report.
Our opinion on the Financial Report does not cover the Other Information and, accordingly, we do not and will not express an audit opinion or any form of assurance conclusion thereon, with the exception of the Remuneration Report.
In connection with our audit of the Financial Report, our responsibility is to read the Other Information. In doing so, we consider whether the Other Information is materially inconsistent with the Financial Report or our knowledge obtained in the audit, or otherwise appears to be materially misstated.
We are required to report if we conclude that there is a material misstatement of this Other Information, and based on the work we have performed on the Other Information that we obtained prior to the date of this Auditor’s Report we have nothing to report.
Costa Group Holdings Limited – Annual Report 2017 95
Independent Auditor’s Report continued
92
Responsibilities of the Directors for the Financial Report
The Directors are responsible for:
• preparing the Financial Report that gives a true and fair view in accordance with Australian Accounting Standards and the Corporations Act 2001
• implementing necessary internal control to enable the preparation of a Financial Report that gives a true and fair view and is free from material misstatement, whether due to fraud or error
• assessing the Group and Company's ability to continue as a going concern. This includes disclosing, as applicable, matters related to going concern and using the going concern basis of accounting unless they either intend to liquidate the Group and Company or to cease operations, or have no realistic alternative but to do so.
Auditor’s responsibilities for the audit of the Financial Report
Our objective is:
• to obtain reasonable assurance about whether the Financial Report as a whole is free from material misstatement, whether due to fraud or error; and
• to issue an Auditor’s Report that includes our opinion.
Reasonable assurance is a high level of assurance, but is not a guarantee that an audit conducted in accordance with Australian Auditing Standards will always detect a material misstatement when it exists.
Misstatements can arise from fraud or error. They are considered material if, individually or in the aggregate, they could reasonably be expected to influence the economic decisions of users taken on the basis of this Financial Report.
A further description of our responsibilities for the audit of the Financial Report is located at the Auditing and Assurance Standards Board website at: http://www.auasb.gov.au/auditors_files/ar2.pdf. This description forms part of our Auditor’s Report.
96 Costa Group Holdings Limited – Annual Report 2017
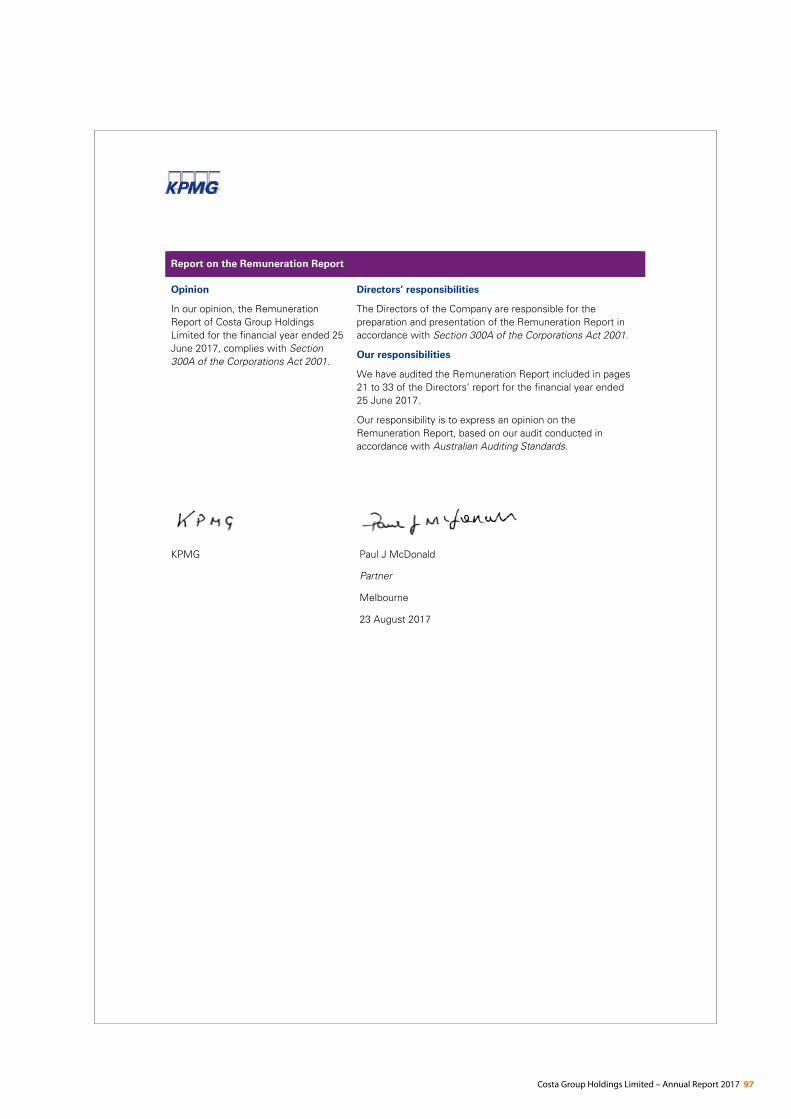
93
Report on the Remuneration Report
Opinion
In our opinion, the Remuneration Report of Costa Group Holdings Limited for the financial year ended 25 June 2017, complies with Section 300A of the Corporations Act 2001.
Directors’ responsibilities
The Directors of the Company are responsible for the preparation and presentation of the Remuneration Report in accordance with Section 300A of the Corporations Act 2001.
Our responsibilities
We have audited the Remuneration Report included in pages 21 to 33 of the Directors’ report for the financial year ended 25 June 2017.
Our responsibility is to express an opinion on the Remuneration Report, based on our audit conducted in accordance with Australian Auditing Standards.
KPMG Paul J McDonald
Partner
Melbourne
23 August 2017
Costa Group Holdings Limited – Annual Report 2017 97
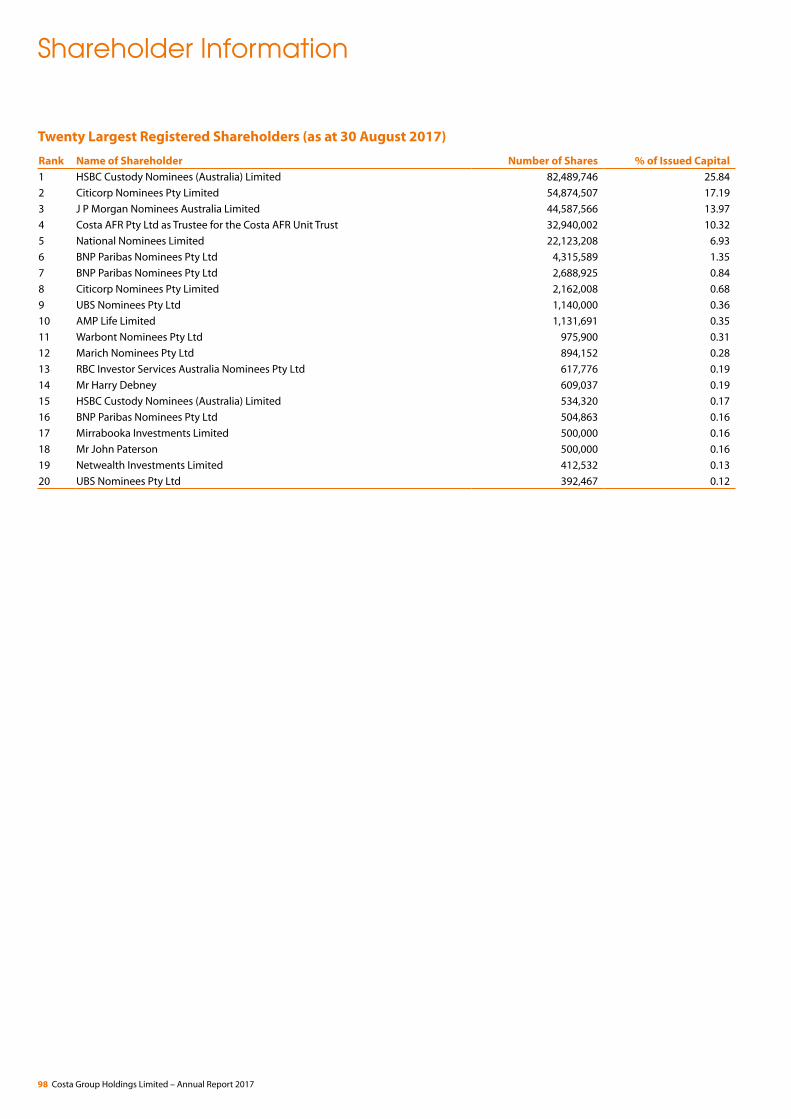
Shareholder Information
Twenty Largest Registered Shareholders (as at 30 August 2017)
Rank Name of Shareholder Number of Shares % of Issued Capital
1 HSBC Custody Nominees (Australia) Limited 82,489,746 25.84
2 Citicorp Nominees Pty Limited 54,874,507 17.19
3 J P Morgan Nominees Australia Limited 44,587,566 13.97
4 Costa AFR Pty Ltd as Trustee for the Costa AFR Unit Trust 32,940,002 10.32
5 National Nominees Limited 22,123,208 6.93
6 BNP Paribas Nominees Pty Ltd 4,315,589 1.35
7 BNP Paribas Nominees Pty Ltd 2,688,925 0.84
8 Citicorp Nominees Pty Limited 2,162,008 0.68
9 UBS Nominees Pty Ltd 1,140,000 0.36
10 AMP Life Limited 1,131,691 0.35
11 Warbont Nominees Pty Ltd 975,900 0.31
12 Marich Nominees Pty Ltd 894,152 0.28
13 RBC Investor Services Australia Nominees Pty Ltd 617,776 0.19
14 Mr Harry Debney 609,037 0.19
15 HSBC Custody Nominees (Australia) Limited 534,320 0.17
16 BNP Paribas Nominees Pty Ltd 504,863 0.16
17 Mirrabooka Investments Limited 500,000 0.16
18 Mr John Paterson 500,000 0.16
19 Netwealth Investments Limited 412,532 0.13
20 UBS Nominees Pty Ltd 392,467 0.12
98 Costa Group Holdings Limited – Annual Report 2017
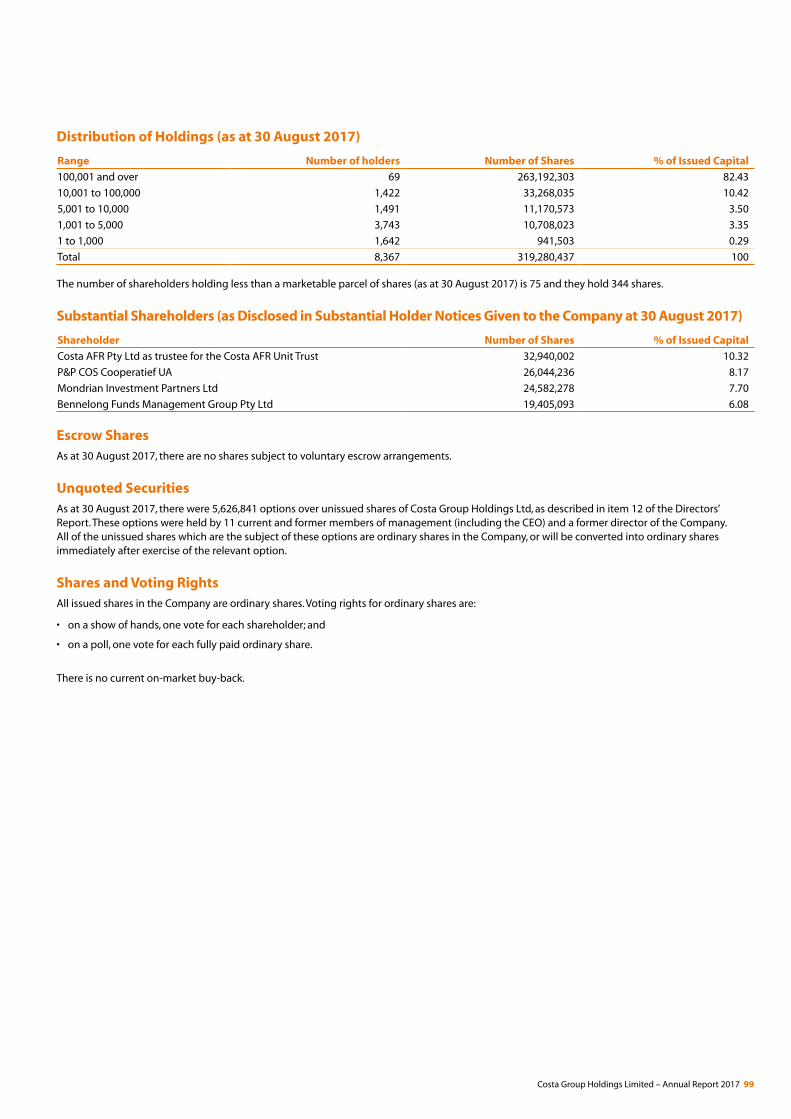
Distribution of Holdings (as at 30 August 2017)
Range Number of holders Number of Shares % of Issued Capital
100,001 and over 69 263,192,303 82.43
10,001 to 100,000 1,422 33,268,035 10.42
5,001 to 10,000 1,491 11,170,573 3.50
1,001 to 5,000 3,743 10,708,023 3.35
1 to 1,000 1,642 941,503 0.29
Total 8,367 319,280,437 100
The number of shareholders holding less than a marketable parcel of shares (as at 30 August 2017) is 75 and they hold 344 shares.
Substantial Shareholders (as Disclosed in Substantial Holder Notices Given to the Company at 30 August 2017)
Shareholder Number of Shares % of Issued Capital
Costa AFR Pty Ltd as trustee for the Costa AFR Unit Trust 32,940,002 10.32
P&P COS Cooperatief UA 26,044,236 8.17
Mondrian Investment Partners Ltd 24,582,278 7.70
Bennelong Funds Management Group Pty Ltd 19,405,093 6.08
Escrow SharesAs at 30 August 2017, there are no shares subject to voluntary escrow arrangements.
Unquoted SecuritiesAs at 30 August 2017, there were 5,626,841 options over unissued shares of Costa Group Holdings Ltd, as described in item 12 of the Directors’ Report. These options were held by 11 current and former members of management (including the CEO) and a former director of the Company. All of the unissued shares which are the subject of these options are ordinary shares in the Company, or will be converted into ordinary shares immediately after exercise of the relevant option.
Shares and Voting RightsAll issued shares in the Company are ordinary shares. Voting rights for ordinary shares are:
• on a show of hands, one vote for each shareholder; and
• on a poll, one vote for each fully paid ordinary share.
There is no current on-market buy-back.
Costa Group Holdings Limited – Annual Report 2017 99
DirectorsNeil Chatfield (Chairman)Harry Debney (CEO)Frank CostaKevin SchwartzPeter MarginTiffany FullerJanette Kendall
Company SecretaryDavid Thomas
Registered OfficeUnit 1, 275 Robinsons Road RavenhallVictoria 3023AustraliaT +613 8363 9000E [email protected]
Share RegistryLink Market Services LimitedLevel 12, 680 George Street, SydneyNSW 2000
Locked Bag A14, Sydney SouthNSW 1235
T +61 1300 554 474 (toll free within Australia)F +61 2 9287 0303F +61 2 9287 0309 (for proxy voting)E [email protected]
www.linkmarketservices.com.au
AuditorKPMGTower Two, Collins Square 727 Collins Street MelbourneVictoria 3008Australia
Stock ExchangeCosta Group Holdings Limited shares are quoted on the Australian Securities Exchange (ASX code: CGC)
Corporate Directory
100 Costa Group Holdings Limited – Annual Report 2017
Costa Group Holdings Limited – Annual Report 2017 101

Co
sta G
rou
p H
old
ing
s Limite
d – A
nnu
al Re
po
rt 2017