Cost transformation
73
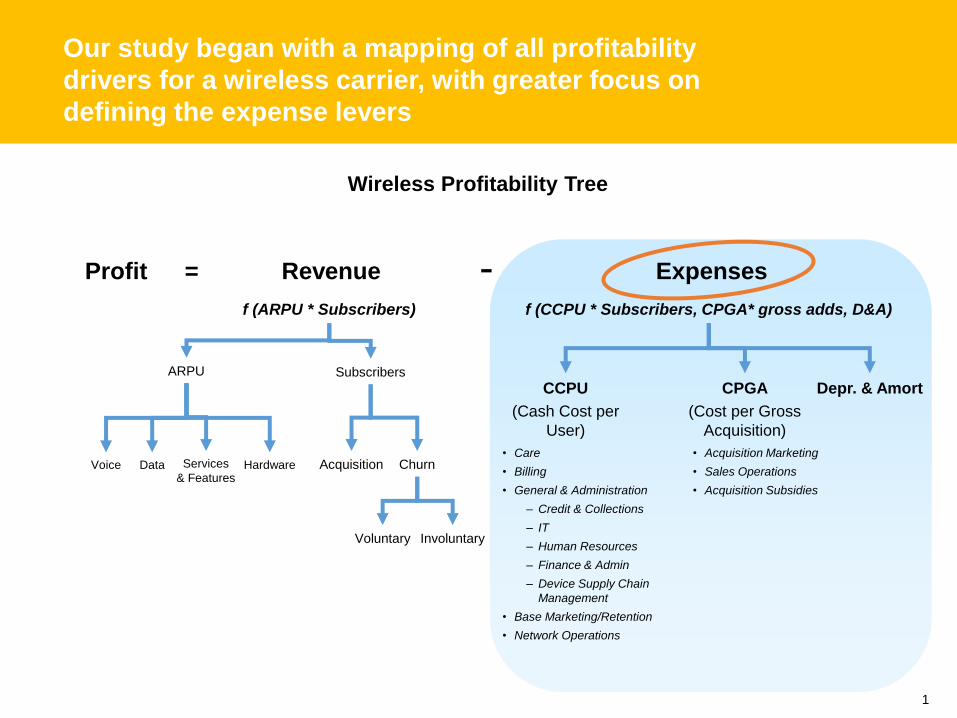
1 Our study began with a mapping of all profitability drivers for a wireless carrier, with greater focus on defining the expense levers Profit = f (ARPU * Subscribers) f (CCPU * Subscribers, CPGA* gross adds, D&A) - ARPU Subscribers CPGA (Cost per Gross Acquisition) CCPU (Cash Cost per User) Depr. & Amort Revenue Expenses Wireless Profitability Tree Acquisition Churn Hardware Voice Data Services & Features Voluntary Involuntary • Care • Billing • General & Administration – Credit & Collections – IT – Human Resources – Finance & Admin – Device Supply Chain Management • Base Marketing/Retention • Network Operations • Acquisition Marketing • Sales Operations • Acquisition Subsidies
-
Upload
slidingup -
Category
Technology
-
view
320 -
download
0
Transcript of Cost transformation
1
Our study began with a mapping of all profitability
drivers for a wireless carrier, with greater focus on
defining the expense levers
Profit =
f (ARPU * Subscribers) f (CCPU * Subscribers, CPGA* gross adds, D&A)
-
ARPU Subscribers
CPGA
(Cost per Gross
Acquisition)
CCPU
(Cash Cost per
User)
Depr. & Amort
Revenue Expenses
Wireless Profitability Tree
Acquisition ChurnHardwareVoice Data Services
& Features
Voluntary Involuntary
• Care
• Billing
• General & Administration
– Credit & Collections
– IT
– Human Resources
– Finance & Admin
– Device Supply Chain
Management
• Base Marketing/Retention
• Network Operations
• Acquisition Marketing
• Sales Operations
• Acquisition Subsidies

2
CPGA
Acquisition
Marketing
Other
G & ABillingCare
= In Scope
= Out of Scope
Base
Marketing /
Retention
Network
(Variable)
Sales
Operations
OpEx
CCPU1Cost per Gross
AcquisitionCash Cost
per User
Wireless Operating Expense Cost Tree*
Credit &
CollectionsIT HR F & A
Device
SCM
• Depreciation / Amortization
Acquisition
Subsidies
* Users
*
Gross
Ads
Note: 1-CCPU should also include cost of content such as licensing fees for video or games and procurement costs.
They are not listed here due to their small percentages in CCPU compared to other cost components.
*For a higher level profitability tree, see appendix
Key F
un
cti
on
s
An in-depth analysis of the Operating Expense
drivers provides a framework for value targeting
around a number of key functions

3
CPGA
Acquisition
Marketing
Other
G & ABillingCare
= In Scope
= Out of Scope
Base
Marketing /
Retention
Network
(Variable)
OpEx
CCPUCost per Gross
AcquisitionCash Cost
per User
Wireless Operating Expense Cost Tree
Credit &
CollectionsIT HR F & A
Sales
Operations
Acquisition
Subsidies
Device
SCM
• Depreciation / Amortization
7% 3% 14% 4% 29% 8% 7% 9%
19% 57% 24%
3.5% 5% 0.3% 1.5% 4%
Cost Breakdown % of OPEX*
Source: US DB Data Book 2005, Major US wireless companies’ financials
Note: Payroll and training costs are included in functional areas.
*For a cost breakdown as a percent of revenue, see Appendix
* Users
*
Gross
Ads
A benchmark of key components of OpEx has been
created based on large US carriers’ financials and
compared across major markets of the world.

4
10-20%
Savings
5-15%
Savings
CPGA
Acquisition
Marketing
Other
G & ABillingCare
= In Scope
= Out of Scope
Base
Marketing /
Retention
Network
(Variable)
OpEx
CCPUCost per Gross
AcquisitionCash Cost
per User
Wireless Operating Expense Cost Tree
Credit &
CollectionsIT HR F & A
Sales
Operations
Acquisition
Subsidies
Device
SCM
• Depreciation / Amortization
7% 3% 14% 4% 29% 8% 7% 9%
19% 57% 24%
3.5% 5% 0.3% 1.5% 4%
15-20%
Savings
20-25%
Savings
12-19%
Savings
25-35%
Savings
20-25%
Savings
30-35%
Savings
15-20%
Savings
15-20%
Savings
15-20%
Savings
15-20%
Savings
35-40%
Savings
20-25%
Savings
20-30%
Savings
15-25%
Savings
Savings % of Cost Element*
Source: US DB Databook 2005, Large US Wireless Companies’ Financials
*For savings percentage ranges as a percent of overall OpEx, see Appendix
* Users*
Gross
Ads
A target range of average savings potential within
each operating expense component was developed
using cost take-out leading practices

5
The Care function operates all points of service to
resolve customer issues including the use of
agents, self-service portals, and IVR systems.
— Cost Reduction Trends —
— Definition —
• Inbound and Outbound Care Centers
– Agents and Outside Agencies
• Agent, IVR, Face-to-Face, Mail/Fax, and Web Care Channels
• Prepaid & Postpaid contacts
Care Includes:
— Functional Interdependencies —
Key Cost KPIs:
• Calls per Customer
• Agent First Call Resolution Rate
• Average Handle Time
• Misdirects
• Service level
• Repeat Call rate
• IVR Percent Complete
• Web Percent Complete
CCPU - Care
• Credit & Collections (separate tree)
• Outbound Sales (Covered in tree under CPGA)
Care does not Include:
• Billing
– Multiple bills per customer will trigger more volume in the
care channel
• Marketing
– An easy to understand offer or campaign will drive down
volume in Care
• Network
– Dropped calls or other network downtime will increase
contacts to the Care channels
Emerging vendor offerings are driving customer contact management infrastructure to outsourcers and to offshore locations (e.g., India, Philippines)
Technology advances create significant opportunities to fundamentally shift cost structure
– Advances in voice recognition have the potential to reduce traffic to agents
– Intelligent call routing and balancing reduces queues and improves close-out rate
The move towards web care is enabling substantial cost savings
– 80% of Fortune 1000 companies involved with some form of Web care (Yankee Group Survey)
The mobile handset will increasingly serve as a supplemental customer care platform
– SMS provides simple care features today (already in place in Europe)
– Mobile Web provides more dynamic care features in future
– Proliferation of handset types and carriers’ desire to retain control over customer data may limit growth of mobile care in the near term
Customer care services bureaus, managed by third party service providers, will increasingly become an attractive option for carriers to deliver care at reduced costs without compromising proprietary customer information
6
• Company owned Retail
vs Third Party
• # of contacts
• AHT
• Labor costs1
• Service Level
• Agent utilization
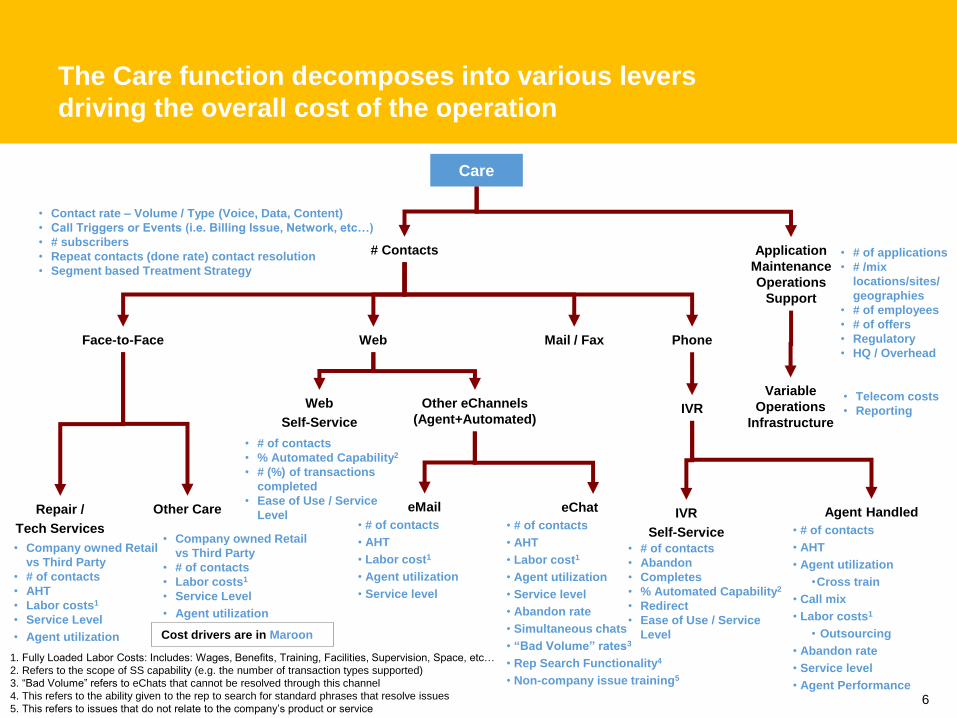
The Care function decomposes into various levers
driving the overall cost of the operation
Phone
Care
Application
Maintenance
Operations
Support
# Contacts
IVR
Agent Handled
• # of contacts
• AHT
• Agent utilization
•Cross train
• Call mix
• Labor costs1
• Outsourcing
• Abandon rate
• Service level
• Agent Performance
Web
Web
Self-Service
Other eChannels
(Agent+Automated)
eChat
• # of contacts
• AHT
• Labor cost1
• Agent utilization
• Service level
• Abandon rate
• Simultaneous chats
• “Bad Volume” rates3
• Rep Search Functionality4
• Non-company issue training5
• # of contacts
• AHT
• Labor cost1
• Agent utilization
• Service level
• Contact rate – Volume / Type (Voice, Data, Content)
• Call Triggers or Events (i.e. Billing Issue, Network, etc…)
• # subscribers
• Repeat contacts (done rate) contact resolution
• Segment based Treatment Strategy
• # of applications
• # /mix
locations/sites/
geographies
• # of employees
• # of offers
• Regulatory
• HQ / OverheadFace-to-Face
• # of contacts
• % Automated Capability2
• # (%) of transactions
completed
• Ease of Use / Service
Level
• # of contacts
• Abandon
• Completes
• % Automated Capability2
• Redirect
• Ease of Use / Service
Level
IVR
Self-Service
1. Fully Loaded Labor Costs: Includes: Wages, Benefits, Training, Facilities, Supervision, Space, etc…
2. Refers to the scope of SS capability (e.g. the number of transaction types supported)
3. “Bad Volume” refers to eChats that cannot be resolved through this channel
4. This refers to the ability given to the rep to search for standard phrases that resolve issues
5. This refers to issues that do not relate to the company’s product or service
Mail / Fax
Other CareRepair /
Tech Services• Company owned Retail
vs Third Party
• # of contacts
• Labor costs1
• Service Level
• Agent utilization
Variable
Operations
Infrastructure
• Telecom costs
• Reporting
Cost drivers are in Maroon

7
Detailed Analysis of the Cost Drivers of the Care
Function
Cost Element /
Cost Drivers
Cost Take-Out Leading Practices Sample Experience Key Performance
Indicators
Number of Contacts
• Call volume
• Contact rate
• Misdirected calls
• Repeat calls
Understanding and proactive management of 'Call Drivers' can
eliminate significant segments of call volume, via:
– Automation of common inquiries (e.g., Payments) via self service
channels (IVR and Web)
– Reduction of mis-directs, and repeat calls
• Universal Agents (or universal serviceability of common
inquiries)
• First call resolution (supported by process, call reason
analysis, and workforce effectiveness tools)
• Customer insight driven routing
• Knowledge management application (operating procedures,
FAQs, etc.)
– Simplification of billing and product offerings (e.g., bundled and
single cost service packages)
– Incentives for self service (e.g., 'On-line' pricing)
– Offering directed/dynamic self service offerings for increased
adoption (e.g., offer restore service functionality to suspended
accounts ONLY)
– Proactive communication of customer impacting changes (e.g.,
Service, Regulatory, etc)
– Create a strong correlation between the reason of contacts and
business process impacted or causing the inbound call
– Identify inside the communication plan channels and events the
telco operator uses to contact the customer base that can cause an
inbound flow of contacts
– Identify business processes that create cases of interactions with
the customer base (e.g. invoicing process, new offerings, faults, ..)
– Create a correlation between incoming contacts and events
causing an information need to the clients
• BellSouth
• AT&T (SBC)
• Verizon
• Qwest
• AOL
• H3G
• Telecom Italia
• HP reduced misdirects
from 40% to 10%
Average client
experience:
• Decrease contact
volume in all channels
by 5-15% (key is agent
call volume)
• Increase first call
resolution by 5-15%
• Increase call
completion rates by 5-
15%
• Increase in
automated/self-redirect
rates by 5-15%
• Decrease cost to serve
overall
• First call resolution rate
• Call completion rate
• Automated/self redirect
rate
• Misdirects < 8%

8
Detailed Analysis of the Cost Drivers of the Care
Function
Cost Element /
Cost Drivers
Cost Take-Out Leading Practices Sample Experience Key Performance
Indicators
Web Self Service
• # of contacts
• % Automated
Capability
- Scope of
capability
- # (%) of
transactions
completed
• Ease of Use /
Service Level
Through channel optimization, drive more contacts to the Web for
self service vs. more expensive channels
– Provide more holistic, easily navigable and enjoyable web
experience by standardizing web infrastructure and
integrating customer insights
– Promote web self service through traditional channels
– Maximize number of simple transactions that can be
completed through web
– Improve completion rates
• Use queries with natural language understanding
capability
• Implement personalization, channel integration, dynamic
FAQs, remote diagnostics
– Over time, migrate more complex transactions to the web
• AT&T - Ask Allie: 70%
increase in self service
usage
• BEA: Self Service customer
retention improved 10%
• BellSouth: 200% increase in
web based sales and service
• Telia (Sweden): 10 fold
increase in time spent on the
web site for self service
• BT Spain, Telefonica
(Spain), Bell Canada, Virgin
Mobile, BT, MCI, Telecom
Italia, Telenor
• % self service 40+%
• % web self service 10+%
• Web completion rate
• Agent call volume
• Customer satisfaction
IVR Self Service
• Number of IVR
contacts
• Abandons
• Completes
• % Automated
Capability
- How many
transaction types
• Redirects
• - Ease of Use /
Service Level
Through channel optimization, drive more contacts to the IVR for
self service vs. the agent channel to reduce cost to serve
– Maximize self-service channel by enabling rules-driven,
differentiated treatment based on customer segmentation
– Use customer insight to expand breadth and depth of IVR
offerings and increase done rate
– Migrate platform to new lower cost technologies
– Multi-channel integration to complete portions of transactions
in IVR through CTI (Computer Telephony Integration)
• Reduce AHT when info is retained and passed on to
agents
• Lead to enhanced customer experience: Personalized
responses, Natural language speech recognition,
Announcements, Dynamic scripting, Customer centric
vs. industry centric offerings
• Telenor: 50% increase in
deflection of calls to self
service
• Verizon: Increase in self
service usage: 3% to 20%
• Virgin Mobile - 8.6%
reduction in callers
requesting an agent in IVR
Average client experience:
• Increase IVR complete rate
increase by 5-50%
• Increase in Automated/Self
Redirect Rates by 5 -15%
• % self service 40+%
• % IVR self service 25+%
• IVR completion rate
• Agent call volume
• First call resolution
• Call completion rate
• Automated/self redirect
rates

9
Detailed Analysis of the Cost Drivers of the Care
Function
Cost Element /
Cost Drivers
Cost Take-Out Leading Practices Sample Experience Key Performance
Indicators
Agent- Handled
Calls
• # of contacts
• AHT
• Agent utilization
- Cross train
• Call Mix
• Labor costs
• Abandon rate
• Service level
• Occupancy
• Forecast accuracy
• Agent performance can be improved by a
combination of training and desktop
enhancements
– Increase first-call-resolution rates by
leveraging customer insight
– Decrease average handle time (AHT)
– Reduce agent/manager turnover rates
– Increase speed to rep proficiency and
reduce training cost
– Eliminate rework and repetition necessary
to support content requirements
– Skill-based routing
• Use technology to minimize the redundant data
and auto-navigate the applications that agents
must use to serve customers
• Off-shore call center vendor management
• Reduce vendor costs: consolidating vendors to
drive better pricing; increasing offshore mix as
skills increase; shifting greater portion of calls to
external agents leveraging reduced vendor cost
• Streamline processes in centers by focusing on
key cost drivers (e.g., AHT, Done rate)
• Reduce inefficiency with higher occupancy
• CTI for lower customer recognition time
• Workflow management
• IVR and Browsing history management
At one telecom provider:
• 20% AHT reduction
• Rep retention improved from 60%-100% in
1st month
• Double rate of productivity
• Reduced training time by 50%
• Improved average work time by 4-7%
• Improved 1st call resolution by 6%
• Improved quality scores by 11%
• Improved customer satisfaction by 5%
• Improved employee satisfaction by 27%
• BellSouth - 20% decrease in AHT and a
25% increase in revenue/call
• POPCORN
• H3G
• Telecom Italia
• British Telecom: Initial training time reduced
from months to weeks
• Cingular: Initial training time reduced by
50% and time to proficiency reduced from 6
weeks to 5 days
• Turnover 15%
• First call resolution 85%
• Supervisor/Agent ratio
15/1
• New hire training hours
100 hours
• Blocked calls <0.5%
• Average speed to answer
20 seconds
• Average time to abandon
45 seconds
• Occupancy 80%
• Adherence 95%
• Calls resulting in complaint
< 1%
• AHT
• Time to proficiency
10
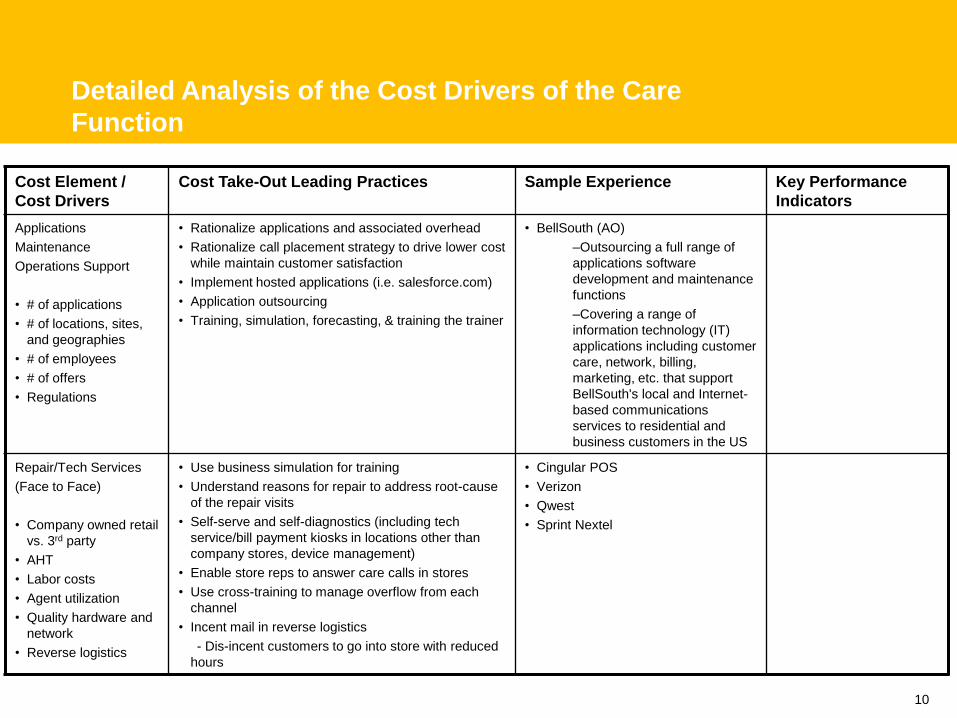
Detailed Analysis of the Cost Drivers of the Care
Function
Cost Element /
Cost Drivers
Cost Take-Out Leading Practices Sample Experience Key Performance
Indicators
Applications
Maintenance
Operations Support
• # of applications
• # of locations, sites,
and geographies
• # of employees
• # of offers
• Regulations
• Rationalize applications and associated overhead
• Rationalize call placement strategy to drive lower cost
while maintain customer satisfaction
• Implement hosted applications (i.e. salesforce.com)
• Application outsourcing
• Training, simulation, forecasting, & training the trainer
• BellSouth (AO)
–Outsourcing a full range of
applications software
development and maintenance
functions
–Covering a range of
information technology (IT)
applications including customer
care, network, billing,
marketing, etc. that support
BellSouth's local and Internet-
based communications
services to residential and
business customers in the US
Repair/Tech Services
(Face to Face)
• Company owned retail
vs. 3rd party
• AHT
• Labor costs
• Agent utilization
• Quality hardware and
network
• Reverse logistics
• Use business simulation for training
• Understand reasons for repair to address root-cause
of the repair visits
• Self-serve and self-diagnostics (including tech
service/bill payment kiosks in locations other than
company stores, device management)
• Enable store reps to answer care calls in stores
• Use cross-training to manage overflow from each
channel
• Incent mail in reverse logistics
- Dis-incent customers to go into store with reduced
hours
• Cingular POS
• Verizon
• Qwest
• Sprint Nextel

11
Detailed Analysis of the Cost Drivers of the Care
Function
Cost Element /
Cost Drivers
Cost Take-Out Leading Practices Sample Experience Key Performance
Indicators
eMail (agent handled)
• # of contacts
• AHT
• Labor cost
• Agent utilization
• Service level
• Auto suggestion
settings
• Auto routing
• High propensity to outsource (no accent issues,
language barriers, or time zone issues; easily
distributed, natural filler work, non-real-time)
• Cross-train and gain efficiency through tools
• Use insight to achieve higher first contact resolution
%s
• Implement efficiency tools (i.e., agent can type
question into web or knowledge base to get pre-
scanned answers automatically sent back to
customers)
• Customer enabled case creation
• Earthlink
• H3G
• Telecom Italia
eChat
• Number of contacts
• AHT
• Labor cost
• Agent utilization
• Cross-train
• Abandon rates
• Simultaneous chats
• High propensity to outsource (no accent issues,
language barriers, or time zone issues; easily
distributed, natural filler work, non-real-time)
• Cross-train and gain efficiency through tools
• Use insight to achieve higher first contact resolution
%s
• Implement efficiency tools (i.e., agent can type
question into web or knowledge base to get pre-
canned answers automatically sent back to
customers)
• Intelligent routing
• Page pushing and collaboration tools
• Customer enabled case creation
• AOL eChat
– Workforce management not to
exceed two simultaneous chats
– Reduce chat volume and volume
to contact center
– Reduce billing contacts
redirected to phone
– Implemented frequently used
sayings

12
The Billing function encompasses the systems
and operations responsible for physical and
electronic processing, presentment and payment
— Definition —
• Billing Systems
– Biller
– Message Processing Systems
– EBPP Systems
– Remittance Processing Systems
– Management Systems
• Billing Operations
– Return Mail
– Message Processing
– Bill Rendering
– Billing Support Centers
– Remittance Processing/ Cash Application
• Printed Bill costs
– Include mail, presentment, and postage
• Greater complexity of voice services, data services and handsets making billing more complex
• Billing accuracy is a key element of the CRM cost structure
– 30-40% of customer care calls are related to billing
• Adoption of EBPP/ABP will significantly impact the billing cost structure
– By 2010, 52% of online households will pay bills online: a five-year increase of 75% from 2005. This amounts to over 47 million households in the US alone (Forrester Forecast)
– The average large company sending invoices to consumers via e-billing can save about 55 cents per invoice (Gartner)
• Greater integration between CRM, EBPP, and web-based self-service
• In software, shift from customized to standardized solutions, elimination of distinction between prepaid and postpaid customers, and increasing scope of functionality along value chain
• Billing accuracy
• # of bill cycles
• # of customers
• # of instances
• EBPP utilization
• Platform integration
• Electronic processing utilization
Billing includes: Key Cost KPIs:
CCPU – Billing
• Credit & Collections
– Quality level of credit approvals directly
impact Net Bad Debt
• Sales Operations
– Postpaid vs prepaid mix each have a
different billing cost structure
• Retention / Marketing
– Incentives (discounts) can complicate
Billing calculations and processing
– New product definitions and customer
plans require re-configuring processes to
ensure accurate billing
— Cost Reduction Trends —
— Functional Interdependencies —
13
• # of applications
• # of instances
• # of physical and logical markets
• # of bill cycles
• Complexity of architecture
• # /mix locations/sites/geographies
• # of employees:
• Testing and defect solving (H3G)
• CRM – Billing systems alignment
• # or % manual processing /automated
calculation processing
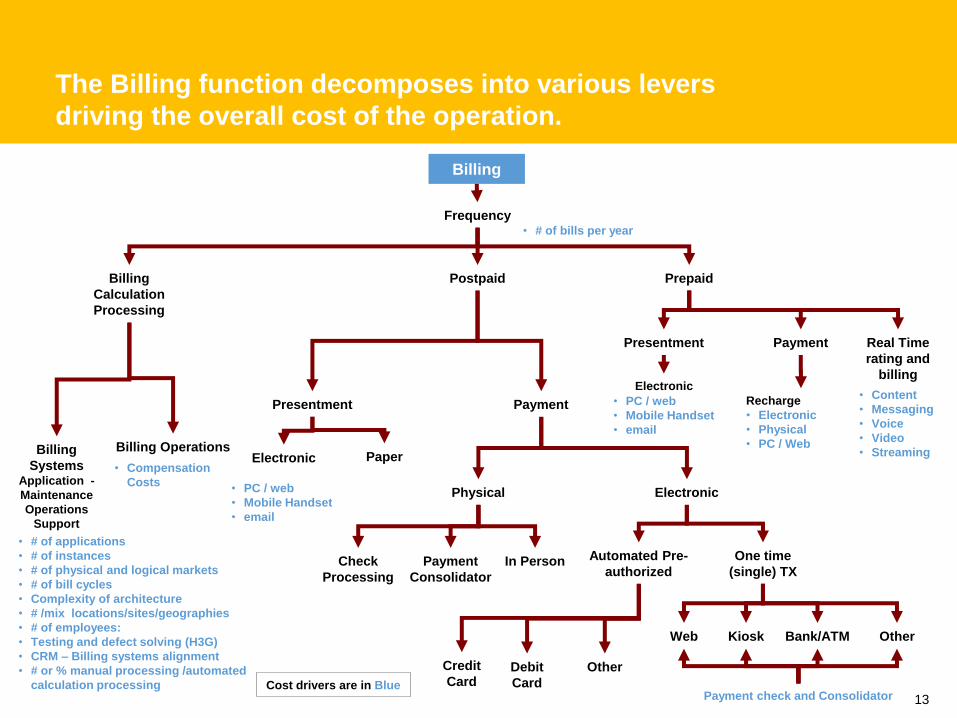
The Billing function decomposes into various levers
driving the overall cost of the operation.
Billing
Frequency
Billing
Calculation
Processing
Billing
Systems Application -
Maintenance
Operations
Support
Billing Operations
Presentment
Electronic Paper
Payment
Physical Electronic
Automated Pre-
authorized
One time
(single) TXIn PersonPayment
Consolidator
Check
Processing
• # of bills per year
• PC / web
• Mobile Handset
• Compensation
Costs
Postpaid Prepaid
PaymentPresentment Real Time
rating and
billing
• Content
• Messaging
• Voice
• Video
• Streaming
Recharge
• Electronic
• Physical
• PC / Web
OtherDebit
Card
Credit
Card
Web Kiosk Bank/ATM Other
Payment check and Consolidator
• PC / web
• Mobile Handset
Electronic
Cost drivers are in Blue

14
Detailed Analysis of the Cost Drivers of the Billing
Function
Cost Element /
Cost Drivers
Cost Take-Out Leading Practices Sample Experience Key Performance
Indicators
Frequency
• # of billing cycles
• # of customers
• Bill cycle optimization - trade off costs with increased load
to customer service and flexibility requirements with
customers
• Bill market optimization - trade off # of instances with IT
capacity, # of cycles, and market demands
• Balance the cost of bill creation and remittance processing
with impact on cash flow
• Potential impact: 50 FTEs
• Cingular cycle optimization
• WIND - implemented CSG/BP
real-time billing platform that
calculates rates and issues
bills for all services (mobile,
wireline, internet)
Application
Maintenance
Operations Support
• # of applications
• # of instances
• # of physical and
logical markets
• Complexity of
architecture
• # /mix
locations/sites/geogr
aphies
• # of employees
• Software
Development
Lifecycle
• Develop application architecture and design that aligns to
business strategy of optimal billing cycles and instances
• Application rationalization by finding synergies and
eliminating HW / SW through conversions and archiving
• Consolidate application software providers to reduce
diversity of applications and associated costs such as IT
maintenance and supporting headcount
• Develop business organization strategy for physical and
logical markets based on customer demand
• Storage rationalization to effectively optimize across
storage hardware
• Create application layer to get any data, any time,
anywhere to increase effectiveness of reporting
- Elimination of duplicate data
- Drive self service reporting
- Effective access to information reduces development
costs
• Data warehousing
• Albacom Billing Application
Maintenance - reduction of
billing backlog; ability to face
current growth; operation costs
optimization; treasury
optimization
• BellSouth
• ATL
• Cingular Billing Consolidation

15
Cost Element /
Cost Drivers
Cost Take-Out Leading
Practices
Sample Experience Key Performance
Indicators
Billing operations
• # of bill cycles
• Compensation
Costs
• # of employees
• Data retention and
archiving
• Software
Development
Lifecycle efficiency
• Technology
infrastrucutre
• PPE, power, etc..
• # of customers
• Assess SDLC to find gaps in efficiency
of doing development and testing
before production
• Organization workforce optimization to
align to future processes and # of bill
cycles
• Conduct process assessment for the
cost to automate vs headcount costs
for manual functions
• Design organization structure to
support 'to be' process which depends
on other CRM decisions such as rate
plans and data retention strategy
• Outsourcing to a third party is one
highly effective option to transform
billing operations:
- Third party services provider assumes
responsibility for operational functions
and improve performance through
business process realignment
initiatives
- Services provider guarantees
business results that address wireless
carrier’s specific needs
- Blended workforce of offshore /
onshore mix
• US Wireless provider recovered/accelerated a
significant amount of revenue
- Recovered billable Call Detail Records (CDRs):
US$90-110k per month
- 20-25% fewer CDR errors daily: US$960k per
month
- Improved CDR error correction: US$270-290k
per month
- Reduced backlog of rejected invoices: US$6-7m
• Malaysian mobile service operator retail/customer
billing project involved bottom line revenue
recovery and increased operational efficiency
– Revenue recovery through billing of 4m error
CDRs (worth about RM2 million) after 2 months
and subsequently timely resolution of ongoing
CDR errors
• Malaysian mobile service operator interconnect
billing project delivered
- Improved ICS revenue billed (revenue recovery)
by >30%
- Reduction in interconnect cost (over-charging
by other Telcos) by more than 5%
- Increased system performance and efficiency
(reduced processing time by >50%
Detailed Analysis of the Cost Drivers of the Billing
Function

16
Cost Element /
Cost Drivers
Cost Take-Out Leading Practices Sample Experience Key Performance
Indicators
Electronic
Presentment
• Cost to provide
through: PC,
Mobile handset,
• Kiosks in stores
• Connectivity
• Support for HW /
SW maintenance
• A key differentiator will be providing incentive to eliminate paper
bills, otherwise benefit of electronic enablement will not be fully
realized
• Enable EBPP/ABP as the primary presentment and payment
channel for select customer segments.
• Drive adoption by incorporating and marketing EBPP as an
element of select offers (e.g. DSL).
• Partner with banks and other consolidators to co-market ABP
capabilities.
• Utilize leading software platforms and service provider
capabilities to accelerate capability development. Top EBPP
vendors include: Checkfree (BlueGill), Avolent (Just in Time),
eDocs (owned by Oracle)
• Reduce costs by shifting to a service provider (ASP model) to
leverage the provider’s economies of scale.
• Tightly integrate with the broader eCRM and traditional customer
operations capabilities to maintain an integrated customer
experience:
- Tightly integrate with eCare offers to manage Bill Inquiry
through the electronic channel
- Tightly integrate with eSales offer to upsell and cross-sell
through the electronic channel
• Drive customer adoption to the lower cost ABP channel by
incorporating electronic payment mechanisms in select offers.
• Utilize payment processing gateways to enable on-line payment.
- For global needs, focus on foreign-currency support
capabilities of leading vendors
• H3G EBP- built and delivered
EBP system in Sweden with
optimized invoicing database
• Cesky Telecom – required by
government to provide bill
over the Internet, developed
custom solution based on
J2EE technologies and
developed interfaces in
Ensemble, Geneva, and
Siebel
• Telenor – EBPP and
customer letter
• Verizon Advanced Data eBill
– developed, and operated an
end-to-end billing, taxation,
EBP, and dispute
reconciliation for host ISP
account
- Reduced average customer
balance outstanding from 90
to 33 days
• - Average receivables aging
>60 days reduced from 85%
to 8%
• - Cost of billing and
settlements per subscriber
<$0.15 per subscriber
Detailed Analysis of the Cost Drivers of the Billing
Function

17
Cost Element /
Cost Drivers
Cost Take-Out Leading Practices Sample
Experience
Key Performance
Indicators
Paper
Presentment
• # customers that
receive paper bill
• Print operations
• Postage scale
• Consolidate/outsource bill print operations contracts to scale-based
providers to optimize unit cost and secure variable pricing
- Utilize the highly specialized, non-occupational workforce of most
outsourcers
- Implement variable pricing that outsourcers can secure with their
vendors (e.g., high-speed printer manufacturers)
- Lock in contracted bill print rates for the life of the contract
• Postage consolidation to negotiate a preferential postage rate through
scale
• Optimize the invoice layout to balance bill clarity with consumption of
space to reduce paper and postage costs
• Utilize color print on the invoice to reduce the number of bill inquiries
Revenue uplift
• Take advantage of the physical interaction with customer for advertising
purposes.
• Leverage insight driven messaging for uplift
Detailed Analysis of the Cost Drivers of the Billing
Function
18
Cost Element /
Cost Drivers
Cost Take-Out Leading Practices Sample
Experience
Key Performance
Indicators
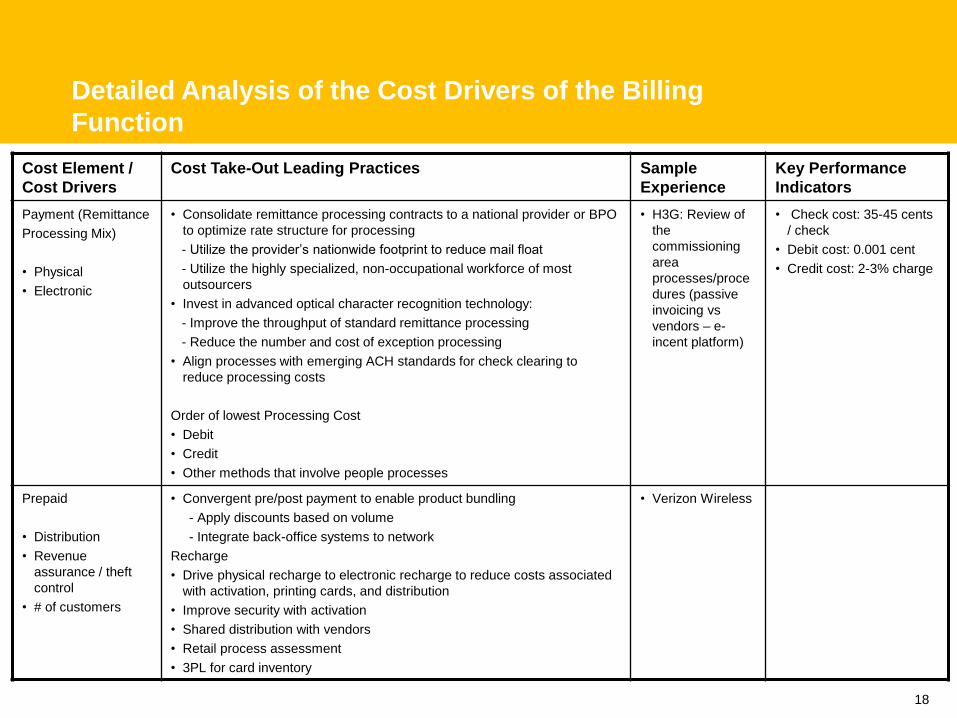
Payment (Remittance
Processing Mix)
• Physical
• Electronic
• Consolidate remittance processing contracts to a national provider or BPO
to optimize rate structure for processing
- Utilize the provider’s nationwide footprint to reduce mail float
- Utilize the highly specialized, non-occupational workforce of most
outsourcers
• Invest in advanced optical character recognition technology:
- Improve the throughput of standard remittance processing
- Reduce the number and cost of exception processing
• Align processes with emerging ACH standards for check clearing to
reduce processing costs
Order of lowest Processing Cost
• Debit
• Credit
• Other methods that involve people processes
• H3G: Review of
the
commissioning
area
processes/proce
dures (passive
invoicing vs
vendors – e-
incent platform)
• Check cost: 35-45 cents
/ check
• Debit cost: 0.001 cent
• Credit cost: 2-3% charge
Prepaid
• Distribution
• Revenue
assurance / theft
control
• # of customers
• Convergent pre/post payment to enable product bundling
- Apply discounts based on volume
- Integrate back-office systems to network
Recharge
• Drive physical recharge to electronic recharge to reduce costs associated
with activation, printing cards, and distribution
• Improve security with activation
• Shared distribution with vendors
• Retail process assessment
• 3PL for card inventory
• Verizon Wireless
Detailed Analysis of the Cost Drivers of the Billing
Function
19
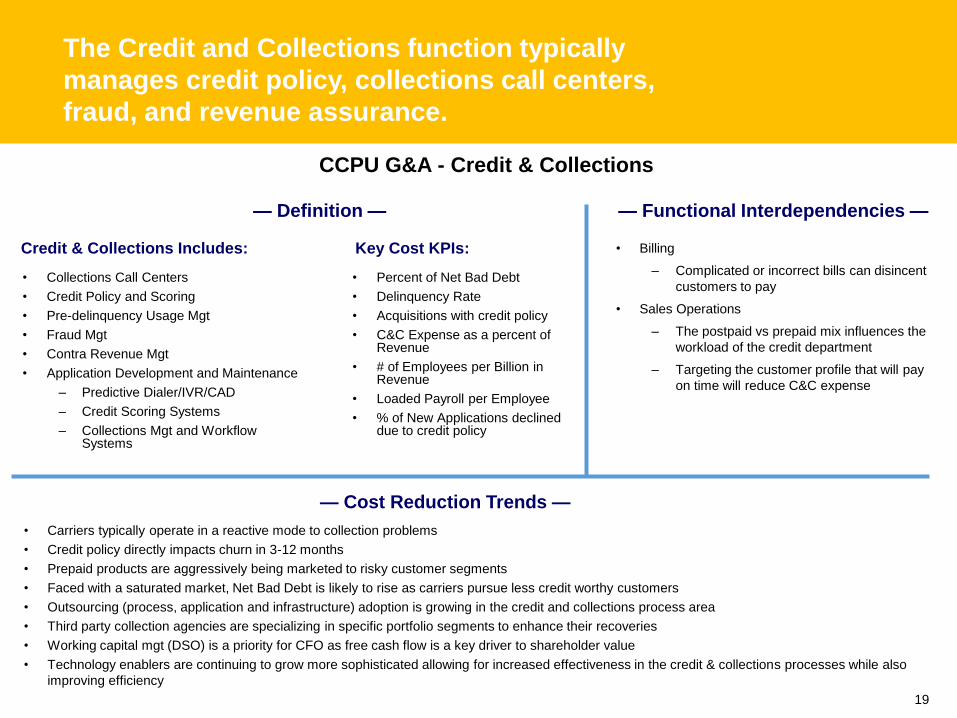
The Credit and Collections function typically
manages credit policy, collections call centers,
fraud, and revenue assurance.
— Definition —
• Collections Call Centers
• Credit Policy and Scoring
• Pre-delinquency Usage Mgt
• Fraud Mgt
• Contra Revenue Mgt
• Application Development and Maintenance
– Predictive Dialer/IVR/CAD
– Credit Scoring Systems
– Collections Mgt and Workflow Systems
• Carriers typically operate in a reactive mode to collection problems
• Credit policy directly impacts churn in 3-12 months
• Prepaid products are aggressively being marketed to risky customer segments
• Faced with a saturated market, Net Bad Debt is likely to rise as carriers pursue less credit worthy customers
• Outsourcing (process, application and infrastructure) adoption is growing in the credit and collections process area
• Third party collection agencies are specializing in specific portfolio segments to enhance their recoveries
• Working capital mgt (DSO) is a priority for CFO as free cash flow is a key driver to shareholder value
• Technology enablers are continuing to grow more sophisticated allowing for increased effectiveness in the credit & collections processes while also
improving efficiency
• Percent of Net Bad Debt
• Delinquency Rate
• Acquisitions with credit policy
• C&C Expense as a percent of Revenue
• # of Employees per Billion in Revenue
• Loaded Payroll per Employee
• % of New Applications declined due to credit policy
Credit & Collections Includes: Key Cost KPIs:
CCPU G&A - Credit & Collections
• Billing
– Complicated or incorrect bills can disincent
customers to pay
• Sales Operations
– The postpaid vs prepaid mix influences the
workload of the credit department
– Targeting the customer profile that will pay
on time will reduce C&C expense
— Cost Reduction Trends —
— Functional Interdependencies —
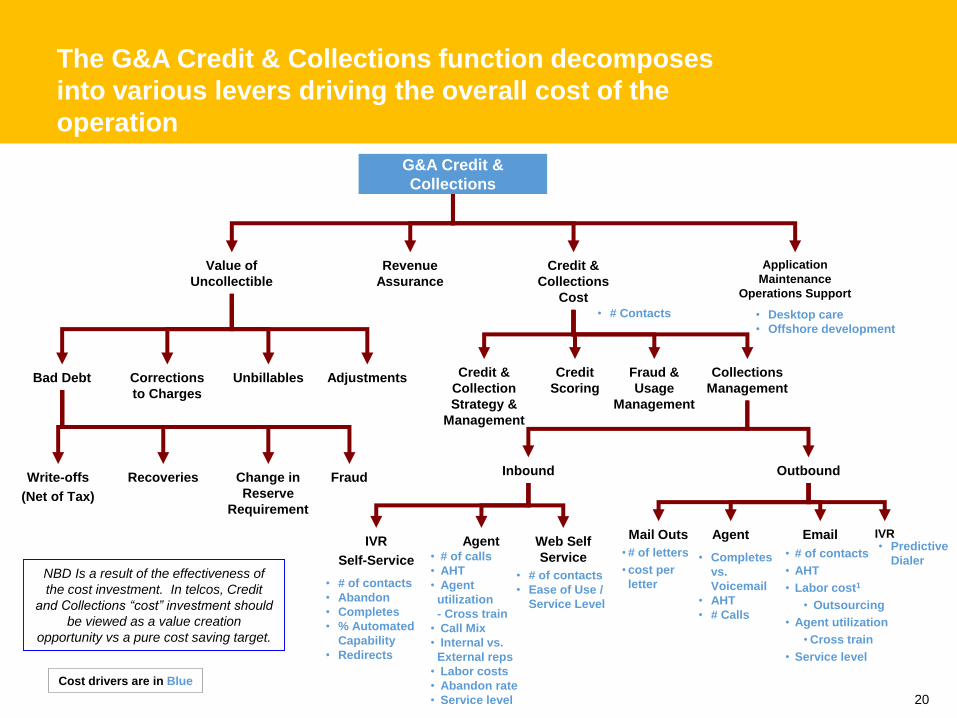
20
G&A Credit &
Collections
Application
Maintenance
Operations Support
Credit &
Collections
Cost
The G&A Credit & Collections function decomposes
into various levers driving the overall cost of the
operation
Value of
Uncollectible
Bad Debt Credit
ScoringAdjustments
Inbound
IVR
Self-Service
Agent• # of calls
• AHT
• Agent
utilization
- Cross train
• Call Mix
• Internal vs.
External reps
• Labor costs
• Abandon rate
• Service level
Outbound
Mail Outs
• # of letters
• cost per
letter
Agent
• # of contacts
• Abandon
• Completes
• % Automated
Capability
• Redirects
• Completes
vs.
Voicemail
• AHT
• # Calls
• # Contacts • Desktop care
• Offshore development
Credit &
Collection
Strategy &
Management
Fraud &
Usage
Management
Collections
ManagementCorrections
to Charges
Unbillables
Write-offs
(Net of Tax)
Recoveries Change in
Reserve
Requirement
Fraud
Revenue
Assurance
NBD Is a result of the effectiveness of
the cost investment. In telcos, Credit
and Collections “cost” investment should
be viewed as a value creation
opportunity vs a pure cost saving target.
Web Self
Service
• # of contacts
• Ease of Use /
Service Level
Email IVR
• # of contacts
• AHT
• Labor cost1
• Outsourcing
• Agent utilization
• Cross train
• Service level
• Predictive
Dialer
Cost drivers are in Blue

21
Detailed Analysis of the Cost Drivers of the Credit
& Collections Function
Cost Element /
Cost Drivers
Cost Take-Out Leading
Practices
Sample Experience Key Performance
Indicators
Credit and
Collections
Strategy and Mgt
• Overall strategy
• FTEs
• Overall portfolio
performance
• Optimize the strategy of the Credit
and Collection Processes to
improve effectiveness and
efficiencies while driving bottom
line EBIT improvement
• Increase span of control to
leadership team to drive down
headcount
• Create value with management
team by focusing on effectiveness
and efficiency
• German Wireless Provider -- consolidated financial
operations into two centers
– Over $40m of receivables collected and Days Sales
Outstanding (DSO) reduced by 30% within the first year
– AR payback in 14 months
– Project savings: $144.7m from the Go-To-Market
proposition and $20.3m royalty payments
• SBC: Advanced Collections Environment - Defined future
operating environment for the C&C function
• North-American wireless company received a list of 35
improvement opportunities - a 10% reduction in workforce
• US Based Telecom - Identified and defined DSO reduction
opportunities of 10%-15%, resulting in an annual savings of
approximately $25m by improving invoicing cycle review
• NBD
• Cost per Customer
• Cost per Dollar
Collected
• AR as a % of Sales
• DSO
Credit Scoring
• Cost of scores/ risk
data
• Effectiveness of
data usage
• Supporting
technology
enablers
• Optimize the use of credit and
related capabilities to effectively
manage the risk of delinquent
payment and write-off
• Reduce cost per score by moving
from a multi-bureau to a single
bureau
• Identify repetitive debtor to
minimize credit scoring required
• Optimize the number of accounts
outside the credit agency
• Increase percentage of prepaid/risk
mitigating customers
• Cost per Score
• Effectiveness of the
scoring model
• Repetitive debtor
identification ratio
• Number of accounts
outside desired credit
tolerances
• Acceptance percentage
of prepaid/risk mitigating
offers

22
Detailed Analysis of the Cost Drivers of the Credit
& Collections Function
Cost Element /
Cost Drivers
Cost Take-Out Leading
Practices
Sample Experience Key Performance
Indicators
Fraud and Usage
Management
• Fraud
• Revenue leakage
• Usage levels
• Supporting technology
enablers
• Fraud mitigation and usage
monitoring and management
capabilties
• Implement a skip tracing
solution
• Implement fraud modelling
techniques to increase early
detection
• Implement limit and usage
management techniques, such
as prepaid accounts
• Malaysian mobile service operator stabilized and operated
day-to-day Fraud Management Operations
- Detected mobile prepaid fraud cases by internal staff
with revenue loss of more than RM10m per year
- Achieved post fraud savings of about RM33m per year
(reduced the RM exposure per fraudulent account by
more than 75%)
• Fraud component of NBD
• Unbilled/Unbillable
revenue
• "Never Pay Accounts &
Dollars as a % of Write-
offs
• Avg Balance per Never
Pay Account
Collections Management
• Collector sourcing
• Workplace location
• Method on contact -
inbound and outbound
• First party vs third
party performance
• Supporting technology
enablers
• Effectively balance the
investment in operating expense
to improve efficiencies while
improving the effectiveness of
the collections management
processes
• In most cases collections
effectiveness should be focused
on as a priority to drive reduced
NBD, customer churn, DSO
reduction, improve revenue and
reduce credit risk/fraud
• US-based Global Telecoms Provider -- Business Process
Outsourcing delivered 40% reduction in operating costs
– Collected over $60m in overdue receivables
– Reduced Days Sales Outstanding by 30% in the first
four months and sustained the improved DSO
– Consistent achievement of 99% service levels on
accuracy of cash processing and resolution of
misapplied payments prior to next invoice cycle
• German Wireless Provider
– Consolidate financial operations into two centers
– Over $40m of receivables collected and DSO reduced
by 30% within the first year
– AR payback in 14 months
– Project savings: $144.7m from the Go-To-Market
proposition and $20.3m royalty payments
• Inbound/outbound calls
per collector
Average handle and
answer time
• IVR completion
percentage

23
Detailed Analysis of the Cost Drivers of the Credit
& Collections Function
Cost Element /
Cost Drivers
Cost Take-Out
Leading Practices
Sample Experience Key Performance
Indicators
Net Bad Debt (NBD)
• Write-offs (net of
tax)
• Recoveries
• Change in reserve
requirements
• Affiliate allocation
• Driving efficiency and
effectiveness into the
strategy, credit scoring,
fraud, usage mgt and
collection management
processes will yield
improvements in NBD
• North-America-Based Wireless Company
– Identified opportunities provided a 3-year reduction in NBD
and DSO of over $40m
• US-based telecoms company received deliverables outlining
initiatives estimated to provide annual benefits of $118-189m
– Identified and defined Net Bad Debt reduction opportunities
of 7%-10%, resulting in a annual savings of approximately
$64m
– Identified and defined operating expense reduction
opportunities of 8%-18%, resulting in an annual savings of
approximately $26m
– Annual margin lift of $10-20m
• Major European Wireless Operator received bad debt
management assistance leading to >30% increase in the bad
debt amount collected after the roll-out of the new bad debt
capability
• Written Off Accounts as a
% of total accounts
• Average Balance per
Write-off Account
• Average Tenure of Written
off accounts
Application
Development &
Maintenance
• Desktop applications
• Development
sourcing
• Supporting
technology enablers
• Optimize the technology
enablers supporting the
credit and collections
processes
• Outsource to a lower cost
location
• Disparate, common
shared systems
• Implement hosting
solutions where applicable
• North-America-Based Wireless Company
– Installed treatment optimization modifications expected to
increase dollars collected by 10%

24
Detailed Analysis of the Cost Drivers of the Credit
& Collections Function
Cost Element /
Cost Drivers
Cost Take-Out
Leading Practices
Sample Experience Key Performance
Indicators
Revenue
Assurance
• Revenue
leakage
• Number of
personnel
• Level of system
complexity
• Level of control
• Number of
manual
processes
• Optimize the
processes around
revenue reporting
and reduce the
process cost to
achieve the same or
better results
• Implement an
integrated order 2
cash end-to-end
process with
appropriate
supporting people,
process, and
technology
• US Wireless Provider
– Identified out-collect file processing gaps : US$3-
4m
• US Based Telecom
– Identified Contra-Revenue reduction opportunity
of 7%-10%, resulting in an annual savings of
approximately $24m
• US wireless joint-venture developed airtime RA
process flows, control points and business
requirements as well as detailed procedures for
reconciling third party vendor bills
– US$1500 per month benefit achieved by adding
rigor to the process of reconciling third party
provider bills
• North American Based Telecom (Bell Canada)
– Received a list of 35 improvement opportunities
– Identified opportunities provided a 3-year
reduction in NBD and DSO of over $40M and a
10% reduction in workforce

25
NOTE: (1) Internal voice and data network used to support company operations only -- does not include core wireless network used to transport customer voice and data traffic
Information Technology includes all relevant labor,
software, hardware, network communications, and
facilities expenditures supporting wireless operations
• Percent on time delivery
• % in Budget delivery
• Average cost / person
• Mean time to repair
• Availability
In Scope: Key Cost KPIs:
CCPU G&A - Information Technology
• Labor – internal and external (contract
labor / external service providers)
Scope includes the following expenses
required to support Application Development
/ Maintenance and Production / Operations,
IT Management, IT Strategy and Account
Management.
• Increased pressure on IT to respond to rapidly changing business needs related to supporting more products, bundles (ordering / billing / product dev/intro), customer targeting, digital rights management
– Wireline: IPTV, VoIP
– Wireless: High speed data, music, gaming
• Business moving to simplify / rationalize product structure as new products come on-line
• The entry of new, lower cost players (VoIP, Wireless (including slim MVNOs and UMTS pure-plays) putting pressure on incumbents with expensive imbedded base to consolidate
– Wireline / wireless mergers in Europe– Rural “pure play” consolidation in US
• IT looking to upgrade primary legacy applications to IP-centric, COTS for Next-Gen billing, ordering, provisioning, etc.
• Renewed focus on “speed to market” within IT leading to co-sourcing, transformation of development capabilities
• Application architecture simplification / rationalization to increase responsiveness to business changes
• Application / infrastructure consolidation and rationalization post-merger / acquisition
• Software – Licenses,
maintenance expense, one time
fees, amortization/depreciation
(applications and operating
systems)
• Hardware – Leases and
maintenance fees for desktops,
servers, storage, and peripheral
• Network/Communications 1
– Voice and Data
• Facilities
• Other (e.g. one-time M&A
costs)
— Definition —
— Cost Trends — — IT Response —

26
The G&A Information Technology function
decomposes into various levers driving the overall
cost of the operation
G&A IT
Application
Development &
Maintenance 1
Production
Operations
IT Operations
(OpEx)
New Investment
(CapEx)
NOTES: (1) Includes all Development and Testing activities; (2) Includes Facilities and other one-time expenses (e.g. M&A costs); (3) Internal voice
and data network used to support company operations only -- does not include core wireless network used to transport customer voice and data
traffic
Hardware
Software
People
Governance
Mainframe
Operations &
Support
Server
Operations &
Support
Network
Operations &
Support 3
Desktop & End
User Support
Out of scope
IT
AdminR&D
Architecture
Strategy
Program,
Release,
Project
Mgmt
Account
Mgmt/
Service Mgmt
Other 2
Methods /
Processes
• Hardware right sizing and consolidation
• Software rationalization, optimization
• People – pyramid, cost, structure, skills / competency
• Governance – Strategic architecture, Business Alignment, Performance Management,
Roles/Responsibilities
• Methods / Processes – Leading practices, Continuous Improvement, Commonly defined / used

27
Detailed Analysis of the Cost Drivers of the IT
Function
Cost Element /
Cost Drivers
Cost Take-Out Leading Practices Sample Experience Key Performance
Indicators
Application
Development &
Maintenance (ADM)
• People (Cost,
Structure, HP)
• Technology
(Infrastructure &
Tools)
• Methods &
Processes (Usage
& C.I.)
• Governance
(Roles/Responsibilit
y, Alignment &
Port.Mgmt, Svc.
Level Management)
• For Development or Maintenance - IT Transformation
Diagnostic / Assessment of current spend (strategic
alignment, discretionary/non-discretionary), use of process,
application portfolio, infrastructure, etc.) leading to:
1. Reduce cost through
• a. Outsourcing portions of the Production Support, Break/Fix
code, Project/Release Detailed Design, Code, Test and
Deployment tasks to lower cost offshore resources
• b. Analysis of current organization structure / pyramid and
adjusting to leading practices
• c. Application Rationalization / Optimization - Rationalize,
Consolidate and Re-platform custom, legacy software/
platforms to less costly COTS-based solutions
2. Increase productivity through:
• a. Adoption / Implementation of Project Delivery Methods
replacing current client methods
• b. Assess culture related to use of standard methods,
standard processes and operational metrics to guide
delivery excellence; implement Human Performance
Offerings / Balanced Scorecard to shift behavior to common
process and metrics-based execution.
• c. Assessment of current Development / Maintenance
related skills with recommendations to address skill issues
• d. Adoption, Institutionalized, and Industrialized "Leading
Practices" across Maintenance / Development related
Processes; e.g. Requirements Management, Project
Management, Change Management, Release Management)
• 20-30% cost reduction, 20%
increase in productivity
(Orange,UK)
• 20-30% cost reduction, 20%
productivity increase (Telefonica
Argentina)
• 10-15% cost reduction (Telus)
• 15% Cost Reduction (One2One)
• 23% savings on outsourced
labor for development /
maintenance (AT&T Consumer)
• 25-30% Cost reduction / 20%
increased productivity (KPN
Netherlands)
TYPICAL SAVINGS:
• Application Rationalization - 15-
30% cost reduction (Savings
comes from: Labor-50-
75%,Facilities 10-35%,
Hardware 0-15%, Software 0-
15%)
• ADM Outsourcing - 20-35% cost
reduction from labor savings

28
Detailed Analysis of the Cost Drivers of the IT
Function
Cost Element /
Cost Drivers
Cost Take-Out Leading
Practices
Sample Experience Key Performance
Indicators
Production Operations
• Mainframe Operations &
Support
• Server Operations & Support
• Network Operations & Support
• Desktop & End User Support-
Systems and Network Admin
(Voice and Data)
• Outsourcing - Shift portions of
operations, support, admin. through
lower cost labor
• Infrastructure Consolidation -
Rationalize, Consolidate Systems
(MF/Servers/Desktop Architecture,
Internal voice/data Network) and
associated storage, operating systems,
data bases, support staff and facilities)
• Process Optimization - Assess current
process execution vs. leading
practices; Adopt, Institutionalize, and
Industrialize ITIL based "Leading
Practices" across Operations, e.g.
Problem, Change and Configuration
Management, Vendor Management
• 50% Reduction in unplanned systems
downtime (Orange UK)
• 44% reduced downtime (Vodafone)
• 20% Reduced Operations Expense -
One2One
• 10-20% Cost Reduction from Supplier
Rationalization (One2One)
• 10-20% Cost Reduction Operations (KPN,
The Netherlands)
TYPICAL SAVINGS:
• Infrastructure Consolidation - 20-40% cost
reduction (Sys Platforms 20-35%,
Enterprise enabling infrastructure - 20-
35%, Application Enabling Infrastructure -
15-25%, Security Infrastructure - 5-10%,
Ops Management - 15-30%)
R&D & Architecture Strategy
• People (Cost, Structure, HP)
• Technology
(Infrastructure&Tools)
• Methods & Processes (Usage
& C.I.)
• Governance
(Roles/Responsibility,
Alignment&Port.Mgmt, Svc.
Level Management)
• Develop long term IT application /
infrastructure architectures and
migration planning to move to "next
generation" platforms
• Develop IT strategy, IT Organization
Design, IT Governance Design
• Telecom Italia - move to next generation
IP based platform

29
Detailed Analysis of the Cost Drivers of the IT
Function
Cost Element /
Cost Drivers
Cost Take-Out Leading
Practices
Sample Experience Key Performance
Indicators
Program, Release,
& Project Management
• People (Cost, Structure, HP)
• Technology (Infrastructure &
Tools)
• Methods & Processes (Usage
& C.I.)
• Governance (Roles/Respon,
Alignment & Port.Mgmt, Svc.
Level Management)
• Process Optimization - Institutionalize /
Industrialize "Leading Practices" within
Release Management, Program/Project
Management
• Improve skills of existing client Program
/ Project Managers
• Improved governance and tracking of
requirements change management
• Implementation of standard tools to
measure and reinforce governance,
project management, change
management processes
• Implement and integrate
supply/demand balancing and resource
management
• 20-35% increased
productivity, improved
percent of commitments
met on schedule and
increased speed of
throughput in development
center

30
Detailed Analysis of the Cost Drivers of the IT
Function
Cost Element / Cost
Drivers
Cost Take-Out Leading Practices Sample Experience Key Performance
Indicators
Account Management &
Service Management
• People (Cost, Structure,
HP)
• Technology
(Infrastructure & Tools)
• Methods & Processes
(Usage & C.I.)
• Governance
(Roles/Responsibility,
Alignment&Port.Mgmt,
Svc. Level Management)
• Define IT Services, service levels and costs
associated with differentiated service levels
• Implement Demand Management processes to
control levels of low value / non -strategic
discretionary spend
• Service Level Management, Account
Management, Project Initiation)
• Refine and Implement rigorous governance
related to change management
• 25-30% Cost Reduction / 20%
increased productivity - KPN, The
Netherlands
TYPICAL SAVINGS:
• Demand Management / Resource
Management: Up to 20% budget
reduction from increased
workforce utilization
IT Management (CIO, HR,
Finance, Risk Mgt)
• People (Cost, Structure,
HP)
• Technology
(Infrastructure & Tools)
• Methods & Processes
(Usage & C.I.)
• Governance
(Roles/Responsibility,
Alignment&Port.Mgmt,
Svc. Level Management)
• IT Transformation Assessment re:-
• HR: hiring / retention / human performance /
training / career path development aligned to IT
Strategy, Resource Management, Demand
Management and sourcing
• Performance Management - Implementation of
"Leading Processes" and automation for a
balanced scorecard using integrated tools for
cost accounting, time reporting, charge back
mechanisms, performance reporting, etc.
• Vendor / Supplier Management - Consolidation of
number of suppliers/vendors and contracts to
leverage discounts, improve service levels and
reduce management expense

31
HR and Benefits Administration
• Companies are moving to outsource non-core HR transactional activities utilizing a shared service approach. Processes usually performed in a shared service model include: Recruiting, Staffing, Performance Management, Compensation, Benefits, and Payroll.
• Internal HR resources now focus on areas with huge business impact: Human Capital Strategy, Leadership, Employee Engagement, Talent Management, Workforce Performance and Knowledge Management.
Training
• Sales, Marketing, and Customer Care agents require continual training as product lines and complexity increase
• Integrating Workplace Performance Solutions which continually keep employees engaged and up-to-speed on products, service, and issues by using learning “nuggets” is a key trend.
Human Resources includes both core HR company-
wide processes such as benefits admin, and HR
processes in specific functional areas such as
retention and training
— Definition —
•Staffing and Support
– Employee Lifecycle: Recruiting, hiring, talent management, staffing, exiting, and alumni relations; Employee performance evaluation/management; Maintenance of employee information; Compensation & Benefits; Time & Attendance; Payroll
•Employee Management & Relations
– Employee communications; Grievance management; Employee services; Disciplinary activities
•Training, Development, and Knowledge Management (Internal)
– Development and delivery including online, instructor-led, and virtual aimed at employee development
– Knowledge Management
•Customer/Channel Partner Training
– Development and delivery including online, instructor-led, and virtual aimed at customer/partner development
•Vendor Management
•Application Development and Maintenance
– HR, Training, Benefits Administration, and KM Systems
• Cost of employee acquisition
• HR cost per employee served
• Cost of training each employee (time & expense to reach competency)
• Retention Rate of Key Talent
HR Includes: Key Cost KPIs:
CCPU G&A - Human Resources
• Care
– Labor issues (e.g., union) can strain the HR lifecycle management
– Offshore/Onshore Blend will affect HR support costs
• Marketing
– Rate of growth and new product introduction will affect hiring and training needs
• Sales Operations
– Proliferation of Outlets (Retail & Direct to Corporate) can increase HR expense and management required
— Cost Reduction Trends —
— Functional Interdependencies —

32
The G&A Human Resource function decomposes
into various levers driving the overall cost of the
operation
Risk
Management
Staffing &
Support
Training
Internal
Training
Customer/ Channel
Partner Training
Application
Development
& Maintenance
Benefits
Administration
G&A HR
- Training costs are part of loaded employee costs in each of the functional areas
• Desktop care
• HR ERP Solution
• Web-based Self-
Service
• Training Delivery
Technologies
• Learning
Management
System
• Performance
Workspace
Solutions
• % of Offshore
Development
• Talent Pipeline
Efficiency
• Retention
Rates
• % of
transactions
through self
service
• % of Online
Delivery
• # of Employees
• Retention Rate
• Time to Proficiency
• % of Online
Delivery
• # of Learners
• Sessions per Year
• Time to Proficiency
• % of Online
Delivery
• # of Learners
• Sessions per Year
• Time to Proficiency
• # of HR
Cases
Escalated
Cost drivers are in Blue

33
Detailed Analysis of the Cost Drivers of the HR
Function
Cost Element /
Cost Drivers
Cost Take-Out Leading Practices Sample Experience Key Performance
Indicators
Staffing / Recruitment
• # Employees
• Retention Rate
• Growth Rate of Employee
Base
• Employee Segmentation
(locations, states,
countries)
• Frequency of Employee
Evaluation
• # of HRIS/ERP Systems
of Record
• Decrease cost to serve through the following
functions:
–Employee lifecycle: Recruiting, hiring, talent
mgt, staffing, exiting, and alumni relations
–Performance evaluation/management
–Maintenance of employee information
–Compensation & Benefit
–Time & Attendance
–Payroll
• Improve % of HR transactions that self served
• Decrease # of HR case escalation through
effective HR lifecycle management
• Achieve wage arbitrage and economies of scale
through global, multi-client service centers
• Standardize processes across areas, consolidate
vendors, and integrate with upstream and
downstream legacy systems
• Utilize the web to streamline benefits admin
• Seagate Technology LLC (Oracle HRMS)
–Improved employee productivity and
retention
–Reduced administrative/transactional HR
headcount by 30%
–Lowered HR transactional costs
–Increased global HR standardisation and
consistency
–Enhanced HR strategic focus and alignment
–Improved customer satisfaction with HR by
20%
–Reduced hiring costs and training/learning
costs
–Faster access to employee data
–Elimination of dual data entry
• Leading International Financial Services
Company (in-house HR Shared Services
implementation)
–4.5M HR cost reduction in one year
–reduced average costs per HR transaction
by 60%
– reduced number of processes by 40%;
–increased employee satisfaction by 50%
• Cost to serve per employee
• % of HR transactions that
are self-serviced
• Number of HR case
escalations
• Employee satisfaction
Employee Relations
• Employee #s
• Time to Competency by
Role
• Amount of Re-Training
required
• Cost of Delivery by
Medium (ILT vs online)
Costs to communicate and serve employees
includes: Employee communications, Grievance
management, Employee services, Disciplinary
activities, The number of "services" supplied to
employees (i.e. LifeWorks programs) will drive costs.
Also, process efficiency around disciplinary action
will also drive effectiveness.
• BT (Central helpdesk facility/web-based
solutions to deliver safety awareness)
– Absence reduced by 20%
• Number of employee
disciplinary cases
• Use of EAP programs per
1000 employees
• Communication Budget per
employee

34
Detailed Analysis of the Cost Drivers of the HR
Function
Cost Element / Cost
Drivers
Cost Take-Out Leading Practices Sample Experience Key Performance
Indicators
Training & Development
• Employee #s
• Time to Competency by
Role
• Amount of Re-Training
required
• Cost of Delivery by
Medium (ILT vs online)
• Create a rapidly scalable, customizable, and
low-cost means to develop and deliver training
to employees, channel partners and end
customers
• Consolidate and evaluate vendors for content
development and delivery.
• Incorporate strategic alignment and business
insight to better target content development
gaps
• Transform and shift instructor led course media
to less expensive, eLearning platforms
• Implement just-in-time embedded learning at
your desktop (real-time delivery of nuggets)
• Incorporate partner/customer insight to better
target content development and provide “just-in-
time” training.
• Deploy Knowledge Bases
• Ayava (centralization of admin to
Service Center)
– 30% reduction in training costs
• Training Costs per employee
• Number of employee
disciplinary cases
• Use of EAP programs per
1000 employees
• Communication Budget per
employee
Customer / Channel
Partner Training
• # of Partner/ Channel
Participants &
"Learners"
• Time to Competency
• Amount of Face Time
with each "Learner"
• BT (HRO)
– Migrated 29,000 instructor-led
safety training days to e-learning
– BT’s new learning capability
achieved ISO 9001 registration
• Number of employee
disciplinary cases
• Use of EAP programs per
1000 employees
• Communication Budget per
employee
Application Development
& Maintenance
•Desktop applications
•Self-Service vehicles
(web, kiosks, etc.)
•Offshore development
• Reduce costs by migrating portions of the ADM
offshore
• Re-platform custom, legacy software/ platforms
to less costly COTS-based solutions.
• FileNet (Comprehensive HRT)
– significantly enhanced reporting
capabilities
– faster and better-informed
decisions based upon quick
access to timely employee
information
– self-service capabilities boosted
employee satisfaction as they
streamlined operations and saved
costs
• Number of systems to
integrate
• Cost of ADM per man/year of
effort
35
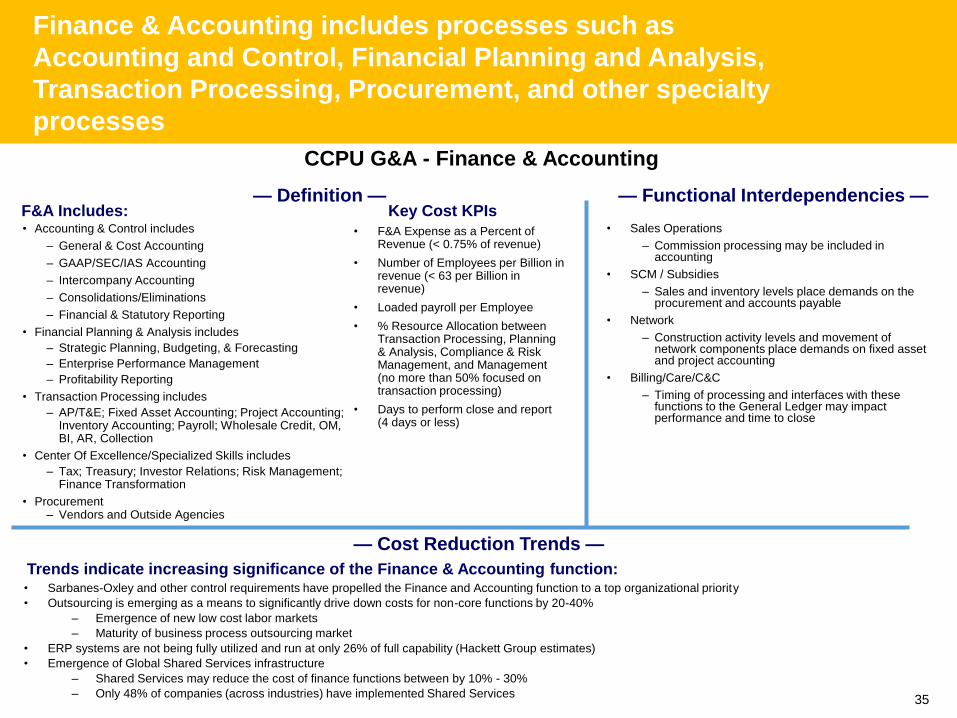
Finance & Accounting includes processes such as
Accounting and Control, Financial Planning and Analysis,
Transaction Processing, Procurement, and other specialty
processes
— Cost Reduction Trends —
— Definition —
• Accounting & Control includes
– General & Cost Accounting
– GAAP/SEC/IAS Accounting
– Intercompany Accounting
– Consolidations/Eliminations
– Financial & Statutory Reporting
• Financial Planning & Analysis includes
– Strategic Planning, Budgeting, & Forecasting
– Enterprise Performance Management
– Profitability Reporting
• Transaction Processing includes
– AP/T&E; Fixed Asset Accounting; Project Accounting; Inventory Accounting; Payroll; Wholesale Credit, OM, BI, AR, Collection
• Center Of Excellence/Specialized Skills includes
– Tax; Treasury; Investor Relations; Risk Management; Finance Transformation
• Procurement– Vendors and Outside Agencies
• Sarbanes-Oxley and other control requirements have propelled the Finance and Accounting function to a top organizational priority
• Outsourcing is emerging as a means to significantly drive down costs for non-core functions by 20-40%
– Emergence of new low cost labor markets
– Maturity of business process outsourcing market
• ERP systems are not being fully utilized and run at only 26% of full capability (Hackett Group estimates)
• Emergence of Global Shared Services infrastructure
– Shared Services may reduce the cost of finance functions between by 10% - 30%
– Only 48% of companies (across industries) have implemented Shared Services
• F&A Expense as a Percent of Revenue (< 0.75% of revenue)
• Number of Employees per Billion in revenue (< 63 per Billion in revenue)
• Loaded payroll per Employee
• % Resource Allocation between Transaction Processing, Planning & Analysis, Compliance & Risk Management, and Management (no more than 50% focused on transaction processing)
• Days to perform close and report (4 days or less)
F&A Includes: Key Cost KPIs
CCPU G&A - Finance & Accounting
• Sales Operations
– Commission processing may be included in accounting
• SCM / Subsidies
– Sales and inventory levels place demands on the procurement and accounts payable
• Network
– Construction activity levels and movement of network components place demands on fixed asset and project accounting
• Billing/Care/C&C
– Timing of processing and interfaces with these functions to the General Ledger may impact performance and time to close
— Functional Interdependencies —
Trends indicate increasing significance of the Finance & Accounting function:

36
The Finance and Accounting function
decomposes into various levers driving the
overall cost of the operation
Financial Planning &
AnalysisAccounting &
Control
Application
Development
& Maintenance
GAAP/ SEC/ IAS Accounting
General & Cost Accounting
Financial & Statutory Reporting
Consolidations/ Eliminations
Inter-company Accounting
G&A Finance and Accounting1
Budgeting & Forecasting
Enterprise Performance Management
Channel/ Customer/ Product Profitability
Center Of
Excellence/
Specialized Skills
Tax
Treasury/Cash Management
Investor Relations
Risk Management
Finance Transformation
Strategic Planning
Transaction
Processing
Travel & Expense
Fixed Asset Accounting
Project Accounting
Accounts Payable
Inventory Accounting
Payroll
Wholesale Credit, OM, Billing, AR, Collections
Audit
Board/Audit Committee
• # of FTEs
• # of Entities
• # of Countries
• % Standardization of Processes
• Degree of Automation of Processes
• # of Financial Applications
• # of Transactions processed
Cost drivers are in Blue
• Desktop care
• Offshore development
Note: 1- Cost drivers are listed beneath G&A Finance and Accounting (F&A) because these drivers are common
for F&A’s major cost components.

37
Detailed Analysis of the Cost Drivers of the
Finance and Accounting Function
Cost Element /
Cost Drivers
Cost Take-Out Leading Practices Sample Experience Key Performance
Indicators
Accounting & Control
• # of FTEs
• Staff location/labor market
• Supporting tech. enablers
• Business volumes
• # of entities and/or business
complexity
• F&A outsourcing
• Shared services
• Process standardization
• Integrated transaction processing systems to automate accounting
transaction processing
• Streamlined close cycle and reduction in manual close effort
• Integrated enterprise performance mgmt. platform
• At a global telecom,
reduced the close cycle
time by 50% through a
streamlined process
• Monthly close and report
cycle 4 days or less
• General accounting and
reporting costs 0.1-0.2% of
revenue
Financial Planning & Analysis
• # of FTEs
• Staff location/labor market
• Supporting tech. enablers
• Business volumes
• # of entities and/or business
complexity
• Budget model complexity
• F&A outsourcing
• Shared services
• Integrated transaction processing systems to automate accounting
transaction processing
• Integrated enterprise performance management platform that
enables self-service reporting, analysis, and information
distribution
Budgeting & Forecasting:
• Streamlined budget & forecasting process with rolling cycles and
web-based data collection to reduce manual effort
• At one of the world’s
largest electrical
engineering and
electronics companies
delivered reduction of
close cycle by 50% and
cost reduction of 25%
through a single global
web interface for all
Accounting and FP&A
teams
• Planning, performance
management, business
analysis function of 6-11
FTE per Billion of revenue
• Cost of 0.1-0.15% of
revenue
• Single reporting platform
Internal Audit
• # of FTEs
• Staff location/labor market
• Supporting tech. enablers
• # of entities and/or business
complexity to audit
Minimal opportunity to save in this area, but still
have best practices:
• Integrated transaction processing platform to reduce the cost of
performing audits
• Integrated enterprise performance management platform that
provides information which can be used to reduce the cost of
performing audits
• Proper controls and compliance measures
• At a large global telecom -
program management to
comply with Sarbanes
Oxley
• 3+ audits performed per
audit FTE
• 4-6 FTEs per Billion of
revenue
• Audit and compliance costs
of .005-.075% as a percent
of revenue
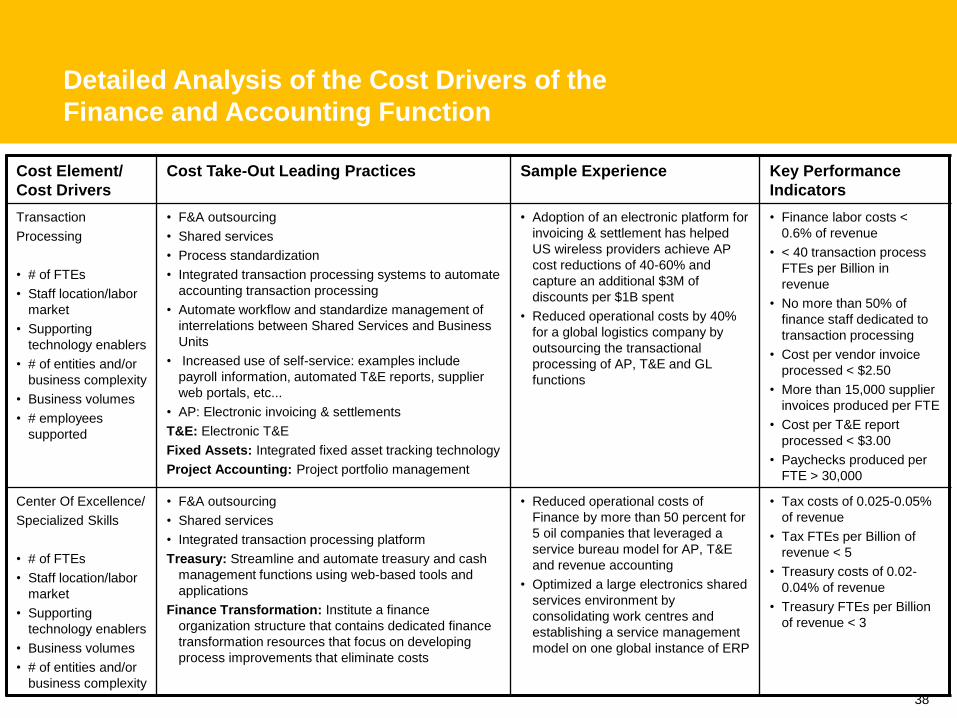
38
Detailed Analysis of the Cost Drivers of the
Finance and Accounting Function
Cost Element/
Cost Drivers
Cost Take-Out Leading Practices Sample Experience Key Performance
Indicators
Transaction
Processing
• # of FTEs
• Staff location/labor
market
• Supporting
technology enablers
• # of entities and/or
business complexity
• Business volumes
• # employees
supported
• F&A outsourcing
• Shared services
• Process standardization
• Integrated transaction processing systems to automate
accounting transaction processing
• Automate workflow and standardize management of
interrelations between Shared Services and Business
Units
• Increased use of self-service: examples include
payroll information, automated T&E reports, supplier
web portals, etc...
• AP: Electronic invoicing & settlements
T&E: Electronic T&E
Fixed Assets: Integrated fixed asset tracking technology
Project Accounting: Project portfolio management
• Adoption of an electronic platform for
invoicing & settlement has helped
US wireless providers achieve AP
cost reductions of 40-60% and
capture an additional $3M of
discounts per $1B spent
• Reduced operational costs by 40%
for a global logistics company by
outsourcing the transactional
processing of AP, T&E and GL
functions
• Finance labor costs <
0.6% of revenue
• < 40 transaction process
FTEs per Billion in
revenue
• No more than 50% of
finance staff dedicated to
transaction processing
• Cost per vendor invoice
processed < $2.50
• More than 15,000 supplier
invoices produced per FTE
• Cost per T&E report
processed < $3.00
• Paychecks produced per
FTE > 30,000
Center Of Excellence/
Specialized Skills
• # of FTEs
• Staff location/labor
market
• Supporting
technology enablers
• Business volumes
• # of entities and/or
business complexity
• F&A outsourcing
• Shared services
• Integrated transaction processing platform
Treasury: Streamline and automate treasury and cash
management functions using web-based tools and
applications
Finance Transformation: Institute a finance
organization structure that contains dedicated finance
transformation resources that focus on developing
process improvements that eliminate costs
• Reduced operational costs of
Finance by more than 50 percent for
5 oil companies that leveraged a
service bureau model for AP, T&E
and revenue accounting
• Optimized a large electronics shared
services environment by
consolidating work centres and
establishing a service management
model on one global instance of ERP
• Tax costs of 0.025-0.05%
of revenue
• Tax FTEs per Billion of
revenue < 5
• Treasury costs of 0.02-
0.04% of revenue
• Treasury FTEs per Billion
of revenue < 3

39
Detailed Analysis of the Cost Drivers of the
Finance and Accounting Function
Cost Element/
Cost Drivers
Cost Take-Out Leading Practices Sample Experience Key Performance
Indicators
Application
Development &
Maintenance (ADM)
• # FTEs
• Staff location/labor
market and/or
sourcing strategy
• Supporting
technology enablers
• # users
• Reduce costs by migrating portions of the ADM
offshore
• Re-platform custom, legacy software/ platforms to less
costly COTS-based solutions
• For a US medical devices
manufacturer, System Integrator
maintains ERP, BI, BW and websites
and delivers 99 percent of software
updates without defects, against a
service level of 98 percent
• Finance related
technology costs of 0.1-
0.15% of revenue
• Finance technology costs
~25% that of finance labor
costs

40
Device Supply Chain encompasses both upgrade device
subsidy and supply chain operations costs such as
inventory planning, logistics, and service & repair
management
— Cost Trends —
— Definition —
• Device Subsidies (Upgrades only)
– Procurement & Sourcing
– Inventory Obsolescence
• Device Supply Chain Operations
– Inventory Planning & Management
– Logistics Management
– Service & Repair Management
• Worldwide device spend in 2006 is expected to be more than $120B (iSuppli), Worldwide device shipments in 2006 expected to be 850M units (iSuppli)
• Annual device spend for Top 6 US carriers will exceed $18B in 2005, Average spend for Top 6 US carriers is $3.6B, Average trailing twelve month inventory balance for Top 6 US carriers is $500M
• With US market maturing, device shipments increasingly are fulfilling upgrade demand
• Upgrade devices comprise roughly 60% of US market in 2005, Upgrade devices expected to comprise roughly 85% of US market by 2009
• Device complexity (design, features) will increase and lifecycles will continue to contract
• After-sales service execution will be more difficult and critical
• Carriers will continue to place great importance on company-owned retail networks
• Device Purchase Price
• Inventory Turns
• Forecast Deviation
• Inventory Obsolescence
• Product Availability
• Logistics Cost per Device
• Repair Cost per Device
• First Year Failure Rate
Device SCM Includes: Key Cost KPIs:
Device Supply Chain Management
• Sales Operations
– Direct shipments vary load on SCM
• Fulfillment / Subsidies
– Supply is dependant on inventory levels
• Marketing
– Campaigns and incentives affect sales which affect supply chain forecasts
• Acquisition Subsidies
Device SCM does not include:
(1) All data sourced from Internal Research unless otherwise noted.
Key Service Level MetricTarget with New
Capabilities in Place
Device Purchase Price
Inventory Turns
Forecast Deviation (45 days out)
Inventory Obsolescence
Product Availability
Logistics Cost per Device
First Year Failure Rate
5% – 15% lower
>12 turns
<30% in aggregate
<1.2% annually
>95% in stock
<$4.20 per unit
<8% annually
EBIT Impact: $350 million
Cash Flow Impact: $450 million
— Financial Impact —(Expected 5-year Benefits for Carrier with 20M subs)
— Functional Interdependencies —

41
The Device Supply Chain Management function
decomposes into various levers driving the overall
cost of the operation
Device SCM
Reverse Logistics
Management
• Returns volume
(including exchanges)
• Returns mix (bulk vs.
each inspection)
• Returns network size
and configuration
• Service level terms
• In-house vs. outsourced
returns operations
Forward Logistics
Management
• Fulfillment volume and
mix (bulk vs. each pick)
• Distribution network
size and configuration
• Service level terms
• In-house vs. outsourced
fulfillment operations
• Accuracy of demand
forecast
• 1
Logistics
Management
• 1
Service & Repair
Management
• Warranty claim volume
• Warranty claim accuracy
Warranty Claims
Management
• Repair services offered
• Repair volume
• Repair mix (L1, L2, L3)
• Repair network size and
configuration
• Service level terms
• In-house vs. outsourced
repair operations
Repair / Refurbish
Management
• 1
Device Subsidy
(Upgrades Only)
• Efficacy of planned
marketing promotions
• Frequency and lead time
of unplanned marketing
promotions
• Product / customer
segmentation
• Product availability
Revenue from
Equipment Sales
• 1
Cost of
Equipment Sales
• # SKUs
• # Vendors
• Device features and
complexity
• Device technology
(CDMA, GSM, etc.)
• Scale-driven purchase
discounts
• Extent of supplier
collaboration
Procurement &
Sourcing
• Accuracy of demand
forecast
• Inventory turns
• Distribution network
size and configuration
• Safety stock levels
Inventory
Obsolescence
Inventory Planning
& Management
• Accuracy of demand
forecast
• Inventory turns
• Distribution network
size and configuration
• Safety stock levels
• Holding costs
Cost drivers are in Blue
• 1
GP&S
Procurement

42
The Device Subsidy1 function decomposes into
various levers driving the overall cost of the sub-
operation
Equipment
Margin 2
Device Subsidy (Gross Adds Only)
NOTES:
(1) Device subsidy is a component in both CPGA (for gross add sales) and
CCPU (for upgrade sales) calculations. Tree is the same for both.
(2) Driven by customers’ willingness and/or ability to pay, which is inversely
proportional to subsidy cost (negative equipment margin.)
Industry Trends Influencing Device Subsidy:
• Industry consolidation
• Increasing product complexity
• Shrinking product life cycles
• Demand highly sensitive to price / promotions
Cost of
Equipment Sales
Procurement &
Sourcing
• # SKUs
• # Vendors
• Device features and
complexity
• Device technology
(CDMA, GSM, etc.)
• Scale-driven purchase
discounts
• Extent of supplier
collaboration
Revenue from
Equipment Sales
• Efficacy of planned
marketing promotions
• Frequency and lead time
of unplanned marketing
promotions
• Product / customer
segmentation
• Product availability Inventory
Obsolescence
• Accuracy of demand
forecast
• Inventory turns
• Distribution network
size and configuration
• Safety stock levels
Cost drivers are in Blue

43
Detailed Analysis of the Cost Drivers of the Device
Supply Chain Function
Cost Element/
Cost Drivers
Cost Take-Out Leading Practices Sample Experience Key Performance
Indicators
Device & Accessory Revenue
• Efficacy of planned marketing
promotions
• Frequency and lead time of
unplanned marketing promotions
• Product /customer segmentation
• Product availability
Subsidy-impacting Marketing or cross-functional
activities:
• Promotion strategy & planning
• Product / customer segmentation
• Device portfolio strategy & mgmt
• Device pricing strategy & mgmt
• T-Mobile
• Sprint Nextel
• Verizon Wireless
Device & Accessory Cost
• # SKUs
• # Vendors
• Device featurs and complexity
• Device technology (CDMA, GSM,
etc.)
• Scale-driven purchase discounts
• Extent of supplier collaboration
Procurement & Sourcing activities:
• Strategic sourcing - reverse eAuctions to capture
reduced spend opportunity and enhance sourcing
capability
• Procurement – Automate and standardize the
purchasing process
• Developed negotiation strategies with OEMs to
reduce handset pricing
• Collaborative planning
• SRM
• Cingular - $300M in
benefits over 5 years
• NTT DoCoMo – reduced
overall procurement
related costs by 12% by
negotiating OEM prices
and developing an
optimal handset mix
• Vodafone, T-Mobile, TIM

44
Detailed Analysis of the Cost Drivers of the Device
Supply Chain Function
Cost Element/
Cost Drivers
Cost Take-Out Leading Practices Sample Experience Key Performance
Indicators
Inventory
Obsolescence Cost
• Accuracy of demand
forecast
• Inventory turns
• Distribution network
size and
configuration
• Safety stock levels
Adjustments to device & accessory inventory due to:
* Obsolescence * Pilferage / shrink
* Vendor rebates * Vendor co-op
Inventory planning and management activities:
• S&OP - implement collaborative tools such as i2, SAP, or APO
• Demand,
• supply planning - use Vendor Managed Inventory (VMI) where
applicable, price to push inventory that is owned
• Replenishment planning -use demand driven replenishment by
applying forecasting to the retail store network
• Distribution network rationalization
• Implemented Just in Time style fulfillment method to reduce
inventory and improve stock-out rates at the retail stores and
distribution centers
• ATT Wireless
• Cellcom
• Cingular - inventory turns
from 6 to 12 (50% reduction
in avg inventory)
• Qwest Wireless
• Sprint / Sprint Nextel - post
merger reduction of >$300M
in inventory
• Baseline Obsolescence
cost of 1.2%
• 45 day demand forecast
deviation of 30%
• 12 annual inventory turns
Inventory Planning and
Management Cost
• Accuracy of demand
forecast
• Inventory turns
• Distribution network
size and
configuration
• Safety stock levels
• Holding costs
• S&OP - implement collaborative tools such as i2, SAP, or APO
• Demand planning
• Supply planning - use Vendor Managed Inventory (VMI) where
applicable, price to push inventory that is owned
• Replenishment planning - use demand driven replenishment
by applying forecasting to the retail store network
• Distribution network rationalization
• Bring down lead times between carrier and OEM by paying
more for shorter lead times if the overall cash position is
beneficial
• ATT Wireless
• Cellcom
• Cingular - inventory turns
from 6 to 12 (50% reduction
in avg inventory)
• Qwest Wireless
• Sprint / Sprint Nextel - post
merger reduction of >$300M
in inventory
• 45 day demand forecast
deviation of 30%
• 12 annual inventory turns

45
Detailed Analysis of the Cost Drivers of the Device
Supply Chain Function
Cost Element/
Cost Drivers
Cost Take-Out Leading Practices Sample Experience Key Performance
Indicators
Forward Logistics
Management Cost
• Fulfillment volume and mix
(bulk vs. each pick)
• Distribution network size and
configuration
• Service level terms
• In-house vs. outsourced
fulfillment operations
• Accuracy of demand forecast
• Improve Order mgmt & tracking, DC fulfillment
operations, Transportation mgmt, and DC network
strategy through:
• Rationalize distribution network
• Implement new warehouse technology to improve
productivity and reduce labor costs
• Create an optimal transportation strategy mix
between air and ground
• Warehouse layout and equipment changes for
productivity
• Find optimal insource vs. outsource mix
• Cingular - $150M in benefits over 5 years
by rationalizing distribution network
infrastructure from 14 facilities to 1.
• Nextel – transferred operations to OEM
which reduced cycle times from 2-3 days
to 1 day.
• NTT DoCoMo – Reduced Logistics cost
from $4/device to <$1.5
• Vodafone – developed eRequisitioning
and eContracting that reduced order lead
times by 90%
• Cellcom, Orange, Qwest Wireless, T-
Mobile, Vivo
• Forward logistics cost per
device $4.20
Reverse Logistics Mgt Cost
• Returns volume (including
exchanges)
• Returns mix (bulk vs. each
inspection)
• Returns network size and
configuration
• Service level terms
• In-house vs. outsourced
returns operations
• Improve Order mgmt & tracking, DC fulfillment
operations, Transportation mgmt, and DC network
strategy through:
• Rationalize distribution network
• Implement new warehouse technology to improve
productivity and reduce labor costs
• Create an optimal transportation strategy mix
between air and ground
• Warehouse layout and equipment changes for
productivity
• Find optimal insource vs. outsource mix
• Ensure DCs are capable of receiving and processing
returns
• Cingular - $200M in savings from variety
of initiatives, including repair operations,
exchange program, technician
productivity, repair outsourcing.
• Telefonica
• T-Mobile
• Reverse logistics cost per
device $4.20

46
Detailed Analysis of the Cost Drivers of the Device
Supply Chain Function
Cost Element/
Cost Drivers
Cost Take-Out Leading Practices Sample Experience Key Performance
Indicators
Repair / Refurbish Management
Cost
• Repair services offered
• Repair volume
• Repair mix (L1, L2, L3)
• Repair network size and
configuration
• Service level terms
• In-house vs. outsourced
repair operations
• Repair order mgmt & tracking
• Repair operations optimal mix of:
+ In-store repair operations - have technician in
store if enough volume to justify the repairs and
swaps
+ Depot repair operations
+ 3rd party repair operations
• Find the right mix of in-house vs. third party vs.
OEM repair and implement tracking systems to
help source the operations
• Cingular
• Sprint – in store repair solution
realized a 30% reduction in
handset exchange volume and
annual net benefits of about
$70M
• Telefonica
• First year device failure
rate of 8%
• Repair cost per device of
$35-50
Warranty Management Cost
• Warranty claim volume
• Warranty claim accuracy
• Warranty service offering management - set up
claims management system with OEMs by region,
market and repair depot to reduce leakage
• Warranty claim management - implement
systems to track warranties processing to reduce
leakage
• Cingular
• Sprint (part of the $70M above
Sprint PCS solution)
• Telefonica
GP&S Procurement • Consolidate spend
• Improve contract compliance (policy enforcement,
e-procurement, etc...)
• Maximize vendor discounts and improve resource
allocations.
• Achieve wage arbitrage and economies of scale
through low cost, multi-client service centers.
• Minimize spend through use of eRequisitioning
system.
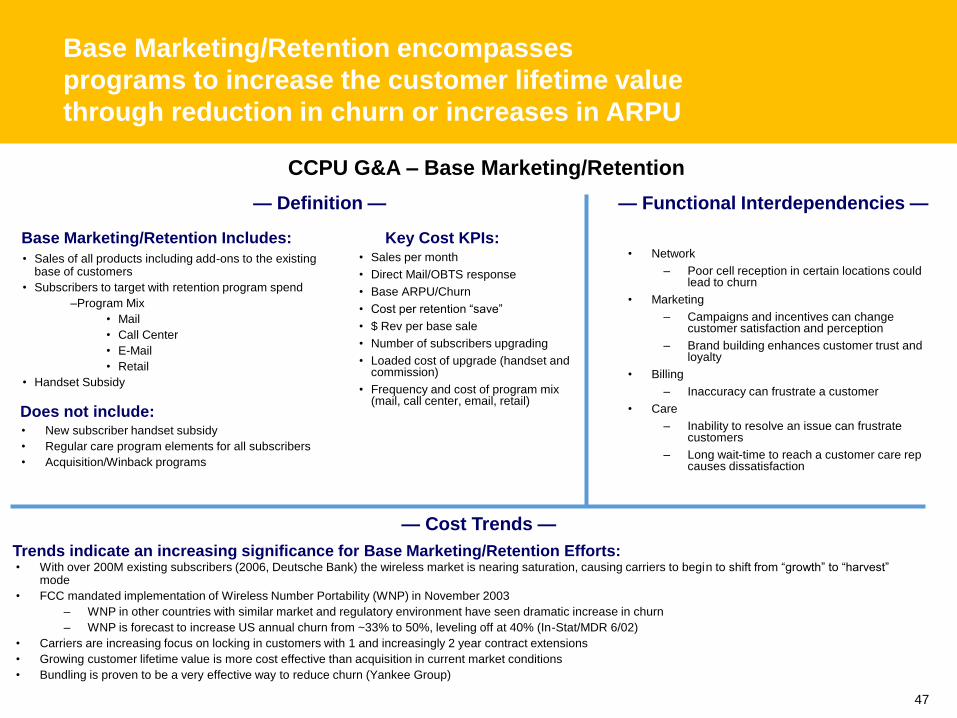
47
Base Marketing/Retention encompasses
programs to increase the customer lifetime value
through reduction in churn or increases in ARPU
— Definition —
• Sales of all products including add-ons to the existing base of customers
• Subscribers to target with retention program spend
–Program Mix
• Call Center
• Retail
• Handset Subsidy
• With over 200M existing subscribers (2006, Deutsche Bank) the wireless market is nearing saturation, causing carriers to begin to shift from “growth” to “harvest” mode
• FCC mandated implementation of Wireless Number Portability (WNP) in November 2003
– WNP in other countries with similar market and regulatory environment have seen dramatic increase in churn
– WNP is forecast to increase US annual churn from ~33% to 50%, leveling off at 40% (In-Stat/MDR 6/02)
• Carriers are increasing focus on locking in customers with 1 and increasingly 2 year contract extensions
• Growing customer lifetime value is more cost effective than acquisition in current market conditions
• Bundling is proven to be a very effective way to reduce churn (Yankee Group)
• Sales per month
• Direct Mail/OBTS response
• Base ARPU/Churn
• Cost per retention “save”
• $ Rev per base sale
• Number of subscribers upgrading
• Loaded cost of upgrade (handset and commission)
• Frequency and cost of program mix (mail, call center, email, retail)
Base Marketing/Retention Includes: Key Cost KPIs:
CCPU G&A – Base Marketing/Retention
• Network
– Poor cell reception in certain locations could lead to churn
• Marketing
– Campaigns and incentives can change customer satisfaction and perception
– Brand building enhances customer trust and loyalty
• Billing
– Inaccuracy can frustrate a customer
• Care
– Inability to resolve an issue can frustrate customers
– Long wait-time to reach a customer care rep causes dissatisfaction
• New subscriber handset subsidy
• Regular care program elements for all subscribers
• Acquisition/Winback programs
Does not include:
— Functional Interdependencies —
— Cost Trends —
Trends indicate an increasing significance for Base Marketing/Retention Efforts:

48
The Base Marketing/Retention function decomposes
into various levers driving the overall cost of the
operation
Base Marketing/Retention
Reactive
Upgrades
Proactive
• # of Upgrades
• % Upgrading
• Average Subs
• Cost / Upgrade
• Handset Subsidy
• Commission
Cost of Save
Programs
Care CollectionsSales
Channels
Dedicated
Save Center
Customer
Touchpoint
Operations• Cost of incentive
programs
• Volume of save
program transactions
Plan
Migration
Network
Migration
Customer
Touchpoint
Operations
• # of contacts
• AHT
• Agent utilization
•Cross train
• Call Mix
• Labor costs1
• Outsourcing
• Abandon rate
• Service level
• Agent Performance
Care CollectionsSales
Operations
• Refer to
channel
operations
• Refer to
Care• Refer to
Collections
• Refer to Sales
operations
• Refer to
Care
• Refer to
Collections
• Propensity to Churn
• Customer Satisfaction
Cost drivers are in Blue
Base Marketing
Retention
Marketing
• DM
• Web cost
• eMail Cost
• Dedicated Rep
headcout
(continued on page 39)

49
The Base Marketing function can further decompose
into reactive, proactive and base marketing efforts,
each with their respective cost elements
Base Marketing/Retention
Reactive Proactive
Cost of
Marketing
Programs
Care CollectionsSales
Channels
Dedicated
Call Center
Customer
Touchpoint
Operations
• Cost of rep incentive/
commission
programs
• Cost of Customer
Sales incentives
• DM
• Web cost
• eMail Cost
• Dedicated Rep
headcount
• # of contacts
• AHT
• Agent utilization
•Cross train
• Call Mix
• Labor costs1
• Outsourcing
• Abandon rate
• Service level
• Agent Performance
• Refer to
channel
operations
• Refer to
Care• Refer to
Collections
• Propensity to Churn
• Customer Satisfaction
Cost drivers are in Blue
Base Marketing

50
Detailed Analysis of the Cost Drivers of the Base
Marketing/Retention Function
Cost Element/
Cost Drivers
Cost Take-Out Leading Practices Sample Experience Key Performance
Indicators
Retention Effectiveness • Conduct customer segmentation and profitability analysis
• Establish parameters for selecting retention target
customers
• Utilize customer analytics / segmentation to drive rules
driven retention program
– Proactively identify at risk customers through churn
models
– Develop target programs
• OUTBOUND: Conduct targeted DM/TM/Web campaigns in
customer’s channel of choice with retention offer
• INBOUND: Enable agents with holistic view of customers
on in-bound calls. (e.g., save campaigns, proactive pitches
on care related calls)
• Starhub - implemented
churn prediction models
that made Starhub 3-4
times more efficient at
predicting churn and added
$6 million in profit per year
• A large wireless operator
expects to realize a
reduction in its churn rate
of 15-25%
• An Asia-Pacific
telecommunications
company experienced a
churn rate decrease from
25% to 12%
• Churn management
offerings can reduce
churn by 25-50%
Dedicated Save Center
• # of contacts
• AHT
• Agent utilization
• Cross train
• Call Mix
• Labor costs
• Outsourcing
• Abandon rate
• Service level
• Agent Performance
• Improve agent save performance and reduce AHT by
–Providing quick and holistic view of the customer
–Allowing pre-scripted save options for different customer
call-in segments
• Utilize outsourced centers to achieve cost savings
• Slovak Telecom - Initial set
up of 73,000 loyalty club
members on Siebel system
to enable call center
effectiveness by linking all
CRM information
51
Detailed Analysis of the Cost Drivers of the Base
Marketing/Retention Function
Cost Element/
Cost Drivers
Cost Take-Out Leading Practices Sample Experience Key Performance
Indicators
Cost of Save Programs
• Cost of incentive programs
• Volume of save program
transactions
• Analyze customers by propensity to churn
• Understand the profitability of customers with high risk to
churn
• Target customers with the highest profitability and risk to
churn
• Customize incentives to the customer profitability
• Analyze non-profitable customers to reduce cost to serve
• Strategic Sourcing
• Sprint Nextel -10%
reduction in the cost of an
existing targeted retention
program
Plan Migration
• Churn
• Lost Overage Revenue
• Analyze customers by propensity to churn
• Understand the profitability of customers with high risk to
churn and high profitability due to overage charges
• Understand profitability of legacy rate plans
• Target customers with the lowest profitability/or
unprofitable plans for migration to new plans
• Customize incentives/message/ channel to customer
profitability (DM for low value customers/OBTS for high
value/etc
Network Migration
• Cost of dropped/lost calls
• Cost for dual mode
handsets
• # of customers to migrate
• Network deployment plans
• Analyze network deployment market by market
• Determine customers/markets to implement network
migration based on customer value, network capacity,
product usage, and customer movement between
markets
• Migrate customers to minimize service disruption and
cost of migration while maximizing retention and network
capacity
52
Detailed Analysis of the Cost Drivers of the Base
Marketing/Retention Function
Cost Element/
Cost Drivers
Cost Take-Out Leading Practices Sample
Experience
Key Performance
Indicators
Retention Marketing
• DM
• Web cost
• eMail Cost
• Dedicated Rep headcount
• Analyze customers by propensity to churn
• Understand the profitability of customers with high risk to churn
• Target customers with the highest profitability and risk to churn
• Customize incentives/message/ channel to customer profitability (DM
for low value customers/OBTS for high value/etc
• Analyze non-profitable customers to reduce cost to serve
• Sprint Nextel -10%
reduction in the cost
of an existing targeted
retention program
Upgrades
• # of Upgrades
- % Upgrading
- Average Subs
• Cost / Upgrade
- Handset Subsidy
- Commission
• Analyze customers by propensity to churn
• Understand the profitability of customers with high risk to churn
• Target customers with the highest profitability and risk to churn
• Customize handset upgrade to the customer profitability
• Manage costs of non-profitable customers
• Sprint Nextel -10%
reduction in the cost
of an existing targeted
retention program
Cost of Marketing Programs
• Cost of rep incentive/
commission programs
• Cost of Customer Sales
incentives
• DM
• Web cost
• eMail Cost
• Dedicated Rep headcout
• Analyze customers by propensity to buy
• Target customers with the product they are most likely to buy
• Deliver customer insight to the customer touchpoint with the relevant
offer by customer
• Customize incentives to the customer profitability
• Analyze non-profitable customers to increase margin through the sale
of more profitable products
• Sprint Nextel
-End to end customer
solution driving
>$250M in annual
revenue
-Close rate on offers up
to 30%
-Optimized offer among
15 products

53
— Cost Trends —
The Network Process contains the cost of providing
connectivity from the cell phone to the terminating
phone – either another wireless device or a landline
— Definition —
• Network Planning & Design
• Network Deployment
– Network Procurement and Supply
– Connectivity / Backhaul Costs
• Field Operations and Maintenance
– Field Service
• Site Management
– Facilities Management
• Network Service Assurance
• Third Party Relationships
– LD Costs
Network Includes: Key Cost KPIs:
• Network Availability
• Cost per cell site
• Technicians per cell site
• # of NOCs
• Data services available
• Access vs. Core transmission
• Short vs. Long haul
CCPU - Network
• Big move during late ‘90s early ’00s to outsource tower management.
– In ‘02/’03, tower management companies were having trouble with high debt loads and going bankrupt; share prices collapsing as a result
– Carriers beginning to decommission 1G/early 2G networks and move toward CDMA or GSM as the primary digital phone networks
• Carriers increasingly deploying next generation data/voice networks, but at significant additional cost
– Data volume remains a fraction of voice volume, and data revenues do not yet cover costs.
– Carriers incur additional costs from supporting multiple network technologies during migration to 3G
• Wireless carriers beginning to support / build out Wi-Fi networks, creating yet another technology to support
– Wi-Fi integration with core wireless network will increase CapEx, but low Wi-Fi OpEx could create sustainable profitability over time, depending on adoption
• Marketing
– Strategies can affect Network area build out and maintenance
– Drives expectations of network availability
• Sales Operations
– Ability of reps to sell data network will affect capacity strategy
• Acquisition Subsidies
– Increasing data network availability could affect subsidy size on expensive data devices to induce take-up
— Functional Interdependencies —

54
Core
The Network Operations function decomposes
into various levers driving the overall cost of the
operation
Network Planning
and DesignNetwork Deployment
Field Operations
and Maintenance
Third Party
Relationship
Radio
Transmission
Core
Services
(Auxiliary Platforms)
Network Service
Assurance
Radio Transmission
Services
(Auxiliary Platforms)
TestingNetwork
Operations
Support
Network
Call Centers
Network
CertificationVoice
Roaming
Interconnect
(wireline settlement)
Contracts
Network
Operations
• # of FTEs
• # of tools and vehicles
• # of spares
• # of contracts
• # of outages
• # of redesigns
• MOU
• Cost/Min
• In Collect
• Out Collect
• MOU
• Cost/Min
Cost drivers are in Blue* Data services examples: ring tone, SMS, MMS, voicemail, IM
Device
Certification
• Data service*
• Data service*
• Data service*
This would mainly include
FTE related costs that
perform P&D activities and
some P&D tools & testing
This would include OpEx
portion of network redesign
and deployment
This would include field
services, testing, maintenance
& repairs costs
This would include assurance
functions such as OSS,
activation, mediation, billing, and
performance management
This would include network
management OpEx such as
facilities, rentals, lease lines,
and power
Cost scope
1 2 3 4 5
1 2 3 5 6
• # of FTEs• # of FTEs
• 2G
• 3G
• WiFi (when
applicable)
• Access
• Core
• Circuit Switch
• Packet Switch
• 2G
• 3G
• Lease lines
• IP networks
• Microwave
• Short & long
hauls
• Circuit switch
• Packet switch
• # FTEs
Work-In-Progress
Site Management
4
• # of FTEs
• # cell towers
• Utilities (e.g. power)
• Legal, insurance & taxes
Core ManagementFacilities
Management
• Switches
• Lines
• Cell towers
• Utilities
• Rental
• Transmission
cost
• Legal
• Insurance
• Taxes
Data Roaming
• Infrastructure
• Maintenance
• Content
Maintenance
• Radio
• Transmission
• Core
• Services
• Radio
• Transmission
• Core
• Services
• Devices
This would include settlement,
data and voice roaming costs, as
well as 3rd-party contracts
6
• Tools
• Systems
• # of FTEs
• Tools
• Systems
• # of FTEs
• # Devices
• # Applications
• # NOCs
• # Data
Systems
• OSS
• # of FTEs
• # Call
Centers
• # FTEs
• Systems

55
Detailed Analysis of the Cost Drivers of the
Network Operations Function
Cost Element/
Cost Drivers
Cost Take-Out Leading Practices Sample
Experience
Key Performance
Indicators
Network Planning &
Design
• # FTEs
• 2G vs. 3G Radio
technology complexity
• Data services available
• Access vs. Core
Transmission
• Standardize methodology for designing new cell sites with design
optimization and simulation tools
• Optimize Networks that leverage across service platforms that drive
the best unit costs. Ongoing assessment of substitution
technologies, with particular focus on the following: (Can result in 10-
45% improvement)
- Node placement
- Managing Bandwidth
- Backhaul technology
For radio network
• Outsource Planning and Design to external companies or NEP
(negotiate costs of equipment based on a global contract)
For transmission network
• Introduce Next Generation Technologies. Choice of transmission
technology based geographics, demographics, expected ROI,
forecasted traffic, maturity
• Schema has been
used at Sprint for
replanning the
network.
- Resulting in an
overall 10-20%
cost reduction of
network costs
• Wind,
- optimization of
transmission
leased lines,
(savings 15%-
20%);
- rationalization of
backbone leased
lines (10%-20%)
Network Deployment
• # FTEs
• 2G vs. 3G Radio
Technology complexity
• Backhaul build and set-up
• Short vs. Long haul
• Circuit vs. Packet
switched
• Data services available
• Standardized and uniform processes for site build, site deployment
and implementation
• Inventory systems that accurately reflect deployed, provisioned and
planned inventory
• Skills based Co-Sourcing and Outsourcing arrangements to drive
optimal economics
• Minimize network elements, e.g., Reduce # of HLRs (Home Location
Registers)
• Supply Chain Optimization – examples include reducing
warehousing spend levels and headcounts
• Conducted
backhaul
optimization for
large US Wireless
Carrier that saved
$600M
• Vodafone UK
• Sprint Nextel
• Cingular

56
Detailed Analysis of the Cost Drivers of the
Network Operations Function
Cost Element/
Cost Drivers
Cost Take-Out Leading Practices Sample Experience Key Performance
Indicators
Field Operations &
Maintenance
• # FTEs
• # of Spares
• # of Contracts
• # of Outages
• # of redesigns
• Network outsourcing / co-sourcing
• Migrate the network to “all IP”, in order to rationalize the use of
the network, lower the maintenance costs, improve service
assurance (through better resilience, and redundancy)
• Reduce and optimize spare levels – supply chain mgt.
• Optimize Tool sets and equipment – equipping FTEs
• Optimize dispatch and operations centers, location, number,
overlaps, geographic coverage, etc.
• Workforce management systems to improve installations/FTE
• At a major US wireless
carrier, implemented a
wireless dispatch solution
that can handle 58,000
daily transactions.
• Amena
• Wind
Site Management
• # of FTEs
• # of cell towers
• Utilities
• Lease agreements
• Site leasing and sharing to reduce cost per site
• Outsourcing of maintenance and operations of cell sites
• Technology substitution at switch and POP/Hubs to decrease
footprint, and operating cost per unit of measure
• Improved inside plant operations processes and effectiveness
with work flow and eLearning tools coupled with wireless
technologies
• Vodafone UK • # of technicians / cell site
Network Service
Assurance
• # of FTEs
• # of NOCs
• # of Call Centers
• OSS Systems
• # of devices and
applications
• Improved incident management and trouble isolation – One
trouble, one dispatch, one fix
• Continuous Improvement to MTTR and work effort per repair
with Service Assurance process reengineering and better tools
• Optimizing required number of NOC and Tier 2/3 agencies
• Call centres consolidation
• Reduce # of OSS Systems and introduce next generation OSS
• Consolidation of platforms and reducing headcount
• Reduce contracts for operational support
• NOC consolidation at a
Nordic Telecom operator
resulted in 25% cost
reduction in NOCs
• Amena – through
outsourcing, network
deployment redesign,
spare reorganization, and
NOC consolidation, saved
10-13% of network costs
• 45 cell sites / technician
(depends on city
location, population
density, etc…)

57
Detailed Analysis of the Cost Drivers of the
Network Operations Function
Cost Element/
Cost Drivers
Cost Take-Out Leading Practices Sample Experience Key Performance
Indicators
Third Party Relationship
• MOUs
• In Collect and Out
Collect agreements
• Data services
provided
• Negotiated
contracts/agreements
• Analyze traffic and renegotiate roaming contracts
• Leverage device management and target features that provide
value
• Streamline process for acquiring 3rd party content to get it onto
the Network faster while controlling billing
• AWE Roaming contracts
pre-merger – identified
several hundred millions
• Cingular reviewed over
5000 contracts in order to
renegotiate and consolidate
vendors
• Frontier Communications
• Qwest
• C&W
• GSM roaming rates are
50% less expensive than
TDMA - Incollect
58
— Cost Trends —
Marketing encompasses the use of both direct
and indirect media and advertising to attract new
customers.
— Scope —
• Media/Advertising
– Traditional (e.g., print, TV, radio)
– Online advertisements
• Targeted Marketing
– Direct Mailings including acquisition list costs
• Product Marketing
– Management Salaries
– Education and Training costs
– Development and roll-out of a new product/service
• Top wireless industry carriers spend over $1B per year on advertising
• Majority of marketing (80%-90%) is spent on brand advertising
• Growing use of direct marketing for acquisition, such as marketing specific technology differentiators
• Industry interest to further retention through enhancing customer experience, offering bundled services
• Web response rates are decreasing customer acquisition costs
– Response rates for banner ads and e-mail marketing are .5% and 4%, respectively
• Advertising Effectiveness
• Response Rates
• Conversion Rates
• Product Management as percent of total marketing
• Utilization of demo centers
• Trade show attendance
In Scope: Key Cost KPIs:
CPGA - Marketing
• Sales Operations
– Sales effectiveness will drive marketing campaigns
• Care
– Insight learned in Care can increase Marketing effectiveness
• Fulfillment / Subsidies
– Volume and effectiveness of sales affect subsidy rate
— Functional Interdependencies —

59
Mass
Media/Advertising
Non-Traditional Channels
Marketing/Promotions
Marketing
Market
Research
The Marketing function decomposes into various
levers driving the overall cost of the operation
Labor
Product
Development
Product
Marketing
(includes
pricing)
• Frequency
• Reach (which
may translate
directly to Gross
Adds)
• Traditional
measures like
reach
• Marketing targets
• Sales targets (i.e. #
of Gross Adds)
• Incidental events
(i.e. unsold
products at end of
season)
• Budget
• # Headcount
• Third party
relationships
(i.e. external
research
groups)
• # of Market
Segments
• # Products /
Offers
• # Headcount
• # of market
segments
• # Products /
Offers
• # Headcount
• # Products /
Offers
• # Segments
Non-Labor
Notes to Non-labor:
1. Media/Advertising includes: National TV, National Radio, Spot Radio, National Magazines, Internet,
Spot TV, National Newspaper, Local Newspaper
2. Promotions includes: Incentive / Recognition; Spiffs (funds for special promos); MDFs (marketing
development fund); Co-op (incentive matching with agents); Events / Tradeshows; Demo Centers;
Sponsorships (local and national); Co-Marketing programs
CMO
Creative
Development
Media
Purchasing
• Frequency
• Reach
• Marketing
effective metrics
(e.g., ROI)
Marketing
Strategy &
Analysis
Marketing
Analytics
Direct
Marketing
• # Headcount
• # Products /
Offers
• # Segments
• # Headcount
• # Products /
Offers
• # Segments
Cost drivers are in Blue

60
Detailed Analysis of the Cost Drivers of the Marketing
Function
Cost Element/
Cost Drivers
Cost Take-Out Leading Practices Sample Experience Key Performance
Indicators
Creative Development &
Media Purchasing (Media /
Advertising)
– Frequency
– Reach
• Utilize customer insight and apply knowledge to
better target customers, coordinate campaigns, and
reallocate resources
• Incorporate data analytics to measure effectiveness
during the marketing processes to better target
advertising expenditures
• Consolidate media purchase to a few key vendors
• MROI group - Marketing
Sciences on average deliver
14% profit improvement, with
82% of projects delivering
greater than 5% improvement
• Cost (CPM)
• GRPs
• Reach
• Affinity
• Ad position
• Seasonality
• Delivery
Promotions
• Traditional measures like
reach
• Marketing targets
• Incidental events (i.e.
unsold products at end of
season)
• # of Gross Ads
• Budget
• Utilize customer insight and apply knowledge to
better target customers, coordinate campaigns, and
reallocate resources
• Incorporate data analytics to measure effectiveness
during the marketing processes to better target
advertising expenditures
• Consolidate media purchase to a few key vendors
• T-Mobile Hungary -
developed campaign
management software based
on Chordiant Marketing
Director tool
Research
• # Headcount
• Third party relationships
(i.e. external research
groups)
• # of Market Segments
• # Products / Offers
• Automating of survey instrument and survey design
• Offshoring of survey analytics and tying survey data
back to the customer base

61
Detailed Analysis of the Cost Drivers of the Marketing
Function
Cost Element/
Cost Drivers
Cost Take-Out Leading Practices Sample Experience Key Performance
Indicators
Product Development
• # Headcount
• # of market segments
• # Products / Offers
• Rapid prototyping to speed time to market
• Customer research to limit investment in non-valuable
products
• Analysis of new product usage to help with
pricing/network planning
• Customer analysis to isolate customers most likely to
adopt new products
Product Marketing
• # Headcount
• # Products / Offers
• # Segments
• Streamline product development by establishing a
common service creation environment.
• Streamline marketing processes through automation,
collaboration, and knowledge retainment.
• Incorporate customer insight during product
development phase to decrease testing and better
target products/offers.
• France Telecom Wanadoo -
Interactive marketing
campaign management that
reduced time to market,
staffing costs and automated
some marketing processes
Direct Marketing
(Marketing Strategy &
Analysis)
• # Headcount
• # Products / Offers
• # Segments
• Integration of existing databases
• Offshoring of analytics
• China Unicom Direct
Marketing campaign had a
successful acquisition rate of
4% by the third week of
telesales

62
Detailed Analysis of the Cost Drivers of the Marketing
Function
Cost Element/
Cost Drivers
Cost Take-Out Leading Practices Sample Experience Key Performance
Indicators
Marketing Analytics
(Marketing Strategy &
Analysis)
• # Headcount
• # Products / Offers
• # Segments
• Creation of a dedicated data mart for marketing
campaigns
- Reduces data redundancies and increasing effective
access to information
• Creation of a centralized campaign history
• Management of mutual exclusion between campaigns
to help identify ROI
• Create reporting capabilities to evaluate campaign
effectiveness
• MROI group - Marketing
Sciences on average deliver
14% profit improvement, with
82% of projects delivering
greater than 5% improvement
• BT - realized €25m on a
marketing budget of €140m,
and 34% in efficiency gains
by using optimal media mix
spend
• Bouygues Telecom - through
segmentation customer data
analysis and implementation
of systems Bouygues
customer contacts increased
450%, accuracy of
segmentation tripled and the
time needed to execute a
marketing campaign reduced
by 75%
• Cost (CPM)
• GRPs
• Reach
• Affinity
• Ad position
• Seasonality
• Delivery

63
Commission, the highest component of CPGA,
involves paying a margin to both external and internal
sales channels for signing up new customers
— Trends —
— Definition —
• Store Configuration & Optimization
• Collateral & Merchandising
• Sales Force Effectiveness
• Commission structure & strategy
• Training
• Inbound and Outbound Sales Service Centers
– Agents and Outside Agencies
– Acquisition List Costs
• Carriers are focusing on channels with more control over the customer experience
– Carriers are continuing to emphasize company owned stores
– Carriers are exercising pressure on non-exclusive agents to become exclusive
• Outbound Telesales hampered by no-call lists
• National Retail channels
• Although Internet is the cheapest distribution channel, it still makes up only 6% of total Gross Adds
• Subscribers using direct channels tend to have a lower churn (20 to 50 bps) and higher ARPU
Channel Operations Includes: Key Cost KPIs:
• Channel Mix
• CPGA by channel
–Yield on Inbound Sales Calls
–Yield on Outbound Sales Calls
• Churn by channel
• ARPU by channel
CPGA – Sales Operations
• Marketing
– Promotions will drive channel traffic
– Promotions will affect revenues which can increase or decrease subsidies
– Handset selection is driven through marketing campaigns
• Device SCM
– Inventory management, procurement and sourcing strategies will drive sales costs
• IT
– In store IT infrastructure will affect ability to service/upsell customers
• Device Subsidies (separate component)
• Acquisition marketing (separate component)
Channel Operations does not include:
Web
6%
Agents
26%
National
Retail
17%
Company
Owned
41%
Telesales
3%
B2B
7%
Average US Wireless Company Revenue
Distribution by Channel
— Functional Interdependencies —
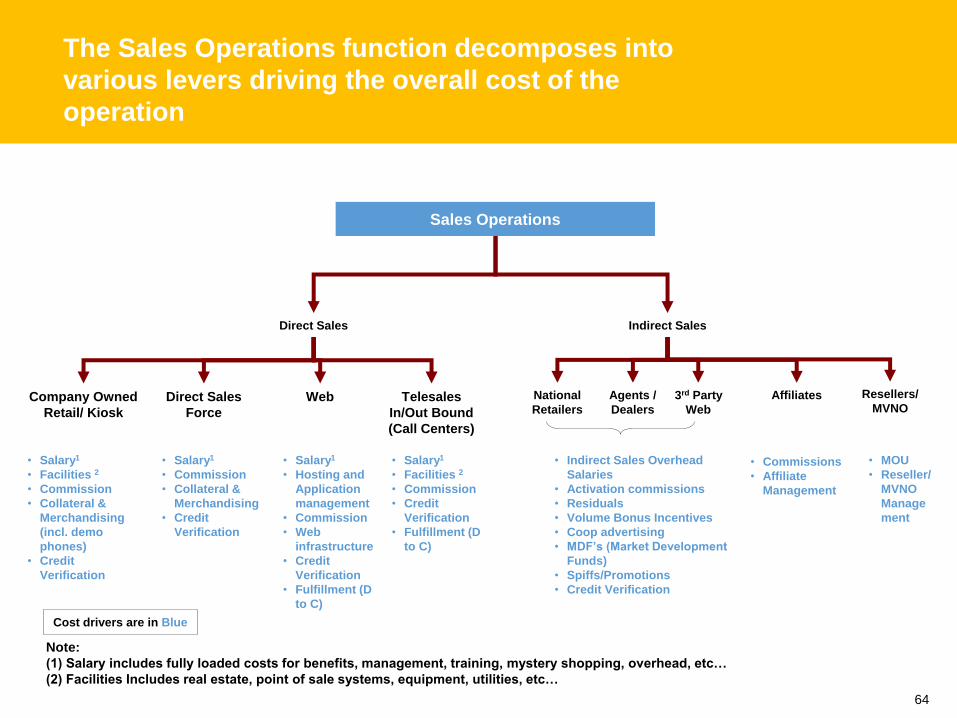
64
The Sales Operations function decomposes into
various levers driving the overall cost of the
operation
Sales Operations
Company Owned
Retail/ Kiosk
Direct Sales
Force
Telesales
In/Out Bound
(Call Centers)
Web
• Salary1
• Facilities 2
• Commission
• Collateral &
Merchandising
(incl. demo
phones)
• Credit
Verification
• Salary1
• Commission
• Collateral &
Merchandising
• Credit
Verification
• Salary1
• Facilities 2
• Commission
• Credit
Verification
• Fulfillment (D
to C)
Direct Sales Indirect Sales
Agents /
Dealers
National
Retailers
3rd Party
Web
Affiliates
• Indirect Sales Overhead
Salaries
• Activation commissions
• Residuals
• Volume Bonus Incentives
• Coop advertising
• MDF’s (Market Development
Funds)
• Spiffs/Promotions
• Credit Verification
Note:
(1) Salary includes fully loaded costs for benefits, management, training, mystery shopping, overhead, etc…
(2) Facilities Includes real estate, point of sale systems, equipment, utilities, etc…
• Salary1
• Hosting and
Application
management
• Commission
• Web
infrastructure
• Credit
Verification
• Fulfillment (D
to C)
• MOU
• Reseller/
MVNO
Manage
ment
Resellers/
MVNO
• Commissions
• Affiliate
Management
Cost drivers are in Blue

65
Detailed Analysis of the Cost Drivers of the Sales
Operations Function
Cost Element /
Cost Drivers
Cost Take-Out Leading Practices Sample Experience Key Performance
Indicators
Cross Channel
• Mix
• Salary
• Facilities
• Commission
• Channel Mix Optimization on ROI basis
- Alignment of resources, compensation, and organization
with business objectives
• Nextel • Optimizing sales
channel mix can have a
10% reduction in CPGA
Retail / Kiosk
• Salaries
• Facilities
• Commission
• Collateral &
Merchandising
(incl. demo
phones)
• Credit Verification
• Gain customer insight to effectively target customers by:
– Enabling a rules-driven, differentiated customer
treatment
– Analyzing traffic flow to set labor management
scheduling
– Determining location strategy for retail stores
• Drive self service through:
- Configuring stores to promote self service usage
• Optimize support (i.e. training) given to dealers / agents
• Collateral & Merchandising vendor consolidation
• Automate data management to reduce ad-hoc analysis
• CCF example for Sprint retail
(desktop simplification by using
web overlay) (Note: project not
sold yet)
• Collateral vendor consolidation
proposal for Sprint, target approx
15% savings in print spend (Note:
proposal not sold).
• At Sprint, realized 20-30% time
reduction in data management
activities, such as account
lookups, billing inquires, etc...
• Gross adds by
store/employee
• ARPU by Channel
• CPGA by channel
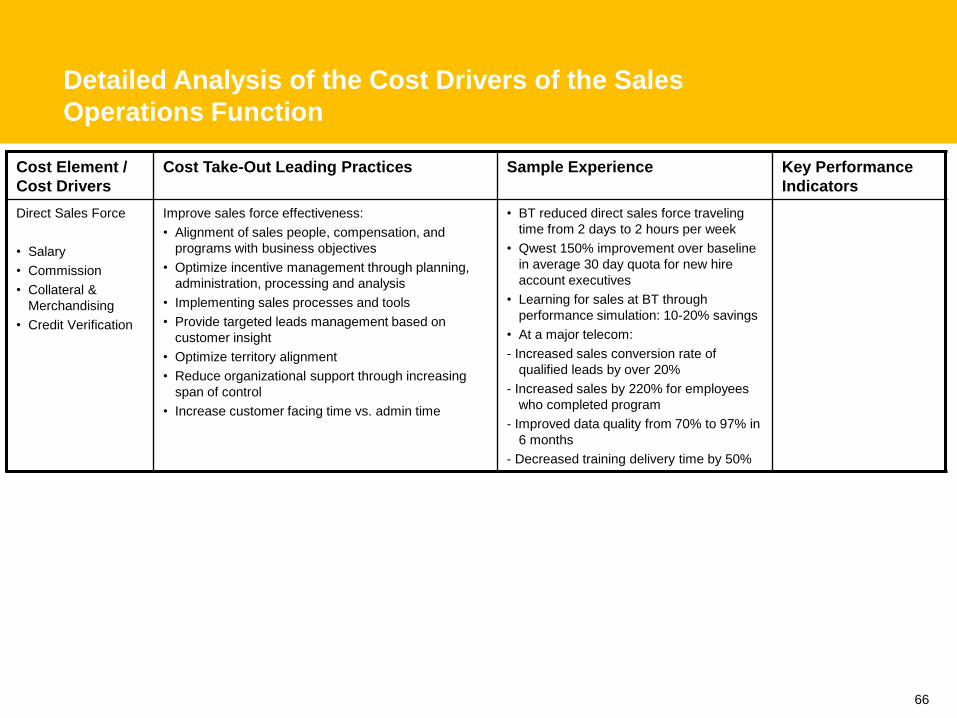
66
Detailed Analysis of the Cost Drivers of the Sales
Operations Function
Cost Element /
Cost Drivers
Cost Take-Out Leading Practices Sample Experience Key Performance
Indicators
Direct Sales Force
• Salary
• Commission
• Collateral &
Merchandising
• Credit Verification
Improve sales force effectiveness:
• Alignment of sales people, compensation, and
programs with business objectives
• Optimize incentive management through planning,
administration, processing and analysis
• Implementing sales processes and tools
• Provide targeted leads management based on
customer insight
• Optimize territory alignment
• Reduce organizational support through increasing
span of control
• Increase customer facing time vs. admin time
• BT reduced direct sales force traveling
time from 2 days to 2 hours per week
• Qwest 150% improvement over baseline
in average 30 day quota for new hire
account executives
• Learning for sales at BT through
performance simulation: 10-20% savings
• At a major telecom:
- Increased sales conversion rate of
qualified leads by over 20%
- Increased sales by 220% for employees
who completed program
- Improved data quality from 70% to 97% in
6 months
- Decreased training delivery time by 50%

67
Detailed Analysis of the Cost Drivers of the Sales
Operations Function
Cost Element/
Cost Drivers
Cost Take-Out Leading Practices Sample Experience Key Performance
Indicators
Web
• Hosting and
Application
Maintenance
• Salary
• Commission
• Web infrastructure
• Fulfillment (D to C)
• Credit Verification
• Optimize web experience and architecture to drive
additional sales complete by assessing purchase flow and
abandonment points
• Ensure lower cost channels, such as web, are capable of
handling new volume and are lowest cost point
- If web order, ensure complete fulfillment is electronic
- Validate orders online to reduce back-end fallout and rep
manual reentry
• Share web services layer (back-end system access) across
web SS and IVR front end
• Drive self-service through rules driven, differentiated
treatment for customers
• Decrease costs by standardizing the web infrastructure.
• Utilize third-party web development for front-end user
interface
• AT&T
• BellSouth
• CPGA by Channel
• Churn by Channel
• 2% of gross adds through
web is maximum rate in
North America

68
Detailed Analysis of the Cost Drivers of the Sales
Operations Function
Cost Element/
Cost Drivers
Cost Take-Out Leading Practices Sample Experience Key Performance
Indicators
Telesales
• Salary
• Facilities
• Commission
• Credit Verification
• Improve agent effectiveness and efficiency
- Give agents an enhanced desktop with improved
usability and functionality
- Increase automation of simple orders and
activations
- Apply Customer Insight to improve yield
- Enhance agent training through agent certification
• Consolidation across divisions to reduce
redundancy and increase efficiency of reporting
• Improve IVR through diagnostic and gap
assessments
• Improve leads management
- Implement process to find scrub lists
- Capture non-converted calls to create follow up
leads
• Reduce vendor costs
- Consolidate vendors to drive better pricing
- Increase offshore mix as skills increase
• Shift greater portion of calls to external agents
leveraging reduced vendor cost – get market
pricing.
• Streamline processes in centers by focusing on key
cost drivers.
• Priority router for telesales - reduces cost,
increases close rate, quality and availability
• Wireless provider telesales diagnostic
that identified initiatives resulting in
~$150M in incremental annual revenue
and ~$6M in annual OpEx reductions
• Large Telco recruitment, training and
coaching transformation that delivered a
10% increase in conversion rates for
inbound telesales
• Large Telco vendor marketplace
program resulting in Customer
Satisfaction improvement scores of
1400-2200 basis points and a >2%
reduction in customer churn
• SalesCoach implementation at Sprint led
to 20% overall incremental lift /
productivity increase, and an increase in
all product categories
• Sprint - increased telesales take-up from
0% to 10-15% of all sales
• US wireless carrier to target customers
for a contract renewal campaign. By
using cusotmer insight and
segmentation/predictive modeling with
incentives tied to the customer’s value,
consulting company was able to help its
client to generate a campaign ROI of
300% (increase of 40% from existing
campaign).
• CPGA for telesales is
$250 compared to an
average of $350

69
Detailed Analysis of the Cost Drivers of the Sales
Operations Function
Cost Element/
Cost Drivers
Cost Take-Out Leading Practices Sample Experience Key Performance
Indicators
Indirect Sales
• Indirect Sales Overhead
Salaries
• Channel Mix
• Activation commissions
• Residuals
• Volume Bonus Incentives
• Coop advertising
• MDF’s (Market
Development Funds)
• Spiffs/Promotions
• Credit Verification
• Training
- Enhance dealer agent training
- Enhance agent training and coaching
• Consolidate redundant functions or groups
• Territory alignment
• Span of control adjustment
• Sales process standardization
• Improve 3rd party Commission and Incentive structure
• Optimize/integrate 3rd party activation systems and tools
• Develop channel stategy to optimize use of indirect channel
• Strategic sourcing of sales collateral
• Partner relationship management
• Refer to retail for items that carrier can influence
• Gross adds by store
• ARPU by Channel
• CPGA by Channel
• Churn by Channel
Affiliates
• Commissions
• Affiliate Management
• Note: Sales Operations of affiliates are typically run by the
affiliates themselves. Improvement opportunities will mainly exist
around the management of the affiliates
Resellers / MVNO
• MOU
• Reseller/MVNO
Management
• Note: Sales Operations of resellers/MVNO's are typically run by
the MVNO's themselves. Improvement opportunities will mainly
exist around the management of the resellers/MVNO's and the
related reporting tools and processes. Depending on the level of
involvement in the business of the reseller/MVNO there will be
other areas (e.g. billing) where cost transformation could take
place.

70
Appendix
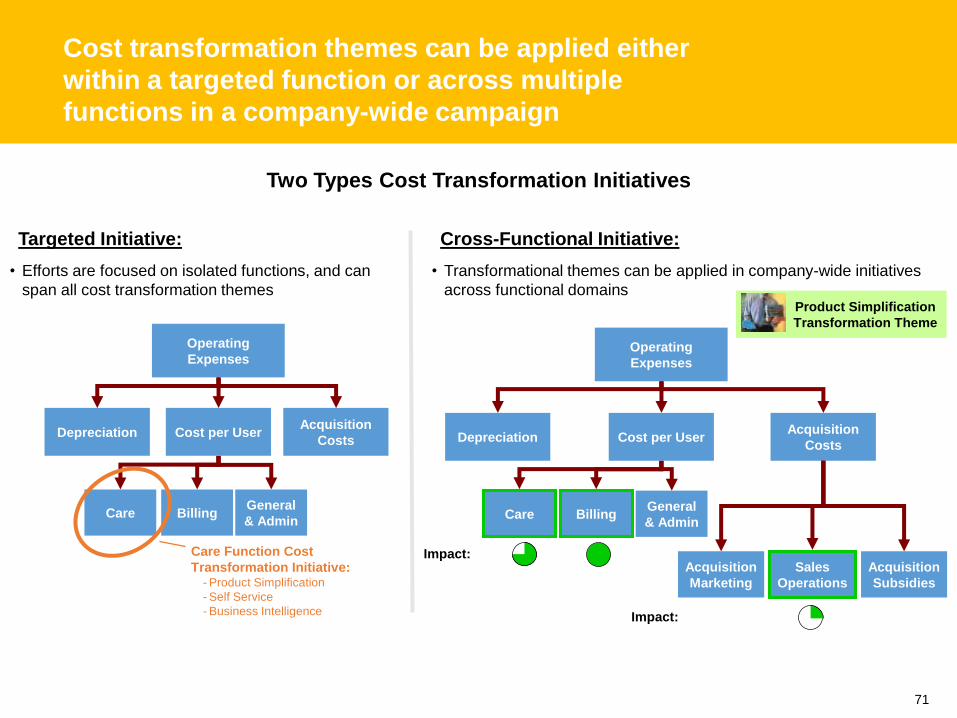
71
Cost transformation themes can be applied either
within a targeted function or across multiple
functions in a company-wide campaign
Two Types Cost Transformation Initiatives
Acquisition
CostsDepreciation
General
& AdminBillingCare
Operating
Expenses
Cost per User Acquisition
Costs
Acquisition
Marketing
Depreciation
General
& AdminBillingCare
Sales
Operations
Operating
Expenses
Cost per User
Acquisition
Subsidies
Targeted Initiative:
• Efforts are focused on isolated functions, and can
span all cost transformation themes
Care Function Cost
Transformation Initiative:- Product Simplification
- Self Service
- Business Intelligence
Cross-Functional Initiative:
• Transformational themes can be applied in company-wide initiatives
across functional domains
Impact:
Impact:
Product Simplification
Transformation Theme

72
To facilitate ease of comparison, operating expense
benchmarks have also been normalized as a
percentage of revenue
CPGA
Acquisition
Marketing
Other
G & ABillingCare
= In Scope
= Out of Scope
Base
Marketing /
Retention
Network
(Variable)
OpEx
CCPUCost per Gross
AcquisitionCash Cost
per User
Wireless Operating Expense Cost Tree
Credit &
CollectionsIT HR F & A
Sales
Operations
Acquisition
Subsidies
Device
SCM
• Depreciation / Amortization
6% 2% 12% 3% 24% 7% 6% 7%
16% 47% 20%
3% 4% 0.2% 1.2% 3%
Source: US DB Databook 2005, Large US Wireless Companies’ Financials
* Users*
Gross
Ads
OPEX % of Revenue82%

73
Potential savings ranges were also translated as a
percentage of total operating expenses to facilitate
analysis and comparison
CPGA
Acquisition
Marketing
Other
G & ABillingCare
= In Scope
= Out of Scope
Base
Marketing /
Retention
Network
(Variable)
OpEx
CCPUCost per Gross
AcquisitionCash Cost
per User
Wireless Operating Expense Cost Tree
Credit &
CollectionsIT HR F & A
Sales
Operations
Acquisition
Subsidies
Device
SCM
• Depreciation / Amortization
7% 3% 14% 4% 29% 8% 7% 9%
19% 57% 24%
4% 5% 0.3% 0.5% 4%
15-20%
Savings
11-15%
Savings
3-5%
Savings
2-3%
Savings
0.5-1%
Savings
4-5%
Savings
0.5-1%
Savings
4-6%
Savings
1-1.5%
Savings
0.5-1%
Savings
1-2%
Savings
0.5-0.7%
Savings
1.8-2%
Savings
0-0.2%
Savings
0.3-0.5%
Savings
0.6-1%
Savings
Savings % of Total OPEX Cost
Source: US DB Databook 2005, Large US Wireless Companies’ Financials
* Users*
Gross
Adds