Cost structure of bio-based plastics: A Monte-Carlo ...
33
Paper 197 HWWI Research Cost structure of bio-based plastics: A Monte-Carlo-Analysis for PLA Claudia Wellenreuther, André Wolf, Nils Zander Hamburg Institute of International Economics (HWWI) | 2021 ISSN 1861-504X
Transcript of Cost structure of bio-based plastics: A Monte-Carlo ...
Paper 197
HWWI Research
Cost structure of bio-based plastics: A Monte-Carlo-Analysis for PLA
Claudia Wellenreuther, André Wolf, Nils Zander
Hamburg Institute of International Economics (HWWI) | 2021ISSN 1861-504X

Corresponding authors:Dr. Claudia WellenreutherHamburg Institute of International Economics (HWWI)Oberhafenstr. 1 | 20097 Hamburg | GermanyTelephone: +49 (0)40 340576-337 | Fax: +49 (0)40 340576-150Email: [email protected]
Dr. André WolfHamburg Institute of International Economics (HWWI)Oberhafenstr. 1 | 20097 Hamburg | GermanyTelephone: +49 (0)40 340576-665 | Fax: +49 (0)40 340576-150Email: [email protected]
HWWI Research PaperHamburg Institute of International Economics (HWWI)Oberhafenstr. 1 | 20097 Hamburg | GermanyTelephone: +49 (0)40 340576-0 | Fax: +49 (0)40 [email protected] | www.hwwi.orgISSN 1861-504X
Editorial board:Prof. Dr. Henning Vöpel
© by the authors | June 2021The authors are solely responsible for the contents which do not necessarily represent the opinion of the HWWI.

HWWI Research Paper 197
Cost structure of bio-based plastics: A Monte-Carlo-Analysis for PLA
Claudia Wellenreuther, André Wolf, Nils Zander
This work has received funding from the European Union's Horizon 2020 research and innovation programme under grant agreement No. 860407.
Project BIO-PLASTICS EUROPE: https://bioplasticseurope.eu/
.

Cost structure of bio-based plastics: a Monte-Carlo-Analysis for PLA
Abstract
This paper conducts a meta-analysis of the estimated costs of producing Polylactic Acid (PLA). Cost contributions of specific inputs and process stages are identified through a production chain perspective. By applying the Monte Carlo technique, uncertainties in current estimates are reflected, both regarding technological input requirements and the development of input prices. Moreover, results are compared between two scenarios differing in feedstock choice: production from corn grain and from corn stover. The re-sults stress the specific importance of capital costs, energy, and the biological feedstocks as cost components. Nevertheless, the Monte Carlo simulations point out that the current state of knowledge is still subject to a high degree of uncertainty.
Keywords
Life Cycle Cost Analysis, bio-based plastics, PLA, plastic feedstocks, Monte Carlo Simulation

1 | Introduction
In the course of the transformation to a sustainable and circular bioeconomy, biobased and biodegradable plastics have gained increasing attention in recent years. The use of renewable instead of fossil raw materials is expected to have ecological advantages over conventional plastics in the form of a smaller carbon footprint and less intensive resource consumption. Moreover, the feature of biodegradability promises a solution to the in-creasingly pressing problem of plastic waste on land and in the sea. Therefore, the grow-ing environmental awareness of consumers is strengthening the demand for bio-based and biodegradable plastics, while at the same time policy measures worldwide, but par-ticularly, in Europe have supported the bioplastics industry. Nevertheless, according to estimates from the industry association European Bioplastics (2020), currently only about one percent of the more than 368 million tonnes of plastic produced worldwide are bio-based and/or biodegradable.
One of the main reasons for the limited market penetration is economics. Since plastic goods are largely standardized products such as packaging, price competitiveness plays a particularly important role. Bio-based plastics exhibit higher production costs than their fossil-based counterparts, especially in the segment of novel polymers that are in-teresting in terms of their biodegradability. In view of the complexity of the production processes, the reasons for this cannot be attributed from the outset to a particular input or technology. To better understand the market-side obstacles to the growth of the bio-based segment, representative estimates are therefore required. Unfortunately, the data situation in this respect is currently very limited. For example, there is currently no pub-lic database on the development of the average production costs of certain polymers at industry level. Existing estimates are usually based on individual technoeconomic case studies, the results of which are to a certain extent dependent on local production con-ditions and decisions regarding the use of specific feedstocks and technological setups. Therefore, to get an overview of the scattered data situation for individual polymers, meta-studies are required. In addition to the determination of a mean cost level, these should, if possible, also reflect the level of technological and market-related cost uncer-tainty in the existing estimates.
In this paper, we conduct such a meta-study for the polymer polylactic acid (PLA) based on current literature. PLA is currently the market leader in the segment of bio-based and biodegradable plastics, and at the same time the polymer that is generally estimated to come closest to conventional plastics in terms of its manufacturing costs. In addition to looking at the average cost pattern, we also seek to reflect the observed level of uncer-tainty by applying the Monte Carlo Technique. To acknowledge the current debate on the choice of feedstocks, we compare a scenario featuring corn grain as currently popular feedstock from the so-called first generation with a production scenario featuring corn

stover as an alternative second-generation feedstock. Finally, the framework is utilized for a discussion of future cost evolution by means of considering alternative long-term scenarios.
The remainder of the paper is structured as follows: Section 2 provides an introduction into the specific market situation for PLA. Section 3 discusses the results of existing life cycle cost studies on PLA production. Section 4 presents methodology and data basis of our own analysis. Section 5 presents results of the deterministic and stochastic analysis, while section 6 concludes.
2 | PLA - properties and market developments
The increasing interest in sustainable materials is reflected in the growing market for bio-based and biodegradable plastics. The latest market report from European Bioplas-tics 2020 shows steady growth in the bioplastics segment and indicates a global increase in bioplastics production capacity from about 2.11 million tonnes in 2020 to about 2.87 million tonnes in 2025. Currently, biodegradable plastics account for almost 60% of global bioplastics production capacity and will continue to grow faster than the bio-based and non-biodegradable plastics1 segment in the coming years (European Bioplas-tics, 2020). Among biodegradable plastics, PLA has currently the largest market share and promises the strongest growth compared to the other biodegradable polymers.
PLA is a bio-based and biodegradable polymer built from lactic acid molecules. Being a thermoplastic polyester, it will soften when heated and harden when cooled. It can be cooled and heated several times without changing its mechanical and chemical proper-ties. This allows the material to be shaped and processed by liquefaction and molding techniques and then recycled by similar processes. Due to its flexibility and other tech-nical properties, PLA can technically compete with conventional plastics and is therefore suitable for a wide range of applications, from single used packaging to durable con-sumer goods. Among the different application segments, packaging is by far the largest market segment for PLA and shows the highest growth rates (European Bioplastics, 2020).
While PLA can compete with conventional plastics from a technical point of view, the prices of PLA cannot currently keep up with those of conventional plastics. The produc-tion costs of PLA significantly exceed the costs of producing fossil-based plastics. PLA production generally involves the following process steps: raw material extraction, glu-cose extraction, fermentation, and polymerisation (see Figure 1). The exact process
1 Bio-based and non-biodegradable plastics include drop-in solutions such as bio-based PE (polyethylene) and bio-based PET (polyethylene ter-
ephthalate) as well as bio-based PA (polyamides) and currently account for just over 40 % of global bioplastics production capacity (European Bioplastics, 2020).
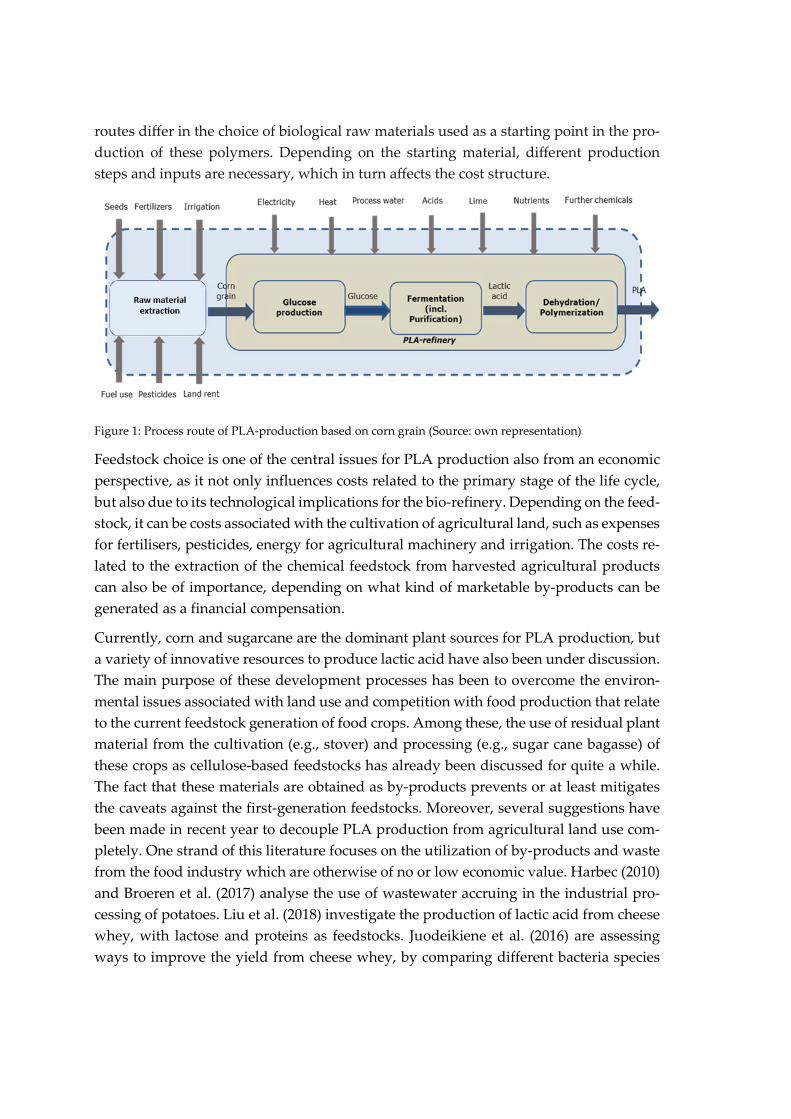
routes differ in the choice of biological raw materials used as a starting point in the pro-duction of these polymers. Depending on the starting material, different production steps and inputs are necessary, which in turn affects the cost structure.
Figure 1: Process route of PLA-production based on corn grain (Source: own representation)
Feedstock choice is one of the central issues for PLA production also from an economic perspective, as it not only influences costs related to the primary stage of the life cycle, but also due to its technological implications for the bio-refinery. Depending on the feed-stock, it can be costs associated with the cultivation of agricultural land, such as expenses for fertilisers, pesticides, energy for agricultural machinery and irrigation. The costs re-lated to the extraction of the chemical feedstock from harvested agricultural products can also be of importance, depending on what kind of marketable by-products can be generated as a financial compensation.
Currently, corn and sugarcane are the dominant plant sources for PLA production, but a variety of innovative resources to produce lactic acid have also been under discussion. The main purpose of these development processes has been to overcome the environ-mental issues associated with land use and competition with food production that relate to the current feedstock generation of food crops. Among these, the use of residual plant material from the cultivation (e.g., stover) and processing (e.g., sugar cane bagasse) of these crops as cellulose-based feedstocks has already been discussed for quite a while. The fact that these materials are obtained as by-products prevents or at least mitigates the caveats against the first-generation feedstocks. Moreover, several suggestions have been made in recent year to decouple PLA production from agricultural land use com-pletely. One strand of this literature focuses on the utilization of by-products and waste from the food industry which are otherwise of no or low economic value. Harbec (2010) and Broeren et al. (2017) analyse the use of wastewater accruing in the industrial pro-cessing of potatoes. Liu et al. (2018) investigate the production of lactic acid from cheese whey, with lactose and proteins as feedstocks. Juodeikiene et al. (2016) are assessing ways to improve the yield from cheese whey, by comparing different bacteria species

and enzymes used in fermentation. Nguyen et al. (2013) examine a scenario where waste from the industrial extraction of curcuminoid used in medical applications from the cur-cuma longa root is fermented to lactic acid through simultaneous saccharification and fermentation. De la Torre et al. (2018) consider a mixture of orange peel waste and corn steep liquor as substrates. Pleissner et al. (2016) investigate waste from coffee production, coffee pulp, as substrate. Alves de Oliveira et al. (2020) propose the use of sugar beet pulp obtained as a side product for animal feed from the process of extracting sugar from sugar beets. Another strand examines the potential to shift from land-based to sea-based resources. The cultivation and fermentation of sea plants rich in carbohydrates is seen as an opportunity to set up new production routes from scratch and thus preserve existing food production chains from being disrupted by plastic manufacturing. In this vein, Helmes et al. (2018) explore the use of the seaweed Ulva spp. in lactic acid produc-tion. Ögmundarson et al. (2020) experiment with the cultivation of brown algae of the species Laminaria sp. as feedstock source.
The level of production costs is therefore strongly dependent on raw material prices and technological progress in bioplastics production. In addition, production capacities and the associated economies of scale have an influence on unit costs. Political measures to promote sustainable alternatives to fossil-based plastics can support the expansion of production capacities for PLA. Furthermore, the development of prices for competing fossil-based plastics depending on the development of the crude oil price plays an im-portant role in the development of demand for bioplastics and thus also for the expan-sion of production capacities.
3 | Studies on the costs of PLA production
In order to find the most relevant journal articles analysing the cost structure of PLA production, an extensive literature search was conducted. For this purpose, generally recognised search engines such as Google Scholar, ResearchGate and the libraries of rel-evant publishers of scientific journals were searched using search terms such as "PLA cost analysis", "PLA cost", "techno-economic analysis PLA" or "PLA LCC". It has been shown that despite the recent growing interest in the production of bio-based plastics such as PLA, there is a lack of studies in the literature that assess the cost structure and techno-economic feasibility of commercial production of PLA.
In this section, the most relevant studies for this paper are presented in detail. These five studies examine the costs of the individual process steps in PLA production. Due to dif-ferent feedstocks considered for the production of PLA, the process routes investigated also differ between the studies. For this reason, the results are not directly comparable
with each other, but they do provide information on the cost structure and the approxi-mate cost range for the production of PLA.
In an older study by Jim Lunt & Associates (2010), the manufacturing process of PLA produced from locally grown raw materials is examined to test its economic viability. By applying an engineering cost model based on engineering expertise and publicly available information, the study estimates the costs of manufacturing PLA in Maine (USA). Two different process routes are investigated, which differ in the choice of feed-stock. One production route involves PLA production from potato starch, the other PLA production from sugar extracted from wood. The results of the cost analysis are com-pared with the current costs of PLA production from Midwest corn by NatureWorks.
The study identifies four major drivers for PLA costs. Firstly, raw material costs, which in the first case include the cost of dextrose, which is mainly obtained from potato pro-cessing waste, and in the second case costs of wood sugar. Secondly, additive and waste disposal costs, in particular the costs of chemicals, nutrients and gypsum waste associ-ated with bacterial fermentation. The third cost driver is process revenue, and the fourth cost driver comprises utility costs, e.g., electricity costs.
The process routes are examined in three scenarios, which differ in capital costs and the technology used to produce PLA. In all the scenarios, a plant capacity of 50,000 tonne of PLA is considered. The first scenario, the "greenfield" scenario, requires the highest cap-ital costs, as it assumes the construction of the plant from the ground up. The higher capital costs result from the provision of electricity, steam, and water systems in partic-ular. In addition, this scenario assumes that the traditional bacterial fermentation pro-cess is used to produce lactic acid, which is a more expensive technology. The second scenario achieves significant cost savings (approx. 22%) compared to the first scenario, as it assumes a "brownfield" construction strategy. Compared to the "greenfield" sce-nario, this strategy not only reduces the capital costs and thus simplifies the financing of plant construction, but also lowers the annual operating costs, including taxes, insurance, maintenance, return on investment and other expenses. Similar to the first scenario, tra-ditional bacterial fermentation technology is used here. The third scenario, the preferred one, achieves further significant cost reductions by using the new yeast fermentation technology while maintaining a brownfield construction strategy. Costs are 8% lower than in the other brownfield scenario and 29% lower than in the greenfield scenario. The cost structure of these processes is compared with the cost structure of the usual pro-cesses in which PLA is produced from Midwestern corn. The study concludes that by using advanced fermentation technologies and al-ready existing industrial infrastruc-ture, the considered scenario can compete with corn-based PLA.
Chiarakorn et al. (2014) investigate the production of PLA considering the Cargill Dow process by NatureWorks. In contrast to the study by the Jim Lunt & Associates (2010)

discussed earlier, the study by Chiarakorn et al. (2014) assesses environmental costs (in-direct costs) in addition to financial costs (or direct costs such as production costs and investment costs). Two production scenarios for PLA are analysed. In the first scenario, cassava roots are used as raw material to produce PLA. Cassava starch is extracted from the cassava roots, which is then converted into glucose and finally into PLA. The second scenario omits the first steps and starts with the production of glucose from cassava starch and then continues as the first scenario. The calculations include the potential di-rect costs of PLA production, raw material costs (cassava roots and chemicals), capital costs, labour costs, operating costs, and waste treatment costs. The environmental costs (indirect costs) of PLA production include two main cost items: the cost of CH4 emissions from wastewater and the cost of CO2 emissions resulting from electricity and fuel con-sumption. The total cost of PLA production from cassava starch to PLA resin (scenario 2) is 2.82 USD/kg PLA, which is higher than the total cost of PLA resin production from cassava root in the first scenario (i.e., 2.71 USD/kg PLA). The differences in the results of the two scenarios result from the fact that the production of PLA from cassava root in scenario 1 produces two by-products during starch extraction: cassava flour and gypsum. The costs and the benefits of these by-products are only included in the first scenario.
Kwan et al. (2018) carry out a techno-economic analysis of a food waste valorisation pro-cess for lactic acid, lactide and poly(lactic acid) production. In this study, a techno-eco-nomic assessment was carried out to investigate the technical feasibility, profitability and extent of investment risk between lactic acid (LA), lactide and PLA production using food waste powder as the raw material in a plant. The economic performance of the three scenarios was assessed by estimating capital costs, operating costs, and revenue genera-tion. The total capital costs include the fixed investment costs and the operating capital costs. The fixed investment refers to the expenditure for the construction of the plant, including the cost of equipment purchase, installation, piping and other related costs. Estimated operating costs include total variable production costs, fixed costs, plant over-heads and general costs. Revenue was generated from the sale of products and from the food waste treatment service fee. Various profitability indicators were employed to eval-uate the economic performance of the three scenarios. Kwan et al. 2018 conclude that all scenarios examined in this study are economically feasible, which is demonstrated with a range of economic indicators, with LA production (Scenario I) being the most profita-ble option. The minimum selling prices for one tonne of LA, lactide and PLA are USD 943, USD 2073 and USD 3330, respectively.
Sanaei and Stuart (2018) investigate the costs and economic performance of producing PLA using an innovative feedstock named triticale. Triticale (X Triticosecale Wittmack) is a crop that according to the authors has the potential to become a preferred industrial energy crop for bio-refineries. Compared to existing cereal crops such as wheat, the plant grows on marginal land and generates higher yields. Another advantage is that this crop
does not compete with food crops. The aim of their paper is to identify an economically promising strategy for the production of PLA based on this new raw material. In addi-tion to several economic indicators to evaluate the economic performance of different production scenarios, the study also provides cost estimates. The baseline scenario fea-tures the lowest technological risk while maximising the production capacity of the product. The alternative scenarios involve higher technological risks compared to the baseline scenario but can potentially lead to a better return on investment. The total pro-duction costs include the costs of raw materials (biomass and chemicals), energy and operating materials, maintenance and repair, labour, operating materials, insurance and overhead, administration, distribution and sales. The total costs estimated in this study range from USD 911/t PLA to USD 1496/t PLA, with the benchmark scenario having the highest costs.
Manandhar and Shah (2020) investigate the techno-economic feasibility of producing 100,000 tonnes of lactic acid per year from corn grains in a bio-refinery. In doing so, the study estimates the resource requirements (equipment, raw materials, energy and la-bour) and costs of producing lactic acid from bacteria, fungi and yeast-based fermenta-tion pathways. The study found that lactic acid production costs are very sensitive to sugar to lactic acid conversion rates, corn prices, plant size, annual operating hours and potential use of gypsum. The minimum selling price for the lactic acid produced from corn grain using different fermentation pathways was comparable to the market price of lactic acid. It was found that fermentation pathways using microorganisms such as yeast, which tolerate low pH and have high lactic acid yields, had the lowest production costs, estimated at USD 844/t of lactic acid. The total production costs of lactic acid from corn grain for the bacteria and fungi-based fermentation pathways were USD 1181/t and USD 1251/t, respectively. The authors point out that improvements in process efficiency and lower costs for raw materials, equipment and chemicals could further reduce pro-duction costs and improve the techno-economic feasibility of lactic acid production.
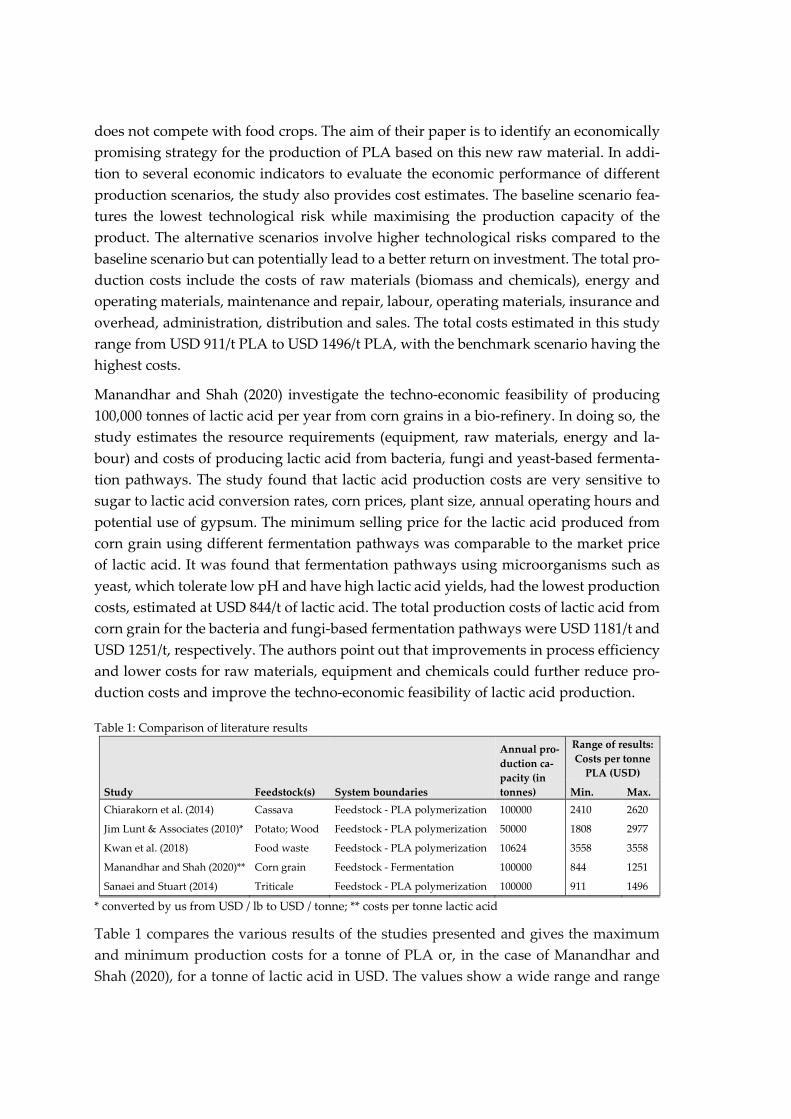
Table 1: Comparison of literature results
Study
Feedstock(s)
System boundaries
Annual pro-duction ca-pacity (in tonnes)
Range of results: Costs per tonne
PLA (USD)
Min. Max. Chiarakorn et al. (2014) Cassava Feedstock - PLA polymerization 100000 2410 2620
Jim Lunt & Associates (2010)* Potato; Wood Feedstock - PLA polymerization 50000 1808 2977
Kwan et al. (2018) Food waste Feedstock - PLA polymerization 10624 3558 3558
Manandhar and Shah (2020)** Corn grain Feedstock - Fermentation 100000 844 1251
Sanaei and Stuart (2014) Triticale Feedstock - PLA polymerization 100000 911 1496
* converted by us from USD / lb to USD / tonne; ** costs per tonne lactic acid
Table 1 compares the various results of the studies presented and gives the maximum and minimum production costs for a tonne of PLA or, in the case of Manandhar and Shah (2020), for a tonne of lactic acid in USD. The values show a wide range and range
from 844 to 3558 USD per tonne of PLA/LA. The main cost drivers identified in the stud-ies were: costs for raw materials, energy costs, labour costs and capital costs.
The wide range of results is due to the different process routes that were analysed. The processes differ in the selection of feedstocks and in the assumptions made regarding the production process. Therefore, the results are not directly comparable. A significant difference is due to the choice of feedstock, which has a great influence on the results. The choice of feedstock not only affects the costs directly associated with the raw mate-rial input, but also changes the subsequent technical steps in the process chain.
Another very cost-relevant factor in PLA production, is the energy use (i.e., electricity, heat) incurred for the individual process steps, particulary in the PLA refinery process. When innovative raw materials are used, the technology, which is not yet fully devel-oped, is usually associated with high energy intensity and thus represents a cost driver. The costs for additives and waste disposal also depend on the choice of feedstock and the subsequent technological process steps.
4 | Uncertainty analysis of cost drivers
4.1 | Methodology
4.1.1 | Production scenarios
In our analysis, we consider the scenario of an integrated PLA production facility, which includes all steps in the chemical conversion of the biological feedstock from pre-treat-ment to polymerization. This corresponds to the real production structure at large sup-pliers such as NatureWorks. Specifically, we compare two product systems that differ in the choice of feedstock. The first product system (henceforth termed corn grain-based system) considers corn grain as as feedstock substrate and hence reflects the current commercial situation. The process steps can be described as follows: the harvested grains are dried and transported to a corn wet milling facility nearby. There, they are separated by a wet milling process into their components, including starch. The starch undergoes enzymatic hydrolysis, splitting starch polymers into glucose monomers. Then, the glu-cose solution enters a bacteria-based fermentation process taking place in a facility inte-grated in the same refinery site. Calcium hydroxide is added to the solution to maintain the pH-value, the resulting calcium lactide is then acidified by means of sulfuric acid, generating lactic acid. The lactic acid is purified and then undergoes a polymerization process, also located at the same refinery site. After a series of pre-treatment steps, ring-

opening polymerization is performed to obtain PLA molecules, which are purified by means of chloroform and methanol.
The second product system (henceforth termed corn stover-based system) assumes corn stover to be the feedstock substrate. This has consequences for the chemical conversion processes, as in this case lignocellulose instead of starch represents the chemical feed-stock. Harvested stover is pre-treated through a washing and grinding procedure. Then, the resulting fine stover particles undergo an acid hydrolysis to obtain a fermentable sugar mix as an input to the fermentation procedure. Once lactic acid is obtained, the final steps are identical to those observed for the corn grain-based system. Figure 1 de-picts the process structure of the two systems. Regarding the geography of production, we assume in both systems that the PLA facility is located in the US. There are two main reasons for this. Firstly, it reflects the current production situation for corn-based PLA production on the part of the global suppler NatureWorks. Secondly, a large part of the input prices required for the cost analysis is only available on a USD basis and reflects the US cost situation.

Figure 2: Description of the two product systems considered (Source: own representation)
4.1.2 | Monte Carlo technique
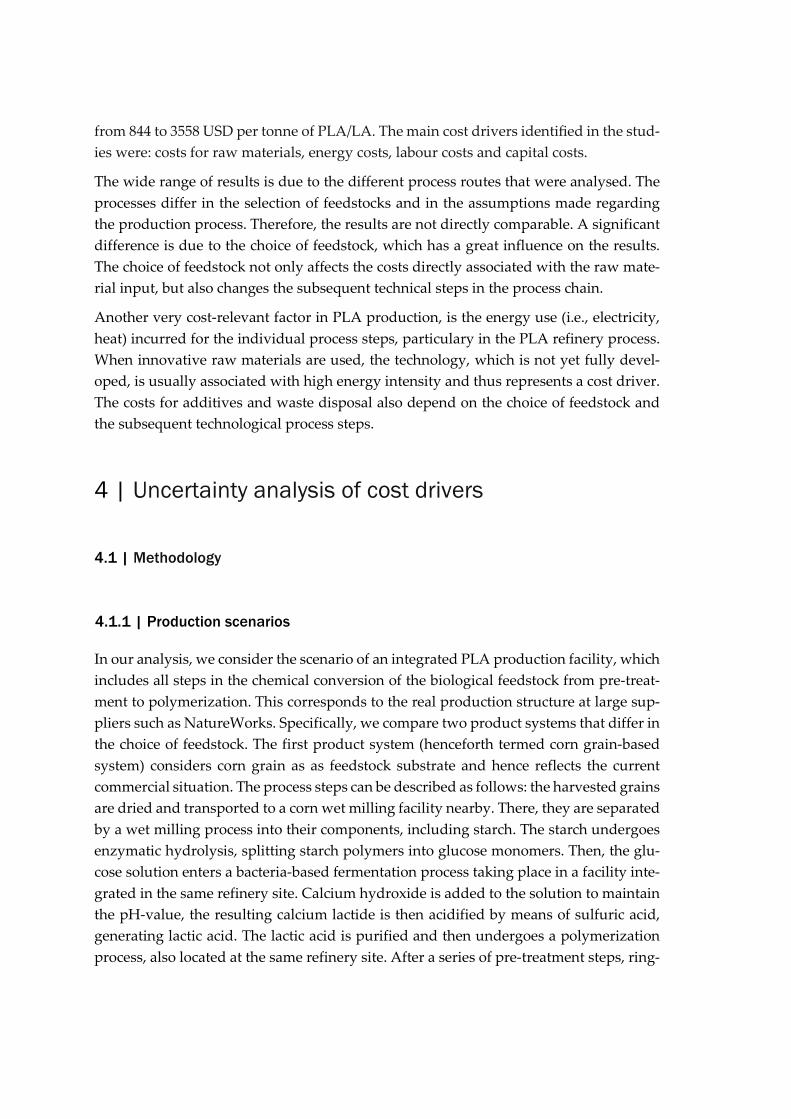
Due to the absence of detailed sector-wide data on the input mix, there exists consider-able uncertainty regarding the cost structure of bio-based plastics and PLA in particular. IFBB (2020) offers some average indicators, but only for the processing line of feedstocks itself, not for the use of energy and auxiliary materials. When reviewing current research, there is considerable heterogeneity in the technical data underlying the life cycle assess-ments in the literature, due to different data origins (experiments, process simulations, real-life production samples) and specific technological setups. This not just concerns alternative process routes for different feedstocks, but also the input mix involved in PLA production based on one and the same feedstock. Table 2 depicts for four important inputs the range of input use intensities in the production of corn-grain-/ corn-stover-based lactic acid found in recent papers in the literature.
System Boundaries
Seeds Fertilizers Farming activities
Irrigation Pesticides Land occupation Carbon uptake
Electricity
Heat
Process water
Process chemicals
Corn stover
Enzymes
Table 2: Range of input intensities for producing one kg of lactic acid reported in recent literature
Production based on corn grain
Milling and hydrolysis Fermentation
Input Unit Min. Max. Min. Max.
Corn grain kg 1.507 2.390 - -
Electricity kWh 0.002 0.002 0.002 0.312
Heat MJ 1.906 2.192 12.161 18.700
Lime kg - - 0.372 1.759
Production based on corn stover
Pre-treatment and
hydrolysis Fermentation
Input Unit Min. Max. Min. Max.
Corn stover kg 1.734 2.107 - -
Electricity kWh 0.070 0.080 0.009 2.388
Heat MJ 2.379 2.737 6.882 19.870
Lime kg - - 0.976 1.015
Sources: Adom & Dunn (2017); Harbec (2010); Maga et al. (2019); Ögmundarson et al. (2020); Vink et al.
(2015)
Cost uncertainty is not limited to technical parameters. Variations in input prices are another issue, both in a spatial (regional markets) and a time dimension (volatility). An essential task for a meta-analysis of PLA production costs is thus to make the extent of input-specific variations transparent. Then, implications for overall cost uncertainty can be assessed. In the following, we apply Monte Carlo simulation as a common tool for such a task. It has been used for cost estimations by various studies (Ge & Asgarpool, 2011; Wang et al., 2012), including the cost structure of corn-based biofuel production (Petter & Tyner, 2014), but has to the best of our knowledge not yet been applied to PLA production. The basic idea behind the Monte Carlo approach is to capture the output uncertainty of a system by means of specifying probability distributions for the relevant input parameters. Conducting a very large number of draws from these distributions and computing for each draw the resulting output leads to a distribution of output val-ues, in our case a distribution of the unit costs of PLA production.
A first step is to identify the most relevant cost drivers, whose variations are supposed to be reflected by statistical distributions in the model. Based on our discussion of liter-ature results, four major cost items stand out within the variables costs of corn-grain based PLA production: feedstock use, electricity consumption, heat consumption and use of lime in the fermentation stage. For these items, variations in input requirements as well as in prices are reflected by stochastic modelling. In addition, uncertainty in the size of capital costs is accounted for as well.

A second step is to make adequate distributional assumptions for the relevant cost in-puts. The PERT distribution and the Triangular distribution are popular distribution families in Monte Carlo risk assessment, mostly because they feature easy-to-interpret maximum and minimum values as distribution parameters (Petter & Tyner, 2014). How-ever, ideally the choice of a probability distribution should not be theoretically imposed but rooted in empirical observation. In many applications, this is prevented by the small number of data points available for a parameter value. In our case, this primarily holds for the technical input indicators. Following the meta-analysis approach, we draw for this on the input values reported by the life cycle studies cited above. The few observed values show a tendency to cluster around the mean, with single outliers in both direc-tions. On this basis, we prefer the PERT distribution over the Triangular distribution, as the former assigns less probability to the tails. For the price indicators, a larger amount of information in the form of price time series is available (see next section). In this case, the existence of market price volatility does not justify the specificiation of clear upper and lower bounds for the price distributions. Instead, we specify a lognormal approxi-mation as an approximation for the input prices.
Then, based on the distributional assumptions made, parameter values for each item-specific distribution are determined as sample estimates from the available data. Regard-ing capital costs, we are reliant on the estimates provided by the relevant cost analysis papers. As discussed above, they differ in basic assumptions on depreciation rates, maintenance costs and alternative returns to capital. We consider capital cost uncertainty by applying PERT distributions for each of these three parameters, specifying as mini-mum and maximum values the respective extreme values among the available estimates. The remainder of cost items (further variable cost components and labor costs) are con-sidered in the form of fixed quantities and prices.
Concerning the corn stover-based system, the same methodological approach as for corn grain is followed. An examination of the existing data reveals that the same factors (feed-stock, heat, electricity, lime) are dominating the cost performance and are therefore mod-elled as stochastic distributions here as well. In doing so, a specific issue represents the quantification of a feedstock price. Unlike corn grain, corn stover is not traded in a stand-ardized manner on commodity market platforms. Hence, there exists no market price data that can be utilized as a transparent cost source. Fortunately, there is a comprehen-sive research literature that aims to assess the costs of corn stover as a production input through alternative means. The general approach is to divide these costs in two catego-ries: costs related to the harvesting of the stover from the field and opportunity costs of alternative usage. Measured harvesting costs comprise activities like shredding, baling, storing and (sometimes) transport. The opportunity costs can only be measured in an indirect way, by considering the specific benefits of leaving the stover on the field. These benefits are typically monetized by estimating their nutrient contributions to the soil and

calculating the expenditures for mineral fertilizers needed to compensate the nutrient loss from harvesting. We follow this approach by drawing on data from this literature. The procedure of data collection is sketched in the next section.
4.2 | Data sources
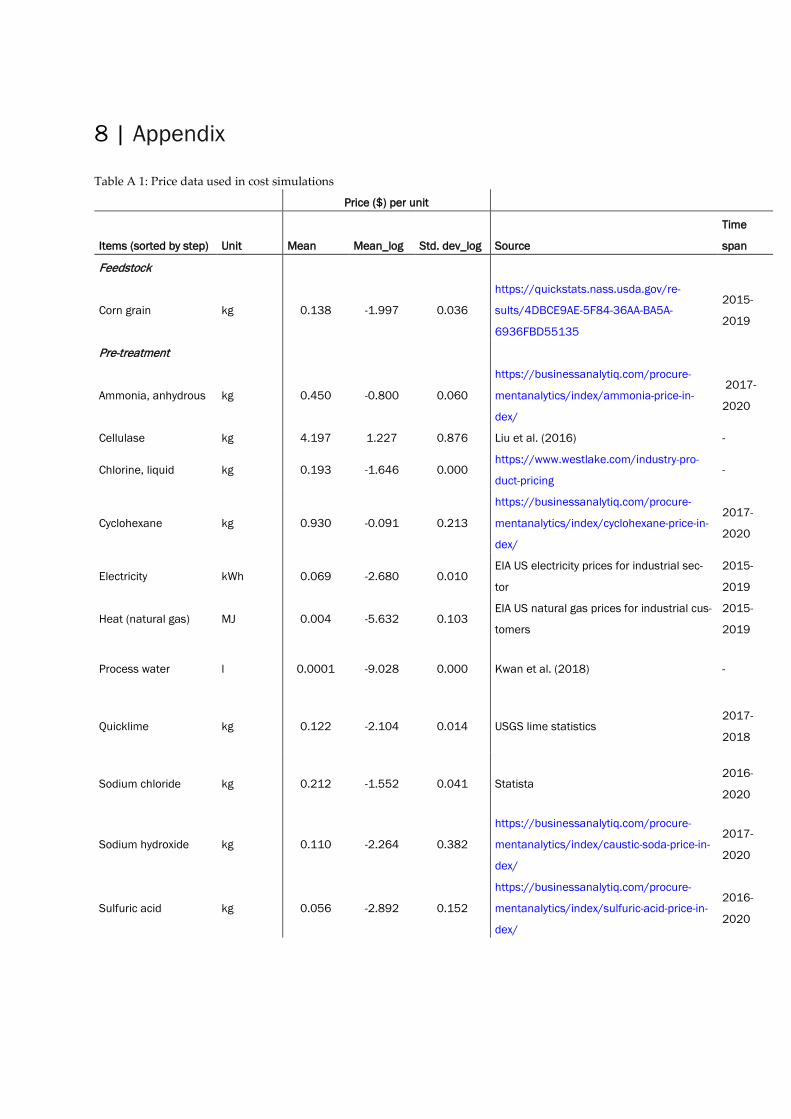
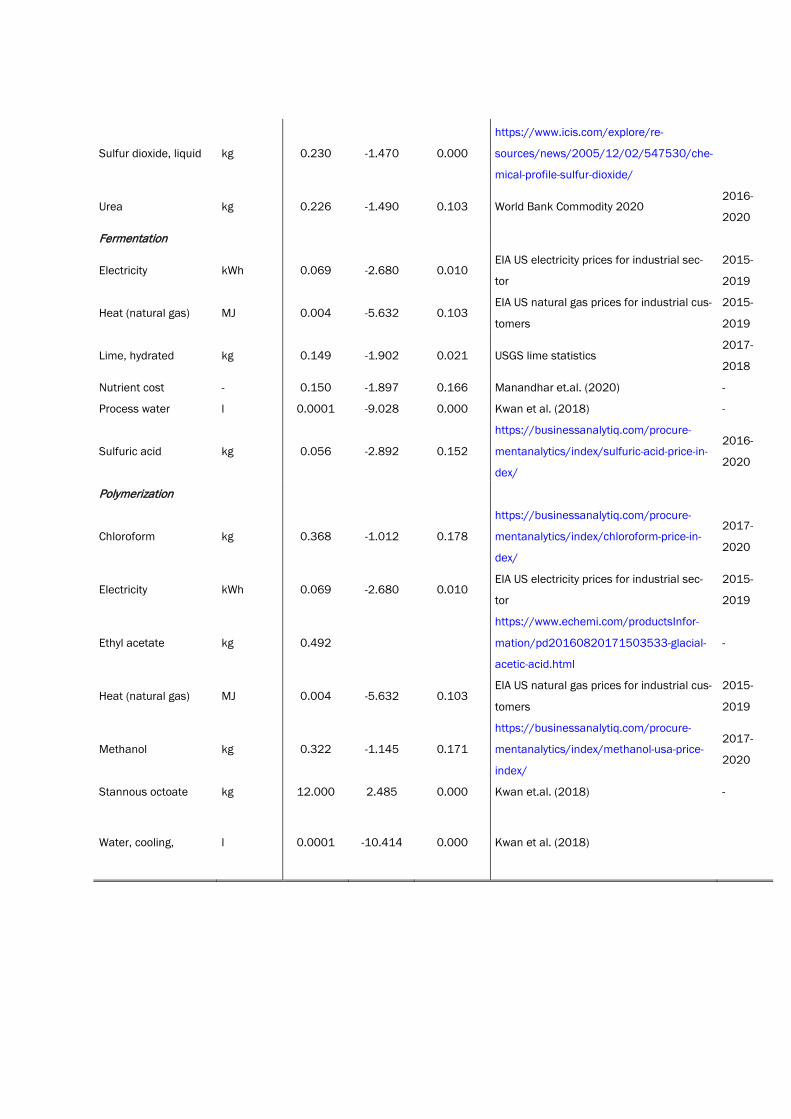
Following the methodological approach outlined above, the data requirements consist of three types of information: technical input quantities, unit prices of variable cost com-ponents and fixed cost estimates. Estimates for input quantities are drawn from recent papers on life cycle assessment, complemented by additional information on feedstock quantities from IFBB market reports. Only these sources offer information on input use in the necessary degree of detailedness required for our meta-analysis. Data on input prices are obtained from a variety of public sources. To reflect the scenario of US-based PLA production, price information at the national US level was generally favored. For three of the four major variable cost items high-frequency US price data were available: corn grain, heat and electricity. For all these items, parameters of the current price dis-tribution were estimated based on a subsample of values from the last five years. For the fourth major item (lime), prices were only available for the period from 2017 onwards. Accordingly, the period 2017-2020 represented here the calculation basis. Prices for the less relevant variable cost components were retrieved from different market platforms. In those cases where time series data was available, five-year averages were calculated to cancel out short-term volatility. Data on relevant parameters (total investments, de-preciation rates, maintenance rates, return on capital) stems from the cost analysis pa-pers cited above. All sources for particular items are listed in the Appendix.
Specific input requirements for corn stover-based PLA production can be drawn from the recent analyses by Adom & Dunn (2017) and Ögmundarson et al. (2020). Even though both sources consider the same process routes, they differ quite substantially in the use of certain inputs, pointing to a still high degree of technological uncertainty. We address the implications of this uncertainty by considering the input data from these papers as extreme ends for the probability distributions of our input values. Concerning the capital costs of corn stover-based production, no detailed results are yet available from the cost analysis literature. The only available source represents Liu et al. (2015). We adopt their estimate for total investment expenditures and apply to this the capital cost parameters of the corn grain-based system, in order to minimize distortions for the system comparison.
5 | Results
5.1 | Deterministic case
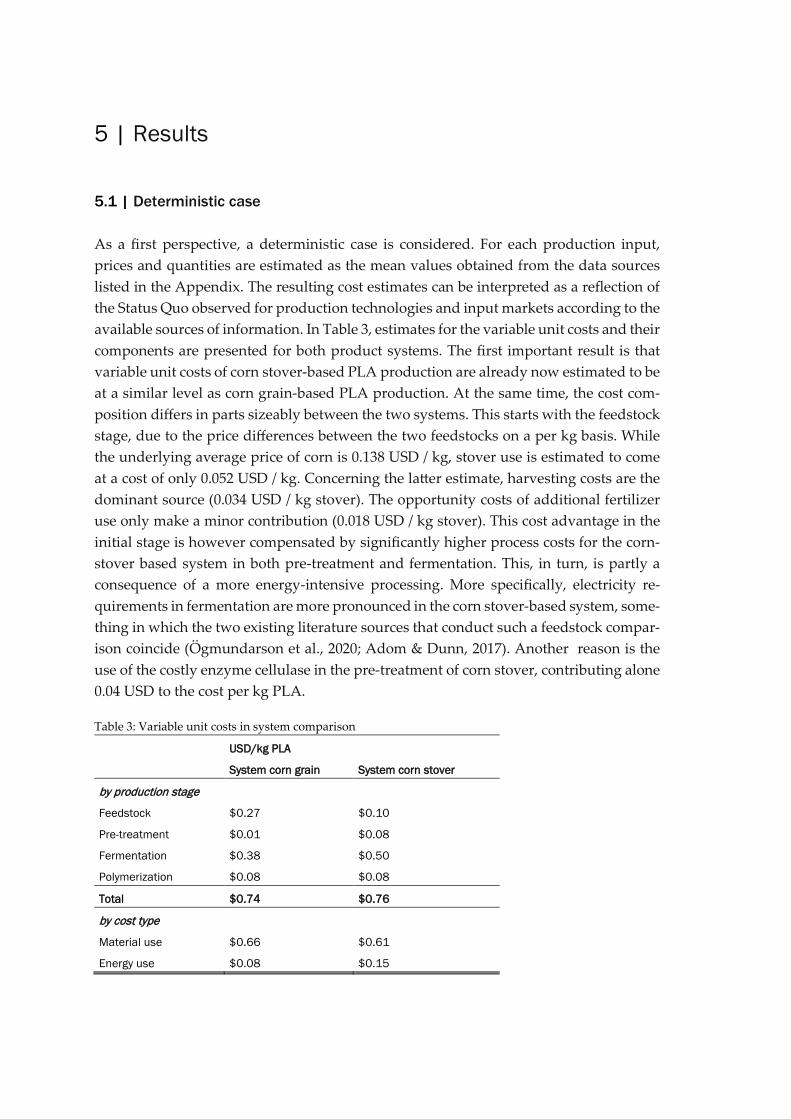
As a first perspective, a deterministic case is considered. For each production input, prices and quantities are estimated as the mean values obtained from the data sources listed in the Appendix. The resulting cost estimates can be interpreted as a reflection of the Status Quo observed for production technologies and input markets according to the available sources of information. In Table 3, estimates for the variable unit costs and their components are presented for both product systems. The first important result is that variable unit costs of corn stover-based PLA production are already now estimated to be at a similar level as corn grain-based PLA production. At the same time, the cost com-position differs in parts sizeably between the two systems. This starts with the feedstock stage, due to the price differences between the two feedstocks on a per kg basis. While the underlying average price of corn is 0.138 USD / kg, stover use is estimated to come at a cost of only 0.052 USD / kg. Concerning the latter estimate, harvesting costs are the dominant source (0.034 USD / kg stover). The opportunity costs of additional fertilizer use only make a minor contribution (0.018 USD / kg stover). This cost advantage in the initial stage is however compensated by significantly higher process costs for the corn-stover based system in both pre-treatment and fermentation. This, in turn, is partly a consequence of a more energy-intensive processing. More specifically, electricity re-quirements in fermentation are more pronounced in the corn stover-based system, some-thing in which the two existing literature sources that conduct such a feedstock compar-ison coincide (Ögmundarson et al., 2020; Adom & Dunn, 2017). Another reason is the use of the costly enzyme cellulase in the pre-treatment of corn stover, contributing alone 0.04 USD to the cost per kg PLA.
Table 3: Variable unit costs in system comparison
USD/kg PLA
System corn grain System corn stover
by production stage Feedstock $0.27 $0.10
Pre-treatment $0.01 $0.08
Fermentation $0.38 $0.50
Polymerization $0.08 $0.08
Total $0.74 $0.76
by cost type Material use $0.66 $0.61
Energy use $0.08 $0.15
Source: own calculations
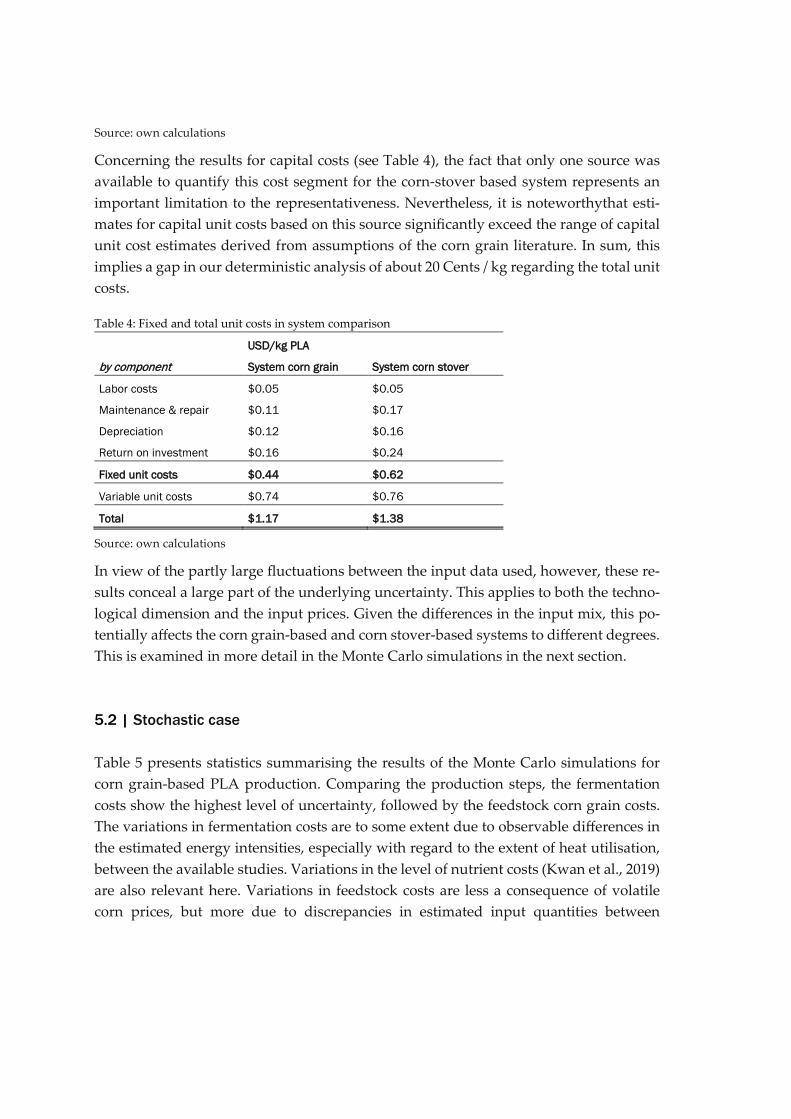
Concerning the results for capital costs (see Table 4), the fact that only one source was available to quantify this cost segment for the corn-stover based system represents an important limitation to the representativeness. Nevertheless, it is noteworthythat esti-mates for capital unit costs based on this source significantly exceed the range of capital unit cost estimates derived from assumptions of the corn grain literature. In sum, this implies a gap in our deterministic analysis of about 20 Cents / kg regarding the total unit costs.
Table 4: Fixed and total unit costs in system comparison
USD/kg PLA
by component System corn grain System corn stover
Labor costs $0.05 $0.05
Maintenance & repair $0.11 $0.17
Depreciation $0.12 $0.16
Return on investment $0.16 $0.24
Fixed unit costs $0.44 $0.62
Variable unit costs $0.74 $0.76
Total $1.17 $1.38
Source: own calculations
In view of the partly large fluctuations between the input data used, however, these re-sults conceal a large part of the underlying uncertainty. This applies to both the techno-logical dimension and the input prices. Given the differences in the input mix, this po-tentially affects the corn grain-based and corn stover-based systems to different degrees. This is examined in more detail in the Monte Carlo simulations in the next section.
5.2 | Stochastic case
Table 5 presents statistics summarising the results of the Monte Carlo simulations for corn grain-based PLA production. Comparing the production steps, the fermentation costs show the highest level of uncertainty, followed by the feedstock corn grain costs. The variations in fermentation costs are to some extent due to observable differences in the estimated energy intensities, especially with regard to the extent of heat utilisation, between the available studies. Variations in the level of nutrient costs (Kwan et al., 2019) are also relevant here. Variations in feedstock costs are less a consequence of volatile corn prices, but more due to discrepancies in estimated input quantities between

sources. Uncertainty in capital costs concerns both the annual loss in value of the capital employed and the level of annual expenditures for maintenance.
Table 5: Distribution of unit costs for corn grain-based PLA production
System corn grain USD/kg PLA
Mean Std. Dev. Max. Min.
Feedstock $0.27 $0.02 $0.32 $0.21
Pre-treatment $0.01 $0.00 $0.01 $0.01
Fermentation $0.38 $0.05 $0.55 $0.26
Polymerization $0.08 $0.01 $0.12 $0.05
Variable unit costs $0.74 $0.05 $0.91 $0.57
Fixed unit costs $0.44 $0.03 $0.51 $0.36
Total unit costs $1.18 $0.06 $1.37 $1.00
Source: own calculations
Table 6 shows the same statistics for the Monte Carlo simulations of the corn-stover based system. In this instance, the range of results from the drawings is somewhat more pronounced. This is primarily due to the greater uncertainty regarding the costs of the pre-treatment stage. Specifically, it is above all the price of the enzyme cellulase, for which strongly fluctuating values can be found in the literature (see also Liu et al., 2016). The likewise quite significant variation in the fermentation costs is more strongly at-tributable to fluctuations in electricity use than in the corn grain scenario. In the case of feedstock costs, the uncertainty about the extent of harvesting costs is primarily in the foreground. Histograms for variable and total unit costs in both product systems are shown in Figure 3. Overall, large areas of overlap can be observed here.
Table 6: Distribution of unit costs for corn stover-based PLA production
System corn stover USD/kg PLA
Mean Std. Dev. Max. Min.
Feedstock $0.10 $0.02 $0.15 $0.06
Pre-treatment $0.08 $0.06 $0.58 $0.03
Fermentation $0.50 $0.04 $0.65 $0.37
Polymerization $0.08 $0.01 $0.12 $0.06
Variable unit costs $0.77 $0.07 $1.30 $0.59
Fixed unit costs $0.63 $0.04 $0.74 $0.51
Total unit costs $1.40 $0.08 $1.97 $1.13
Source: own calculations

Figure 3: Estimated distributions of variable and total unit costs in both product systems (Source: own cal-
culations)
A comparison of the range of our results to the unit costs reported in the literature can be found in Table 7. The results of our corn grain scenario are roughly in the range of the results reported by Manandhar and Shah (2020). A direct comparison of the corn stover scenario with literature results is difficult, as the studies investigating innovative feed-stocks differ considerably in their scenario specifications. In principle, however, the higher degree of maturity of corn stover-based production seems to be reflected in cost advantages compared to third-generation feedstocks such as food waste. However, iso-lating the role of technology would require a consistent comparative analysis of different innovative feedstocks under the same basic setup.

Table 7: Comparison of own results with the literature
* converted by us from USD / lb to USD / tonne; ** costs per tonne lactic acid
5.3 | Long-term scenarios
The calculations carried out so far were based on data from the recent past and served to present the Status Quo. At present, bio-based materials play only a minor role on the plastics markets, as discussed in section 2. In the future, however, a significant increase in production capacities is expected. The industry association European Bioplastics ex-pects global production capacities to grow by 36 % over the period 2020-2025 (European Bioplastics, 2020). Longer-term estimates forecast global capacity growth of 79 % for the period 2018-2030 (Doehler et al., 2020). An important prerequisite for the realisation of these growth rates is an improvement in the price competitiveness of bio-based poly-mers like PLA. The future development of the cost structure will play a central role here. Against this background, scenarios for the long-term cost development of both product systems are investigated in this section, with the year 2030 defined as the target year. The basis for these scenarios is, on the one hand, the expected development in input prices. We focus here on three major inputs for which external long-term projections on price development are available: electricity, heat (natural gas) and corn grain. Long-term projections for US industry prices of electricity and natural gas are obtained from EIA (2020). US corn price predictions are obtained from the current USDA long-term projec-tions (USDA, 2020).
On the other hand, potential changes in input intensities are considered as well. Given the aforementioned capacity growth, a likely source for such changes are static and dy-namic scale economies in production. Static scale economies arise directly from im-
Cost estimates:
$ /MT PLA
Study Feedstock(s) System boundaries Min. Max.
Own Corn grain Feedstock - PLA polymerization 977 1401
Own Corn stover Feedstock - PLA polymerization 1130 1972
Chiarakorn et al. (2014) Cassava Feedstock - PLA polymerization 2410 2620
Jim Lunt & Associates (2010)* Potato; Wood Feedstock - PLA polymerization 1808 2977
Kwan et al. (2018) Food waste Feedstock - PLA polymerization 3558 3558
Manandhar and Shah
(2020)** Corn grain Feedstock - Fermentation 844 1251
Sanaei and Stuart (2014) Triticale Feedstock - PLA polymerization 911 1496
proved capacity utilization. Fixed costs are spread over a large production quantity, re-ducing costs of the single unit. Dynamic scale economies are productivity improvements resulting from learning effects of increased production experience. Given the still limited market outreach of bio-based plastics, some potential of unexploited learning effects should remain for the future. The extent of its productivity impact is however highly uncertain. Due to the absence of sector-level production data for bio-based polymers, no statistical evidence regarding productivity increases is available from the research liter-ature. Daugaard et al. (2015) report estimated learning rates for products from the bio-technology sector in total, presenting a wide range of annual rates from 5 % to 20 % productivity improvement. In our projections, we address this uncertainty by compar-ing different scenarios for this parameter. Since anything bigger than 5 % p.a. leads to implausibly high cost reductions over the 10-year-projection we are studying, we restrict our attention to the following three scenarios: 0 %, 2 % and 5 %.
At the same time, it is unlikely that productivity improvements cause all input require-ments to decrease in a homogeneous manner. Depending on the type of adjustments in the production technology, improvements could asymmetrically affect the energy inten-sity or the use of specific process chemicals. Since it is impossible to predict the exact nature of future technological change, we reflect also on this type of uncertainty by means of alternative sub-scenarios, distinguishing cases where the learning rates either affect the intensity of all energy inputs or of all material inputs. Moreover, simulations have in all cases been undertaken for both product systems. Since our projections involve no assumptions on the evolution of production capacities and no information on the future evolution of investment requirements is available, the simulation exercises are limited to the estimation of variable unit costs.
Table 8 presents the results for all scenarios, together with the results of the current benchmark scenario from section 5.1. When comparing corn grain-based with corn-stover based production, it is evident that the individual scenarios have very different effects on the estimated production costs of the two product systems. In the scenario without productivity improvement, i.e. pure price change, the production costs are ini-tially hardly changed in both cases. Only the costs for process heat make a measurable difference here compared to the benchmark scenario. While the EIA projections for the US industry price of electricity for 2030 imply a slight decrease of -2.6 % compared to the price in the benchmark scenario, the price of natural gas increases by 10.6 %. Corn prices, according to USDA projections, remain almost constant until 2030 (+ 1.4 %). Larger dis-crepancies arise in the scenarios featuring learning effects.
A general decrease in material intensity reduces costs in all process steps, most strongly in fermentation. In the corn-grain-based system, the overall cost reduction is somewhat greater than in the corn-stover-based system. This is due to the higher share of material consumption in production costs in the corn grain-based system. This difference is only
significant in the scenario with 5 % annual productivity growth. Even in the corn-stover-based system, however, variable unit costs would be halved by 2030 in this scenario. In contrast, the effects of declines in energy intensity in the same magnitude would be much smaller. In this respect, the corn-stover based system benefits more due to its cur-rently higher energy intensity. In the 5 % productivity scenario, the cost advantage is reversed in favor of the corn-stover based system.
Inreality, a comparison of the systems is complicated by the fact that, due to the different degrees of maturity, different extents of learning effects can be expected for the two tech-nologies. Ögmundarson et al. (2020) assign a Technology Readiness Level (TRL) of 4-5 to technologies based on second-generation feedstocks, compared to a level of 8-9 for first-generation feedstocks. Moreover, the same authors estimate the optimiziation po-tential for corn grain-based PLA as "low", the potential for corn stover-based PLA as "medium". This implies for the latter technology higher potentials for productivity in-creases via learning effects. Since the exploitation of this potential is associated with an increase in production volumes, this will also have a favorable effect on fixed unit costs in the medium term. In turn, this will additionally reduce the cost disadvantage com-pared with first-generation technology. However, given the current data situation, the speed at which this process will take place cannot yet be plausibly estimated.

Table 8: Results of long-term projections: variable unit costs USD/kg PLA
Current
Scenario 2030:
no technological change
System corn grain System corn stover System corn grain System corn stover
by production stage Feedstock $0.268 $0.101 $0.268 $0.101 Pre-treatment $0.009 $0.076 $0.011 $0.079 Fermentation $0.380 $0.501 $0.400 $0.514 Polymerization $0.080 $0.080 $0.080 $0.080
Total $0.737 $0.758 $0.759 $0.774
by cost type Material use $0.661 $0.611 $0.660 $0.610
Energy use $0.076 $0.147 $0.099 $0.164
Scenario 2030:
2 % p.a. reduction material intensity
Scenario 2030:
2 % p.a. reduction energy intensity
System corn grain System corn stover System corn grain System corn stover
by production stage
Feedstock $0.209 $0.079 $0.268 $0.101 Pre-treatment $0.011 $0.065 $0.009 $0.075 Fermentation $0.331 $0.433 $0.381 $0.482 Polymerization $0.063 $0.063 $0.080 $0.080
Total $0.615 $0.640 $0.738 $0.738
by cost type Material use $0.516 $0.477 $0.660 $0.610
Energy use $0.099 $0.164 $0.077 $0.128
Scenario 2030:
5 % p.a. reduction material intensity
Scenario 2030:
5 % p.a. reduction energy intensity
System corn grain System corn stover System corn grain System corn stover
by production stage
Feedstock $0.099 $0.037 $0.268 $0.101 Pre-treatment $0.011 $0.040 $0.005 $0.068 Fermentation $0.203 $0.281 $0.346 $0.424 Polymerization $0.031 $0.031 $0.079 $0.079
Total $0.344 $0.390 $0.697 $0.671
by cost type Material use $0.245 $0.226 $0.660 $0.610
Energy use $0.099 $0.164 $0.037 $0.061
Source: own calculations
6 | Conclusion
This study investigated cost patterns in the production of the bio-based polymer PLA, comparing two alternative feedstocks: corn grain and corn stover. While PLA produc-tion based on corn grain has long been established on a larger scale, the feedstock alter-native corn stover, which is interesting from the perspective of land use savings, has not yet reached the stage of mass production. As far as the current cost situation is con-cerned, we estimate that corn stover-based PLA is already competitive with corn grain-based PLA in terms of variable costs. However, this is overshadowed by the disad-vantage of higher fixed costs. In addition, our Monte Carlo simulation clearly demon-strates that cost estimates based on the current state of knowledge are associated with a high degree of uncertainty. This holds particularly in the case of corn stover, foremost with regard to input intensity. At the same time, the identified differences in the cost structure of corn grain- and corn stover-based PLA production imply different responses of cost levels to exogenous developments such as changes in input prices. This makes it difficult to predict the future performance of these two production alternatives.
Finally, our long-term scenarios based on external price forecasts have indicated that the technology factor will continue to be essential for cost competitiveness in the future. A key issue will be the extent to which the two production alternatives can benefit from learning effects in the context of production increases. In this regard, the fact that corn stover-based PLA represents the less mature technology generally implies higher learn-ing potentials. However, the degree to which these potentials can be realized will also depend on the speed at which corresponding production capacities can be built up. In the upscaling phase, capacity growth is likely to be restrained by the demand side. To reach a state of competitiveness, it will hence be important for producers to convince their customers of the environmental superiority of such a feedstock switch. The current public discussion on land usage of the bioeconomy sector can be supportive here. At the same time, one needs to be aware that corn stover is only one of many innovative feed-stock options that have proven to be technically feasible. Achieving an optimal balance of cost competitiveness and ecological impacts would require consistent life cycle com-parisons between different second- and third-generation feedstock technologies. This represents an important task for future research.
7 | References
Adom, F. K., & Dunn, J. B. (2017). Life cycle analysis of corn‐stover‐derived poly-mer‐grade l‐lactic acid and ethyl lactate: greenhouse gas emissions and fossil energy consumption. Biofuels, Bioproducts and Biorefin-ing, 11(2), 258-268.
Alves de Oliveira, R., Schneider, R., Hoss Lunelli, B., Vaz Rossell, C. E., Maciel Filho, R., & Venus, J. (2020). A Simple Biorefinery Concept to Produce 2G-Lactic Acid from Sugar Beet Pulp (SBP): A High-Value Target Approach to Valorize a Waste Stream. Molecules, 25(9), 2113.
Broeren, M. L. M., Kuling, L, Worrell, E., Shen, L. (2017). Environmental impact assess-ment of six starch plastics focusing onwastewater-derived starch and additives Re-sources. Conservation and Recycling, 127, 246-255.
Chiarakorn, S.; Permpoonwiwat, C. K.; Nanthachatchavankul, P. (2014). Financial and Economic Viability of Bioplastic Production in Thailand; WorldFish (ICLARM) – Econ-omy and Environment Program for Southeast Asia (EEPSEA), Research Report 7, Phil-ippines.
Daugaard, T., Mutti, L.A., Wright, M.M., Brown, R.C. and Componation, P. (2015). Learning rates and their impacts on the optimal capacities and production costs of bio-refineries. Biofuels, Bioprod. Bioref., 9: 82-94.
De la Torre, I., Ladero, M., & Santos, V. E. (2018). Production of d-lactic acid by Lacto-bacillus delbrueckii ssp. delbrueckii from orange peel waste: techno-economical assess-ment of nitrogen sources. Applied mi-crobiology and biotechnology, 102(24), 10511-10521.
Döhler, N., Wellenreuther, C., Wolf, A. (2020). Market dynamics of bioplastics: demand projections and linkages to European policies. HWWI Research Paper No. 193.
European Bioplastics (2020). Bioplastics Market Development Update 2020: https://docs.european-bioplastics.org/conference/Report_Bioplastics_Mar-ket_Data_2020_short_version.pdf
Ge, H., & Asgarpoor, S. (2011). Parallel Monte Carlo simulation for reliability and cost evaluation of equipment and systems. Electric Power Systems Research, 81(2), 347-356.
Harbec, A. (2010). Lactic acid production from agribusiness waste starch fermentation with Lactobacillus Amylophilus and its cradle-to-gate Life Cycle Assessment as a pre-cursor to Poly-L-Lactide, Université De Montréal.
Helmes, R.J.K., López-Contreras, A.M., Benoit, M.; Abreu, H., Maguire, J., Moejes, F. & Burg, S.W.K. (2018). Environmental Impacts of Experimental Production of Lactic Acid for Bioplastics from Ulva spp., Sustainability, 10, 2462, 1-15.

IfBB (2020). Biopolymers - facts and statistics, Production capacities, processing routes, feedstock, land and water use. Institute for Bioplastics and Biocomposites, https://www.ifbb-hannover.de/files/IfBB/downloads/faltblaetter_broschueren/f+s/Bi-opolymers-Facts-Statistics-2020.pdf.
Jim Lunt & Associates (2010). The business case for commercial production of bioplastics in Maine. Preliminary report to the Maine Technology Institute.
Juodeikiene, G., Zadeike, D., Bartkiene, E., & Klupsaite, D. (2016). Application of acid tolerant Pedioccocus strains for increasing the sustainability of lactic acid production from cheese whey. LWT-Food science and Technology, 72, 399-406.
Kwan, T. H., Hu, Y., & Lin, C. S. K. (2018). Techno-economic analysis of a food waste valorisation process for lactic acid, lactide and poly (lactic acid) production. Journal of cleaner production, 181, 72-87.
Liu, J., Zhao, Y., Diao, M., Wang, W., Hua, W., Wu, S., ... & Cheng, Y. (2019). Poly (3-hydroxybutyrate-co-3-hydroxyvalerate) Production by Rhodospirillum rubrum Using a Two-Step Culture Strategy. Journal of Chemistry, 2019.
Maga, D., Hiebel, M., & Thonemann, N. (2019). Life cycle assessment of recycling options for polylactic acid. Resources, Conservation and Recycling, 149, 86-96.
Manandhar, A.; Shah, A. (2020). Techno-Economic Analysis of Bio-Based Lactic Acid Production Utilizing Corn Grain as Feedstock. Processes 8 (2), S. 199. DOI: 10.3390/pr8020199.
Nguyen, C. M., Kim, J. S., Nguyen, T. N., Kim, S. K., Choi, G. J., Choi, Y. H., ... & Kim, J. C. (2013). Production of L-and D-lactic acid from waste Curcuma longa biomass through simultaneous saccharification and cofermentation. Bioresource technology, 146, 35-43.
Ögmundarson, Ó., Sukumara, S., Laurent, A., & Fantke, P. (2020). Environmental hotspots of lactic acid production systems. GCB Bioenergy, 12(1), 19–38.
Petter, R., & Tyner, W. E. (2014). Technoeconomic and policy analysis for corn stover biofuels. International Scholarly Research Notices, 2014.
Pleissner, D., Neu, A. K., Mehlmann, K., Schneider, R., Puerta-Quintero, G. I., & Venus, J. (2016). Fermentative lactic acid production from coffee pulp hydrolysate using Bacil-lus coagulans at laboratory and pilot scales. Bioresource Technology, 218, 167-173.
Sanaei, S., & Stuart, P. R. (2018). Systematic assessment of triticale‐based biorefinery strategies: Techno‐economic analysis to identify investment opportunities. Biofuels, Bi-oproducts and Biorefining, 12, S46-S59.

Vink, E. T. H., & Davies, S. (2015). Life Cycle Inventory and Impact Assessment Data for 2014 Ingeo® Polylactide Production. Industrial Biotechnology, 11(3), 167–180.
Wang, N., Chang, Y. C., & El-Sheikh, A. A. (2012). Monte Carlo simulation approach to life cycle cost management. Structure and Infrastructure Engineering, 8(8), 739-746.
8 | Appendix
Table A 1: Price data used in cost simulations
Price ($) per unit
Items (sorted by step)
Unit Mean Mean_log Std. dev_log Source
Time
span
Feedstock
Corn grain kg 0.138 -1.997 0.036
https://quickstats.nass.usda.gov/re-
sults/4DBCE9AE-5F84-36AA-BA5A-
6936FBD55135
2015-
2019
Pre-treatment
Ammonia, anhydrous kg 0.450 -0.800 0.060
https://businessanalytiq.com/procure-
mentanalytics/index/ammonia-price-in-
dex/
2017-
2020
Cellulase kg 4.197 1.227 0.876 Liu et al. (2016) -
Chlorine, liquid kg 0.193 -1.646 0.000 https://www.westlake.com/industry-pro-
duct-pricing -
Cyclohexane kg 0.930 -0.091 0.213
https://businessanalytiq.com/procure-
mentanalytics/index/cyclohexane-price-in-
dex/
2017-
2020
Electricity kWh 0.069 -2.680 0.010 EIA US electricity prices for industrial sec-
tor
2015-
2019
Heat (natural gas) MJ 0.004 -5.632 0.103 EIA US natural gas prices for industrial cus-
tomers
2015-
2019
Process water l 0.0001 -9.028 0.000 Kwan et al. (2018) -
Quicklime kg 0.122 -2.104 0.014 USGS lime statistics 2017-
2018
Sodium chloride kg 0.212 -1.552 0.041 Statista 2016-
2020
Sodium hydroxide kg 0.110 -2.264 0.382
https://businessanalytiq.com/procure-
mentanalytics/index/caustic-soda-price-in-
dex/
2017-
2020
Sulfuric acid kg 0.056 -2.892 0.152
https://businessanalytiq.com/procure-
mentanalytics/index/sulfuric-acid-price-in-
dex/
2016-
2020
Sulfur dioxide, liquid kg 0.230 -1.470 0.000
https://www.icis.com/explore/re-
sources/news/2005/12/02/547530/che-
mical-profile-sulfur-dioxide/
Urea kg 0.226 -1.490 0.103 World Bank Commodity 2020 2016-
2020
Fermentation
Electricity kWh 0.069 -2.680 0.010 EIA US electricity prices for industrial sec-
tor
2015-
2019
Heat (natural gas) MJ 0.004 -5.632 0.103 EIA US natural gas prices for industrial cus-
tomers
2015-
2019
Lime, hydrated kg 0.149 -1.902 0.021 USGS lime statistics 2017-
2018
Nutrient cost - 0.150 -1.897 0.166 Manandhar et.al. (2020) -
Process water l 0.0001 -9.028 0.000 Kwan et al. (2018) -
Sulfuric acid kg 0.056 -2.892 0.152
https://businessanalytiq.com/procure-
mentanalytics/index/sulfuric-acid-price-in-
dex/
2016-
2020
Polymerization
Chloroform kg 0.368 -1.012 0.178
https://businessanalytiq.com/procure-
mentanalytics/index/chloroform-price-in-
dex/
2017-
2020
Electricity kWh 0.069 -2.680 0.010 EIA US electricity prices for industrial sec-
tor
2015-
2019
Ethyl acetate kg 0.492
https://www.echemi.com/productsInfor-
mation/pd20160820171503533-glacial-
acetic-acid.html
-
Heat (natural gas) MJ 0.004 -5.632 0.103 EIA US natural gas prices for industrial cus-
tomers
2015-
2019
Methanol kg 0.322 -1.145 0.171 https://businessanalytiq.com/procure-
mentanalytics/index/methanol-usa-price-
index/
2017-
2020
Stannous octoate kg 12.000 2.485 0.000 Kwan et.al. (2018) -
Water, cooling, l 0.0001 -10.414 0.000 Kwan et al. (2018)
The Hamburg Institute of International Economics (HWWI) is an independent
economic research institute that carries out basic and applied research and pro-
vides impulses for business, politics and society. The Hamburg Chamber of Com-
merce is shareholder in the Institute whereas the Helmut Schmidt University /
University of the Federal Armed Forces Hamburg is its scientific partner. The Insti-
tute also cooperates closely with the HSBA Hamburg School of Business Adminis-
tration.
The HWWI’s main goals are to:
• Promote economic sciences in research and teaching;
• Conduct high-quality economic research;
• Transfer and disseminate economic knowledge to policy makers,
stakeholders and the general public.
The HWWI carries out interdisciplinary research activities in the context of the fol-
lowing research areas:
• Digital Economics
• Labour, Education & Demography
• International Economics and Trade
• Energy & Environmental Economics
• Urban and Regional Economics
Hamburg Institute of International Economics (HWWI)
Oberhafenstr. 1 | 20097 Hamburg | GermanyTelephone: +49 (0)40 340576-0 | Fax: +49 (0)40 [email protected] | www.hwwi.org