Cost Sharing in Education - Public Finance, School …saide.org.za/resources/Library/Penrose - Cost...
141
Cost Sharing in Education - Public Finance, School and Household Perspectives - Education Research Paper No. 27, 1998, 141 p. Table of Contents EDUCATION RESEARCH Perran Penrose September 1998 Serial No. 27 ISBN: 186192 056 3 Department For International Development Table of Contents Department For International Development - Education Papers Abbreviations I Introduction and Background
Transcript of Cost Sharing in Education - Public Finance, School …saide.org.za/resources/Library/Penrose - Cost...

Cost Sharing in Education - Public Finance, School and Household Perspectives - Education Research Paper No. 27, 1998, 141 p.
Table of Contents
EDUCATION RESEARCH
Perran PenroseSeptember 1998
Serial No. 27ISBN: 186192 056 3
Department For International Development
Table of Contents
Department For International Development - Education Papers
Abbreviations
I Introduction and Background
A. IntroductionB. Background & DefinitionsC. Principle Questions
II Principles of Cost sharing and Key Issues
A. IntroductionB. RightsC. Economics and FinanceD. CultureE. Foreign AidF. Conclusions
III Case Studies in Cost Sharing - Ghana
A. IntroductionB. Overview of the Ghanaian Education SystemC. The Economy, Public Finance and the Education SectorD. Trends in Recurrent Education Expenditures in GhanaE. Distribution of the Benefits of Public ExpenditureF. Household Expenditures and Cost Sharing in EducationG. Conclusions
IV Case Studies in Cost Sharing: Tanzania
A. IntroductionB. Structure of the Education SystemC. The Economy, Public Finance and the Education SectorD. Trends in Recurrent Education Expenditures in TanzaniaE. Distribution of the Benefits from Public ExpenditureF. Household Expenditures and Cost Sharing in EducationG. Conclusions
V Conclusions for Cost Sharing Policy
A. Cost Sharing in PerspectiveB. Package of Reforms

C. Summary and Conclusions
Bibliography
Cost Sharing in Education - Public Finance, School and Household Perspectives - Education Research Paper No. 27, 1998, 141 p.
[Table of Contents] [Next Page]
Department For International Development - Education Papers This is one of a series of Education Papers issued from time to time by the Education Division of the Department For International Development. Each paper represents a study or piece of commissioned research on some aspect of education and training in developing countries. Most of the studies were undertaken in order to provide informed judgements from which policy decisions could be drawn, but in each case it has become apparent that the material produced would be of interest to a wider audience, particularly but not exclusively to those whose work focuses on developing countries.
Each paper is numbered serially, and further copies can be obtained through the DFID's Education Division, 94 Victoria Street, London SW1E 5JL, subject to availability. A full list appears overleaf.
Although these papers are issued by the DFID, the views expressed in them are entirely those of the authors and do not necessarily represent the DFID's own policies or views. Any discussion of their content should therefore be addressed to the authors and not to the DFID.
LIST OF OTHER DFID EDUCATION PAPERS AVAILABLE IN THIS SERIES
No. 1 Pennycuick, D. 1993 'SCHOOL EFFECTIVENESS IN DEVELOPING COUNTRIES: A SUMMARY OF THE RESEARCH EVIDENCE' ISBN: 0 90250 061 9
No. 2 Hough, J.R. 1993 'EDUCATIONAL COST-BENEFIT ANALYSIS' ISBN: 0 90250 062 7
No. 3 Gray, L. et al 1993 'REDUCING THE COST OF TECHNICAL AND VOCATIONAL EDUCATION' ISBN: 0 90250 063 5
No. 4 Williams, E. 1993 'REPORT ON READING ENGLISH IN PRIMARY SCHOOLS IN MALAWI' ISBN: 0 90250 064 3 (See also No. 24)
No. 5 Williams, E. 1993 'REPORT ON READING ENGLISH IN PRIMARY SCHOOLS IN ZAMBIA' ISBN: 0 90250 065 1 (See also No. 24)

No. 6 Lewin, K. 1993 'EDUCATION AND DEVELOPMENT: THE ISSUES AND THE EVIDENCE' ISBN: 0 90250 066 X
No. 7 Penrose, P. 1993 'PLANNING AND FINANCING: SUSTAINABLE EDUCATION SYSTEMS IN SUB SAHARAN AFRICA' ISBN: 0 90250 067 8
No. 8 (not issued)
No. 9 Brock, C. Cammish, N. 1991 (Revised 1997) - 'FACTORS AFFECTING FEMALE PARTICIPATION IN EDUCATION IN SEVEN DEVELOPING COUNTRIES' ISBN: 1 86192 065 2
No. 10 Rogers, A. 1994 'USING LITERACY: A NEW APPROACH TO POST-LITERACY METHODS' ISBN: 1 86192 070 9
No. 11 McGrath, S. King, K. et al. 1995 (Reprinted 1997) 'EDUCATION AND TRAINING FOR THE INFORMAL SECTOR' Vol. 1 and Vol. 2 - Case studies. ISBN: 1 86192 090 3
No. 12 Little, A. 1995 'MULTI-GRADE TEACHING: A REVIEW OF RESEARCH AND PRACTICE' ISBN: 0 90250 058 9
No. 13 Bilham, T. Gilmour, R. 1995 'DISTANCE EDUCATION IN ENGINEERING FOR DEVELOPING COUNTRIES' ISBN: 0 90250 068 6
No. 14 Barnett, E. de Koning, K. Francis, V. 1995 'HEALTH & HIV/AIDS EDUCATION IN PRIMARY & SECONDARY SCHOOLS IN AFRICA & ASIA' ISBN: 0 90250 069 4
No. 15 Gray, L. Warrender, A.M. Davies, P. Hurley, G. Manton, C. 1995 'LABOUR MARKET SIGNALS & INDICATORS' ISBN: 0 90250 070 8
No. 16 Lubben, F. Campbell R. Dlamini B. 1995 'IN-SERVICE SUPPORT FOR A TECHNOLOGICAL APPROACH TO SCIENCE EDUCATION' ISBN: 0 90250 071 6
No. 17 Archer, D. Cottingham, S 1996 'ACTION RESEARCH REPORT ON REFLECT' ISBN: 0 90250 072 4
No. 18 Kent, D. Mushi, P. 1996 'THE EDUCATION AND TRAINING OF ARTISANS FOR THE INFORMAL SECTOR IN TANZANIA' ISBN: 0 90250 074 0
No. 19 Brock, C. Cammish, N. 1997 'GENDER, EDUCATION AND DEVELOPMENT - A PARTIALLY ANNOTATED AND SELECTIVE BIBLIOGRAPHY' ISBN: 0 90250 076 7
No. 20 Taylor, P. Mulhall, A. 1997 'CONTEXTUALISING TEACHING AND LEARNING IN RURAL PRIMARY SCHOOLS: USING AGRICULTURAL EXPERIENCE' Vol. I ISBN: 1 861920 45 8 Vol. 2 (Case Studies) ISBN: 1 86192 050 4

No. 21 Kutnick, P. Jules, V. Layne, A. 1997 'GENDER AND SCHOOL ACHIEVEMENT IN THE CARIBBEAN' ISBN: 1 86192 080 6
No. 22 Bourne, R. Gundara, J. Dev, A. Ratsoma, N. Rukanda, M. Smith, A. Birthistle, U. 1997 'SCHOOL-BASED UNDERSTANDING OF HUMAN RIGHTS IN FOUR COUNTRIES: A COMMONWEALTH STUDY' ISBN: 1 86192 095 4
No. 23 Stephens, D. 1998 'GIRLS AND BASIC EDUCATION: A CULTURAL ENQUIRY' ISBN: 1 86192 036 9
No. 24 Williams, E. 1998 'INVESTIGATING BILINGUAL LITERACY: EVIDENCE FROM MALAWI AND ZAMBIA' (Updated and combined reissue of Serial No. 4 & 5) ISBN: 1 86192 041 5
No. 25 Swainson, N. Bendera, S. Gordan, R. Kadzamira, E.1998 'PROMOTING GIRLS' EDUCATION IN AFRICA: THE DESIGN AND IMPLEMENTATION OF POLICY INTERVENTIONS' ISBN: 1 86192 046 6
No. 26 Rosenberg, D. Odini, C. Radebe, T. Sidibe, A. 1998 'GETTING BOOKS TO SCHOOL PUPILS IN AFRICA' ISBN: 1 86192051 2
OTHER DFID EDUCATION STUDIES ALSO AVAILABLE
Swainson, N. 1995 'REDRESSING GENDER INEQUALITIES IN EDUCATION'
Wynd, S. 1995 'FACTORS AFFECTING GIRLS' ACCESS TO SCHOOLING IN NIGER'
Phillips, D. Arnhold, N. Bekker, J. Kersh, N. McLeish, E. 1996 'EDUCATION FOR RECONSTRUCTION'
Rosenberg, D. 1996 'AFRICAN JOURNAL DISTRIBUTION PROGRAMME: EVALUATION OF 1994 PILOT PROJECT'
Perraton, H. 1998 'REWARDING WRITERS OF COURSE MATERIAL FOR OPEN AND DISTANCE LEARNING'
All available free of charge from DFID Education Division, 94 Victoria Street, London SW1E 5JL.A free descriptive catalogue giving further details of each paper is also available.
[Top of Page] [Next Page]

Cost Sharing in Education - Public Finance, School and Household Perspectives - Education Research Paper No. 27, 1998, 141 p.
[Previous Page] [Table of Contents] [Next Page]
Abbreviations AER Apparent Enrolment Ratio
BEST Basic Education Statistics
BWI Bretton Woods Institutions
CCM Chama Cha Mapinduzi
CFS Consolidated Fund Services
CPI Consumer Price Index
CSEE Certificate of Secondary Education
CSR Civil Service Reform
DSM Dar es Salaam
ERB Economic Research Bureau
GDP Gross Domestic Product
GER Gross Enrolment Ratio
GLSS Ghana Living Standards Survey
GSS Ghana Statistics Service
HRDS Human Resources Development Survey
IMF International Monetary Fund
IRR Internal rate of return
JSS Junior Secondary School
LSMS Living Standards Measurement Survey
MOE Ministry of Education
MSTHE Ministry of Science Technology and Higher Education
NER Net Enrolment Ratio
NETF National Education Trust Fund
PBME Planning Budgeting Monitoring and Evaluation Division
PTA Parent Teachers Association
PTR Pupil Teacher Ratio
SIDA Swedish International Development Agency

SRC Student Representative Council
SSNIT Social Security and National Insurance Trust
SSS Senior Secondary School
TADREG Tanzania Development Research Group
UDSM University of Dar es Salaam
UPE Universal Primary Education
WMS Welfare Monitoring Survey
[Previous Page] [Top of Page] [Next Page]

Cost Sharing in Education - Public Finance, School and Household Perspectives - Education Research Paper No. 27, 1998, 141 p.
[Previous Page] [Table of Contents] [Next Page]
I Introduction and Background A. Introduction B. Background & Definitions C. Principle Questions
A. Introduction
This monograph is concerned with how children in poor countries can gain access to good quality education.1 The basic thesis of the paper is that financial barriers are the main reason for the failure of many countries to provide education to their children. Financial barriers are of two sorts. First, the cost to parents and children is often too high, particularly when economies are in trouble. Second, public finances are in most cases inadequate: however, the financial management of education systems is frequently neither efficient nor effective, so that the state's resources derived from taxes in many cases cannot finance basic learning inputs which they would otherwise be able to do if those resources were managed better.
[1 I am grateful to a number of people for comments and discussion. They include John Mace and an anonymous reviewer, and the numerous officials and others in various countries with whom I have worked in this area. Christopher Colclough kindly permitted me to attend his seminar on cost recovery, and I use the excellent papers extensively in this study.]
That the paper is oriented towards public finance should not be a reason for non economists to be uncomfortable with reading it. Although some of the concepts may be unfamiliar, educators should be able to judge the arguments against their own experience and decide whether they provide a sufficient explanation for the poor quality and falling enrolment ratios which they may be witnessing in their own countries or elsewhere. The paper is critical of the role that economists have played in the formulation of education policy, critical of sectoral management, and critical of the foreign aid agencies' activities, but educators may find that the criticisms come from other directions from those they have customarily employed. 'The purpose and outcome of a great deal of what is said and written about education, however 'scientific' its form, is to persuade and convince. It seeks to establish a basis for agreement on what is, and

what should be done.'2 At the heart of the matter is the question of resources and how they are managed, and this paper is intended to further our knowledge of those issues, which affect daily the lives of every teacher in every classroom, and to persuade and convince that some current orthodoxies should be re-examined.
[2 Taylor W., Metaphors of Educational Discourse, in Taylor W (ed.) Metaphors of Education, Heinemann Educational Books & University of London Institute of Education, 1984, p 20.]
B. Background & Definitions
The subject of this paper is cost sharing, a term which combines the concepts of direct cost recovery, and thus education pricing policies, and indirect contributions from pupils, their parents and sponsors, which may be voluntary, quasi-compulsory or even compulsory. The costs include opportunity costs: that is, alternatives to being at school (how far opportunity cost is properly a subset of cost sharing is a matter for interpretation, and is discussed further in Chapter 2). The term 'cost sharing' encompasses privately as well as publicly provided services. In this study the term is used when the subject under discussion is not restricted to user fee issues, which are classified under 'cost recovery'. However, the terms are frequently used interchangeably, and, although there is a euphemistic element in 'cost-sharing', its sense is clear enough. Even where families face apparent discretionary costs, closer examination may reveal that those costs are perceived by them to be non-discretionary.
While to some cost sharing is a term which has most significance in specific contexts. such as textbook procurement or school building, and is in various ways linked to concepts of 'community participation', this study, while incorporating and acknowledging those contexts, is in the first place concerned with the complex relation between citizens and the state in the area of financing education and to some extent public services in general. This is the only way the subject can be properly treated because of the linkages between different components of household spending - no one component can be analysed without reference to other components and because cost sharing is frequently treated as a way of earmarking funds for specific purposes, such as textbooks. In some respects this type of hypothecation represents a failure of public finance management systems, although many economists would propose that public bureaucracies are inherently incapable of being 'efficient', a dubious though attractive proposition. In view of that aspect of cost sharing, issues of public finance management are central to the analysis.
The approach of the study is quantitative, but not scientific in the sense that the data can be used to predict future outcomes. There are many different possible approaches to the

study of cost sharing. Large scale surveys and associated correlation and probability analysis reveal much that cannot be derived from small scale, qualitative studies, and casual observation techniques can be as illuminating as rigorous statistical techniques. The subject spans government, household and school finance, as each of these requires specialised analysis.
This study tries to cover most aspects of the subject, and such an attempt is bound to be imperfect. While there has been a good deal of qualitative, small scale work, most of it in the form of unpublished reports to be found only in the countries themselves, and a good deal of large scale survey work, unfortunately not all easily available in spite of the fact that they are financed by public money, the focus of this study is on an area which is not commonly analysed, but which for policy purposes is central.
There are also important cultural and sociological aspects to be considered. The economic rationalism which dominates current policy analysis of cost sharing is too simple in its conception. The critical issue overarching cost sharing is its explicit role in a larger project to reduce public expenditures and the role of the state, and that project is driven forward against, in many cases, the weight of evidence that people do not react to the provision of modern education services in the ways they are believed to react. Furthermore, there are many questions to ask about the educationist's, as contrasted with the economist's, assumptions about the functions of education which impinge on consideration of cost sharing, and many of those questions are discussed in this paper. This study is therefore primarily concerned with putting together a modest body of evidence on education expenditures by governments and households and exploring the implications the evidence has for the central questions which need to be asked in order to develop and sustain government expenditure policies.
The structure of the paper is as follows. Chapter 2 considers the principles which underpin cost sharing policies. The following two chapters consist of case studies of specific countries. The case studies are not intended to be merely comparative studies only. They consider various aspects of cost sharing according to the availability of information and data and the nature of the issues facing the country. They are not self contained, and each complements the other: the surveys had different designs and their content has different emphases. The final chapter summarises the issues and draws policy conclusions.
C. Principle Questions
This study approaches cost sharing through six questions:
a) Does cost sharing increase total resources available for education?

b) Does cost sharing enhance efficiency of resource use?
c) Does cost sharing affect enrolments and attendance?
d) Does cost sharing improve quality of education?
e) What other effects result from cost sharing in education?
f) Is a policy of cost sharing justified?
The questions are not always easy to answer, and they subsume more detailed questions. The assumption that all of them have positive answers underlies the arguments of those who advocate increased cost recovery and cost sharing.3
[3 These questions may be compared to those asked by Christopher Colclough in Who Should Learn to Pay? An Assessment of Neo-liberal Approaches to Education Policy in Colclough C. & J. Manor, States or Markets? Neo-liberalism and the Development Policy Debate, Clarendon Press, 1991, pp 197-213. He considers the 'neo-liberal' agenda against four elements: (1) user charges at tertiary and secondary levels combined with scholarships to promote both efficiency and equity; (2) loans for tertiary students; (3) encouragement of private schooling; (4) reallocation of 'sayings' to more 'socially profitable' parts of the system. He addresses the 'neo-liberals' on their own ground and on certain technical arguments, particularly those relating to rates of return. Rates of return are so suspect anyway that little is gained by arguing about their levels, though to state that view does not diminish the force of the arguments.
For recent overviews which are excellent within their objectives but do not take a public finance orientation, see Bray, M., Counting the Full Cost: Parental and Community Financing of Education in East Asia, World Bank, 1996, and Decentralisation of Education: Community Financing, World Bank, 1996. Those two pamphlets cover an impressive bibliography which confirm the narrowness of the analysis of cost sharing in education.]
The questions are hard to answer because the data are generally not available to determine the effects of cost sharing over time: while there is evidence of falling enrolments and falling utilisation of health facilities over the short term, such evidence would not be sufficient to reject cost sharing policies, partly because of other factors which may affect service utilisation, such as an economic downturn. Another reason for the difficulty in arriving at more than tentative conclusions relates to the counterfactual:
what might have happened under different circumstances? Counterfactual analysis can only be indicative, but is an important component of analysis of the effects of stabilisation and adjustment, and of changing policies on public expenditure. Thus, for example, the answer to question (a) above might be negative in relation to a given base year, but nevertheless resources allocated to education from all sources might have been even less without cost sharing.
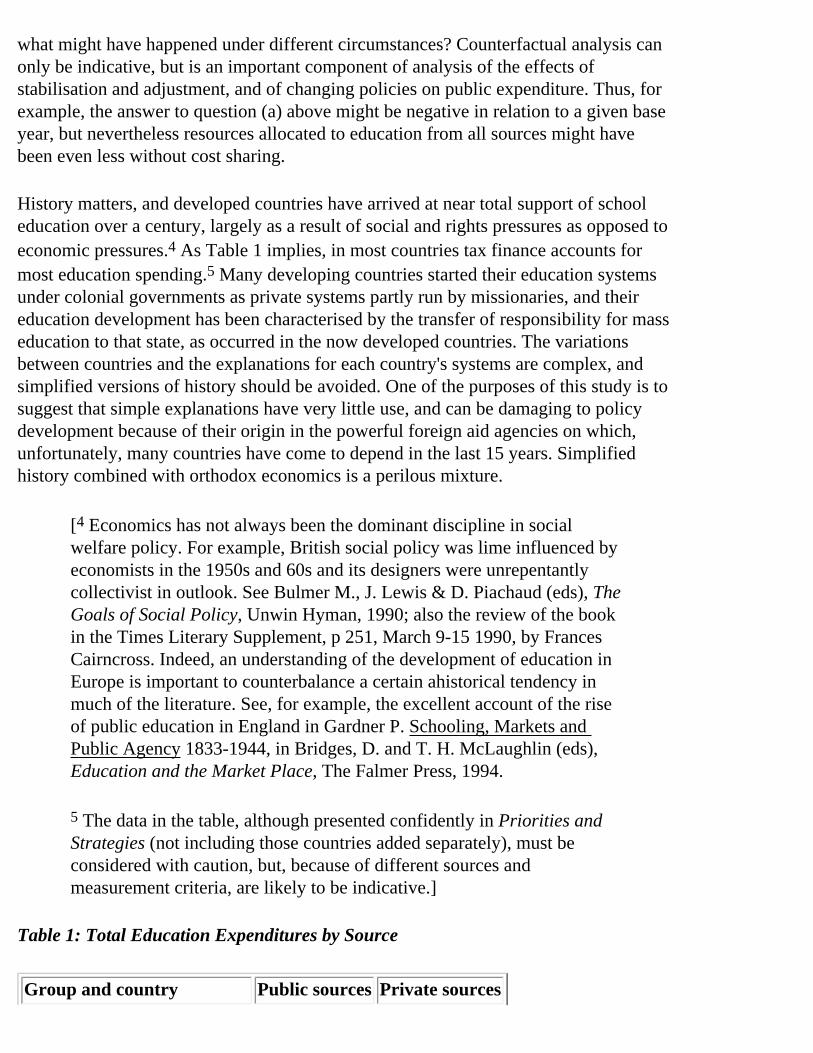
History matters, and developed countries have arrived at near total support of school education over a century, largely as a result of social and rights pressures as opposed to economic pressures.4 As Table 1 implies, in most countries tax finance accounts for most education spending.5 Many developing countries started their education systems under colonial governments as private systems partly run by missionaries, and their education development has been characterised by the transfer of responsibility for mass education to that state, as occurred in the now developed countries. The variations between countries and the explanations for each country's systems are complex, and simplified versions of history should be avoided. One of the purposes of this study is to suggest that simple explanations have very little use, and can be damaging to policy development because of their origin in the powerful foreign aid agencies on which, unfortunately, many countries have come to depend in the last 15 years. Simplified history combined with orthodox economics is a perilous mixture.
[4 Economics has not always been the dominant discipline in social welfare policy. For example, British social policy was lime influenced by economists in the 1950s and 60s and its designers were unrepentantly collectivist in outlook. See Bulmer M., J. Lewis & D. Piachaud (eds), The Goals of Social Policy, Unwin Hyman, 1990; also the review of the book in the Times Literary Supplement, p 251, March 9-15 1990, by Frances Cairncross. Indeed, an understanding of the development of education in Europe is important to counterbalance a certain ahistorical tendency in much of the literature. See, for example, the excellent account of the rise of public education in England in Gardner P. Schooling, Markets and Public Agency 1833-1944, in Bridges, D. and T. H. McLaughlin (eds), Education and the Market Place, The Falmer Press, 1994.
5 The data in the table, although presented confidently in Priorities and Strategies (not including those countries added separately), must be considered with caution, but, because of different sources and measurement criteria, are likely to be indicative.]
Table 1: Total Education Expenditures by Source
Group and country Public sources Private sources

OECD countries
Australia 85 15
Canada 90 10
Denmark 99 1
Finland 92 8
France 90 10
Germany 73 27
Ireland 93 7
Japan 74 26
Netherlands 98 2
Spain 50 20
United States 79 21
Low and middle-income countries
Uganda (1992-1993) (1)(2)(3) 47 53
Haiti 20 80
Hungary 93 7
India 89 11
Indonesia 63 37
Kenya (2) (1992/93) 62 38
Tanzania(1993)(1) 69 31
Venezuela (1987) 73 27
Notes and Sources: From "Priorities and Strategies for Education", World Bank 1995, Table 3.1, p 54.(1) For Uganda, see World Bank, Access to Education and Health Care in Uganda, June 1996, p 21. For Tanzania see World Bank, Social Sector Review, Draft, April 1995, Table S5, p xxiv. The original table shows data for Uganda for 1989/90 (43%+57%)(2) Public institutions only. Private sources refer to households only.(3) Primary and secondary levels only. Private sources refer to households only.
The cost sharing/recovery policies which have been advocated over the last few years for developing (and in many cases developed) countries have a medley of motives behind the arguments. The obvious reason for interest in cost sharing is fiscal stress - the inability of domestic revenues to support education systems - so raising

contributions from non-government sources (i.e. outside the tax system) through compulsory charges (cost recovery) and through discretionary charges (cost sharing) increases the total level of expenditures. Less explicitly stated reasons are more ideological, based on assumptions about desirable (often termed 'optimal') levels of public expenditures and taxation and other policies within the macroeconomic frame. That cost sharing enhances equity and efficiency is counter intuitive, yet its proponents regard those attributes as a strong part of their case: many believe that cost sharing will result in increased enrolments, particularly of the poor, and force government to manage resources more efficiently. This is the somewhat narrow approach to the question of equity which is followed in this study: equity is, in fact, a more complex concept concerning compensation, fiscal equalisation and other measures, but for the purpose of this discussion it is hard, I believe, to disassociate equity issues from efficiency issues and to treat them separately.
Furthermore, it is argued that additional resources are made available as a result of cost sharing to increase expenditures on direct learning inputs such as books and to stimulate qualitative improvements. A cycle is created. Enrolment is sensitive to the quality of school experience, which in turn relies on non-government finance. Enrolment is also sensitive to cost. If people don't pay, quality does not improve. If quality does not improve, people don't enrol.
This mixture of necessity and ideology, unsupported by evidence, is confused, all the more so when public expenditure as a whole is taken into account, particularly in countries with a high non-discretionary component in recurrent expenditure.6
[6 'Discretionary' expenditures are those over which the spender has some choice. Governments have no choice (generally) whether they should pay debt, or pensions, for example, and such expenditures are 'non-discretionary'.]
Does cost sharing increase total resources to education?
Total resources for education can be increased through (a) increasing overall public expenditures; (b) reallocating to education within a given level of public expenditure; and (c) increasing non-government contributions with no reduction (or a less than proportionate reduction) in enrolments. Only in the first case is there a net additional claim on public expenditures.
The second and third cases are the most interesting, in that most analysis assumes explicitly or implicitly that the fiscal constraint on government is binding (except for off-budget foreign aid), and that public expenditures should be reduced. Such a generalised response ignores two crucial factors, namely the details of the composition
of public expenditures and the fungibility of money.7
[7 Fungibility is the substitutability of money between different uses and is a concept which is central in economics (derived from Latin fungor meaning 'to perform a duty or fulfil an office' which gave rise to a Latin legal term 'such that any unit is substitutable for another'). If somebody gives me a dollar, I can use the dollar I already have for something else, but which dollar do I use, as they were not marked and are indistinguishable from each other? In the same way, if the Ghanaian football team beats Tanzania 3-2, which is the winning goal? Is it the first, second or third? because none could exist without the other. Fungibility is also why foreign aid lending or donation to a project with the highest social return is not what it appears: the loan will always be for the marginal project, irrespective of the ostensible 'purpose' of the money. The whole issue of fungibility in foreign aid has been woefully ignored, or argued not to exist or be malign (e.g. Cassen R. and Associates, Does Aid Work?, Clarendon Press, 1987, p 21). There are relatively few studies of fungibility of aid: see Pack H. and J. R. Pack, Foreign Aid and the Question of Fungibility, The Review of Economics and Statistics, 1993, pp 258 - 265, for one example.]
Most of the countries we are discussing are heavily indebted to foreign creditors, to domestic creditors and to their central banks, and interest costs are shown 'above the line': they are part of the same budget out of which education expenditures are made. The higher the interest costs, other things being equal, the less the finance available for education and other uses, because interest payments are non-discretionary: they have first call on the budget. Although interest costs are temporary, they cannot be ignored, and a counterfactual analysis of a budget without 'excessive' interest costs shows that increasing education (and other) spending is a strong option: more to the point, it shows that reducing spending because of temporary budget problems is counterproductive, because it is easy to cut and very hard to reinstate cuts. As the case study of Ghana illustrates, while expenditures on education do not account for a particularly remarkable proportion of national income, they account for a high (relative to most countries) proportion of the discretionary (after debt cost) budget, implying among other things that debt costs are crowding social expenditures. Consequent public expenditure management thus becomes geared to freeing resources to cope with debt costs. This aspect of the debt problem is rarely brought up in the debates on debt.
There is also the issue of fungibility, considered further in the next chapter. Fungibility - the substitutability of money - is a fundamentally important concept in all analysis of public finance and foreign aid. Its presence turns many (if not most) foreign aid interventions into illusion and gives limited meaning to many (if not most) donor and lender conditionalities relating to budgetary allocations. It is difficult to analyse and its
effects are hard to prove, relying heavily on counterfactual speculation The impact of the fungibility of money on cost sharing policies is quite simply that cost sharing is just as likely to achieve the opposite of what is intended as to achieve what is intended, and to reduce expenditures.
Thus, whether cost sharing can increase total resources, as it is often assumed it should do, will depend very much on the underlying reasons. It is more likely to mitigate the effects of reductions in government expenditures rather than to increase total expenditures, or to result in increased expenditures in other parts of the budget.
Does cost sharing enhance efficiency of resource use?
The relation of cost sharing to efficiency is explored theoretically and empirically in this study. Much of the rationale for user charges derives from a belief that they stimulate efficiency and accountability. However, it is equally likely that the reverse may be true, particularly in countries with weak fiscal management, and cost recovery can maintain inefficiency and create problems of lack of accountability. Overcoming resource constraints by charging users can permit inefficient management of resources within the sector and throughout the government budget as a whole, because pressure to find resources through other means is reduced. The fungibility of money can mean that consumers are required to pay for inefficient government sectoral management, which can outweigh any advantages which competition and consumer awareness might bring. Similarly, where fees are raised outside the tax system it has proved hard in many countries to control them.
Another argument which is explicit in the case for cost sharing is that the imposition of charges as well as higher indirect costs at the secondary and tertiary levels of education can permit greater allocative efficiency, creating room for allocations from post-primary budgets to primary education. While the argument has theoretical attractions, it is of little practical validity in the short term because in general governments do not allocate fixed shares of the budget or national income to one sub-sector, and because the sums of money actually raised are small in comparison with what is required. Over the longer term there may be more room to manoeuvre, depending on the overall fiscal position and the political sensitivity of higher education.
Does cost sharing affect enrolments and attendance?
Although enrolment effects from cost sharing are important, attendance effects can be equally important, because reduced attendance ratios affect repetition rates and achievement measures. There is considerable evidence to suggest that attendance ratios are negatively affected by cost sharing as children are sent home for non payment of fees.

Whether total expenditures on education rise as a result of cost sharing measures or not will depend among other things on the relation between enrolments and increased costs. A justification for cost recovery is that it stimulates increases in enrolments largely through the effect of increasing resources and permitting budgetary reallocation. However, cost sharing is more often a response to fiscal stress. Fiscal stress is caused inter alia by general economic difficulties. It is logical to suppose that most people will share in general economic difficulties. Cost sharing is imposed on an already stressed population, and the ratios of food expenditures to total expenditures in a household tend to rise in such times, squeezing capacity to finance items which are not necessities, of which education is one. For example, survey evidence often shows an apparent substitution of health expenditures for education expenditures, and indeed, that primary education is one of the most discretionary of family expenditures: people place priority on expenditures essential for physical survival. Where economies are in trouble, cost sharing policies will affect enrolments, and that is indeed what most evidence suggests. However, it is not easy to distinguish the effect of costs from other effects: for example, most people regard schooling as a route to employment, and in economic bad times employment opportunities are fewer. The economic situation of the people affects their cost-benefit calculus, both from the point of view of opportunity costs (children's labour on farms, for example) and in terms of risk (their perception of the increased probability of unemployment). Similarly, a large number of school children consider public sector employment as the most desirable, and civil service reform may affect that perception.
Thus, while it may appear that the increased cost burdens imposed on households may be responsible for declines in enrolments, the underlying factors are more complex.
Does cost sharing improve the quality of education?
Improved quality of teaching and learning may result from managerial improvements and from better resource allocation. They may also result from improvements in the provision of specific inputs such as textbooks or construction labour: it is reasonable to suppose that availability of inputs enhances quality given that the circumstances are favourable (for example, that there are competent teachers). The history of specific cost recovery schemes for textbooks, for example, has not so far been encouraging, though it is often difficult to see why. Even though specific cost sharing strategies like textbook funds might seem to exert a positive influence on quality, they still have to be considered within the overall menu of alternatives which might be pursued to improve quality.
It is not easy to measure changes in the quality of learning, and less easy to ascribe reasons for quality improvements. Attempts to measure factors which influence learning can result in counter intuitive conclusions, such as that class size or teacher

training have no effects: the problem is controlling for all other variables while holding the variable under review constant, and this is extremely difficult in the type of analysis generally employed to measure qualitative changes. At the very least, though, we can reasonably assume that increasing the supply learning inputs such as textbooks has a positive effect.8
[8 Much of the literature is ambiguous on the effects of increased learning inputs, reflecting perhaps the diminishing returns to expenditures on them. However, where the supply of such inputs is very low it is reasonable to suppose increasing returns. See, Hanushek E. A, The Economics of Schooling: Production and Efficiency in Public Schools, Journal of Economic Literature, Vol. XXIV, Sept 1986, pp 1141-1177; and Fuller B, What School Factors Raise Achievement in the Third World?, Review of Educational Research, Vol. 57 nr 3, 1987, pp 255-292. See also Lockheed M. E., Verspoor A. M. and associates, Improving Primary Education in Developing Countries, OUP/World Bank, 1991, chapter 3.]
A textbook fund may also permit governments to avoid structural changes to the budget, which, if undertaken, might result in greater quality gains. In the country case studies in this paper, non-government finance supports a large proportion of, if not nearly all, learning inputs, and that without that finance there would be no inputs. The dependence on non-government finance affects enrolments, which fall because of the costs of schooling. Looked at from that point of view, it might appear that quality enhancement, if it does indeed result from cost sharing, also has a cost in reduced enrolments.
What other effects result from cost sharing in education?
The responses of households to user charges include (a) reallocating from other expenditures to finance the charges; (b) finding additional money; (c) withdrawing from the service; (d) withdrawing from other services; (e) continuing to use the service but refusing to pay.
The first of those choices can have wider effects. Cost sharing is not an exclusive preoccupation of education sector agencies. Costs of health, irrigation and public transport are also significant in many household budgets. Perhaps the most substantial is health charges. Policies in general are sectoral, rather than cross sectoral or programmatic, and the impact of health charges on household ability to pay for education and vice versa is rarely considered. Indeed, it is likely that when faced with competition from other charges, households consider education charges to be the lowest priority.
Finding additional money may mean borrowing, or selling assets. There is evidence in some countries which suggests that people disinvest in physical assets at a more than 'normal' rate in order to pay fees. What is the aggregate effect of more than 'normal' cattle sales in rural areas to raise money to pay user charges? Does it affect the distribution of wealth and poverty? Does it affect economic growth? Where the 'rich' are required to pay for post primary fees, do they forgo alternative investments which might raise economic growth? These and similar questions have not been investigated as fully as they should be.
Ability to pay is a complex concept, and should not be confused with willingness to pay. It is possible for people to pay more than they can afford in certain circumstances, with adverse long run effects, yet simplified analysis can conclude that because they paid, they were both willing and able to pay, which of course in a sense they were: economics has no model for reluctance to pay in the face of absence of real choice whether to pay or not, though many economists would argue that the choice was 'rational'.
While the question of what other effects may result from cost sharing policies is important, this study does no more than acknowledge the issue, as evidence is slight. The question is posed to highlight the need to examine the effect of sectoral policies outside the sector concerned.
Is a policy of cost sharing justified?
The final question, which is the theme of this paper, is whether policies of cost sharing are really justified. The principle intention in considering this question is to highlight the relationship between public sector management and the costs to citizens which result from decisions of governments. Those costs include costs of inefficiency, costs of decisions which make the service more expensive than it needs to be, and costs arising from perverse expenditure priorities. If through better management and more responsive policies the state can reduce the cost of schooling without loss of effectiveness, the case for cost sharing is weak. Yet in most countries increased cost sharing occurs without any significant progress in reducing the cost of learning to pupils and their parents, or in improving services. In other words, parents are forced to pick up the costs of state inefficiency, or of costly state education policies. The argument applies troth to public and private schools.
For example, a cumulative process of curriculum development in response to changing education theories and policies has resulted in overloaded and expensive curricula in many countries. The scope of the curricula influences strongly the level of cost of the system. An alternative to making people pay to support the system is to change the system to fit more with the ability of the state to pay. Similarly, in some countries

assessment and examinations push up costs with no visible benefit, with the added effect of perverting education and disrupting local societies. At a more technical level, the failure in most countries to control the allocation of teachers means that salary bills are higher than they need be for any given level of salary. In these instances, the availability to the state of additional indirect and direct finance outside the tax system relaxes a constraint which in other circumstances could force down costs. In this respect, it may also be noted that foreign aid constitutes a form of cost sharing, and also permits states to avoid difficult decisions. Orthodox economic models assume costs as given, and therefore are able to demonstrate axiomatic benefits from cost recovery.
The first step in justifying the introduction of cost sharing policies is to evaluate how far existing provision is compatible with the ability of the state to pay, and how far state provision is efficient. If the education system is too expensive for what it delivers, and if indications are that sector management could be improved, a proper sequencing of reform demands that state provision be rationalised and made more efficient before costs are pushed on to citizens outside the tax system. Similarly, where overall economic management is poor, the state's ability to pay is reduced, but would be greater if economic management were improved.
[Previous Page] [Top of Page] [Next Page]
Cost Sharing in Education - Public Finance, School and Household Perspectives - Education Research Paper No. 27, 1998, 141 p.
[Previous Page] [Table of Contents] [Next Page]
II Principles of Cost sharing and Key Issues
A. Introduction B. Rights C. Economics and Finance D. Culture E. Foreign Aid F. Conclusions
A. Introduction
This chapter sets out a framework within which the principles underlying cost sharing need to be considered. The principles may be divided into four related and interdependent categories:
a) rights of citizens; b) economics and finance; c) cultural aspects; d) in the case of developing countries, foreign aid and national autonomy.
B. Rights
The framework in which children's rights are normally considered is that provided by the UN Convention on the Rights of the Child. Most governments are signatories to the convention, which lays certain obligations on them. As far as education is concerned, states are obliged to 'make primary education compulsory and available free to all' (Article 28). Article 4 of the Convention recognises the possibility of resource constraints: 'with regard to economic, social and cultural rights, States Parties shall undertake such measures to the maximum extent of their available resources and, where needed, within the framework of international cooperation'.

The Convention begs many questions, some of which will emerge in this paper. Nevertheless, its intentions are clear. The child has rights to services, to protection, and to participation and self-determination. The child must be recognised as an individual with volition, which may be contrasted to some extent with instrumentalist views of children virtually as the property of parents as a resource worth investing in, exemplified in the human capital literature.9 The significance of rights based approaches and their related legal obligations is that they may imply policies which are not consistent with economic efficiency (however defined), and that they have costs attached to them which should not be discretionary costs because of legal enforceability.
[9 See de Vylder S. Children's Rights, Development Strategies and Macroeconomic Policies, Radda Barnen, January 1995, pp 2 ff]
Opportunity Cost
One interesting aspect of rights approaches and their effect on economic analysis is that of opportunity cost, which in some sense serves also as a metaphor for the adult view of the world embodied in most policy concerned with children. The concept of opportunity (or alternative) cost expresses the basic relationship between and choice. Opportunity cost is therefore the evaluation placed on the most highly valued of the rejected alternatives in the presence of scarcity. It is critical to understand that the alternative is that which might be and not that which might have been without the qualifying reference to choice. If no choice was present, although it is possible to value what might have been, it would not be correct to refer to these values as opportunity costs, since they did not represent a lost opportunity. If education is compulsory (as basic education is in the countries used in this study as case studies), no choice (legally) exists, and therefore there is no opportunity cost: although in the absence of choice it may sometimes be useful to consider alternative values, those values cannot be considered as opportunity costs.
Where education is voluntary opportunity costs, to be present, require someone to do the choosing, and only the chooser can know what the best alternative is: the value of the alternative exists in the mind of the chooser, and nowhere else. The cost must be borne by the chooser and cannot be shifted to anyone else.
As opportunity cost exists within the mind of the chooser, and cannot be objectified or measured by anyone else, it cannot be readily translated into money, although this is common practice in education economics. The cost only exists at the moment of decision. If a child decides between his/her alternative employment and going to school in favour of the latter, once the choice is made, the cost vanishes, for that which is rejected can never be enjoyed, nor can it be recovered. They become sunk costs, which
are irrelevant, except in so far as we are interested in quantifying sunk costs. Opportunity cost is forward-looking. It is 'choice-influencing' rather than 'choice influenced'.10 Economists tend to value a child's or a household's opportunity cost of schooling in terms of earnings foregone, for example, related to an imputed market agricultural wage, and the opportunity cost of not attending school in terms of the returns foregone. Both these sets of calculations, while of interest, can only be speculative.
[10 See Buchanan J, Cost and Choice, University of Chicago Press, 1977, and Professor Buchanan's entry on opportunity cost in the Palgrave Dictionary of Economics.]
It is likely that many, if not most, children want to go to school, and it is equally likely that many are not able to attend because of family pressures to work. Family income foregone is a cost to the family of a child attending school, but if both the family and the child choose to attend school, the relevance of the cost becomes less clear. If the child chooses to attend but the family does not wish it, the cost is ascribed to the family and not to the child, who, it is generally agreed, has a right to go to school. This is an example of the importance of defining a position on children's rights, and compulsory education is partly a response to the danger of parents not wishing children to attend school. It might be argued therefore that family income foregone is irrelevant, though nonetheless real. In terms of economic theory, the concept of opportunity cost is relatively straightforward in market settings (where opportunity cost at the margin equates to cost), but once it is extended beyond market settings its interpretation becomes complex.
C. Economics and Finance
Mark Blaug in his classic monograph published in 1973 reflected a change in thought on how education policy should be made. 'Suffice it to say', he wrote, 'that the concept of education planning for economic objectives is an untidy mess, but it is a paragon of order compared to educational planning for social, political and educational objectives. Is it perhaps that sociologists, political scientists, psychologists and educationists have lacked a framework of decision making in which their positive findings may be fitted? If so, cost-effectiveness analysis is such a framework, which would permit social scientists other than economists to make their contribution to the subject'.11
[11 Blaug M, Education and the Employment Problem in Developing Countries, ILO, 1973, p 25.]
Since Professor Blaug wrote those words economists have come to dominate education

policy making (as opposed to education practice), and neo-classical12 economics with its emphasis on market solutions and maximisation principles has developed the analytical tools with which are most familiar. This section reviews some attributes of those tools, with particular reference to partial equilibrium analysis; to the propositions that people ('economic agents') are 'rational' (often loosely used as short hand for economic rationality); and to the economics of public pricing. What are the theoretical and practical criteria on which we can draw to determine public policy for the finance of education and therefore the scope and level of cost sharing? How far are the widely accepted approaches which dominate theoretical discussions of user charges useful as a foundation for policy formulation?
[12 In this discussion the terms 'orthodox' and 'neo-classical' are used interchangeably. This is perhaps too loose, but this is not the place for an extended definition and justification of terms. An important theoretical work which sets out the definitional issues is Hodgson G. Economics and institutions, Polity Press, 1988. There is a powerful body of literature which sets out to question both equilibrium theoretical systems and that part of orthodox economics which has been critical of equilibrium (e.g. the Austrian School).]
Economic Justification for State Provision of Education: 'Market Failure'
The role of government and tax finance the provision of education is generally justified by the presence of conditions for 'market failure'. In other words, the market alone would not supply sufficient education services to be economically 'optimal', and the state must intervene in order to compensate for the shortcomings of the market. For example, in the cases where people do not fully appreciate the social benefits of education (i.e. the benefits to others rather than themselves, as in the apparent case of girls' education and fertility) or cannot afford basic education, society, represented by the state, will 'demand' more education than the aggregation of individuals will demand - the social demand will exceed the private demand. Individual consumers will not take into account the benefits to society which would accrue should they 'demand' more education, and because they do not take those benefits into account, their demand (when added together) for education is less than the 'optimum', meaning the level of demand which benefits society most. In such cases the state should finance education so that price does not act as a barrier to participation. Similarly, where education and training are considered to be necessary conditions for economic growth, society and therefore the state (in principle at least) have a common interest in increasing the educational level of the population.
The presence of conditions for 'market failure' implies a recognition that some 'subsidy' to education services is required, but the presence of fiscal constraints suggests that

'market clearing' solutions will depend on the extent to which users of the service are able and willing to pay for them. This is a difficult judgement, as is the judgement of what the socially 'optimal' desired level of provision might be.13 In orthodox economics, willingness to pay is the maximum price that can be charged without reducing an individual's welfare or utilisation of services. The policy issue is therefore one of determining the appropriate mix of tax and non-tax financing.
[13 One curious result of 'market' policies based on orthodox economic analysis is the power given to policy makers, who have assumed some of the functions of the central planners who are now so vilified. Thus, Jimenez (Jimenez E, Pricing Policy in the Social Sectors Cost Recovery in for Education and Health in Developing Countries, Johns Hopkins University Press, 1987) suggests that 'policy makers must agree on the level of consumption at which the marginal social benefit of another unit of education service is equal to its marginal social cost' (p 68, fn 3) and that 'the basic needs level of consumption can be interpreted as a minimum amount that society or the policy maker considers desirable' (p 133). Similarly, another influential writer equates 'society' with 'government' in considering social returns (Psacharapoulos G. and M. Woodhall, Education for Development: An Analysis of investment Choices, OUP, 1985, pp 35 - 37). There are many reasons why such 'decisions' should not be left to 'policy makers' acting on behalf of society: planners and 'policy-makers' have their own preference functions. Geoffrey Hodgson (Economics and Institutions, Polity Press, 1988, p 246) writes that there is 'an internal contradiction in much New Right analysis. If it were as absolutely rationalistic or subjectivist as claimed then it would have to abandon any rational argument to persuade others of the policy proposals to which it is attached. This inner contradiction caused by combining extreme subjectivism with rational argument was identified by Michael Oakeshott ... when he wittily described Hayek's work as 'a plan to resist all planning'.]
Financing of Education: Tax or Fees?
Tax finance is the most stable source of finance for services. Most, but not all, people would accept that tax systems should be progressive, that is, the better off should contribute a larger proportion of their income at the margin than the less well off. User fees, on the other hand, are a comparatively fragile base for social service finance. Moreover, fee finance relates to the individual consumption of services and can interfere with efficient and equitable service provision because of the effect on distribution: one function of the state and tax systems is to redistribute resources. A broad based tax system should not be hijacked by the better off in their pursuit of benefit from services, but to a greater or lesser degree there will always tend to be a

distribution in favour of the better off Indeed, it may even be desirable. 14
[14 'Higher supply strongly biased towards more privileged groups may be worse than lower supply'. Stern N, Comment on Social Sector Pricing Policy Revisited, Proceedings of the World Bank Annual Conference on Development Economics, 1989, pp 139 - 142, quoted in Tilak J. B. F. Cost Recovery in Education, op cit. p 15.]
Government expenditures derive from taxes which include income and transaction related taxes, borrowing and in the cases of the countries we are discussing, foreign aid. A distinction between direct compulsory or quasi-compulsory payments made by students and parents for schooling and payments made by governments is to some extent artificial. Bird defines a tax as 'a compulsory contribution from an individual to the government without reference to any special benefits conferred on him as an individual...', and a fee as 'a compulsory payment intended to defray the cost of a service undertaken by the government primarily in the public interest but conferring a measurable advantage on the fee payer'.15 He acknowledges the difficulties posed by education. He does not take into account the fungibility of money: defraying the cost of a service is the same as supporting the cost of an alternative object of expenditure for any given level of total expenditure. Fees permit governments to have large armies or large debt just as much as they 'pay for' education. In other words, fee income can allow governments to maintain an overall pattern of expenditure which may be inefficient, inequitable or indeed repressive.16
[15 Bird R. M, Charging for Public Services: A New Look at an Old idea, Canadian Tax Foundation, 1976, pp 16-22.
16 This proposition might be rejected on the grounds that the finance involved is small relative to total spending. However, that is the significance of the margin: in cases where most of the education budget is salaries the smallest reduction in expenditure has an effect on employment and therefore political consequences. The straw that broke the camel's back is an example of impact at the margin.]
The attraction of fee based systems is that fees can be earmarked (allocated to specific purposes) more easily than general taxation.17 Graduate taxes or payroll taxes can be earmarked taxes, and strong arguments have been made in their favour.18 However, earmarked taxation, if acceptable to Treasuries, which it rarely is because it constrains financial policy, requires relatively sophisticated systems to administer, systems which are lacking in most developing countries. Fees which do not pass through consolidated revenues are not threatened by Treasury policy. User charges, fees and other types of cost recovery, when not centrally administered, bypass the normal budgetary and

accountability processes, and therefore offer none of the constraints that tax finance offers. They often bypass the political process, as well as government accounting processes: several countries are beginning to experience problems from the unaccountability of the user charge process.
[17 For a review of the arguments for and against earmarking, see Teja R. S. and B. Bracewell-Milnes, The Case for Earmarked Taxes, IEA Research Monograph Nr 46, 1991.
18 Colclough C, Raising Additional Resources for Education in Developing Countries: Are Graduate Payroll Taxes Preferable to Student Loans?, International Journal of Educational Development, Vol. 10 Nr 2, pp 169 - 180.]
Education Pricing: Efficiency and Distribution
Pricing theory is principally concerned with efficiency. In its purest form, the price of the service should be set at its marginal cost of production, as that is the only 'correct' price. However, the marginal cost of providing education is not easy to determine: it may be the additional pupil, which may be low, or the additional school, which may be high. In the absence of any pricing rule for education, the principle of 'excess demand' is adduced.
An early formulation of the rules for the mix between tax finance and fees was by Thobani in 1983 in the case of Malawi, and is sometimes known as the 'Thobani Rule'.19 The Thobani Rule requires a market clearing price of education services, and subsidies are only made in cases where socially desired service provision solutions exceed market solutions, where less education is provided by the market than is socially desirable. If the constraint on resources is such that the supply of services is insufficient meet the demand, some of those who demand the service in vain will, it is argued, be willing to pay for it. There would be a lower aggregate supply of services in the case of full 'subsidy' than in the case where people paid, because the available resources cannot meet the costs of the full subsidy. If fees are charged, the total level of resources available increases, all other things being equal. Therefore, the argument runs, charging fees augments the total level of resources for education, so that all demand can be satisfied, even though the subsidy does not cover the full costs. In this case, the rule is to raise the user charge so long as there is excess demand for the service.
[19 Thobani M, Charging User Fees for Social Services. The Case of Education in Malawi, World Bank Staff Working Paper Nr 572, 1983. More specific analysis was undertaken in Tan, J-P, K. H. Lee and A. Mingat in User Charges for Education: The Ability and Willingness to
Pay in Malawi, World Bank Staff Working Paper Nr 661, 1984.]
The converse of the rule can also apply. Where there is a constraint on fee payment, it would follow that fees should be reduced and/or subsidies increased in order to attain the socially desired level of service supply.20 In reality there are always constraints on both public finance and on household finance.
[20 For an extended discussion of these theoretical issues see Bertrand T. and R. Griffin, The Economics of Financing Education: A Case Study of Kenya, World sank Staff Working Paper Nr 402, 1983, Annex 1.]
The rules can be formally demonstrated by the construction of demand functions, showing how the demand for education services is influenced by their price. However, the analysis is much more complicated than it appears to be at first sight in the standard texts, simply because of the difficulty of specifying the demand curves. In applying supply-demand principles the product must be defined. Education cannot be easily categorised as one product, yet the notion of private excess demand implies that there is one product with one demand curve.21 The question must be asked, excess demand for what? For example, if there is excess demand for poor quality schooling, what does this mean? Poor quality schooling is a different product from good quality schooling, and must therefore have a different demand curve.22 Private excess demand may have little meaning under such circumstances, though some writers see a virtue in the private provision of low quality education.23 In many countries education cost benefit analysis appears to suggest 'high' rates of return, while at the same time the low quality of service provision is widely recognised, leading to the logical conclusion that governments do not need to invest in improving quality (particularly as such expenditures may reduce net social benefits). A proper specification of demand curves is by no means an academic point, and can provide a conceptual framework within which to consider some of the paradoxical results which seem to emerge from much education policy analysis.
[21 Throughout this discussion 'education' is synonymous with schooling. Such a synonymy is not always acceptable. we may be talking about a demand for a certificate, or a demand for an unemployment substitute, as well as a demand for learning. These considerations highlight the difficulty of analysing education within a simple demand-supply framework (at least as far as economic principles are concerned). Furthermore, perceptions of the product change, and a different thing might be demanded at different points in time.
22 Indeed, the conclusions reached by Armitage and Sabot in Kenya suggest that there is an effective demand for low quality education. see
Armitage J. and R. Sabot, 'Efficiency and Equity Implications of Subsidies to Secondary Education in Kenya', in Newberry D. and N. Stern (eds), The Theory of Taxation for Developing Countries, OUP, 1987.
23 Such as James E, Public Policies Towards Private Education: An International Comparison, International Journal of Education Research, Vol. 15, 1987, and Armitage and Sabot op cit.]
Moreover, the simple models we are discussing assume that the costs of education are given. If costs can be reduced, fees and/or government expenditures can be reduced. Where costs are in some sense unnecessarily high, households are then required to pick up the bill for government or institutional inefficiency. In this case it would follow that any fee policy would be specifically concerned with minimising fees and reducing costs as a matter of principle.
While Thobani and others argued that income from user charges should yield additional finance for education, an alternative school of thought holds that user charges should be a substitute for government expenditure, and that the burden of service financing should shift from centrally or locally collected taxation to direct payment. In other words, reducing excess demand through increased subsidies is itself not socially 'optimal' because the marginal costs incurred through additional taxation exceed the marginal benefits to society.24 In the real world of public finance management it cannot be assumed that fees will augment total resources.
[24 Ie finance raised through taxation uses up resources in its collection and is itself costly. Resources are used up in administration and in waste. There are also social costs. For example, where tax systems are regressive and disproportionately favour the better off, any services paid for out of tax finance have by definition social costs to the poor. Where taxes have high opportunity costs such as might be found in a country with high marginal rates, the social benefits from government spending on education would have to be adjusted accordingly: this is rarely considered in the social cost-benefit calculus. The additional resources needed to increase subsidies are usually not possible to calculate and are hidden overheads, but nevertheless they would result in an inefficient solution in this context.]
Efficiency
User price theory suggests that charges enhance both efficiency and equity. The attraction of the argument for some is therefore that they can save money and, at the

same time and with one policy instrument, promote a fairer and more efficient use of resources. Cost recovery is seen as a 'multipurpose remedy'.25
[25 Hall P. H. Land, R. Parker & A. Webb, Change, Choice and Conflict in Social Policy, Heinemann, 1975, quoted in Tilak J. B. G. Cost Recovery Approaches in Education, National Institute of Educational Planning and Administration, New Delhi, 1994, p 13, paper prepared for the Workshop on the Social and Economic Effects of Alternative Methods of Financing Education and Health Services in Developing Countries, Institute of Development Studies, Sussex, March 1994. This paper, and others from the same workshop, appear in Colclough C. (ed), 'Marketizing Education and Health in Developing Countries: Miracle or Mirage?', Clarendon Press, Oxford, 1997 (in press at the time of writing).]
User charges can in principle affect efficiency different ways. Additional resources can permit increased technical efficiency as well as enhanced cost effectiveness. A combination of additional fee finance and reduced tax finance can put pressure for a better and more accountable allocation of public finance.26 Fees, it is argued, can force consumers to appreciate the value of services and not to use them unnecessarily. Because the costs of higher education to individuals is low in relation to the returns, more people demand it than would do so if they faced the 'true' costs.27 The argument is analogous to the concept of 'frivolous' demand for health services, and it is a difficult argument to apply to education: there is little evidence to suggest that the argument has substance even in relation to health services.28
[26 There are several (related) dimensions of efficiency, including cost-effectiveness, technical, allocative, and incremental output efficiency, and they relate both to the ways in which education policy is formulated and to the way in which public finances are managed. Cost-effective provision of education involves increasing the education and skill status of the population for a given budget; technical efficiency involves attaining a given level of education provision for minimum cost; and allocative efficiency involves the least cost combination of inputs for a given output. Incremental output efficiency relates the additional outcomes associated with each efficiency measure with each other: do we want major improvements in reading while numeracy declines?
27 'If households faced the true social costs of obtaining more education, they would confront a lower rate of return; instead they are induced to obtain more schooling.' Jimenez E, Pricing Policy in the Social Sectors Cost Recovery in for Education and Health in Developing Countries,
Johns Hopkins University Press, 1987, p 40. But the intention behind subsidising higher education is precisely to induce more demand. The issue is whether it does or not, and how that demand is distributed across income groups.
28 See Creese A, User Charges for Health Care: A Review of Recent Experience, in Health Policy and Planning, Vol. 6 Nr. 4, 1991, pp 309 - 319.]
The argument for efficiency effects of user charges and private schooling also holds that competition is created by consumer choice, and that this drives down costs. Apart from the fact that most consumers face little choice in what school their children can attend, the role of competition itself as it is defined by orthodox economists is troublesome. It is not axiomatic that competition, which can be 'at once the god and the devil',29 is always desirable, and that it inevitably enhances welfare.
[29 Penrose E. T. The Theory of the Growth of the Firm, John Wiley and Sons, New York, 1959, p 265. The most advanced area of economics in the sense of its rejection of simple neo-classicism is the economics of the firm, where much interesting theoretical and empirical work is now taking place. For the role of competition and economic theory of competition, see Best M, The New Competition, Polity Press, 1990, and Hodgson G. Economies and Evolution, Polity Press, 1993. There are many reasons why (neo) liberal dogma about competition should be considered sceptically, including reasons relating to efficiency and reasons relating to equity and ethics (e.g., see Hirsch F. Social Limits to Growth, Routledge and Kegan Paul, 1977).]
Equity
To many, the main argument in favour of cost sharing policies, particularly at post basic education levels, is that they induce a more equitable distribution of opportunities and resources. To others, such a concept is counter intuitive. Equity, it is argued, is achieved by increasing resources through fees charged to those who can afford them through present or future resources, and thereby more children are enabled to receive education. Greater allocative efficiency allows resources to be redirected from higher education to primary education, and this permits poorer people to send their children to school, or, alternatively, the funds can be used to give scholarships to poorer students.
Equity arguments are deceptively simple. There are few if any examples of obvious reductions in public spending at higher levels in favour of lower levels of education, especially where costs per pupil are concerned, partly because in most countries the

management of resources for education is weak and the systems are inefficient. The effect of reallocations is just as likely to be to redirect finances towards inefficient uses, which is hardly fair on those who pay, whether they be 'rich' or not. Moreover, in a broader context, the fungibility of money implies that fee income can perpetuate rather than obviate inequitable resource allocation.
Nevertheless, equity of provision of education opportunities across income groups should be an important social goal. The question is how it is to be achieved, and the history of earmarked and targeted expenditures in countries with weak fiscal management suggests that the answer is not straightforward. For example, measurement of how far government expenditures are redistributive, neutral or regressive (in the sense that the better off benefit from them more than proportionately to their share of income), can to some extent be made on the basis of household data and information on government expenditures.
Household finance combines with public finance to make up the total package of expenditures on education. More affluent households have a higher level of discretionary resources to allocate to education. Relative affluence is often concentrated in particular geographic locations, but in most communities there is a spread of incomes. One function of public finance is to compensate for income diversity through the tax system and through the distribution of benefits financed by taxes. Analysis of the geographical distribution of resource allocations can show how far public budgets are equitably shared between the population, and at the household level it is possible to determine to some degree how equitably public resources are distributed between income/expenditure groups, irrespective of location.
The incidence of the benefits from public spending can be derived from data on the number of people in a population in given income (expenditure) brackets and the average expenditure per enrolled pupil. Enrolments of different consumption groups can be identified, and on the assumption of a single national average expenditure per pupil the amount of public expenditure 'captured' by each income group can be plotted on a Lorenz curve to show the progressiveness or regressiveness of public spending. The case studies of Ghana and Tanzania show the results of benefit incidence calculations, and are intuitively acceptable, in that they show progressive distribution of resources at the primary levels, regressing at higher levels.30
[30 The technique is a useful one but not without flaws, and tells us nothing about the quality of expenditures on the different income groups. As with much poverty oriented analysis, it is also not always clear that the information adds a good deal to what is already apparent, and when the costs of data collection and processing are taken into account there must be some question about the use of scarce resources on expensive

surveys: Living Standards Measurement Surveys cost up to $1 million, not including staff costs.]
In Tanzania and Ghana (and in many other countries), the incidence of the benefits of public expenditure on primary education is broadly progressive. The issue is how to increase and sustain enrolments at the basic level at the same time as making the incidence of benefits from post basic education expenditure more progressive. Simply charging fees for post basic education will not achieve that objective without strong complementary actions: it merely increases the marginal rate of tax on 'rich' families with few redistributive benefits.
The Assumption of Rationality: Government and Household Reaction Functions
Analysis of policy requires assessment of how agents react to interventions. How do governments and households react to cost sharing and cost recovery? What are the effects of the fungibility of money? These are the central questions, from which the questions we ask in this paper are derived.
The Government Reaction Function
A paradox in the theoretical system we have been discussing is that on the one hand governments are frequently assumed to be inefficient, so the less that government manages the better; while on the other hand the success of market prescriptions depends on an efficient bureaucracy, as well as a set of complementary interventions which would ensure success. There is a set of 'implementation conditions' upon which the success of any reform depends, and it is the failure of economic reform packages to reflect that concept at the sectoral level which is the cause of much of the decline in enrolments in many countries.31
[31 Creese A. and J. Kutzin, Lessons from Cost Recovery in Health, World Health Organisation, 1994, paper prepared for the Workshop on the Social and Economic Effects of Alternative Methods of Financing Education and Health Services in Developing Countries, Institute of Development Studies, Sussex, March 1994. See Chapter 5 for an outline of a possible package.]
The network of assumptions we have been considering extends beyond individual behaviour and equilibrium, which we discuss below, to assumptions about perfect flexibility in public finance mechanisms: it is almost as though the abstract conception of the rational individual is mirrored by the abstract conception of the rational bureaucracy. The capacity of administrative systems to respond to calls for the reallocation of finance, targeted scholarship systems, fee exemption mechanisms, and

so on, is notoriously weak: all of these require resources which are usually not available. Welfare economic analysis of user charges involves assumptions about public finance management, in particular that reallocation of finance to those areas yielding the highest social returns is in fact possible, and that government expenditure can be efficient and 'optimal'.
The reaction of government to fee income and cost sharing is the central fiscal question we are addressing, and the functional relationship between a government and an additional resource injection may be expressed via a reaction function.32 Whether explicitly or implicitly, the effect of fiscal squeeze has been to regard cost recovery as a way of reducing the burden of public expenditure. Were other things to be equal, total ('private' + public) expenditures on education would rise as a result of increased cost recovery, but in reality cost recovery policies are usually intended to mitigate the effect of falling public expenditures. This can be looked at in one of two ways:
a) without cost recovery expenditures on education would fall by more than they would with it; and
b) without cost recovery measures government would have been forced to reallocate in favour of education away from, say, defence, or to improve revenue collection. Fungibility in the budget permits government to charge parents fees which effectively finance less socially desirable outcomes: without the option of cost recovery expenditures on education might be maintained and a better composition and balance of public expenditure be achieved at the same time.
[32 See Heller P. 'A Model of Fiscal Behaviour in Developing Countries: Aid, Investment and Taxation', American Economic Review, Vol. LXV Nr 3, June 1975, pp 429-445.]
(a) and (b) above represent two possible counterfactuals, and, as with all counterfactuals, it is not possible to say whether or not they are 'true' for any given case. The questions raised are central to cost sharing policy, because recovery of the costs incurred (out of tax finance) by the state for education and health permits the state to maintain levels of inefficiency and misallocation. Even where there is an explicit policy of substitution of non tax compulsory financing for tax financing, the gains which the proponents of such policies might expect will not be forthcoming if the overall level of public expenditure is not reduced or if there is no progressive reallocation.
The Household Reaction Function
The reaction of families and individuals to cost sharing policies and patterns of

government expenditure is equally complex. How do people respond to better services? How much is the demand for education or certification affected by the quality of provision of service? Do sectoral interventions have a greater effect on household responses to education policies than do the employment effects of economic policies? There are two broad sets of views of the how and why decisions are made in households. On the one hand many models are based on the assumption that households are homogenous groups with one set of preferences, while others, more in keeping with anthropological studies, are based on more complex assumptions about how individuals within households negotiate their interests.33 There is increasing interest in the specific role of children in decisions affecting their future. In many cultures children do not get a substantial share in decisions about schooling, although in some, such as Ghana, with more complex family patterns, children may not only decide but have responsibility for raising money. In some societies women prefer to spend money on their children's education, whereas men have other preferences.
[33 For a review see Alderman H. et al, 'Unitary Versus Collective Models of the Household: Is it time to shift the burden of proof ?', The World Bank Research Observer, Vol. 10, nr 1, Feb 1995, pp 1 - 19.]
There is a wide range of economic and cultural influences on household reactions to education policy. For example, Tilak has shown how, in the case of India, there was a positive relationship between government and household absolute expenditures on education. Families appeared from his data to spend more on education as government spent more.34 If there is a causal relationship, one explanation might that the level of public expenditure has a strong enough effect on quality, perhaps in the form of school inputs, for people to want to spend more. This would be consistent with survey experience and with experience in the health sector.35
[34 Tilak J. B. G. Family and Government Investments in Education, International Journal of Educational Development, Vol. 11, Nr 2, pp 91-106, 1991.
35 Bennett S, The Relationship Between Public and Private Systems in Health Care, Health Policy unit, London School of Hygiene and Tropical Medicine, 1994, p 16, paper prepared for the Workshop on the Social and Economic Effects of Alternative Methods of Financing Education and Health services in Developing countries, Institute of Development Studies, Sussex, March 1994.]
Few countries have time series of data for household education expenditures which would allow the hypothesis of complementarily between government and family expenditures on education to be explored further.36 Intuitively, it makes a good deal of

sense. For example, survey results indicate that parents will pay more if they feel it is worth it: if there is indeed a link between total expenditures and quality of output, then increased government expenditures could trigger increased family expenditures. In order for cost recovery to become a successful policy, the consumers of the service must see benefits. One of the underlying reasons for resistance to cost recovery in higher education is that there is little apparent benefit to students, who have little incentive to accept it. Were their conditions to be improved, it is possible that they would show more willingness to pay.
[36 For example, using regional cross-sectional data, there was no systematic relation between household and government spending in Viet Nam (Penrose P. Review of Public Expenditures on Education in Viet Nam, UNDP/Ministry of Finance, Hanoi, 1995). But cross sectional data would not be strong evidence either way.]
The contrary hypothesis is that government expenditures crowd out private expenditures (West's 'public/private displacement mechanism'37), particularly those on private schools. High levels of government expenditure on education in developed countries are, it is argued, a principal reason for relatively low private expenditures when compared with less developed countries, where 'excess demand' prompts parents to seek their own solutions.38 The absence of time series data makes it difficult to take these conjectures further, though West's study of education finance in Britain through the 1 9th and early 20th centuries is food for thought. An interesting aspect of the same issue is found in Chile. One study shows that after the privatisation of education in Chile total household expenditures on education increased, but profit-taking by school owners resulted in lower average expenditures on direct and indirect inputs than previously.39
[37 West E. G. Education and the Industrial Revolution, Batsford, 1975. He argues that there was a significant 'public/private displacement mechanism' in Britain between 1833 and 1945 as public (state) schools took over from private schools and total average expenditures on education expenditure declined (Chap 15).
38 See for example Johnes G. The Economics of Education, MacMillan, 1993, pp 81 ff, and James E, Public Policies towards Private Education, op cit.
39 Schiefelbein E, Restructuring Education through Economic competition: The case of Chile, Journal of Educational Administration, Vol. 29, Nr 4, 1991, pp 17-29.]

One way in which we find out how people react to cost sharing policies is through household surveys.40 Household income is made up of cash income through work, sales, borrowing and transfers, and non-cash income, such as the imputed value of food and own production. Household surveys have different ways of measuring income, and they are not always clearly specified in analysis based on them. It is notoriously difficult to determine income in questionnaires, and a little less difficult to determine expenditures: often therefore household expenditures and cash savings are used as a proxy for (cash) income and other non-cash values are added. There is a strong relation between income and expenditure, but there is a less strong relation between cash expenditure and total income (cash plus imputed income) among poorer people.
[40 see Behrman J. R. 'Human Capital Formation, Returns and Policies: Analytical Approaches and Research Questions', Journal of International Development, Vol. 8, Nr 3, 1996, pp 341-373 for an overview of issues of technical analysis of household data in a neo-classical empirical economic framework. The use of the term 'household' is in many ways unsatisfactory, but there is no easy shorthand alternative. 'Household' has come to mean the opposite of government, so that total expenditures = government + household. The pervasiveness of the technology of planning now far surpasses what was available to the central planners of the command economies, and as market economies are increasingly susceptive to the preferences of planners as survey techniques become more sophisticated.]
Fees and other schooling costs affect household savings and investment, and by extension there must also be an effect on national economies. One reaction to fees which is not well documented is that the poor may sell significant proportions of their assets (i.e. more than that which is normally set aside for financing their children) in order to pay fees and other charges: they switch investments from physical investments to human capital. Fee obligations may be one cause of declining household abilities to sustain their basic needs as well as reduce their capacity to generate wealth. Part of the problem is that although the returns to schooling appear to be 'high', those who do not earn are not included in the calculations, and families take increasing risks in deciding to 'invest' in schooling, even assuming that their expenditures are voluntary.
Wealthier families can afford more risk41 and are likely to spend more on education. Their opportunity costs include investment in business: the alternative 'investments' to education are not restricted to capital or equipment investments with which returns may be compared, but also in recurrent costs of entrepreneurship and other wealth creating activities. User charges will necessarily have a macroeconomic cost, the issue being that of the size of the effect and how the costs and benefits balance against each other.

[41 Levhari D. and Y. Weiss, 'The Effect of Risk on the Investment in Human Capital', American Economic Review, Vol. 64, Nr 6, December 1974, pp 950-963.]
Risks are greater and less affordable for poorer families. Poor households have more children, and the ratio of total education costs to total household cash income will be higher in the case of large households than in the case of smaller households on the same cash income. One consequence of this is the additional burden placed on families by extending basic education without compensation measures. It is also likely that in poor areas the number of households represented in a school will be less than in better off areas, because of larger families. The average expenditure per child would thus be lower, and the poverty of the school would be worsened by reduced income from parents.
Economic Rationality
Over the last few years the economic concept of 'human capital' has gained ascendancy in the social sector literature and dominated foreign aid discussions on education.42 'Rational' human beings are assumed to make investments in themselves and their children on economic grounds, and society also makes investments in individuals on economic grounds. Investments by definition yield streams of financial and economic returns. In the case of human beings these are expressed in the form of lifetime earnings and other financial and non-financial returns, which benefit both society and individuals. These streams of returns can be estimated, and internal rates of return both to individuals and to society as whole derived as guides to policy.
[42 Compare Mark Blaug's assessment in 1976: 'In all likelihood, the human capital research programme will never die, but it will gradually fade away to be swallowed up by the new theory of signalling, the theory of how teachers and students, employers and employees, and indeed all buyers and sellers select each other when their attributes matter but when information about these attributes is subject to uncertainty'. (Blaug M, 'The Empirical Status of Human Capital Theory: A Slightly Jaundiced Survey', in Journal of Economic Literature, Vol. 14, Nr 3, Sept 1976, pp 827-855.]
One assumption which is hard to accept as a basis for serious policy formulation is the view that economic coordination is simply a matter of price signalling in markets to which individuals react predictably (a crude definition of 'rationality'). We need to take account of a wide variety of factors relating to culture, institutions and other components of individuals' environments. The problem with simplified propositions is that while they are useful tools of analysis, they can discourage deeper understanding of

the connecting principles relating to relevant phenomena.43
[43 In his important book, Equilibrium and Evolution: An Exploration of the Connecting Principles in Economics, Manchester university Press, 1991, Brian Loasby suggests, following Adam Smith, that 'we try to make sense of the world by imposing patterns on it, and then sticking to them as long as they are tolerably successful in allowing us to feel that we understand what we observe and what we experience.' He continues: 'Smith argued that people like to feel comfortable, and that they do not feel comfortable unless they can link together in their own minds the phenomena to which they are exposed. People prefer not to have to think; but what they like even less is the feeling that they do not understand, and in such a situation they are driven to seek an explanation.... The motivation of science, therefore, according to Smith, is the psychological need to invent a set of connecting principles which will make sense of experience, and thereafter leave the brain in peace.' (pp 6 -7). The drive to define connecting principles has resulted in the rational choice equilibrium method of economics, a method which gives tranquillity to the economist's imagination. The world of the economist's imagination is not the world of policy: Herbert Simon wrote 'the decision maker's ... perceived world is fantastically different from the real world' (Simon H. A, Models of Bounded Rationality, MIT Press, Cambridge MA, 1982, Vol. 2 p 306), and the consensus of economists in the subject matter we are discussing is very much responsible for many of the problems faced by education systems in poor countries now.]
The importance of the price mechanism for education policy making is illustrated by the current hegemony (at least within the Bretton Woods Institutions) of the analysis of internal rates of return to education. Rates of return are seen by many as an indicator of how individuals perceive the financial benefits to themselves derived from additional education, and as an indicator of the economic benefits to 'society'. Where there is a high 'private' benefit relative to the estimated 'social' benefit, it is implied that there is excess demand and that therefore fees must be charged. Because the 'social' internal rates of return to primary education are generally estimated to be higher than those to secondary or tertiary education, and because the divergence between 'private' and 'social' benefits is usually calculated to be less at the lower levels, policy advice based on rate of return analysis is invariably that public expenditures should be directed at those lower levels of education while cost recovery must be pursued at higher levels, principally at the university levels.44
[44 Social rates of return are computed simply by adjusting estimated private rates to include costs to the state, with little corresponding

adjustment on the benefit side of the cost-bereft calculus, particularly those which might be caused by externalities.]
There are two kinds of question which can be posed about the value of education cost-benefit analysis. The first relates to the rational choice basis of the assumptions derived from it, and the second relates to reasons of a more technical and methodological nature which cast doubt on the reliability of the solutions offered. In many respects the robustness of rate of return analysis is surprising, and tells us more about the absence of tools which enable us to make education policy than the usefulness of the technique itself.45 Although there have been a number of criticisms of the foreign aid agencies' reliance on rates of return in its policy 'dialogues' with governments, criticisms do not appear to have affected the widespread acceptance of the results offered, principally the policy focus on expanding basic services and rationing access to post-basic services through price.46 The range of objections to the technique as a main basis for policy decisions is too wide to discuss fully in this paper, but I return to the subject where it is relevant, particularly in regard to post primary policy: there are in any case very strong reasons for not placing too much credence on education rates of return. Moreover, even for those who do have faith in such analysis, the problem should lie more in how the findings are used in relation to public expenditure allocations as a whole (especially when they are driven by foreign aid conditionalities), and whether the correct response is to charge fees and raise costs for post-primary education rather than to eliminate expenditures elsewhere in the budget with even lower 'social' rates of return, as theory would suggest.
[45 But the need for such a tool derives not from 'market' approaches but rather from central planning requirements. A point which was often missed from the rate of return versus manpower planning debate is that both techniques are used by central planners, but one appears to be more sensitive to market signals than the other.
46 The criticisms of the reliance on internal rates of return for education policy purposes are strong enough to require the results to be used with circumspection, if at all. Where they are used well, such as by Knight and Sabot in Knight J. B. and R. H. Sabot, Education, Productivity and Equality: The East African Natural Experiment, OUP, 1990, the authors caution readers that they did not 'wish to perpetuate the illusion of precision created by oversimplification' (p 51). Knight and Sabot, rightly, do not dismiss either the methods or the results, but suggest that the reliance on survey data for cross section averages does not take into account the changing conditions facing new entrants to employment, and that rates of return may be weak guides to policy. A strong (and sometimes intemperate) attack with many well argued points which I
have not seen answered is by Curtin in Curtin T, The Economics of Public Investment in Education in Papua New Guinea, University of Papua New Guinea Press, 1991. See also Bennell P. Using and Abusing Rates of Return: A Critique of the World Bank's 1995 Education Sector Review, IDS Working Paper Nr 22, Sept 1995, and two other Working Papers (Nrs 23 & 24).
One interesting development is how more recent calculations (most of the cited IRRs are a decade or more old) show high private relative to social IRRs to primary education, and more or less equalised rates for secondary education (as in the recent calculations for Ghana). This may well be a trend, and it will be interesting to see how aid policy is affected. See Psacharopoulos G. 'Returns to Investment in Education: A Global Update', World Development Vol. 22, Nr 9, pp 1325-1343.
It is often suggested that nobody pays much attention in practice to rate of return findings, but experience suggests otherwise. Not only is lip service paid to them, but Treasury officials, often frustrated by the absence of reasoned justifications for expenditures in education sectors, latch on to them as at least one way of making sense of education spending.]
D. Culture
Although any discussion of cost sharing will have an economic bias in that the justifications for cost sharing policies relate to the financing of education, the cultural and social environment in which cost sharing activities take place will to a great extent determine how they work. There is considerable cultural diversity between countries which directly affects people's reactions to cost sharing, and the insights from anthropological and sociological research are important in balancing the cruder assumptions of economic rationality.47
[47 There have been a number of important studies over the years which bring cultural issues to the fore. Perhaps One of the finest is Philip Foster's Education and Social Change in Ghana, Kegan Paul, 1965. Another very important study is Serpell R. The Significance of Schooling. Life journeys in an African society, Cambridge University Press, 1996. Also Musgrove F. Education and Anthropology: Other Cultures and the Teacher, John Wiley, 1982.]
In 1932 T. S. Eliot wrote 'Questions of education are frequently discussed as if they

bore no relation to the social system in which and for which the education is carried on... Education cannot be carried on in a void: our questions raise other questions, social, economic, financial, political. And the bearings are on more ultimate problems even than these: to know what we want in education we must know what we want in general, we must derive our theory of education from our philosophy of life'.48 Western education can have a different significance in many traditional societies, and the influence of foreign aid can be, in Denis Goulet's phrase, 'shockingly ambiguous'.49 One reason for the ambiguity is that modern education systems in non-Western cultures have not arisen in the same way out of a 'philosophy of life' in a natural fashion. Sociological and anthropological literature is replete with accounts of the reactions of 'traditional' peoples to modern education, and dissenting economic literature has also emphasised the consequent problems of transporting foreign models via the medium of foreign aid.50
[48 Eliot T. S. Modern Education and the Classics, in Selected Essays, Faber & Faber, 1966, pp 507-516.
49 Goulet D, The Cruel Choice: A New Concept in the Theory of Development, New York: Athenaeum, 1971.
50 'External doles ... tend to bias the development process in directions based on external prototypes which are often inappropriate and therefore damaging. Such a sequence retards development rather than promotes it... Adverse results are all the more likely when the expenditure within the country is undertaken by people who do not themselves bear the cost.' Bauer P T. Dissent on Development, Wiedenfield and Nicolson, 1971, p 103.]
In a sociological echo of the language of economics, the concept of capital investment may be extended to that of investment in 'cultural capital'. The range of meanings of the concept of cultural capital is wide, but modern education systems may stimulate capital growth where it may be less desirable and destroy cultural investment without creating new capital.
In an example of the first phenomenon, as governments seek means of targeting public finance to overcome inequalities and inequities in the system they come up against the self-replicating nature of social status and provision where parents with education are able to use the publicly financed system to perpetuate and consolidate their advantages.51 At the same time, the pressure from the foreign aid agencies to 'liberalise' education provision and encourage the development of private schools will tend to create a 'cycle of privilege' if accompanied by a reduction in public finances for state schools.52 Cost sharing will always tend to create inequalities simply because schools

in better off areas or with better off pupils are better financed than others.53 If schools rely on cost recovery for non-salary items, and cost recovery is unevenly distributed between schools, underfunding is built into the system, even where the incidence of public expenditure may be progressive. Such a tendency would work to offset the supposed equity effects of cost recovery.
[51 See, for example, the discussion and analysis in Halsey A. H, A. F. Heath and J. M. Ridge, Origins and Destinations: Family, Class and Education in Modern Britain, Clarendon Press, 1980, pp 75 ff and pp 198 ff.
52 State education is often viewed from the World Bank as an 'inferior good', meaning something that people cease to purchase as their incomes rise.
53 See, for example, Bray M, Community Financing of Schools in Less Developed Countries: Rationales, Mechanisms and Policy Implications, paper prepared for the Workshop on the Social and Economic Effects of Alternative Methods of Financing Education and Health Services in Developing Countries, Institute of Development Studies, Sussex, March 1994. There are other local phenomena. For example, in some places in the north of Ghana, parents do not wish to contribute anything to schools because of the competition from teachers in farming. Teachers, who earn salaries, are able to finance farming inputs (as well as use children as free labour), and this gives them an advantage over poor farmers with little cash working capital. Throughout every system local effects such as these strongly influence attitudes to cost sharing.]
An example of the second phenomenon is the relation between 'traditional' wisdom and skills and those promoted in modern schools.
A good deal of anthropological debate centres on the assumption and definition of (economic) rationality.54 Anthropologists have much to say about the impact of markets and economics on societies to which these phenomena have been relatively recently introduced, particularly by foreign aid. Indeed, anyone who has worked in countries which are the subject of the attentions of foreign aid project designers should have been able to see the various patterns of resistance which are mounted against them.
[54 In some instances economists can be treated as a homogenous group, but this should not be the rule: one example of this treatment is in R. L. Stirrat's interesting paper Economics and Culture: Notes Towards an
Anthropology of Economics, School of African and Asian Studies, University of Sussex, 1994. This paper was one of many delivered at a conference with the theme of 'tensions between economics and culture' in the University of London Institute of Education.]
People possess economic rationality in the sense that they will respond in some way to economic stimuli. This is not the same as saying that those responses will outweigh all other responses, or that economic rationality is not tempered by other types of rationality. Self-interest is not confined to economic betterment, but includes it. The Mandevillian baker bakes bread for a living and not for altruistic reasons, but he may also consider it important to make good bread (quite apart from the market implications of baking bad bread), and may also take seriously his place in society as a contributor to general welfare. Economic rational man is stimulated exclusively by prices, an assumption as absurd as it is wrong. As surveys illustrate, people desire education for other reasons than economic reasons, but of course for economic reasons as well.55
[55 Though the Becker position would be that all behaviour is by definition rational to the behaver (Becker G. The Economic Approach to Human Behaviour, Chicago, 1976), a position not universally shared.]
For example, one interesting paper records that in Mozambique 'peasant families were generally unable to ascribe any meaning to what was taught in schools in terms of content... Instead, schooling was basically ascribed a purely functional value, that of opening up the door leading to modern society and its well-being. But even in this respect, the relationship was ambiguous'.56 One reason for the ambiguity was that education offered an escape route from the peasant condition, but that at the same time the route was 'long, costly and insecure'. Another reason was that education took a member of the group away from the group, transforming him or her into something different. While this might be acceptable for boys, it represented a great risk for girls in a matrilineal society. Research such as this goes some way towards the explanation of why there is underenrolment in the presence of 'high' private rates of return.57
[56 Palme M, Being Respected but Teaching Hieroglyphs: addressing the question of the primary school teacher, culture and local community in rural Mozambique, paper presented to conference on 'tensions between economics and culture' in the University of London Institute of Education.
57 Although, of course, the returns are only to those in employment.]
Survey literature in other countries shows similar phenomena. In Sierra Leone, for example, parents in some parts of the country see western education as haram (sinful),

as breeding ingratitude, and as alienating children from their families and homes.58 The general reaction by the agents of the modern education sector - teachers, administrators, foreign aid workers is that parents are 'ignorant', they 'do not appreciate education', and that community attitudes to education are in some sense irrational. This applies also to girls' education, where refusal to send girls to school is seen as an oppressive measure. In reality, parents' attitudes may be very rational, even in the economic sense, as in, for example, Pakistan, where parents who have traditionally been opposed to the education of their daughters may change their views if they see economic benefits deriving from it.59 It is also important to note in the consideration of cost sharing that the benefits accruing from education can be more important in people's perceptions than the costs of attaining it, for the benefits are measured in other ways than the material, and are frequently seen as 'social' rather than 'private'.
[58 Kroma S. Factors Influencing School Enrolment and Attendance in Rural Communities in Sierra Leone, (mimeo) Njala University College, Sierra Leone, December 1993.
59 Bacchus K. & I. Farah, Tensions Between Economics and Culture in the Provision of Education for Girls, Institute for Educational Development, Aga Khan University, Karachi, 1995. The paper was delivered to the London Institute of Education conference.]
'All societies seem to have a somewhat ambivalent attitude towards children. They are accorded the status of humans as far as our basic orientation is concerned. We do not treat them like animals: we talk to them, greet them, expect them to eat, to toilet and to dress like humans; but we do not expect them to take responsibility for their actions or their words. They are thus incomplete humans, in a state of transition, creatures about to be persons. Their actions are promissory, provisional, subject to correction and to being forgotten. It is this ambivalence which motivates the activities we call rearing, socialisation or education through which we attempt to prepare children for adult personhood.'60 Parents and communities are fairly clear about what they expect from their children, and there is always a tension between economic betterment and the attributes and behaviour of a person in any given society. In African countries, as in many Asian countries, communities are rural and small, and education must provide skills and attributes for survival both in those communities and in the bigger world of the towns and cities. Yet a key function of school is 'getting children out of their families'61: schools become the 'third cultural reality' of Malinowski, and they transcend the cultures in which they are situated in order for societies to progress.
[60 Serpell, op cit. p 70.
61 Musgrove, op cit. p 174]
The importance of understanding what constitutes education in any society in relation to policies which require citizens to pay for it lies in the need to understand the product. The economic justification for making citizens pay for the education of their children is partly founded on calculations of economic returns, and therefore in some sense involves repayment of a debt to society (although economic justifications often conceal a simpler truth which is that the state has insufficient resources, for whatever reason). The implication might be that people pay for the perceived entitlement to employment. The product is deemed as one which enables those who purchase it to be employed, and secondary benefits may or may not be learning how to be better people, and so on. Evidence suggests that when employment opportunities do not flow from success in schooling, school is seen as only mildly relevant, which is a sad indictment of any education system.
The intermediation between schooling and the economic benefits which accrue from it is the examination. In some countries the examination has complete dominance over all aspects of the system. Educational considerations are of little relevance. It is widely accepted among teachers and pupils that if an item is not examined there is little point in teaching it. As Ron Dore wrote in 1980,
Schools belonged unmistakably to the modern sector. Timetables were adjusted to the city week, not to the rhythms of the agrarian calendar. Teachers were hired and paid in accordance with the canons of modern bureaucracy, not indigenous custom. Furniture, layout, and curriculum design explicitly mimicked imported models. Schooling was socialisation into modern sector life - in anticipation of a future which only a small minority could enjoy. Hence, an overwhelming importance was attached to examinations, which determined who should belong to that minority.62
[62 Dore R, The Future of Formal Education in Developing countries, in Simmons J. (ed) The Education Dilemma: Policy Issues for Developing Countries in the 1980s, Pergamon, 1980, pp 72-73.]
Dore reiterates the difference between the emergence of education systems in industrialised countries and those in developing countries: 'where they lack certain pre-industrial traditions it is harder to sustain the guise that education is aimed at personal development and spiritual enrichment rather than money-earning opportunities, a fiction which in older societies derives some strength from traditional ideals and mitigates the effect of the qualifications disease'.
The extent to which parents and children perceive the relative advantages of schooling in economic or non-economic terms depends on tradition and culture as well as the

robustness of employment opportunities, and will vary between and within countries. There is frequently a belief that school can build moral responsibility and discipline, partly in reaction to the breakdown of traditional relationships in communities. In that cost sharing policies rest on assumptions of economic benefits, their success or failure will be sensitive to the attitudes of communities to the benefits of school, which, one would suppose, is related to success of children in examination systems. However, lack of information or the ability to interpret information, or indeed the lack of any choice, parents may be unaware of the poor quality of schooling their children receive as measured by examination results.
Although there are many aspects of the cultural environment which impinge on education policy, perhaps most critically language issues, another aspect which is relevant to cost sharing is the culture of management in the public sectors. The general model of cost recovery supposes among other things a perfect flexibility in public finance allocation. Such a flexibility cannot easily be achieved by any large organisation, public or private, and not at all in hierarchical and unaccountable public sector bureaucracies staffed by underpaid staff who live often in fear of their superiors and where there is no reward for innovation and much reward for caution and inactivity. Many of the reforms proposed for the management of education systems which emanate from foreign aid agencies seem to derive from idealised rationalist perspectives, assuming an underlying willingness of the recipients of these attentions to change. Yet in many countries the simplest of analyses reveals the irrationality of change, and preference for the 'inefficient' status quo, when viewed from the local perspective. Efficiency brings unemployment, and there is in most developing countries a shared goal of employment with widespread unwillingness to be responsible for or collude in other people's unemployment. Also, larger work loads may interfere with the necessary business of making a living from second or third jobs.
Much of the rhetoric about communities and 'ownership' is based on an assumption that measures can be taken to thrust on teachers accountability to the communities in which they serve. Apart from the fact that teachers will be accountable to those who pay their salaries (if they are accountable at all), the foregoing paragraphs suggest that the widest perception of the product which teachers deliver is employment (or movement up the education system) through certification. As Serpell argues well in the case of Zambia, the impediments to teachers perceiving their responsibilities to their communities as opposed to the wider educational bureaucracy are centred on the nature of the product, rather than on what should be the process, for teaching to examinations may not involve much which can be construed as 'learning'.63
[63 Serpell, op Cit. pp 132 - 135]
All this is to emphasise the scope of the 'implementation package' in which cost sharing

policies should be included. To implement reallocation and efficiency in public expenditures requires action along an extended chain ranging through different government agencies, including schools. It requires individuals to make arguments and claim more accountability than is strictly necessary, as well as requiring them to relocate accountability in ways which the system in which they operate cannot easily support.
E. Foreign Aid
It is worth also considering the culture of foreign aid agencies, which can be generally characterised as bureaucratic and hierarchical, with inward looking accountability, as evidenced in the Wappenhans report for the World Bank.64 The role of foreign aid agencies in the context of the present discussion can hardly be exaggerated: cost recovery was a central part of economic adjustment strategies on which aid was conditional, and there were few dissenters within the agencies. Moreover, most aid policy was directed towards expansion and increasing costs, and it disrupted the natural evolution of education systems within fiscal feasibility.65 It had a direct impact through this mechanism on cost recovery imperatives.
[64 The 'Wappenhans Report' was prepared by a former Vice-President of the World Bank in 1992 but never published. It attributed much of the high failure rate of World Bank projects to a 'culture of commitment' in which staff were appraised more on the basis of the projects for which they gained approval and committed funds rather than by any success of the projects themselves. This seems to be common to most agencies.
65 cf '... aid represents the import of resources not generated within the receiving economy. This may mean that the skills which would have been generating those resources were never in fact called for or learned, and are not available to use the resource when it is provided. In a more complex case, the educational system of a country has to be paid for from its productive resources ..., but if education is rapidly expanded by the use of unearned aid resources (without corresponding growth in the economy) there may not be employment for its graduates....' Bauer op cit, pp 105-106, quoting Guy Hunter.]
Another way foreign aid affected cost was via the high level of debt incurred by countries.66 In many countries, up to one third of recurrent budgets is allocated to paying debt costs (domestic and foreign).67 Priority is given to paying debt, and the large spenders in the budget such as education are constrained. The point to note is that debt is (or should be) a temporary phenomenon. Yet foreign aid agencies in their drive

to impose fiscal rectitude on countries take debt costs as given and ask for substantial and in some cases irreversible changes in education policy in order to reduce expenditures. Were debt not to be such a burden these changes would not be necessary. Foreign aid has therefore promoted contradictory aims of expansion and contraction, which is hardly a sound base for policy.
[66 How far should countries borrow to finance their social sectors? The argument is that without education economies will not grow, and that growth provides the fiscal space to repay loans. That has not transpired in many countries with have borrowed heavily for education. Moreover, the benefits of education loans may be doubted: in Tanzania and Ghana it is hard to see the returns to past loans for education.
67 For example, external debt costs account for over a third of the Ghanaian development budget for education. Nearly all this debt is to the World Bank. Internal debt cannot be allocated to sectors, though of course it finances them. There is a connection between aid to education and internal debt through the cost push effects of aid (e.g. through the expansion of systems beyond fiscal feasibility) which forces governments to borrow for deficit finance. World Bank officials commonly urge that IDA aid is almost grant aid, a disingenuous argument as the chickens of the 1970s and 80s come home to roost in the 90s.]
To a large extent foreign aid upsets a natural process of evolution in education policy, as countries are subject to swings of education fashion from outside: from the emphasis on university education; to vocational education and 'diversified' secondary curricula; to the current emphasis on 'basic' education. Depending on the capacity of the recipient country, staff from aid agencies have great influence over domestic policy, and in many cases even draft it.68
[68 As in the case of Tanzania where social sector policy was written and published by World Bank staff.]
Foreign aid projects have played a significant role in expanding education systems beyond a size which can be supported by domestic tax finance. Perhaps one of the most destructive initiatives has been Universal Primary Education (UPE) and the huge costs associated with it. Many countries expanded their systems too rapidly to maintain any quality, creating a large pool of untrained teachers, a stock of poorly built schools and large equipment and materials deficits. They also created raised expectations of employment which, not materialising, have prompted withdrawals from schools rather than increased enrolments, the opposite of what was intended. A current example is the education reform and consequent free compulsory universal basic education policy in
Ghana which extended the cycle from six to nine years in a fiscally stressed country.
Paradoxically, in many countries foreign aid agencies, while pressing for basic education policies, allocate the greater part of their donations to post-basic uses: this is certainly the case in Tanzania. However, this should not matter simply because of the fungibility of money. Indeed, there is a reasonable case for foreign aid to be directed at higher levels of education on the grounds that such interventions are much more likely to assist the poor than sub-sectoral interventions at the basic level.
There are two reasons which support such a view. First, post basic education has heavy infrastructural costs which, if they come from the same budget as primary education, will effect primary education spending: this is arguably one reason for the aid fashion of requiring communities to build their own primary schools, while post basic institutions receive capital budgets from government. Secondly, the ratio of private to public expenditures at the primary level are higher than the ratios at post-primary levels simply because costs are higher. The marginal dollar has a greater impact at the primary level than at higher levels. It would follow from this that policies should aim to create conditions and incentives to maximise parental contributions to primary schools rather than to reduce them. This would necessarily involve reducing the private costs of secondary education. Indeed, the argument can be extended: foreign aid should finance heavy infrastructure (roads, water and sewerage) within recurrent maintenance and operational cost constraints, and work through fungibility to push more resources from domestic revenues to social expenditures. The foreign aid fallacy is the assumption that foreign aid finances only achieve what they are directed targeted to achieve, which ignores fungibility.69
[69 Contrary to the belief of many commentators, governments' natural priorities tend towards higher education rather than basic education: hence the multiplicity of foreign aid conditionalities. If this were not so, why would conditionalities be required? Kenya provides an interesting example. Most aid to education was stopped for several years for political reasons. During the period of no aid government allocations to education investment showed entirely different priorities. Details are given for one section of the education system in the 1994 Kenya Public Expenditure Review, Chap 8.
Similarly, if priorities in the Ghanaian education development budget are ranked with and without foreign aid, higher education receives the highest ranking when only domestically financed investment is included, whereas basic education takes first rank when aid is included. Similarly, over the whole government development budget education expenditures rank fourth at 3.5 per cent of the total when only domestic finances are
considered, but rises to the second highest priority over all expenditures at 11 per cent when foreign aid is added. The situation is complicated by 'matching funds', which are domestic revenues required to match foreign aid allocations: see Penrose P. Budgeting and Expenditures in the Education Sector in Ghana, Ministry of Education, April 1996, Chap 5. (There is a deplorable tendency for agencies to demand fixed coefficients for budgetary allocations to education (e.g. the absurd '20/20' formula), something which, apart from all the measurement ambiguities involved, would never be countenanced by public finance managers in any country). In Ghana there has been intense pressure over recent years on the higher education budget with corresponding pressure to raise its share of the total. One argument commonly used by those pushing for reallocation is that basic education benefits from foreign aid.]
The implementation of cost recovery policies is frequently a part of wider conditionalities relating to fiscal balance and a part of institutional development programmes the design of which contains serious flaws of pacing and sequencing.70 Throughout the adjustment period the combined reduction of expenditures in real terms71 and increased costs to families invariably featured highly in Bretton Woods Institution (BWI) conditionality lists. These conditionalities were more attached to ideology than evidence.72 The history of foreign aid over the decade 1985-1995 (and perhaps beyond) will be shown to have had an immensely destructive effect on education systems in many countries with hasty 'reforms' imposed without regard to practicality or educational effect.73
[70 One such example was cost recovery in Zambia. Bretton Woods conditionalities, supported by donors, imposed cost recovery policies for health and education during a period of drought, and before significant public finance reforms were implemented.
71 David Sahn's study was more concerned with social sector expenditures as a percentage of national income, rather than in absolute real terms. As a percentage of national income education expenditure was quite robust in many countries, while at the same time falling in real terms. Both measurements are valid as partial measurements of real movements in fiscal effort, but it is a little disingenuous to argue, as is often the case, that real expenditures are maintained on the basis of constant or rising GNP/GDP shares. See Sahn D. E, Public Expenditures in Sub-Saharan Africa During a Period of Economic Reform, World Development, Vol. 20, nr 5, pp 673 - 693.
72 See Colclough C. & J. Manor, States or Markets? Neo-liberalism and

the Development Policy Debate, Clarendon Press, 1991, pp 197-213
73 This perhaps somewhat strong statement will be countered by 'what choice was there?', and while in relation to certain structural reforms it is probably the case that little choice existed, in the case of education there were many choices, some related to wider reform programmes and some simply to paying more attention to evidence and less to dogma. In both cases reforms paid little heed to initiating medium term measures to tackle the underlying cost structures of education, instead preferring to concentrate on superficial measures to reduce budgets. The failure to understand the essential requirements of civil service reform was another example. One documented example is in Carnoy M. and C. Torres, Educational Change and Structural Adjustment: A Case Study of Costa Rica, UNESCO, September 1992. The authors argue that Costa Rican secondary education never recovered from the effect of 'reform' policies initiated in the 1980s. It is easy to destroy and hard to rebuild.]
F. Conclusions
This chapter has set out issues for inclusion in the analytical framework for the case-studies of cost sharing. The common economic justifications for cost sharing are contradictory and inconsistent, and their rationalist assumptions do not reflect reality, either of how people behave or how public finance systems react. The politics and economics of cost sharing in developing countries are rather founded in fiscal crisis74 and in the ideology of 'low' public spending and budget deficits. They are also heavily influenced by foreign aid policies, which are themselves unstable over time and frequently inconsistent between donors and lenders, and which impose additional fiscal burdens on countries. As a result, there has been a general failure to understand the content, pacing and sequencing of financial reforms which improve the resource flows to education.
[74 A point generally accepted in Bray M. and K. Lillis (eds), Community Financing of Education: Issues and Policy Implications in Less Developed Countries, Pergamon Press, 1988. The book provides interesting case studies and is written, as the title suggests, with minimal analysis of public finance aspects of community financing. Keith Hinchliffe, in a cogent review article Neo-liberal Prescriptions for Education Finance: Unfortunately Necessary or Inherently Desirable? in International Journal of Educational Development, 1993, Vol. 13, Nr 2, pp 183-187 asks the same question in the title, although he is cautious in his approach to the answer.]

The subsequent chapters consider the evidence from selected countries and attempt to answer the questions posed at the beginning of this paper.
[Previous Page] [Top of Page] [Next Page]

Cost Sharing in Education - Public Finance, School and Household Perspectives - Education Research Paper No. 27, 1998, 141 p.
[Previous Page] [Table of Contents] [Next Page]
III Case Studies in Cost Sharing - Ghana A. Introduction B. Overview of the Ghanaian Education System C. The Economy, Public Finance and the Education Sector D. Trends in Recurrent Education Expenditures in Ghana E. Distribution of the Benefits of Public Expenditure F. Household Expenditures and Cost Sharing in Education G. Conclusions
A. Introduction
This chapter and the next are case studies of cost sharing in education. The first case study is of Ghana, and the next chapter covers Tanzania. My Ghana survey was undertaken between 1994 and 1996, and the large scale survey data are from the Ghana Living Standards Survey of which the latest round collected data for 1992.75 As I have already emphasised, my small scale surveys are intended to yield qualitative insights and are not statistically representative in that they can be used for prediction or statistical probability analysis.
[75 The research for this chapter was carried out by staff of the Ministry of Education. They were Steven Agyarkwa, Eunice Dappah, Nana Dwomoh, Gottfried Gome, Daniel Konadu, and Daniel Zogblah, supported by Yaw Dwomoh and R. J. Mettle-Nunoo. Florence Hianno and Herbert Gorman checked and entered the data on computer. I am also grateful to H. N. Pandit for his assistance.]
B. Overview of the Ghanaian Education System
Structure and Curriculum
The school system is divided into four levels. Pre-school education lasts for two years, and is mainly enjoyed by urban children. Primary education, from the age of 6 to the age of 12, lasts for 6 years, followed by Junior Secondary School (JSS) which lasts for three years. Primary and JSS are considered together as Basic Education, and the government is embarking on a programme of compulsory basic education for all children. For most children Basic Education is terminal.
The curricula are, by general consent, too large. There appears to be a consensus that there are 'too many subjects' in basic school, and that they should be reduced from the present nine subjects at primary level to five or six subjects, and from the present JSS total of 13, of which 12 are examined in national

examinations, to 12, with 10 nationally examined. At the SSS level the problem is equally acute.
The importance of this issue from a financial viewpoint is simply that it is the number of subjects which determines the number of teachers required at the post primary levels, and which therefore is a significant determinant of educational costs. The legacy of years of curriculum development and reform in many countries is large curricula which impose both substantial burdens of learning on children and high costs on parents and the state.
Enrolments and Staffing
Table 2 shows trends in enrolments. Up to 1991 there had been decline in the apparent enrolment ratio (AER)76, which reached about 69 per cent in 1989. The basic education enrolment has been fairly constant since, though there appears to be a drop in the primary AER, which, if true, will cause a decline in the overall basic AER over the next few years if not offset by large increases in Primary 1 intake.77 The data need to be treated with some reservation because population data are extrapolations from the 1984 census. In absolute terms total primary enrolments increased by 148,500 over the period, an increase of a little under 2 per cent a year. The age 6 population growth rate is probably higher than that. Senior secondary enrolments have declined in the same period. The enrolment data are for public schools only, and the AERs include private school enrolments, which have made a modest contribution to enrolment growth.
[76 Also known as the Gross Enrolment Ratio.
77 Which is unlikely as there have been declining grade 1 enrolments throughout the country.]
Table 2: Enrolments in Ghana, 1991/2 -1995/6
Level 1991/92 1992/93 1993/94 1994/95 1995/96
Primary (public) 1,807,226 1,848,300 1,910,408 1,920,803 1,955,713
Apparent Enrolment Ratio (public + private) 79% 77% 77% 75%
Pupil-Teacher Ratio (state schools) 27 30 31 30 32
Junior Secondary (public) 592,867 629,258 655,642 659,85 1677,641
Apparent Enrolment Ratio (public + private) 56% 58% 59% 58%
Pupil-Teacher Ratio (state schools) 17 19 18 19 20
Basic Education AER (public & private) 67 77 77 76
Senior Secondary (public) 225,277 247,496 236,530 201,813 194,460
Pupil-Teacher Ratio (state schools) 22 22 23 20 17
Tertiary 21,947 22,754 23,493 30,331
Notes & Sources: School data from MOE PBME school statistics. Tertiary education comprises Universities and Polytechnics only, data from Dept of Tertiary Education.

The apparent enrolment ratio is the ratio of the total number of children in school to the school age group. It can thus exceed 100 per cent, and is only a general indicator of enrolment performance, depending on the number of 'over-age' children in school. It also provides no indication of what percentage of any given age group actually attend and complete school. Its general use as an indicator of universal primary education is therefore misplaced. Time series for the two other measurements, net enrolment ratios and age-specific enrolment ratios, are not available in Ghana (apart from the two year GLSS comparison shown below). Age data have only recently begun to be collected and analysed in the school census.
Table 3: Primary School Net and Apparent Enrolment Ratios, Ghana 1991/92
Consumption Quintiles
I II III IV V All
NER AER NER AER NER AER NER AER NER AER NER AER
Accra Male ns ns ns ns ns ns 96.7 146.7 ns ns 91.3 138.9
Female 100.0 ns ns 111.1 92.6 115.6 90.6 88.2 88.6 80.9 87.4 116.6
Other Male 78.0 111.9 86.2 119.8 88.7 126.8 85.9 126.3 97.3 154.8 86.4 106.4
Urban Female 63.3 92.9 81.4 116.7 82.8 110.1 85.7 121.4 88.2 121.1 79.7 90.8
Rural Male 61.3 91.9 81.4 122.0 87.8 123.0 86.0 128.0 86.1 144.4 80.1 101.1
Coastal Female 55.0 80.0 67.2 93.4 72.2 95.8 80.0 126.7 85.7 128.6 70.3 123.1
Rural Male 78.7 126.0 89.4 127.8 80.3 109.8 85.6 124.0 93.5 129.9 84.7 123.1
Forest Female 75.2 99.3 80.6 113.7 85.7 114.3 89.1 118.8 78.8 126.9 81.8 112.3
Rural Male 45.6 70.5 51.7 82.8 45.1 70.3 60.9 88.0 60.4 98.1 51.3 78.0
Savannah Female 31.4 46.3 65.6 76.7 43.5 67.1 38.0 52.2 58.9 101.8 45.6 66.0
All
Male 66.6 101.2 77.8 113.3 76.3 110.9 80.5 118.1 87.5 130.7 76.5 113
Female 58.3 81.4 76.1 104.7 74.3 100.0 74.0 102.8 79.5 120.9 71.5 100
All 62.6 91.7 77.0 109.4 75.3 105.5 77.4 110.7 83.6 125.9 74.1 107
Notes & Sources: GSS, The Pattern of Poverty in Ghana, 1981-1992, May 1995, Tables 7.4 & 7.5. ns=not significant (small sample). The first quintile is the lowest consumption quintile.
The GLSS provides information on net enrolment ratios (NER) - albeit in some cases on the basis of a small sample - by Accra, other urban and the key ecological zones, not by administrative locality. The NER is the ratio of the number of children of school age in school to the total population of school age: where the denominator of the AER includes all children in school, the NER excludes children outside the 'official' age range. Table 3 summarises the data.
There is a discrepancy between the national apparent enrolment ratio of 79 per cent in 1992 in Table 2 and the 1991/92 AER in Table 3 of 108 per cent.
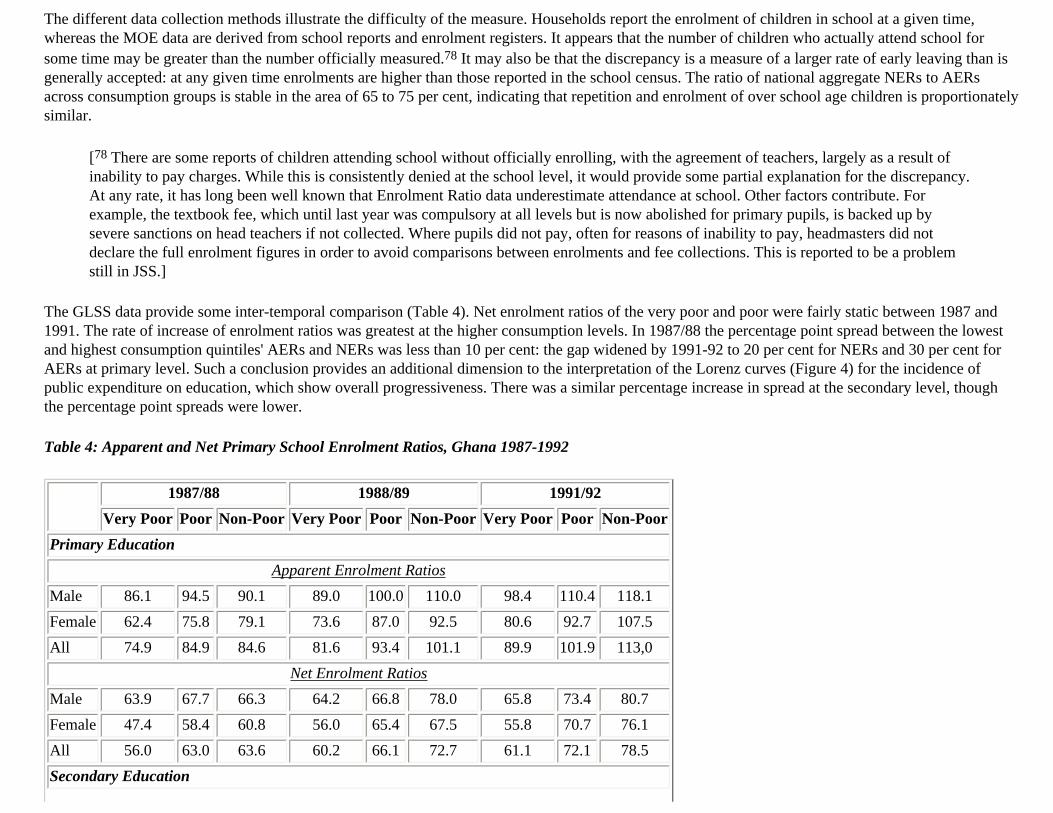
The different data collection methods illustrate the difficulty of the measure. Households report the enrolment of children in school at a given time, whereas the MOE data are derived from school reports and enrolment registers. It appears that the number of children who actually attend school for some time may be greater than the number officially measured.78 It may also be that the discrepancy is a measure of a larger rate of early leaving than is generally accepted: at any given time enrolments are higher than those reported in the school census. The ratio of national aggregate NERs to AERs across consumption groups is stable in the area of 65 to 75 per cent, indicating that repetition and enrolment of over school age children is proportionately similar.
[78 There are some reports of children attending school without officially enrolling, with the agreement of teachers, largely as a result of inability to pay charges. While this is consistently denied at the school level, it would provide some partial explanation for the discrepancy. At any rate, it has long been well known that Enrolment Ratio data underestimate attendance at school. Other factors contribute. For example, the textbook fee, which until last year was compulsory at all levels but is now abolished for primary pupils, is backed up by severe sanctions on head teachers if not collected. Where pupils did not pay, often for reasons of inability to pay, headmasters did not declare the full enrolment figures in order to avoid comparisons between enrolments and fee collections. This is reported to be a problem still in JSS.]
The GLSS data provide some inter-temporal comparison (Table 4). Net enrolment ratios of the very poor and poor were fairly static between 1987 and 1991. The rate of increase of enrolment ratios was greatest at the higher consumption levels. In 1987/88 the percentage point spread between the lowest and highest consumption quintiles' AERs and NERs was less than 10 per cent: the gap widened by 1991-92 to 20 per cent for NERs and 30 per cent for AERs at primary level. Such a conclusion provides an additional dimension to the interpretation of the Lorenz curves (Figure 4) for the incidence of public expenditure on education, which show overall progressiveness. There was a similar percentage increase in spread at the secondary level, though the percentage point spreads were lower.
Table 4: Apparent and Net Primary School Enrolment Ratios, Ghana 1987-1992
1987/88 1988/89 1991/92
Very Poor Poor Non-Poor Very Poor Poor Non-Poor Very Poor Poor Non-Poor
Primary Education
Apparent Enrolment Ratios
Male 86.1 94.5 90.1 89.0 100.0 110.0 98.4 110.4 118.1
Female 62.4 75.8 79.1 73.6 87.0 92.5 80.6 92.7 107.5
All 74.9 84.9 84.6 81.6 93.4 101.1 89.9 101.9 113,0
Net Enrolment Ratios
Male 63.9 67.7 66.3 64.2 66.8 78.0 65.8 73.4 80.7
Female 47.4 58.4 60.8 56.0 65.4 67.5 55.8 70.7 76.1
All 56.0 63.0 63.6 60.2 66.1 72.7 61.1 72.1 78.5
Secondary Education

Apparent Enrolment Ratios
Male 40.1 37.5 46.9 37.1 38,0 48.3 39.4 43.4 52.7
Female 23.1 30.5 30.9 22.3 25.4 32.3 25.4 36.2 40.0
All 32.5 34.1 39.2 30.6 32.3 40.4 33.2 40.3 46.5
Net Enrolment Ratios
Male 34.5 33.6 39.6 33.7 34.5 41.5 34.5 37.2 43.5
Female 21.4 29.1 27.7 22.0 24.6 29.5 23.4 33.1 35.9
All 28.7 31.4 33.9 28.6 30.0 35.6 29,5 35.5 39.8
Notes and Sources: Compiled from GSS, The Pattern of Poverty in Ghana, 1981-1992, May 1995, Tables 7.3, 7.4, 7.5 & 7.6.
The geographical variation in enrolment ratios creates inequality in the distribution of education facilities around the country, but the inequality of distribution of facilities measured in this way has been substantially reduced in recent years: the northern regions remain the most disfavoured.
While the primary PTR rose slowly, it varied significantly between and within provinces, as is shown in Table 5, and the variance between the PTR and the average number of pupils per class is also wide. The distribution of enrolments is uneven throughout the country, and the north is particularly disadvantaged. One effect of unequal distribution is that even though the distribution of public expenditure on education may be mildly progressive when measured against shares of aggregate consumption spending, the geographical distribution of expenditures may not be.
Table 5: Enrolments and Teachers by Region, Ghana 1992/3
Region Total Enrolment Population Aged 6 - 11 Nr. of Classes Teachers Pupils per Teacher Pupils per Class
ASHANTI 333,940 442,475 11,276 10,999 30 30
BRONG AHAFO 198,825 272,579 8,001 7,653 26 25
CENTRAL 190,751 228,667 6,780 5,863 33 28
EASTERN 272,422 353,662 10,809 10,389 26 25
GREATER ACCRA 180,642 324,493 4,209 4,562 40 43
NORTHERN 136,328 265,686 6,770 5,123 27 20
UPPER EAST 75,758 164,472 2,363 2,012 38 32
UPPER WEST 48,909 91,111 1,888 1,461 33 26
VOLTA 215,496 242,149 8,528 7,545 29 25
WESTERN 195,229 254,536 7,856 7,237 27 25
Totals 1,848,300 2,639,830 68,480 62,844 29 27
Notes & Sources: Enrolment, population & classes from MOE data; teachers from GES. Data sources account for the difference in PTR between Tables 2 and 5.
Thus, enrolment growth has been slow and the proportion of the school age population in school has been declining (other data not shown here indicate that the entry class enrolments in primary school have in many places been declining or stagnant since 1992). These facts are important background to the analysis of cost sharing.
C. The Economy, Public Finance and the Education Sector
The importance of a better understanding of the effect of economic management on the education sector is vital to sectoral policy making in view of the apparent acceptance of resource constraints at the sectoral level and the apparent need to adapt to them. There are features of Ghana's macroeconomic management which seriously affect the level of resources available for sectoral spending. In addition, limited capacity in the general public finance management area means that assumptions about reallocation in the system must be treated with caution. Ghana accepted Bretton Woods stabilisation and adjustment programmes at an early stage. Cost recovery was part of the package with well documented consequences.79
[79 For an excellent (and critical) account see Kraus J. The Political Economy of Stabilisation and Structural Adjustment in Ghana, in Rothchild D, Ghana: The Political Economy of Recovery, Lynne Rienner Publishers, 1991, pp 119-156.]
National Income and Public Expenditures
The Ghanaian GDP figures are generally accepted to be in need of revision, and there is a programme under way to do so. Similarly, there are questions surrounding the reliability of total government expenditure data. Table 6 is constructed from various sources and the usual data cautions apply.80 It appears that the growth of education recurrent expenditures has exceeded that of GDP growth, but that it was lower than the growth of total government expenditure. However, it exceeded the growth of discretionary recurrent expenditures by a little under twice as much. While maintaining a fairly steady proportion of total discretionary recurrent expenditures of just under 40 per cent, these relative growth rates exerted pressure on the budget and depended for their sustainability on the ability to reallocate from other budget items. Internal debt growth was also significant, as interest payments compete for recurrent finance.
[80 Nominal expenditures are converted to 1994 prices with the GDP deflator. Another way of looking at a salary based budget is to use a consumer price index. If this is used growth rates are slightly higher. This does not affect the comparative data. Opinions vary about the level of misestimation of GDP, but it may not be as significant as in other countries (including Tanzania).]
Table 6: Shares of Government Expenditure on Education in GDP and Total Budget, Ghana 1990-1997
1990 1991 1992 1993 1994 1995 1996 1997
Actual Actual Actual Actual Actual Actual Actual Provisional
(Actual and estimated expenditures in billion cedis at current prices)
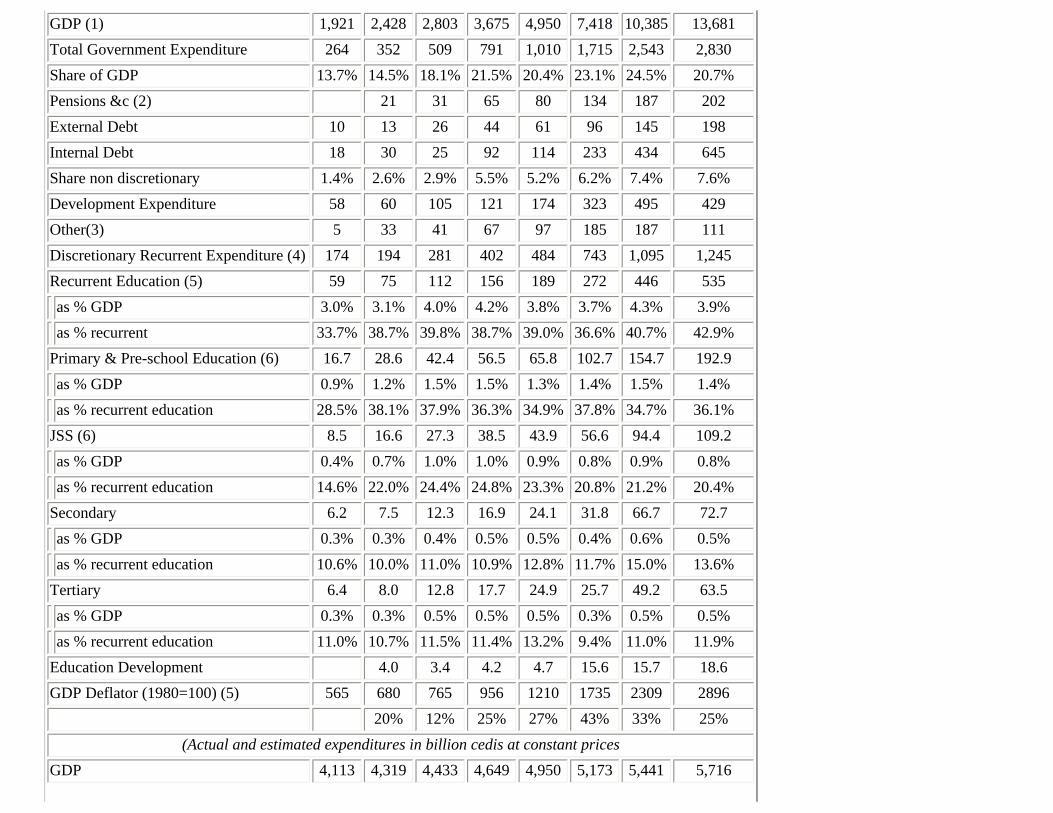
GDP (1) 1,921 2,428 2,803 3,675 4,950 7,418 10,385 13,681
Total Government Expenditure 264 352 509 791 1,010 1,715 2,543 2,830
Share of GDP 13.7% 14.5% 18.1% 21.5% 20.4% 23.1% 24.5% 20.7%
Pensions &c (2) 21 31 65 80 134 187 202
External Debt 10 13 26 44 61 96 145 198
Internal Debt 18 30 25 92 114 233 434 645
Share non discretionary 1.4% 2.6% 2.9% 5.5% 5.2% 6.2% 7.4% 7.6%
Development Expenditure 58 60 105 121 174 323 495 429
Other(3) 5 33 41 67 97 185 187 111
Discretionary Recurrent Expenditure (4) 174 194 281 402 484 743 1,095 1,245
Recurrent Education (5) 59 75 112 156 189 272 446 535
as % GDP 3.0% 3.1% 4.0% 4.2% 3.8% 3.7% 4.3% 3.9%
as % recurrent 33.7% 38.7% 39.8% 38.7% 39.0% 36.6% 40.7% 42.9%
Primary & Pre-school Education (6) 16.7 28.6 42.4 56.5 65.8 102.7 154.7 192.9
as % GDP 0.9% 1.2% 1.5% 1.5% 1.3% 1.4% 1.5% 1.4%
as % recurrent education 28.5% 38.1% 37.9% 36.3% 34.9% 37.8% 34.7% 36.1%
JSS (6) 8.5 16.6 27.3 38.5 43.9 56.6 94.4 109.2
as % GDP 0.4% 0.7% 1.0% 1.0% 0.9% 0.8% 0.9% 0.8%
as % recurrent education 14.6% 22.0% 24.4% 24.8% 23.3% 20.8% 21.2% 20.4%
Secondary 6.2 7.5 12.3 16.9 24.1 31.8 66.7 72.7
as % GDP 0.3% 0.3% 0.4% 0.5% 0.5% 0.4% 0.6% 0.5%
as % recurrent education 10.6% 10.0% 11.0% 10.9% 12.8% 11.7% 15.0% 13.6%
Tertiary 6.4 8.0 12.8 17.7 24.9 25.7 49.2 63.5
as % GDP 0.3% 0.3% 0.5% 0.5% 0.5% 0.3% 0.5% 0.5%
as % recurrent education 11.0% 10.7% 11.5% 11.4% 13.2% 9.4% 11.0% 11.9%
Education Development 4.0 3.4 4.2 4.7 15.6 15.7 18.6
GDP Deflator (1980=100) (5) 565 680 765 956 1210 1735 2309 2896
20% 12% 25% 27% 43% 33% 25%
(Actual and estimated expenditures in billion cedis at constant prices
GDP 4,113 4,319 4,433 4,649 4,950 5,173 5,441 5,716

Total Government Expenditure 565 625 804 1,001 1,010 1,196 1,332 1,182
Government Exp/GDP 13.7% 14.5% 18.1% 21.5% 20.4% 23.1% 24.5% 20.7%
Pensions &c na 38 48 82 80 94 98 84
External Debt 21 23 42 56 61 67 76 83
Internal Debt 37 53 39 116 114 162 228 269
Other 11 58 65 85 97 129 98 46
Discretionary Recurrent Expenditure 372.3 345.6 444.3 508.8 484.1 518.4 573.5 520.3
% GDP 9.1% 8.0% 10.0% 10.9% 9.8% 10.0% 10.5% 9.1%
% Total 65.9% 55.3% 55.2% 50.8% 47.9% 43.4% 43.0% 44.0%
Total Education 140.9 182.0 202.2 193.3 200.5 241.8 231.1
Education Recurrent 125.3 133.8 176.7 196.9 188.6 189.6 233.6 223.3
Primary & Pre-school Education 35.7 51.0 67.0 71.5 65.8 71.6 81.1 80.6
JSS 18.3 29.5 43.2 48.8 43.9 39.5 49.4 45.6
Secondary 13.2 13.4 19.4 21.4 24.1 22.2 35.0 30.4
Tertiary 13.7 14.3 20.3 22.4 24.9 17.9 25.8 26.5
Development Expenditure 124 108 166 154 174 225 259 179
Education Development 7.1 5.3 5.3 4.7 10.9 8.2 7.8
% Total Development 6.6% 3.2% 3.5% 2.7% 4.8% 3.2% 4.3%
as % total education exp 5.0% 2.9% 2.6% 2.4% 5.4% 3.4% 3.4%
Notes & Sources: From Ghana Country Economic Memorandum, World Bank, May 1995, Tables Al, A2 & A7; Quarterly Digest of Statistics, Ghana Statistical Service, March 1993, Tables 40 & 42, & Broad Based Budget, 1994, Government of Ghana, n.d., Section A p 6. 1993 budget data provisional actuals, 1994 estimates. Education development expenditures from 1994 Public Expenditure Review Table A1.3 (1993&94) and Broad Based Budget Section D.1(c). The development expenditure estimates are inconsistent between sources and very unreliable, and are assumed to be 'narrow coverage' (i.e. domestically financed expenditures only). The mixture of sources also means that some of the trend data should be interpreted with circumspection.
(1) GDP to 1996 from IMF, Staff Country Report, 1997; 1997-98 from 1998 Budget Statement
(2) Includes pensions, gratuities, social security
(3) Includes Common Fund, Environmental Fund, arrears clearance & emergency fund, redeployment & ESB, arrears clearance
(4) Total recurrent less pensions, debt & others

(5) Does not include Common Fund; interest subsidies on student loans; student loans arrears; scholarships; National Service volunteers.
(6) Primary and pre-school normally budgeted and accounted together. Primary budget includes GES admin, not apportioned to JSS.
By international developing countries' standards the proportion of discretionary expenditure allocated to education in Ghana has been high, while the ratio of education expenditure to GDP is comparable to the sub-Saharan average.81 Total government expenditure as a percentage of GDP has been rising to a level which places it within a comparable range for other African countries. It appears, though, that discretionary recurrent expenditure as a proportion of total government expenditures declined, and this was and continues to be the source of pressure on the overall education budget. The lower growth rate of domestic development expenditures indicates that finance is not being reallocated to investment. While it may be unlikely that education expenditures as a percentage of total discretionary expenditures will rise, the apparent steady decline in education spending as a proportion of total government expenditures shows that an overall reallocation of spending is taking place out of the sector, perhaps to service internal debt costs among others. If such a trend were to continue, it is difficult to see how the proportion of discretionary expenditures could be maintained in the face of competing claims on the diminishing total. The picture is made clearer in Figure 1.
[81 International comparisons should be treated cautiously because of the well documented problems in computing developing country national incomes; because of the ambiguities created by including capital/development expenditures in total education expenditures; and because of the combination of discretionary and non-discretionary expenditures in the numerator. Nevertheless, the average range of the education/GDP ratio in sub-Saharan Africa is likely to be in the region of 4 per cent; and the share in total government expenditure of education spending to be about 1 5 per cent (World Bank, Priorities and Strategies for Education: A World Bank Review, August 1995, p 66).]
The left hand axis of the Figure 1 measures public expenditures and the right hand axis measures national income. The four lines plot trends in GDP, total government expenditure, government expenditure after items such as pensions and debt payment are subtracted, and education sectoral expenditure. The area between total government expenditure and total government discretionary expenditures indicates the level of non discretionary expenditures. As the table shows, the gap is mainly accounted for by the growing level of internal debt interest payments which are above the line and which therefore compete with the sectors for recurrent finance.
Figure 1: Shares of Government Expenditure on Education in GDP and Total Budget, Ghana 1990-1997
The rate of inflation, reported to have exceeded 70 per cent in 1996 was accompanied by a growing deficit82 and level of government borrowing from the central bank. While this is not the place for an analysis of government economic policies, a resurgence of inflation and the failure to take action on its causes has created great difficulties in maintaining a stable sectoral policy framework. Salaries rose by about 30 per cent. Nevertheless, the level of national income implies a greater capacity to finance sectoral budgets than is currently experienced
[82 'Deficit' here refers to the budget balance net of foreign grants but including internal debt interest.]
D. Trends in Recurrent Education Expenditures in Ghana
Total Expenditure Trends
Most government recurrent education expenditure is in the government budget, the main exception apparently being expenditures from compulsory fees such as the textbook fee, which has not been on budget. However, not all education sectoral expenditure is recorded in the Ministry of Education's budget, including secondary schools and university scholarships; the interest subsidy of the student loans scheme; and a few other items. There are also considerable difficulties in disaggregating past kindergarden, primary and junior secondary expenditures.
Figure 2: Trends in Government Real Education Expenditure, Ghana 1990-1997 (Actual expenditures in '000,000 cedis at constant 1994 prices)
Notes & Sources: From MOE tables (PBME).
Figure 2 plots the trends in real actual expenditures (expressed in 1994 prices) from 1990-1995. Expenditures by sub-sector seem to follow the track of total expenditures, with a slight reallocation towards post-basic education. Over the period the average annual growth of secondary education has exceeded that of basic education. Of the major expenditures, only tertiary education is experiencing real growth.
Basic education (including kindergarden83) grew in real terms over the period, though the growth rate was interrupted in 1994, and now appears to be declining again. Secondary education also grew but is also now declining, while post-secondary education showed little growth.84 It is worth noting that although there are problems using the GDP deflator to derive real growth rates, it is similar in its order to magnitude to the CPI, and most of the budget is salaries. Growth in the education budget (as much of the Ghanaian civil service budget) is effectively financed largely through inflation taxation on teachers and civil servants.
[83 Note that all Ghanaian data combine pre-school and primary expenditures. It is a serious distortion of primary figures: pre-school expenditures account for about 18 per cent of the figure normally quoted as 'primary'.
84 Without including overhead allocations, the growth rates of direct expenditure are higher, indicating that overheads have declined. The data are not given here.]
Average Expenditure Trends
Figure 3: Average Actual Government Expenditures for School Education, Ghana 1990-1996 (Cedis at constant 1994 prices)
Source: Derived from MOE PBME data. Primary costs have been estimated by reducing the figures in Table 6 by 15 per cent to allow for KG costs.
Average Expenditures per Pupil
To make sense of total expenditure movements it is necessary to compare them to average expenditures, where the denominator is both expressed in terms of students and of teachers, and of non-salary expenditures. The calculation of such figures is fraught with difficulty, and they can only be taken as indications of orders of magnitude and trends, and even this may be misleading.
With these caveats in mind, Figure 3 shows the trends in average expenditures, expressed in 1994 prices. Average expenditures per primary pupil appear
to have been constant. Over the latter part of the period JSS per pupil expenditures have declined but may be rising again, although they may be underestimated because of reporting difficulties. There has been a fairly sharp rise in secondary student average expenditures since 1993, largely because the fall in enrolments was not matched by a reduction in the number of teachers.
Average Non-Salary Expenditures: Textbooks
Non salary recurrent expenditures on non administration are largely limited to learning materials and school maintenance at post primary levels.
In 1993 an average of cedis 1,276 was spent on textbooks for each child in basic education, in 1994 the figure was cedis 1,011, and in 1995 it was 1,854. Expenditures on senior secondary books were low in 1993, at about cedis 1,292 per student, and in 1994, when 1,022 cedis was spent per student: in 1995 expenditure per student on textbooks was nearly 6,000 cedis. The average cost of a primary education textbook was about 600 cedis and at senior secondary level 3,000-5,000 cedis. The budget would have purchased less than two books for every primary child: JSS children require at present 12 books, while in primary grades 1 - 3 children require books for two subjects and in the following grades for four subjects.
These data do not include expenditures made from the textbook revolving fund. Each senior secondary student contributes 6,000 cedis per year and each JSS student 500 cedis. Primary children no longer have to contribute. Expenditures from the revolving fund amounted to about 1 billion cedis in 1995. At January 1995 the account had a balance of 2.3 billion cedis, and the balance at January 1996 was 2.6 billion. If the revolving fund expenditures are added to the recurrent expenditures, average expenditures on post primary books are higher.
E. Distribution of the Benefits of Public Expenditure
One indication of how far government expenditures are equitably distributed across income groups is how far the share of government expenditure captured by income groups equates to their share of the population. If shares are equally distributed, the poorest 20 per cent of the population would expect to 'capture' 20 per cent of government expenditures, the next 20 per cent the same, and so on. A progressive distribution of government expenditures would have as a minimum condition that each quintile85 captures a greater percentage of public expenditure than the quintile below it. If shares are not progressively distributed, the poorest 20 per cent would be expected to capture less than 20 per cent of public expenditures. These relationships can be plotted on Lorenz curves, which are shown in Figure 4.
[85 Quintiles - population divided into five equal shares - are commonly measured in terms of aggregate consumption, which is taken to be a proxy for income, as income is difficult to measure because of income in kind. The GLSS categorises consumption groups in terms of 'expenditure'.]
It can be seen from comparing the two charts that there was some flattening of the curves over the period, meaning that expenditure, even for tertiary education, became more progressive. Expenditure on primary education is progressive, with lower quintiles receiving a proportionately larger share of primary expenditure, and it is notable that the incidence of secondary education spending is also very close to the 45 degree diagonal, which indicates equal shares to all quintiles. Indeed, when all education expenditure is aggregated it is only mildly regressive when measured in this way, and education spending is more progressively distributed than is aggregate consumption.86
[86 The way these data are calculated is described in Chapter 2. There are several reasons why they should be regarded as indicative, and it

is not easy to determine whether they over or underestimate progressiveness of the incidence of public expenditures, at least for school education. As most school education expenditure is made up from salaries, the incidence of aggregated public expenditures on education tells us very little about the quality of expenditure. Where there is a greater level of private expenditure to complement the public expenditures, it is fair to assume that quality will be higher than where private expenditures are lowest, at least where the data imply geographic distributions of benefits (because, for example, poorer people would be concentrated in specific locations). Also, there are variations in average expenditures on pupils between regions, and presumably these differences are reflected at the district and finally the school levels. Further insights into variations between schools are given later. There are other problems, such as the choice of unit, which will affect the distribution pattern: whether per adult equivalent measures are used or per capita total household expenditures matters. This is discussed in Demery et al, where alternative measures are given. The charts above are based on actual expenditures and are not adjusted.]
Figure 4: Benefit Incidence of Public Expenditures OH Education in Ghana, 1989 & 1992

Notes & Sources: Computed from data in Demery et al, The Incidence of Social Spending in Ghana, World Bank mimeo, Sept 1995. Tables Al & A2; GLSS3 Table 7.1 for 1992 aggregate consumption
In concluding the general overview of government education expenditures, there are a number of points to note which impinge upon cost sharing. First, it does appear that government has been reallocating away from education over the period, which would imply that any cost sharing measures were a response to a growing fiscal gap in education, and possibly a deliberate government policy (although the state of the macro-economy would be a better
explanation). Second, enrolment growth is low, as are enrolment ratios, and additional costs to parents are unlikely to stimulate more enrolment. Third, a reduction in the government's debt obligations would release discretionary resources for education, and a longer term strategy would involve increasing expenditure on education, with less emphasis on short term gap filling.87 Fourth, there is little space for reallocation: higher education takes about 12 per cent of the budget, and while there has been a fall in the efficiency the secondary sector, its share of about 16 per cent of the budget is not excessive and it is likely that demand for places will eventually pick up.
[87 Although public expenditures are to be reduced as a percentage of GDP.]
[Previous Page] [Top of Page] [Next Page]
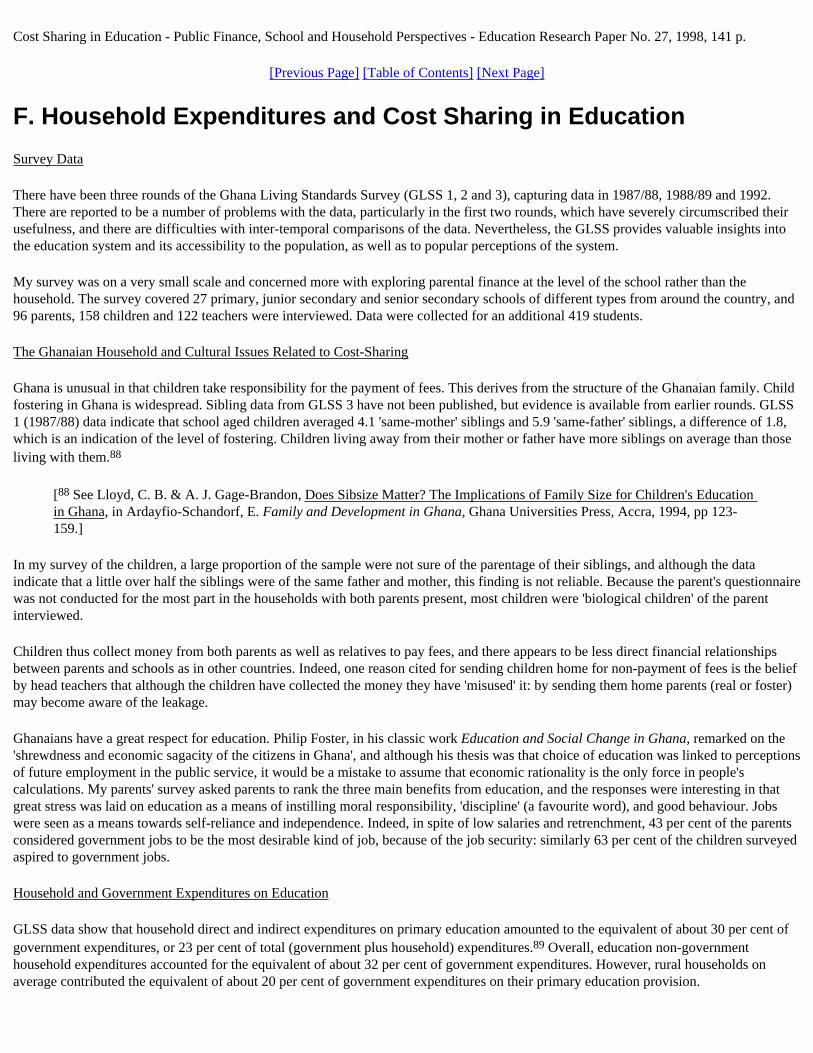
Cost Sharing in Education - Public Finance, School and Household Perspectives - Education Research Paper No. 27, 1998, 141 p.
[Previous Page] [Table of Contents] [Next Page]
F. Household Expenditures and Cost Sharing in Education
Survey Data
There have been three rounds of the Ghana Living Standards Survey (GLSS 1, 2 and 3), capturing data in 1987/88, 1988/89 and 1992. There are reported to be a number of problems with the data, particularly in the first two rounds, which have severely circumscribed their usefulness, and there are difficulties with inter-temporal comparisons of the data. Nevertheless, the GLSS provides valuable insights into the education system and its accessibility to the population, as well as to popular perceptions of the system.
My survey was on a very small scale and concerned more with exploring parental finance at the level of the school rather than the household. The survey covered 27 primary, junior secondary and senior secondary schools of different types from around the country, and 96 parents, 158 children and 122 teachers were interviewed. Data were collected for an additional 419 students.
The Ghanaian Household and Cultural Issues Related to Cost-Sharing
Ghana is unusual in that children take responsibility for the payment of fees. This derives from the structure of the Ghanaian family. Child fostering in Ghana is widespread. Sibling data from GLSS 3 have not been published, but evidence is available from earlier rounds. GLSS 1 (1987/88) data indicate that school aged children averaged 4.1 'same-mother' siblings and 5.9 'same-father' siblings, a difference of 1.8, which is an indication of the level of fostering. Children living away from their mother or father have more siblings on average than those living with them.88
[88 See Lloyd, C. B. & A. J. Gage-Brandon, Does Sibsize Matter? The Implications of Family Size for Children's Education in Ghana, in Ardayfio-Schandorf, E. Family and Development in Ghana, Ghana Universities Press, Accra, 1994, pp 123-159.]
In my survey of the children, a large proportion of the sample were not sure of the parentage of their siblings, and although the data indicate that a little over half the siblings were of the same father and mother, this finding is not reliable. Because the parent's questionnaire was not conducted for the most part in the households with both parents present, most children were 'biological children' of the parent interviewed.
Children thus collect money from both parents as well as relatives to pay fees, and there appears to be less direct financial relationships between parents and schools as in other countries. Indeed, one reason cited for sending children home for non-payment of fees is the belief by head teachers that although the children have collected the money they have 'misused' it: by sending them home parents (real or foster) may become aware of the leakage.
Ghanaians have a great respect for education. Philip Foster, in his classic work Education and Social Change in Ghana, remarked on the 'shrewdness and economic sagacity of the citizens in Ghana', and although his thesis was that choice of education was linked to perceptions of future employment in the public service, it would be a mistake to assume that economic rationality is the only force in people's calculations. My parents' survey asked parents to rank the three main benefits from education, and the responses were interesting in that great stress was laid on education as a means of instilling moral responsibility, 'discipline' (a favourite word), and good behaviour. Jobs were seen as a means towards self-reliance and independence. Indeed, in spite of low salaries and retrenchment, 43 per cent of the parents considered government jobs to be the most desirable kind of job, because of the job security: similarly 63 per cent of the children surveyed aspired to government jobs.
Household and Government Expenditures on Education
GLSS data show that household direct and indirect expenditures on primary education amounted to the equivalent of about 30 per cent of government expenditures, or 23 per cent of total (government plus household) expenditures.89 Overall, education non-government household expenditures accounted for the equivalent of about 32 per cent of government expenditures. However, rural households on average contributed the equivalent of about 20 per cent of government expenditures on their primary education provision.

[89 These figures may be subject to considerable error. It is extremely difficult to derive household education expenditure data disaggregated by level from the GLSS, for a number of reasons (including the fact that in most tables education is lumped with recreation, which includes significant levels of 'gambling' expenditures). The percentages given in the text are derived from Demery & al, op cit Table 11, in which government and household expenditures have been averaged using total population as the denominator.]
Education Expenditures within Households
Across all households, average household expenditures on education accounted for about 2.8 per cent of total average household expenditures.90 Equivalent figures for household expenditures in Kenya and Uganda91 were 6.7 per cent and 5.4 per cent respectively. The Ghana data seem very low, and may not provide an accurate picture. Expressed as a percentage of non-food spending, Ghanaian households on average spent about 5.7 per cent on education.92 The percentage expenditure accounted for by education in total discretionary (non-food) expenditures is comparable to other countries: it is higher than Tanzania but a bit lower than Zambia. As the Zambian data show93, there can be a strong relationship between percentage shares of education in household spending and changes in total spending (income) where total income declines while the fixed elements of education costs must still be met. Over all Ghana this amounted to about 15,000 cedis per household, according to GLSS, though the figure may be low. This may be compared to 11,000 cedis per household spent on weddings, dowries and funerals.
[90 Ghana Living Standards Survey: Report on Third Round, Ghana Statistical Service, March 1995. Derived by comparing relevant figures from Tables A9.27 & 28 with Table A9.29.
91 Report on the Uganda National Integrated Household Survey, 1992-93, Table 1.51.36: Kenya WMS 1993 Table 36a.
92 Demery et al, op cit. Table 14.
93 Zambian non-food expenditures fell from a national average of 42 per cent of total household expenditures in 1991 to 31 per cent in 1993, reflecting the rise in poverty over the period. Education in 1991 accounted for about 7 per cent of non-food expenditures, and rose to a startling 16 per cent as families grappled with poverty, drought and adjustment. See Penrose P. L. Harris and G. Bloom, Evaluation of the EU Structural Adjustment Support Programme in Zambia, EU Evaluation Unit, Brussels, August 1996, for an assessment of the relation between economic 'reform' and poverty. Data in table are from Central Statistics Office, Social Dimensions of Adjustment Priority Survey I, Lusaka, 1992, table 10.1 p 119 and Priority Survey II (1994), table 9.1 p 102, adjusted with the CSO annual rate of inflation. For Tanzania see Chapter 4.]
The introduction of health charges in Ghana introduced an additional item of expenditure to household budgets, and most health expenditures, particularly to the poor, are probably non-discretionary.94 In 1989 households spent 8.5 per cent of total non-food expenditures on health, rising to 9.4 per cent in 1992, and over the same period education shares in household spending fell (Table 7). Rural households show the strongest relationship between the claims of health and education spending. While their share of health spending in non-food expenditures rose by a little over 18 per cent, the share of education fell by 28 per cent. At the same time, the percentage of non-food spending in total spending rose. Thus a larger proportion of a larger proportion of total household expenditures is being spent on health care, while in total and in rural areas a smaller proportion of a larger proportion of total household expenditures is being spent on education.
[94 When health charges were introduced in Ghana in 1985 outpatient visits declined from 4.4 million to 1.6 million. Waddington C. J. and K. A. Enyimayew, A Price to Pay: The Impact of User Charges in the Volta Region of Ghana, Parts I & II, International Journal of Health Planning and Management, Vol. 4 Nr I, 1 989, pp 17 - 47, and Vol. 5 Nr 4, 1990, pp 287-312. It is unlikely that the reduction was a result of a decline in 'frivolous' usage. Utilisation has since climbed back, but with changes in the way people use health services and how they procure drugs: Ghana has a seriously high rate of antibiotic resistance. See also Kraus J. op cit. p 142.]
Table 7: Household Spending on Education and Health, Ghana 1989 & 1992
Household Spending as a Per Cent of Non-food Expenditure
Population Grouping 1989 1992
Education Health Ed + Health Education Health Ed + Health
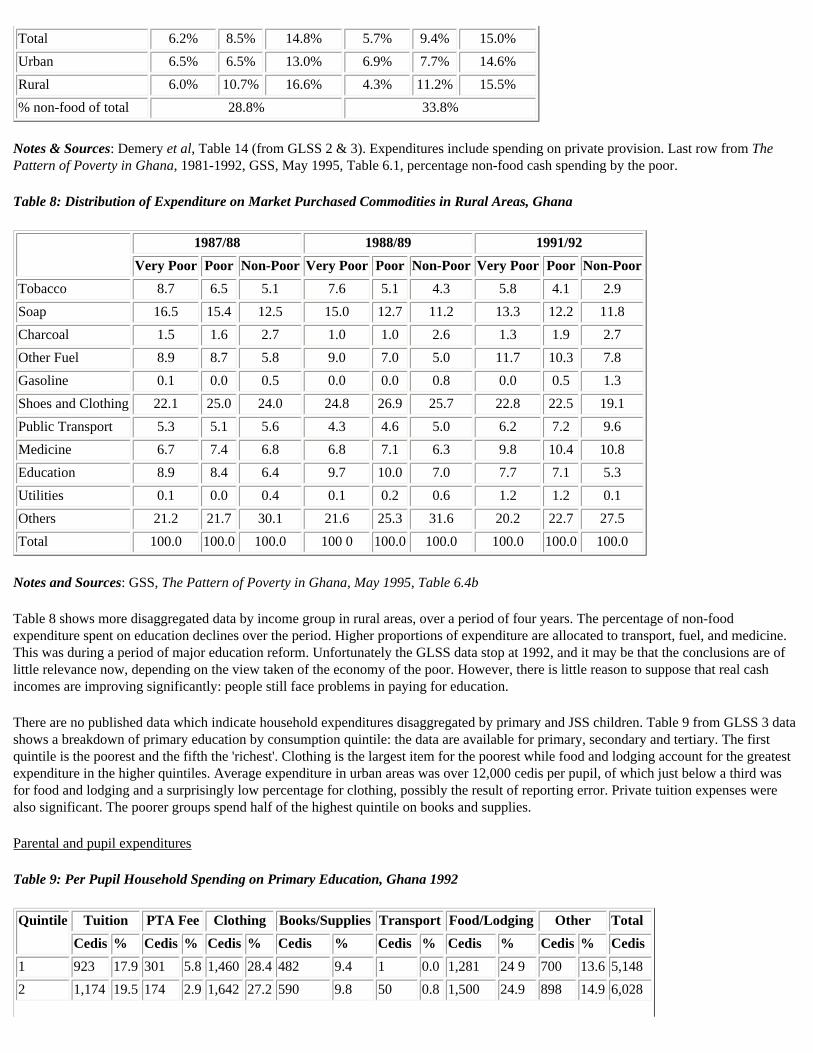
Total 6.2% 8.5% 14.8% 5.7% 9.4% 15.0%
Urban 6.5% 6.5% 13.0% 6.9% 7.7% 14.6%
Rural 6.0% 10.7% 16.6% 4.3% 11.2% 15.5%
% non-food of total 28.8% 33.8%
Notes & Sources: Demery et al, Table 14 (from GLSS 2 & 3). Expenditures include spending on private provision. Last row from The Pattern of Poverty in Ghana, 1981-1992, GSS, May 1995, Table 6.1, percentage non-food cash spending by the poor.
Table 8: Distribution of Expenditure on Market Purchased Commodities in Rural Areas, Ghana
1987/88 1988/89 1991/92
Very Poor Poor Non-Poor Very Poor Poor Non-Poor Very Poor Poor Non-Poor
Tobacco 8.7 6.5 5.1 7.6 5.1 4.3 5.8 4.1 2.9
Soap 16.5 15.4 12.5 15.0 12.7 11.2 13.3 12.2 11.8
Charcoal 1.5 1.6 2.7 1.0 1.0 2.6 1.3 1.9 2.7
Other Fuel 8.9 8.7 5.8 9.0 7.0 5.0 11.7 10.3 7.8
Gasoline 0.1 0.0 0.5 0.0 0.0 0.8 0.0 0.5 1.3
Shoes and Clothing 22.1 25.0 24.0 24.8 26.9 25.7 22.8 22.5 19.1
Public Transport 5.3 5.1 5.6 4.3 4.6 5.0 6.2 7.2 9.6
Medicine 6.7 7.4 6.8 6.8 7.1 6.3 9.8 10.4 10.8
Education 8.9 8.4 6.4 9.7 10.0 7.0 7.7 7.1 5.3
Utilities 0.1 0.0 0.4 0.1 0.2 0.6 1.2 1.2 0.1
Others 21.2 21.7 30.1 21.6 25.3 31.6 20.2 22.7 27.5
Total 100.0 100.0 100.0 100 0 100.0 100.0 100.0 100.0 100.0
Notes and Sources: GSS, The Pattern of Poverty in Ghana, May 1995, Table 6.4b
Table 8 shows more disaggregated data by income group in rural areas, over a period of four years. The percentage of non-food expenditure spent on education declines over the period. Higher proportions of expenditure are allocated to transport, fuel, and medicine. This was during a period of major education reform. Unfortunately the GLSS data stop at 1992, and it may be that the conclusions are of little relevance now, depending on the view taken of the economy of the poor. However, there is little reason to suppose that real cash incomes are improving significantly: people still face problems in paying for education.
There are no published data which indicate household expenditures disaggregated by primary and JSS children. Table 9 from GLSS 3 data shows a breakdown of primary education by consumption quintile: the data are available for primary, secondary and tertiary. The first quintile is the poorest and the fifth the 'richest'. Clothing is the largest item for the poorest while food and lodging account for the greatest expenditure in the higher quintiles. Average expenditure in urban areas was over 12,000 cedis per pupil, of which just below a third was for food and lodging and a surprisingly low percentage for clothing, possibly the result of reporting error. Private tuition expenses were also significant. The poorer groups spend half of the highest quintile on books and supplies.
Parental and pupil expenditures
Table 9: Per Pupil Household Spending on Primary Education, Ghana 1992
Quintile Tuition PTA Fee Clothing Books/Supplies Transport Food/Lodging Other Total
Cedis % Cedis % Cedis % Cedis % Cedis % Cedis % Cedis % Cedis
1 923 17.9 301 5.8 1,460 28.4 482 9.4 1 0.0 1,281 24 9 700 13.6 5,148
2 1,174 19.5 174 2.9 1,642 27.2 590 9.8 50 0.8 1,500 24.9 898 14.9 6,028
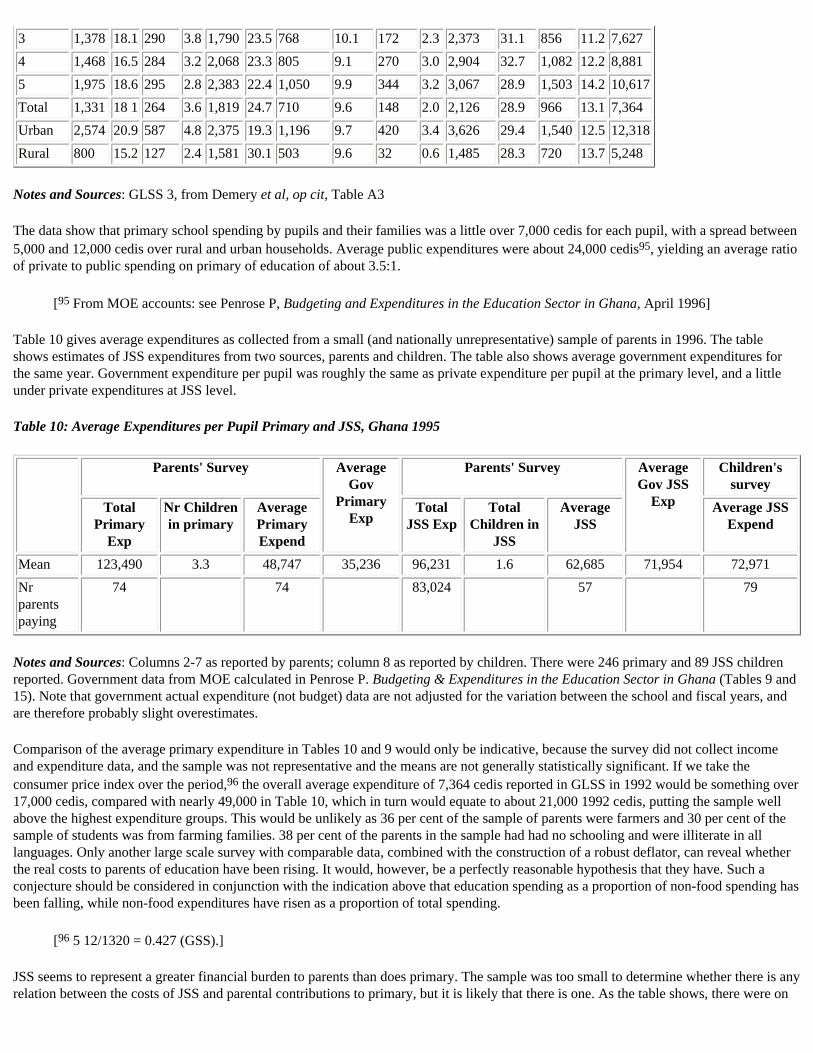
3 1,378 18.1 290 3.8 1,790 23.5 768 10.1 172 2.3 2,373 31.1 856 11.2 7,627
4 1,468 16.5 284 3.2 2,068 23.3 805 9.1 270 3.0 2,904 32.7 1,082 12.2 8,881
5 1,975 18.6 295 2.8 2,383 22.4 1,050 9.9 344 3.2 3,067 28.9 1,503 14.2 10,617
Total 1,331 18 1 264 3.6 1,819 24.7 710 9.6 148 2.0 2,126 28.9 966 13.1 7,364
Urban 2,574 20.9 587 4.8 2,375 19.3 1,196 9.7 420 3.4 3,626 29.4 1,540 12.5 12,318
Rural 800 15.2 127 2.4 1,581 30.1 503 9.6 32 0.6 1,485 28.3 720 13.7 5,248
Notes and Sources: GLSS 3, from Demery et al, op cit, Table A3
The data show that primary school spending by pupils and their families was a little over 7,000 cedis for each pupil, with a spread between 5,000 and 12,000 cedis over rural and urban households. Average public expenditures were about 24,000 cedis95, yielding an average ratio of private to public spending on primary of education of about 3.5:1.
[95 From MOE accounts: see Penrose P, Budgeting and Expenditures in the Education Sector in Ghana, April 1996]
Table 10 gives average expenditures as collected from a small (and nationally unrepresentative) sample of parents in 1996. The table shows estimates of JSS expenditures from two sources, parents and children. The table also shows average government expenditures for the same year. Government expenditure per pupil was roughly the same as private expenditure per pupil at the primary level, and a little under private expenditures at JSS level.
Table 10: Average Expenditures per Pupil Primary and JSS, Ghana 1995
Parents' Survey Average Gov
Primary Exp
Parents' Survey Average Gov JSS
Exp
Children's survey
Total Primary
Exp
Nr Children in primary
Average Primary Expend
Total JSS Exp
Total Children in
JSS
Average JSS
Average JSS Expend
Mean 123,490 3.3 48,747 35,236 96,231 1.6 62,685 71,954 72,971
Nr parents paying
74 74 83,024 57 79
Notes and Sources: Columns 2-7 as reported by parents; column 8 as reported by children. There were 246 primary and 89 JSS children reported. Government data from MOE calculated in Penrose P. Budgeting & Expenditures in the Education Sector in Ghana (Tables 9 and 15). Note that government actual expenditure (not budget) data are not adjusted for the variation between the school and fiscal years, and are therefore probably slight overestimates.
Comparison of the average primary expenditure in Tables 10 and 9 would only be indicative, because the survey did not collect income and expenditure data, and the sample was not representative and the means are not generally statistically significant. If we take the consumer price index over the period,96 the overall average expenditure of 7,364 cedis reported in GLSS in 1992 would be something over 17,000 cedis, compared with nearly 49,000 in Table 10, which in turn would equate to about 21,000 1992 cedis, putting the sample well above the highest expenditure groups. This would be unlikely as 36 per cent of the sample of parents were farmers and 30 per cent of the sample of students was from farming families. 38 per cent of the parents in the sample had had no schooling and were illiterate in all languages. Only another large scale survey with comparable data, combined with the construction of a robust deflator, can reveal whether the real costs to parents of education have been rising. It would, however, be a perfectly reasonable hypothesis that they have. Such a conjecture should be considered in conjunction with the indication above that education spending as a proportion of non-food spending has been falling, while non-food expenditures have risen as a proportion of total spending.
[96 5 12/1320 = 0.427 (GSS).]
JSS seems to represent a greater financial burden to parents than does primary. The sample was too small to determine whether there is any relation between the costs of JSS and parental contributions to primary, but it is likely that there is one. As the table shows, there were on
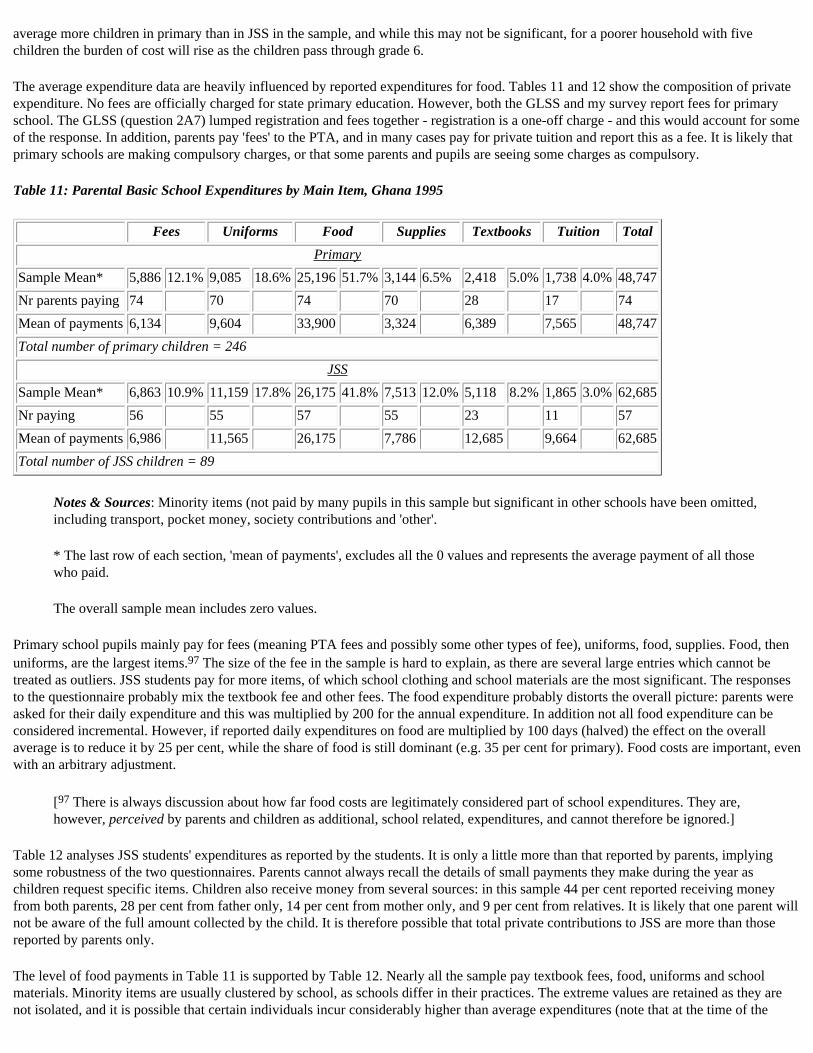
average more children in primary than in JSS in the sample, and while this may not be significant, for a poorer household with five children the burden of cost will rise as the children pass through grade 6.
The average expenditure data are heavily influenced by reported expenditures for food. Tables 11 and 12 show the composition of private expenditure. No fees are officially charged for state primary education. However, both the GLSS and my survey report fees for primary school. The GLSS (question 2A7) lumped registration and fees together - registration is a one-off charge - and this would account for some of the response. In addition, parents pay 'fees' to the PTA, and in many cases pay for private tuition and report this as a fee. It is likely that primary schools are making compulsory charges, or that some parents and pupils are seeing some charges as compulsory.
Table 11: Parental Basic School Expenditures by Main Item, Ghana 1995
Fees Uniforms Food Supplies Textbooks Tuition Total
Primary
Sample Mean* 5,886 12.1% 9,085 18.6% 25,196 51.7% 3,144 6.5% 2,418 5.0% 1,738 4.0% 48,747
Nr parents paying 74 70 74 70 28 17 74
Mean of payments 6,134 9,604 33,900 3,324 6,389 7,565 48,747
Total number of primary children = 246
JSS
Sample Mean* 6,863 10.9% 11,159 17.8% 26,175 41.8% 7,513 12.0% 5,118 8.2% 1,865 3.0% 62,685
Nr paying 56 55 57 55 23 11 57
Mean of payments 6,986 11,565 26,175 7,786 12,685 9,664 62,685
Total number of JSS children = 89
Notes & Sources: Minority items (not paid by many pupils in this sample but significant in other schools have been omitted, including transport, pocket money, society contributions and 'other'.
* The last row of each section, 'mean of payments', excludes all the 0 values and represents the average payment of all those who paid.
The overall sample mean includes zero values.
Primary school pupils mainly pay for fees (meaning PTA fees and possibly some other types of fee), uniforms, food, supplies. Food, then uniforms, are the largest items.97 The size of the fee in the sample is hard to explain, as there are several large entries which cannot be treated as outliers. JSS students pay for more items, of which school clothing and school materials are the most significant. The responses to the questionnaire probably mix the textbook fee and other fees. The food expenditure probably distorts the overall picture: parents were asked for their daily expenditure and this was multiplied by 200 for the annual expenditure. In addition not all food expenditure can be considered incremental. However, if reported daily expenditures on food are multiplied by 100 days (halved) the effect on the overall average is to reduce it by 25 per cent, while the share of food is still dominant (e.g. 35 per cent for primary). Food costs are important, even with an arbitrary adjustment.
[97 There is always discussion about how far food costs are legitimately considered part of school expenditures. They are, however, perceived by parents and children as additional, school related, expenditures, and cannot therefore be ignored.]
Table 12 analyses JSS students' expenditures as reported by the students. It is only a little more than that reported by parents, implying some robustness of the two questionnaires. Parents cannot always recall the details of small payments they make during the year as children request specific items. Children also receive money from several sources: in this sample 44 per cent reported receiving money from both parents, 28 per cent from father only, 14 per cent from mother only, and 9 per cent from relatives. It is likely that one parent will not be aware of the full amount collected by the child. It is therefore possible that total private contributions to JSS are more than those reported by parents only.
The level of food payments in Table 11 is supported by Table 12. Nearly all the sample pay textbook fees, food, uniforms and school materials. Minority items are usually clustered by school, as schools differ in their practices. The extreme values are retained as they are not isolated, and it is possible that certain individuals incur considerably higher than average expenditures (note that at the time of the

survey $1 US was worth a little under 1,000 cedis, and the extreme values are not extreme in absolute or even purchasing power terms).
Table 12: JSS Student Expenditures by Item, Ghana 1995
Text book User Fee
Stationery Fee for Exams
PTA dues
Sport Ex Books
Uniforms Shoes &
Canvas
Other School Mat's
Food Culture Furniture Religious Collection
Bag Total
Mean 446 2,133 109 117 4,480 8,696 7,273 10,761 23,108 219 2,316 527 4,162 68,750
Maximum 6,000 6,000 750 900 26,000 30,000 39,000 114,000 80,000 6,000 10,000 8,000 20,000 187,160
Nr std'ts paid
68 51 33 34 76 75 75 76 61 29 32 22 58 79
Mean of p'mts
518 3,304 262 272 4,657 9,160 7,661 11,186 29,926 597 5,719 1,891 5,669 68,750
Notes and Sources: Expenditures incurred by a small number of students in the sample have been omitted. These include transport, entertainment fees, and rent. Such expenditures are incurred in other schools. The last row is the mean of those who have actually paid, while the first mean includes zero values.
Secondary Education
We now turn to the costs of secondary education. This is an area which has tended to be neglected over recent years because of the emphasis on basic education by foreign aid agencies. However, although there still lacks a strong body evidence to support the hypothesis, it may well be that increasing the private costs of secondary education create disincentives to attend primary school and have the effect of reducing household expenditures on primary education. There is some evidence of this in Ghana.98 Parents and children perceive that there is relatively little return in terms of access to jobs from just a basic education99, and therefore recognise the need to stay on at school. Primary school is therefore essentially a route through to secondary education. However, if secondary education costs are perceived to be beyond the ability of parents and children to pay, they may choose to forego the expense of basic education in the anticipation of not being able to continue beyond it.100
[98 Lavy V, Investment in Human Capital, Schooling Supply Constraints in Rural Ghana, LSMS Working Paper Nr 93, World Bank, 1992.
99 See Glewwe P, Schooling, Skills, and the Returns to Government Investment in Education: An Exploration Using Data from Ghana, LSMS Working Paper Nr 76, World Bank, 1991. Glewwe argues that returns to primary education in Ghana are (or were at the time of analysis (1989 GLSS)) almost nil.
100 See World Bank, Access to Education and Health Care in Uganda, June 1996, p 22 for speculation that this effect occurs in Uganda.]
Lavy addresses the criticism raised in Chapter 2 that cross-sectional data are used to predict future behaviour, and that costs are fairly constant throughout the education cycle. His model explores the effect of future costs on the present demand for primary schooling, rejecting the assumption of constant costs. His main result is that the cost of access to post-primary education is the major determinant of parents' decisions to enrol their children in primary school, although the principal component of this conclusion is distance. Direct costs are weak coefficients, while he does not consider indirect costs except for travel costs. Distance is treated in effect as a proxy for cost, with some reason. Furthermore, his conclusions concern rural communities.
As the main cost constraint identified by Lavy was travel to secondary school, he concludes that access to secondary school should be made cheaper through building more schools. Expansion of JSS access is just one such response, and the community secondary school programme was another.101 My survey data are not adequate for the purpose of exploring the relation between the costs of grades 7-9 (JSS) and decisions to attend primary school, but perhaps future GLSS surveys will be better able to address such questions through more appropriate questions. It is likely that costs both to government and households rise sharply at grade 7. It is also reasonable to suppose that one effect of a single basic cycle will be to emphasise constraints to senior secondary school.
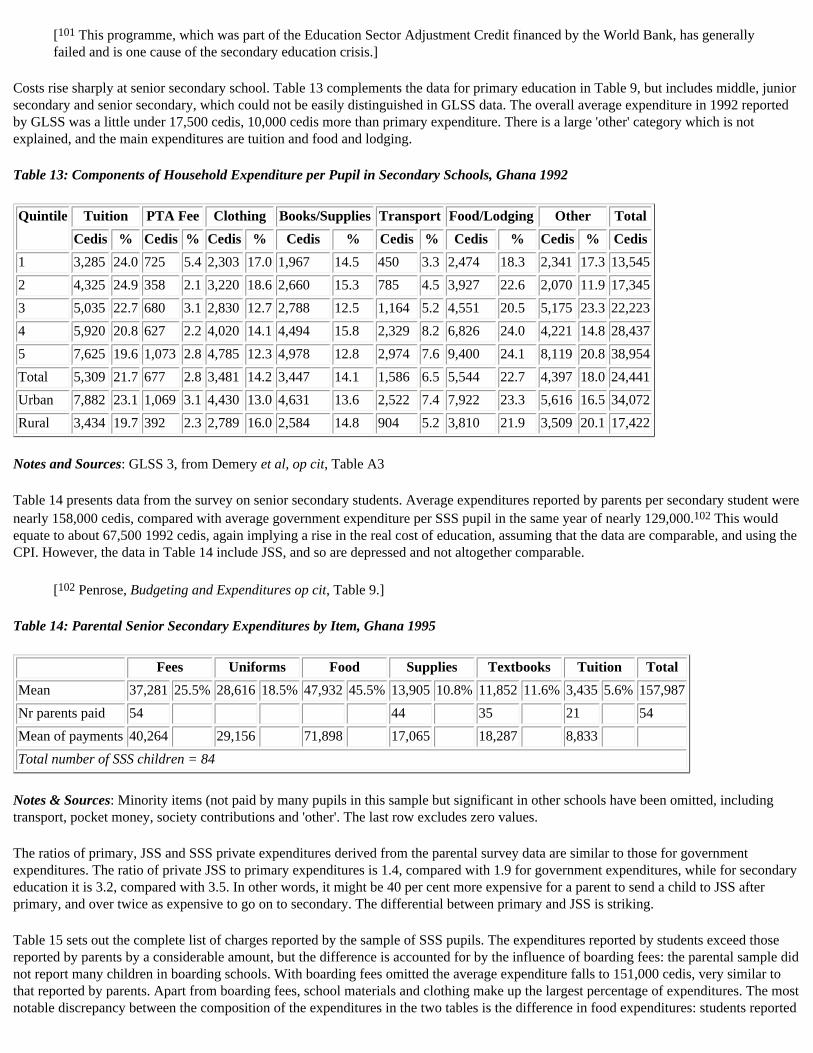
[101 This programme, which was part of the Education Sector Adjustment Credit financed by the World Bank, has generally failed and is one cause of the secondary education crisis.]
Costs rise sharply at senior secondary school. Table 13 complements the data for primary education in Table 9, but includes middle, junior secondary and senior secondary, which could not be easily distinguished in GLSS data. The overall average expenditure in 1992 reported by GLSS was a little under 17,500 cedis, 10,000 cedis more than primary expenditure. There is a large 'other' category which is not explained, and the main expenditures are tuition and food and lodging.
Table 13: Components of Household Expenditure per Pupil in Secondary Schools, Ghana 1992
Quintile Tuition PTA Fee Clothing Books/Supplies Transport Food/Lodging Other Total
Cedis % Cedis % Cedis % Cedis % Cedis % Cedis % Cedis % Cedis
1 3,285 24.0 725 5.4 2,303 17.0 1,967 14.5 450 3.3 2,474 18.3 2,341 17.3 13,545
2 4,325 24.9 358 2.1 3,220 18.6 2,660 15.3 785 4.5 3,927 22.6 2,070 11.9 17,345
3 5,035 22.7 680 3.1 2,830 12.7 2,788 12.5 1,164 5.2 4,551 20.5 5,175 23.3 22,223
4 5,920 20.8 627 2.2 4,020 14.1 4,494 15.8 2,329 8.2 6,826 24.0 4,221 14.8 28,437
5 7,625 19.6 1,073 2.8 4,785 12.3 4,978 12.8 2,974 7.6 9,400 24.1 8,119 20.8 38,954
Total 5,309 21.7 677 2.8 3,481 14.2 3,447 14.1 1,586 6.5 5,544 22.7 4,397 18.0 24,441
Urban 7,882 23.1 1,069 3.1 4,430 13.0 4,631 13.6 2,522 7.4 7,922 23.3 5,616 16.5 34,072
Rural 3,434 19.7 392 2.3 2,789 16.0 2,584 14.8 904 5.2 3,810 21.9 3,509 20.1 17,422
Notes and Sources: GLSS 3, from Demery et al, op cit, Table A3
Table 14 presents data from the survey on senior secondary students. Average expenditures reported by parents per secondary student were nearly 158,000 cedis, compared with average government expenditure per SSS pupil in the same year of nearly 129,000.102 This would equate to about 67,500 1992 cedis, again implying a rise in the real cost of education, assuming that the data are comparable, and using the CPI. However, the data in Table 14 include JSS, and so are depressed and not altogether comparable.
[102 Penrose, Budgeting and Expenditures op cit, Table 9.]
Table 14: Parental Senior Secondary Expenditures by Item, Ghana 1995
Fees Uniforms Food Supplies Textbooks Tuition Total
Mean 37,281 25.5% 28,616 18.5% 47,932 45.5% 13,905 10.8% 11,852 11.6% 3,435 5.6% 157,987
Nr parents paid 54 44 35 21 54
Mean of payments 40,264 29,156 71,898 17,065 18,287 8,833
Total number of SSS children = 84
Notes & Sources: Minority items (not paid by many pupils in this sample but significant in other schools have been omitted, including transport, pocket money, society contributions and 'other'. The last row excludes zero values.
The ratios of primary, JSS and SSS private expenditures derived from the parental survey data are similar to those for government expenditures. The ratio of private JSS to primary expenditures is 1.4, compared with 1.9 for government expenditures, while for secondary education it is 3.2, compared with 3.5. In other words, it might be 40 per cent more expensive for a parent to send a child to JSS after primary, and over twice as expensive to go on to secondary. The differential between primary and JSS is striking.
Table 15 sets out the complete list of charges reported by the sample of SSS pupils. The expenditures reported by students exceed those reported by parents by a considerable amount, but the difference is accounted for by the influence of boarding fees: the parental sample did not report many children in boarding schools. With boarding fees omitted the average expenditure falls to 151,000 cedis, very similar to that reported by parents. Apart from boarding fees, school materials and clothing make up the largest percentage of expenditures. The most notable discrepancy between the composition of the expenditures in the two tables is the difference in food expenditures: students reported
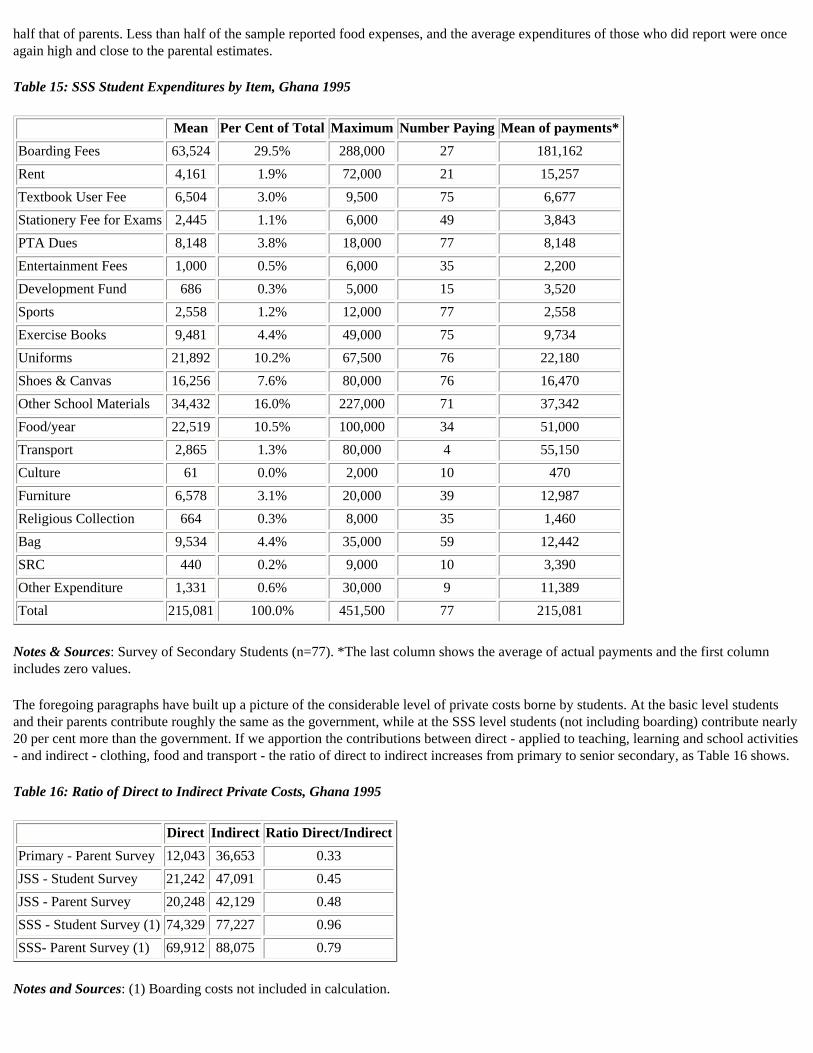
half that of parents. Less than half of the sample reported food expenses, and the average expenditures of those who did report were once again high and close to the parental estimates.
Table 15: SSS Student Expenditures by Item, Ghana 1995
Mean Per Cent of Total Maximum Number Paying Mean of payments*
Boarding Fees 63,524 29.5% 288,000 27 181,162
Rent 4,161 1.9% 72,000 21 15,257
Textbook User Fee 6,504 3.0% 9,500 75 6,677
Stationery Fee for Exams 2,445 1.1% 6,000 49 3,843
PTA Dues 8,148 3.8% 18,000 77 8,148
Entertainment Fees 1,000 0.5% 6,000 35 2,200
Development Fund 686 0.3% 5,000 15 3,520
Sports 2,558 1.2% 12,000 77 2,558
Exercise Books 9,481 4.4% 49,000 75 9,734
Uniforms 21,892 10.2% 67,500 76 22,180
Shoes & Canvas 16,256 7.6% 80,000 76 16,470
Other School Materials 34,432 16.0% 227,000 71 37,342
Food/year 22,519 10.5% 100,000 34 51,000
Transport 2,865 1.3% 80,000 4 55,150
Culture 61 0.0% 2,000 10 470
Furniture 6,578 3.1% 20,000 39 12,987
Religious Collection 664 0.3% 8,000 35 1,460
Bag 9,534 4.4% 35,000 59 12,442
SRC 440 0.2% 9,000 10 3,390
Other Expenditure 1,331 0.6% 30,000 9 11,389
Total 215,081 100.0% 451,500 77 215,081
Notes & Sources: Survey of Secondary Students (n=77). *The last column shows the average of actual payments and the first column includes zero values.
The foregoing paragraphs have built up a picture of the considerable level of private costs borne by students. At the basic level students and their parents contribute roughly the same as the government, while at the SSS level students (not including boarding) contribute nearly 20 per cent more than the government. If we apportion the contributions between direct - applied to teaching, learning and school activities - and indirect - clothing, food and transport - the ratio of direct to indirect increases from primary to senior secondary, as Table 16 shows.
Table 16: Ratio of Direct to Indirect Private Costs, Ghana 1995
Direct Indirect Ratio Direct/Indirect
Primary - Parent Survey 12,043 36,653 0.33
JSS - Student Survey 21,242 47,091 0.45
JSS - Parent Survey 20,248 42,129 0.48
SSS - Student Survey (1) 74,329 77,227 0.96
SSS- Parent Survey (1) 69,912 88,075 0.79
Notes and Sources: (1) Boarding costs not included in calculation.
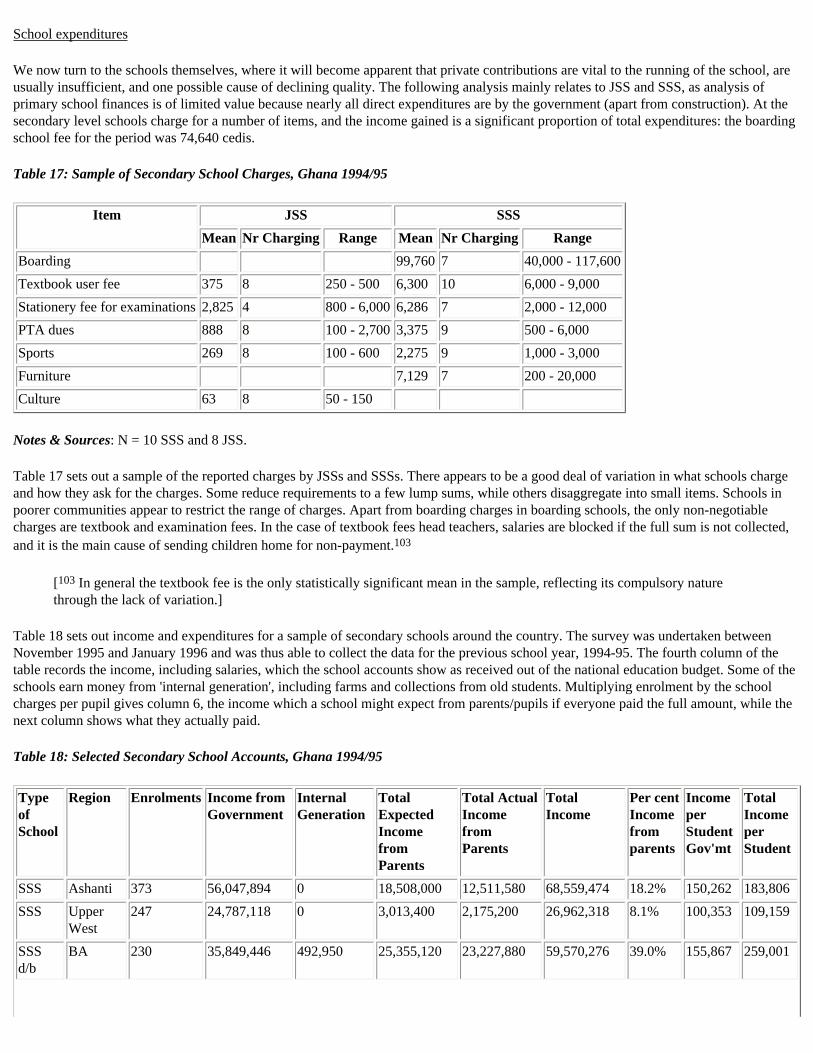
School expenditures
We now turn to the schools themselves, where it will become apparent that private contributions are vital to the running of the school, are usually insufficient, and one possible cause of declining quality. The following analysis mainly relates to JSS and SSS, as analysis of primary school finances is of limited value because nearly all direct expenditures are by the government (apart from construction). At the secondary level schools charge for a number of items, and the income gained is a significant proportion of total expenditures: the boarding school fee for the period was 74,640 cedis.
Table 17: Sample of Secondary School Charges, Ghana 1994/95
Item JSS SSS
Mean Nr Charging Range Mean Nr Charging Range
Boarding 99,760 7 40,000 - 117,600
Textbook user fee 375 8 250 - 500 6,300 10 6,000 - 9,000
Stationery fee for examinations 2,825 4 800 - 6,000 6,286 7 2,000 - 12,000
PTA dues 888 8 100 - 2,700 3,375 9 500 - 6,000
Sports 269 8 100 - 600 2,275 9 1,000 - 3,000
Furniture 7,129 7 200 - 20,000
Culture 63 8 50 - 150
Notes & Sources: N = 10 SSS and 8 JSS.
Table 17 sets out a sample of the reported charges by JSSs and SSSs. There appears to be a good deal of variation in what schools charge and how they ask for the charges. Some reduce requirements to a few lump sums, while others disaggregate into small items. Schools in poorer communities appear to restrict the range of charges. Apart from boarding charges in boarding schools, the only non-negotiable charges are textbook and examination fees. In the case of textbook fees head teachers, salaries are blocked if the full sum is not collected, and it is the main cause of sending children home for non-payment.103
[103 In general the textbook fee is the only statistically significant mean in the sample, reflecting its compulsory nature through the lack of variation.]
Table 18 sets out income and expenditures for a sample of secondary schools around the country. The survey was undertaken between November 1995 and January 1996 and was thus able to collect the data for the previous school year, 1994-95. The fourth column of the table records the income, including salaries, which the school accounts show as received out of the national education budget. Some of the schools earn money from 'internal generation', including farms and collections from old students. Multiplying enrolment by the school charges per pupil gives column 6, the income which a school might expect from parents/pupils if everyone paid the full amount, while the next column shows what they actually paid.
Table 18: Selected Secondary School Accounts, Ghana 1994/95
Type of School
Region Enrolments Income from Government
Internal Generation
Total Expected Income from Parents
Total Actual Income from Parents
Total Income
Per cent Income from parents
Income per Student Gov'mt
Total Income per Student
SSS Ashanti 373 56,047,894 0 18,508,000 12,511,580 68,559,474 18.2% 150,262 183,806
SSS Upper West
247 24,787,118 0 3,013,400 2,175,200 26,962,318 8.1% 100,353 109,159
SSS d/b
BA 230 35,849,446 492,950 25,355,120 23,227,880 59,570,276 39.0% 155,867 259,001
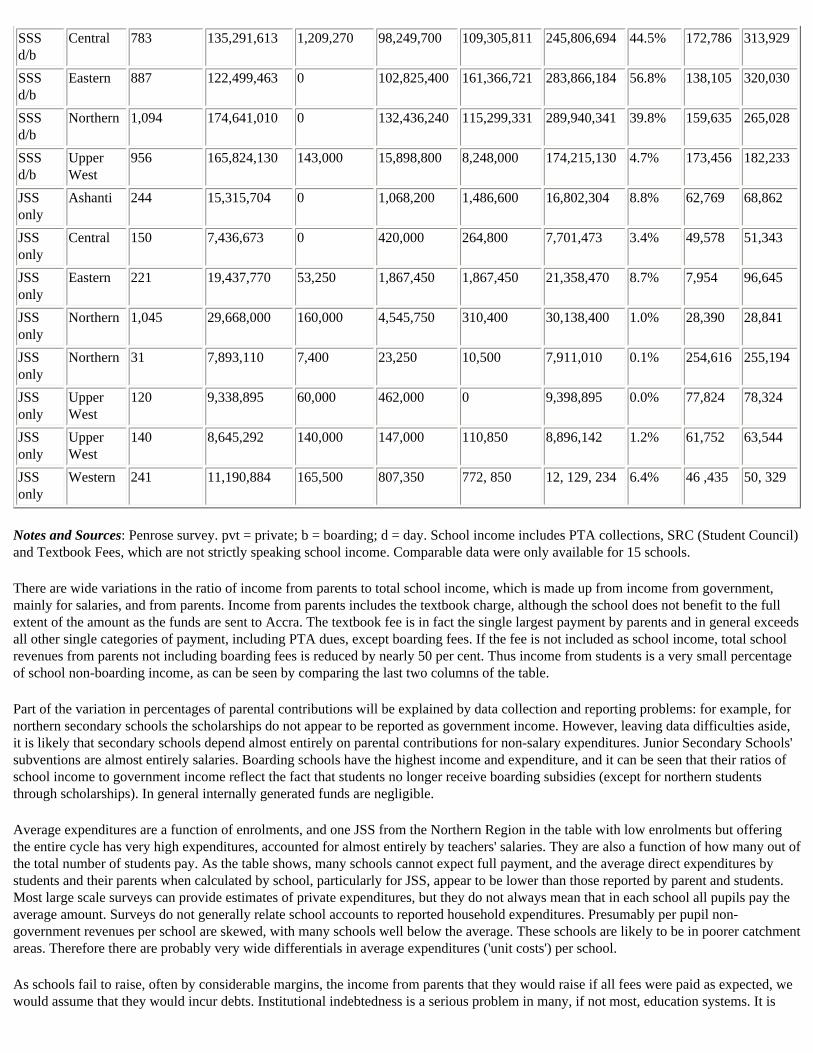
SSS d/b
Central 783 135,291,613 1,209,270 98,249,700 109,305,811 245,806,694 44.5% 172,786 313,929
SSS d/b
Eastern 887 122,499,463 0 102,825,400 161,366,721 283,866,184 56.8% 138,105 320,030
SSS d/b
Northern 1,094 174,641,010 0 132,436,240 115,299,331 289,940,341 39.8% 159,635 265,028
SSS d/b
Upper West
956 165,824,130 143,000 15,898,800 8,248,000 174,215,130 4.7% 173,456 182,233
JSS only
Ashanti 244 15,315,704 0 1,068,200 1,486,600 16,802,304 8.8% 62,769 68,862
JSS only
Central 150 7,436,673 0 420,000 264,800 7,701,473 3.4% 49,578 51,343
JSS only
Eastern 221 19,437,770 53,250 1,867,450 1,867,450 21,358,470 8.7% 7,954 96,645
JSS only
Northern 1,045 29,668,000 160,000 4,545,750 310,400 30,138,400 1.0% 28,390 28,841
JSS only
Northern 31 7,893,110 7,400 23,250 10,500 7,911,010 0.1% 254,616 255,194
JSS only
Upper West
120 9,338,895 60,000 462,000 0 9,398,895 0.0% 77,824 78,324
JSS only
Upper West
140 8,645,292 140,000 147,000 110,850 8,896,142 1.2% 61,752 63,544
JSS only
Western 241 11,190,884 165,500 807,350 772, 850 12, 129, 234 6.4% 46 ,435 50, 329
Notes and Sources: Penrose survey. pvt = private; b = boarding; d = day. School income includes PTA collections, SRC (Student Council) and Textbook Fees, which are not strictly speaking school income. Comparable data were only available for 15 schools.
There are wide variations in the ratio of income from parents to total school income, which is made up from income from government, mainly for salaries, and from parents. Income from parents includes the textbook charge, although the school does not benefit to the full extent of the amount as the funds are sent to Accra. The textbook fee is in fact the single largest payment by parents and in general exceeds all other single categories of payment, including PTA dues, except boarding fees. If the fee is not included as school income, total school revenues from parents not including boarding fees is reduced by nearly 50 per cent. Thus income from students is a very small percentage of school non-boarding income, as can be seen by comparing the last two columns of the table.
Part of the variation in percentages of parental contributions will be explained by data collection and reporting problems: for example, for northern secondary schools the scholarships do not appear to be reported as government income. However, leaving data difficulties aside, it is likely that secondary schools depend almost entirely on parental contributions for non-salary expenditures. Junior Secondary Schools' subventions are almost entirely salaries. Boarding schools have the highest income and expenditure, and it can be seen that their ratios of school income to government income reflect the fact that students no longer receive boarding subsidies (except for northern students through scholarships). In general internally generated funds are negligible.
Average expenditures are a function of enrolments, and one JSS from the Northern Region in the table with low enrolments but offering the entire cycle has very high expenditures, accounted for almost entirely by teachers' salaries. They are also a function of how many out of the total number of students pay. As the table shows, many schools cannot expect full payment, and the average direct expenditures by students and their parents when calculated by school, particularly for JSS, appear to be lower than those reported by parent and students. Most large scale surveys can provide estimates of private expenditures, but they do not always mean that in each school all pupils pay the average amount. Surveys do not generally relate school accounts to reported household expenditures. Presumably per pupil non-government revenues per school are skewed, with many schools well below the average. These schools are likely to be in poorer catchment areas. Therefore there are probably very wide differentials in average expenditures ('unit costs') per school.
As schools fail to raise, often by considerable margins, the income from parents that they would raise if all fees were paid as expected, we would assume that they would incur debts. Institutional indebtedness is a serious problem in many, if not most, education systems. It is
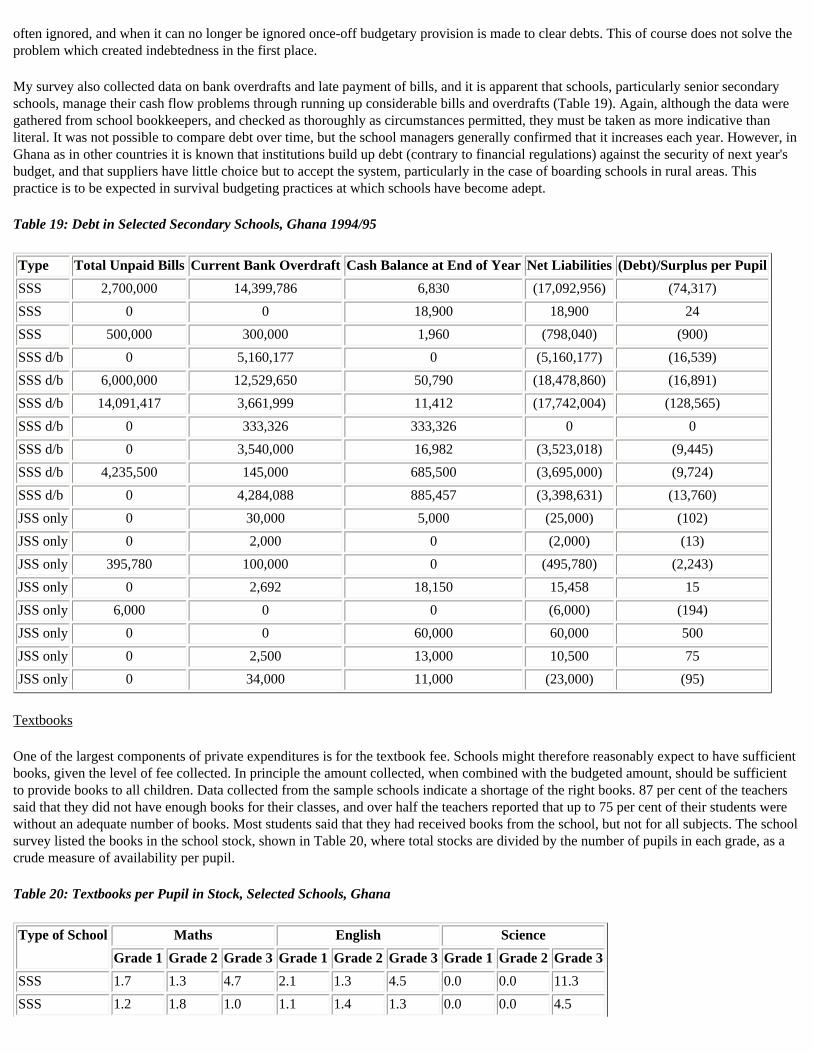
often ignored, and when it can no longer be ignored once-off budgetary provision is made to clear debts. This of course does not solve the problem which created indebtedness in the first place.
My survey also collected data on bank overdrafts and late payment of bills, and it is apparent that schools, particularly senior secondary schools, manage their cash flow problems through running up considerable bills and overdrafts (Table 19). Again, although the data were gathered from school bookkeepers, and checked as thoroughly as circumstances permitted, they must be taken as more indicative than literal. It was not possible to compare debt over time, but the school managers generally confirmed that it increases each year. However, in Ghana as in other countries it is known that institutions build up debt (contrary to financial regulations) against the security of next year's budget, and that suppliers have little choice but to accept the system, particularly in the case of boarding schools in rural areas. This practice is to be expected in survival budgeting practices at which schools have become adept.
Table 19: Debt in Selected Secondary Schools, Ghana 1994/95
Type Total Unpaid Bills Current Bank Overdraft Cash Balance at End of Year Net Liabilities (Debt)/Surplus per Pupil
SSS 2,700,000 14,399,786 6,830 (17,092,956) (74,317)
SSS 0 0 18,900 18,900 24
SSS 500,000 300,000 1,960 (798,040) (900)
SSS d/b 0 5,160,177 0 (5,160,177) (16,539)
SSS d/b 6,000,000 12,529,650 50,790 (18,478,860) (16,891)
SSS d/b 14,091,417 3,661,999 11,412 (17,742,004) (128,565)
SSS d/b 0 333,326 333,326 0 0
SSS d/b 0 3,540,000 16,982 (3,523,018) (9,445)
SSS d/b 4,235,500 145,000 685,500 (3,695,000) (9,724)
SSS d/b 0 4,284,088 885,457 (3,398,631) (13,760)
JSS only 0 30,000 5,000 (25,000) (102)
JSS only 0 2,000 0 (2,000) (13)
JSS only 395,780 100,000 0 (495,780) (2,243)
JSS only 0 2,692 18,150 15,458 15
JSS only 6,000 0 0 (6,000) (194)
JSS only 0 0 60,000 60,000 500
JSS only 0 2,500 13,000 10,500 75
JSS only 0 34,000 11,000 (23,000) (95)
Textbooks
One of the largest components of private expenditures is for the textbook fee. Schools might therefore reasonably expect to have sufficient books, given the level of fee collected. In principle the amount collected, when combined with the budgeted amount, should be sufficient to provide books to all children. Data collected from the sample schools indicate a shortage of the right books. 87 per cent of the teachers said that they did not have enough books for their classes, and over half the teachers reported that up to 75 per cent of their students were without an adequate number of books. Most students said that they had received books from the school, but not for all subjects. The school survey listed the books in the school stock, shown in Table 20, where total stocks are divided by the number of pupils in each grade, as a crude measure of availability per pupil.
Table 20: Textbooks per Pupil in Stock, Selected Schools, Ghana
Type of School Maths English Science
Grade 1 Grade 2 Grade 3 Grade 1 Grade 2 Grade 3 Grade 1 Grade 2 Grade 3
SSS 1.7 1.3 4.7 2.1 1.3 4.5 0.0 0.0 11.3
SSS 1.2 1.8 1.0 1.1 1.4 1.3 0.0 0.0 4.5

SSS 1.2 2.8 2.3 2.0 2.7 2.7 0.0 0.0 2.6
SSS 0.7 1.3 1.2 0.7 1.3 1.2 1.3 0.0 0.0
SSS 1.2 1.3 1.8 1.2 1.3 1.8 2.0 0.0 0.0
SSS 1.4 1.5 2.1 1.9 1.4 1.9 0.0 0.0 3.1
SSS 0.9 1.7 1.2 1.0 2.0 1.0 0.4 1.0 1.0
SSS 1.1 0.7 1.2 1.1 0.7 1.4 1.1 0.7 1.4
SSS 0.9 0.7 0.8 0.9 0.9 0.8 0.0 0.0 2.8
SSS 1.5 2.1 4.3 2.5 2.2 3.0 0.4 1.0 0.5
Average 1.2 1.5 2.1 1.5 1.5 2.0 0.5 0.3 2.7
JSS only 15 2.1 2.5 2.6 1.3 2.6 2.4 2.0 1.0
JSS only 0.7 0.6 1.2 0.5 0.9 1.0 0.4 1.1 1.8
JSS only 0.7 1.0 1.2 0.4 1.1 0.7 0.4 1.1 1.2
JSS only 0.9 1.4 1.4 1.2 1.3 1.3 0.8 1.3 1.4
JSS only 3.7 1.4 1.1 1.3 0.5 0.6 2.8 1.3 1.3
JSS only 0.2 0.7 0.0 0.0 0.2 0.0 1.0 0.0 0.0
JSS only 0.8 1.2 1.4 0.0 1.0 0.9 0.8 1.4 1.2
JSS only 0.8 1.1 2.2 1.1 1.3 1.0 1.4 1.8 2.1
Average 1.2 1.2 1.6 0.9 1.0 1.2 1.3 1.3 1.4
While it may seem that there are sufficient books, many of the books are donated or old books and not used for the syllabus. The table shows considerable variation between schools (with the newer schools mostly experiencing the shortages: older schools have accumulated more books). The senior secondary schools appeared to be lacking science books. It appears that while teachers and students (40 per cent of whom bought at least one book) complain of inadequate numbers of books, many schools have stocks of books which they do not use because they are not the right books for the course.
In that cost sharing is supposed to provide benefits to pupils and schools, it would seem to be of the utmost importance that this major component of school charges should be seen to work well. It seems to be reasonably efficient in collection, but less so in distribution.
Borrowing
Another indication both of ability and willingness to pay is the level of borrowing and/or sale of physical assets to pay for education. The GLSS3 document does not tabulate these questions, but indicates in the text that 28 per cent of all households were in debt.104 GLSS did not gather data on asset sales. Education is not mentioned as a reason for loans, but 12 per cent of loans were for health reasons. The sample of university students would be too small for GLSS, and consequently student loans would not show up in the survey. In addition, the fungibility of money would suggest that loans for one item release funds for another. Overall, though, it seems that Ghanaian households do not consider borrowing for education to be a priority, though such a conclusion must necessarily be a weak one for lack of evidence. Nevertheless, the question is an important one, as among other things it is an indication of the perception of the relative returns to education.
[104 GLSS3 p 106]
Tertiary Education
There is a scarcity of information on how university students finance their education.105 Of all the education institutions, universities succeed in raising the least fee income, less even than senior secondary schools. Cost recovery at the higher education level is one of the most difficult political challenges facing governments, and there is little history of success in Africa. The costs of higher education are by nature high relative to other parts of the system, and these high costs are compounded by the difficulties experienced in many countries of managing the sub-sector.
[105 My survey did not cover higher education institutions. One report has been produced by the Technology Centre of the
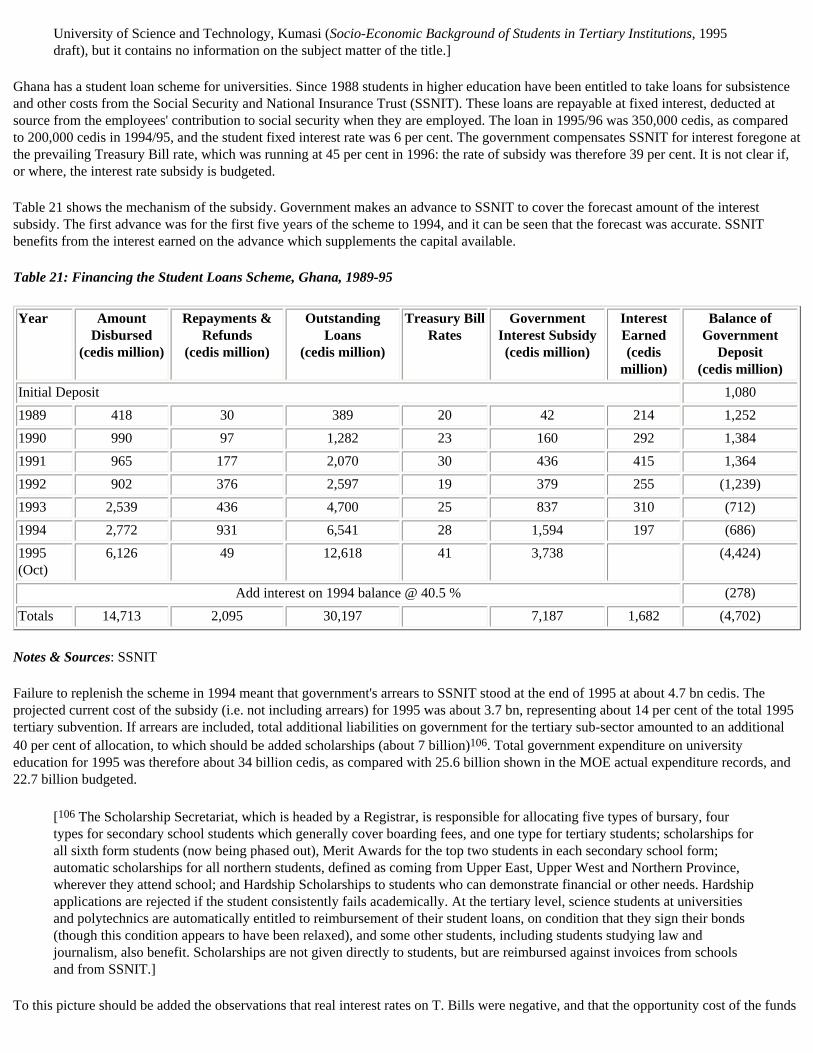
University of Science and Technology, Kumasi (Socio-Economic Background of Students in Tertiary Institutions, 1995 draft), but it contains no information on the subject matter of the title.]
Ghana has a student loan scheme for universities. Since 1988 students in higher education have been entitled to take loans for subsistence and other costs from the Social Security and National Insurance Trust (SSNIT). These loans are repayable at fixed interest, deducted at source from the employees' contribution to social security when they are employed. The loan in 1995/96 was 350,000 cedis, as compared to 200,000 cedis in 1994/95, and the student fixed interest rate was 6 per cent. The government compensates SSNIT for interest foregone at the prevailing Treasury Bill rate, which was running at 45 per cent in 1996: the rate of subsidy was therefore 39 per cent. It is not clear if, or where, the interest rate subsidy is budgeted.
Table 21 shows the mechanism of the subsidy. Government makes an advance to SSNIT to cover the forecast amount of the interest subsidy. The first advance was for the first five years of the scheme to 1994, and it can be seen that the forecast was accurate. SSNIT benefits from the interest earned on the advance which supplements the capital available.
Table 21: Financing the Student Loans Scheme, Ghana, 1989-95
Year Amount Disbursed
(cedis million)
Repayments & Refunds
(cedis million)
Outstanding Loans
(cedis million)
Treasury Bill Rates
Government Interest Subsidy(cedis million)
Interest Earned(cedis
million)
Balance of Government
Deposit(cedis million)
Initial Deposit 1,080
1989 418 30 389 20 42 214 1,252
1990 990 97 1,282 23 160 292 1,384
1991 965 177 2,070 30 436 415 1,364
1992 902 376 2,597 19 379 255 (1,239)
1993 2,539 436 4,700 25 837 310 (712)
1994 2,772 931 6,541 28 1,594 197 (686)
1995 (Oct)
6,126 49 12,618 41 3,738 (4,424)
Add interest on 1994 balance @ 40.5 % (278)
Totals 14,713 2,095 30,197 7,187 1,682 (4,702)
Notes & Sources: SSNIT
Failure to replenish the scheme in 1994 meant that government's arrears to SSNIT stood at the end of 1995 at about 4.7 bn cedis. The projected current cost of the subsidy (i.e. not including arrears) for 1995 was about 3.7 bn, representing about 14 per cent of the total 1995 tertiary subvention. If arrears are included, total additional liabilities on government for the tertiary sub-sector amounted to an additional 40 per cent of allocation, to which should be added scholarships (about 7 billion)106. Total government expenditure on university education for 1995 was therefore about 34 billion cedis, as compared with 25.6 billion shown in the MOE actual expenditure records, and 22.7 billion budgeted.
[106 The Scholarship Secretariat, which is headed by a Registrar, is responsible for allocating five types of bursary, four types for secondary school students which generally cover boarding fees, and one type for tertiary students; scholarships for all sixth form students (now being phased out), Merit Awards for the top two students in each secondary school form; automatic scholarships for all northern students, defined as coming from Upper East, Upper West and Northern Province, wherever they attend school; and Hardship Scholarships to students who can demonstrate financial or other needs. Hardship applications are rejected if the student consistently fails academically. At the tertiary level, science students at universities and polytechnics are automatically entitled to reimbursement of their student loans, on condition that they sign their bonds (though this condition appears to have been relaxed), and some other students, including students studying law and journalism, also benefit. Scholarships are not given directly to students, but are reimbursed against invoices from schools and from SSNIT.]
To this picture should be added the observations that real interest rates on T. Bills were negative, and that the opportunity cost of the funds

to SSNIT are probably therefore heavily underestimated. While this does not represent a financial cost, it does represent an economic cost, though the volume is small when compared with the total volume of SSNIT transactions.
SSNIT bears the full risk of non-recovery. At present that risk is not seen as a threat, because each student must provide three guarantors who themselves are in the social security scheme. The SSNIT merely has to deduct outstanding payments from guarantor's contributions.
However, the continuing rise in graduate unemployment could prove to be a problem, not so much because students themselves do not get jobs, and therefore do not become members of the scheme, but because perceptions of future unemployment may act as a disincentive to guarantors.107
[107 It is interesting to note that because of this threat SSNIT takes an active interest in higher education policy. One response is to encourage greater enrolments in science and technology subjects on the grounds that students with these degrees will have a greater chance of employment, or be better equipped for self-employment. The Ministry also takes this view, which may, however, be questioned in the light of tracer studies and market surveys. One of these shows clearly that employers' demand is for management and business related graduates (Plan Consult, Manpower Survey, Graduate Tracer Study, Accra, Sept 1995). Out of the total sample of 339 vacancies, 3 were for science graduates. Employers' predictions of future vacancies were bleak.]
SSNIT's own ceiling on the increase of the loan is the rate of increase in the index of its basket of salaries, which is a mixture of private and public sector salaries. For 1995 the index was 30 per cent, the previous year being 10 per cent. The government, on the other hand, is constrained by the level of subsidy, which, in view of the fixed level of student interest, is a function of T Bill rates. The current high rates of inflation have a serious impact on the effectiveness and sustainability of the loans scheme. Government has therefore capped future loan increases at 600,000 cedis per student. A more satisfactory student interest rate would reduce government liabilities and enable the loan to be increased.
In addition to loans, which do not provide direct finance to the universities, but are a substitute for student maintenance grants, there are attempts to introduce direct fees for higher education, and some of these are in place, though the amounts are not significant. They include application and registration fees, and 'academic facility fees'. Polytechnics charge fees to part-time students which do represent significant income. In general, secondary education is still more expensive to students than university education.
There are clearly serious questions to be asked about the sustainability of the scheme in spite of the professionalism of its management. The amounts are low and arguably not very significant when compared with the required resources: falling repayment rates must be a real possibility and indeed defaults in due course, and the interest rate burden on government is probably excessive. As the pressure to expand post secondary education increases the loans scheme will face difficult problems.
Willingness to Pay
My survey had questions about willingness to pay in questionnaires for school administrators, school teachers, students and parents. The responses to this type of question are notoriously difficult to interpret, and of course need to be considered carefully. The responses were fairly consistent. School administrators, parents and students gave broadly similar responses to the question on how much more fees could be raised, as shown in Table 22 (teachers appeared to be unwilling to be specific about a figure).
75 per cent of the form teachers questioned (not shown in table) did not think their pupils would be able or willing to pay more fees. About one third of school administrators felt that pupils could pay more than an additional 3,000 cedis, but at the same time they felt that between 40 and 60 per cent might drop out if fees were raised. About 40 per cent of the parents expressed a willingness to pay higher fees, though less than 20 per cent would exceed 3,000 cedis extra, but they would need to see improvements in facilities, teaching, and their children's performance. However, 22 per cent of parents said that under no circumstances would they be willing to pay more fees. Parents in general might be expected to be more reluctant to express a willingness to pay more, but the overall impact of the table is that raising school charges would meet with hostility in the absence of tangible reasons why they should be raised.
Table 22: Extent to which fees can be raised, Ghana
Extent to which fees can be raised Students Parents School Management
No more 39% 30% 33%
up to 3,000 cedis more 15% 21% 33%

up to 5,000 cedis more 18% 8% 11%
more than 5,000 cedis more 27% 9% 22%
Don't know/no opinion 1% 32% 1%
The parental questionnaire had an open-ended question which asked parents what they would do were they the minister for education. The responses were striking in one respect: there was an evident sympathy for the problems of teachers. The belief that education is important for every child is also evident in the responses to this and other questions (the interviewers were encouraged to record opinion on the questionnaires), and there was a widely expressed opinion that costs were a problem for other families if not the respondent him or herself. As another indicator of the attitude towards paying for education, 63 per cent of the parents interviewed did not consider more private schools to be desirable.
The teachers were asked for their opinions on why children in the area were not enrolled at their school, and to rank their answers in order of significance. There were four main reasons which accounted for three quarters of the responses. They were
a) financial reasonsb) wrong type of schoolc) not good enough marks in examsd) poor physical facilities.
The second category covered many disparate reasons, of which the most significant were that parents preferred boarding schools and local children cannot board; religion; ethnic reasons; and a preference for 'old' rather than 'new' schools. The first reason was the dominant response.
When teachers were asked for their explanation for their pupils' absenteeism, the main reason given was a combination of 'lack of interest in schooling' and fees. There did not seem to be a significant relation between absenteeism and the agricultural calendar. 70 per cent of the teachers reported that students from their form had been sent home for non-payment of fees, one quarter of them reporting over 10 students (from classes of about 30). The average length of time before students were allowed back was two weeks. The parents' survey shows 17 per cent of parents stating that their children had been sent home for non-payment, with the students' sample giving a slightly higher figure of 20 per cent. Over half the school administrators said that students were sent home for non-payment, in one case up to 400 students, but in general between 20 and 70. One third of the students said that it was very difficult to raise the money for fees, with another third saying it was difficult: the rest reported no problem. Half of the students reported paying fees late on occasion, and one fifth were always late. The school administrators reported that about 80 per cent of students regularly did not pay their fees by the end of the first term.
Families in most of Ghana set great store by education, particularly in urban and town areas.108 When pupils are asked under what circumstances their parents and sponsors would be willing to pay more, they invariably reply 'if I do well'. From this it might be deduced that investments in improving quality would result in a greater volume of private contributions. However, there may also be a mismatch between perceptions of quality and the reality. When asked if and why they liked their child's school, a large number of parents replied 'because he/she is doing well'. The survey collected school examination results, and in many cases the same school where children were believed by their parents to be 'doing well' reported near total failures in examination results. Indeed, even teachers, who might be expected to know the examination results, appeared to have a positive attitude towards school performance which is belied by the results. In Ghana examination results are not published, and parents therefore have an imperfect source of information on school performance, at least those aspects of performance measured by examination success, though in the survey teachers reported in some cases that parents chose schools for their children which had better academic reputations, and which also provided extra tuition. Only 20 per cent of the sample said they had never visited the school, and a third said they visited teachers often. A little over half of the teachers rated their own schools as average.
[108 For one account, see Peil M, Ghanaian Education as Seen from an Accra Suburb, International Journal of Educational Development, Vol. 15 Nr 3, 1995, pp 289-305.]
G. Conclusions
How have government and households reacted to cost sharing? The functional relationship between government expenditure and cost sharing is largely a question of the relative levels of expenditure that occur/would have occurred with and without cost sharing; while the relationship between household behaviour and cost sharing is critically a matter of the effect on enrolment trends. We may now consider the six questions with which we started this paper in the context of education financing in Ghana:

a) Has cost sharing increased total resources available for education?
b) Has cost sharing enhanced efficiency of resource use?
c) Has cost sharing affected enrolments?
d) Has cost sharing improved quality of education?
e) What other effects have resulted from cost sharing in education?
f) Is a policy of cost sharing justified?
Has cost sharing increased total resources available for education?
Real education expenditures have been stagnant in recent years, and expenditures per pupil at the basic and tertiary levels appear to have been falling. There is a lack of evidence on how far household expenditures have increased over the period to compensate. Schools depend on non tax revenues for nearly all non salary costs, and at this level there is little doubt that cost sharing is important. Had there been no textbook fund it is possible but not certain that there would be fewer textbooks in the system: and as far as primary education is concerned the pupil textbook ratios are very low indeed, in most parts of the country less than one.
However, cost sharing may have also enabled government to squeeze education expenditures, which, together with declining efficiency expenditures, could also mean that cost sharing has contributed to a lower level of expenditure than might otherwise have been. The availability of funds from the textbook fund meant that government did not need to budget for JSS and SSS books. There might have been more pressure on the government to allocate teachers better in order to release funds for non-salary learning inputs. Put in another way, the existence of the textbook funds may permit allocative and technical inefficiency of resource allocation to continue. Had government raised the aggregate PTR by 0.5 of a pupil sufficient resources would have been released to dispense with the textbook fund (or to be used for other purposes).
While cost sharing may have resulted in increased resources per pupil, or a slower decline than would otherwise have occurred, it has also involved the establishment of a potentially regressive tax. Cost sharing has been in partial response to the fiscal gap, and in that sense has not resulted in augmented resources except in so far as total expenditures would be lower ceteris paribus without cost sharing.
Has cost sharing enhanced efficiency of resource use?
The efficiency of the education system in Ghana is low, with a high proportion of expenditure on salaries and little on learning inputs. More resources would be available to purchase learning inputs which are at present financed by direct contributions if the system were more efficient, and there is plenty of scope for that to happen. Parents are therefore subsidising inefficiency.
There is no evidence of reallocations from higher levels of education to lower levels - rather the reverse: in terms of average expenditures there has been a trend in favour of secondary schools, but the reasons underlying that trend are connected with attempts to make secondary education more widely available, as well as the effects of the reform of the structure. There is little space to reallocate from higher education, which receives a relatively modest share of the budget and which is politically significant enough to make politicians wary of pushing to hard for more cost sharing, even were that the right thing to do, which is not self evident.
Indeed, there is considerable pressure to increase the share of higher education in the budget, partly on the grounds that basic education receives more foreign aid. There have been no equity effects through allocative adjustments, and, on the basis of the available evidence, cost sharing at post primary levels has not resulted in allocative changes within the budget in favour of primary education, which is one of the main justifications for the policy. Instead, cost sharing at post basic levels is accompanied by increased shares of the government budget for those levels.
At the tertiary level, there are considerable costs attached to the loan scheme, which increase the government's liabilities substantially. These costs, coupled with the low ceiling required by the insurance system, mean that it is unlikely that the level of loan can be increased to any significant amount, and it is not clear just how much social benefit is derived from the scheme. In any case, the university sector is inefficient (in terms of staffing ratios, for example) and student loans should not be the first choice for increasing discretionary resources. Indeed, it is possible that the whole scheme will slowly disintegrate as it becomes less and less relevant to the overall problem of higher

education funding.
Has cost sharing affected enrolments?
The data suggest that enrolment ratios have been stagnant or falling, and that cost is a factor. Furthermore there is evidence to suggest that attendance ratios are affected by the textbook fee, although this has now been abolished for basic education. Although the GLSS data showed a rise in apparent and net enrolment ratios between 1988 and 1992, the growth in secondary school enrolment ratios of the poor was slight, and the gap between the richer and the poorer groups' ratios rose over the period. There are no comparable data after 1992 so it is not possible to judge trends over the last four years, except on the basis of extrapolated population data and census enrolment figures.
The removal of boarding subsidies for secondary schools (except for Northern students) resulted in a sharp decline in the number of boarding students and was a contributor to the decline in secondary enrolment. One reason for the failure of many students to enrol in secondary school is the absence of boarding facilities, as well as cost. How far the constraints on secondary enrolment affect primary enrolments is difficult to determine, but some respondents to the survey said that the lack of employment and the high cost of secondary education were factors in their decisions not to continue in basic education. There is no doubt that the absence of affordable accommodation is a key factor in low secondary enrolments and inefficiency of resource allocation at the secondary level.
The question is whether enrolments would have been higher had the direct and indirect costs of education been lower. At the basic education level the indirect costs are dominant, and could only be reduced by abolishing school uniforms, providing school meals and other measures. Similar measures would be required at the secondary level, plus direct funding for non-salary items. At both levels a much higher level of infrastructural spending would be required.
In that Ghana has embarked on a policy of free compulsory and universal basic education (primary + JSS), the definition of 'free' is important, partly because of the morality of compulsion when considerable costs are involved, and partly because nothing is 'free'. In the first instance it means that all direct charges are abolished. Quasi-compulsory charges also need to be reviewed, as well as community responsibility for building.109 Such policies would only make sense in the context of a fundamental review of the determinants of the costs of education inputs. This would involve simplification of the curriculum, a reform of teacher training, control over the establishment, and other measures.
[109 The situation is further complicated by District Assemblies' revenue raising rights, and in Ghana the perception is that the 'F' of 'FCUBE' (Free Compulsory Universal Basic Education) has got smaller (it is often printed as 'fCUBE').]
It is reasonable to hypothesise that were direct and indirect costs to parents and their children to be reduced, enrolments would rise, and it remains to be seen whether the abolition of fees has an effect on basic enrolments. However, if an increase in the number of students were not accompanied by scale economies in the provision of inputs (particularly rising pupil-teacher ratios) there would be a strain on the budget. There is also more room over the medium term in the Ghanaian budget to expand expenditure on the education sector than is commonly supposed: the high proportion of education expenditure in discretionary expenditure is more a reflection of the size of the non-discretionary budget than an indication that too much is allocated to education.
Cost sharing has not resulted in increased enrolments via increased resources, and there have been no equity effects. It is more likely to have contributed directly to a reduction in enrolments at all levels, except for tertiary institutions where demand is strong.
Has cost sharing improved quality of education?
Cost sharing policies have had little impact on quality. Nevertheless, the text book revolving fund as well as the near total reliance of the JSS and SSS systems on parental contributions for non-salary costs imply that without cost sharing policies the quality of education provision could have been worse, assuming all other things to be equal. The ceteris paribus assumption is not, however, entirely appropriate, because by presuming on an apparent willingness and capacity to pay in the short run government has succeeded in delaying efficiency improvements in publicly financed provision. In any case, examination results have not been improving, and other evidence suggests a stagnation in school performance.
What other effects have resulted from cost sharing in education?
This question is not examined in detail. Education cost-benefit calculus proposes that investment in education has relatively high returns compared to other investments.110 There is no analysis of the alternative investment choices open to the people who pay school costs, so it is not possible to justify the choice of schooling as the best investment. Would the rate of (non-human) capital accumulation in rural areas

increase with lower schooling costs? Would parents of secondary school pupils increase their savings rates? Would the health of the population improve if more private resources were moved to health care?
[110 Curiously, the Ghanaian rates of return show little difference between social and private returns to secondary education, and much higher private than social returns to primary education. This is in spite of loading the cost equation with private costs. At the very least the data would suggest to those who regard them as useful policy indicators that government should invest more in secondary education. They are presented in Annex 3-3 of the Staff Appraisal Report for the World Bank's Basic Education Improvement Programme (May 1996). The author of the annex does not consider Glewwe's paper on GLSS1 data where, like Knight and Sabot in East Africa, the meaning of the returns to low quality education is questioned.]
Among the poor the alternative use of resources is probably limited. The parents surveyed were asked what they would give up in order to pay more for education. About half could not answer or would/could give up nothing. About a fifth of the sample would give up luxury items, though the main component of such items was alcoholic drink. 10 per cent said they would have to work longer hours. There seems to be little slack in household budgets.
Is a policy of cost sharing justified?
In Ghana households provide significant support for the education system, particularly at the post-primary and pre-tertiary levels. How far their support has enabled the education system to expand more than it would have in the absence of such support is not easy to judge.
However, if the reason for raising private costs is that efficiency and equity are improved by user charges, there is some reason to be sceptical that this has actually transpired in Ghana. Cost sharing is a response to fiscal pressure, and the policy may not be justified, particularly in view of the large non-discretionary part of the budget. Not only would there be room for more public expenditure on education with better macroeconomic management, but also the poor management of the education system has involved costs to government and therefore to households which are higher than they need be. In this sense cost sharing may enhance and perpetuate inefficiency and excessive costs.
In summary, few of the objectives of cost sharing policies seem to have been achieved in Ghana. Enrolments have declined, school quality has deteriorated, and expenditure reallocations have not been made in favour of primary education. Private schools have made a modest contribution to enrolment growth, and there may be scope for further private school enrolments, although they would not go a long way towards tackling the low enrolment problems or to releasing state resources for public schools: indeed they would take the better pupils out of state schools (the data on private schools in Ghana are not good, and there is more analysis of private schooling in the next chapter in the context of Tanzania). The school textbook fund assists in secondary school book availability, while the university loans scheme is a well run example of its kind, but they both have had relatively little impact.
In many respects Ghana has not laid great emphasis on cost recovery except in the specified areas of student loans and textbooks, but at the same time the dependence of schools on non government funds is great. As a result schools are under provided and in poor physical shape. There would be little justification for further emphasis on cost sharing until some of the major systemic issues are resolved.
[Previous Page] [Top of Page] [Next Page]
Cost Sharing in Education - Public Finance, School and Household Perspectives - Education Research Paper No. 27, 1998, 141 p.
[Previous Page] [Table of Contents] [Next Page]
IV Case Studies in Cost Sharing: Tanzania
A. Introduction B. Structure of the Education System C. The Economy, Public Finance and the Education Sector D. Trends in Recurrent Education Expenditures in Tanzania E. Distribution of the Benefits from Public Expenditure F. Household Expenditures and Cost Sharing in Education G. Conclusions
A. Introduction
The case of Tanzania provides a good contrast with that of Ghana, although both countries are dependent on foreign aid: aid dependency in Tanzania may even be stronger than in Ghana.111 An important difference between the countries is their size: the population of Tanzania is about 28 million compared with Ghana's 16 million, and Tanzania is four times larger than Ghana. The provision of education services is strongly affected by factors such as population density and communications distances. There are also important differences between anglophone West Africa and East Africa in their historical experiences.
[111 See Doriye J. & M. Wuyts, Aid, Adjustment and Sustainable Recovery, Institute of Social Studies, The Hague, March 1992, for a powerful analysis of Tanzania's aid dependency and the ineffectiveness of aid. Also Agrawal N. & al, Structural Adjustment, Economic Performance, and Aid Dependency in Tanzania, Policy Research Working Paper WPS 1204, World Bank, October 1993: this paper suggests that adjustment had been successful in Tanzania but accepts that the effectiveness of aid had been very low in spite of its large volume.]
Another common feature is the influence (or attempted influence) of lenders and donors on education policy. To some, Tanzania is seen as a political economy laboratory, and over the recent years the fervency of donors and lenders in promoting (on paper at least) a privatised education system matches the same fervency of 15 years previously in support of a somewhat different type of system. In many

respects the experimentation of the World Bank and the donors who support the Bank's approaches is a classic example of the neo-liberal package described by Colclough.112
[112 Colclough C. & J. Manor, States or Markets? Neo-liberalism and the Development Policy Debate, Clarendon Press, 1991, pp 197-213.]
In both countries lenders and donors have made strong efforts to drive policy, though to my knowledge there are no recent examples in Ghana of Bank authorship of government documents as was the case for the Tanzanian social sector policy. Ghana, however, implemented in the 1980s many of the measures that have thus far eluded Tanzania: for example, a student loans scheme, a textbook fund, and elimination of government expenditures on boarding costs and school food. The effect of those measures has not been fully evaluated, but may not have had the intended results, and it may in the longer run be to Tanzania's benefit that many of the BWI policies have been resisted in spite of the heavy Bretton Woods pressures.
The main difference between the countries in the context of cost sharing is the rapid rise of private secondary schools in Tanzania as a result of liberalisation policies and a history of minimal access to secondary education. Private schooling is the most expensive form of cost sharing for individuals, and it properly forms a significant part of analysis in a study such as this one when it becomes a major plank in government policy. In Tanzania, as elsewhere, the World Bank has vigorously advocated the expansion of private secondary schools as well as fee increases in government schools on the basis of very little evidence and a good deal of dogma, and has also constructed arguments for cost reductions in the state system on the basis of its perceptions of private school performance.113 The Bretton Woods emphasis on cost cutting and public expenditure reductions had a cruel effect on education expenditures and Tanzania is one of the lowest spenders on education, expressed as a percentage of GDP.
[113 For a similar criticism related to the health sector, see Mills A, Improving the Efficiency of Public Sector Health Services in Developing Countries: Bureaucratic vs Market Approaches, Health Policy Unit, London School of Hygiene and Tropical Medicine, p 7: 'In the two, recent reviews of developing country health policies (World Bank 1993), it is remarkable how many reforms are proposed, but how little detailed evidence can be put forward on the impact of past reforms in terms of quantitative measures of efficiency or equity.']
This case study is based on work undertaken in Tanzania between 1992 and 1996, including a specially prepared survey which took place in August 1994.114 Other sources of information on households and schooling are taken from two large scale surveys, one in 1991 by Cornell University and the Economic Research Bureau (ERB) of the University of Dar es Salaam and one by the World Bank in 1993/94.
[114 The survey work for this chapter was undertaken with the assistance of TADREG,

and researchers included Brian Cooksey, Stella Bendera, Abel Ishumi, P. Lipembe, George Malekela, Emmanuel Nkumbi, Alice Rugumyamheto, Joseph Rugumyamheto, Fred Sichyiza, John Sivalon, and Fidelis Wamara who entered the raw data. I was also assisted by E. E. Moshi, who sadly died before the work was completed: he was a fine man and a great Tanzanian educator. Lucy Stevens and Samer Al-Samarrai assisted with data analysis.]
B. Structure of the Education System
Structure and Curriculum
Tanzania, unlike Ghana, has not changed its education structure over recent years to expand the basic education cycle. Apart from pre-school education, which is not publicly provided, though there is a policy to do so115, there are 7 years of primary education (up to Standard 7, when there is an examination), followed by four years to Ordinary Level (O Level, Form 4). Those who are permitted to proceed beyond O level take a 2 year Advanced Level (A Level, Form 6) course, followed by university.
[115 Tanzania Education and Training Policy, MOE, March 1995, p 10.]
As with Ghana, there has been some concern about the size of the curriculum. The primary curriculum was to have been reduced from 13 to 7 subjects, but the reform was postponed. However, unlike Kenya, not all subjects are examined, and the Standard 7 examination covers only Maths, English and a General paper. Three quarters of the teachers in my survey agreed that secondary curriculum reform was needed.
Enrolments and Staffing
Until the liberalisation and economic reform programmes education policy emphasised primary education, and entry to post-primary education was restricted. Table 23 shows the trends.
The table shows that apparent enrolment ratios were rising slowly for primary education although the enrolment of children of school age only was constant. While primary enrolments rose by 18 per cent between 1989 and 1995, secondary enrolments rose by 48 per cent, with over half accounted for by private schools. The proportion of private enrolments fell for the last three years or so of the period as enrolments grew in the state schools.
Table 23: Enrolments in Tanzanian Primary and Secondary Education
1990/1 1991/2 1992/3 1993/4 1994/5 1995/6 1996/7

Primary Enrolments (1)(3)
3,379,000 3,507,394 3,599,580 3,732,493 3,793,201 3,872,473 3,942,888
Apparent Enrolment Ratio (2)(3)
73.5 74.4 74.2 74.9 77.9 77.6
Net Enrolment Ratio (2)(3)
54.2 53.8 54.2 53.7 55.2 55.4
Primary Teachers (1)(3)
96,850 98,714 101,306 101,816 103,900 105,280 110,200
PTR 34.9 35.5 35.5 36.7 36.5 36.8 35.8
Secondary Enrolments (1)(2)(3)
145,242 166,812 175,776 180,899 186,246 196,375 199,093
of which private (per cent)
57.4 55.7 55.2 58.2 55.2 53.1
Secondary Teachers (2)(1)(3)
6,930 8,649 8,926 9,568 10,928 11,158 10,908
Apparent Enrolment Ratio
5.1
PTR 21.0 19.3 19.7 18.9 17.0 17.6 18.2
Notes and Sources: From MOE statistics. (1) Basic Education Statistics in Tanzania (BEST): Regional, 1994, MOE March 1996. (2) BEST 1989-1993, MOE June 1994. Most Tanzanian education statistics differ between sources. The population base for the AER is extrapolated from the 1988 census. (3) Basic Education Statistics in Tanzania (BEST), 1995, & 1996, MOE 1996 & 1997
As with Ghana, survey data provide alternative enrolment ratios, and reveal enrolment ratios higher than those given in the normal education statistics which use school registrations and population extrapolations. These are shown in Table 24. The data show that girls' enrolments are relatively high at most income levels, at both primary and secondary school. Secondary enrolment ratios are very low indeed: the high proportion of private enrolments is placed into context, because while it is to be expected that a section of the population will have sufficient income to purchase secondary education, it is highly unlikely that a figure of 50 per cent would be maintained as enrolments rise. A further notable conclusion from the table it is evident difficulty faced by urban children in gaining access to primary education, particularly in Dar es Salaam.
Table 24: Primary and Secondary Enrolment Ratios: Tanzania 1993
Lowest Quintile
2nd Quintile 3rd Quintile 4th Quintile Top Quintile Average

Male Female Male Female Male Female Male Female Male Female Male Female
Apparent Enrolment Ratios
Primary School
Dar es Salaam
n/a n/a 64 60 79 66 78 80 74 72 75 73
Other Urban
79 94 88 91 90 103 92 86 88 92 89 93
Rural 77 74 75 73 76 96 82 75 90 87 79 80
All Tanzania
77 76 77 76 79 97 85 79 87 86 81 82
Secondary School
Dar es Salaam
n/a n/a n/a 16 10 3 14 21 23 21 18 19
Other Urban
1 2 8 13 6 10 17 22 31 28 15 17
Rural 3 2 6 3 14 5 12 6 15 7 8 4
All Tanzania
3 2 7 5 11 6 14 12 23 17 11 8
Net Enrolment Ratios
Primary School
Dar es Salaam
n/a n/a 53 41 47 46 49 63 51 53 50 54
Other Urban
54 60 57 70 59 68 62 68 69 68 62 8
Rural 50 52 52 53 53 62 51 54 66 65 53 56
All Tanzania
50 53 53 56 54 63 54 59 65 65 55 59
Secondary School
Dar es Salaam
n/a n/a n/a 16 7 0 9 19 18 19 13 17
Other Urban
1 2 8 12 5 6 11 16 22 24 11 14
Rural 2 2 3 3 9 4 9 6 7 5 5 3
All Tanzania
2 2 4 5 8 4 9 10 15 14 7 7

Notes and Sources: From Social Sector Household Survey. Note that the sample sizes for secondary students were low, to the point of insignificance in some cases, and margin of error in others.
Like Ghana, the distribution of the PTR in Tanzania between regions varies considerably, as does the number of pupils per stream. The average number of primary teachers per stream (class), however, is usually close to 1, with some exceptions, and the national average is 1. The primary PTRs are also considerably higher than Ghana, while the apparent primary enrolment ratio is similar, implying there will be considerable difficulty in raising the PTR without raising enrolments. Where there is a significant mismatch between the two ratios there exists an excess or deficit of teachers against the norms of one teacher per stream.
It can be seen in Table 25 that the variation around the average is mainly the result of higher levels of staffing per stream in the urban areas and in some cases a higher density of enrolment, resulting in larger average stream sizes. While class and school sizes are larger in urban centres, the PTR is smaller, reflecting underutilised teachers. The PTR exceeds class sizes: to have lower class sizes would require an even greater imbalance between the PTR and stream size (increases in the aggregate pupil teacher ratio do not necessarily achieve larger classes; neither is the opposite automatically true). The efficient disposition of teachers is a critical issue in considering cost sharing, because where the disposition is not efficient parents are made to pay more than they otherwise would.
Table 25: Primary Enrolments and Teachers by Region: Tanzania 1994
Region Enrolments Teachers PTR Streams Teachers/Stream Pupils/Stream
Arusha 234,518 5,557 42.2 6,039 0.9 38.8
DSM 231,437 5,575 41.5 5,304 1.1 43.6
Dodoma 184,671 5,486 33.7 4,874 1.1 37.9
Iringa 232,985 5,992 38.9 6,987 0.9 33.3
Kagera 201,363 6,092 33.1 5,259 1.2 38.3
Kigoma 134,932 3,784 35.7 3,620 1.0 37.3
Kilimanjaro 242,493 8,022 30.2 6,700 1.2 36.2
Lindi 85,001 2,782 30.6 2,722 1.0 31.2
Mara 193,559 5,302 36.5 5,591 0.9 34.6
Mbeya 274,229 7,805 35.1 7,932 1.0 34.6
Morogoro 196,735 5,614 35.0 5,543 1.0 35.5
Mtwara 129,996 4,004 32.5 4,346 0.9 29.9
Mwanza 312,340 7,458 41.9 8,161 0.9 38.3
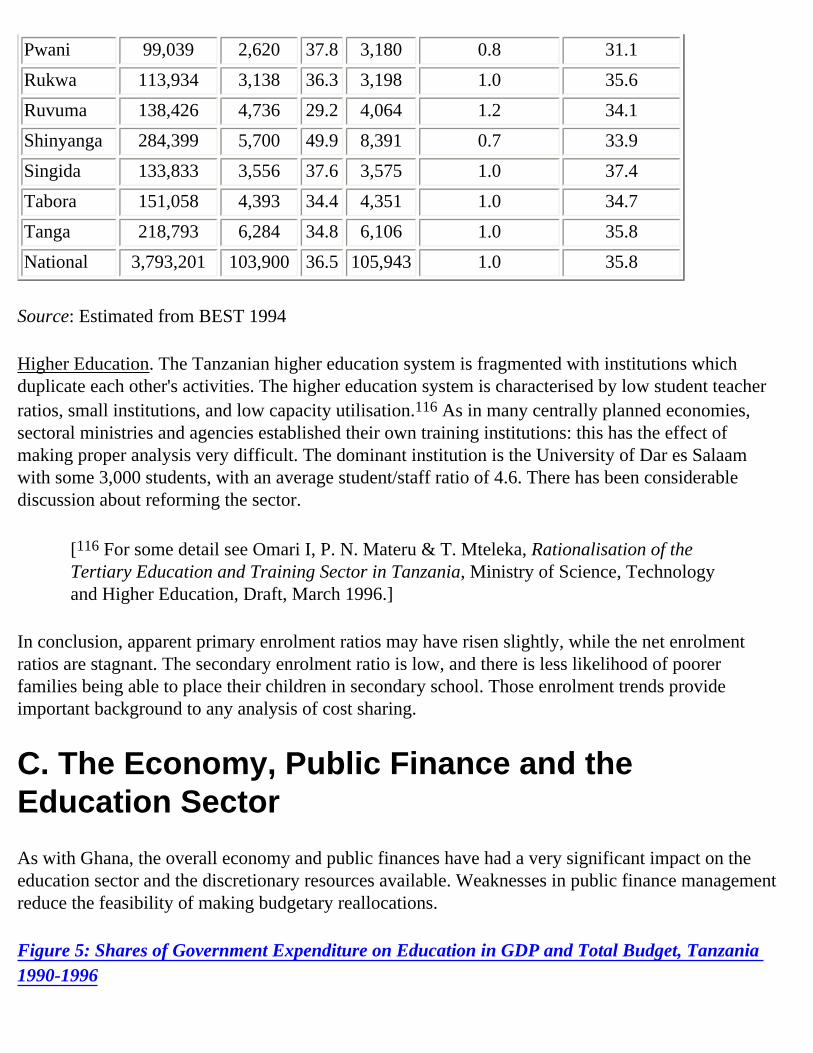
Pwani 99,039 2,620 37.8 3,180 0.8 31.1
Rukwa 113,934 3,138 36.3 3,198 1.0 35.6
Ruvuma 138,426 4,736 29.2 4,064 1.2 34.1
Shinyanga 284,399 5,700 49.9 8,391 0.7 33.9
Singida 133,833 3,556 37.6 3,575 1.0 37.4
Tabora 151,058 4,393 34.4 4,351 1.0 34.7
Tanga 218,793 6,284 34.8 6,106 1.0 35.8
National 3,793,201 103,900 36.5 105,943 1.0 35.8
Source: Estimated from BEST 1994
Higher Education. The Tanzanian higher education system is fragmented with institutions which duplicate each other's activities. The higher education system is characterised by low student teacher ratios, small institutions, and low capacity utilisation.116 As in many centrally planned economies, sectoral ministries and agencies established their own training institutions: this has the effect of making proper analysis very difficult. The dominant institution is the University of Dar es Salaam with some 3,000 students, with an average student/staff ratio of 4.6. There has been considerable discussion about reforming the sector.
[116 For some detail see Omari I, P. N. Materu & T. Mteleka, Rationalisation of the Tertiary Education and Training Sector in Tanzania, Ministry of Science, Technology and Higher Education, Draft, March 1996.]
In conclusion, apparent primary enrolment ratios may have risen slightly, while the net enrolment ratios are stagnant. The secondary enrolment ratio is low, and there is less likelihood of poorer families being able to place their children in secondary school. Those enrolment trends provide important background to any analysis of cost sharing.
C. The Economy, Public Finance and the Education Sector
As with Ghana, the overall economy and public finances have had a very significant impact on the education sector and the discretionary resources available. Weaknesses in public finance management reduce the feasibility of making budgetary reallocations.
Figure 5: Shares of Government Expenditure on Education in GDP and Total Budget, Tanzania 1990-1996

Notes and Sources: As previous tables.
National Income and Public Expenditures
Figure 5 depicts the trends over recent years. The left hand axis of the Figure 5 measures public expenditures and the right hand axis measures national output. The four lines plot trends in GDP, total government expenditure, discretionary government expenditure (after items such as pensions and debt payment are subtracted), and education sectoral expenditure. The shaded area in the chart illustrates the gap between total government expenditure and total government discretionary expenditures.
The chart shows that there have been fluctuations in the level of non-discretionary expenditures, but some of these fluctuations may be accounted for by poor data, and some by deferral of debt payments: it can be seen that the budgeted 1996 amount is returning to the more normal level of about one third of the budget. In other words, one third of all government recurrent expenditure is not allocated to expenditures on services and other items, but to debt payment.
Table 26: Shares of Government Expenditure on Education in GDP and Total Budget, Tanzania 1990-1996 (Actual and estimated expenditures in million shillings at current and constant 1994 prices)
Current Prices 1990/91 1991/92 1992/93 1993/94 1994/95 1995/96
GDP 935,074 1,130,596 1,267,432 1,635,470 2,284,600 2,998,272
Total Government Recurrent Expenditure
161,224 199,670 250,942 263,226 386,573 470,014
Government Exp/GDP 17.2% 17.7% 19.8% 16.1% 16.9% 15.7%
CFS (1) 49,817 59,165 68,166 33,826 109,376 160,690
CFS % recurrent expenditure 30.9% 29.6% 27.2% 12.9% 28.3% 34.2%
Discretionary Recurrent Expenditure(2)
111,407 140,505 182,776 229,400 277,197 328,805
%GDP 11.9% 12.4% 14.4% 14.0% 12.1% 11.0%
% Total 69.1% 70.4% 72.8% 87.1% 71.7% 70.0%
Education Recurrent (see notes) 21,880 27,587 33,055 46,782 78,351 78,587
as % GDP 2.3% 2.4% 2.6% 2.9% 3.4% 2.6%
as % discretionary recurrent exp 19.6% 19.6% 18.1% 20.4% 28.3% 23.9%
as % total recurrent exp 13.6% 13.8% 13.2% 17.8% 20.3% 16.7%
1994 Constant Prices
GDP 1,753,264 1,729,093 1,602,451 1,635,470 1,746,280 1,823,471

Total Government Recurrent Expenditure
416,004 422,115 429,610 352,708 386,573 373,905
Discretionary Recurrent Expenditure (2)
287,462 297,037 312,911 307,383 277,197 261,570
Education Recurrent 56,457 58,321 56,590 62,685 78,351 62,517
Memo item: deflator (3) 100 123 148 188 245 308
Notes and Sources: From 1996 Public Expenditure Review (draft), which was undertaken by World Bank staff and consultants. I have chosen to use the draft 1996 PER data to provide an up-to-date a picture as possible, and to make the figures in the table consistent with each other. However, the data are very misleading, in that the 'actual expenditure' figures are drawn from the Estimates Books and not the appropriation accounts. The 1993 and 1995 data are particularly suspect. Education expenditure in 1993 was actually TSh 40 million. The 1995 data may contain expected counterpart funds which were neither transferred to the Treasury nor spent, but for some reason remained in the accounts. (1) CFS = Consolidated Fund Service, which is mainly made up of debt costs. (2) Total recurrent less CFS. (3) Deflator from IMF tables.
The data, explained in the notes to Table 26, are also not reliable: they are drawn from the 1996 PER undertaken by World Bank staff. Nevertheless, apart from the 1994/95 estimated expenditures which are plainly wrong, it does appear that Tanzania has been under spending on education, with total recurrent expenditures hovering at about 2.5 per cent of GDP, and 20 per cent of the discretionary budget, which is itself under 20 per cent of GDP. As in the case of Ghana, it must be concluded that there is a strong case for increased education expenditures.117
[117 Cf the World Bank's Social Sector Review, para 36 (in the draft): '...spending is already high for such a poor country' (a curious sentiment when it is intended as a justification for higher household contributions!).]
D. Trends in Recurrent Education Expenditures in Tanzania
Total Expenditure Trends
Table 27 sets out recent trends of public expenditure on education in Tanzania by sub-sector, in both current prices and constant prices (1994 equivalent shillings). The trends are shown graphically in Figure 6. There appears to have been a steady increase in total primary expenditure in real terms over the period, while secondary expenditures, having risen, are on a falling trend.
Table 27: Trends in Government Education Expenditures, Tanzania 1990-1996 (Actual

expenditures in '000,000 shillings at constant 1994 prices)
Current prices 1990/91 1990/91 1991/92 1992/93 1994/93 1994/95
Primary 10,284 13,104 16,693 23,859 49,174 51,602
Secondary 4,376 4,828 4,793 6,783 7,533 6,608
Teacher Education 1,750 1,931 1,653 2,105 2,013 1,458
Higher & Technical 3,282 5,242 6,611 9,824 15,922 16,836
Other 2,188 2,483 3,306 4,210 4,524 2,596
Total 21,880 27,587 33,055 46,782 79,166 79,100
Constant 1994 prices
Primary 19,283 20,041 21,105 23,859 37,587 31,383
Secondary 8,205 7,383 6,060 6,783 5,758 4,019
Teacher Education 3,282 2,953 2,090 2,105 1,539 887
Higher & Technical 6,154 8,016 8,358 9,824 12,170 10,239
Other 4,103 3,797 4,179 4,210 3,458 1,579
Total 41,026 42,191 41,793 46,782 60,512 48,107
Notes and Sources: Ministry of Finance. Higher education does not include interest rate subsidies for the student loans scheme. The data are not consistent with the PER.
Figure 6: Trends in Government Education Expenditures, Tanzania 1990-1996 (Actual expenditures in '000,000 shillings at constant 1994 prices)
On the other hand, higher and technical education expenditures rose as the post secondary sector faced the need for rationalisation. In real terms total expenditures on education rose by about 20 per cent between 1989/90 and 1993/94. They appear to have risen by a further third in 1994/95, but those data require further investigation, particularly in view of the 1995/96 expenditure. The total real increase over the six years of the period was under 10 per cent.
Taking into account the enrolment trends, crude average expenditures for primary and secondary education can be derived. These are shown in Table 28 and shown in Figure 7.
Table 28: Average Expenditures per Student, Tanzania Tanzanian Shillings
1990/91 1991/92 1992/93 1993/94 1994/95 1995/96
Current Prices
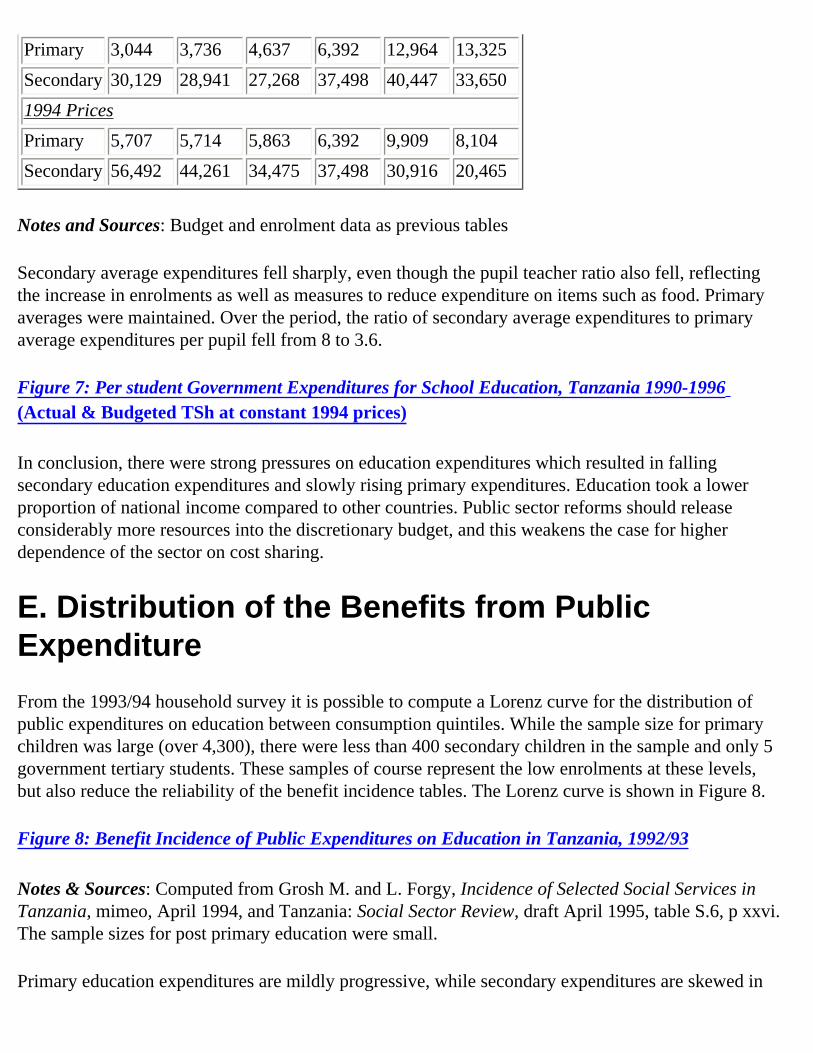
Primary 3,044 3,736 4,637 6,392 12,964 13,325
Secondary 30,129 28,941 27,268 37,498 40,447 33,650
1994 Prices
Primary 5,707 5,714 5,863 6,392 9,909 8,104
Secondary 56,492 44,261 34,475 37,498 30,916 20,465
Notes and Sources: Budget and enrolment data as previous tables
Secondary average expenditures fell sharply, even though the pupil teacher ratio also fell, reflecting the increase in enrolments as well as measures to reduce expenditure on items such as food. Primary averages were maintained. Over the period, the ratio of secondary average expenditures to primary average expenditures per pupil fell from 8 to 3.6.
Figure 7: Per student Government Expenditures for School Education, Tanzania 1990-1996 (Actual & Budgeted TSh at constant 1994 prices)
In conclusion, there were strong pressures on education expenditures which resulted in falling secondary education expenditures and slowly rising primary expenditures. Education took a lower proportion of national income compared to other countries. Public sector reforms should release considerably more resources into the discretionary budget, and this weakens the case for higher dependence of the sector on cost sharing.
E. Distribution of the Benefits from Public Expenditure
From the 1993/94 household survey it is possible to compute a Lorenz curve for the distribution of public expenditures on education between consumption quintiles. While the sample size for primary children was large (over 4,300), there were less than 400 secondary children in the sample and only 5 government tertiary students. These samples of course represent the low enrolments at these levels, but also reduce the reliability of the benefit incidence tables. The Lorenz curve is shown in Figure 8.
Figure 8: Benefit Incidence of Public Expenditures on Education in Tanzania, 1992/93
Notes & Sources: Computed from Grosh M. and L. Forgy, Incidence of Selected Social Services in Tanzania, mimeo, April 1994, and Tanzania: Social Sector Review, draft April 1995, table S.6, p xxvi. The sample sizes for post primary education were small.
Primary education expenditures are mildly progressive, while secondary expenditures are skewed in

favour of the higher income groups. University education is shown to be entirely benefiting the higher income group, but this may reflect the sample size. Compared with Ghana, the distribution of the benefits of public expenditure on education in Tanzania seems to be less progressive. While the history of the country would suggest that the incidence of primary education expenditures was progressive, the fall in enrolments which occurred during the 1980s and the failure of poorer people to go to school, particularly in urban areas, must be influencing the pattern. In many respects the incidence of secondary education benefits is to be expected, and, indeed, given the absolute low enrolments, it indicates that the distribution of secondary opportunities is not unacceptably regressive. How far this has changed over recent years is unknown, and the effect on the poor of phasing out catering subsidies remains to be seen.
[Previous Page] [Top of Page] [Next Page]

Cost Sharing in Education - Public Finance, School and Household Perspectives - Education Research Paper No. 27, 1998, 141 p.
[Previous Page] [Table of Contents] [Next Page]
F. Household Expenditures and Cost Sharing in Education
There has been one survey specifically designed to investigate the use of social services (health, education, water supply), financed by the World Bank: this was the Human Resources Development Survey (HRDS) of 1994. For education, the survey suffered sample size problems, but yielded much useful information. A previous household survey was conducted by Cornell University in association with the Economic Research Bureau of the University of Dar es Salaam. The World Bank and Cornell/ERB surveys used the same national sampling frame.
My survey, undertaken in August 1994, covered 18 government secondary schools in 14 districts, in which 863 students completed questionnaires, and 15 private secondary schools in 10 districts, involving 942 students.118 A total of 294 parents were interviewed, 184 with at least one child in the private schools and 110 with at least one child in the state schools. The parents with at least one child in private school reported details on expenditures on a total of 600 children, while those with at least one child in state schools reported details of expenditures on 642 children. In addition, we administered a simple test in English and Maths. As with the Ghana survey, the sample cannot be considered representative as it was school-based, and not chosen from a national sample. In addition, 429 teachers from government schools were interviewed and 217 teachers from private schools.
[118 The private school sampling was problematic as there was some resistance to the survey teams.]
The Tanzanian Household and Cultural Issues Related to Cost-Sharing
Tanzanian households differ in their characteristics from Ghanaian households, although of course there are similarities. The Marriage Act of 1971 and the laws of inheritance put a strong emphasis on paternal responsibility, and matrilineal kinship structures are gradually disappearing.119 One of the most significant developments has been the 'transformation of the rural household from a unit of production into an income-sharing unit',120 which has resulted partly from the decline in formal paid employment. The 'second economy' has been expanding rapidly as people have responded to the pressures occasioned by economic changes.121 Schooling competes with income earning, as is shown in the HRDS data, which report a significant number of hours worked by children out of school: boys of 7-9 worked about 20 hours per week and girls for about 30 hours, though these figures may be doubted (see below).122
[119 See Omari C. K, Tanzania Household and Community Structures and Dynamics, mimeo, University of Dar es Salaam Sociology Dept, 1994. But see also Booth D. & al, Social, Economic and Cultural Change in Tanzania, SIDA, 1993, pp 28 ff for an account of the erosion also of patriarchal systems.
120 Mbilinyi M, Big Slavery: Agribusiness and the Crisis in Women's Employment, DSM University Press, 1991, p 9 23-24, quoted in Booth op cit. p 29,
121 Maliyamkono T. L. & M. S. Bagachwa, The Second Economy in Tanzania, James Currey, 1990.
122 See Mason A. D. and S. R. Khandker, Household Schooling Decisions in Tanzania, World Bank Poverty and Social Policy Dept, July 1995, p 15.]
It appears that parents take more responsibility for school charges than in Ghana, where frequently the child has to seek money from several sources and from parents who do not live together. In the World Bank household survey 65 per cent of the children in the sample lived in the same household as their father: 80 per cent of the sample lived in the same household as their mother.
In my sample of private school students, 40 per cent gave the source of their school fees as their fathers, and 25 per cent as both parents (6.5 per cent as mother): thus most of the sample receive their fees from expected sources. Nearly 13 per cent gave their 'uncles' as the source. In the HRDS less than 4 per cent of the households reported help with expenses from outside the immediate household.
The average number per household of children under 15 in the HRDS sample across the country was 2.8, with the poorest 20 per cent averaging 3.4 children under 15, out of an average household size of 6.1 (7.2 among the poorest). Over a third of the households with 5 children or more were situated in the poorest 40 per cent of the population. Just under 45 per cent of the 625 age group were enrolled in primary or secondary school, implying a household enrolment ratio for that age group of under 50 per cent. Poorer families have lower household enrolment ratios and more children, which means that there is a considerable burden on them in financing children in school,
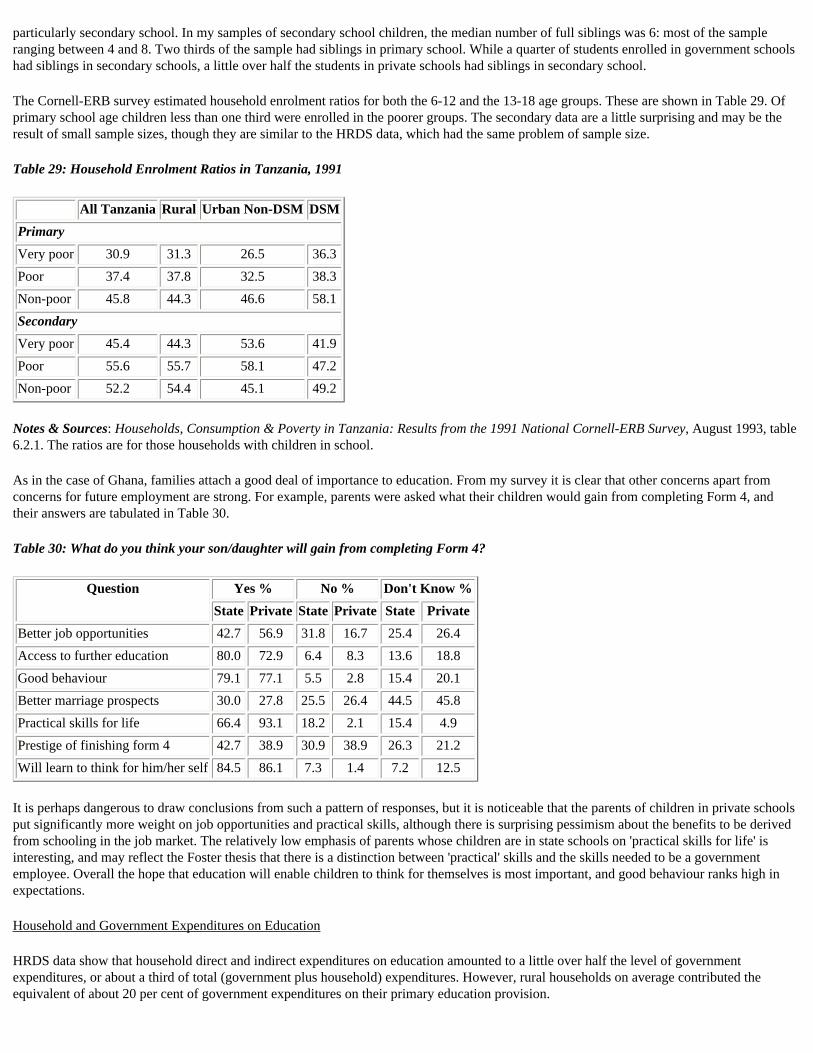
particularly secondary school. In my samples of secondary school children, the median number of full siblings was 6: most of the sample ranging between 4 and 8. Two thirds of the sample had siblings in primary school. While a quarter of students enrolled in government schools had siblings in secondary schools, a little over half the students in private schools had siblings in secondary school.
The Cornell-ERB survey estimated household enrolment ratios for both the 6-12 and the 13-18 age groups. These are shown in Table 29. Of primary school age children less than one third were enrolled in the poorer groups. The secondary data are a little surprising and may be the result of small sample sizes, though they are similar to the HRDS data, which had the same problem of sample size.
Table 29: Household Enrolment Ratios in Tanzania, 1991
All Tanzania Rural Urban Non-DSM DSM
Primary
Very poor 30.9 31.3 26.5 36.3
Poor 37.4 37.8 32.5 38.3
Non-poor 45.8 44.3 46.6 58.1
Secondary
Very poor 45.4 44.3 53.6 41.9
Poor 55.6 55.7 58.1 47.2
Non-poor 52.2 54.4 45.1 49.2
Notes & Sources: Households, Consumption & Poverty in Tanzania: Results from the 1991 National Cornell-ERB Survey, August 1993, table 6.2.1. The ratios are for those households with children in school.
As in the case of Ghana, families attach a good deal of importance to education. From my survey it is clear that other concerns apart from concerns for future employment are strong. For example, parents were asked what their children would gain from completing Form 4, and their answers are tabulated in Table 30.
Table 30: What do you think your son/daughter will gain from completing Form 4?
Question Yes % No % Don't Know %
State Private State Private State Private
Better job opportunities 42.7 56.9 31.8 16.7 25.4 26.4
Access to further education 80.0 72.9 6.4 8.3 13.6 18.8
Good behaviour 79.1 77.1 5.5 2.8 15.4 20.1
Better marriage prospects 30.0 27.8 25.5 26.4 44.5 45.8
Practical skills for life 66.4 93.1 18.2 2.1 15.4 4.9
Prestige of finishing form 4 42.7 38.9 30.9 38.9 26.3 21.2
Will learn to think for him/her self 84.5 86.1 7.3 1.4 7.2 12.5
It is perhaps dangerous to draw conclusions from such a pattern of responses, but it is noticeable that the parents of children in private schools put significantly more weight on job opportunities and practical skills, although there is surprising pessimism about the benefits to be derived from schooling in the job market. The relatively low emphasis of parents whose children are in state schools on 'practical skills for life' is interesting, and may reflect the Foster thesis that there is a distinction between 'practical' skills and the skills needed to be a government employee. Overall the hope that education will enable children to think for themselves is most important, and good behaviour ranks high in expectations.
Household and Government Expenditures on Education
HRDS data show that household direct and indirect expenditures on education amounted to a little over half the level of government expenditures, or about a third of total (government plus household) expenditures. However, rural households on average contributed the equivalent of about 20 per cent of government expenditures on their primary education provision.

Table 31 gives an indication of the relative expenditure per pupil. The table can only be taken as indicative, and shows both the balance of expenditures between families and the state, and the wide variations between urban and rural areas. Dar es Salaam families in the sample cited spend 10 times as much on their primary children as the poorest rural family, and a little more than the government.
Table 31: Government and Household Financing of a Primary Pupil, Tanzania 1993
Item Government Households (3rd Quintile) Lowest Rural Quintile
Rural Urban (excl DSM) DSM All
Teaching and private tutoring 7,357 30 540 760 140 0
Materials 300 440 900 1,500 650 400
Maintenance 0 in kind and through contributions
Uniforms 430 1,800 3,400 1,400 400
Fees & Non-fees 360 800 2,000 480 270
Board &c 100 15 20 70 0
Transport 55 90 2,000 80 0
Other 60 320 1,000 110 40
Totals 7,657 1,475 4,465 10,680 2,930 1,110
Notes and Sources: Household data derived from HRDS 1993. Government expenditures from dividing total enrolments by 1993/94 actual expenditures. These household expenditure data are almost certainly underestimates.
Education Expenditures within Households
Both the HRDS and the Cornell-ERB published results combine cash and non-cash consumption expenditures, and when this is done the apparent percentage expenditures on education appear to be low. For example the HRDS cites education as accounting for 1.4 per cent of the expenditures of the average household, which seems low until it is understood that some 15-30 per cent of the total expenditures are non-cash.123 This is mainly the result of growing own food, to which the surveys impute a cash equivalent value, and in rural areas between 40 and 50 per cent of total food consumption is from own production.124 The Cornell-ERB study showed even lower percentages, fractions of 1 per cent.
[123 HRDS p xix and pare 28 p 37. The average ratio of cash to non-cash expenditures in the HRDS is 86 per cent with a standard deviation of 18: rural households have a mean ratio of 77 per cent, SD=19.
124 World Bank, Tanzania: A Poverty Profile, 1993, p 26.]
A better way of using the data for our purposes is to take out imputed income. The average expenditure per household on food across the country is a little over 71 per cent: 61 per cent in Dar es Salaam. Non-food expenditures therefore seem to be a lower proportion of total expenditures than in Ghana, perhaps reflecting deeper general poverty in relation to prices. On average, household expenditures on education, based on HRDS published data, were 5 per cent of non-food expenditures (which would be mainly cash). This is a little lower than the Ghana average (5.7 per cent). Nevertheless, although the Social Sector Review emphasises the low level of household expenditure on education, as a percentage of cash discretionary expenditures (assuming food as non-discretionary for most households, and therefore a low likelihood of substitution between food and education) Tanzanian households spend only a little less than Ghana. In Dar es Salaam the average percentage share of education expenditure in non-food expenditures was 3 per cent, possibly reflecting high costs of other items, and partly the result of higher incomes of the better off segment of the sample. Although comparisons are difficult, one possible conclusion is that on average there is some scope in households to increase private expenditures on education, although the Social Sector Review assertion that household expenditures on education were 'low' is misleading: surveys show that the people will pay more but not for what they get at present.
Tanzanians, according to the HRDS average data, spend nearly 2 per cent of (cash + imputed) household income on health. This seems to conform with the Ghanaian pattern where expenditures on health take a larger share than those on education: whether the relative shares have switched over the last few years or not is not possible to determine. However, it is likely that health expenditures are less discretionary than education expenditures, and that households will reduce education expenses if faced with higher health costs.
Table 32 summarises the main items of expenditure per primary child from my samples of parents and total average expenditures per child. The table distinguishes between parents who have secondary school children in private schools, and those whose secondary school children

are in state schools, in order to see whether there is any variation in their patterns of expenditures. The fee element of TSh 200 is the 'UPE' contribution, which were collected by the schools but in many cases were not retained in the schools. Although most parents appear to have paid their fee, this was not universal. The fees were collected in the district headquarters, and perusal of the accounts of two districts showed average contributions of TSh 57 and TSh 111 respectively.125 Other evidence showed a considerable rise in contributions when the schools were permitted to retain fees.126 At the time of the survey, in addition to the UPE contribution, parents paid - or were supposed to pay - a one-off registration fee of TSh 500, some TSh 300-500 for school projects, as well as the larger items such as uniforms.
[125 Penrose P, Review of Public Expenditures in the Education Sector, Commission of the European Communities, July 1992, p 21.
126 World Bank, Teachers and the Financing of Education, Population and Human Resources Division, December 1991 (draft), p 50.]
Table 32: Primary Pupil Household Expenditures, Tanzania 1994Tanzania Shillings
Parents of Government Secondary Students Parents of Private Secondary Students
Fees Uniform & Shoes
Books & Materials
Other Total Fees & Tuition
Contributions Uniform & Shoes
Books & Materials
Other Total
All sample
Mean 264 4,928 2,502 4,091 8,686 234 479 4,490 1,711 1,819 9,609
Median 200 4,000 1,500 3,000 6,800 200 500 4,000 1,200 1,200 8,000
Maximum 1,000 20,000 20,000 11,000 36,400 1,500 1,715 13,000 5,520 12,000 38,600
Minimum 200 750 200 100 200 200 32 100 200 100 1,040
Number 178 188 183 179 191 295 252 331 330 115 331
Urban
Mean 293 4,593 2,517 4,841 9,139 226 447 5,666* 2,054 2,139 13,467*
Median 200 3,900 1,750 5,000 7,100 200 400 5,000 1,500 1,300 13,300
Maximum 1,000 18,000 20,000 11,000 36,400 800 1,700 13,000 5,500 12,000 38,600
Minimum 200 750 600 700 200 200 32 200 200 200 3,600
Number 68 66 64 68 70 92 78 93 92 51 93
Peri-urban
Mean 262 6,962 3,204 2,366 9,611 306 595 4,305* 1,341 1,771 7,267
Median 200 4,000 3,000 1,000 8,400 200 500 4,000 900 1,750 6,500
Maximum 700 15,000 6,000 22,000 26,000 1,500 1,600 12,600 5,000 3,120 22,000
Minimum 200 1,500 200 200 200 200 120 500 200 100 1,700
Number 29 29 27 25 29 65 46 91 91 10 91
Rural
Mean 240* 4,532 2,285 3,999 8,050 205* 457 3,862 1,726 1,526 8,619
Median 200 3,000 1,200 3,000 6,250 200 500 3,300 1,500 1,000 7,500
Maximum 500 20,000 15,000 10,000 25,250 440 1,715 12,000 5,520 4,300 27,900
Minimum 200 1,000 300 100 1,000 200 50 100 200 200 1,040
Number 81 93 92 86 92 138 128 147 147 54 147
Notes & sources: In this table as in all other tables from survey, I have omitted zero value cases on the grounds that (a) the sample is not representative; and (b) I wish to show what is paid by those who actually pay. *mean/SD>=2
Although the sample does not in general yield statistically significant results, it is interesting that the variations around the means of the expenditures reported by parents with children in private schools is smaller than those reported by the parents with secondary school children

in state schools, and that a number of the private school parent means are in fact statistically significant. The variation in payments by state school parents seem to be generally higher (and not always easy to explain, and possibly due to data or reporting errors, as well as the smaller government school sample size). The implications of the data would be usefully explored with larger samples. Do parents with secondary school children in private schools pay more or less than those with children in state schools once income is controlled for? Do they purchase more or fewer books and materials?
These data may be compared to those of the HRDS, which cites the average expenditure per pupil as ranging from TSh 2,948 to TSh 9,976 with an average of TSh 3,842. Those data are taken from the draft Social Sector Review which is based on a cleaned data set. Table 33 shows expenditures derived from the original set: the main difference between the two sets are found in the highest quintile, and the amounts are a little higher than the final data set.
Table 33: Household Expenditures on Primary Education, 1993
Consumption Quintile Total Household Expenditure-Primary Expenditure/primary pupil Average enrolment
1 5,085 2,132 2.4
2 7,396 2,782 2.7
3 9,138 3,419 2.7
4 9,744 4,002 2.4
5 23,305 10,118 2.3
Notes & Sources: HRDS, uncleaned data set
Table 32 shows minimum expenditure of TSH 1,040 with high maxima, but with two thirds of the sample ranging between about TSh 4,000 and TSh 15,000. It appears from these data that my sample falls in about the 4th quintile of the HRDS on average, although my survey took place a year after the HRDS and costs were rising. Nevertheless, the HRDS estimations seem low, for example, the data in Table 31. One reason may be that there were many households reporting enrolments in school but not reporting expenditures: this is evident in the data set.
School uniforms followed by books and supplies make up the biggest private expenditures, with uniforms comprising half the total. It is notable that the costs of primary school are constant between localities, and that the median expenditures do not change much except perhaps being a little lower in the rural areas. In contrast with Ghana, food expenditures do not figure highly. The households in my sample pay very similar amounts in indirect and direct expenditures for each pupil to those paid by the government. In terms therefore of cost sharing there seems to be a 50-50 split, but there is relatively little cost recovery.
How far do the direct and indirect costs of secondary schooling affect primary enrolments? The sample was not representative enough to explore the hypothesis that the higher the costs of secondary education the less parent spend on primary education. The median total expenditures by parents with secondary school children in more expensive private schools on their primary school children were higher than those of parents with children in government secondary schools, except in the case of pert-urban parents. Other evidence from the HRDS shows that, as expected, higher income families spend more on education that lower income families, and that there are other variables which influence expenditures: the data would need to be controlled for these factors, and a representative sample would be needed.
Analysis of the HRDS data set showed that there may be a relation between the supply of schools and expenditures, and between access to government secondary schools and primary expenditures.127 An increase in the supply of primary schools per head of total regional population is associated inversely with the amount spent by a family on a primary student, and the same effect is observed in the case of secondary schools. One possible explanation for this is that families send more children to school when more schools are available, and that their budget constraints limit the amount that can be spend on each child. Another reason might be that costs of schooling are reduced when more schools are available: for example, there would be lower travel costs.
[127 Deolalikar A. B, The Demand for Schooling Quantity and Quality in Tanzania: A Note, mimeo, April 1994. The conclusions of this paper need to be analysed further: many of the coefficients were low.]
At a regional level, there is an inverse relationship between the number of government owned secondary schools in a given region and expenditure per child, reflecting the lower costs of state schools. In addition, it seems that families respond to the lower costs of secondary education with increases in their expenditures on their primary school children. In other words, because of these substitution effects operating at the household level, primary school children benefit as much from reduced secondary costs which result from increased availability of government secondary schools as do secondary children. On the basis of a different sort of analysis, this conclusion is consistent with that of Lavy in Ghana, that the increased supply of secondary schools is associated with increased primary enrolments.

It does not appear that the costs of primary schooling are generally a major barrier to entry, although to the poorest will always be hard pressed to find even small amounts of money. One analysis of the HRDS data suggests that neither cost nor distance is a significant factor, but that supply constraints are. As far as opportunity costs are concerned the same study suggests these are significant for girls: imputing a 'market' wage to girls' time yields the result that school attendance is negatively related to the 'value' of their time. However, the opposite result was obtained for boys. The HRDS data are not compatible with my own survey of secondary school students: whereas for the age range the HRDS records about 9 hours a week worked by school children when not in school (9 for boys and 10 for girls), in my survey both sexes reported about 4 hours work, slightly less for girls. The HRDS data are time log data, whereas my survey indicates how much the children think they work. Nevertheless, there are features of the study's approach that bear examination.128
[128 Mason A. D. and S. R. Khandker, Household Schooling Decisions in Tanzania, World Bank Poverty and Social Policy Dept, July 1995. The FAST survey, a rapid survey carried out at the time of the HRDS by the World Bank, shows much longer hours worked by girls - up to 20 per week. The authors calculate 'opportunity time' as the difference between total hours worked by children not in school and total hours worked by children in school. A reduced out of school work time would increase 'opportunity cost' as defined by Mason and Khandker, which would then dominate all other costs. Their approach results in opportunity costs being measured against an 80 hour week! It can be therefore of little surprise that the authors find that 'opportunity costs' are the biggest single component of household costs.]
One important survey was clear in its conclusions on the disenchantment of parents with primary school:
A small minority (57 percent) of household heads disagreed with the statement: 'Parents should contribute more towards their children's education'. A similar proportion (59 per cent) disagreed with the statement: 'People like me cannot afford to send their children to school these days'. But a large majority (82 percent) agreed with the statement: 'More parents would send their children to school if they thought their children would benefit from schooling'.129
[129 TADREG, Parent's Attitudes Towards Education in Rural Tanzania, TADREG Research Report Nr 5, November 1993, p 21. The following pages make sobering reading, as they chronicle the frustration of parents with their schools: 'wanadai pesa kila siku ila matumizi hayajulikani - every day they want money but we never know what it's used for'; 'if they could give us the quality of education of colonial times we would be ready to pay for it by working as casual labourers'. The survey provides shocking insights into the reality of Tanzanian schools, including forced labour by pupils.]
These opinions are consistent with the financial data, which appear to indicate that there is some scope for increasing household expenditures, and with the stagnant enrolment ratios, which indicate that there is continuing resistance to attending school. They also highlight the need for rapid improvements in the quality of sector management, and suggest that there is small likelihood of increasing enrolments until the public sector is able to operate more accountably and efficiently. the willingness of parents to pay more for education will depend on the ability of the state to improve quality, which will require higher expenditures and other measures.
Another small study of primary school cost sharing (1993) in two wards of Dar es Salaam130 estimated the average cost to parents of sending a child to primary school at about TSh 5,000, which was equivalent to one month's minimum wage in the areas. The showed that some parents send no children to school because of cost. Other factors intrude:
I have two girls, neither of them is going to school. The first one (14 years old) was in standard five when she was expelled from the school when she got pregnant. The second one studied up to standard two only. I felt she was costing me too much and was wasting my money. She is stupid, does not understand anything in class...
[130 Sumra S, Primary Education and the Urban Poor: A Study of Parental Attitudes Towards Schooling in the Buguruni and Vinguguti Wards in Dar-es-Salaam, PLAN International, 1993. See also Sumra, S. Democratising School Management: Making Community Participation a Reality in Primary Schooling in Tanzania, Faculty of Education, UDSM, 1993, paper prepared for the TADREG workshop on 'Quality and Equity Issues in Tanzanian Education Policy & Practice: Insights from Recent Research', DSM, December 1993.]
The common answer to this type of problem is that a system of exemptions can be set up. Such systems have limited success in health provision, where in principle they are easier to administer, but are rarely feasible in education systems, particularly in countries with weak administration systems. One successful example of community based means testing occurred during the Zambian drought, but it does not appear to have been extended to formal schooling in 'normal' circumstances, though in Zambia principals informally exempt children in many cases.131 In Tanzania parents may apply for exemption to their village governments which in turn apply to the district office, which invariably approve the exemption. However, this involves the state taking responsibility for the fees, which it is rarely capable of doing. Furthermore, in a system in which government accounts and collection systems for fees are weak132 and accountability structures barely in place, it is unrealistic

to expect an exemption system to work.133
[131 Booth D, J. Milimo, G. Bond, & al, Coping with Cost Recovery in Zambia, SIDA, 1994. Headmasters do not enforce payment when they believe that children may drop out for good, but one school is cited in the study where all children were sent home. See also Penrose P. & al, Evaluation of the EU Structural Adjustment Support Programme in Zambia, Evaluation Unit' DGVIII, Brussels, August 1996, Vol. II, chap 6.
132 Andrea G. S. S. Financing Education and Health at Local Government Level: A Comparison of Dodoma Rural District and Morogoro Municipal Councils, Working Paper Nr 2, Local Government Support Unit, Prime Minister's Office, DSM, Feb 1996. An additional problem was/is the reliance of local government for general operating funds on collections from education fees, which has to some extent been stopped but not entirely.
133 See Post-Primary Education and Training in Tanzania: Investments, Returns and Future Opportunities, World Bank, draft, 1996, for the astonishing recommendation that records should be kept of the 'wealth' of all students as they enter primary school and pass through the system, in order to enable systematic means testing. Such centralised planning would not have been considered in the days of central planning...]
Secondary School
Table 34 shows the actual expenditures reported by parents of students in both government and private secondary schools.
Table 34: Household Expenditures on Form 4 Students, Tanzania 1994 Tanzanian Shillings
School Fees Caution Money Transport Rent Food Uniform & Shoes Books & Materials Other Total
State Schools
mean 5,235* 758 9,004 4,591* 6,797 11,168* 6,095 5,503 29,727*
median 5000 500 6000 4000 5000 9250 5000 5000 26000
minimum 2,000 300 1,000 2,000 600 1,800 500 100 9,000
maximum 20,000 5,000 35,000 8,000 24,000 30,000 30,000 30,000 73,100
N 100 19 23 11 35 100 101 70 106
Private Schools
School Fees Contribution Transport Rent Tuition Uniform & Shoes Books & Materials Other Total
mean 29,135* 4,136 3,718 3,196 11,667 8,278 7,452 12,315 43361*
median 30000 2500 3000 4000 9000 5000 5000 10000 42500
minimum 3,000 300 400 200 1,600 800 1,000 200 12,000
maximum 85,000 30,000 20,000 7,000 54,000 36,000 99,000 80,000 243,000
N 179 109 33 15 165 65 173 122 179
Notes & Sources: *=mean SD>=2
Households face considerably greater costs for children in secondary schools than for those in primary schools. There are two features of the Tanzania system which are unusual. First, there is a very low secondary enrolment ratio, and second, there is a high proportion of secondary school students attending private schools. The latter fact is to be expected with such low enrolment ratios, as those who are able to pay will do so when state provision is not available.
Table 35: Schedule of School Fees, TanzaniaTanzanian Shillings
Government Private
Day Boarding Day Boarding

1993/94 5,000 8,000 26,000 38,000
1994/95 5,000 8,000 30,000 40,000
1995/96 8,000 15,000
1996/97 20,000 40,000 Wazazi 60,000 90,000
Trusts 90,000 150,000
1997/98 30,000 60,000
Notes and Sources: MOE. Wazazi = parents' association (CCM). Figures vary for Trusts and those cited are upper limits. Government has set ceilings on private school fees of 80,000 and 110,000 for day and boarding schools respectively
Table 35 shows the levels at which fees were set and the planned rises in government school fees. In 1994 fees for state day students were TSh 5,000, and TSh 30,000 for private school day students. Most of the sample students were day students: there were 53 boarders in the private sample, none in the government school sample. Fees for private school boarders were TSh 40,000 and TSh 8,000 for government schools.
Private schooling cost parents twice as much more a year as did government schooling. Private school students were required to make significant contributions towards the school building, and on average spent more on books and clothing, though the medians are similar. A little under a third of the sample incurred tuition costs as well. These data compare with the national average expenditure per secondary pupil reported in the HRDS of TSh 41,438, with a range of TSh 39,500 to 56,200 between the lowest and highest quintiles. Again, there may have been some under reporting, and the non-representativeness of my sample (which is only Form 4 students) can be contrasted with the small but national HRDS sample. Table 36 gives the HRDS data.
Table 36: Household Expenditures on Secondary Education, Tanzania 1993Tanzanian Shillings
Consumption Quintile Total Household Expenditure Expenditure per pupil Average enrolment
1 43,459 39,577 1.1
2 42,074 39,577 1.1
3 75,456 35,071 2.2
4 60,798 40,171 1.5
5 90,081 56,212 1.6
Notes & Sources: HRDS, uncleaned data set
These average expenditures represent about 10 per cent of average cash non-food expenditures of households (not adjusted for adult equivalence). Although the HRDS emphasises the low income-expenditure ratios of Tanzanian households, where households have secondary school students enrolled, this does not apply. In other words, another strong reason for low expenditures on education is the lack of access to secondary education.
Although the sample sizes become smaller, it is of interest to compare the urban, pert-urban and rural averages. These are shown in Table 37. Schools around towns appear to be much more expensive than either town or rural schools. This is partly because a greater part of the private school pert-urban sample was boarders, and material costs seem to have been higher. Rural parents' private school costs were a slightly smaller multiple of urban and pert-urban parents' costs.
Table 37: Form 4 Expenditures by Location, Tanzania 1994Tanzanian Shillings
State Schools Private Schools
Urban Peri-Urban Rural Urban Peri-Urban Rural
Mean 25,532* 40,963 33,151* 64,687* 69,593* 54,498*
Median 23,450 27,506 28,500 61,000 63,500 53,000
N 46 20 41 47 52 79

Notes and Sources: . *=mean/SD>=2
Table 37 is based on the sample of parents. My survey also covered students, and the students at government schools answered questions on expenses. Table 38 shows their reported expenditures. The median expenditure of nearly TSh 39,000 is higher than that reported in the previous tables, and approaches that of the HRDS (which is still possibly an underestimate because of the fact that half the country's secondary students are in private schools134). The parents questionnaires did not capture all the expenditures, and the students questionnaire was fuller.
[134 The HRDS sample had only 80 private school pupils out of a total secondary sample of 380.]
Table 38: Government Secondary School Student Expenditures, Tanzania, 1994Tanzanian Shillings
School fees Caution money Exam fee School travel Rent Food Uniform Textbooks Books Mattress Other Total
mean 6,307* 599 5,482 6,849 7,796 7,934 9,962 6,345 4,356 11,015 7,299 42,611*
stdev 1,736 993 1,191 8,587 7,277 8,697 7,369 6,500 4,762 6,150 8,630 21,875
median 5,000 500 5,600 4,000 6,000 5,000 8,000 4,000 3,000 10,000 5,000 38,850
percent 12.9% 1.3% 14.4% 10.3% 15.4% 12.9% 20.6% 10.3% 7.7% 25.7% 12.9% 100.0%
N 752 347 774 504 137 291 761 472 822 133 662 858
Notes & Sources: 95 per cent of the surveyed students were form 4 students, and 5 per cent form 1 students. 53 per Table 0: 53 cent were day students. *=mean/SD>=2
About half of the government students were in boarding schools. Expenditure per student for day and boarding students was identical, although the composition varied. Whereas boarders paid higher fees and also incurred twice as high transport costs, day students paid more for food and for learning inputs. The median figures are shown in Table 39.
In 1994 the average expenditure by government for a secondary school student was around TSh 100,000. Parents contributed over TSh 20,000 in direct costs (fees, exam fees, and learning materials), not taking into account indirect and support expenditures such as uniforms and food. These are national average figures and in some schools the ratios were higher and in others lower. Nevertheless, on average the cost recovery ratio was about 16 per cent (20,000/120,000).
Table 39: Government Secondary Day and Boarding Student Expenditures, Tanzania 1994Tanzanian Shillings
Day Boarding
Median Number Median Number
Fees 5,000 406 8,000 341
Caution Money 500 199 500 147
Exam fees 5,600 372 5,600 400
Travel 2,000 122 4,650 380
Food 6,000 209 5,000 76
Uniforms 10,000 400 7,000 358
Textbooks 5,000 276 4,000 197
Exercise Books 3,900 429 2,500 392
Other 5,000 319 4,000 337
Total 31,670 455 31,200 402
Notes & Sources: Government school students survey
Government School Finances
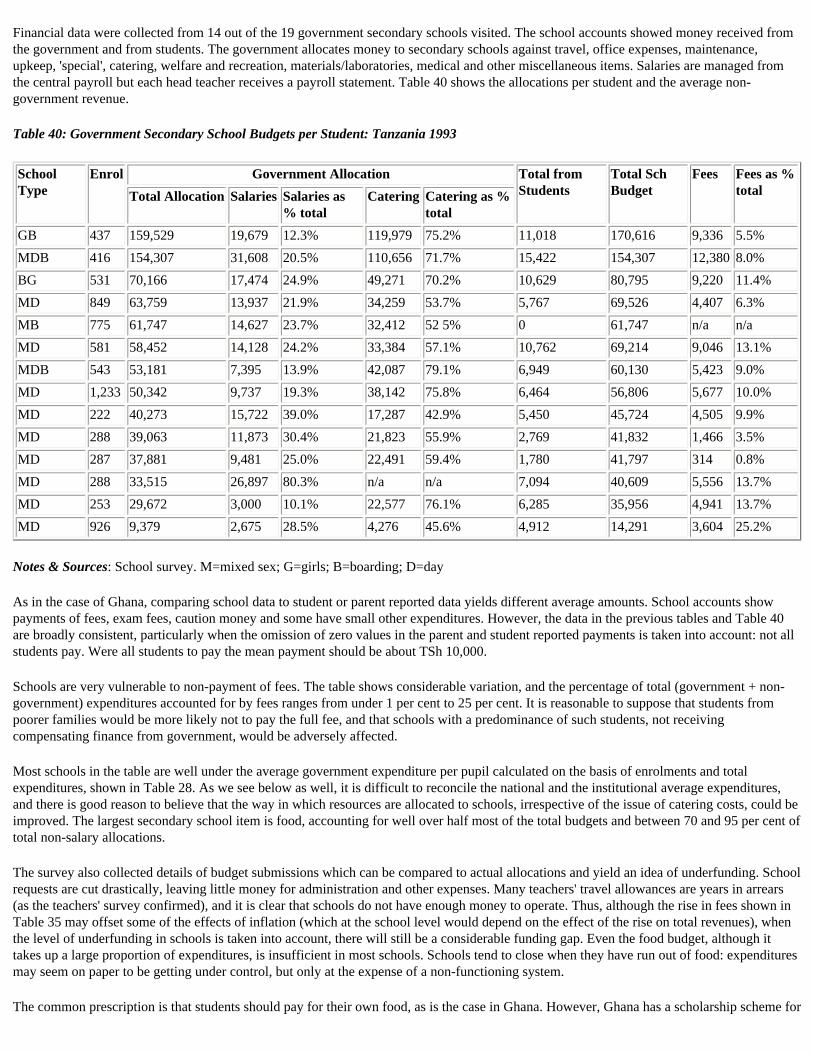
Financial data were collected from 14 out of the 19 government secondary schools visited. The school accounts showed money received from the government and from students. The government allocates money to secondary schools against travel, office expenses, maintenance, upkeep, 'special', catering, welfare and recreation, materials/laboratories, medical and other miscellaneous items. Salaries are managed from the central payroll but each head teacher receives a payroll statement. Table 40 shows the allocations per student and the average non-government revenue.
Table 40: Government Secondary School Budgets per Student: Tanzania 1993
School Type
Enrol Government Allocation Total from Students
Total Sch Budget
Fees Fees as % total Total Allocation Salaries Salaries as
% total Catering Catering as %
total
GB 437 159,529 19,679 12.3% 119,979 75.2% 11,018 170,616 9,336 5.5%
MDB 416 154,307 31,608 20.5% 110,656 71.7% 15,422 154,307 12,380 8.0%
BG 531 70,166 17,474 24.9% 49,271 70.2% 10,629 80,795 9,220 11.4%
MD 849 63,759 13,937 21.9% 34,259 53.7% 5,767 69,526 4,407 6.3%
MB 775 61,747 14,627 23.7% 32,412 52 5% 0 61,747 n/a n/a
MD 581 58,452 14,128 24.2% 33,384 57.1% 10,762 69,214 9,046 13.1%
MDB 543 53,181 7,395 13.9% 42,087 79.1% 6,949 60,130 5,423 9.0%
MD 1,233 50,342 9,737 19.3% 38,142 75.8% 6,464 56,806 5,677 10.0%
MD 222 40,273 15,722 39.0% 17,287 42.9% 5,450 45,724 4,505 9.9%
MD 288 39,063 11,873 30.4% 21,823 55.9% 2,769 41,832 1,466 3.5%
MD 287 37,881 9,481 25.0% 22,491 59.4% 1,780 41,797 314 0.8%
MD 288 33,515 26,897 80.3% n/a n/a 7,094 40,609 5,556 13.7%
MD 253 29,672 3,000 10.1% 22,577 76.1% 6,285 35,956 4,941 13.7%
MD 926 9,379 2,675 28.5% 4,276 45.6% 4,912 14,291 3,604 25.2%
Notes & Sources: School survey. M=mixed sex; G=girls; B=boarding; D=day
As in the case of Ghana, comparing school data to student or parent reported data yields different average amounts. School accounts show payments of fees, exam fees, caution money and some have small other expenditures. However, the data in the previous tables and Table 40 are broadly consistent, particularly when the omission of zero values in the parent and student reported payments is taken into account: not all students pay. Were all students to pay the mean payment should be about TSh 10,000.
Schools are very vulnerable to non-payment of fees. The table shows considerable variation, and the percentage of total (government + non-government) expenditures accounted for by fees ranges from under 1 per cent to 25 per cent. It is reasonable to suppose that students from poorer families would be more likely not to pay the full fee, and that schools with a predominance of such students, not receiving compensating finance from government, would be adversely affected.
Most schools in the table are well under the average government expenditure per pupil calculated on the basis of enrolments and total expenditures, shown in Table 28. As we see below as well, it is difficult to reconcile the national and the institutional average expenditures, and there is good reason to believe that the way in which resources are allocated to schools, irrespective of the issue of catering costs, could be improved. The largest secondary school item is food, accounting for well over half most of the total budgets and between 70 and 95 per cent of total non-salary allocations.
The survey also collected details of budget submissions which can be compared to actual allocations and yield an idea of underfunding. School requests are cut drastically, leaving little money for administration and other expenses. Many teachers' travel allowances are years in arrears (as the teachers' survey confirmed), and it is clear that schools do not have enough money to operate. Thus, although the rise in fees shown in Table 35 may offset some of the effects of inflation (which at the school level would depend on the effect of the rise on total revenues), when the level of underfunding in schools is taken into account, there will still be a considerable funding gap. Even the food budget, although it takes up a large proportion of expenditures, is insufficient in most schools. Schools tend to close when they have run out of food: expenditures may seem on paper to be getting under control, but only at the expense of a non-functioning system.
The common prescription is that students should pay for their own food, as is the case in Ghana. However, Ghana has a scholarship scheme for

students from the poorer north, and a better distribution of day secondary schools (though these are seriously under enrolled). The proliferation of private schools in Tanzania is unlikely to continue in the absence of innovative but perhaps unrealistic funding mechanisms. Moreover, the cost of food may well have contributed to the decline in secondary enrolments in Ghana, and any policy of reducing food budgets in secondary schools should be carefully thought out before introduction. The first step should be to reduce the costs to the school by changing the tendering regulations: both the government and parents paid more than they needed to pay. Most school heads would be able to procure food in local markets and much reduced prices, and would also be able to equalise across seasons through storage of preservable foodstuffs. Some calculations have shown that the reduction in cost can be significant. Secondly, students in many schools will undoubtedly drop out if they have to finance the full cost of catering, and ways would need to be found of identifying vulnerable schools if not vulnerable students.
Boarding and Day Schools
The issue of boarding has similarities to that of catering, in that it is also in the sights of the Bretton Woods rifle. Catering and boarding are considered to be symptoms of 'inefficiency'. Table 40 confirms that boarding schools tend to be more expensive per student than day schools, but it also shows that some boarding schools turn in lower average expenditures than day schools. While it is likely that on average boarding schools may have higher average costs, it is not automatic, and the 'de-boarding' policy seems to have been pushed through on the basis of no real evidence or analysis.
The rationale for boarding in Tanzania lay in the politics of national unity. It also lies in the fact that boarding schools perform better than day schools. Boarding schools have been the only way in which rural students can gain secondary education. In 1993 (based on HRDS data) secondary students were more or less evenly divided between day and boarding, but 70 per cent of boarders came from rural areas: urban households enjoy the proximity of day schools.
It is not axiomatic that boarding schools are more expensive per pupil than day schools, and they certainly do not need to be. Table 41 shows some comparative costs, as well as a summary of the push and pull factors which affect costs. The costs seem lower than the averages in Table 40, and may be slight underestimates because they are from different sources.
Table 41: Comparative Costs of Government Boarding and Day Schools, 1994Tanzanian Shillings
School Type Exp/Student Enrolment Pupils/Stream % Grad Tchers
Av Tchr Sal/mth
Av Tchr load/wk
Tching cost/total cost
PTR Tching/Non-tch ratio
% non-tching cost/tot
Material Cost/pupil
Galanos Ag Board
35,368 540 34 21% 28,000 16 70% 13 1.6 20% 63
Shinyanga Tech Board
21,975 601 35 35% 27,000 23 66% 20 1.9 16% 393
Bugene Comm day
23,905 266 33 6% 27,501 17 99% 14 n/a 0% 137
Mtwara Fundi board
31,527 542 45 3% 27,380 26 63% 15 1.5 21% 923
Notes & Sources: Calculated from MOE payroll sheets (July 1994), and school statistical returns Non-teaching expenditures are budgeted expenditures, not actuals. School debt is also not included.
The lowest expenditure per student is in a 'technical' boarding school, which at the same time manages more material expenditures and has a higher proportion of graduate students than the day school in the sample. Part of the reason for the lower expenditure is that teachers are used relatively efficiently, even though there is a higher ratio of non-teaching to teaching staff than the other schools, and there is high enrolment. The main reason is that there is both a higher PTR and a reasonable average enrolment per stream. It may be that it is easier to make boarding schools more efficient because they can use their resources to the full, and are not dependent on catchment areas for their pupils.
Another interesting feature of the table is (as in Table 40) that the average expenditures when computed on the basis of school data are much lower than the national average, even if it is assumed that they are underestimates. Indeed, against these figures, the direct expenditures of students exceed those of the government. The arguments against government support to boarding schools may not be based on very sound evidence and principles, and in Tanzania there was no systematic effort to amass data on which to decide appropriate policy.135
[135 A good example of the application of orthodox dogma is to be found in Post-Primary Education and Training in Tanzania:

Investments, Returns and Future Opportunities, World Bank, draft, 1996. On the basis of a superficial and incomplete analysis of 5 schools, 4 of which are in Dar es Salaam, the report advocates new secondary school policies which include the abolition of 'student welfare costs' (as they are called in Bretton Woods jargon) as well as higher fees, and extols the virtue of private schools with only passing mention that 'not all private schools are functioning well'. The report also provides an example of the approach of not distinguishing between direct and indirect expenditures.]
In a number of countries, including Kenya136, it appears that boarding schools have powerful positive effects, or at least that the students they attract already possess or acquire certain characteristics. The positive effects include attitudes towards future education and self-evaluation. Table 42 illustrates these effects. Boarders have both higher aspirations and higher academic self-evaluation than day students: for example 53 per cent of male boarders aim for university (though 43 per cent think they are capable of getting there) while 46 per cent of day students share that aim. Boarding girls aim higher than day girls: one quarter of the sample of females in government schools aim for university in contrast with 15 per cent of day students. Boarders in government schools have higher expectations and self-valuation than those in private schools: 43 per cent of the boarding boys believe themselves capable of reaching university compared with 25 per cent of the private boarders. Girls have much lower expectations than boys. Exceptions to these generalisations include day girls' expectations of level of teaching qualification.
[136 See Karani F. A. & al, Cost and Financing of Education in Kenya. Study 2 - Access, Quality and Equity in Secondary Education, MOE, Nairobi, Dec 1995. Boarding schools in the sample perform better than other schools. Also, 'public secondary schools offer a significantly better quality of education than the private schools' (p 110). Government expenditure per student is reported to be 24 per cent higher in boarding than day schools. In spite of the evident advantages of boarding schools, this report recommends, as is the fashion, the reduction of the number of such schools. It also recommends more private schools. The study was financed by the World Bank.]
Table 42: Expectations of Secondary Students, Tanzania per cent
Government Schools Private Schools
Academic aspiration Academic level capable of Academic aspiration Academic level capable of
Boarder Day Boarder Day Boarder Day Boarder Day
M F M F M F M F M F M F M F M F
Form 4 4 6 6 5 8 6 7 9 6 11 9 8 7 12 8 13
Form 6 15 30 20 19 24 31 19 23 30 26 30 25 29 26 32 25
Teacher Grade A 10 20 14 48 9 25 17 44 17 32 22 53 21 36 27 49
Degree level 15 13 11 11 12 8 13 10 10 7 7 4 12 5 8 5
University Degree 53 25 46 16 43 22 39 12 30 18 25 6 25 17 18 5
Other 3 6 4 1 4 8 5 2 7 6 7 4 6 4 7 3
Total 100 100 101 100 100 100 100 100 100 100 100 100 100 100 100 100
Notes & Sources: Students survey
Strong conclusions perhaps should not be drawn from the data cited above, though they are consistent with parental attitudes in Ghana and, indeed, elsewhere: parents see boarding schools as the route to greater success. One reason is that government and boarding schools (or mixed day and boarding) perform better in examinations. In Tanzania the top performing schools are catholic seminaries (which are all mixed boarding/day), and government schools, which are mainly but not exclusively mixed boarding/day. In the list of schools ranked among the top 25 per cent in the CSEE (Certificate of Secondary Education) there is one private school. There are many factors which need to be taken into account to standardise these comparisons, including the quota system whereby students are allocated on regional grounds, exam selection and parental background. A more appropriate measure of performance would be of value added, but it is probably nevertheless fair to assume that the rankings are for the most part reasonable indicators of quality, if unfair in certain cases.
Private Schools
Private schools represent an important source of access for rural and poorer households to secondary education, in the same way that boarding schools do. Of the 70 per cent of boarders who come from rural areas, about half are in private schools (HRDS data), and overall about 60 per cent of rural students attend private schools. In Dar 78 per cent of secondary students attend day schools, and of that number about three quarters attend private day schools.
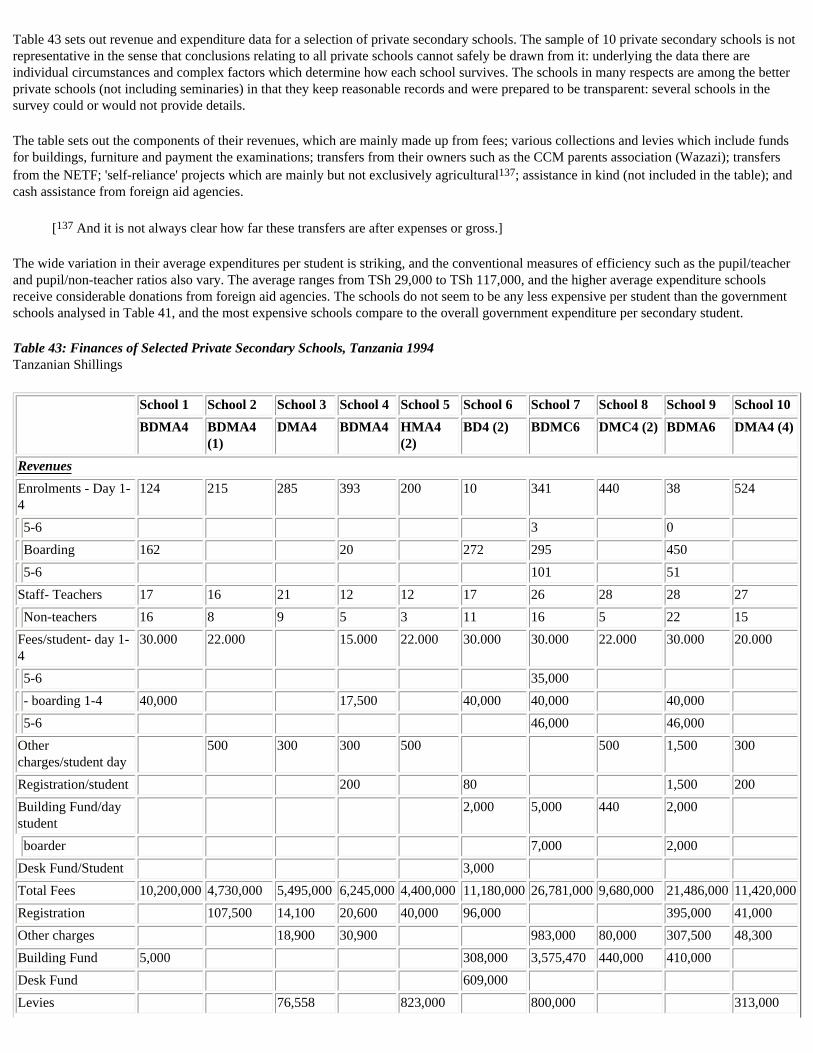
Table 43 sets out revenue and expenditure data for a selection of private secondary schools. The sample of 10 private secondary schools is not representative in the sense that conclusions relating to all private schools cannot safely be drawn from it: underlying the data there are individual circumstances and complex factors which determine how each school survives. The schools in many respects are among the better private schools (not including seminaries) in that they keep reasonable records and were prepared to be transparent: several schools in the survey could or would not provide details.
The table sets out the components of their revenues, which are mainly made up from fees; various collections and levies which include funds for buildings, furniture and payment the examinations; transfers from their owners such as the CCM parents association (Wazazi); transfers from the NETF; 'self-reliance' projects which are mainly but not exclusively agricultural137; assistance in kind (not included in the table); and cash assistance from foreign aid agencies.
[137 And it is not always clear how far these transfers are after expenses or gross.]
The wide variation in their average expenditures per student is striking, and the conventional measures of efficiency such as the pupil/teacher and pupil/non-teacher ratios also vary. The average ranges from TSh 29,000 to TSh 117,000, and the higher average expenditure schools receive considerable donations from foreign aid agencies. The schools do not seem to be any less expensive per student than the government schools analysed in Table 41, and the most expensive schools compare to the overall government expenditure per secondary student.
Table 43: Finances of Selected Private Secondary Schools, Tanzania 1994 Tanzanian Shillings
School 1 School 2 School 3 School 4 School 5 School 6 School 7 School 8 School 9 School 10
BDMA4 BDMA4 (1)
DMA4 BDMA4 HMA4 (2)
BD4 (2) BDMC6 DMC4 (2) BDMA6 DMA4 (4)
Revenues
Enrolments - Day 1-4
124 215 285 393 200 10 341 440 38 524
5-6 3 0
Boarding 162 20 272 295 450
5-6 101 51
Staff- Teachers 17 16 21 12 12 17 26 28 28 27
Non-teachers 16 8 9 5 3 11 16 5 22 15
Fees/student- day 1-4
30.000 22.000 15.000 22.000 30.000 30.000 22.000 30.000 20.000
5-6 35,000
- boarding 1-4 40,000 17,500 40,000 40,000 40,000
5-6 46,000 46,000
Other charges/student day
500 300 300 500 500 1,500 300
Registration/student 200 80 1,500 200
Building Fund/day student
2,000 5,000 440 2,000
boarder 7,000 2,000
Desk Fund/Student 3,000
Total Fees 10,200,000 4,730,000 5,495,000 6,245,000 4,400,000 11,180,000 26,781,000 9,680,000 21,486,000 11,420,000
Registration 107,500 14,100 20,600 40,000 96,000 395,000 41,000
Other charges 18,900 30,900 983,000 80,000 307,500 48,300
Building Fund 5,000 308,000 3,575,470 440,000 410,000
Desk Fund 609,000
Levies 76,558 823,000 800,000 313,000

Transfers 399,500 107,288 112,740
NETF 2,330,561 3,000,000 100,000
Self reliance projects
4,045,558 1,693,600 478,749 100,000 1,244,000 4,660,000 325,503 180,000
Borrowing 2,268,542 345,326 283,110 296,000 250,000 45,000 200,000 640,160
Foreign Aid 9,095,000 100,000 12,916,000 5,000,000 9,450,000
Total 18 849,661 18,626,100 6,828,133 6,579,610 5,859,000 26,710,288 36,844,470 15,400,000 33,126,903 12,002,300
School 1 School 2 School 3 School 4 School 5 School 6 School 7 School 3 School 9 School 10
BDMA4 BDMA4 (1)
DMA4 (1)(2)(3)
BDMA4 HMA4 (2)
BD4 (2) BDMC6 DMC4 (2) BDMA6 DMA4 (4)
Teachers salaries & allowances
2,813,160 7,308,725 4,544,810 2,622,960 2,483,040 3,135,030 10,859,400 5,489,770 4,315,462 3,194,957
Non-teachers salaries & allowances
1,742,136 793,522 775,280 611,040 303,600 1,161,891 1,786,500 606,320 1,898,875 1,119,590
Materials 2,500,000 1,400 412,903 146,000 1,726,740 500,000 492,860
Consumables 4,423,489 2,061,219 313,586 118,439 184,290 3,507,705 197,436 400,000 684,500
Welfare 5,304,355 326,000 430,245 454,875 1,506,792 308,520 189,544 200,000 298,000
Transport 312,000 585,749 459,375 165,206 755,473 253,874 170,000 305,612
Rent 94,240 61,400 43,590 153,265
Building 6,052,159 326,250 146,375 741,000 8,354,441 4,863,927 5,400,000 1,482,300
Equipment 1,400,000 122,718 6,500,000 264,547
Other 4,512,374 1,077,469 372,287 272,166 6,503,413 24,819,080 1,720,919 6,774,149
Total 14,283,140 25,265,999 8,271,747 5,198,254 5,863,494 31,996,803 43,234,308 12,766,090 11,351,793 11,088,696
Expenditure/student 49,941 117,516 29,024 12,587 29,317 113,464 67,978 29,014 23,262 21,162
Pupil/Teacher Ratio 17 13 14 34 17 17 24 16 17 19
Pupil/Non-teacher Ratio
18 27 32 83 67 26 40 88 22 35
% Untrained teachers
29 19 33 50 50 65 15 71 29 19
Average cost/teacher/month
13,790 38,066 18,035 18,215 17,243 15,368 34,806 16,339 12,844 9,861
Notes & Sources: (1) has foreign teachers
(2) gets assistance in kind from foreign aid
(3) 163 students on 15000 & 122 on 25000
(4) 430 students @20000, 94 @ 30,000
B=Boarding
D=Day
H=Hostel
M=Mixed
A=Agric
4=Forms 1-4
6=Form 6
A feature of private schooling in Tanzania is the interest taken in it by foreign aid agencies. In order to encourage the expansion of private schools agencies have been trying to develop improved financial support systems, such as the National Education Trust Fund (NETF). They also provide teachers, cash, materials and equipment to private schools, as the table shows. One prominent organiser of private schools, some

of which are represented in this survey, did not think it possible for private schools to be viable without additional assistance, as parents could not pay full cost fees.
Costs in the schools are kept down with some exceptions by the recruitment of unqualified teachers (several of the schools also have foreign volunteer teachers). Many have low pupil-teacher ratios, identical to the national average (Table 23). They vary widely in the number of non-teaching staff. The table suggests that private schools are not more 'efficient' in the sense of higher PTRs and lower pupil/non-teacher ratios. On the question of whether 'parents who send their children to private schools get value for money' 42 per cent of my sample of teachers in private schools agreed (36 per cent disagreed), as did 60 per cent of state school teachers.
I surveyed teachers' backgrounds and opinions from private and state secondary schools in order to gain more insight into issues of school quality. The average age of state school teachers in the sample was 33 and that of the private school teachers was 30, and the older state teachers had on average one more dependent (5) than the private teachers. In the private schools 29 per cent of the sample (of 217 teachers) were untrained, 47 per cent held diplomas, and the highest academic qualification of 50 per cent of the sample was A Level. In the government school teacher sample (of 429 teachers) only 4 were untrained and 89 per cent were diploma holders: 83 per cent had A Level as the highest academic qualification. Over two thirds of the private school teachers had never taught before, and their median years teaching experience was 5, compared with the state school teachers' median years experience of 7. Teachers in private schools on average teach 21 periods per week, compared with 17 periods per week for state teachers. Both sets of teachers spend similar time in preparation, about 10 hours per week, slightly more for state teachers. State teachers spend a little more time marking (a median of 6 hours compared with 5 hours in private schools). Both sets of teachers set similar amounts of work for their students, with private school teachers setting marginally more homework and tests than state teachers. For some reason 90 per cent of the private school teachers reported that they undertook continuous assessment as opposed to 78 per cent of state teachers.
The teachers were asked to make assessments about the English language capabilities of their students. The comparative responses were striking in that in both types of school language capability was judged to be similar, with 40 per cent of the students assessed as writing and speaking English 'of a satisfactory standard': state teachers reported marginally better standards. These perceptions are not reflected in the test scores shown in Tables 44 and 45. However, state teachers had a lower opinion of secondary education than private teachers, with three quarters agreeing that 'students don't learn much in secondary school these days' as opposed to a little over half the private school teachers agreeing with the same statement. Three quarters of both samples did not feel that the quality of education was improving. Teachers in both types of school shared similar opinions on the supply of textbooks: 44 per cent in both private and state schools considered textbook supplies to be good or adequate. Private school teachers appear to experience more discipline problems than state school teachers.
Private school teachers were less well paid than state teachers, reflecting both the qualifications differential and the greater discretion of employers. Their median monthly salary was TSh 16,000, TSh 9,000 less than their state colleagues at TSh 25,000. However, they were usually paid more or less on time, compared with the experience of 53 per cent of the state teachers who reported that their salaries were never paid on time. Also, half the private teachers had free accommodation (which most did not like very much), whereas nearly all the state teachers received no such benefit. All teachers thought they were underpaid, and said that about twice their current salary would be reasonable: all teachers professed to be discouraged by their incomes and prospects. More private teachers (49 per cent) considered teaching to be a respected profession than state teachers (37 per cent).
The profile of the teaching profession built up in the survey responses is of a profession which is demoralised138 irrespective of whether they teach in private or public schools. Private school teachers tend to be younger, less experienced and untrained.139 They are also paid less and work more hours, and it is from this fact that the apparent cost advantage of private schools is derived for given pupil/teacher and teaching/non-teaching staff ratios. They seem to share common attitudes and problems, and themselves do not perceive that private schooling is of itself an advantage.
[138 See also a survey of teachers carried out in 1991, Cooksey B. & al, A Survey of living and Working Conditions of Primary and Secondary School Teachers on Mainland Tanzania, 1991, and Malekela G. A, Teacher Quality and Motivation, UDSM Dept of Educational Foundations, paper prepared for the TADREG workshop 'Qualify and Equity Issues in Tanzanian Education Policy and Practice: Insights from Recent Research', December 1993.
139 The poverty of inservice training in Tanzania, for which no government money was allocated during the period under discussion, is indicated by the fact that of both samples around half had had no such training.]
School Performance
Private schools consistently dominate the bottom rankings of examination performance, where they are the only type of school represented.140 My survey included simple tests in English and mathematics. The results of the tests are given in Tables 44 and 45.

[140 Ndabi D. M. & S. A. C. Waane, School Quality and Performance, paper prepared for the TADREG workshop on 'Quality and Equity Issues in Tanzanian Education Policy & Practice: Insights from Recent Research', DSM, December 1993]
Table 44: English and Maths Test Results state and private schools
PUBLIC PRIVATE
Male Female Total Male Female Total
English test
Mean 10.31 9.01 9.75 9.22 7.82 8.49
Standard deviation 2.55 2.81 2.75 2.54 2.59 2.66
Number of observations 481 374 858 444 467 914
Mathematics test
Mean 14.9 12.45 13.83 11.45 8.77 10.07
Standard deviation 4.23 4.40 4.46 4.43 3.83 4.35
Number of observations 480 373 856 444 465 912
Combined Score
Mean 25.22 21.46 23.59 20.66 16.58 18.56
Standard deviation 5.80 6.38 6.33 5.72 5.27 5.87
Number of observations 480 373 856 443 465 911
Note: The English test is out of a maximum of 15 whereas the mathematics test is marked out of 24. The mathematics and English scores are combined for the combined score. Male and female observations do not add up to the total because there are some observations with missing observations for the sex of the respondent.
They show that state schools scored better, with girls and boys sharing evenly in the score differentials. Although the sampling could bias the results in the sense that like may not be compared with like, and other factors may need to be controlled for, it can be concluded that there is no axiomatic performance advantage in private schools as is often argued, just as there is no axiomatic efficiency benefit. Within the state school system, boarders performed better in the tests than day students, although the small margin does not strongly support the view that boarding schools have better cognitive results than day schools. However, within the private school system the performance of boarders was no different from that of day students.
The data are shown in Table 45, which also suggests a high differential in cognitive outcomes between state boarders and private boarders, with state girl boarders accounting for the largest part of the difference. Further more carefully controlled research on this area would be of considerable interest in informing policy towards boarding schools (as well as private schools).
Table 45: English and Maths Test Results state and private schools
Public Schools
Boarders Day Students
Male Female Total Male Female Total
English test
Mean 10.85 9.71 10.37 9.80 8.47 9.20
Standard deviation 2.47 2.48 2.53 2.53 2.95 2.81
Number of observations 234 165 401 247 208 456
Mathematics test
Mean 15.87 13.60 14.94 13.97 11.52 12.85
Standard deviation 4.07 3.97 4.17 4.17 4.52 4.49

Number of observations 234 165 401 246 207 454
Combined Score
Mean 26.72 23.31 25.31 23.79 19.98 22.06
Standard deviation 5.55 5.52 5.77 5.68 6.66 6.43
Number of observations 234 165 401 246 207 454
Private Schools
Boarders Day Students
Male Female Total Male Female Total
English test
Mean 9.48 7.96 8.69 8.92 7.63 8.25
Standard deviation 2.54 2.63 2.69 2.52 2.56 2.63
Number of observations 235 251 486 202 208 412
Mathematics test
Mean 11.39 8.90 10.10 11.52 8.63 10.06
Standard deviation 4.45 3.60 4.21 4.44 4.12 4.53
Number of observations 234 251 485 203 206 411
Combined Score
Mean 20.88 16.86 18.80 20.41 16.25 18.29
Standard deviation 5.72 5.10 5.77 5.72 5.52 6.01
Number of observations 234 251 485 202 206 410
Note: The English test is out of a maximum of 15 whereas the mathematics test is marked out of 24. The mathematics and English scores are combined for the combined score. Male and female observations do not add up to the total because there are some observations with missing observations for the sex of the
Higher Education Loans
Students in universities used to receive a range of allowances. Table 46 shows the allowances for UDSM students in 1992/93.
Table 46: Student Allowances, University of Dar es Salaam, 1992/93
Description Amount TSh
Field Allowance 1,500
Book Allowance - 1st year 15,000
Book Allowance - others 10,000
Special requirements 18,000
Stationery Allowance 4,000
Meal Allowance/day 500
Fares variable
Notes & Sources: UDSM budget
These allowances accounted for about half the university's allocation, though less of the actual expenditure. The government found it difficult to move away from this type of system because of student resistance, and a programme of transferring costs from government to students was initiated in 1991/92. In 1993 government announced in its policy statement that students would have to pay for boarding, tuition fees, textbooks and learning materials, membership fees for clubs, registration, graduation and examinations.141 In 1994 a student loan scheme was introduced, intended to cover accommodation and food expenses. The system was in some ways an extension of the approach to fee exemption at school level, and was designed to assist those who could not afford to pay. It was introduced hurriedly, partly as a response to pressure from

foreign aid agencies, and not fully thought through.
[141 MOE/MSTHE, Tanzania Integrated Education and Training Policy, August 1993.]
Tanzania has no equivalent of the Ghanaian SSNIT, and the option of recovering loans from social security and national insurance contributions is not present. Another difference between the Ghanaian and the Tanzanian system is that in the latter case the scheme is intended for those who cannot pay, and is thus an exemption-based scheme, and not universal. Students complete an application form which is partly on the British model, in which they declare their income. The form is approved by the District Commissioner (DC) in the student's home area. If the DC endorses the form, the application is invariably accepted. Nearly all students who apply are reported to have had their applications accepted.
Like Ghana, the terms of the loan are advantageous to the student, and involve the government in a substantial interest rate subsidy. The loan is interest free to the student, with a repayment period of 16 years after graduation. As the scheme has just started at the time of writing there has been no experience of recovery, and the institutional mechanism for recovery is in any case unclear.
Willingness to Pay
A large part of the HRDS was concerned with ascertaining willingness to pay for education. The survey employed a game approach, where respondents were asked first to allocate chips to the value of 20 shillings to five school characteristics, set out with drawings on a card. The characteristics were
a) well qualified teachers who teach children well b) excellent headmaster who manages the school well c) enough supplies so each child has a desk and workbooks d) clean building with toilets and a playground e) emphasises academic study, no self-reliance work.
Once the respondents had placed their chips on the squares showing pictures of the above characteristics, their choices were ranked: what they were willing to spend most for was assumed to be the most important characteristic.142 They were then taken through chains of questions to decide up to what amount they would be willing to pay to send their children to such a school. In other words, the exercise was an application of the orthodox economic principle of maximisation of utility subject to a hard budget constraint.
[142 Rather than their perception of the most expensive: it was assumed that respondents would naturally associate the most desirable options with their cost.]
There are several variables to consider when interpreting the results of the exercise. The first is household income, and the second is education of the bidder: both are correlated with each other. Unsurprisingly, better educated and higher income respondents were willing to 'bid' more for their ideal school. A second use of the data was to compare actual average expenditures per pupil to levels.
Table 47 shows the results of this exercise. The 20 per cent of the population with the lowest annual expenditure (cash and imputed) would be willing to pay an additional 65 per cent for better schools, while the 20 per cent with the highest annual consumption (the fifth quintile) would be willing to pay an additional 8 per cent. The rural population would be willing to pay more in addition to what they already pay than the urban areas, and in Dar es Salaam most of the population evidently felt that they paid too much, and responded with bids less than what they already paid.143 The total effect, were all these average additional expenditures to be made, would be an average increment of about TSh 1,000 per primary student across the country, or a 12 per cent addition to total (public plus private) education expenditure. While such an estimate is crude, the level of underfunding of the system is certainly greater than the incremental private contributions which might, according to these data, accrue from better quality provision, and almost certainly much less than the costs of improving quality.
[143 See Social Sector Review (draft) for another way of looking at these data. An 'amazing' 22 per cent of the sample is reported to be willing to pay over TSh 25,000 for primary schooling, the maximum sum asked in the game. The surveyors found the result 'amazing' because they assumed that respondents would 'sensibly (sic) make offers lower than what they would actually pay', an interesting example of cultural assumptions.]
Table 47: The Hypothetical Influence of Improved Quality on Per Pupil Primary School Expenditures, Tanzania, 1993 Per cent
Consumption Quintile All Tanzania Rural Tanzania Urban, excl DSM DSM
1 65 65 51 -11

2 65 68 48 3
3 61 73 43 -49
4 6 66 29 -29
5 8 30 21 -72
Notes & Sources: Calculated from original (uncleaned) HRDS data set: the effects of data cleaning would be mainly felt on the 5th quintile, but not significant for this table. See text for explanation of table.
These data suggest strong upper bounds on household willingness and ability to pay. Indeed, of the average total expenditure of a household (cited in the HRDS as TSh 579,555), assume that 75 per cent of that, or TSh 434,666, is cash expenditure, and take 5 per cent of total cash income as a reasonable amount to be made available to finance a secondary student: TSh 21,733 is half the current average (HRDS data). It is 15 per cent of average rural expenditures per adult equivalent. It is difficult on the basis of such data to see how more than a small fraction of the population will have the means of making significant contributions.
G. Conclusions
We may now consider the six questions with which we started this paper in the context of education financing in Tanzania, in order to determine how governments and households have reacted to cost sharing policies.
a) Has cost sharing increased total resources available for education? b) Has cost sharing enhanced efficiency of resource use? c) Has cost sharing affected enrolments and attendance? d) Has cost sharing improved quality of education? e) What other effects have resulted from cost sharing in education? f) Is a policy of cost sharing justified?
Has cost sharing increased total resources available for education?
Total real education expenditures rose until 1994/95, but then seemed to decline sharply, with an overall reallocation to debt costs and possibly to other sectors. Primary education real expenditure rose and then appeared to fall, and average primary expenditures per pupil rose very slightly. Real total government secondary expenditures declined over the period we have analysed, and average expenditures declined sharply in response to rising enrolments: total tertiary expenditures were robust but may also have started to decline.
Government policy has been to allow the private sector to expand secondary access, and to concentrate on primary education. The existence of private secondary schools reduced pressure on the government to finance the expansion secondary access in the very short term, and permitted real expenditures on primary education to be maintained, even if they were mainly composed of salaries. In terms of macroeconomic policy the government bought time to allow the economy to improve in order to allocate more finance to education.
Tanzania underspends on education in terms of a proportion of national income when compared to other countries, and this may have been deliberate policy to force the private sector to pick up the 'excess demand': where Ghana allocates some 4 per cent of GDP to education, Tanzania allocates under 3 per cent (Kenya spends over 6 per cent of GDP, but Uganda well under 2 per cent). If the availability of foreign aid, on which the government depends for the provision of books and other materials, is taken into account, the combination of foreign aid financing and support for private school development has permitted lower government expenditures than might otherwise have been required. However, with a secondary school enrolment ratio under 10 per cent, strong fiscal pressure will be exerted on the budget whether or not primary enrolments rise, as demand for secondary schooling increases beyond the level which can be absorbed in a private system
It is likely that the demand for private schools is a result of the absence of government school alternatives. While there may be a belief that private schools provide more efficient and effective education, it remains to be seen whether this view will be maintained in view of the generally poor performance of private schools (apart, of course, from the seminaries and high cost schools). There is no doubt that total expenditure would have been lower without cost sharing via private schools. Moreover, it does seem that there was some reallocation towards primary education, though it is not clear what benefits have ensued. However, there may be also a substitution effect as government sees the potential for overall education budget reductions partly arising from the perceived reduced demand for government finance for secondary education.
Cost sharing has increased total resources for education in the sense that it is unlikely that the government would have made those same expenditures in the absence of private expenditures. However, Tanzania's total public expenditure effort is low because of poor revenue

performance and weak budgetary management, as well as slow implementation of wider public sector reform. As in the case of Ghana, it must be hypothesised that the ability of the government to exact additional taxation outside the normal revenue systems to pay for education reduces the urgency of implementing reforms. Although it can only be conjectured, a growing normality of private financing for what are usually be considered as public goods must be one factor in consolidating the legitimacy of tax avoidance: for example, newspapers in Ghana and Tanzania frequently publish letters which question the value of paying taxes in the absence of the provision of adequate services. It is doubtful whether the present level of cost sharing is sustainable, at least if increased enrolments are an objective.
Has cost sharing enhanced efficiency of resource use?
Measured in terms of PTRs, primary sector financing has not been inefficient in comparison with other countries, including Ghana, although that has little to do with cost sharing. Measured in the same way, the secondary sector was not as efficient, and the tertiary sector was the least efficient. The inefficiency of the private schools may indeed have resulted in an aggregate decline in the overall (public + private) efficiency of secondary school provision facing parents: they must accept inferior private schools in the absence of sufficient higher quality state provision, and the overall cost (i.e. the cost to society) of private schools they are obliged to use may be higher than the costs of the alternative but unattainable state schools. More evidence would be needed to substantiate that hypothesis.
The underfunding of the system makes it unlikely that there are significant efficiency measures available which would permit major reallocations to learning inputs. There is at present a strong belief that 'rationalisation' of the teaching force will permit such measures, and while this is true to some extent, it is unlikely to be particularly significant because raising the PTR is probably more realistically a function of raising enrolments rather than reducing teacher numbers. In terms of allocative efficiency, the higher and technical education system takes some 20 per cent of the budget, but this is a reflection of the low level of total expenditure as much as of a 'high' share: tertiary education costs have high non-discretionary elements, and tertiary education spending would probably not increase in proportion to total spending were total spending to approach 4 per cent of GDP.
As in the case of Ghana, claims that cost sharing stimulates greater efficiency and equity in education provision are not supported by the Tanzanian evidence.
Has cost sharing affected enrolments?
Although total enrolments have risen, the secondary apparent enrolment ratio has declined in Tanzania while the primary enrolment ratio is stagnant. Cost sharing has been the principal reason for the apparent increase in enrolments at secondary schools, but it is not possible to say whether secondary enrolments would have risen faster had cost not been a factor, both in the public and private sectors. Survey results indicate that some children do not enrol because of cost. Enrolments in state schools have probably suffered as a result of cost sharing, while the ability of the population to afford private education - at least in its present form - may be reaching its limit. Furthermore, as the state school fees equalise with private school fees a continuing decline in the demand for secondary places may be expected.
Cost may, however, be less of a barrier than other factors, such as quality of the school experience, which are in turn related to government financing, particularly at the primary level. Nevertheless, it may be that in spite of the positive role played by private schools in permitting secondary enrolments to increase, costs are a critical factor in the low rate of increase of the primary enrolment ratio and in the decline of the secondary enrolment ratio.
Has cost sharing improved quality of education?
Tanzanian consumers of education seem to be expected to pay for a service which does not improve as a consequence of their payments. Although households pay considerable sums towards their children's schooling, it is commonly accepted that there has been little or no improvement in the quality of most schools. While cost sharing has had a role to play in quantitative improvements, the failure to bring qualitative improvements negates much of the purpose of the policy.
What other effects have resulted from cost sharing in education?
As in the case of Ghana, I have not analysed this issue in detail. Given the status of rural and urban poverty in Tanzania it is hard not to believe that the funds which households devote to schooling could have been better applied elsewhere, given the low quality of schools.
Is a policy of cost sharing justified?
The principal problem facing Tanzanian education is the low level of public expenditure on education, less than 3 per cent of GDP. Unlike Ghana, the government of Tanzania has been slow to implement financial management reform and the progress of public sector management reform is slight. Only recently have serious attempts been made to improve revenue collection, but all aspects of resource management remain

weak: Tanzania is still at the time of writing subject to cash budgeting imposed by the IMF after some four years. Moreover, the toll of the war with Uganda, and of security costs associated with the problems in Burundi and Rwanda, have demanded that resources be channeled into the armed forces and the police. There is a high level of non discretionary expenditure in the budget arising from central government borrowing.
At the sectoral level, resource management is fragmented, and the institutions are weak. Financial management has not been a government priority, and the fungibility of aid has probably given the wrong signals to public sector managers. There are many who regard the activities of donors and lenders to education in the country over the last 25 years as having been fundamentally perverse; the high rates of application of foreign technical assistance as having deskilled and demoralised government staff except in so far as there are short term benefits to be gained; and the fungibility of aid finance as having permitted the government to avoid reform.
Tanzania is a good case study of a country with public sector resource management in disarray which should not place cost sharing high on the sectoral policy agenda, but which should concentrate on improving the quality of its public services, raising the level of its public expenditures and improving their structure.
[Previous Page] [Top of Page] [Next Page]

Cost Sharing in Education - Public Finance, School and Household Perspectives - Education Research Paper No. 27, 1998, 141 p.
[Previous Page] [Table of Contents] [Next Page]
V Conclusions for Cost Sharing Policy
A. Cost Sharing in Perspective B. Package of Reforms C. Summary and Conclusions
A. Cost Sharing in Perspective
I have argued in this paper that cost sharing in education does not axiomatically result in qualitative improvements in schools and increased finance for education as a whole. It is not, however, my contention that education should (or can) be exclusively the responsibility of the state: individuals will always face costs. Rather it is the application of cost recovery policies for the wrong reasons and on the basis of inadequately understood evidence and theoretical analysis which must be scrutinised.
The conclusion is based on the study of two countries, and experience differs between countries. Another case study could be that of Kenya, which has been held up as a successful pioneer of cost sharing policies. In some sense that is true, but it is also apparent in Kenya that the cost sharing policy has reached its limits; that enrolment ratios are falling; that quality is deteriorating; that accountability for sectoral performance by sectoral managers has been eroded; and that a major reappraisal of how education is financed in the country is required. The Harambee schools and Institutes, while more reliant than many writers appear to think on state funding, played an important part in the development of education in Kenya, but failure to understand the limitations on private finance has led to a crisis of confidence in the education system, and considerable indebtedness of individuals and institutions.
Cost sharing policies have provided a breathing space which have allowed governments to allocate resources to growth which eventually enable them to assume greater responsibility for financing education systems. Cost sharing does not provide a permanent solution to the problems of financing costly education services in countries with weak fiscal management which have education policies which make unrealistic demands on fiscal and household capacity. While in Kenya the policy has run its course

and requires major modification, other countries such as Tanzania are embarking on similar policies, and should learn the lessons of those who have gone before.144 Once it is accepted that the attractions of cost sharing as a major financial policy instrument are limited, other reappraisals follow, principally policies related to 'community participation'.145
[144 See Lillis K. and H. Ayot, Community Financing of Education in Kenya, in Bray M. with K. Lillis, Community Financing of Education: Issues and Policy Implications in Less Developed Countries, Pergamon Press, 1988, pp 117 - 129, for a well argued, perceptive and prescient analysis, written 10 years ago, of the Harambee system.
145 The best sustained example of scepticism that I know of is Lillis and Ayot op cit. The rest of the book in which the chapter is contained is more ambiguous. However, the message of caution was clear enough.]
One consequence of endorsing cost sharing community based policies is the legitimisation of the cost sharing culture as a response to fiscal stress and inefficient public sector management. By disguising the demands on parents and children in the euphemism of 'participation' the real reasons for cost sharing systems have been obscured. Governments could be bypassed by aid agencies and NGOs, which suited the Bretton Woods institutions' onslaught on government in the late 1980s and first half of the 1990s, and which was consistent with the NGO conception of the world as a place where the rural poor and others were deprived of 'voice'. Government officers could develop community participation policies and thus relinquish responsibility for maintaining large parts of the system.
Another consequence has been the serious deterioration of education infrastructure: in nearly all countries it became - and still is - the norm to expect communities to be responsible for building. Yet infrastructure is expensive in terms of time and money. While communities could reasonably be expected to erect simple temporary or semi-temporary structures, such structures were regarded as permanent by governments, which allocated no resources. Foreign aid agencies frequently financed shells of buildings, to be completed by communities, but in many countries even these were an excessive burden, or simply unsuitable for any number of different reasons. As long as the benefits from education were significant and visible, communities could be mobilised, but when enrolment ratios started to decline it was less likely that communities would take such a strong interest: the reason for declining enrolment ratios were precisely those reasons which reduced enthusiasm for local education development. A vicious spiral of decline set in, and it is now apparent in almost all African countries that the absence of good structures and teachers' houses is a strong factor in enrolment decline. Where teachers have poor living conditions they are absent

or late and demoralised, and this affects parental and children's attitudes to school.
One reason given for failure of community participation is that communities did not have sufficient discretion, and there is much to be said for that view. Where communities feel they can exercise some influence over how schools are run, it is possible that education benefits. However, this is a slightly different (though related) issue from that of how schools are financed. The main issue from a financial point of view is that it is unlikely that any component of the education budget can be entirely handed over to local fund raising. Matching grant and other systems which achieve the same end are likely to give added momentum.146 It is time for government budgets to take on responsibility for infrastructure, at least where there are problems in attracting children to school.
[146 For example, in Zimbabwe the government's matching grant to communities for teachers' houses was too low, and few got built. With foreign aid funds the government contribution was increased in 1995, and there was a significant increase in the number of houses as communities then became able to raise the balance of finance required.]
Similarly, it is now almost received wisdom that textbooks should be rented or purchased by children and parents. Yet the cost of providing children with textbooks is not prohibitive within the perspective of total government expenditure. Failure of government managers and aid agencies to understand the necessary sequencing of reforms and the consequent neglect of public sector management has resulted in education system development projects which ignored the root causes of the apparent inability of the state to finance even the cheapest school inputs. Book provision was long of notorious interest to agencies because of the gains that publishers (and paper companies) could make, and because it is a technically easy way of spending aid budgets. Aid provision of books created a culture, which is persistent, of governments believing that they do not need to cover that expense.
People will always face costs, whether a service is 'free' or not. The issues are the level of those costs and the benefits derived from them. The level of cost is largely determined by government policy, whether the costs are faced by private or state schools. Governments set salary levels and determine the curriculum, the number of subjects and the length of the school year. Competition and consumer pressure can have very little impact on cost, except in the narrowest of senses. The essential components of a cost sharing policy should be (a) to aim at the lowest fee possible and (b) to relate benefits from the fee directly to the fee payer. The first component may seem surprising, but without it there are no constraints on how government determines education costs. It means that before any steps to introduce fees are taken, all other steps which are necessary to reduce costs must be taken, whether they are technical,
such as control over teacher numbers, institutional, such as decentralisation and autonomisation, or political, such as reducing the scope of the curriculum. The more normal approach has the reverse aim, to maximise fees.
B. Package of Reforms
Although the justification of cost sharing policies may be found in their anticipated impact on revenues, efficiency and equity, the public finance and public sector management environment may be hostile. As with other policy reforms, cost sharing should therefore be seen as part of a package of policies, and the pacing and sequencing of implementation should take into account the wide range of factors which influence the supply of education and the demand for it. It is now widely recognised that a key to the success of reform policies is how they are sequenced, especially the order of (a) changes in incentive structures; and (b) changes in institutional structures. Components of cost sharing policy should be as follows, in the order of implementation sequence;
a) public sector reform;
b) sectoral finance and management reform;
c) direct linkage of cost recovery to service improvements.
Within all of these a pattern of incentives should be identified. Reform programmes without incentives to reform have less chance of succeeding. The policy should recognise from the outset the fragility of user fees as a base, and the importance of broad-based tax finance, derived from a progressive tax system. Direct and indirect costs should not have a perverse effect and make the overall incidence of compulsory and quasi-compulsory payments regressive.
Public Sector Reform
There are three critical areas of focus in public sector reform: (a) revenue raising; (b) resource allocation and management; and (c) the reform of institutions and management systems. One of the most serious weaknesses of the Bretton Woods led reform programmes is that these three aspects were ignored or compartmentalised: they conformed to the government systems and structures which themselves needed to be changed. Civil service reform (CSR) and public finance reform are usually two separate programmers, with little connection between them: this has certainly been the case in both Ghana and Tanzania. All the three issues have bearings on the budget deficit, and therefore borrowing and public debt, and, by extension, fiscal stress and cost sharing.

One of the more serious mistakes in adjustment policies was the early concentration on expenditure reductions while ignoring revenue raising.147 Badly designed tax systems and inefficient tax collection lead to higher budget deficits or reduced public expenditures, and consequently can have a serious effect on education expenditures. There is little justification for structural changes to education systems in response to fiscal pressure when possibilities for increased revenue are present: even though revenue measures may take some time to come through (though they need not), structural changes can be irreversible and cause permanent damage. The more common case is gradual erosion of infrastructure and of salaries through cumulative expenditure reductions caused by revenue shortfalls.
[147 Partly due to assumption of the presence of the 'Please Effect', which proposes that improved tax revenue leads to government responses which increase expenditure rather than reduce government dissaving.]
Tax finance is the only sustainable source of finance for education. However, innovative possibilities exist in the form of earmarked taxation and forms of local taxation. Such innovations are not viable if the normal system is weak and not enforced. It is sometimes argued that cost recovery is required precisely because taxation systems are weak, but this is a curious argument, in the same category of argument that has resulted in the profusion of parallel project management and aid delivery systems, many established by foreign aid agencies, on the grounds of government failure. For cost recovery systems to work, government systems must work.
In view of the importance of budget reform it is surprising how little serious effort has been made to make it a priority,148 and while large inflows of foreign aid are available, aid fungibility will continue to threaten that budgets will not be improved. Both the countries in the case studies in this paper have weak state machinery, similar to many developing countries, suffering from inefficiency, low morale and principal-agent problems. Overall public expenditure reform is the major condition underlying all sectoral and sub-sectoral financial interventions. There is no justification for a state to pass on the costs of inefficiency to citizens. While tax finance is often costly and inefficient, supplementary costs of inefficiency are even less acceptable when they are compulsory. In that one of the main reasons, if not the main reason, for the introduction of cost recovery policies, is the failure of public finances to cover the costs of education, the tendency is to take the inefficiencies of public finance management as a given and proceed to raise additional revenues. In most economic adjustment programmes cost recovery has been part of a package of measures to achieve fiscal balance through expenditure reduction, not to improve education quality.
[148 'In virtually no country has fiscal reform enabled the budget to become a real tool for effectively managing the development process',

Gordon D. F., Debt. Conditionality and Reform, in Callaghy T. M. & J. Ravenhill (eds), Hemmed In: Responses to Africa's Economic Decline, Columbia University Press, 1993, p 122.]
Budgets are the most important policy documents of governments: they are approved by parliaments and therefore have legal status. Yet in many countries they do not reflect stated priorities: there is usually a disparity between government's revealed preferences and the policies they present to their own populations and to foreign aid agencies. Expenditure reform must take place through the budget process. Because of the collapse of the budget process in many countries, foreign aid agencies have established parallel structures and accounting systems, but such practices only paper over the cracks and fail to achieve lasting improvements. Therefore, sectoral reform must also take place through the budget process and the normal systems of sectoral management which centres on budget implementation.
A policy of cost sharing in education or other sectors depends for its effectiveness on the strength of public finance management. In that it is generally recognised that cost sharing policies have a greater chance of success under decentralised conditions, local government fiscal systems take on the responsibility for regulation and accountability. Where these have been weak cost sharing has aroused popular resistance, and fees collected are often not accounted for. Similarly, in order for institutions to have autonomy of financial management strong supervisory and audit systems are needed: in their absence autonomisation of institutional management will not be effective, yet that policy is one of the most potentially important in bringing down institutional costs. In other words, wherever we look for interventions which will facilitate service cost reductions and best use of non-tax finances, we see the essential condition of public sector expenditure management reform.
Financial reform cannot take place without an improved quality of civil service. Most countries, including Ghana and Tanzania, have been trying to tackle public sector management and employment issues for some time, but for various reasons with limited success. Manpower decisions are essentially budgetary decisions, and most civil service reforms (CSRs) did not appreciate that link. In both Ghana and Tanzania the systems of recruitment and of budget are independent of each other, and establishment therefore becomes a fixed cost to budget managers. This is particularly important for education sectors which are the largest single civilian employer in every country. Teacher allocation and reallocation should be effected through the budget (preferably by system managers within a decentralised system where decentralisation is an option) and not by central or parallel planning mechanisms, such as are to be found in Sector Development Programmes and CSRs. Efficient staffing is at the heart of a package of reforms which involves cost sharing, for it is only when personnel are properly and efficiently disposed that parents can rightly be asked to contribute outside the tax system.

Sector Finance and Management
The areas of reform described above are necessary conditions and arguably even sufficient conditions for sectoral reform. Sectoral ministries generally have the responsibility for proposing resource allocation, and for making decisions which affect the costs of education. If ministries do not take action to ensure that the costs of education are fiscally realistic and affordable to government and people, the burden of cost sharing becomes heavy and at the same time the quality of infrastructure and instruction declines.
In both Ghana and Tanzania sectoral management systems require major reform at ministerial and decentralised local government levels, and at institutional levels, but such reforms take time and need to be the subject of consensus. Ministries may have weak financial control systems, and resource allocation may be largely incremental and line item based. There are few incentives to perform within hierarchical management systems in which the main criterion for success is survival, and not good performance defined in some sense as a contribution to improving learning outcomes.
Direct Linkage of Cost-Recovery to Service Improvements
As cost recovery takes place at the institutional level, institutions must be able to demonstrate immediate benefits to those who pay, either directly related to the amount of the charge or more generally through service improvements. This should be a central tenet of a cost sharing policy.
Fees are a form of benefit tax, where payment is made for government services which yield direct and identifiable benefits to the payer. Opinion surveys show that people are more willing to pay if they see tangible benefits. In some cases cost recovery policies may even reduce costs to the user of the service. In the health sector payment for drugs can achieve this, because where there are no drugs patients have to wait for longer periods, bribe or pay higher prices in the market place.149 Similarly, it should be possible for central procurement systems to purchase and distribute textbooks more cheaply than leaving it to the market, and it may be efficient and effective for government to provide such a service on a cost recovery basis, although there will tend to be an overhead subsidy which can be justified on the grounds that more textbooks are in the system than would otherwise have been.
[149 See Abel-Smith B. & P. Rawal, Can the poor afford 'free' hearth services? A case study of Tanzania, Health Policy and Planning, Vol. 7 Nr 4 1992, pp 329-341. There is of course a major problem with the argument that because 'services have deteriorated to such an extent that even the poor have to resort to the private sector to obtain services at
much higher cost, charges will be less inequitable than continuing to provide under-financed services..' (p 331). At the time of Abel-Smith's work Tanzania's revenue efforts were very poor indeed.]
Cost sharing policies must therefore be part of wider policy packages designed to address all the issues which make education cost what it does, and which constrain the fiscal capacity of government to support education. There is little sense in imposing cost recovery packages in the absence of wider interventions. They can result in much damage: the decline in enrolments and/or enrolment ratios in many countries confirms the reality of such damage, although there are other reasons for those declines apart from cost.
The lessons for foreign aid agencies are also clear. Donors should be more sceptical of the Bretton Woods prescriptions and their underlying economic arguments.150 They should be more circumspect about cost-benefit data, and about the supposed efficiency and equity effects which accrue from charging fees. They should be more interested in evidence of cost sharing policy success. They should analyse and tackle the underlying reasons for fiscal stress and its effects on education expenditures, and be less preoccupied with developing large-scale projects which fail to fit into a workable sequencing pattern. They should be more interested in genuinely sector-wide reforms rather than fashionable concentration on sub-sectors, at present the primary sector, but sector programmes which are financed in the same way that projects are financed will end up as projects. Their programmes should allow space for 'normal' institutional structures to work, rather than establishing parallel project units, management teams and other parallel systems with enhanced salaries and facilities. Such a change in foreign aid practices would be fundamental, as it would involve reconsideration of their disbursement systems with a move towards direct support to government budgets, and even of the volume of resources they consider necessary.151
[150 Tilak, in Cost Recovery Approaches in Education, op cit, notes how widespread scepticism pushed the World Bank economists into disclaiming their earlier arguments for primary education fees. The World Bank has also gone about in the prevailing wind of scepticism about its earlier health policies. (One notorious example was the case of a study, financed by the World Bank, of cost recovery in health in Kenya, the publication of which was suppressed by the Bank. For the abridged report and a brief account of the affair, see Bloom G. and M. Segall, Expenditure and Financing of the Health Sector in Kenya, IDS, Sussex, 1993).
151 It is this issue which causes difficulties for sector development programmes, which are now the New Jerusalem. While their intentions

may be laudable (though there is good reason to be sceptical), agency procurement and financing regulations, and aid agencies' inherent desire to exert control, make true budget support difficult to achieve, and sector programmes tend to be large projects in disguise. Sector programmes also seek for perfection, usually with the help of liberal doses of consultants, before starting, which diminishes the opportunity for learning and organic growth within sectoral management cultures and structures. Aid agency driven programmes are also impatient, and subject to the disbursement imperative, with aid agents being more interested in spending money than real improvement. There is evident danger of collusion between donor/lender and beneficiary in seeking perverse objectives. A justification for sectoral programmes which is rarely analysed is that they can make fungibility work positively through the budget. While there has been no analysis of the issue, there is good reason to suppose that endogenous growth as a policy objective applies just as much to public sector as to private sector institutions. Competency based and resource based growth theories of the firm have their potential parallels in public sector organisation, and the danger of sectoral programmes is that they do not take account of all the factors which themselves create new disequilibria while at the same time achieving temporary equilibrium. A dynamic process is started which 'encourages continuous growth but limits the rate of growth' (Penrose, E. T. op cit, p 5).]
In summary, cost sharing should not be seen as a way of overcoming institutional and fiscal failure. Its objectives should be specified; its implementation carefully paced and sequenced; and its effects properly evaluated in order to ensure that evidence and not dogma drives policy development.
C. Summary and Conclusions
The argument advanced in this study is that cost sharing policies have not had the effects anticipated by those who introduced them. Without complementing measures, cost sharing will not increase total resources for education, nor will it enhance the efficiency of resource use, as is often proposed, to give more equitable public finance targeting. Cost sharing has undoubtedly contributed strongly to falling and stagnant enrolment ratios where these have occurred, and the failure of cost sharing to improve the supply of learning inputs and better infrastructure is part of a wider failure to achieve good quality education service provision in many countries. The wider social and economic effects of cost sharing are little understood. This study concludes that there has been little justification to support the introduction of cost sharing policies, and is critical of the linkage which was made between foreign aid entitlement and cost

sharing as part of the wider, mainly Bretton Woods Institution, project of rapid public expenditure reductions.
There are six broad and related reasons for failure of cost sharing policies.
First, the fungibility of money from cost sharing and foreign aid has permitted governments to avoid difficult reform decisions. User fees, less obvious compulsory payments, and direct intergovernmental transfers through foreign aid acted as a buffer against poor public sector management. Governments could then maintain higher than necessary spending on external and internal security, loss making parastatals, and other manifestations of extensive government machinery, including excessive teaching forces. Governments, which themselves failed to raise adequate revenues from taxation, required its citizens to make what are essentially tax payments outside their tax systems, consolidating regressive taxation and bypassing public accountability. Moreover, the endorsement of such policies by foreign aid agencies and others gave legitimacy to related policies such as 'community participation' which included the devolution of responsibility to communities for school building and maintenance: this has resulted in the slow but sure deterioration of infrastructure. Payers of user fees and other charges have, in effect, subsidised government failure. Cost sharing may have contributed to the inefficiency and lack of effectiveness of education service delivery more than to its improvement. It might be tempting to qualify this conclusion with the observation that cost sharing is unlikely to have such a significant effect because of the relatively small sums of money involved: while this study has shown that the sums are larger than generally supposed, it is important to realise that cost sharing is an impact at the margin.
Second, the underlying reasons for cost sharing related to fiscal stress and the need to fill a fiscal gap, rather than to augmenting resources within an efficient system to achieve a more equitable public spending pattern, as is argued in the literature. Fiscal stress implies that the education system is probably underfunded and/or inefficient, and that the quality of service delivered is poor. At the level of the household survey evidence suggests that primary education is among the most discretionary of household expenditures and therefore an early expenditure foregone in times of household cash budgetary stress. At the level of the school near total reliance on parental contributions for non-salary expenditures, particularly those on learning inputs, meant that schools fell into debt or had to operate with insufficient resources to provide quality raising inputs. People do not want to pay for a poor service, and as direct and indirect charges did not improve the service, demand for schooling stagnated.
Third, the rigidities of public finance systems were not sufficiently taken into account. The reallocation effects which for many are the underlying rationale for cost sharing did not occur: charging the 'rich' did not result in more resources for the 'poor', and the supposed equity enhancements were not realised. A further reason for the failure to
reallocate from higher education to primary education was that any cost reduction measures were welcomed by Ministries of Finance and by the Bretton Woods Institutions as contributions to overall reductions in public expenditures, particularly in the early years of stabilisation and adjustment when rapid expenditure reduction rather than revenue growth were priorities. Moreover, higher education is a very political sub-sector, and difficult to rationalise.
Fourth, the timing of reform was often inappropriate. Policies were introduced during times of growing economic difficulties compounded by squeezes on public expenditure: in some places, such as Zambia, during a time of severe drought and major epidemic. In periods of economic difficulty, employment opportunities are reduced, and the costs of education outweigh perceived benefits, in spite of the misleading arguments derived from cost benefit analysis. People did not want to pay for a poor service which did not lead to employment.
Fifth, during the period of economic adjustment inappropriate policy initiatives pushed up costs, such as a too rapid attempt to introduce Universal Primary Education, '20/20' aid formulae, project based initiatives which expanded curricula and syllabuses, extensions to the basic education cycle, and other measures which could not be afforded from domestic resources, and which there was little likelihood of being affordable in the foreseeable future. These and other initiatives which required external financing to support them were not located in a package of measures necessary to ensure that cost sharing was introduced alongside quality improvement of the education service. Donors and lenders concentrated on narrow projects and were preoccupied with targeted aid, and ignored the connections between policy actions.
Finally, the simplistic assumptions of economic rationality which underlie neo-classical economic theories of demand for a service such as education, and on which much foreign aid policy is based (for foreign aid has for the most part been the main driver of cost recovery policies), could not absorb cultural aspects of demand, and for that and other reasons the orthodox theoretical basis of cost sharing is a poor guide to policy.
This paper has argued that as a consequence of these effects, cost sharing policies have combined with other factors to interrupt enrolment growth (with declines in enrolment ratios and in some cases of absolute enrolment levels taking place in many African countries), and have contributed to the decline in the quality of education services. A properly paced and sequenced package of reform should focus first on bringing the costs of education to manageable levels, with priority given to minimising the costs to households rather than maximising them, as has tended to be the case explicitly or implicitly; and second to structuring education systems so that they can be afforded by governments without excessive dependence on foreign aid, particularly where that aid involves borrowing, no matter how concessional the interest rates.

This study has explored most of the aspects of cost sharing and cost recovery. It argues that the economic basis of many of the arguments for cost sharing policies is simplistic and part of a wider agenda of transferring costs from government to people outside the tax system, often in untransparent and unaccountable ways. Irrespective of how households make choices, the aggregate effect seems to have been that cost sharing has contributed to a stagnation in enrolment ratios and failure to improve the quality of educational provision, and that it has enabled governments to avoid difficult reforms. There is already considerable evidence of the damage that cost sharing policies have had on health care systems and the health of populations, such as rising rates of resistance to antibiotics as people cannot afford to purchase full courses, and it is hoped that this study will raise serious questions about the near and long term effects of those policies on education systems and the opportunities for populations to improve their knowledge and skills.
Perran PenrosePenquite HouseCornwall 1997
[Previous Page] [Top of Page] [Next Page]

Cost Sharing in Education - Public Finance, School and Household Perspectives - Education Research Paper No. 27, 1998, 141 p.
[Previous Page] [Table of Contents]
Bibliography Abel-Smith B. & P. Rawal, Can the poor afford 'free' health services? A case study of Tanzania, Health Policy and Planning, Vol. 7 Nr 4 1992, pp 329-341
Agrawal N. & al, Structural Adjustment, Economic Performance, and Aid Dependency in Tanzania, Policy Research Working Paper WPS 1204, World Bank, October 1993
Alderman H, et al, 'Unitary Versus Collective Models of the Household: Is it time to shift the burden of proof?', The World Bank Research Observer, Vol. 10, nr 1, Feb 1995, pp 1 - 19
Andrea G. S. S. Financing Education and Health at Local Government Level. A Comparison of Dodoma Rural District and Morogoro Municipal Councils, Working Paper Nr 2, Local Government Support Unit, Prime Minister's Office, DSM, Feb 1996
Armitage J. and R. Sabot, 'Efficiency and Equity Implications of Subsidies to Secondary Education in Kenya', in Newbery D. and N Stern (eds), The Theory of Taxation for Developing Countries, OUP, 1987
Bacchus K. & I. Farah, Tensions Between Economies and Culture in the Provision of Education for Girls, Institute for Educational Development, Aga Khan University, Karachi, 1995, paper presented to the conference 'Tensions Between Economics and Culture', University of London Institute of Education, 1994
Bauer P. T. Dissent on Development, Wiedenfield and Nicolson, 1971
Becker, G. The Economic Approach to Human Behaviour, Chicago, 1976
Behrman J. R. 'Human Capital Formation, Returns and Policies: Analytical Approaches and Research Questions', Journal of International Development, Vol. 8, Nr 3, 1996, pp 341-373
Bennell P, Using and Abusing Rates of Return: A Critique of the World Bank's 1995 Education Sector Review, IDS Working Paper Nr 22, Sept 1995
Bennett S., The Relationship Between Public and Private Systems in Health Care, Health Policy Unit, London School of Hygiene and Tropical Medicine, 1994, paper prepared for the Workshop on the Social and Economic Effects of Alternative Methods of Financing Education and Health Services in Developing Countries, Institute of Development Studies, Sussex, March 1994
Bertrand T. and R. Griffin, The Economics of Financing Education. A Case Study of Kenya, World Bank Staff Working Paper Nr 402, 1983
Best M, The New Competition, Polity Press, 1990
Bird R. M, Charging for Public Services. A New Look at an Old Idea, Canadian Tax Foundation, 1976
Birdsall N, 'Pragmatism, Robin Hood and Other Themes: Good Government and Social Well-Being in Developing Countries', in Chen L. C, A. Kleinman and N. C. Ware (eds), Health and Social Science in International Perspective, Harvard University Press, 1993
Blaug M, 'The Empirical Status of Human Capital Theory: A Slightly Jaundiced Survey', in Journal of Economic Literature, Vol. 14, Nr 3, Sept 1976, pp 827-855
Blaug M, Education and the Employment Problem in Developing Countries, ILO, 1973
Bloom G. and M. Segall, Expenditure and Financing of the Health Sector in Kenya, IDS, Sussex, 1993
Booth D, J. Milimo, G. Bond, & al, Coping with Cost Recovery in Zambia, SIDA, 1994.
Booth D. & al, Social, Economic and Cultural Change in Tanzania, SIDA, 1993
Bray M, Community Financing of Schools in Less Developed Countries: Rationales, Mechanisms and Policy Implications, paper prepared for the Workshop on the Social and Economic Effects of Alternative Methods of Financing Education and Health Services in Developing Countries, Institute of Development Studies, Sussex, March 1994
Bray M. and K. Lillis (eds), Community Financing of Education. Issues and Policy Implications in Less Developed Countries, Pergamon Press, 1988.
Bray, M, Counting the Full Cost: Parental and Community Financing of Education in

East Asia, World Bank, 1996
Bray, M, Decentralisation of Education: Community Financing, World Bank, 1996
Buchanan J, Cost and Choice, University of Chicago Press, 1977
Bulmer M, J. Lewis & D. Piachaud (eds), The Goals of Social Policy, Unwin Hyman, 1990
Carnoy M. and C. Torres, Educational Change and Structural Adjustment: A Case Study of Costa Rica, UNESCO, September 1992
Cassen R. and Associates, Does Aid Work?, Clarendon Press, 1987
Colclough C, Raising Additional Resources for Education in Developing Countries: Are Graduate Payroll Taxes Preferable to Student Loans?, International Journal of Educational Development, Vol. 10 Nr 2, pp 169 - 180
Colclough C. & J. Manor, States or Markets? Neo-liberalism and the Development Policy Debate, Clarendon Press, 1991, pp 197-213
Colclough C, Who Should Learn to Pay? An Assessment of Neo-liberal Approaches to Education Policy in Colclough C. & J. Manor, States or Markets? Neo-liberalism and the Development Policy Debate, Clarendon Press, 1991, pp 197-213
Colclough C. (ed), 'Marketizing Education and Health in Developing Countries: Miracle or Mirage?', Clarendon Press, Oxford, 1997 (in press)
Cooksey B. & al, A Survey of Living and Working Conditions of Primary and Secondary School Teachers on Mainland Tanzania, 1991
Creese A, User Charges for Health Care: A Review of Recent Experience, in Health Policy and Planning, Vol. 6 Nr 4, 1991, pp 309 - 319
Creese A. and J. Kutzin, Lessons from Cost Recovery in Health, World Health Organisation, 1994, paper prepared for the Workshop on the Social and Economic Effects of Alternative Methods of Financing Education and Health Services in Developing Countries, Institute of Development Studies, Sussex, March 1994
Curtin T. The Economics of Public Investment in Education in Papua New Guinea, University of Papua New Guinea Press, 1991

Demery et al, The Incidence of Social Spending in Ghana, World Bank mimeo, Sept 1995
Deolalikar A. B. The Demand for Schooling Quantity and Quality in Tanzania: A Note, mimeo, April 1994
Dore R, The Future of Formal Education in Developing Countries, in Simmons J. (ed) The Education Dilemma: Policy Issues for Developing Countries in the 1980s, Pergamon, 1980, pp 72-73
Doriye J. & M. Wuyts, Aid, Adjustment and Sustainable Recovery, Institute of Social Studies, The Hague, March 1992
Eliot T. S. Modern Education and the Classics, in Selected Essays, Faber & Faber, 1966
Foster P. Education and Social Change in Ghana, Kegan Paul, 1965
Gardner P. Schooling. Markets and Public Agency 1833-1944, in Bridges, D. and T. H. McLaughlin (eds), Education and the Market Place, The Falmer Press, 1994
Gertler P. and J. Van der Gaag, The Willingness to Pay for Medical Care, Johns Hopkins, 1990
Ghana Statistical Service, Ghana Living Standards Survey: Report on Third Round, Accra, March 1995
Glewwe P. Schooling, Skills, and the Returns to Government Investment in Education: An Exploration Using Data from Ghana, LSMS Working Paper Nr 76, World Bank, 1991
Gordon D. F. Debt, Conditionality and Reform, in Callaghy T. M. & J. Ravenhill (eds), Hemmed In Responses to Africa's Economic Decline, Columbia University Press, 1993
Goulet D, The Cruel Choice. A New Concept in the Theory of Development, New York: Athenaeum, 1971
Halsey A. H, A. F. Heath and J. M. Ridge, Origins and Destinations: Family, Class and Education in Modern Britain, Clarendon Press, 1980
Hinchliffe K, Neo-liberal Prescriptions for Education Finance: Unfortunately Necessary or Inherently Desirable? in International Journal of Educational Development, 1993,
Vol. 13, Nr 2, pp 183-187
Hirsch F, Social Limits to Growth, Routledge and Kegan Paul, 1977
Hodgson G, Economics and Institutions, Polity Press, 1988
Hodgson G, Economics and Evolution, Polity Press, 1993
James E, Public Policies Towards Private Education. An International Comparison, International Journal of Education Research, Vol. 15, 1987
Jimenez E, Pricing Policy in the Social Sectors Cost Recovery in for Education and Health in Developing Countries, Johns Hopkins University Press, 1987
Johnes G, The Economics of Education, MacMillan, 1993
Jones C. and Y Xiao, Understanding Poverty Trends in Ghana, 1988-92, World Bank, May 1995, draft;
Karani F. A. & al, Cost and Financing of Education in Kenya. Study 2 - Access, Quality and Equity in Secondary Education, MOE, Dec 1995
Kenya Central Statistics Office, Welfare Monitoring Survey 1993
Knight J. B. and R. H. Sabot, Education, Productivity and Equality. The East African Natural Experiment, OUP, 1990
Kraus J. The Political Economy of Stabilisation and Structural Adjustment in Ghana, in Rothchild D, Ghana: The Political Economy of Recovery, Lynne Rienner Publishers, 1991, pp 119-156
Kroma S, Factors Influencing School Enrollment and Attendance in Rural Communities in Sierra Leone, (mimeo) Njala University College, Sierra Leone, December 1993
Lavy V, Investment in Human Capital, Schooling Supply Constraints in Rural Ghana, LSMS Working Paper Nr 93, World Bank, 1992
Levhari D. and Y. Weiss, 'The Effect of Risk on the Investment in Human Capital', American Economic Review, Vol. 64, Nr 6, December 1974
Lillis K. and H. Ayot, Community Financing of Education in Kenya, in Bray M. with K. Lillis, Community Financing of Education: Issues and Policy Implications in Less Developed Countries, Pergamon Press, 1988, pp 117 - 129
Lloyd, C. B. & A. J. Gage-Brandon, Does Sibsize Matter? The Implications of Family Size for Children's Education in Ghana, in Ardayfio-Schandorf, E. Family and Development in Ghana, Ghana Universities Press, Accra, 1994, pp 123-159
Loasby B. Equilibrium and Evolution: An Exploration of the Connecting Principles in Economics, Manchester University Press, 1991
Lockheed M. E, Verspoor A. M. and associates, Improving Primary Education in Developing Countries, OUP/World Bank, 1991
Malekela G. A., Teacher Quality and Motivation, UDSM Dept of Educational Foundations, paper prepared for the TADREG workshop 'Quality and Equity Issues in Tanzanian Education Policy and Practice: Insights from Recent Research', December 1993
Maliyamkono T. L. & M. S. Bagachwa, The Second Economy in Tanzania, James Currey, 1990
Mason A. D. and S. R. Khandker, Household Schooling Decisions in Tanzania, World Bank Poverty and Social Policy Dept, July 1995
Mbilinyi M, Big Slavery: Agribusiness and the Crisis in Women's Employment, DSM University Press, 1991, p 9 23-24
Mills A, Improving the Efficiency of Public Sector Health Services in Developing Countries: Bureaucratic vs Market Approaches, paper prepared for the Workshop on the Social and Economic Effects of Alternative Methods of Financing Education and Health Services in Developing Countries, Institute of Development Studies, Sussex, March 1994
Ministry of Education, Tanzania, Tanzania Education and Training Policy, March 1995
Musgrove F. Education and Anthropology: Other Cultures and the Teacher, John Wiley, 1982
Ndabi D. M. & S. A. C. Waane, School Quality and Performance, paper prepared for the TADREG workshop on 'Qualify and Equity Issues in Tanzanian Education Policy & Practice: Insights from Recent Research', DSM, December 1993

Omari I, P. N. Materu & T. Mteleka, Rationalisation of the Tertiary Education and Training Sector in Tanzania, Ministry of Science, Technology and Higher Education, Draft, March 1996
Omari C. K, Tanzania Household and Community Structures and Dynamics, mimeo, University of Dar es Salaam Sociology Dept, 1994
Pack H. and J. R. Pack, Foreign Aid and the Question of Fungibility, The Review of Economics and Statistics, 1993, pp 258 - 265
Palme M, Being Respected but Teaching Hieroglyphs addressing the question of the primary school teacher, culture and local community in rural Mozambique, paper presented to the conference 'Tensions Between Economics and Culture', University of London Institute of Education, 1994
Peil M, Ghanaian Education as Seen from an Accra Suburb, International Journal of Educational Development, Vol. 15 Nr 3, 1995, pp 289-305
Penrose E. T. The Theory of the Growth of the Firm, John Wiley and Sons, New York, 1959
Penrose P. Review of Public Expenditures in the Education Sector: Tanzania, Commission of the European Communities, July 1992
Penrose P. Review of Public Expenditures on Education in Viet Nam, UNDP/Ministry of Finance, Hanoi, 1995
Penrose P. & al, Evaluation of the EU Structural Adjustment Support Programme in Zambia, Evaluation Unit, DGVIII, Brussels, August 1996
Penrose P. & al, Evaluation of EU Adjustment Programme in Zimbabwe, Evaluation Unit, DGVIII, Brussels, July 1997
Penrose P. Budgeting and Expenditures in the Education Sector in Ghana, EC/Ministry of Education, April 1996
Penrose, P. Expenditures on Training, chapter in World Bank, Kenya Public Expenditure Review, 1994
Plan Consult, Manpower Survey, Graduate Tracer Study, Accra, Sept 1995

Psacharapoulos G. and M. Woodhall, Education for Development: An Analysis of Investment Choices, OUP, 1985
Psacharopoulos G. 'Returns to Investment in Education: A Global Update', World Development Vol. 22, Nr 9, pp 1325-1343
Sahn D. E, Public Expenditures fin Sub-Saharan Africa During a Period of Economic Reform, World Development, Vol. 20, nr 5, pp 673 - 693
Schiefelbein E, Restructuring Education through Economic Competition: The Case of Chile, Journal of Educational Administration, Vol. 29, Nr 4, 1991
Serpell R. The Significance of Schooling: Life-journeys in an African society, Cambridge University Press, 1996
Stern N. Comment on Social Sector Pricing Policy Revisited, Proceedings of the World Bank Annual Conference on Development Economics, 1989, pp 139 - 142
Stirrat R. L, Economics and Culture. Notes Towards an Anthropology of Economics, School of African and Asian Studies, University of Sussex, 1994, paper presented to the conference 'Tensions Between Economics and Culture', University of London Institute of Education, 1994
Sumra S, Primary Education and the Urban Poor: A Study of Parental Attitudes Towards Schooling in the Buguruni and Vinguguti Wards in Dar-es-Salaam, PLAN International, 1993
Sumra, S, Democratising School Management: Making Community Participation a Reality in Primary Schooling in Tanzania, Faculty of Education, UDSM, 1993, paper prepared for the TADREG workshop on 'Qualify and Equity Issues in Tanzanian Education Policy & Practice: Insights from Recent Research', DSM, December 1993
TADREG, Parent's Attitudes Towards Education in Rural Tanzania, TADREG Research Report Nr 5, November 1993
Tan, J-P, K. H. Lee and A. Mingat in User Charges for Education: The Ability and Willingness to Pay in Malawi, World Bank Staff Working Paper Nr 661, 1984
Taylor W, Metaphors of Educational Discourse, in Taylor W. (ed) Metaphors of Education, Heinemann Educational Books & University of London Institute of Education, 1984
Technology Centre of the University of Science and Technology, Kumasi, Socio-Economic Background of Students in Tertiary Institutions in Ghana, 1995 draft
Teja R. S. and B. Bracewell-Milnes, The Case for Earmarked Taxes, IEA Research Monograph Nr 46, 1991
Thobani M, Charging User Fees for Social Services. The Case of Education in Malawi, World Bank Staff Working Paper Nr 572, 1983.
Tilak J. B. G. Cost Recovery Approaches in Education, paper prepared for the Workshop on the Social and Economic Effects of Alternative Methods of Financing Education and Health Services in Developing Countries, Institute of Development Studies, Sussex, March 1994
Tilak J. B. G. Family and Government Investments in Education, International Journal of Educational Development, Vol. II, Nr 2, pp 91-106
Tullock G. The Politics of Bureaucracy, Public Affairs Press, Washington DC, 1965
Uganda Central Statistics Office, Report on the Uganda National Integrated Household Survey, 1992-93
Vylder S. Children's Rights, Development Strategies and Macroeconomic Policies, Radda Barnen, January 1995
Waddington C. J. and K. A. Enyimayew, A Price to Pay: The Impact of User Charges in the Volta Region of Ghana, Parts I & II, International Journal of Health Planning and Management, Vol. 4 Nr 1, 1989, pp 17 - 47, and Vol. 5 Nr 4, 1990, pp 287-312.
West E. G. Education and the Industrial Revolution, Batsford, 1975
World Bank, Access to Education and Health Care in Uganda, June 1996
World Bank, Country Economic Memorandum of 1995, Ghana: Growth, Private Sector and Poverty Reduction, May 1995
World Bank, Teachers and the Financing of Education in Tanzania, Population and Human Resources Division, December 1991
World Bank, Tanzania. A Poverty Profile, 1993
World Bank, Kenya Public Expenditure Review, 1994
World Bank, Priorities and Strategies for Education: A World Bank Review, August 1995
World Bank, Tanzania Social Sector Review (draft), 1994
World Bank, Post-Primary Education and Training in Tanzania. Investments, Returns and Future Opportunities, draft, 1996
Zambia Central Statistics Office, Social Dimensions of Adjustment Priority Survey I, Lusaka, 1992, and Priority Survey II (1994)
[Previous Page] [Top of Page]