Cost of injury-2015
177
-
Upload
terry-penney -
Category
Leadership & Management
-
view
625 -
download
1
Transcript of Cost of injury-2015


THE COST OF INJURY IN CANADA
June 2015
In collaboration with:
!
Funding provided by:
!
Suggested citation:
Parachute. (2015). The Cost of Injury in Canada. Parachute: Toronto, ON
Copyright 2015
Version 1.1 - 4 June 2015

ACKNOWLEDGEMENTS We would like to extend our sincere gratitude to the members of the Advisory Committee for their contributions of time and expertise:
Kathy Belton, Injury Prevention Centre, School of Public Health, University of Alberta
Dr. Ian Pike, BC Injury Prevention Research & Prevention Unit
Jennifer Heatley, Nova Scotia Department of Health and Wellness
Dr. Eden Cloutier, Hygeia Group
Robin Skinner, Public Health Agency of Canada
This report would not be possible without the valuable and significant collaboration from The Conference Board of Canada, specifically through the leadership and expertise from:
Louis Theriault, Vice-President, Public Policy
Greg Sutherland, Senior Economist
Fares Bounajm, Economist
The Public Health Agency of Canada has been a supporter of previous Economic Burden of Injury in Canada reports and has again supported this important work.
Thanks to the members of the Canadian Collaborating Centres for Injury Prevention (CCCIP) for their contributions to the provincial chapter introductions.
Acknowledgements ! i

TABLE OF CONTENTS Acknowledgements i .......................................................................................
Table of Contents ii ..........................................................................................
List of Tables vii ...............................................................................................
List of Figures xi ..............................................................................................
EXECUTIVE SUMMARY 1 ......................................................................................Introduction 1..........................................................................................................Total cost of injury 3.................................................................................................Injury by cause 4......................................................................................................Population by age cohort, Canada, 2010 and 2035 5...........................................Cost of injury by cause 6.........................................................................................Injury by province 7.................................................................................................Conclusion 8.............................................................................................................
INTRODUCTION 9 ..............................................................................................
INJURY IN CANADA 14 .......................................................................................Total cost of injury 14...............................................................................................Direct and indirect costs 14.....................................................................................Intentional and unintentional injury 15................................................................Injury by cause 19....................................................................................................Costs of injury by cause 21.....................................................................................
Falls 24.................................................................................................................Transport injuries 28.........................................................................................Intentional injuries 32.......................................................................................
Provincial comparison of age/sex standardized injury mortality rates 39.....Cost of injury by province 41.................................................................................
Table of Contents ! ii
The Cost of Injury in Canada 2015
Forecasting the Future 43.......................................................................................Population by age cohort, Canada, 2010 and 2035 43...................................Seniors’ falls 44...................................................................................................Speed reduction (transportation) 46................................................................Sports & recreation (head injury) 48................................................................
Provinces 50..............................................................................................................Territories 50.............................................................................................................
ALBERTA 51 ......................................................................................................Total cost of injury 52...............................................................................................Direct and indirect costs 53.....................................................................................Intentional and unintentional injury 53................................................................Injury by cause 54...................................................................................................Transport-related injuries by cause and associated costs 58..............................Fall-related injuries by cause and associated costs 58........................................Intentional injuries by cause and associated costs 59.........................................
BRITISH COLUMBIA 61 ........................................................................................Total cost of injury 63...............................................................................................Direct and indirect costs 64.....................................................................................Intentional and unintentional injury 64................................................................Injury by cause 65...................................................................................................Cost of injury by cause 67.......................................................................................Transport-related injuries by cause and associated costs 69..............................Fall-related injuries by cause and associated costs 70........................................Intentional injuries by cause and associated costs 70.........................................
MANITOBA 72 ...................................................................................................Total cost of injury 73...............................................................................................Direct and indirect costs 74.....................................................................................Intentional and unintentional injury 74................................................................Injury by cause 75....................................................................................................Transport Incidents causes and associated costs 79............................................Falls by cause and associated costs 80..................................................................
Table of Contents ! iii

The Cost of Injury in Canada 2015
Intentional injuries by cause and associated costs 81.........................................
NEW BRUNSWICK 82 .........................................................................................Total cost of injury 83...............................................................................................Direct and indirect costs 84.....................................................................................Intentional and unintentional injury 84................................................................Injury by cause 85....................................................................................................Costs of injury by cause 87.....................................................................................Transport-related injuries by cause and associated costs 89..............................Fall-related injuries by cause and associated costs 89........................................Intentional injuries by cause and associated costs 90.........................................
NEWFOUNDLAND AND LABRADOR 91 ..................................................................Total cost of injury 92...............................................................................................Direct and indirect costs 92.....................................................................................Intentional and unintentional injury 92................................................................Injury by cause 93....................................................................................................Costs of injury by cause 96.....................................................................................Transport-related injuries by cause and associated costs 97.............................Fall-related injuries by cause and associated costs 98.......................................Intentional injuries by cause as associated costs 99............................................
NOVA SCOTIA 100 ..............................................................................................Total cost of injury 101.............................................................................................Direct and indirect costs 102...................................................................................Intentional and unintentional injury 102..............................................................Injury by cause 103..................................................................................................Costs of injury by cause 105...................................................................................Transport-related injuries by cause and associated costs 107............................Fall-related injuries by cause and associated costs 108......................................Intentional injuries by cause and associated costs 109.......................................
ONTARIO 110 ....................................................................................................Total cost of injury 112.............................................................................................
Table of Contents ! iv

The Cost of Injury in Canada 2015
Direct and indirect costs 112...................................................................................Intentional and unintentional injuries 113...........................................................Injury by cause 114...................................................................................................Costs of injury by cause 116.................................................................................... Transport-related injuries by cause and associated costs 118...........................Fall-related injuries by cause and associated costs 118.......................................Intentional injuries by cause and associated costs 119.......................................
PRINCE EDWARD ISLAND 121 ..............................................................................Total cost of injury 122.............................................................................................Direct and indirect costs 123...................................................................................Intentional and unintentional injury 123..............................................................Injury by cause 124..................................................................................................Cost of injury by cause 126.....................................................................................Transport-related injuries by cause and associated costs 128............................Fall-related injuries by cause and associated costs 129......................................Intentional injuries by cause and associated costs 129.......................................
QUEBEC 131 ......................................................................................................Total cost of injury 132.............................................................................................Direct and indirect costs 132...................................................................................Intentional and unintentional injury 132..............................................................Injury by cause 134..................................................................................................Costs of injury by cause 136...................................................................................Transport-related injuries and associated costs 138............................................Fall-related injuries by cause and associated costs 138......................................Intentional injuries by cause and associated costs 139.......................................
SASKATCHEWAN 141 ..........................................................................................Total cost of injury 143.............................................................................................Direct and indirect costs 143...................................................................................Intentional and unintentional injury 143..............................................................Injury by cause 145..................................................................................................Costs of injury by cause 147...................................................................................
Table of Contents ! v

The Cost of Injury in Canada 2015
Transport-related injuries and associated costs 149............................................Fall-related injuries and associated costs 149.......................................................Intentional injuries by cause and associated costs 150.......................................
APPENDIX 1: Methodology 152 ...........................................................................Economic approach 152...........................................................................................Incidence costing 152...............................................................................................Human capital 153...................................................................................................The Electronic Resource Allocation Tool (ERAT) 155.........................................Modelling and estimation techniques 155............................................................Data sources and definitions 156...........................................................................Injury death data 157...............................................................................................Hospitalized injuries 158.........................................................................................Emergency room visits 158.....................................................................................Disability 159............................................................................................................Population denominators 159................................................................................Caveats and data limitations 159..........................................................................
Appendix 2: ICD-10 Code Classifications by Detailed Cause 162 ............................Unintentional injuries 162.......................................................................................Intentional injuries 163............................................................................................
Appendix 3: External Causes Included in Other Unintentional Injuries 164............
Table of Contents ! vi

LIST OF TABLES TABLE 1: Total Cost of Injury, Canada, 2010 14 ............................................................................
TABLE 2: Percentage change in standardized injury death rates, 2004 to 2010 17 ..........................
TABLE 3: Economic cost of hospitalized injuries, 2010 vs 2004 17 .................................................
TABLE 4: Economic cost of injuries seen in emergency rooms, 2010 vs 2004 18 .............................
TABLE 5: Total economic cost, 2010 vs 2004 18 ...........................................................................
TABLE 6: Number of injury deaths, hospitalizations, emergency room visits and related disability cases by cause, Canada, 2010 19 ....................................................................
TABLE 7: Total, direct and indirect costs of injury by cause, Canada, 2010 22 .................................
TABLE 8: Number of injury deaths, hospitalizations, and emergency room visits for falls, Canada, 2010 24
TABLE 9: Rates of injury deaths, hospitalizations, and emergency room visits due to falls by age and sex, Canada, 2010 25 ............................................................................................
TABLE 10: Total, direct, indirect, and per capita cost of falls by age and sex, Canada, 2010 26 ..........
TABLE 11: Direct, indirect, and total costs for falls, Canada, 2010 27 ...............................................
TABLE 12: Number of injury deaths, hospitalizations, and emergency room visits for transport incidents, Canada, 2010 28 ..........................................................................................
TABLE 13: Rates of death, hospitalization, non-hospitalization, and permanent disability for transport incidents by age and sex, Canada, 2010 29 .....................................................
TABLE 14: Total, direct, indirect, and per capita costs of injury due to transport incidents by age and sex, Canada, 2010 31 .......................................................................................
TABLE 15: Direct, indirect, and total costs for injury from transport incidents, by cause, Canada, 2010 ($ Millions) 32 ........................................................................................
TABLE 16: Injury deaths, hospitalizations, and emergency room visits by intent, Canada, 2010 33 ...
TABLE 17: Injury costs by intent, Canada, 2010 ($ Millions) 33 .......................................................
TABLE 18: Rates of death, hospitalization, non-hospitalization, and permanent disability for suicide/self-harm by age and sex, Canada, 2010 34 ......................................................
TABLE 19: Total, direct, indirect, and per capita costs of injury due to suicide/self-harm incidents by age and sex, Canada, 2010 35 ....................................................................
List of Tables ! vii
The Cost of Injury in Canada 2015
TABLE 20: Rates of death, hospitalization, emergency room visits, and permanent disability for violence by age and sex, Canada, 2010 37 ................................................................
TABLE 21: Total, direct, indirect, and per capita costs of injury due to violence by age and sex, Canada, 2010 38 ...................................................................................................
TABLE 22: Age/sex standardized mortality rates by cause of injury, Canada and by province, 2010 39
TABLE 23: Age/sex standardized injury mortality rates by cause, Canada, highest and lowest province, 2010 40
TABLE 24: Economic cost, health care costs & potential years of life lost, Canada & by province, 2010 41
TABLE 25: Economic cost, direct costs, and PYLL of injury, Canada and highest and lowest province, 2010 41
TABLE 26: Summary of findings, all injury, Alberta, 2010 53 .........................................................
TABLE 27: Injury by intent, Alberta, 2010 53 ................................................................................
TABLE 28: Total, direct and indirect costs by intent of injury, Alberta, 2010 54 ................................
TABLE 29: Injury deaths, hospitalizations, and emergency room visits by cause, Alberta, 2010 55 ....
TABLE 30: Mortality, crude death rates (per 100,000 pop.) and total cost per capita by cause, Alberta, 2010 56
TABLE 31: Total, direct, and indirect costs of injury by cause, Alberta, 2010 57 ...............................
TABLE 32: Summary of findings, all injury, British Columbia, 2010 64 ............................................
TABLE 33: Injury by intent, British Columbia, 2010 64 ..................................................................
TABLE 34: Total, direct, and indirect costs by intent of injury, British Columbia, 2010 65 ..................
TABLE 35: Injury deaths, hospitalizations, and emergency room visits by cause, British Columbia, 2010 66 ......................................................................................................
TABLE 36: Mortality, crude death rates (per 100,000 pop.) and total cost per capita by cause, British Columbia, 2010 67 ............................................................................................
TABLE 37: Total, direct, and indirect costs of injury by cause, British Columbia, 2010 68 ..................
TABLE 38: Summary of findings, all injury, Manitoba, 2010 74 .......................................................
TABLE 39: Injury by intent, Manitoba, 2010 74 .............................................................................
TABLE 40: Total, direct, and indirect costs by intent of injury, Manitoba, 2010 75 .............................
TABLE 41: Injury deaths, hospitalizations, and emergency room visits by cause, Manitoba, 2010 76 .....................................................................................................................
List of Tables ! viii
The Cost of Injury in Canada 2015
TABLE 42: Mortality, crude death rates (per 100,000 pop.) and total cost per capita by cause, Manitoba, 2010 77 ......................................................................................................
TABLE 43: Total, direct, and indirect costs of injury by cause, Manitoba, 2010 78 .............................
TABLE 44: Summary of findings, all injury, New Brunswick, 2010 83 ..............................................
TABLE 45: Injury by intent, New Brunswick, 2010 84 ....................................................................
TABLE 46: Total, direct, and indirect costs by intent of injury, New Brunswick, 2010 85 ...................
TABLE 47: Injury deaths, hospitalizations, and emergency room visits by cause, New Brunswick, 2010 86 ..............................................................................................
TABLE 48: Mortality, crude death rates (per 100,000 pop.) and total cost per capita by cause, New Brunswick, 2010 87 .............................................................................................
TABLE 49: Total, direct, and indirect costs of injury by cause, New Brunswick, 2010 88 ...................
TABLE 50: Summary of findings, all injury, Newfoundland and Labrador, 2010 92 ...........................
TABLE 51: Injury by intent, Newfoundland and Labrador, 2010 93 .................................................
TABLE 52: Total, direct, and indirect costs by intent of injury, Newfoundland and Labrador, 2010 93 ......................................................................................................................
TABLE 53: Injury deaths, hospitalizations, and emergency room visits by cause, Newfoundland and Labrador, 2010 94 ................................................................................................
TABLE 54: Mortality, crude death rates (per 100,000 pop.) and total cost per capita by cause, Newfoundland and Labrador, 2010 95 .........................................................................
TABLE 55: Total, direct, and indirect costs of injury by cause, Newfoundland and Labrador, 2010 96 ......................................................................................................................
TABLE 56: Summary of findings, all injury, Nova Scotia, 2010 101 ...................................................
TABLE 57: Injury by intent, Nova Scotia, 2010 102 .........................................................................
TABLE 58: Total, direct, and indirect costs by intent of injury, Nova Scotia, 2010 103 .......................
TABLE 59: Injury deaths, hospitalizations, and emergency room visits by cause, Nova Scotia, 2010 104 ....................................................................................................................
TABLE 60: Mortality, crude death rates (per 100,000 pop.) and total cost per capita by cause, Nova Scotia, 2010 105 .................................................................................................
TABLE 61: Total, direct, and indirect costs of injury by cause, Nova Scotia, 2010 106 .......................
TABLE 62: Summary of findings, all injury, Ontario, 2010 112 .........................................................
TABLE 63: Injury by intent, Ontario, 2010 113 ...............................................................................
TABLE 64: Total, direct, and indirect costs by intent of injury, Ontario, 2010 113 ..............................
List of Tables ! ix

The Cost of Injury in Canada 2015
TABLE 65: Injury deaths, hospitalizations, and emergency room visits by cause, Ontario, 2010 115 .....................................................................................................................
TABLE 66: Mortality, crude death rates (per 100,000 pop.) and total cost per capita by cause, Ontario, 2010 116 ........................................................................................................
TABLE 67: Total, direct, and indirect costs of injury by cause, Ontario, 2010 117 ...............................
TABLE 68: Summary of findings, all injury, Prince Edward Island, 2010 123 ....................................
TABLE 69: Injury by intent, Prince Edward Island, 2010 123 ...........................................................
TABLE 70: Total, direct, and indirect costs by intent of injury, Prince Edward Island, 2010 124 ..........
TABLE 71: Injury deaths, hospitalizations, and emergency room visits by cause, Prince Edward Island, 2010 125 ..............................................................................................
TABLE 72: Mortality, crude death rates (per 100,000 pop.) and total cost per capita by cause, Prince Edward Island, 2010 126 ....................................................................................
TABLE 73: Total, direct, and indirect costs of injury by cause, Prince Edward Island, 2010 127 ..........
TABLE 74: Summary of findings, all injury, Quebec, 2010 132 ........................................................
TABLE 75: Injury by intent, Quebec, 2010 133 ...............................................................................
TABLE 76: Total, direct, and indirect costs by intent of injury, Quebec, 2010 133 ..............................
TABLE 77: Injury deaths, hospitalizations, and emergency room visits by cause, Quebec, 2010 134 ..
TABLE 78: Mortality, crude death rates (per 100,000 pop.) and total cost per capita by cause, Quebec, 2010 136 ........................................................................................................
TABLE 79: Total, direct, and indirect costs of injury by cause, Quebec, 2010 137 ..............................
TABLE 80: Summary of findings, all injury, Saskatchewan, 2010 143 ..............................................
TABLE 81: Injury by intent, Saskatchewan, 2010 144 ....................................................................
TABLE 82: Total, direct, and indirect costs by intent of injury, Saskatchewan, 2010 144 ...................
TABLE 83: Injury deaths, hospitalizations, and emergency room visits by cause, Saskatchewan, 2010 146 ..............................................................................................
TABLE 84: Mortality, crude death rates (per 100,000 pop.) and total cost per capita by cause, Saskatchewan, 2010 147 .............................................................................................
TABLE 85: Total, direct, and indirect costs of injury by cause, Saskatchewan, 2010 148 ....................
List of Tables ! x

List of Figures FIGURE 1: Economic cost per capita and potential years of life lost (PYLL), Canada and by
province, 2010 15 ......................................................................................................
FIGURE 2: Total costs by intent of injury, Canada, 2010 16 ...........................................................
FIGURE 3: Direct cost by intent of injury, Canada, 2010 16 ............................................................
FIGURE 4: Indirect cost by intent of injury, Canada, 2010 17 .........................................................
FIGURE 5: Injury deaths by cause, Canada, 2010 20 ....................................................................
FIGURE 6: Injury hospitalizations by cause, Canada, 2010 20 .......................................................
FIGURE 7: Emergency Room Visits by Injury Cause, Canada, 2010 21 ............................................
FIGURE 8: Injury costs by cause, Canada, 2010 23 .......................................................................
FIGURE 9: Direct and indirect costs by cause, Canada, 2010 23 .....................................................
FIGURE 10: Health care costs per capita and potential years of life lost (PYLL)* by province, 2010 42 .....................................................................................................................
FIGURE 11: Population by age cohort, Canada, 2010 and 2035 43 ...................................................
FIGURE 12: Forecasted reduction in cost of falls, Canada, age 65+ 45 .............................................
FIGURE 13: Forecasted reduction in cost of transport-related injuries and deaths from speed camera intervention, Canada, all ages 47 ....................................................................
FIGURE 14: Forecasted reduction in cost of transport-related injuries and deaths from speed calming intervention, Canada, all ages 47 ...................................................................
FIGURE 15: Forecasted reduction in injury costs from helmet use in sports and recreation injuries 49................................................................................................................
List of Figures ! xi

EXECUTIVE SUMMARY
Introduction Parachute is pleased to publish The Cost of injury in Canada, 2015 in collaboration with The Conference Board of Canada and with support from the Public Health Agency of Canada. This Report quantifies the cost of injury to Canadian children, families, our health care system, and to Canadian society.
The 2015 Report updates The Economic Burden of Injury in Canada last published in 2009. Using the same methodology, the 2015 Report examines all injuries at the national level, as well as providing provincial breakdowns. New in the 2015 Report are forecasts developed by the Conference Board of Canada that show the potential impact of inaction, as well as what can happen if known, effective interventions are broadly and comprehensively implemented across Canada.
The clock is ticking. In Canada, as this Report shows, preventable injuries resulted in:
❖ 15,866 deaths
❖ 231,596 Canadians hospitalized
❖ Nearly 3.5 million emergency room visits
❖ More than 60,000 Canadians either partially or permanently disabled
❖ $15.9 billion in direct health care costs
❖ $26.8 billion in total economic costs
Every hour, 427 people in our country suffer a preventable injury as a result of a fall, a motor vehicle crash, a fire, poisoning, drowning, or other activities.
Executive Summary ! 1
The Cost of Injury in Canada 2015
Preventable injury is the leading cause of death for Canadians aged one to 44, and claims the lives of more children in Canada than all other causes. On a daily basis, more than 10,000 Canadians are injured seriously enough to require medical attention. Of these, approximately 9,567 (93%) are seen in emergency rooms, 43 (0.4%) die, 634 (6%) are hospitalized, and 165 (1.6%) are left partially or totally disabled.
The cost is mounting. In addition to this alarming, and increasing human toll, preventable injuries cost Canadians more than $26.8 billion a year. The direct costs of injury in 2010 were $15,890 billion and indirect costs were $10,906 billion. The injury death rate has increased by 2.8% from 42.06 (per 100,000) to 43.25 (per 100,000).
Preventable injury in 2004 killed 13,000 Canadians. In 2010, the number increased to 15,866. If we continue on the current trajectory, by 2035, preventable injury will kill 26,390 Canadians a year.
The economic cost of injury in Canada has increased by 35% since 2004. By 2035 injuries will cost Canadians $75 billion a year, an increase of 180%.
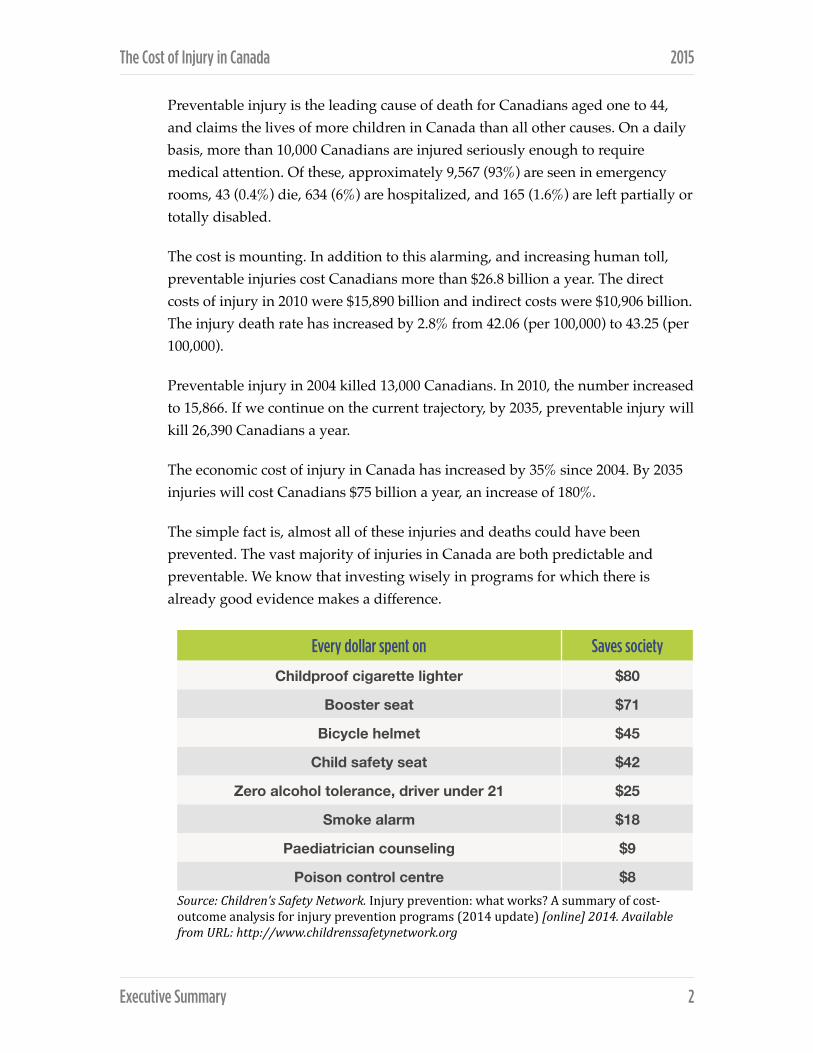
The simple fact is, almost all of these injuries and deaths could have been prevented. The vast majority of injuries in Canada are both predictable and preventable. We know that investing wisely in programs for which there is already good evidence makes a difference.
Source: Children’s Safety Network. Injury prevention: what works? A summary of cost-‐outcome analysis for injury prevention programs (2014 update) [online] 2014. Available from URL: http://www.childrenssafetynetwork.org
Every dollar spent on Saves society
Childproof cigarette lighter $80
Booster seat $71
Bicycle helmet $45
Child safety seat $42
Zero alcohol tolerance, driver under 21 $25
Smoke alarm $18
Paediatrician counseling $9
Poison control centre $8
Executive Summary ! 2
The Cost of Injury in Canada 2015
Total cost of injury
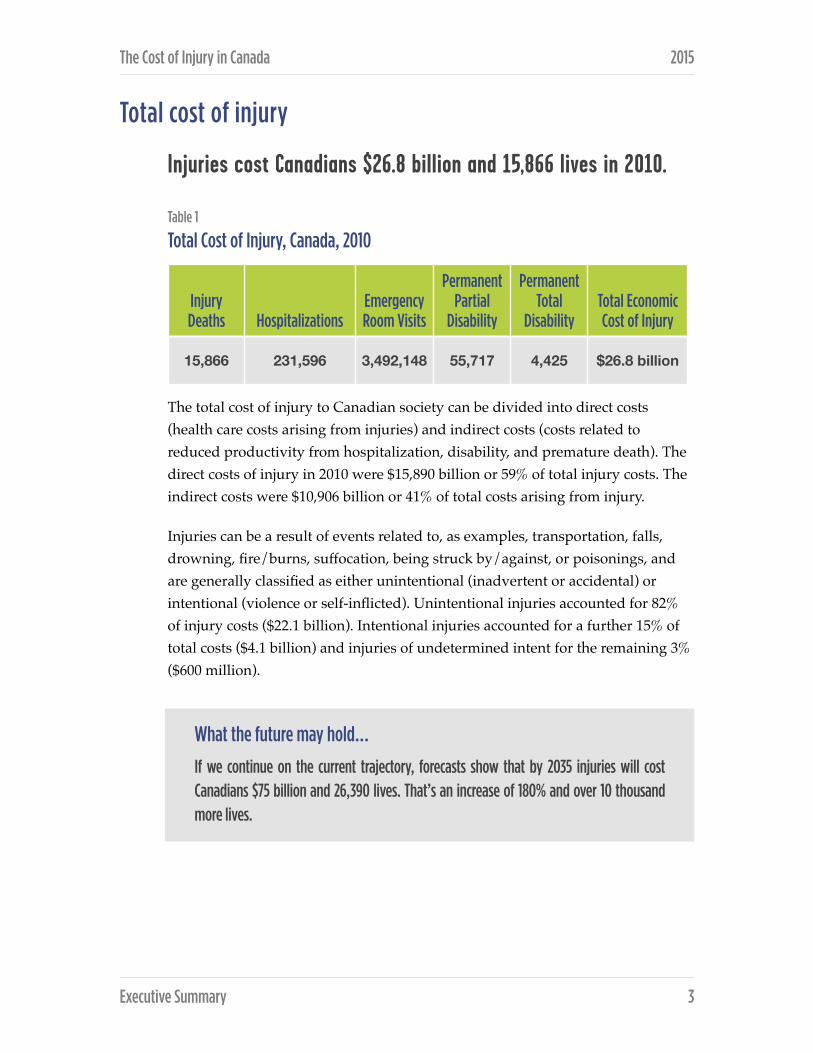
Injuries cost Canadians $26.8 billion and 15,866 lives in 2010.
Table 1
Total Cost of Injury, Canada, 2010
The total cost of injury to Canadian society can be divided into direct costs (health care costs arising from injuries) and indirect costs (costs related to reduced productivity from hospitalization, disability, and premature death). The direct costs of injury in 2010 were $15,890 billion or 59% of total injury costs. The indirect costs were $10,906 billion or 41% of total costs arising from injury.
Injuries can be a result of events related to, as examples, transportation, falls, drowning, fire/burns, suffocation, being struck by/against, or poisonings, and are generally classified as either unintentional (inadvertent or accidental) or intentional (violence or self-inflicted). Unintentional injuries accounted for 82% of injury costs ($22.1 billion). Intentional injuries accounted for a further 15% of total costs ($4.1 billion) and injuries of undetermined intent for the remaining 3% ($600 million).
Injury Deaths Hospitalizations
Emergency Room Visits
Permanent Partial
Disability
Permanent Total
Disability Total Economic Cost of Injury
15,866 231,596 3,492,148 55,717 4,425 $26.8 billion
Executive Summary ! 3
What the future may hold…
If we continue on the current trajectory, forecasts show that by 2035 injuries will cost Canadians $75 billion and 26,390 lives. That’s an increase of 180% and over 10 thousand more lives.

The Cost of Injury in Canada 2015
Injury by cause Table 3
Number of injury deaths, hospitalizations, emergency room visits, and related disability cases by cause, Canada, 2010
* See Appendix 3 for a detailed breakdown of causes of injury in this category.
Description Deaths HospitalizationsEmergency Room Visits
Permanent Partial
Disability
Permanent Total
Disability
Transport Incidents 2,620 28,350 290,782 7,204 699
Falls 4,071 128,389 1,036,079 23,236 1,969
Drowning 369 247 1,251 37 4
Fire\Burns 234 2,099 43,684 982 50
Unintentional Poisoning 1,568 7,893 54,245 1,731 109
Struck By\Against Sports Equipment
<5 664 68,355 518 39
Other Unintentional Injuries*
1,792 36,462 1,845,277 15,881 1,132
Suicide\Self-Harm 3,948 16,131 34,677 3,443 175
Violence 515 8,069 97,360 1,933 202
Undetermined Intent\Other 749 3,292 20,438 752 46
TOTAL 15,866 231,596 3,492,148 55,717 4,425
Executive Summary ! 4

The Cost of Injury in Canada 2015
Population by age cohort, Canada, 2010 and 2035 Canada’s population is aging as the ‘baby boomers’ grow older. This graph shows the distribution of the Canadian population by age in 2010 and again in 2035. These changing demographics will have an impact on the cost of injuries in both human and financial tolls
Population by Age Cohort, Canada, 2010 and 2035
!
Popu
latio
n
0
175,000
350,000
525,000
700,000
Age
0 5 10 15 20 25 30 35 40 45 50 55 60 65 70 75 80 85 90 95 100+
2010 2035
Executive Summary ! 5
What the future may hold…
If we continue on the current trajectory, forecasts show that by 2035:
• Deaths will increase by 60% from 15,866 to 26,386
• Hospitalizations will increase by 62% from 231,596 to 375,215
• Emergency room visits will increase by 26% from 3,492,148 to 4,394,681
• Permanent Partial Disability will increase by 36% from 55,717 to 75,883
• Permanent Total Disability will increase by 39% from 4,425 to 6,146

The Cost of Injury in Canada 2015
Cost of injury by cause Falls were the leading cause of overall injury costs in Canada in 2010, accounting for $8.7 billion or 34% of total costs, followed by transport incidents at $4.3 billion (17%), other unintentional injuries at $5.5 billion (22%) and suicide/self-harm at $2.9 billion (12%).
Table 7
Total, direct and indirect costs of injury by cause, Canada, 2010
* See Appendix 3 for a detailed breakdown of causes of injury in this category.
Falls accounted for $6.7 billion or 42% of direct costs of injury in 2010, followed by transport incidents at $2.1 billion (13%). Other unintentional injuries make up 31% or $4.9 billion.
Transport incidents were the leading cause of indirect costs of injury, accounting for $2.1 billion or 20% of total indirect costs, followed by suicide/self-harm at $2.1 billion (20%) and falls at $2 billion (19%). Other unintentional injuries combined accounted for the remaining portion of indirect costs at $2.3 billion (21%).
DescriptionTotal costs
($ millions)Direct costs ($ millions)
Indirect costs ($ millions)
Transport Incidents 4,289 2,145 2,144
Falls 8,680 6,652 2,029
Drowning 187 13 175
Fire\Burns 366 177 188
Unintentional Poisoning 1,264 396 868
Struck By\Against Sports Equipment 187 97 90
Other Unintentional Injuries* 7,127 4,861 2,265
Suicide\Self-Harm 2,956 829 2,127
Violence 1,142 541 602
Undetermined Intent\Other 598 179 419
TOTAL 26,796 15,890 10,906
Executive Summary ! 6
The Cost of Injury in Canada 2015
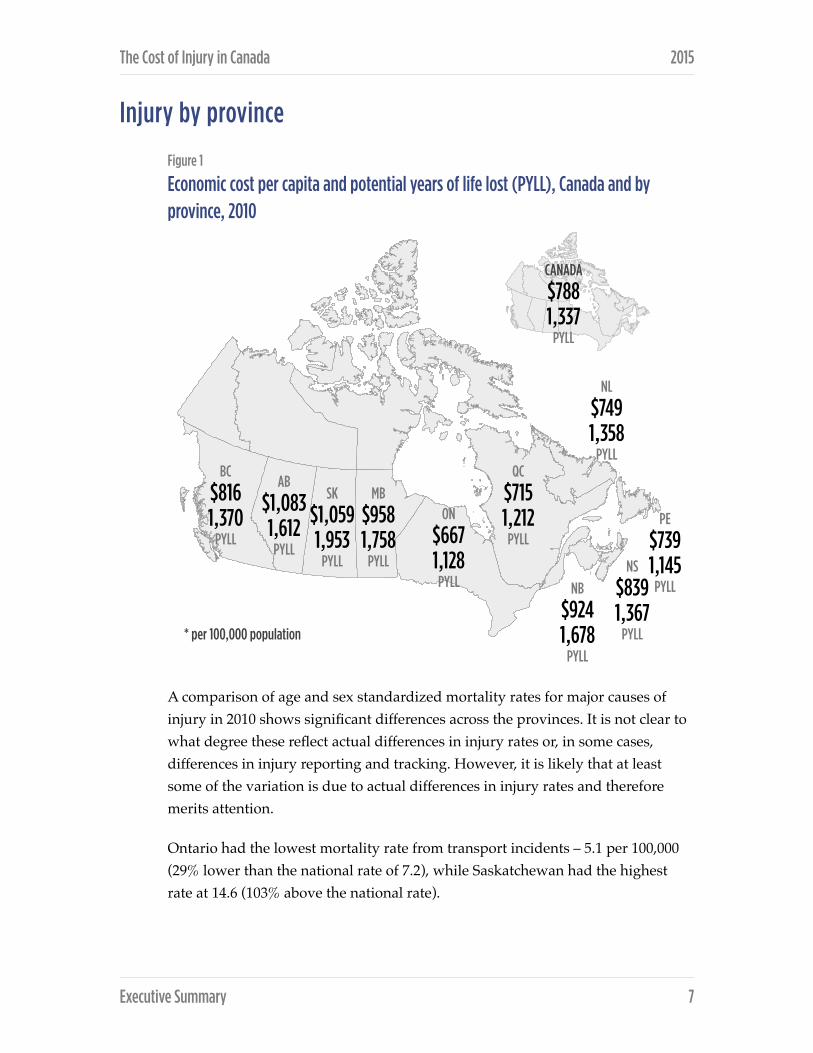
Injury by province Figure 1
Economic cost per capita and potential years of life lost (PYLL), Canada and by province, 2010
A comparison of age and sex standardized mortality rates for major causes of injury in 2010 shows significant differences across the provinces. It is not clear to what degree these reflect actual differences in injury rates or, in some cases, differences in injury reporting and tracking. However, it is likely that at least some of the variation is due to actual differences in injury rates and therefore merits attention.
Ontario had the lowest mortality rate from transport incidents – 5.1 per 100,000 (29% lower than the national rate of 7.2), while Saskatchewan had the highest rate at 14.6 (103% above the national rate).
Executive Summary ! 7
BC
$816 1,370
PYLL
* per 100,000 population
AB
$1,083 1,612
PYLL
SK
$1,059 1,953
PYLL
MB
$958 1,758
PYLL
ON
$667 1,128
PYLL
QC
$715 1,212
PYLL
NL
$749 1,358
PYLL
PE
$739 1,145
PYLLNS
$839 1,367
PYLL
NB
$924 1,678
PYLL
CANADA
$788 1,337
PYLL

The Cost of Injury in Canada 2015
Newfoundland and Labrador had the lowest mortality rate due to falls at 1.5 per 100,000 (33% of the national rate), while Manitoba had from the highest rate – 7.0 (52% higher than the national rate).
Prince Edward Island had the lowest mortality rates from suicide and violence (7.1% and 0.0 respectively), while New Brunswick had the highest suicide rate (13.3 or 22% higher than the national rate), and Manitoba the highest rate due to violence (4.0 or 266% the national rate).
Conclusion This Report quantifies the staggering cost of injury for Canadian children, seniors, families, our health care system, and to Canadian society. Preventable injury is the leading cause of death for Canadians aged one to 44, and claims the lives of more children in Canada than all other causes.
The costs continue to rise year after year. The loss of 15,866 Canadian lives and $26.8 billion is unsustainable.
The good news is that the vast majority of the injuries described in this Report are both predictable and preventable. We know when they happen and under what conditions. We know who is at risk and we increasingly know what works and what does not with respect to prevention.
And as our capacity to monitor, report on, and coordinate effective action to prevent injury grows, our rationale for inaction diminishes. We encourage consideration of the costs of current inaction against the backdrop of Canada’s aging population, shrinking labour force, and over-costed health care system.
The clock is ticking. Effective action to prevent injury can help to alleviate the human and economic costs we all currently bear. It is time to take comprehensive, effective action that will prevent injuries and save lives.
Executive Summary ! 8
INTRODUCTION Parachute is pleased to publish The Cost of Injury in Canada, 2015 in collaboration with the Conference Board of Canada and with support from the Public Health Agency of Canada. This Report quantifies the cost of injury to Canadian children, families, our health care system, and to Canadian society.
The 2015 Report updates the Economic Burden of Injury in Canada last published in 2009. Using the same methodology, the 2015 Report examines all injuries at the national level, as well as providing provincial breakdowns. New in the 2015 Report are forecasts developed by the Conference Board of Canada that show the potential impact of inaction, as well as what can happen if known, effective interventions are broadly and comprehensively implemented across Canada.
More than 3 million Canadians injured and 15,866 killed in 2010 Each year, a staggering 3 million Canadians visit emergency rooms, and another 15,866 are killed as a result of predictable and preventable injuries. Every hour, 427 people in our country suffer a preventable injury as a result of a fall, a motor vehicle crash, a fire, poisoning, drowning, and other activities.
Preventable injury is the leading cause of death for Canadians aged one to 44, and claims the lives of more children in Canada than all other causes. On a daily basis, more than 10,000 Canadians are injured seriously enough to require medical attention. Of these, approximately 9,567 (93%) are seen in emergency rooms, 43 (0.4%) die, 634 (6%) are hospitalized, and 165 (1.6%) are left partially or totally disabled.
The simple fact is, almost all of these injuries and deaths could have been prevented
In addition to this alarming, and increasing human toll, preventable injuries cost Canadians more than $26.8 billion a year. Whether it is direct costs of care, such as an emergency, trauma, surgical, or general medical costs, or the indirect costs arising from reduced productivity from hospitalization, disability or premature
Introduction ! 9

The Cost of Injury in Canada 2015
deaths, the cost is significant, and mounting. The direct costs of injury in 2010 were $15,890 billion and indirect costs were $10,906 billion.
The cost is mounting Preventable injury in 2004 killed 13,000 Canadians. In 2010, the number was 15,866. If we continue on the current trajectory, by 2035, preventable injury will kill 26,390 Canadians a year.
The economic cost of injury in Canada has increased by 35% since 2004. If these trends continue, by 2035 injuries will cost Canadians $75B a year, an increase of 180%.
Since the last report in 2009, reductions in certain injury areas have been realized. For example, transportation injuries have declined; however, an area of growing injuries is falls amongst seniors, especially those over age 85. With the baby boomer population expanding over the next twenty years, this raises major concerns for significant increases in health care costs, and negative impact on quality of life.
There is good news The vast majority of injuries in Canada are both predictable and preventable. We know how they happen, and under what conditions. We know who is at risk and we increasingly know what works and what does not with respect to prevention.
We know that investing wisely in programs for which there is already good evidence makes a difference. Since 2004, the injury death rate has increased by 2.8% from 42.06 (per 100,000 population) to 43.25 (per 100,000 population).
We know that no one wants to be injured. No one wants their child or parent to be injured. The trouble is, too many people think “we won’t get hurt“, and that serious injuries only happen to other people. However, they can and do happen – to us and to others around us – at home, at play, at work and on the road.
We all lead busy and hectic lives – taking a moment to have a word with yourself about doing the right thing can prevent an injury, save your life, and in the long
Introduction ! 10

The Cost of Injury in Canada 2015
run, change societal attitudes and beliefs so that we can prevent injuries and save lives.
The clock is ticking. In Canada, as this Report shows, preventable injuries result in:
❖ 15,866 deaths
❖ 231,596 Canadians hospitalized
❖ Nearly 3.5 million emergency room visits
❖ More than 60,000 Canadians either partially or permanently disabled
❖ $15.9 billion in direct health care costs
❖ $26.8 billion in total economic costs
We have the solution Let’s work together to Stop the Clock on preventable injuries in Canada.
Methods This Report is the third of its kind, the previous reports being published in 1998 (using 1995 data) and 2009 (using 2004 data). Due to differences in methodology in collecting the 1995 and 2004 emergency room data, incomplete 1995 hospitalization and mortality data from Ontario, and missing 1995 data from Quebec, it is not possible to draw accurate comparisons with respect to non-hospitalization and hospitalization rates, or disability rates as these are derived using hospitalization rates. Nor is it possible to compare intentional injury rates, as these were not included in the original 1998 study. Thus a direct comparison of the report from 1998 with the 2009 or 2015 reports is not possible.
The analysis underlying this Report was conducted from a societal perspective, using an incidence costing, human capital approach. That is, the population of Canadian residents injured in 2010 was costed over the lifetime of the injured individuals. The costs, both direct and indirect, were discounted to a present value in 2010 at 3% per annum.
Introduction ! 11

The Cost of Injury in Canada 2015
Cost-of-illness studies distinguish and measure both direct costs (the value of resources used to treat the persons incurring the illness) and indirect costs (the value lost to society as a result of the illness in question).
Direct costs are composed of all the goods and services used for the diagnosis, treatment, continuing care, rehabilitation, and terminal care of people experiencing a major illness or impairment. These cost categories include expenditures for hospitalization, outpatient care, nursing home care, home care, services of physicians, and other health professionals, pharmaceuticals, rehabilitation, as well as the costs of prostheses, appliances, eyeglasses, hearing aids, and speech devices necessary to help the patient overcome the impairments associated with the major illness. Also included are the administrative costs of third-party payers (public and private) who fund such expenses.
Under the human capital methodology, indirect costs are societal productivity losses, which account for the injured individual’s inability to perform his or her major activities. The value of time lost from work and homemaking due to morbidity, disability, and premature mortality is measured by earnings data and the market value of unperformed homemaking services. In accordance with the human capital methodology, this includes only foregone earnings calculated as average earnings, adjusted by the participation rate and unemployment rate, over the relevant period within the working life of an individual from ages 15 to 64 years inclusive. A real wage growth rate of 1% per year was assumed for this study.
As well as these economic costs, there are certain intangible costs associated with injuries, such as pain and suffering, economic dependence, and social isolation. While these costs are difficult to quantify in economic terms, they are costs nonetheless and should at least be identified. Too many Canadians have their lives and those of their families irrevocably changed forever as a result of injury.
This Report did not attempt to quantify these costs and, hence, the indirect costs cited can be considered conservative.
An Electronic Resource Allocation Tool (ERAT) was developed, combining existing data with variables from the literature in order to model full episodic costs for unintentional and intentional injuries. The ERAT is a flexible tool that can be updated as new data become available and according to changes in population, injury incidence, and treatment patterns and costs. As such, it is a
Introduction ! 12

The Cost of Injury in Canada 2015
useful resource that can be used by researchers and public health officials at the provincial and local level to support resource allocation, policy development, and decision-making.
The mortality data for this Report were provided by the Canadian Socio-Economic Information Management System (CANSIM), for the 2010 calendar year. The external cause of injury was classified according to the International Classification of Diseases, 10th revision (ICD-10). The Public Health Agency of Canada provided the acute hospital separation data analysis from their holdings of the Canadian Institute for Health Information (CIHI) Hospital Morbidity Database (HMDB). The information in this Report can be considered a conservative estimate given data on doctor visits, clinic visits and toll on individuals are not accounted for. There may be variations in data between this Report and provincial reports. This is due to the date when data are collected. For more details on the economic approach, ERAT, data sources and limitations, readers are encouraged to see Appendix 1 - Methodology.
Introduction ! 13

INJURY IN CANADA
Total cost of injury
Injuries cost Canadians $26.8 billion and 15,866 lives in 2010.
A further 4,425 individuals were permanently and totally disabled and 55,717 1
were left with a permanent partial disability , while 231,596 Canadians were 2
hospitalized and another 3,492,148 were treated in emergency departments as a result of injury.
Table 1
Total Cost of Injury, Canada, 2010
Direct and indirect costs The total cost of injury to Canadian society can be divided into direct costs (health care costs arising from injuries) and indirect costs (costs related to reduced productivity from hospitalization, disability and premature death).
The direct costs of injury in 2010 were $15.9 billion or 59% of total injury costs. The indirect costs were $10. 9 billion, or 41% of total costs arising from injury.
Injury Deaths HospitalizationsEmergency Room Visits
Permanent Partial
Disability
Permanent Total
Disability
Total Economic
Cost of Injury
15,866 231,596 3,492,148 55,717 4,425$26.8 billion
Permanent total disability is “a condition equivalent to complete and permanent loss of earning power.” Source: T. Miller, N. 1
Pindus, J. Douglass, and S. Rossman. Databook on Nonfatal Injury Incidence, Costs and Consequences, The Urban Institute Press (Washington: 1995), p. 26.
Permanent partial disability is “a condition that results in a permanent disability from which partial recovery is anticipated, 2
along with a return to some form of employment. Complete loss of earning power is expected prior to recovery, after which the worker is expected to return to employment with wages below pre-‐injury wages.” Source: Databook on Nonfatal Injury, p.26.
Injury in Canada ! 14

The Cost of Injury in Canada 2015
Figure 1
Economic cost per capita and potential years of life lost (PYLL), Canada and by province, 2010
Intentional and unintentional injury Injuries can be a result of events related to, as examples, transportation, falls, drowning, fire/burns, suffocation, being struck by/against and poisonings, and are generally classified as either unintentional (inadvertent or accidental) or intentional (violence or self-inflicted). (For a detailed classification of injury causes in each of these categories, please see Appendix 2.)
Unintentional injuries accounted for 83% of injury costs ($22.1 billion). Intentional injuries accounted for a further 15% of total costs ($4.1 billion) and injuries of undetermined intent for the remaining 2% ($600 million).
Injury in Canada ! 15
BC
$816 1,370
PYLL
* per 100,000 population
AB
$1,083 1,612
PYLL
SK
$1,059 1,953
PYLL
MB
$958 1,758
PYLL
ON
$667 1,128
PYLL
QC
$715 1,212
PYLL
NL
$749 1,358
PYLL
PE
$739 1,145
PYLLNS
$839 1,367
PYLL
NB
$924 1,678
PYLL
CANADA
$788 1,337
PYLL

The Cost of Injury in Canada 2015
Figure 2
Total costs by intent of injury, Canada, 2010
Unintentional injuries still account for the vast majority of costs when direct and indirect costs are examined separately – $15.9 billion or 58% of total direct injury costs and $10.9 billion or 41% of total indirect costs arising from injury.
Figure 3
Direct cost by intent of injury, Canada, 2010
Injury in Canada ! 16
Suicide/ Self-Harm
11.0%
Unintentional Injuries 82.5%
Undetermined 2.2%
Violence 4.3%
Unintentional Injuries 90.3%
Suicide/Self Harm 5.2%
Undetermined 1.1%
Violence 3.4%
The Cost of Injury in Canada 2015
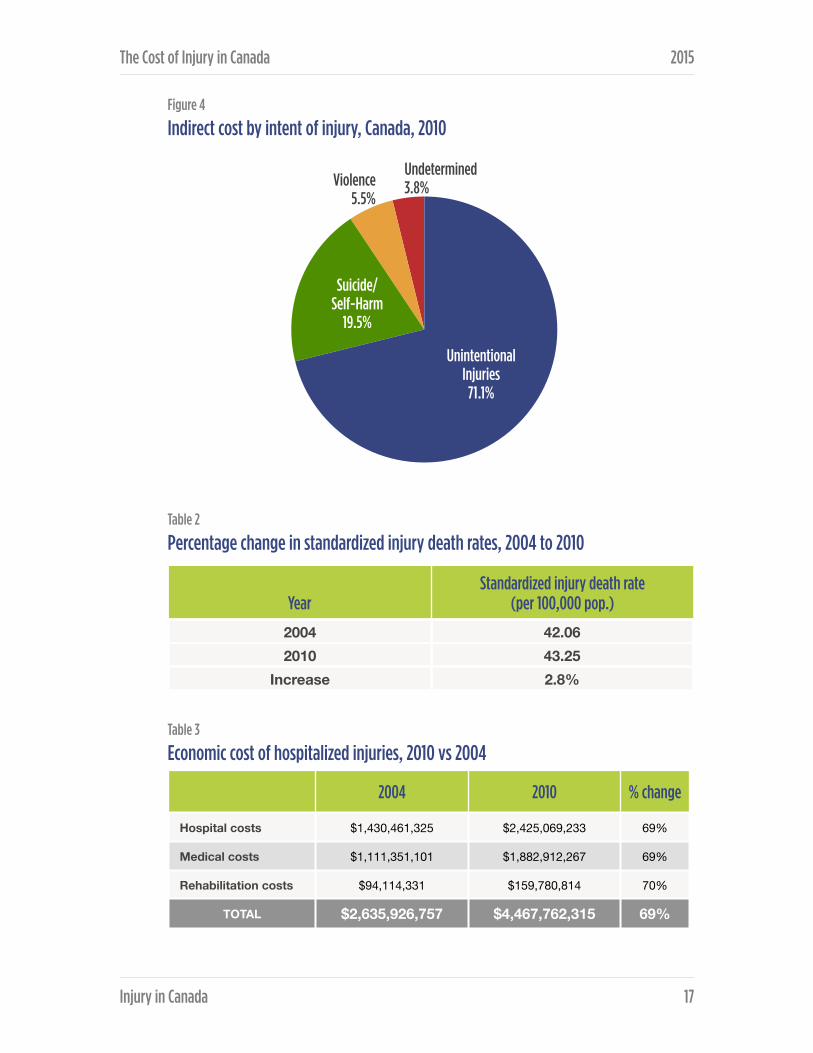
Figure 4
Indirect cost by intent of injury, Canada, 2010
Table 2
Percentage change in standardized injury death rates, 2004 to 2010
Table 3
Economic cost of hospitalized injuries, 2010 vs 2004
YearStandardized injury death rate
(per 100,000 pop.)
2004 42.062010 43.25
Increase 2.8%
2004 2010 % change
Hospital costs $1,430,461,325 $2,425,069,233 69%
Medical costs $1,111,351,101 $1,882,912,267 69%
Rehabilitation costs $94,114,331 $159,780,814 70%
TOTAL $2,635,926,757 $4,467,762,315 69%
Injury in Canada ! 17
Suicide/ Self-Harm
19.5%
Unintentional Injuries
71.1%
Violence 5.5%
Undetermined 3.8%

The Cost of Injury in Canada 2015
Main reasons for increase include:
❖ Greater average cost of hospitalization: $5,162 vs. $4,269 (21%)
❖ Great number of hospitalized injuries (9.4%)
❖ Increase in average Resource Intensity Weights (RIW) due to aging: from 1.6 3
to 2 (29%)
Table 4
Economic cost of injuries seen in emergency rooms, 2010 vs 2004
Main reasons for increase include:
❖ Greater average medical cost: $1,305 vs. $813 (61%)
❖ Greater average rehabilitation cost: $97 vs. $59 (63%)
❖ Greater number of non-hospitalized injuries (11.4%)
Table 5
Total economic cost, 2010 vs 2004
2004 2010 % change
Medical costs $2,548,894,598 $4,602,767,747 80%
Rehabilitation costs $186,141,316 $337,409,719 81%
TOTAL $2,735,035,914 $4,940,177,467 80%
2004 2010 % change
Direct costs $10,716,087,467 $15,889,974,380 48%
Indirect Costs $9,065,036,405 $10,906,104,749 20%
TOTAL $19,781,123,872 $26,796,079,129 35%
RIW -‐ The relative case weights for CMGs™ used to measure the intensity of resource use (relative cost) associated with 3
different diagnostic, surgical procedure and demographic characteristics of an individual. RIWs™ are assigned according to the case mix group to which an individual is assigned as well as their age, health status, and discharge status and are based upon micro-‐costing. In this Report, we have used RIWs™ assigned using the CMG with Complexity Overlay (CMG Plx™) methodology. (Source http://mchp-‐appserv.cpe.umanitoba.ca/viewDe]inition.php?de]initionID=103807)
Injury in Canada ! 18

The Cost of Injury in Canada 2015
Injury by cause Table 6
Number of injury deaths, hospitalizations, emergency room visits and related disability cases by cause, Canada, 2010
* Does not include falls in sports/rec ** See Appendix 3 for a detailed breakdown of causes of injury in this category.
Falls accounted for 26% - 4,071 of all injuries resulting in death, followed by suicide/self-harm 25% - 3,948 and transport incidents 17% - 2,620.
Falls accounted for 55%, 128,389, of all injuries resulting in hospitalization – followed by transport incidents (12% - 28,350), with combined other unintentional injuries at 16% (36,462).
Description Deaths Hospitalizations
Emergency Room Visits
Permanent Partial
Disability
Permanent Total
Disability
Transport Incidents 2,620 28,350 290,782 7,204 699
Falls 4,071 128,389 1,036,079 25,236 1,969
Drowning 369 247 1,251 37 4
Fire\Burns 234 2,099 43,684 982 50
Unintentional Poisoning 1,568 7,893 54,245 1,731 109
Struck By\Against Sports Equipment*
<5 664 68,355 518 39
Other Unintentional Injuries**
1,792 36,462 1,845,277 15,881 1,132
Suicide\Self-Harm 3,948 16,131 34,677 3,443 175
Violence 515 8,069 97,360 1,933 202
Undetermined Intent\Other 749 3,292 20,438 752 46
TOTAL 15,866 231,596 3,492,148 55,717 4,425
Injury in Canada ! 19

The Cost of Injury in Canada 2015
Figure 5
Injury deaths by cause, Canada, 2010
Figure 6
Injury hospitalizations by cause, Canada, 2010
Injury in Canada ! 20
Transport 16.5%
Suicide/ Self-Harm
24.9%
Falls 25.7%
Other Unintentional
Injuries 11.3%
Unintentional Poisoning
9.9%
Undetermined Intent 4.7%
Violence 3.2%
Drowning 2.3% Fire/Burns
1.5%
Falls 55.4%
Other Unintentional
Injuries 15.7%
Transport 12.2%
Suicide/Self-Harm 7%
Violence 3.5%
Unintentional Poisoning 3.4%
Undetermined Intent
1.4%
Fire/Burns 0.9% Struck by/against Sports
Equipment 0.3% Drowning
0.1%

The Cost of Injury in Canada 2015
Figure 7
Emergency Room Visits by Injury Cause, Canada, 2010
Many injuries, while not requiring hospitalization, do involve emergency room visits for treatment. Falls were the leading cause of all injury-related emergency room visits (30% - 1,036,079), followed by transport incidents (8% - 290,782).
Falls were the leading cause of injuries resulting in permanent partial disability (45% - 25,236) and total permanent disability (44% - 1,969). Falls were followed in both these cases by transport incidents (13% - 7,204 and 16% - 699 respectively).
Costs of injury by cause Falls were the leading cause of overall injury costs in Canada in 2010, accounting for $8.7 billion or 32% of total costs, followed transport incidents at $4.3 billion (16%), and suicide/self-harm at $3 billion (11%) (see Table 3).
Injury in Canada ! 21
Transport 8.3%
Violence 2.8%
Undetermined Intent 0.6%
Fire/Burns 1.3%
Suicide/Self-Harm 1.0%
Drowning 0.1%
Other Unintentional
Injuries 52.8%
Falls 29.7%
Struck by/against Sports Equipment 2.0%
Unintentional Poisoning 1.6%

The Cost of Injury in Canada 2015
Table 7
Total, direct and indirect costs of injury by cause, Canada, 2010
* See Appendix 3 for a detailed breakdown of causes of injury in this category.
Between 2004 and 2010 there was a 48% increase in total direct costs and a 20% increase in indirect costs , resulting in an overall 35% increase in total economic cost.
When these figures are broken down into direct and indirect costs, falls were clearly the major driver of direct costs of injury, accounting for $6.6 billion or 42% of Canada’s total in 2010, followed by other unintentional injuries at $4.9 billion (31%) and transport injuries at $2.1 billion (13%).
Transport incidents were the leading cause of indirect costs of injury, accounting for $2.1 billion or 20% of total indirect costs, followed by suicide/self-harm at $2.1 billion (20%) and falls at $2 billion (19%). Other unintentional injuries also accounted for a significant portion of indirect costs at $2.3 billion (21%).
DescriptionTotal costs
($ millions)Direct costs ($ millions)
Indirect costs ($ millions)
Transport Incidents 4,289 2,145 2,144
Falls 8,680 6,652 2,029
Drowning 187 13 175
Fire\Burns 366 177 188
Unintentional Poisoning 1,264 396 868
Struck By\Against Sports Equipment 187 97 90
Other Unintentional Injuries* 7,127 4,861 2,265
Suicide\Self-Harm 2,956 829 2,127
Violence 1,142 541 602
Undetermined Intent\Other 598 179 419
TOTAL 26,796 15,890 10,906
Injury in Canada ! 22

The Cost of Injury in Canada 2015
Figure 8
Injury costs by cause, Canada, 2010
Figure 9
Direct and indirect costs by cause, Canada, 2010
Injury in Canada ! 23
Other Unintentional
Injuries 26.6%
Falls 32.4%
Transport Incidents
16.0%
Suicide/ Self-Harm
11.0%
Unintentional Poisoning 4.7%
Violence 4.3%
Undetermined Intent 2.2%
Fire/Burns 1.4% Drowning
0.7% Struck by/against Sports Equipment 0.7%
Sports
Drowning
Fire/Burns
Undetermined
Violence
Unintentional Poisoning
Suicide/Self-Harm
Transport
Other Unintentional
Falls
Costs (Millions $)
$0 $2,250,000,000 $4,500,000,000 $6,750,000,000 $9,000,000,000
Direct Indirect

The Cost of Injury in Canada 2015
Falls Falls on stairs were the most frequent cause of fall deaths in 2010 (10% n=393) followed by falls on the same level (8% n=327) and falls from furniture (7% n=281).
Falls on the same level were the most common cause of hospitalized treatment (29% n=37,660), emergency room visits (32% n=330,199), permanent partial disability (31% n=6,721) and permanent total disability (27% n=492).
Among Canadians aged 85 and older, males were more likely than females of the same age to die from a fall (396.29 vs 327.94 per 100,000), but females were more likely to be hospitalized (6323.72 vs 4277.54 per 100,000). There are some differences in the rates of emergency room visits and permanent partial disability, but males and females aged 85 and older were almost equally likely to suffer from of permanent disability as a result of a fall.
Table 8
Number of injury deaths, hospitalizations, and emergency room visits for falls, Canada, 2010
Description Deaths Hospitalizations
Emergency Room Visits
Permanent Partial
Disability
Permanent Total
Disability On the same level 327 37,660 330,199 7,235 532
From skates, skis, boards, blades
15 4,189 64,597 1,384 106
From furniture 281 7,794 61,863 1,107 93
In playgrounds <5 1,713 23,870 583 39
On stairs 393 12,404 130,747 2,968 287
From ladders/scaffolding 68 3,771 23,106 1,022 90
Diving <5 194 3,156 56 10
Other 2,985 60,664 398,540 8,882 812
Total 4,071 128,389 1,036,079 23,236 1,969
Injury in Canada ! 24

The Cost of Injury in Canada 2015
Table 9
Rates of injury deaths, hospitalizations, and emergency room visits due to falls by age and sex, Canada, 2010
Death rates for falls among men and women aged 85 and older were by far the highest of all the age groups at 396 and 328 per 100,000 population respectively; for hospitalized treatment and emergency room visits women aged 85 and older had higher rates. Forty-eight percent more women are hospitalized than men (6,324 vs 4,278) and have more emergency room visits than males (15,185 vs 11,889).
Rate per 100,000 population
Description Deaths Hospitalizations
Emergency Room Visits
Permanent Partial
Disability
Permanent Total
Disability
Male 0-4 0.21 151.48 5,845.36 64.83 5.55
Male 5-9 0.11 147.17 3,840.53 58.35 4.21
Male 10-14 0.10 137.50 4,581.92 61.97 4.53
Male 15-19 0.87 125.29 3,082.91 46.19 3.51
Male 20-24 1.44 121.16 2,472.93 41.83 3.52
Male 25-64 3.18 180.63 1,930.32 52.07 4.87
Male 65-74 18.56 552.27 2,786.29 136.69 15.68
Male 75-84 83.54 1,475.65 5,339.16 136.69 15.68
Male 85+ 396.29 4,277.54 11,889.13 136.69 15.68
Female 0-4 0.11 118.77 4,844.83 53.03 4.52
Female 5-9 0.00 120.27 3,478.76 51.42 3.57
Female 10-14 0.00 72.91 3,738.57 39.66 3.00
Female 15-19 0.09 54.03 2,412.11 25.26 1.97
Female 20-24 0.44 59.71 1,993.51 25.06 1.86
Female 25-64 0.83 167.01 2,205.58 53.32 3.97
Female 65-74 10.33 783.07 4,036.33 210.74 16.14
Female 75-84 60.01 2,377.57 7,524.40 210.74 16.14
Female 85+ 327.94 6,323.72 15,185.41 210.74 16.14
Injury in Canada ! 25

The Cost of Injury in Canada 2015
Table 10
Total, direct, indirect, and per capita cost of falls by age and sex, Canada, 2010
* Indirect costs are societal productivity costs, which only include lost earnings if the individual can’t perform their job. This presumes no lost earnings for those over 65 because they no longer work.
DescriptionReference Population
Total Costs ($ Millions)
Direct Costs ($ millions)
Indirect Costs ($ millions)
Per Capita Costs ($)
Male, all ages 16,847,961 4,138 2,929 1,209 245.63
Female, all ages 17,157,313 4,542 3,722 820 264.73
Both, all ages 34,005,274 8,680 6,651 2,029 510.36
Both 0-4 1,873,393 447 256 190 238.36
Both 5-9 1,791,353 391 217 174 218.30
Both 10-14 1,959,726 410 212 199 209.47
Both 15-19 2,249,523 373 197 177 165.98
Both 20-24 2,322,472 375 205 170 161.44
Both 25-64 19,012,664 3,316 2,197 1,118 174.39
Both 65-74 2,579,541 879 879 N/A 340.93
Both 75-84 1,598,413 1,268 1,268 N/A 793.41
Both 85+ 618,189 1,221 1,221 N/A 1,974.45
Male 0-4 959,864 254 147 107 264.77
Male 5-9 920,003 213 117 96 231.94
Male 10-14 1,006,518 255 131 124 253.58
Male 15-19 1,150,163 245 127 118 212.83
Male 20-24 1,178,626 245 134 112 208.28
Male 25-64 9,509,997 1,784 1,132 653 187.61
Male 65-74 1,233,815 369 369 N/A 298.85
Male 75-84 691,899 454 454 N/A 656.03
Male 85+ 197,076 318 318 N/A 1,615.82
Female 0-4 913,529 192 109 83 210.61
Female 5-9 871,350 178 99 79 203.90
Female 10-14 953,208 155 80 75 162.88
Female 15-19 1,099,360 129 70 59 116.98
Female 20-24 1,143,846 129 71 59 113.17
Female 25-64 9,502,667 1,531 1,066 466 161.16
Female 65-74 1,345,726 511 511 N/A 379.51
Female 75-84 906,514 814 814 N/A 898.26
Female 85+ 421,113 902 902 N/A 2,142.29
Injury in Canada ! 26
The Cost of Injury in Canada 2015
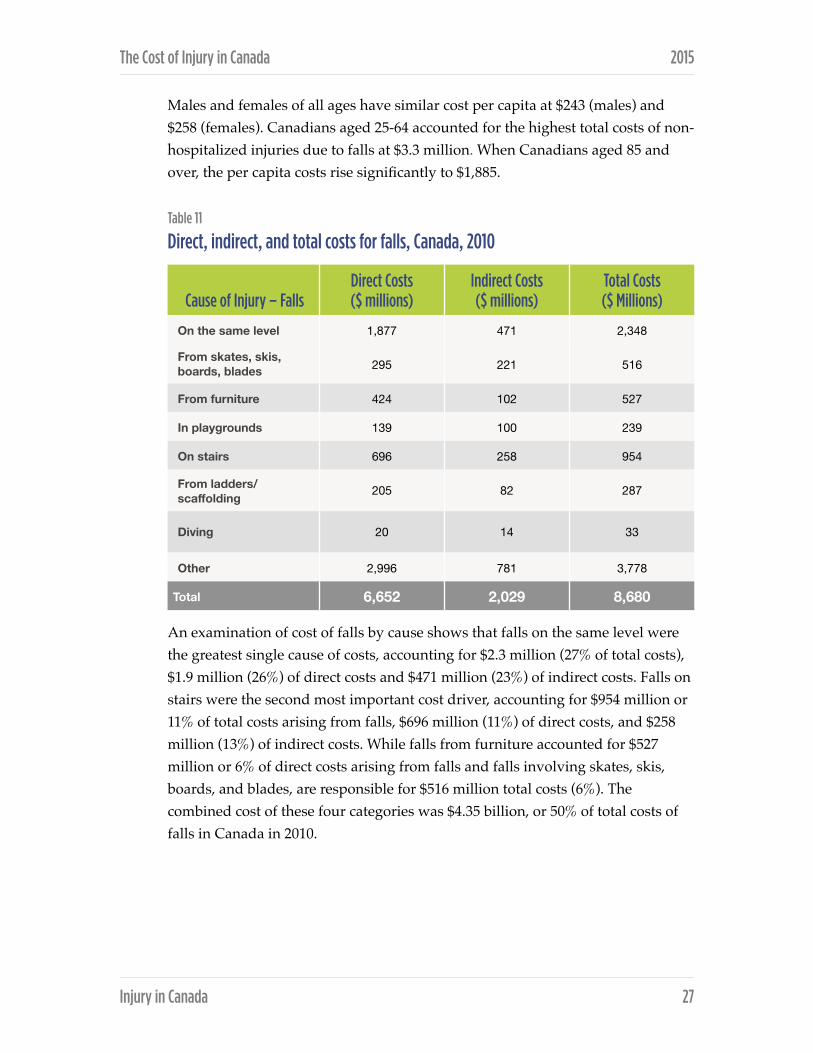
Males and females of all ages have similar cost per capita at $243 (males) and $258 (females). Canadians aged 25-64 accounted for the highest total costs of non-hospitalized injuries due to falls at $3.3 million. When Canadians aged 85 and over, the per capita costs rise significantly to $1,885.
Table 11
Direct, indirect, and total costs for falls, Canada, 2010
An examination of cost of falls by cause shows that falls on the same level were the greatest single cause of costs, accounting for $2.3 million (27% of total costs), $1.9 million (26%) of direct costs and $471 million (23%) of indirect costs. Falls on stairs were the second most important cost driver, accounting for $954 million or 11% of total costs arising from falls, $696 million (11%) of direct costs, and $258 million (13%) of indirect costs. While falls from furniture accounted for $527 million or 6% of direct costs arising from falls and falls involving skates, skis, boards, and blades, are responsible for $516 million total costs (6%). The combined cost of these four categories was $4.35 billion, or 50% of total costs of falls in Canada in 2010.
Cause of Injury – FallsDirect Costs ($ millions)
Indirect Costs ($ millions)
Total Costs ($ Millions)
On the same level 1,877 471 2,348
From skates, skis, boards, blades 295 221 516
From furniture 424 102 527
In playgrounds 139 100 239
On stairs 696 258 954
From ladders/scaffolding 205 82 287
Diving 20 14 33
Other 2,996 781 3,778
Total 6,652 2,029 8,680
Injury in Canada ! 27
The Cost of Injury in Canada 2015
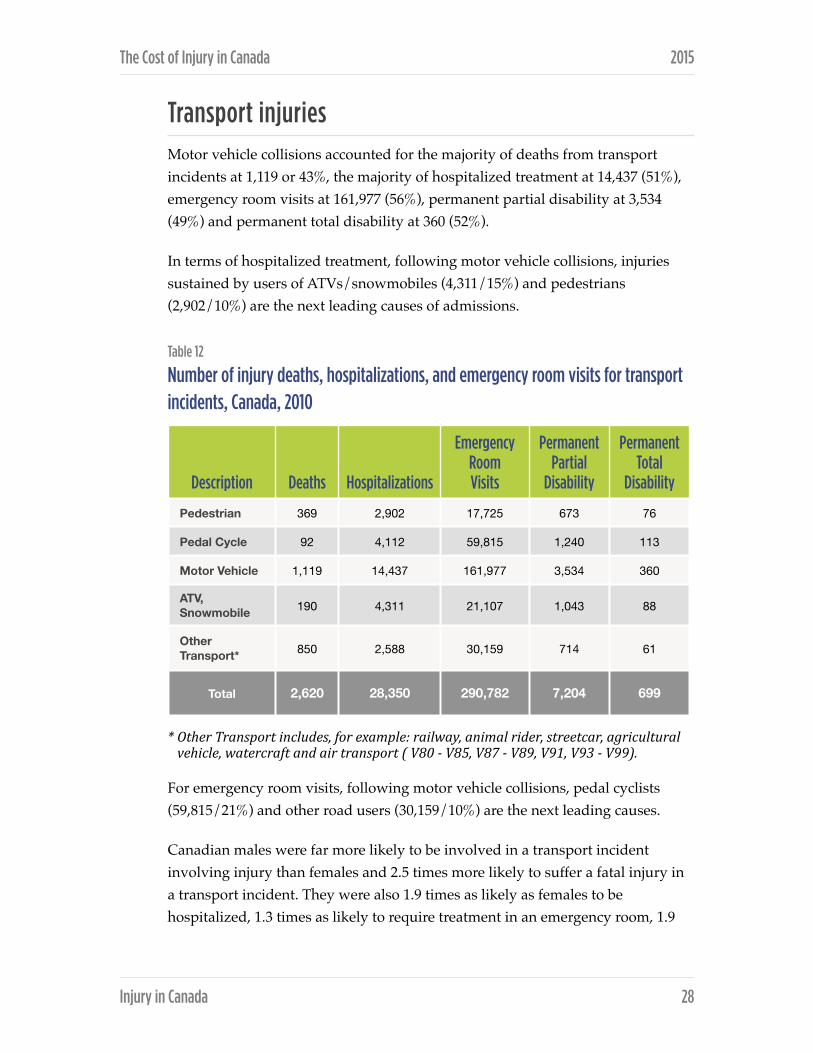
Transport injuries Motor vehicle collisions accounted for the majority of deaths from transport incidents at 1,119 or 43%, the majority of hospitalized treatment at 14,437 (51%), emergency room visits at 161,977 (56%), permanent partial disability at 3,534 (49%) and permanent total disability at 360 (52%).
In terms of hospitalized treatment, following motor vehicle collisions, injuries sustained by users of ATVs/snowmobiles (4,311/15%) and pedestrians (2,902/10%) are the next leading causes of admissions.
Table 12
Number of injury deaths, hospitalizations, and emergency room visits for transport incidents, Canada, 2010
* Other Transport includes, for example: railway, animal rider, streetcar, agricultural vehicle, watercraft and air transport ( V80 -‐ V85, V87 -‐ V89, V91, V93 -‐ V99).
For emergency room visits, following motor vehicle collisions, pedal cyclists (59,815/21%) and other road users (30,159/10%) are the next leading causes.
Canadian males were far more likely to be involved in a transport incident involving injury than females and 2.5 times more likely to suffer a fatal injury in a transport incident. They were also 1.9 times as likely as females to be hospitalized, 1.3 times as likely to require treatment in an emergency room, 1.9
Description Deaths Hospitalizations
Emergency Room Visits
Permanent Partial
Disability
Permanent Total
Disability
Pedestrian 369 2,902 17,725 673 76
Pedal Cycle 92 4,112 59,815 1,240 113
Motor Vehicle 1,119 14,437 161,977 3,534 360
ATV, Snowmobile 190 4,311 21,107 1,043 88
Other Transport* 850 2,588 30,159 714 61
Total 2,620 28,350 290,782 7,204 699
Injury in Canada ! 28

The Cost of Injury in Canada 2015
times more likely to sustain a permanent partial disability, and twice as likely to be permanently totally disabled as a result of a transport incident.
Table 13
Rates of death, hospitalization, non-hospitalization, and permanent disability for transport incidents by age and sex, Canada, 2010
Rate per 100,000 population
Description Deaths Hospitalizations
Emergency Room Visits
Permanent Partial
Disability
Permanent Total
Disability
Male 0-4 1.67 17.29 286.87 4.25 0.47
Male 5-9 1.30 44.24 674.58 12.06 1.02
Male 10-14 2.09 95.97 1,316.44 26.22 2.28
Male 15-19 17.04 164.76 1,685.55 41.53 4.04
Male 20-24 18.75 164.94 1,607.02 42.03 4.20
Male 25-64 11.24 113.39 929.80 28.69 2.78
Male 65-74 12.89 102.04 530.79 23.18 2.89
Male 75-84 17.34 119.82 514.80 23.18 2.89
Male 85+ 26.89 149.69 506.45 23.18 2.89
Female 0-4 1.53 11.93 207.27 3.14 0.30
Female 5-9 1.15 29.95 494.17 8.54 0.73
Female 10-14 1.78 41.54 716.34 12.19 1.18
Female 15-19 8.00 82.05 1,282.97 21.75 2.15
Female 20-24 7.17 71.78 1,379.71 20.81 1.96
Female 25-64 3.70 53.87 797.55 15.15 1.37
Female 65-74 5.28 69.11 485.04 17.14 1.63
Female 75-84 8.71 98.73 456.45 17.14 1.63
Female 85+ 9.50 88.57 319.18 17.14 1.63
Injury in Canada ! 29
The Cost of Injury in Canada 2015
Males were particularly at risk of transport-related injury, with males aged 85+ experiencing the highest death rate (26.89 per 100,000 population). Young males between the ages of 15-19 (17.04 per 100,000 population) and 20-24 (18.75 per 100,000 population) were the next highest category and the same age ranges (15-19 and 20-24) experiencing the highest rates of hospitalization (164.8 per 100,000 population). In terms of emergency room visits, males aged 15-19 had the highest rates (1,685.55 per 100,000 population), while males aged 20-24 sustained the highest rates of permanent partial disability (42.03 per 100,000 population) and permanent total disability (4.20 per 100,000 population).
The risk of fatal injury in a transport incident was lower among Canadians aged 25-74 compared with younger Canadians. Both males and females over 75 years of age were more likely to be fatally injured in a transport incident than their counterparts aged 25-64; however, males over 85 were more likely to be hospitalized than males aged 25-64, males aged 25-64 were more likely to visit an emergency room, or incur a permanent partial disability from such an injury than males aged 25-64. Females over age 75, however, were more likely than those aged 25-64 to be hospitalized while those over age 25 were almost equally likely to incur a permanent partial or total disability. Females aged 75+ were less likely to receive emergency room visits.
Per capita costs arising from transport-related injuries were double for males ($169.46) than females ($83.58). Males aged 20-24 had the highest per capita cost of transport-related injury at $379.90 – 3.0 times higher than the cost for Canadians in general. The per capita cost for injuries involving males aged 15-19 was almost as high at $371.77 and also 3.0 times higher than that for Canadians overall.
Per capita costs related to transport incidents also declined with age, despite the fact that Canadians over 65 had a higher rate of fatal injury and hospitalization than those aged 25-64. This may be due in part to the methodology used for this report which assumes retirement from the labour market at age 65 and, therefore, does not assign indirect costs from lost labour market productivity to injury cases in this age group.
Injury in Canada ! 30

The Cost of Injury in Canada 2015
Table 14
Total, direct, indirect, and per capita costs of injury due to transport incidents by age and sex, Canada, 2010
DescriptionReference Population
Total Costs ($ Millions)
Direct Costs ($ millions)
Indirect Costs ($ millions)
Per Capita Costs ($)
Male, all ages 16,847,961 2,855 1,360 1,495 169.46
Female, all ages 17,157,313 1,434 785 649 83.58
Both 0-4 1,873,393 56 23 33 29.98
Both 5-9 1,791,353 106 55 51 58.97
Both 10-14 1,959,726 219 108 111 111.66
Both 15-19 2,249,523 649 251 399 288.67
Both 20-24 2,322,472 658 266 392 283.26
Both 25-64 19,012,664 2,356 1,197 1,159 123.92
Both 65-74 2,579,541 128 128 N/A 49.47
Both 75-84 1,598,413 88 88 N/A 55.12
Both 85+ 618,189 30 30 N/A 47.75
Both, all ages 34,005,274 4,289 2,145 2,144 253.04
Male 0-4 959,864 30 12 18 31.58
Male 5-9 920,003 62 32 29 67.25
Male 10-14 1,006,518 143 71 72 142.14
Male 15-19 1,150,163 428 157 271 371.77
Male 20-24 1,178,626 448 170 278 379.90
Male 25-64 9,509,997 1,611 785 826 169.42
Male 65-74 1,233,815 76 76 N/A 61.59
Male 75-84 691,899 45 45 N/A 64.95
Male 85+ 197,076 12 12 N/A 62.34
Female 0-4 913,529 26 11 14 28.30
Female 5-9 871,350 44 22 21 50.22
Female 10-14 953,208 76 37 39 79.48
Female 15-19 1,099,360 222 94 128 201.72
Female 20-24 1,143,846 210 96 114 183.68
Female 25-64 9,502,667 745 412 333 78.37
Female 65-74 1,345,726 52 52 N/A 38.35
Female 75-84 906,514 43 43 N/A 47.61
Female 85+ 421,113 17 17 N/A 40.93
Injury in Canada ! 31

The Cost of Injury in Canada 2015
Table 15
Direct, indirect, and total costs for injury from transport incidents, by cause, Canada, 2010 ($ Millions)
Motor vehicle collisions are the greatest single cost totaling $2.2 billion and accounting for 50% of all transport-related incidents. In terms of direct and indirect costs, again motor vehicle collisions have the highest costs, $1.2 billion and $987 million, respectively.
Looking at the other causes of transport incidents in 2010, pedal cyclists account for the next highest direct costs at $293 million, followed by pedestrians at $234 million, while ATV/snowmobile users account for the highest indirect costs at $245 million.
Intentional injuries While unintentional injuries make up the majority of injuries in Canada, intentional injury comprising violence and suicide/self-harm accounted for 4,463 deaths and over $4 billion in total costs in 2010.
Suicide/self-harm was the leading cause of intentional injury deaths (88% - 3948/4463), hospitalizations (67% -16131/24200), and permanent partial disability (64% - 3443/5376).
However, injuries resulting from violence accounted for a much higher proportion of related emergency room visits (74% - 97360/132,037) and a higher proportion (54% - 202/377) of estimated cases of permanent total disability.
Cause of Injury – Transport
Direct Costs ($ millions)
Indirect Costs ($ millions)
Total Costs ($ Millions)
Pedestrian 234 225 458
Pedal Cycle 293 213 506
Motor Vehicle 1,190 987 2,177
ATV, Snowmobile 262 245 507
Other 167 474 641
Total 2,114 2,144 4,289
Injury in Canada ! 32
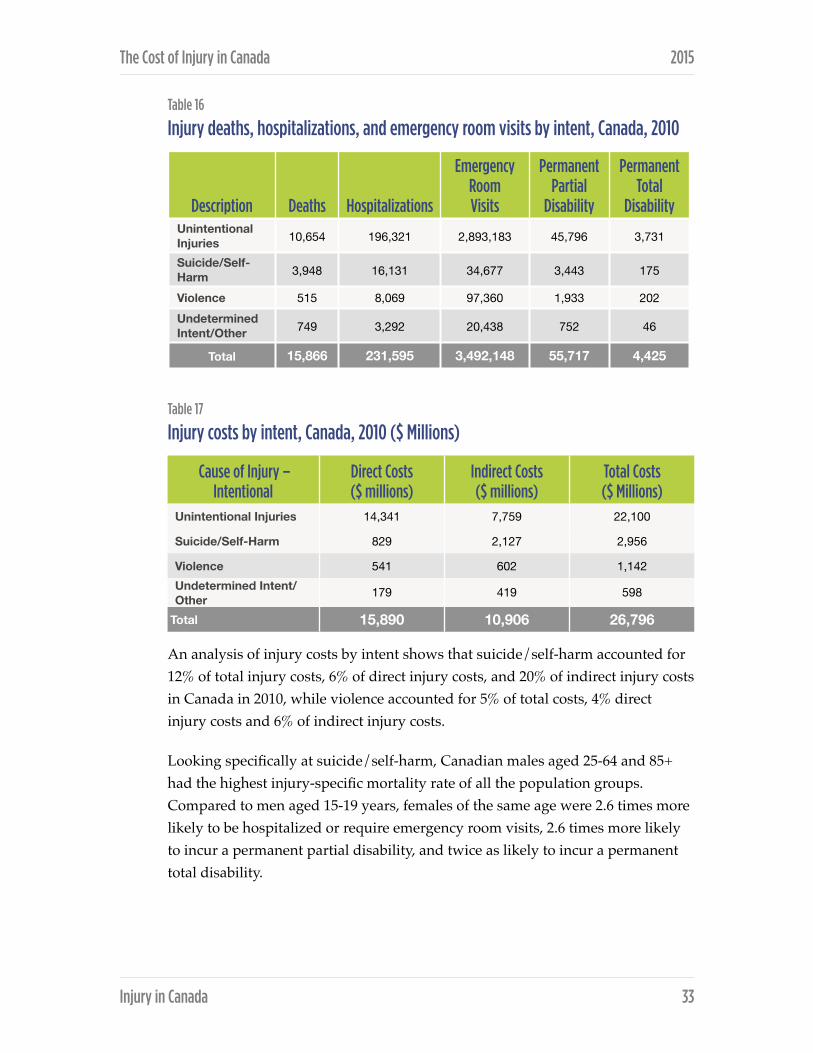
The Cost of Injury in Canada 2015
Table 16
Injury deaths, hospitalizations, and emergency room visits by intent, Canada, 2010
Table 17
Injury costs by intent, Canada, 2010 ($ Millions)
An analysis of injury costs by intent shows that suicide/self-harm accounted for 12% of total injury costs, 6% of direct injury costs, and 20% of indirect injury costs in Canada in 2010, while violence accounted for 5% of total costs, 4% direct injury costs and 6% of indirect injury costs.
Looking specifically at suicide/self-harm, Canadian males aged 25-64 and 85+ had the highest injury-specific mortality rate of all the population groups. Compared to men aged 15-19 years, females of the same age were 2.6 times more likely to be hospitalized or require emergency room visits, 2.6 times more likely to incur a permanent partial disability, and twice as likely to incur a permanent total disability.
Description Deaths Hospitalizations
Emergency Room Visits
Permanent Partial
Disability
Permanent Total
Disability Unintentional Injuries 10,654 196,321 2,893,183 45,796 3,731
Suicide/Self-Harm 3,948 16,131 34,677 3,443 175
Violence 515 8,069 97,360 1,933 202 Undetermined Intent/Other 749 3,292 20,438 752 46
Total 15,866 231,595 3,492,148 55,717 4,425
Cause of Injury – Intentional
Direct Costs ($ millions)
Indirect Costs ($ millions)
Total Costs ($ Millions)
Unintentional Injuries 14,341 7,759 22,100
Suicide/Self-Harm 829 2,127 2,956
Violence 541 602 1,142Undetermined Intent/Other 179 419 598
Total 15,890 10,906 26,796
Injury in Canada ! 33

The Cost of Injury in Canada 2015
Table 18
Rates of death, hospitalization, non-hospitalization, and permanent disability for suicide/self-harm by age and sex, Canada, 2010
* Ages 0-‐4 excluded
Rate per 100,000 population
Description Deaths Hospitalizations
Emergency Room Visits
Permanent Partial
Disability
Permanent Total
Disability Male, all ages 17.69 39.14 79.64 7.97 0.45
Female, all ages 5.64 55.59 123.91 12.24 0.58
Both, all ages 11.61 47.44 101.97 10.13 0.52
Both 5-9 0.00 0.33 1.40 0.07 0.00
Both 10-14 1.63 23.37 55.19 4.09 0.15
Both 15-19 8.76 99.84 286.35 19.07 0.83
Both 20-24 12.40 74.23 214.57 14.86 0.71
Both 25-64 15.32 56.25 110.12 12.43 0.66
Both 65-74 10.43 21.94 26.54 4.62 0.26
Both 75-84 11.20 17.83 18.90 4.64 0.26
Both 85+ 11.32 22.65 23.29 4.70 0.25
Male 5-9 0.00 0.54 1.91 0.12 0.01
Male 10-14 1.89 9.54 21.55 1.59 0.08
Male 15-19 12.61 56.60 153.61 10.78 0.55
Male 20-24 19.09 57.35 153.75 10.74 0.58
Male 25-64 22.91 49.24 95.33 10.32 0.58
Male 65-74 17.18 21.72 24.29 4.35 0.28
Male 75-84 21.53 21.10 19.04 4.35 0.28
Male 85+ 25.88 31.97 28.94 4.35 0.28
Female 5-9 0.00 0.11 0.86 0.03 0.00
Female 10-14 1.36 37.98 90.72 6.73 0.22
Female 15-19 4.73 145.08 425.22 27.74 1.11
Female 20-24 5.51 91.62 277.24 19.10 0.84
Female 25-64 7.72 63.27 124.91 14.54 0.73
Female 65-74 4.24 22.14 28.60 4.87 0.24
Female 75-84 3.31 15.33 18.79 4.87 0.24
Female 85+ 4.51 18.28 20.65 4.87 0.24
Injury in Canada ! 34

The Cost of Injury in Canada 2015
Table 19
Total, direct, indirect, and per capita costs of injury due to suicide/self-harm incidents by age and sex, Canada, 2010
* Ages 0-‐4 excluded
DescriptionReference Population
Total Costs ($ Millions)
Direct Costs ($ millions)
Indirect Costs ($ millions)
Per Capita Costs ($)
Male, all ages 16,847,961 1,775 332 1,443 105.33
Female, all ages 17,157,313 1,181 497 684 68.84
Both, all ages 34,005,274 2,956 829 2,127 175.43
Both 0-4 1,873,393 -- -- -- --
Both 5-9 1,791,353 0.62 0.39 0.23 0.35
Both 10-14 1,959,726 66 26 40 33.49
Both 15-19 2,249,523 367 125 242 163.37
Both 20-24 2,322,472 378 94 285 162.87
Both 25-64 19,012,664 2,102 542 1,559 110.53
Both 65-74 2,579,541 22 22 N/A 8.70
Both 75-84 1,598,413 13 13 N/A 8.31
Both 85+ 618,189 5 5 N/A 8.77
Male 0-4 959,864 -- -- -- --
Male 5-9 920,003 0.51 0.32 0.19 0.55
Male 10-14 1,006,518 25 7 18 24.76
Male 15-19 1,150,163 181 36 145 156.95
Male 20-24 1,178,626 233 35 198 198.06
Male 25-64 9,509,997 1,314 233 1,081 138.20
Male 65-74 1,233,815 11 11 N/A 8.90
Male 75-84 691,899 7 7 N/A 9.96
Male 85+ 197,076 3 3 N/A 12.86
Female 0-4 913,529 -- -- -- --
Female 5-9 871,350 0.11 0.07 0.04 0.13
Female 10-14 953,208 41 19 21 42.72
Female 15-19 1,099,360 187 89 98 170.09
Female 20-24 1,143,846 145 59 86 126.61
Female 25-64 9,502,667 787 309 478 82.85
Female 65-74 1,345,726 11 11 N/A 8.52
Female 75-84 906,514 6 6 N/A 7.04
Female 85+ 421,113 3 3 N/A 6.85
Injury in Canada ! 35

The Cost of Injury in Canada 2015
Among males, adults aged 85 and older were most likely to die from suicide/self-harm (25.88 per 100,000), while those aged 20-24 were most likely to be hospitalized (57.35) and males aged 20-64 were most likely to incur a permanent disability. Males aged 20-24 were most likely to require an emergency room visit (153.75), however, followed closely by those aged 15-19 (153.61).
Among females, women aged 25-64 were most likely to die from suicide/self-harm (7.72 per 100,000), while girls aged 15-19 were most likely to be hospitalized (145.08), -visit the emergency room (425.22), or incur a permanent disability.
The costs of suicide/self-harm are highest for youth aged 15-24. Canadians aged 15-19 of both sexes generated the highest per capita costs of any age group at $163.37, followed by those aged 20-24 at $162.87.
Per capita costs of injuries due to suicide/self-harm were 1.5 times higher for males than females, and highest of all for young males age 20-24 ($198.06), followed closely by young females aged 15-19 ($170.09).
An examination of injuries arising from violence shows that males were almost three times as likely as females to be killed as a result of violence, 4.4 times more likely to be hospitalized, 2.6 times more likely to present to emergency room, 4.2 times as likely to incur a permanent partial disability and 4.7 as likely to incur permanent total disability.
Canadians aged 20-24 were at the greatest risk of injury from violence. When compared with the average Canadian, they were 2.1 times more likely to die from violence, 2.9 times more likely to be hospitalized, 3.7 times more likely to present to an emergency room, 3.2 times as likely to incur a permanent partial disability, and 2.9 times more likely to be permanently totally disabled.
Injury in Canada ! 36

The Cost of Injury in Canada 2015
Table 20
Rates of death, hospitalization, emergency room visits, and permanent disability for violence by age and sex, Canada, 2010
Rate per 100,000 population
Description Deaths Hospitalizations
Emergency Room Visits
Permanent Partial
Disability
Permanent Total
Disability Male, all ages 2.27 38.88 413.37 9.23 0.98
Female, all ages 0.78 8.85 161.54 2.20 0.21
Both, all ages 1.51 23.73 286.31 5.69 0.59 Both 0-4 1.39 11.00 28.48 1.78 0.36 Both 5-9 0.11 1.51 34.14 0.41 0.05
Both 10-14 0.20 4.39 174.51 1.61 0.17 Both 15-19 2.00 44.19 818.63 12.11 1.14 Both 20-24 3.19 69.06 964.00 17.97 1.69 Both 25-64 1.71 25.51 265.17 5.92 0.62 Both 65-74 0.74 4.73 35.50 0.98 0.18 Both 75-84 0.69 7.38 28.92 0.94 0.17 Both 85+ 1.29 9.87 31.78 0.86 0.15 Male 0-4 1.77 12.92 27.13 1.96 0.50 Male 5-9 0.22 1.96 45.75 0.57 0.07
Male 10-14 0.10 4.97 241.99 2.21 0.22 Male 15-19 3.13 74.60 1,170.23 19.73 1.86 Male 20-24 5.01 117.59 1,466.21 30.06 2.86 Male 25-64 2.58 41.66 367.04 9.45 1.02 Male 65-74 1.05 6.65 46.42 1.34 0.28 Male 75-84 0.72 7.37 33.97 1.34 0.28 Male 85+ 2.03 10.15 36.83 1.34 0.28
Female 0-4 0.99 8.98 29.90 1.59 0.21 Female 5-9 0.00 1.03 21.87 0.24 0.02
Female 10-14 0.31 3.78 103.27 0.99 0.11 Female 15-19 0.82 12.37 450.79 4.13 0.38 Female 20-24 1.31 19.06 446.52 5.51 0.49 Female 25-64 0.85 9.36 163.23 2.38 0.22 Female 65-74 0.45 2.97 25.49 0.64 0.09 Female 75-84 0.66 7.39 25.06 0.64 0.09 Female 85+ 0.95 9.74 29.41 0.64 0.09
Injury in Canada ! 37
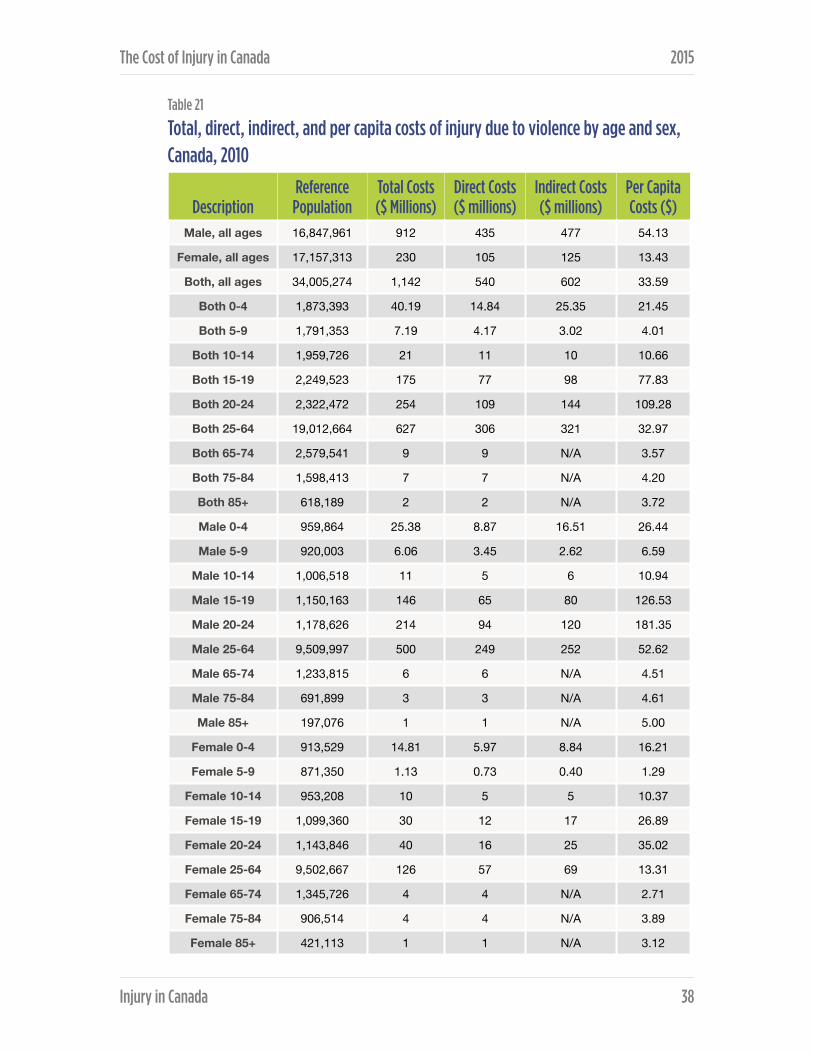
The Cost of Injury in Canada 2015
Table 21
Total, direct, indirect, and per capita costs of injury due to violence by age and sex, Canada, 2010
DescriptionReference Population
Total Costs ($ Millions)
Direct Costs ($ millions)
Indirect Costs ($ millions)
Per Capita Costs ($)
Male, all ages 16,847,961 912 435 477 54.13
Female, all ages 17,157,313 230 105 125 13.43
Both, all ages 34,005,274 1,142 540 602 33.59
Both 0-4 1,873,393 40.19 14.84 25.35 21.45
Both 5-9 1,791,353 7.19 4.17 3.02 4.01
Both 10-14 1,959,726 21 11 10 10.66
Both 15-19 2,249,523 175 77 98 77.83
Both 20-24 2,322,472 254 109 144 109.28
Both 25-64 19,012,664 627 306 321 32.97
Both 65-74 2,579,541 9 9 N/A 3.57
Both 75-84 1,598,413 7 7 N/A 4.20
Both 85+ 618,189 2 2 N/A 3.72
Male 0-4 959,864 25.38 8.87 16.51 26.44
Male 5-9 920,003 6.06 3.45 2.62 6.59
Male 10-14 1,006,518 11 5 6 10.94
Male 15-19 1,150,163 146 65 80 126.53
Male 20-24 1,178,626 214 94 120 181.35
Male 25-64 9,509,997 500 249 252 52.62
Male 65-74 1,233,815 6 6 N/A 4.51
Male 75-84 691,899 3 3 N/A 4.61
Male 85+ 197,076 1 1 N/A 5.00
Female 0-4 913,529 14.81 5.97 8.84 16.21
Female 5-9 871,350 1.13 0.73 0.40 1.29
Female 10-14 953,208 10 5 5 10.37
Female 15-19 1,099,360 30 12 17 26.89
Female 20-24 1,143,846 40 16 25 35.02
Female 25-64 9,502,667 126 57 69 13.31
Female 65-74 1,345,726 4 4 N/A 2.71
Female 75-84 906,514 4 4 N/A 3.89
Female 85+ 421,113 1 1 N/A 3.12
Injury in Canada ! 38

The Cost of Injury in Canada 2015
Canadians aged 20-24 were the most likely to present to emergency room visits for injuries due to violence (964 per 100,000 population).
While children were typically at lower risk of injuries from violence than adults or Canadians generally, very young children age 0-4 suffered significantly higher rates of mortality and hospitalization due to violence than children aged 5-14.
Canadians aged 20-24 had the highest per capita costs due to violence at $109.28 – 3.3 times higher than for Canadians overall. They were followed by youth aged 15-19, with a per capita cost of $77.83 – 2.3 times the average for all Canadians.
Violence related injury costs for males ($54.13 per capita) were 4.0 times higher than those for females ($13.43) and 1.61 times higher than those for Canadians overall.
Provincial comparison of age/sex standardized injury mortality rates
Table 22
Age/sex standardized mortality rates by cause of injury, Canada and by province, 2010
Jurisdiction Transport Falls Suicide ViolenceAlberta 9.1 2.6 12.0 1.7
British Columbia 7.7 4.8 10.5 1.4
Manitoba 8.2 7.0 11.5 4.0
New Brunswick 12.1 4.3 13.3 1.3
Newfoundland and Labrador 8.7 1.5 11.5 0.9
Nova Scotia 6.5 6.3 10.2 2.1
Ontario 5.1 6.2 8.5 1.4
Prince Edward Island 5.8 3.1 7.1 0.0
Quebec 7.0 2.2 13.0 0.9
Saskatchewan 14.6 6.1 11.9 2.4
Canada 7.2 4.6 10.9 1.5
Injury in Canada ! 39

The Cost of Injury in Canada 2015
The comparison of provincial age and sex-standardized rates for the four major causes of injury in 2010 illuminates some important differences between provinces.
The lowest mortality rate for transport deaths was in Ontario (5.1 deaths per 100,000), 29% below the national average and nearly three times less than the highest transport mortality rate observed in Saskatchewan (14.6 deaths per 100,000).
In 2010 Newfoundland and Labrador had the lowest mortality rate due to falls at 1.5 deaths per 100,000 (33% the national rate of 4.6 per 100,000). The highest rate of death — 7.0 deaths per 100,000 — was observed in Manitoba.
In Canada in 2010, the suicide mortality rate was 10.9 deaths per 100,000 citizens. Prince Edward Island experiences the lowest suicide rate at 7.1 deaths per 100,000 (65% of the national average) and New Brunswick had the highest rate at 13.3 deaths per 100,000 (1.2 times the national average).
Prince Edward Island also experienced the lowest rate of violent death (0.0 deaths/100,000). Manitoba experienced in 2010 the highest rate of deaths due to violence at 4.0 deaths per 100,000 (2.7 times the national average of 1.5 deaths per 100,000).
Table 23
Age/sex standardized injury mortality rates by cause, Canada, highest and lowest province, 2010
Cause of injury Lowest provincial rate National rate Highest provincial rate
Transport 5.1 Ontario
7.2 14.6 Saskatchewan
Falls1.5
Newfoundland and Labrador
4.6 7.0 Manitoba
Suicide 7.1 Prince Edward Island
10.9 13.3 New Brunswick
Violence 0.0 Prince Edward Island
1.5 4.0 Manitoba
Injury in Canada ! 40

The Cost of Injury in Canada 2015
Cost of injury by province
Table 24
Economic cost, health care costs & potential years of life lost, Canada & by province, 2010
Table 25
Economic cost, direct costs, and PYLL of injury, Canada and highest and lowest province, 2010
JurisdictionEconomic cost (per capita)
Health care costs (per capita)
Potential years of lost life
(per 100,000 population)
Alberta $1,083 $553 1,612
British Columbia $816 $495 1,370
Manitoba $958 $554 1,758
New Brunswick $924 $531 1,678
Newfoundland and Labrador $749 $477 1,358
Nova Scotia $839 $579 1,367
Ontario $667 $390 1,128
Prince Edward Island $739 $504 1,145
Quebec $715 $450 1,212
Saskatchewan $1,059 $576 1,953
Canada $788 $467 1,337
Lowest provincial rate National rate Highest provincial rate
Economic cost (per capita)
$667Ontario
$788 per capita
$1,083Alberta
Health care costs (per capita)
$390Ontario
$467 per capita
$579Nova Scotia
Potential years of lost life
(per 100,000 population)
1,128Ontario
1,337 per 100,000 population
1,953Saskatchewan
Injury in Canada ! 41

The Cost of Injury in Canada 2015
In 2010, the national economic cost of injury was $788 per capita. Overall per capita costs were lowest in Ontario ($667 per capita, 15% below the national average) and highest in Alberta ($1,083 per capita, nearly 1.4 times the national average).
Ontario also had the lowest per capita health care costs at $390 (16% below the national average) while Nova Scotia invested the highest, spending $579 per capita on injury-related health care costs (24% above the national average).
The lowest rate of potential years of life lost per 100,000 people was observed in Ontario – 1,128 (16% below the national average). Saskatchewan, where the rate was 1,953 per 100,000 (1.5 times the national average), had the highest rate of potential years of life lost.
Figure 10
Health care costs per capita and potential years of life lost (PYLL)* by province, 2010
Injury in Canada ! 42
BC
$495 1,370
PYLL
* per 100,000 population
AB
$553 1,612
PYLL
SK
$576 1,953
PYLL
MB
$554 1,758
PYLL
ON
$390 1,128
PYLL
QC
$450 1,212
PYLL
NL
$477 1,358
PYLL
PE
$504 1,145
PYLLNS
$579 1,367
PYLL
NB
$531 1,678
PYLL
CANADA
$467 1,337
PYLL
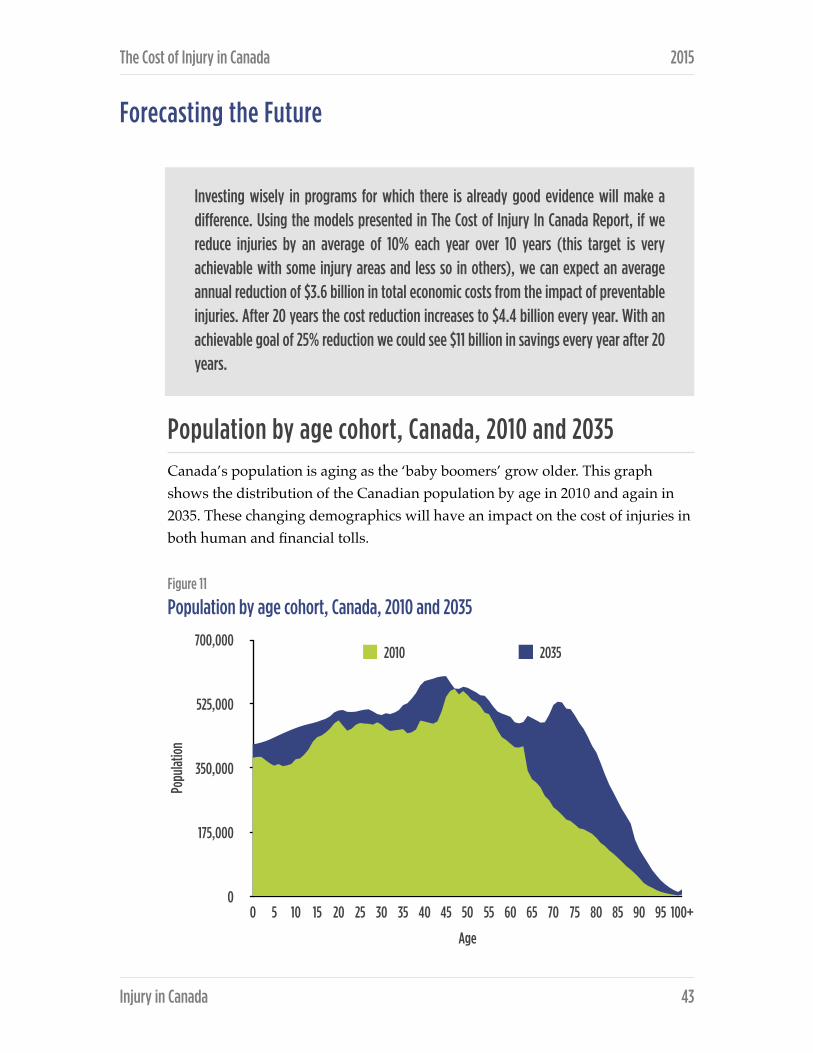
The Cost of Injury in Canada 2015
Forecasting the Future
Population by age cohort, Canada, 2010 and 2035 Canada’s population is aging as the ‘baby boomers’ grow older. This graph shows the distribution of the Canadian population by age in 2010 and again in 2035. These changing demographics will have an impact on the cost of injuries in both human and financial tolls.
Figure 11
Population by age cohort, Canada, 2010 and 2035
!
Popu
latio
n
0
175,000
350,000
525,000
700,000
Age
0 5 10 15 20 25 30 35 40 45 50 55 60 65 70 75 80 85 90 95 100+
2010 2035
Injury in Canada ! 43
Investing wisely in programs for which there is already good evidence will make a difference. Using the models presented in The Cost of Injury In Canada Report, if we reduce injuries by an average of 10% each year over 10 years (this target is very achievable with some injury areas and less so in others), we can expect an average annual reduction of $3.6 billion in total economic costs from the impact of preventable injuries. After 20 years the cost reduction increases to $4.4 billion every year. With an achievable goal of 25% reduction we could see $11 billion in savings every year after 20 years.

The Cost of Injury in Canada 2015
The following forecast scenarios were developed using the ERAT model, augmented by the Conference Board of Canada to include an injury forecast from 2011 to 2035. These scenarios are new to this 2015 Report. They focus on three major areas: seniors’ falls, speed reduction in transport incidents and head injuries in sports and recreation.
The forecasts take into account changes in population over time. With input from Statistics Canada’s demographic division, the Conference Board produces a full population forecast (until 2035) by age cohort for Canada, the ten provinces, and the three territories. This population forecast shows a significant aging of the population from now until 2035. This same population forecast is used for the standard ERAT and for the scenarios as well.
In addition, the Conference Board’s forecast for wages and inflation were used to create the forecast for hospital costs, medical costs, rehabilitation costs and foregone wages. Rest assured that these variables are applied to each year from 2011 to 2035, and not only applied to the year 2035.
By including a full population forecast, a full wage and inflation forecast, as well as an incidence forecast (for each injury) based on actual historical data, The Cost of Injury in Canada forecast is extremely robust.
The forecasts for all hospital, medical, and rehabilitation costs are calculated on a cost-per-case basis. As a result, a change in the incidence rate for a particular injury will lead to an identical change in the economic burden of that injury. For example, a 10% reduction in motor vehicle incidents over the forecast period will lead to a 10% decrease in the total cost of motor vehicle incidents.
Seniors’ falls As noted in this Report, falls were the leading cause of overall injury costs in Canada in 2010, accounting for $8.7 billion of the $26.8 billion. Falls accounted for $6.7 billion of direct costs of injury in 2010. A recent report from the Public Health Agency of Canada showed that between 20% and 30% of seniors fall each year. Research suggests that falls are the direct cause of 95% of all hip fractures,
Injury in Canada ! 44
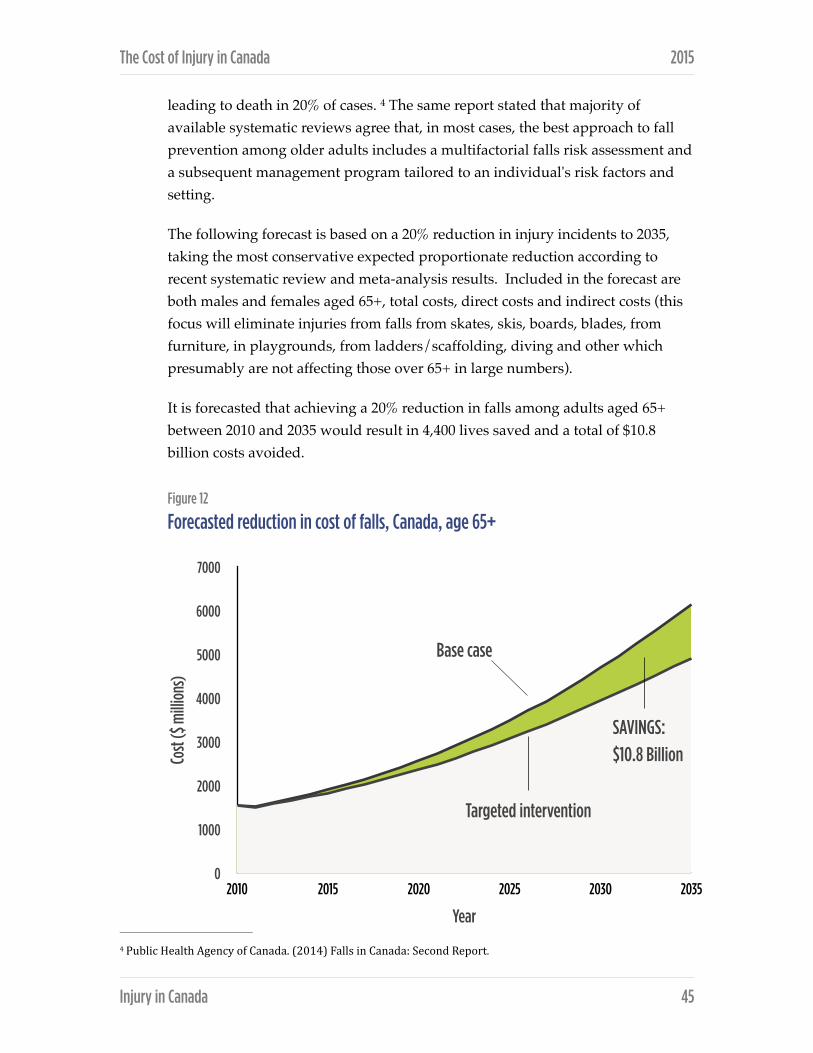
The Cost of Injury in Canada 2015
leading to death in 20% of cases. The same report stated that majority of 4
available systematic reviews agree that, in most cases, the best approach to fall prevention among older adults includes a multifactorial falls risk assessment and a subsequent management program tailored to an individual's risk factors and setting.
The following forecast is based on a 20% reduction in injury incidents to 2035, taking the most conservative expected proportionate reduction according to recent systematic review and meta-analysis results. Included in the forecast are both males and females aged 65+, total costs, direct costs and indirect costs (this focus will eliminate injuries from falls from skates, skis, boards, blades, from furniture, in playgrounds, from ladders/scaffolding, diving and other which presumably are not affecting those over 65+ in large numbers).
It is forecasted that achieving a 20% reduction in falls among adults aged 65+ between 2010 and 2035 would result in 4,400 lives saved and a total of $10.8 billion costs avoided.
Figure 12
Forecasted reduction in cost of falls, Canada, age 65+
Public Health Agency of Canada. (2014) Falls in Canada: Second Report.4
Injury in Canada ! 45
Cost
($ m
illio
ns)
0
1000
2000
3000
4000
5000
6000
7000
Year
2010 2015 2020 2025 2030 2035
Targeted intervention
Base case
SAVINGS:
$10.8 Billion

The Cost of Injury in Canada 2015
Speed reduction (transportation) Speed reduction has the potential to impact the majority of road users – pedestrians, cyclists and motor vehicle occupants. For example, the speed of a vehicle that strikes a pedestrian is a significant factor related to whether pedestrian survives the collision or dies. According to Transport Canada, for each 1.6 km reduction in average speed the chance of a collision with a pedestrian is reduced by 5%. For occupants of motor vehicles, the risk of a vehicle collision doubles at 5 km/h over the speed limit in a 60 km/h zone. - 5 6
Speed control (calming), and speed-camera networks in particular are effective at reducing speed related injury and death, and should be central to road safety and injury prevention initiatives. Speed control is a central tenet in Canada’s road safety vision to have the “safest roads in the world” . This requires that sufficient 7
resources can and will be provided to support enforcement of road safety laws to realize their full benefit; however, there is a strong cost effective case for this investment. Previous studies have demonstrated an average return of investment (ROI) of 5:1 after 1 year and 25:1 after 5 years. The benefit from avoided injuries was more than four times the cost of enforcement. 8
The following two scenarios outline two different interventions. The first is based on the intervention of speed cameras with a projected 15% decrease in death and injury (Figure 12) while the second scenario is based a speed calming intervention with a 30% decrease in deaths and a 50% reduction in injuries (Figure 13). Again, the approach used the most conservative expected proportionate reductions according to the recent research analyses.
Achieving a 15% reduction between 2010-2035 in injuries and deaths related to transport incidents will result in 3,200 lives saved and a total of $11.4 billion in costs avoided.
� Institute for Road Safety Research. (2009). SWOV Fact Sheet: The Relation Between Speed and Crashes. 5
� Gavin, A., Walker, E., Murdoch, C., Graham, A., Fernandes, R., Job, R.F.S. (YEAR) Is a focus on low level speeding justi]ied? 6Objective determination of the relative contributions of low and high level speeding to the road toll. Australasian Road Safety, Research, Policing and Education Conference, August – 3 September 2010, Canberra, Australian Capital Territory
� Transport Canada. 2011. Road Safety in Canada: Making Canada’s Roads the Safest in the World. Government of Canada; 7Ottawa, Ontario.
� Gains A, Heydecker B, Shrewbury J, Robertson S. 2004. The national safety camera programme: three-‐year evaluation report. 8http://www.dft.gov.uk/stellent/groups/dft_rdsafety/documents/page/dft_rdsafety_029193.hcsp
Injury in Canada ! 46

The Cost of Injury in Canada 2015
Figure 13
Forecasted reduction in cost of transport-related injuries and deaths from speed camera intervention, Canada, all ages
Figure 14
Forecasted reduction in cost of transport-related injuries and deaths from speed calming intervention, Canada, all ages
Injury in Canada ! 47
Cost
($ m
illio
ns)
0
1000
2000
3000
4000
5000
6000
7000
8000
Year
2010 2015 2020 2025 2030 2035
Targeted intervention
Base case
SAVINGS:
$11.4 Billion
Cost
($ m
illio
ns)
0
1000
2000
3000
4000
5000
6000
7000
8000
Year
2010 2015 2020 2025 2030 2035
Targeted intervention
Base case
SAVINGS:
$35 Billion

The Cost of Injury in Canada 2015
Achieving a 30% reduction in deaths and a 50% reduction in injuries related to transport incidents between 2010 and 2035 will result in 6,300 lives saved and a total of $35 billion transport costs avoided.
Sports & recreation (head injury) The introduction of standards and legislation for bicycle helmets was a logical progression after the successful introduction of motorcycle helmet legislation. Current legislation varies in other jurisdictions despite support from the medical community. Bicycle helmet legislation appears to be effective in increasing helmet use and decreasing head injury rates in the applicable populations.
A series of systematic reviews, including several Cochrane reviews, found that helmets reduced risk of head injuries while cycling. In one Cochrane review, helmets were estimated to reduce the risk of head and brain injuries by 69%, severe brain injuries by 74% and facial injuries by 65%, with similar effects for cyclists in collisions with motor vehicles and across all age groups. Another study found that helmets reduced head injury risk by 60%, brain injury risk by 58%, facial injuries by 47% and fatal injury by 73%. A reanalysis of this second study in 2011, which included more recent studies and adjustment for potential sources of bias, confirmed the protective effect of helmets on head injuries and facial injuries, although the effects were weakened.
Alpine skiing and snowboarding are popular winter activities worldwide, enjoyed by participants of all ages and skill levels. There is some evidence that the incidence of traumatic brain injury (TBI) and spinal cord injury (SCI) in these activities may be increasing coincidental with the development and acceptance of acrobatic and high-speed activities on the mountains. Head injuries are the most 9
common cause of death among skiers and snowboarders, and young male snowboarders are especially at risk of death from head injury.
Skiers and snowboarders with a helmet were significantly less likely than those without a helmet to have a head injury. There is evidence that helmets reduce 10
the risk of head injury by 22–60%.11
� A Ackery, B E Hagel, C Provvidenza, C H Tator An international review of head and spinal cord injuries in alpine skiing and 9snowboarding. Inj Prev 2007;13:368-‐375 doi:10.1136/ip.2007.017285
� Kelly Russell, Josh Christie, Brent E. Hagel. The effect of helmets on the risk of head and neck injuries among skiers and 10snowboarders: a meta-‐analysis. CMAJ March 9, 2010 vol. 182 no. 4 First published February 1, 2010, doi:10.1503/cmaj.091080 (In the studies included in this review, only one speci]ied ‘diagnosed concussion’ as included within the de]inition of head injury. Research suggests that helmet use does not prevent concussion.)
� Ibid11
Injury in Canada ! 48

The Cost of Injury in Canada 2015
The following forecast is a hybrid scenario developed to forecast a reduction in injury costs associated with sports and recreation. This scenario is based on a 25% reduction in risk of head injuries due to use of bicycle helmets among youth 5-19 year when blading, biking or skating and a 35% reduction in risk of head injuries due to use of ski/snowboard helmets among 0-64 year olds. Again, 12
taking conservative approach, these are the expected proportionate reductions according to the recent research analyses.
Achieving a 25% reduction in injuries associated with sports and recreation for ages 5-19 and a 35% reduction in injuries from skiing falls for ages 0-64 between 2010 and 2035 has the potential to result in 76,000 fewer hospitalizations or 1.4 million fewer hospitalization and emergency room visits combined and avoid a total of $5.5 billion in costs.
Figure 15
Forecasted reduction in injury costs from helmet use in sports and recreation injuries
� In the studies included in this review, only one speci]ied ‘diagnosed concussion’ as included within the de]inition of head 12injury. Research suggests that helmet use does not prevent concussion.
Injury in Canada ! 49
Cost
($ m
illio
ns)
0
500
1000
1500
2000
2500
3000
Year
2010 2015 2020 2025 2030 2035
Targeted intervention
Base case
SAVINGS:
$5.5 Billion

The Cost of Injury in Canada 2015
Provinces
The following chapters focus on the Canadian provinces. Each introduction has been provided by a representative(s) from that province who is a member of the Canadian Collaborating Centres for Injury Prevention (CCCIP) and outlines the state of injury prevention efforts as well as the different agencies and organizations responsible for injury prevention in that province. This information was gathered through the following survey questions:
❖ What is the structure of injury prevention in your province?
❖ Is there an injury prevention organization (e.g. BCIRPU)? If so, how is it funded?
❖ What injury issues does your province focus on?
❖ Does your province have stated priorities? Measurements? Targets?
❖ What is the investment in injury prevention?
❖ Who are the key players in injury prevention in your province?
❖ Is it led by a sector, e.g. transportation?
❖ Do the different fields/sectors communicate, conduct joint projects, etc.? If so can you provide an example?
Territories Due to the small cell sizes that affect the ability to report data and compromise privacy as well as the issue of non-comparable data, make it difficult to present information on the three territories therefore they are not included in this report.
Injury in Canada ! 50

ALBERTA Alberta’s health care delivery organization, Alberta Health Services, provides injury prevention policy direction and supports to health care delivery personnel through its Provincial Injury Prevention Program. Coordination of programs and initiatives to avoid duplication of efforts is ensured through on-going dialogue between Alberta Heath Services, the Injury Prevention Centre and the Ministry of Health. Key areas of focus for Alberta Health Services are suicide prevention, motor vehicle-related injuries and falls.
The Office of the Chief Medical Officer of Health is a significant advocate of injury prevention and will soon be releasing a report Preventing Injuries in Alberta: Taking Action. The goal of the report is to enrol every Albertan in injury prevention.
Alberta Transportation‘s Alberta Traffic Safety Plan: Saving Lives on Alberta’s Roads, a comprehensive strategy to reduce traffic-related deaths and injuries in the province outlines key initiatives to prevent motor vehicle collisions, build safer roads, establish and enforce traffic laws, and educate Albertans on traffic safety. The implementation of the plan continues to drive traffic safety in the Province.
The Ministry of Jobs, Skills, Labour and Training is responsible for workplace injury prevention and promotes health and safety through partnerships, resources, education and enforcement of the Occupational Health and Safety Act of Alberta.
The Injury Prevention Centre (formerly the Alberta Centre for Injury Control & Research), was established in 1998 by the Ministry of Health in recognition that injury prevention is a key component of public health and the role of injury prevention has in achieving a sustainable and effective health system. The Injury Prevention Centre is a catalyst for action by supporting communities and decision-makers with knowledge and tools and raising awareness about preventable injuries as an important component of life-long health and wellness.
The Centre’s current priorities focus on increasing awareness about preventable injuries along with reducing the incidence and severity of injuries that are common in Alberta, including falls, self-harm and suicide, poisoning and motor
Alberta ! 51
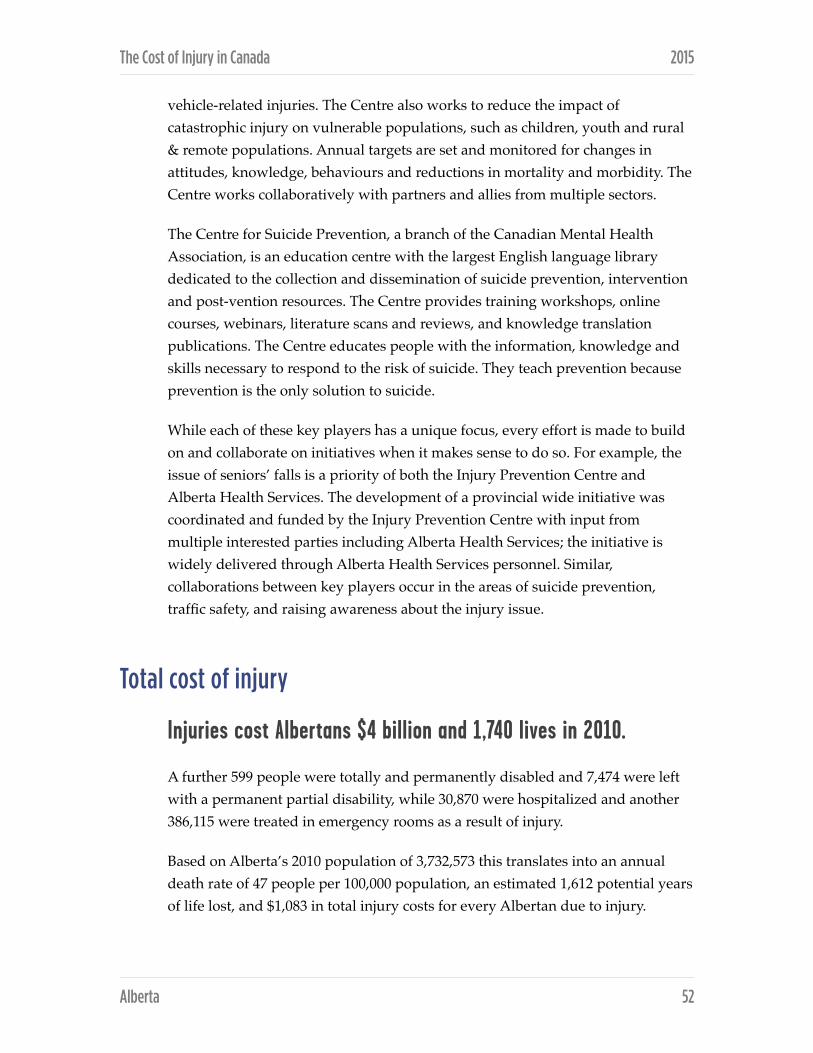
The Cost of Injury in Canada 2015
vehicle-related injuries. The Centre also works to reduce the impact of catastrophic injury on vulnerable populations, such as children, youth and rural & remote populations. Annual targets are set and monitored for changes in attitudes, knowledge, behaviours and reductions in mortality and morbidity. The Centre works collaboratively with partners and allies from multiple sectors.
The Centre for Suicide Prevention, a branch of the Canadian Mental Health Association, is an education centre with the largest English language library dedicated to the collection and dissemination of suicide prevention, intervention and post-vention resources. The Centre provides training workshops, online courses, webinars, literature scans and reviews, and knowledge translation publications. The Centre educates people with the information, knowledge and skills necessary to respond to the risk of suicide. They teach prevention because prevention is the only solution to suicide.
While each of these key players has a unique focus, every effort is made to build on and collaborate on initiatives when it makes sense to do so. For example, the issue of seniors’ falls is a priority of both the Injury Prevention Centre and Alberta Health Services. The development of a provincial wide initiative was coordinated and funded by the Injury Prevention Centre with input from multiple interested parties including Alberta Health Services; the initiative is widely delivered through Alberta Health Services personnel. Similar, collaborations between key players occur in the areas of suicide prevention, traffic safety, and raising awareness about the injury issue.
Total cost of injury
Injuries cost Albertans $4 billion and 1,740 lives in 2010.
A further 599 people were totally and permanently disabled and 7,474 were left with a permanent partial disability, while 30,870 were hospitalized and another 386,115 were treated in emergency rooms as a result of injury.
Based on Alberta’s 2010 population of 3,732,573 this translates into an annual death rate of 47 people per 100,000 population, an estimated 1,612 potential years of life lost, and $1,083 in total injury costs for every Albertan due to injury.
Alberta ! 52
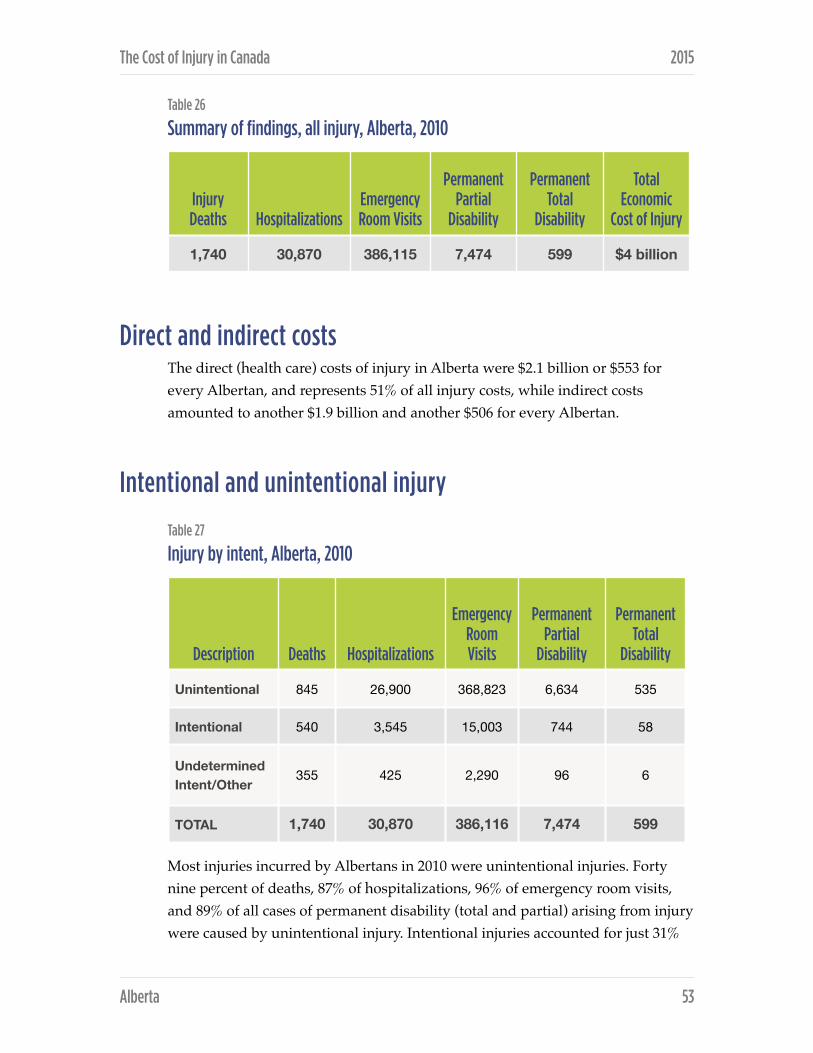
The Cost of Injury in Canada 2015
Table 26
Summary of findings, all injury, Alberta, 2010
Direct and indirect costs The direct (health care) costs of injury in Alberta were $2.1 billion or $553 for every Albertan, and represents 51% of all injury costs, while indirect costs amounted to another $1.9 billion and another $506 for every Albertan.
Intentional and unintentional injury Table 27
Injury by intent, Alberta, 2010
Most injuries incurred by Albertans in 2010 were unintentional injuries. Forty nine percent of deaths, 87% of hospitalizations, 96% of emergency room visits, and 89% of all cases of permanent disability (total and partial) arising from injury were caused by unintentional injury. Intentional injuries accounted for just 31%
Injury Deaths Hospitalizations
Emergency Room Visits
Permanent Partial
Disability
Permanent Total
Disability
Total Economic
Cost of Injury
1,740 30,870 386,115 7,474 599 $4 billion
Description Deaths Hospitalizations
Emergency Room Visits
Permanent Partial
Disability
Permanent Total
Disability
Unintentional 845 26,900 368,823 6,634 535
Intentional 540 3,545 15,003 744 58
Undetermined Intent/Other
355 425 2,290 96 6
TOTAL 1,740 30,870 386,116 7,474 599
Alberta ! 53

The Cost of Injury in Canada 2015
of deaths, 11% of hospitalizations, 4% of emergency room visits, and 10% of all cases of permanent disability arising from injury. The remaining incidents are of undetermined intent.
Table 28
Total, direct and indirect costs by intent of injury, Alberta, 2010
It is not surprising then, that unintentional injuries accounted for $3.13 billion or 77% of Alberta’s $4 billion total injury costs in 2010. Unintentional injuries were also responsible for $1.84 billion or 89% of Alberta’s $2.1 billion in direct injury costs and $1.3 billion or 65% of its $2 billion in indirect costs.
Intentional injuries were responsible for 16% of total costs, 10% of direct costs, and 24% of indirect costs arising from injury, while injuries of other or undetermined intent accounted for 6% of total costs, 1% of direct costs, and 11% of indirect costs.
Injury by cause In 2010, suicide/self-harm and transport incidents were the leading causes of death by injury in Alberta, accounting for 27% and 21% of deaths respectively. Injuries of undetermined intent accounted for a further 20% of injury deaths. Among the remaining deaths, falls were responsible for 11%, violence for 4%, unintentional poisoning for 2%, and drowning for 1%.
Hospitalizations due to injury were most often because of falls (48%), followed by transport incidents (14%) and suicide/self-harm (6%). Violence accounted for an additional 5% and unintentional poisoning resulted in 4%, while fire/burns and undetermined injuries each accounted for 1%.
DescriptionTotal costs
($ millions)Direct costs ($ millions)
Indirect costs ($ millions)
Unintentional $3,132 $1,838 $1,294
Intentional $667 $202 $466
Undetermined Intent/Other
$244 $25 $219
TOTAL $4,043 $2,065 $1,979
Alberta ! 54
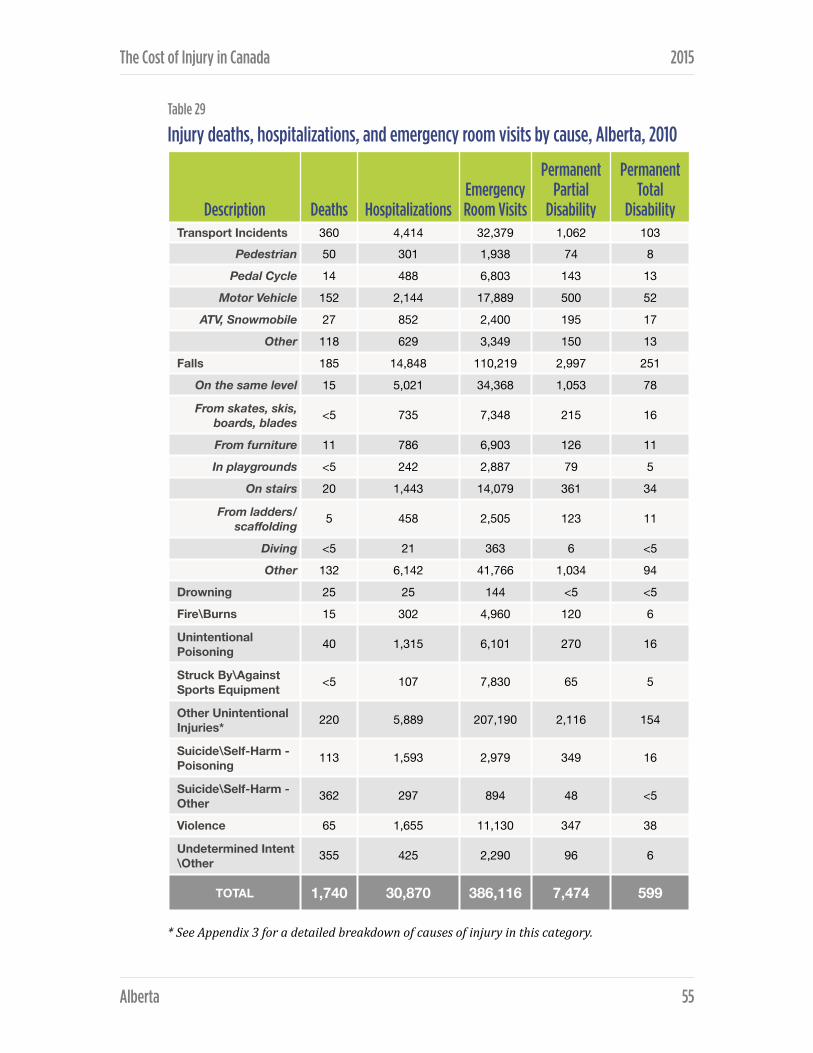
The Cost of Injury in Canada 2015
Table 29Injury deaths, hospitalizations, and emergency room visits by cause, Alberta, 2010
* See Appendix 3 for a detailed breakdown of causes of injury in this category.
Description Deaths HospitalizationsEmergency Room Visits
Permanent Partial
Disability
Permanent Total
Disability Transport Incidents 360 4,414 32,379 1,062 103
Pedestrian 50 301 1,938 74 8
Pedal Cycle 14 488 6,803 143 13
Motor Vehicle 152 2,144 17,889 500 52
ATV, Snowmobile 27 852 2,400 195 17
Other 118 629 3,349 150 13
Falls 185 14,848 110,219 2,997 251
On the same level 15 5,021 34,368 1,053 78
From skates, skis, boards, blades <5 735 7,348 215 16
From furniture 11 786 6,903 126 11
In playgrounds <5 242 2,887 79 5
On stairs 20 1,443 14,079 361 34
From ladders/scaffolding 5 458 2,505 123 11
Diving <5 21 363 6 <5
Other 132 6,142 41,766 1,034 94
Drowning 25 25 144 <5 <5
Fire\Burns 15 302 4,960 120 6
Unintentional Poisoning 40 1,315 6,101 270 16
Struck By\Against Sports Equipment <5 107 7,830 65 5
Other Unintentional Injuries* 220 5,889 207,190 2,116 154
Suicide\Self-Harm - Poisoning 113 1,593 2,979 349 16
Suicide\Self-Harm - Other 362 297 894 48 <5
Violence 65 1,655 11,130 347 38
Undetermined Intent\Other 355 425 2,290 96 6
TOTAL 1,740 30,870 386,116 7,474 599
Alberta ! 55

The Cost of Injury in Canada 2015
The most frequent defined causes of emergency room visits to treat injury were falls (29%) and transport incidents (8%). The remaining causes of emergency room visits were violence (3%), unintentional poisoning (2%), being struck by/against sports equipment (2%), fire/ burns (1%), and suicide/self-harm (1%).
Falls were the leading cause of permanent partial disability (40%) and permanent total disability (42%) arising from injury, followed by other unintentional injury (28% and 26% respectively), and transport incidents (14% and 17%). Less frequent causes included suicide/self-harm poisoning (5% and 3%), violence (5% and 6%), unintentional poisoning (4% and 3%), and injuries of undetermined intent (1% in both cases also).
Table 30
Mortality, crude death rates (per 100,000 pop.) and total cost per capita by cause, Alberta, 2010
While suicide/self-harm was responsible for the most injury deaths per capita (12.7 per 100,000 population), falls generated the greatest per capita cost to Albertans – $309.
Almost half (45%) of the total costs of injury in Alberta in 2010 were attributable to falls (28%) and transport incidents (18%) followed by suicide/self-harm (9%) and violence (9%).
Falls were also the leading cause of health care or direct costs due to injury, accounting for 38% of all direct injury costs in 2010, followed by other unintentional injuries at 31% and transport incidents at 15%. Suicide and violence accounted for a further 5% each of direct costs, unintentional poisoning 3%, and fire/burns 1%.
Cause DeathsDeath rate
(per 100,000) Total CostsCosts per
capita
Transport Incidents 360 9.6 $718 million $192
Falls 185 5.0 $1,154 million $309
Suicide/Self-Harm 475 12.7 $447 million $120
Violence 65 1.7 $220 million $59
Alberta ! 56

The Cost of Injury in Canada 2015
Table 31
Total, direct, and indirect costs of injury by cause, Alberta, 2010
* See Appendix 3 for a detailed breakdown of causes of injury in this category.
DescriptionTotal costs
($ millions)Direct costs ($ millions)
Indirect costs ($ millions)
Transport Incidents $718 $312 $406
Pedestrian $65 $25 $40
Pedal Cycle $71 $35 $36
Motor Vehicle $345 $164 $181
ATV, Snowmobile $106 $50 $55
Other $130 $36 $94
Falls $1,154 $788 $366
On the same level $341 $244 $98
From skates, skis, boards, blades $93 $49 $44
From furniture $60 $44 $16
In playgrounds $36 $19 $17
On stairs $124 $80 $44
From ladders/scaffolding $38 $24 $14
Diving $6 $3 $2
Other $456 $325 $131
Drowning $20 $2 $18
Fire\Burns $44 $23 $22
Unintentional Poisoning $125 $66 $59
Struck By\Against Sports Equipment $27 $13 $14
Other Unintentional Injuries* $1,044 $636 $409
Suicide\Self-Harm - Poisoning $197 $82 $115
Suicide\Self-Harm - Other $250 $20 $230
Violence $220 $100 $121
Undetermined Intent\Other $244 $25 $219
TOTAL $4,043 $2,065 $1,979
Alberta ! 57

The Cost of Injury in Canada 2015
Transport incidents were the leading cause of indirect costs arising from injury at 21%, followed by falls (18%) and suicide/self-harm (17%). Other causes included injuries of undetermined intent (11%), violence (6%), unintentional poisoning (3%), and fire/burns and drowning (1% each).
Transport-related injuries by cause and associated costs Motor vehicle incidents caused 42% of all transport-related injury deaths in Alberta in 2010 and accounted for half of all hospitalizations (49%), emergency room visits (55%), and cases of permanent partial disability (47%) and permanent total disability (50%) arising from transport-related injuries.
The remaining deaths due to transport incidents were attributed to pedestrian incidents (14%), ATV/snowmobile incidents (8%), and cycling incidents (4%). Other transport-related causes of hospitalization included ATV/snowmobiles (19%), cycling (11%), and pedestrian incidents (7%). Other emergency room visits were due to cycling (21%), ATV/snowmobile (7%), and pedestrian incidents (6%).
Motor vehicle incidents accounted for approximately half of total costs (48%), direct costs (53%), and indirect costs (45%) arising from injuries due to transport incidents in Alberta in 2010. Remaining direct costs were due to injuries arising from ATV/snowmobile (15%), cycling (10%), and pedestrian (9%) incidents. Remaining indirect costs were due to ATV/snowmobile (14%), pedestrian (10%), and cycling (9%) incidents.
Fall-related injuries by cause and associated costs After other (non-specified) falls, stairs were the leading cause of death by falls in Alberta in 2010, accounting for 11% of all deaths by falling. Other types of falls resulting in death included falls on the same level (8%), from furniture (6%), and from ladders/scaffolding (3%). The vast majority (71%) of deaths by falls however, are from other (non-specified) types of falls.
However, other (non-specified) types of falls accounted for the leading cause of hospitalizations (41%), emergency room visits (38%), cases of permanent partial disability (35%) and permanent total disability (37%). Falls on the same level were the next leading cause of hospitalization (34%), emergency room visits
Alberta ! 58

The Cost of Injury in Canada 2015
(31%), cases of permanent partial disability (35%) and permanent total disability (31%). Causes of hospitalizations from falls also included falls from stairs (10%), from furniture and skates/skis/boards/blades (5%), playgrounds (2%), and diving (less than 1%).
Emergency room visits due to falls also included falls from stairs (13%), from skates/skis/boards/blades (7%), from furniture (6%), playgrounds (3%), from ladders/scaffolding (2%), and diving (less than 1%). Other (non-specified) types of falls accounted for the remaining 38% of emergency room visits in 2010.
Falls on the same level were also the single greatest cause of costs due to falls, accounting for 30% of total costs, 31% of direct costs, and 27% of indirect costs in 2010, followed by falls from stairs (11% of total costs, 10% of direct costs, and 12% of indirect costs), and falls from skates/skis/ boards/blades (8% of total costs, 6% of direct costs. Other (non-specified) falls accounted for 40% of total costs, 41% of direct costs, and 36% of indirect costs.
Intentional injuries by cause and associated costs Suicide/self-harm other than poisoning accounted for 67% of intentional death. Suicide/self-harm by poisoning accounted for 21% of death, followed by violence at 12%.
Suicide/self-harm by poisoning and violence were almost equally responsible for the majority of hospitalizations (45% and 47% respectively), followed by suicide/self-harm – other (8%), while injury due to violence was responsible for the vast majority of emergency room visits (74%), followed by suicide/self-harm – poisoning (20%) and suicide/self-harm by other means (6%). Permanent partial disability was due equally to violence (47%) and suicide/self-harm by poisoning (47%), followed by suicide/self-harm by other means (6%). Permanent total disability was a result of violence in 66% of cases, followed by suicide/self-harm by poisoning (28%). Suicide/self-harm by other means was too small (less than 7%) to report.
Suicide/self-harm (including poisoning) accounted for the majority of costs arising from intentional injury in 2010 – 67% of total costs, 50% of direct costs, and 74% of indirect costs. A more detailed breakdown shows that total costs were divided almost evenly between violence (33%), suicide/self-harm by other means (37%), and suicide/self-harm by poisoning (30%). While violence was also
Alberta ! 59

The Cost of Injury in Canada 2015
responsible for the greatest share of direct costs (50%), it was followed closely by suicide/self-harm by poisoning (41%), with suicide/self-harm by other means accounting for the remaining 10%.
Indirect costs showed still another pattern with 49% of costs attributable to suicide/self-harm by other means, 26% to violence, and 25% to suicide/self-harm by poisoning.
Alberta ! 60

BRITISH COLUMBIA Under the leadership of the Provincial Health Officer, Public Health plays a variety of roles in British Columbia focused on maintaining and improving the health of the population, including injury prevention, which is articulated in, Promote, Protect, Prevent: Our Health Begins Here – BC’s Guiding Framework for Public Health (Guiding Framework). The injury prevention community in British Columbia represents multiple disciplines and sectors, and includes doctors, nurses, trauma specialists, public health inspectors, mental health and addictions specialists, community health and safety professionals, emergency services workers, policy makers and researchers, among others. This community responds to the goals and objects for injury prevention, as well as addressing local and regional priorities.
The BC Ministry of Health and the Health Authorities provide strong leadership and policy direction, which is supported by strong networks and communities of practice, across sectors and disciplines. The BC Injury Prevention Policy Advisory Committee (BCIP-PAC) provides guidance and recommendations on injury surveillance and prevention policies to the Ministry of Health and the Office of the Provincial Health Officer and programs by liaison with the Provincial Public Health Committee. The Committee provides a forum for health authority representatives holding responsibility for injury prevention as well as Ministry of Health representatives responsible for injury prevention surveillance, programs and policy.
Injury Prevention relies on collaborative partnerships in order to support service delivery in BC. Strong connections across sectors and levels of government, within communities, schools and workplaces, with academia and community-based and NGOs are vital. Partnerships at the local level play an important role in injury prevention. It is at the local level that citizens, NGOs, First Nations and Aboriginal groups, the private sector and government can come together to address local priorities. Collaboration with NGOs is a vital component in the formulation and delivery of many injury prevention initiatives.
The BC Injury Prevention Leadership Action Network (BCiPLAN) is an independent strategic alliance of organizations supporting injury prevention priorities and activities across British Columbia. BCiPLAN provides a forum for
British Columbia ! 61

The Cost of Injury in Canada 2015
organizations and leaders to advise and assist one another regarding research, strategies, policies and programs, identify and promote injury prevention priorities where evidence supports that progress can be made in injury reduction, coordinate and collaborate among member organizations on activities addressing significant injury issues, and provide collaborative leadership thinking and action on injury prevention in BC. Within BCiPLAN, there are a number of coalitions that provide focus on specific injury issues, including the BC Falls Prevention Coalition, the Sport and Recreation Injury Prevention Group, the BC Concussion Advisory Network, and others.
Central to these networks and coalitions, and providing leadership, secretariat and communications support is the BC Injury Research and Prevention Unit (BCIRPU). BCIRPU was established in August, 1997 as part of a province-wide partnership between the Child and Family Research Institute at BC Children’s Hospital, BC Ministry of Health and the University of British Columbia to address the following critical gaps in the injury prevention field in BC:
i) the need for quality and comprehensive injury data
ii) the need for quality injury prevention research
iii) the need to co-ordinate injury prevention efforts throughout BC.
BCIRPU was established as a strategic entity, blending the need for research and evidence with best practices and the development of policies and programs to reduce injury in BC. It is located within a research environment, closely connected to the Ministry of Health and health care services, and readily accessible to health authorities and other injury prevention agencies and organizations throughout BC.
Supporting Promote, Protect, Prevent: Our Health Begins Here – BC’s Guiding Framework for Public Health (Guiding Framework), BCIRPU is responsive to Goal 5 and the associated injury prevention objectives and targets outlined. Serving as a provincial ‘hub’, BCIRPU works in collaboration with Health Authorities, NGOs and communities to focus on three priority objectives:
1. To build a culture of safety at work, home and play by increasing awareness of injury risks, implementing prevention education and taking priority actions, such as designing and developing safe environments, systems and products.
British Columbia ! 62

The Cost of Injury in Canada 2015
2. To reduce the incidence of falls, fall-‐related injuries and fall-‐related risk factors among seniors in BC through surveillance, enhanced community capacity, public information and evidence-based prevention measures.
3. To reduce the incidence of injuries among children and youth in BC through physical and social environmental modifications and increased awareness of safety-promoting behaviours.
Supporting the injury prevention networks and coalitions, BCIRPU employs four strategic focus areas specifically developed to align with, and support the injury prevention priorities and objectives of the Guiding Framework: surveillance, research, knowledge synthesis and translation, and public information.
The purpose of injury prevention in BC is to safeguard the health and well-being of individuals and communities and to reduce the need for emergency and health care services. Collaboration by governments, Health Authorities, First Nations and Aboriginal groups, BCIRPU, NGO’s and communities throughout BC provide the channels for injury prevention initiatives. BCIP-PAC and BCiPLAN provide the forums for exchange, networking, ideas generation and collaborative work to act on the goals and objectives within the Guiding Framework. This collective impact contributes to the relief of unnecessary suffering and enables citizens to live longer, fuller, happier lives, while relieving pressure on the healthcare system.
Total cost of injury
Injuries cost British Columbians $3.6 billion and 2,070 lives in 2010.
Injury also led to the hospitalization of 35,816 British Columbians, resulted in 456,347 visits to the emergency room, caused 643 cases of permanent total disability, and led to 8,065 cases of permanent partial disability.
Given a 2010 provincial population of 4,465,924, injuries caused 46 deaths per 100,000, 1,307 potential years of life lost per 100,000 residents, and came with a per capita price tag of $816.
British Columbia ! 63
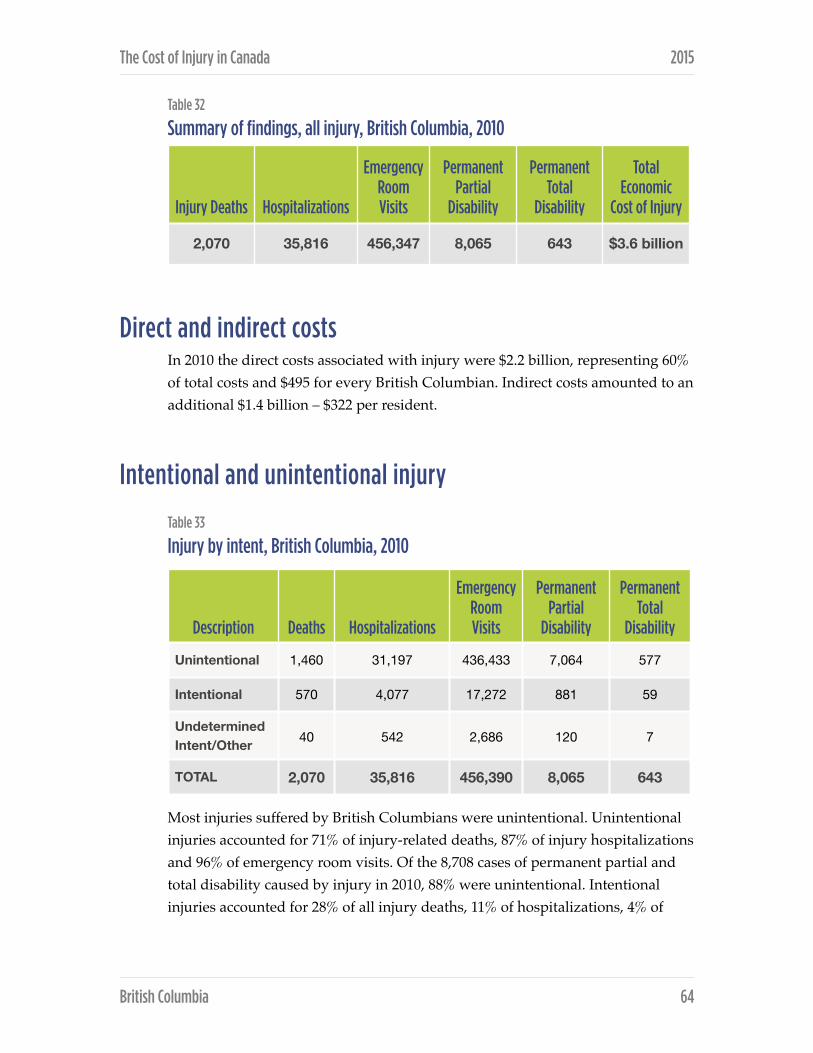
The Cost of Injury in Canada 2015
Table 32
Summary of findings, all injury, British Columbia, 2010
Direct and indirect costs In 2010 the direct costs associated with injury were $2.2 billion, representing 60% of total costs and $495 for every British Columbian. Indirect costs amounted to an additional $1.4 billion – $322 per resident.
Intentional and unintentional injury
Table 33
Injury by intent, British Columbia, 2010
Most injuries suffered by British Columbians were unintentional. Unintentional injuries accounted for 71% of injury-related deaths, 87% of injury hospitalizations and 96% of emergency room visits. Of the 8,708 cases of permanent partial and total disability caused by injury in 2010, 88% were unintentional. Intentional injuries accounted for 28% of all injury deaths, 11% of hospitalizations, 4% of
Injury Deaths Hospitalizations
Emergency Room Visits
Permanent Partial
Disability
Permanent Total
Disability
Total Economic
Cost of Injury
2,070 35,816 456,347 8,065 643 $3.6 billion
Description Deaths Hospitalizations
Emergency Room Visits
Permanent Partial
Disability
Permanent Total
Disability
Unintentional 1,460 31,197 436,433 7,064 577
Intentional 570 4,077 17,272 881 59
Undetermined Intent/Other 40 542 2,686 120 7
TOTAL 2,070 35,816 456,390 8,065 643
British Columbia ! 64

The Cost of Injury in Canada 2015
emergency room visits and 11% of the cases of partial and total disability arising from injury. Remaining injury-related events were of undetermined intent.
Table 34
Total, direct, and indirect costs by intent of injury, British Columbia, 2010
In 2010, unintentional injuries cost the province a total of $3 billion or 83% of all injury-related costs. While unintentional injuries account for 89% direct injury costs, they make up under three-quarters (74%) of indirect costs occurring due to injury. Intentional injuries are responsible for 15% of total costs, 10% of direct costs, and 24% of indirect costs associated with injuries. Just 1% of total costs are due to injuries of undetermined cause.
Injury by cause In 2010, falls were the leading cause of death due to injury in British Columbia accounting for 27% of all deaths. Suicide/self-harm accounted for a further 25% of injuries, while transport incidents led to 18% of injuries. A further 17% of deaths occurred due to unintentional poisonings, 5% resulted from other unintentional causes, 3% were due to violence, 2% resulted from drowning, 2% from injuries of undetermined intent, and 1% from fires or burns.
The majority (56%) of injury-related hospitalizations were due to falls, 14% resulted from transportation incidents and 8% were related to suicide or self-harm. Other less common reasons for hospitalization were other unintentional injuries (13%), unintentional poisoning (4%), violence (3%), fire or burns (1%), and injuries of undetermined intent (2%).
DescriptionTotal costs
($ millions)Direct costs ($ millions)
Indirect costs ($ millions)
Unintentional $3,030 $1,966 $1,065
Intentional $562 $217 $345
Undetermined Intent/Other
$54 $27 $27
TOTAL $3,646 $2,210 $1,436
British Columbia ! 65

The Cost of Injury in Canada 2015
Table 35Injury deaths, hospitalizations, and emergency room visits by cause, British Columbia, 2010
* See Appendix 3 for a detailed breakdown of causes of injury in this category.
Description Deaths HospitalizationsEmergency Room Visits
Permanent Partial
Disability
Permanent Total
Disability Transport Incidents 375 4,872 38,153 1,179 117
Pedestrian 54 562 2,331 129 15
Pedal Cycle 13 985 7,743 253 24
Motor Vehicle 161 2,428 21,370 565 58
ATV, Snowmobile 26 477 2,751 122 10
Other 121 420 3,957 111 9
Falls 555 19,916 135,993 3,356 285
On the same level 46 6,368 43,737 1,090 80 From skates, skis,
boards, blades <5 844 8,297 247 19
From furniture 37 1,167 7,869 148 13
In playgrounds <5 245 2,925 80 5
On stairs 55 1,714 17,206 400 39 From ladders/
scaffolding 9 666 3,092 178 16
Diving <5 33 406 9 2
Other 406 8,879 52,460 1,204 112
Drowning 50 53 161 7 1
Fire\Burns 30 285 5,670 130 7 Unintentional Poisoning 355 1,393 7,051 286 17
Struck By\Against Sports Equipment <5 99 8,789 70 5
Other Unintentional Injuries* 95 4,579 240,615 1,530 109
Suicide\Self-Harm - Poisoning 122 2,517 3,506 543 24
Suicide\Self-Harm - Other 388 338 1,033 55 5
Violence 60 1,222 12,732 283 30 Undetermined Intent\Other 40 542 2,686 120 7
TOTAL 2,070 35,816 456390 8,065 643
British Columbia ! 66

The Cost of Injury in Canada 2015
In British Columbia falls were the leading cause of both permanent partial (42%) and permanent total (44%) disability. Other intentional injuries account for 25% of permanent partial and 23% of permanent total disability due to injury, while transport incidents explain 15% of permanent partial and 18% of permanent total cases of disability in 2010. Less frequent causes of permanent partial and total disability were suicide or self-harm (7% and 4%, respectively), violence (4% and 5%, respectively), unintentional poisoning (4% and 3%, respectively), and injuries of undetermined intent, and being struck by or against sports equipment (1% each).
Table 36
Mortality, crude death rates (per 100,000 pop.) and total cost per capita by cause, British Columbia, 2010
In 2010 in British Columbia, falls were responsible for the highest death rate (12.4 deaths per 100,000 residents), and were associated with the highest per capita cost ($272).
Cost of injury by cause In British Columbia in 2010 more than one-third of all injury-related costs were due to falls (33%) and transport incidents (18%). Total costs also resulted from un-specified unintentional injuries (23%), suicide or self-harm (11%), unintentional poisoning (7%), violence (4%), injuries of undetermined intent (1%), drowning (1%), fire or burns (1%), and being struck by/against sports equipment (1%).
Cause DeathsDeath rate
(per 100,000) Total CostsCosts per
capita
Transport Incidents 375 8.4 $640 million $143
Falls 555 12.4 $1,215 million $272
Suicide/Self-Harm 510 11.4 $410 million $92
Violence 60 1.3 $152 million $34
British Columbia ! 67
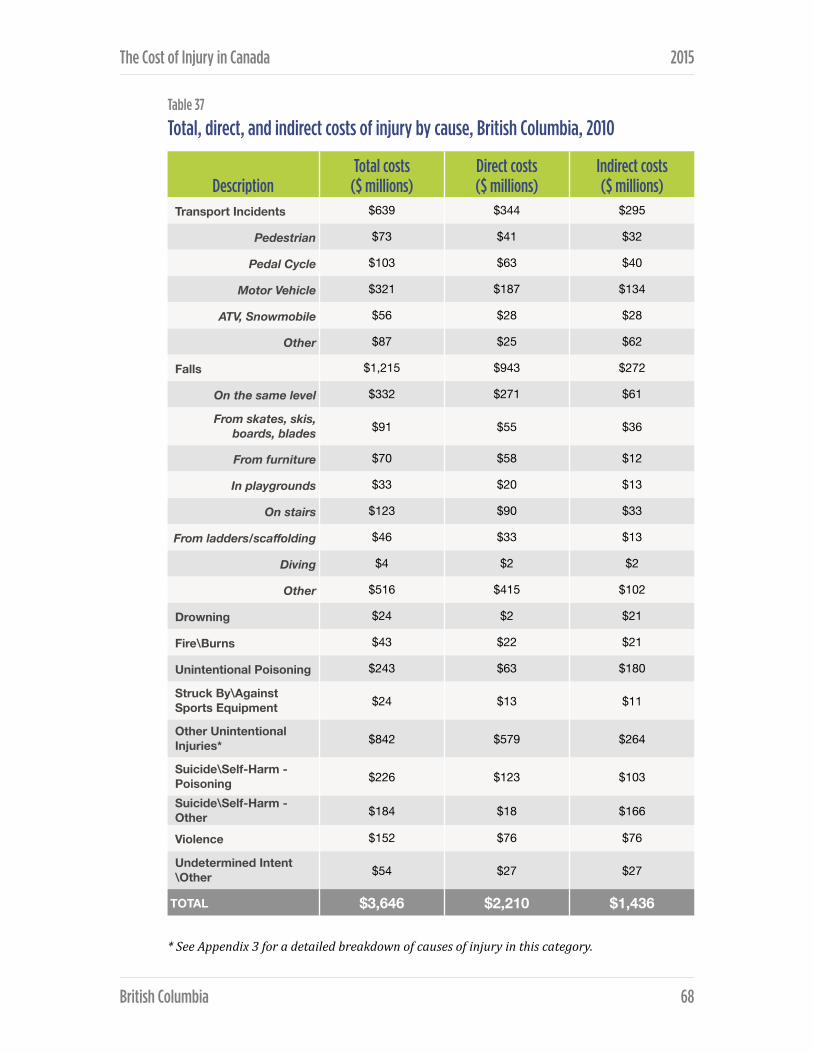
The Cost of Injury in Canada 2015
Table 37
Total, direct, and indirect costs of injury by cause, British Columbia, 2010
* See Appendix 3 for a detailed breakdown of causes of injury in this category.
DescriptionTotal costs
($ millions)Direct costs ($ millions)
Indirect costs ($ millions)
Transport Incidents $639 $344 $295
Pedestrian $73 $41 $32
Pedal Cycle $103 $63 $40
Motor Vehicle $321 $187 $134
ATV, Snowmobile $56 $28 $28
Other $87 $25 $62
Falls $1,215 $943 $272
On the same level $332 $271 $61
From skates, skis, boards, blades $91 $55 $36
From furniture $70 $58 $12
In playgrounds $33 $20 $13
On stairs $123 $90 $33
From ladders/scaffolding $46 $33 $13
Diving $4 $2 $2
Other $516 $415 $102
Drowning $24 $2 $21
Fire\Burns $43 $22 $21
Unintentional Poisoning $243 $63 $180
Struck By\Against Sports Equipment $24 $13 $11
Other Unintentional Injuries* $842 $579 $264
Suicide\Self-Harm - Poisoning $226 $123 $103
Suicide\Self-Harm - Other $184 $18 $166
Violence $152 $76 $76
Undetermined Intent\Other $54 $27 $27
TOTAL $3,646 $2,210 $1,436
British Columbia ! 68
The Cost of Injury in Canada 2015
The leading cause of direct costs was falls (43%) followed by unintentional injuries (26%), transport incidents (16%) and suicide and self-harm (6%). Direct health care costs also resulted from violence (3%), unintentional poisonings (3%), fire or burns (1%), other injuries of undetermined intent (1%) and being struck by/against sports equipment (1%). Indirect costs were most often associated with transport incidents (21%), falls (19%), other unintentional injuries (18%), suicide and self-harm (19%), and unintentional poisonings (13%). The remaining indirect costs were split between violence (5%), drowning (1%), fire/burns (1%), being struck by/against sports equipment (1%), and other injuries of undetermined intent (2%).
Transport-related injuries by cause and associated costs Motor vehicle deaths comprised 43% of all transport-related injury deaths in British Columbia in 2010 and accounted for 50% of hospitalizations, 56% of emergency room visits, 48% of permanent partial disability and 50% of permanent total disability arising from transport injuries.
Transport-related deaths also comprised other non-specified types of transport injury (32%), pedestrian injuries (14%), ATV or snowmobile events (7%), and cycling events (3%). Other causes of hospitalization due to transportation incidents were cycling incidents (20%), pedestrian events (12%), ATV or snowmobile events (10%), and other transport-related causes (9%). Twenty percent of transport-related injury visits to the emergency room were due to cycling events, 10% from other non-specified causes, 7% due to ATV or snowmobile incidents and 6% due to pedestrian events.
In 2010, of the total $640 million cost of transport incidents, 50% was due to motor vehicle incidents. Motor vehicle-related injuries accounted for 54% of direct costs, and 45% of indirect costs. The remaining total costs were divided between cycling related injuries (16%), other unspecified types of transport incidents (14%), pedestrian injuries (11%) and injuries related to ATV and snowmobile use (9%). Remaining direct costs accrued as a result of incidents related to cycling (18%), pedestrians (12%), ATV or snowmobiles (8%) and other transport (7%). After motor vehicle incidents, indirect costs resulted from other non-specific transport incidents (21%), cycling (13%), pedestrian injury (11%) and ATV or snowmobile events (9%).
British Columbia ! 69
The Cost of Injury in Canada 2015
Fall-related injuries by cause and associated costs In 2010 in British Columbia the majority (73%) of deaths due to fall-related injuries were due to unspecified causes. The leading identified cause of death was falls on stairs (10%) followed by falls on the same level (8%), falls from furniture (7%) and falls from ladders of scaffolding (2%).
Hospitalizations due to fall-related injuries were dominated by events without a defined cause (45%), and falls from the same level (32%). Fall-related hospitalizations also occurred due to incidents on stairs (9%), falls from furniture (6%), falls from skates, skis, boards or blades (4%), falls from ladders or scaffolding (3%), and falls in playgrounds (1%). Falls without a defined cause made up 39% of emergency room visits followed by falls from the same level (32%), on stairs (13%), from skates/skis/boards/blades (6%), on playgrounds (2%), and from ladders or scaffolding (2%).
Injuries related to falls cost the province of British Columbia $1.2 billion dollars in 2010. The largest cost category for fall-related injuries were events without an unidentified cause. These injuries account for 43% of total fall spending, 44% of health care costs and 38% of indirect costs. Falls that occurred on the same level accounted for 27% of total costs, 29% of health care costs and 22% of indirect costs while the costs of falls on stairs made up 10% of total costs, 10% of direct costs, and 12% of indirect costs. Of the total cost, falls from skates, skis, boards, or blades made up 7% (6% of direct costs, 13% of indirect costs); falls from furniture made up 6% (6% of direct costs, 4% of indirect costs); falls from ladders or scaffolding are attributed with 4% (4% of direct costs, 5% of indirect costs); and falls in playgrounds made up 3% (2% of direct costs, 5% of indirect costs).
Intentional injuries by cause and associated costs Suicide and self-harm resulted in the majority (89%) of intentional injury deaths in British Columbia in 2010. Suicide or self-harm by means other than poisoning was the leading (68%) cause of death, followed by suicide or self-harm – poison (21%), and violence (11%).
In 2010, suicide or self-harm by poison was responsible for almost two thirds (62%) of intentional injury hospitalization. The remainder of hospitalizations occurred due to violence (30%) and suicide or self-harm by means other than poisoning (8%). Violence resulted in the most intentional injury-related
British Columbia ! 70

The Cost of Injury in Canada 2015
emergency room visits accounting for 74% of visits, followed by suicide or self-harm – poison (20%) and suicide or self-harm by means other than poisoning (6%).
Permanent partial disability occurred most often due to suicide or self-harm poison (62%) while permanent total disability resulted most frequently from violence (51%). Partial disability was also caused by violence (32%) and suicide or self-harm by means other than poisoning (6%) while the other cases of total disability resulted from suicide or self-harm – poison (40%) and suicide or self-harm by means other than poisoning (8%).
In 2010 in British Columbia suicide or self-harm was responsible for 73% of total spending on intentional injury, including 65% of direct costs and 78% of indirect costs. Overall costs were dominated by suicide or self-harm by poisoning (40%), followed by suicide or self-harm by means other than poisoning (33%) and violence (27%). Health care costs occurred overwhelmingly due to poison-related suicide or self-harm (57%), followed by violence (35%), and suicide or self-harm by means other than poisoning (8%). Indirect costs were incurred mostly in relation to suicide or self-harm by means other than poisoning (48%), with the remaining half of spending split between suicide or self-harm – poison (30%) and violence (22%).
British Columbia ! 71
MANITOBA The responsibility for injury prevention is shared amongst several stakeholders. Lead departments and organizations include: Manitoba Public Insurance, Manitoba Infrastructure and Transportation, Manitoba Health, Healthy Living and Seniors, Manitoba Family Services and Labour and regional health authorities.
Under the leadership of Manitoba Health, Healthy Living and Seniors, a five year Manitoba Injury Prevention Strategy was established in 2006 to create a safe and injury free Manitoba and identified leading causes of injury, death and hospitalization. Government departments, regional health authorities and key stakeholders were engaged to collectively move the strategy forward. Specific frameworks were developed for falls, drowning and suicide. In addition, frameworks were developed for each regional health authority in the province and by First Nations. During this time, many successful initiatives were implemented, but more work needs to be done to reduce injury in Manitoba. A new five-year plan for the department of Manitoba Health, Healthy Living and Seniors will renew the focus on injury prevention in Manitoba and will build on the achievements and progress made since the introduction of the Manitoba Injury Prevention Strategy in 2006. Four focus areas of the plan include: motor vehicle collisions, poisoning, falls and drowning. When released, information related to the plan will be available on the Government of Manitoba’s Healthy Living website.
Manitoba Infrastructure and Transportation (MIT) is responsible for the development of transportation policy and legislation, and for the management of the province’s vast infrastructure network. To meet these responsibilities, the department delivers a wide range of programs and services that play a critical role in sustaining the contributions of the transportation sector. For example, MIT has provided a Guide for Establishing Reduced-‐Speed School Zones to assist municipalities in implementing speed reduction in school zones.
Manitoba Public Insurance (MPI) is a non-profit Crown Corporation that is dedicated to keep Manitoba’s roads safe. MPI works with road safety partners to provide funding and people power to fuel vital programs, particularly those aimed at seatbelt use, impaired driving, speeding and aggressive driving, and distracted driving. These activities are designed to help Manitobans gain the
Manitoba ! 72

The Cost of Injury in Canada 2015
knowledge and awareness they need to protect themselves and others behind the wheel.
Manitoba Family Services is responsible for a comprehensive range of social services and regulatory programs. Some of these programs and services are delivered directly by the department, while others are provided in partnership with a variety of organizations and community-based groups. The Child and Family Services Division works with Child and Family Services Authorities, child welfare agencies, community-based agencies, regional offices, community access area teams, and others, to keep children safe and protected, and to provide assistance to people affected by family violence and family disruption. For example, Manitoba Family Services runs the Family Violence Prevention Program (FVPP) plans and develops community programs to help stop family violence. The program supports special services for abused women and their children and for men living with family violence.
Manitoba Labour and Immigration plays an important role in contributing to Manitoba’s growth and development by protecting the rights of workers, ensuring public safety. The Ministry is responsible for the effective delivery of programs and services pertaining to workplace safety and health, employment standards, labour relations, pension plans and public safety. Workplace Safety and Health enforces The Workplace Safety and Health Act and its associated regulations in order to protect the safety and health of workers in Manitoba. Workplace Safety and Health’s inspection and investigation activity focuses on improving legislative compliance in order to eliminate workplace fatalities, injuries and illnesses.
Total cost of injury
In 2010 injury claimed the lives of 725 Manitobans and cost the province 1.2 billion.
Alongside the fatalities, 2,463 individuals incurred permanent total or partial disabilities due to injury, 10,044 were hospitalized, and 127,543 were treated in emergency departments due to injury.
Manitoba ! 73

The Cost of Injury in Canada 2015
Based on the Manitoba’s 2010 population of 1,220,930, 59 people per 100,000 died due to injury that amounts to approximately 1,758 of potential years of life lost per 100,000 residents. The cost of injury was $958 per capita.
Table 38
Summary of findings, all injury, Manitoba, 2010
Direct and indirect costs In 2010 the direct health care costs associated with injury made up $676 million ($554 per capita), or 58% of the total $1.2 billion spent on injuries. Indirect costs accounted for the remaining 42%, totalling $493 million, or $404 for every Manitoban.
Intentional and unintentional injury
Table 39
Injury by intent, Manitoba, 2010
In 2010 the majority of injuries suffered by Manitobans were unintentional. Sixty-nine percent of injury-related deaths were unintentional, as were 83% of injury
Injury Deaths Hospitalizations
Emergency Room Visits
Permanent Partial
Disability
Permanent Total
Disability Total Economic Cost of Injury
725 10,044 127,543 2,278 185 $1.2 billion
Description Deaths Hospitalizations
Emergency Room Visits
Permanent Partial
Disability
Permanent Total
Disability
Unintentional 500 8,343 122,064 1,935 158
Intentional 195 1,475 4,752 296 25
Undetermined Intent/Other
30 226 727 47 3
TOTAL 725 10,044 127,543 2,278 185
Manitoba ! 74

The Cost of Injury in Canada 2015
hospitalizations, 96% of emergency room visits, and 85% of cases of both permanent partial and permanent total disability. Of all injury related deaths, 27% were intentional in nature. Intentional injuries also accounted for 15% of injury hospitalizations, 4% of injury emergency room visits, and 13% of cases of both permanent partial and total disability. The remaining reported incidents were of undetermined intent.
Table 40
Total, direct, and indirect costs by intent of injury, Manitoba, 2010
In 2010, unintentional injuries also accounted for most of the $1.2 billion Manitoba spent addressing the impacts of injury. Of the overall cost of dealing with injuries, $914 million or 78% was due to unintentional injuries, while $223 million or 19% resulted from intentional injuries. Unintentional injuries made up 86% of direct health care costs and 67% of indirect costs while intentional injuries generated 12% of direct costs and 29% of indirect costs. The remaining 3% of total costs, including 2% of direct costs and 4% of indirect costs, resulted from events with undetermined intent.
Injury by cause In 2010 the leading causes of death due to injury in Manitoba were falls and suicide and self-harm, which caused 29% and 20% of all injury deaths, respectively. An additional 14% of injury-related deaths were transportation-related, 13% were due to unintentional poisoning and 10% resulted from other (non-specified) unintentional injuries. Among the other causes of death were violence (7%), injuries of undetermined intent (4%), drowning (1%) and fire or burns (1%).
DescriptionTotal costs
($ millions)Direct costs ($ millions)
Indirect costs ($ millions)
Unintentional $914 $584 $331
Intentional $223 $81 $142
Undetermined Intent/Other
$32 $11 $21
TOTAL $1,169 $676 $493
Manitoba ! 75

The Cost of Injury in Canada 2015
Table 41
Injury deaths, hospitalizations, and emergency room visits by cause, Manitoba, 2010
* See Appendix 3 for a detailed breakdown of causes of injury in this category.
Description Deaths HospitalizationsEmergency Room Visits
Permanent Partial
Disability
Permanent Total
Disability Transport Incidents 105 1,245 10,442 300 29
Pedestrian 13 115 637 28 <5
Pedal Cycle <5 138 2,224 43 <5
Motor Vehicle 46 611 5,732 141 14
ATV, Snowmobile 7 274 770 61 5
Other 36 107 1,079 27 <5
Falls 210 5,209 38,339 915 78
On the same level 17 1,648 12,005 286 21
From skates, skis, boards, blades <5 95 2,453 37 <5
From furniture 15 332 2,419 49 <5
In playgrounds <5 53 975 20 <5
On stairs 21 493 4,704 121 12
From ladders/scaffolding <5 171 798 45 4
Diving <5 12 118 <5 <5
Other 154 2,405 14,866 355 32
Drowning 10 9 47 <5 <5
Fire\Burns 10 123 1,589 41 <5
Unintentional Poisoning 95 253 1,972 57 <5
Struck By\Against Sports Equipment <5 30 2,581 21 <5
Other Unintentional Injuries*
70 1,474 67,095 600 43
Suicide\Self-Harm - Poisoning 35 503 950 111 5
Suicide\Self-Harm - Other 110 114 288 18 <5
Violence 50 858 3,514 167 18
Undetermined Intent\Other 30 226 727 47 <5
TOTAL 725 10,044 127,543 2,278 185
Manitoba ! 76

The Cost of Injury in Canada 2015
The majority of injuries requiring hospitalization in Manitoba were due to falls (52%), followed by transportation incidents (12%), other unintentional injuries (15%), and violence (9%). Hospitalization for injuries also resulted from suicide or self-harm (6%), unintentional poisoning (3%), injuries of undetermined intent (2%), and fire or burns (1%).
Injury-related visits to the emergency room in 2010 occurred most frequently due to non-specific unintentional causes (53%), falls (30%), and transportation incidents (8%). Manitobans also visited the emergency room for injuries resulting from violence (3%), unintentional poisoning (2%), being struck by or against sporting equipment (2%), fire and burns (1%), suicide or self-harm (1%), and injuries of undetermined intent (1%).
Permanent partial disability and permanent total disability resulted most often from falls (40% and 42%, respectively.) The other causes of permanent partial and total disability due to injury were other non-specific unintentional causes (26% and 23%, respectively), transportation incidents (13% and 16%, respectively), violence (7% and 10%, respectively), suicide or self-harm (6% and 4% respectively), unintentional poisoning (3% and 2% respectively), fire/burns (2% and 1% respectively), injuries of undetermined intent (2% and 1% respectively), and being struck by/against sports equipment (both 1%).
Table 42
Mortality, crude death rates (per 100,000 pop.) and total cost per capita by cause, Manitoba, 2010
The highest injury-related death rate in Manitoba in 2010 was falls; 17.2 deaths occurred for every 100,000 Manitobans. Falls were also the most expensive cause of injury with a per capita cost of $283.
Cause DeathsDeath rate
(per 100,000) Total CostsCosts per
capita
Transport Incidents 105 8.6 $189 million $154
Falls 210 17.2 $345 million $283
Suicide/Self-Harm 145 11.9 $114 million $93
Violence 50 4.1 $109 million $89
Manitoba ! 77

The Cost of Injury in Canada 2015
Table 43 Total, direct, and indirect costs of injury by cause, Manitoba, 2010
* See Appendix 3 for a detailed breakdown of causes of injury in this category.
DescriptionTotal costs
($ millions)Direct costs ($ millions)
Indirect costs ($ millions)
Transport Incidents $189 $91 $98
Pedestrian $18 $9 $10
Pedal Cycle $18 $10 $7
Motor Vehicle $94 $50 $45
ATV, Snowmobile $29 $16 $13
Other $29 $7 $22
Falls $345 $262 $83
On the same level $98 $77 $20
From skates, skis, boards, blades $14 $8 $6
From furniture $25 $20 $4
In playgrounds $8 $4 $3
On stairs $41 $29 $12
From ladders/scaffolding $11 $8 $3
Diving $2 $1 $1
Other $147 $115 $32
Drowning $3 $0 $2
Fire\Burns $19 $9 $10
Unintentional Poisoning $63 $14 $49
Struck By\Against Sports Equipment $7 $4 $4
Other Unintentional Injuries* $288 $203 $85
Suicide\Self-Harm - Poisoning $53 $26 $27
Suicide\Self-Harm - Other $61 $6 $55
Violence $109 $50 $59
Undetermined Intent\Other $32 $11 $21
TOTAL $1,169 $679 $493
Manitoba ! 78

The Cost of Injury in Canada 2015
In 2010, almost one third (30%) of Manitoba’s $1.2 billion spending on injury was incurred due to fall injuries. Other unintentional injuries accounted for a further 25% of these total costs while transportation incidents generated 16%, suicide and self-harm accounted for 10% and violence for 9%. Other causes affecting overall costs were unintentional poisoning (5%), undetermined intent (3%), fire/burns (2%), and sports injuries (1%).
In 2010 in Manitoba direct health care costs ($679 million) resulted most often from falls (39%), other unintentional injuries (30%) and transport incidents (13%). The remaining nineteen percent of direct costs arose due to violence (7%), suicide or self-harm (5%), unintentional poisoning (2%), other injuries of undetermined intent (2%), fire/burns (1%), and being struck by or against sport equipment (1%).
The three main causes of $493 million in indirect costs associated with injury were transport incidents (20%), suicide and self-harm (17%) and falls (17%). An additional 17% of costs were associated with other non-specific unintentional injuries, 12% resulted from violence, 10% from unintentional poisonings, 4% from injuries of undetermined intent, 2% from fire or burns, and a final 1% was due to being struck by/against sports equipment.
Transport Incidents causes and associated costs In Manitoba in 2010 the leading cause of transport injury-related death was motor vehicle incidents. Motor vehicle incidents were associated with 44% of all transport incidents resulting in death and were the cause of 49% of transport injury hospitalizations, 55% of emergency room visits, 47% of permanent partial disability and 50% of permanent total disability due to transport incidents.
Among the other causes of transport-related injury deaths were: other (non-specific) transport events (34%), pedestrian events (13%), ATV or snowmobile incidents (7%) and cycling (3%). Twenty two percent of hospitalizations due to transport-related injury were the result of ATV or snowmobile incidents, followed by cycling incidents (11%), pedestrian incidents (9%) and finally other non-specific events (9%). After motor vehicle-related emergency room visits, transport-related visits occurred due to cycling (21%), other non-specific transport incidents (10%), ATV or snowmobiles (7%) and pedestrian injury events (6%).
Manitoba ! 79
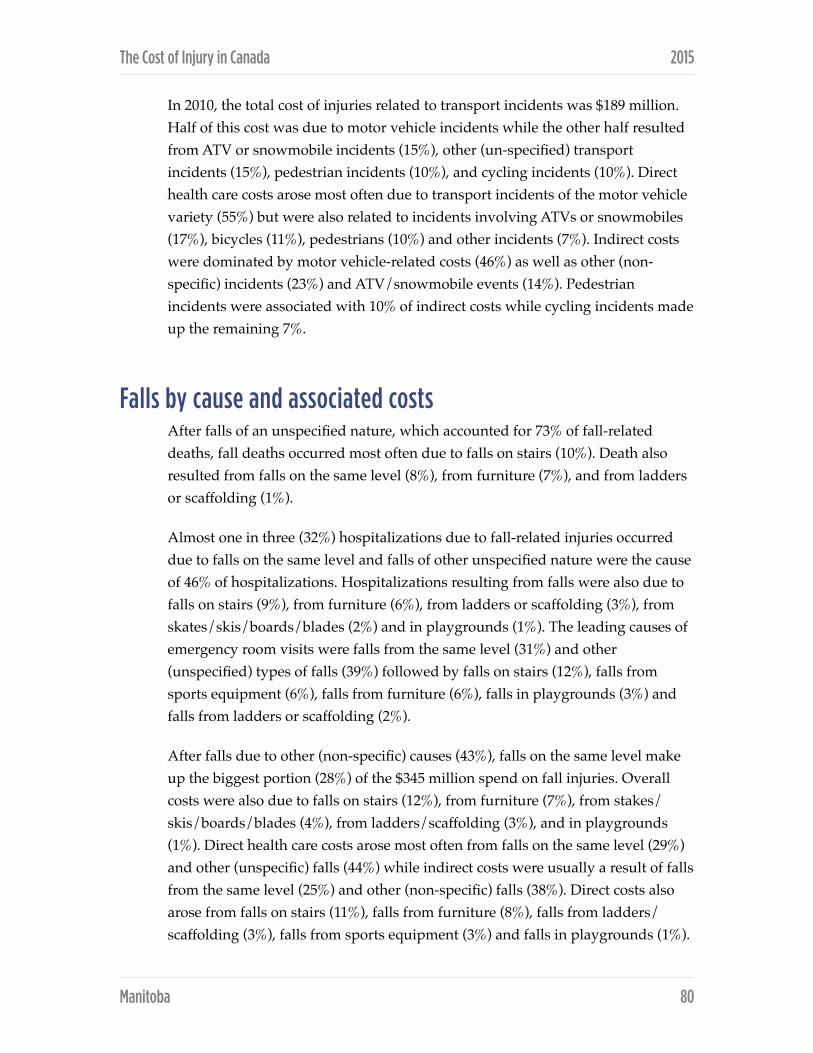
The Cost of Injury in Canada 2015
In 2010, the total cost of injuries related to transport incidents was $189 million. Half of this cost was due to motor vehicle incidents while the other half resulted from ATV or snowmobile incidents (15%), other (un-specified) transport incidents (15%), pedestrian incidents (10%), and cycling incidents (10%). Direct health care costs arose most often due to transport incidents of the motor vehicle variety (55%) but were also related to incidents involving ATVs or snowmobiles (17%), bicycles (11%), pedestrians (10%) and other incidents (7%). Indirect costs were dominated by motor vehicle-related costs (46%) as well as other (non-specific) incidents (23%) and ATV/snowmobile events (14%). Pedestrian incidents were associated with 10% of indirect costs while cycling incidents made up the remaining 7%.
Falls by cause and associated costs After falls of an unspecified nature, which accounted for 73% of fall-related deaths, fall deaths occurred most often due to falls on stairs (10%). Death also resulted from falls on the same level (8%), from furniture (7%), and from ladders or scaffolding (1%).
Almost one in three (32%) hospitalizations due to fall-related injuries occurred due to falls on the same level and falls of other unspecified nature were the cause of 46% of hospitalizations. Hospitalizations resulting from falls were also due to falls on stairs (9%), from furniture (6%), from ladders or scaffolding (3%), from skates/skis/boards/blades (2%) and in playgrounds (1%). The leading causes of emergency room visits were falls from the same level (31%) and other (unspecified) types of falls (39%) followed by falls on stairs (12%), falls from sports equipment (6%), falls from furniture (6%), falls in playgrounds (3%) and falls from ladders or scaffolding (2%).
After falls due to other (non-specific) causes (43%), falls on the same level make up the biggest portion (28%) of the $345 million spend on fall injuries. Overall costs were also due to falls on stairs (12%), from furniture (7%), from stakes/skis/boards/blades (4%), from ladders/scaffolding (3%), and in playgrounds (1%). Direct health care costs arose most often from falls on the same level (29%) and other (unspecific) falls (44%) while indirect costs were usually a result of falls from the same level (25%) and other (non-specific) falls (38%). Direct costs also arose from falls on stairs (11%), falls from furniture (8%), falls from ladders/scaffolding (3%), falls from sports equipment (3%) and falls in playgrounds (1%).
Manitoba ! 80
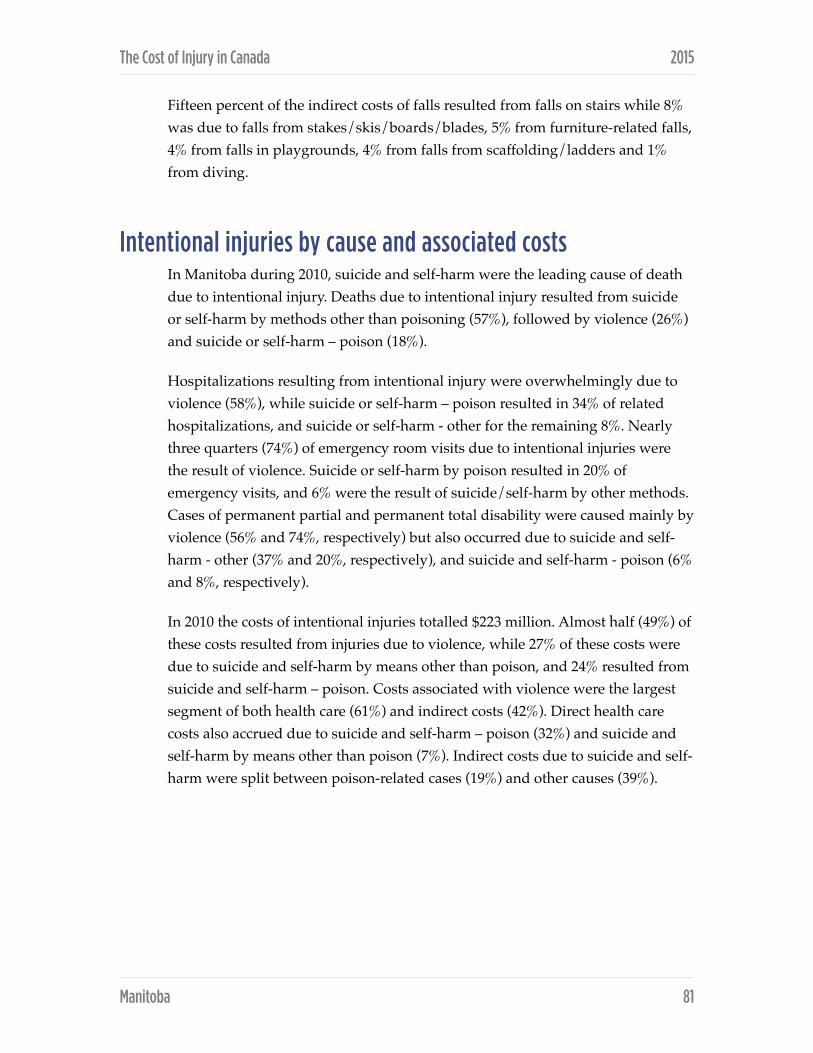
The Cost of Injury in Canada 2015
Fifteen percent of the indirect costs of falls resulted from falls on stairs while 8% was due to falls from stakes/skis/boards/blades, 5% from furniture-related falls, 4% from falls in playgrounds, 4% from falls from scaffolding/ladders and 1% from diving.
Intentional injuries by cause and associated costs In Manitoba during 2010, suicide and self-harm were the leading cause of death due to intentional injury. Deaths due to intentional injury resulted from suicide or self-harm by methods other than poisoning (57%), followed by violence (26%) and suicide or self-harm – poison (18%).
Hospitalizations resulting from intentional injury were overwhelmingly due to violence (58%), while suicide or self-harm – poison resulted in 34% of related hospitalizations, and suicide or self-harm - other for the remaining 8%. Nearly three quarters (74%) of emergency room visits due to intentional injuries were the result of violence. Suicide or self-harm by poison resulted in 20% of emergency visits, and 6% were the result of suicide/self-harm by other methods. Cases of permanent partial and permanent total disability were caused mainly by violence (56% and 74%, respectively) but also occurred due to suicide and self-harm - other (37% and 20%, respectively), and suicide and self-harm - poison (6% and 8%, respectively).
In 2010 the costs of intentional injuries totalled $223 million. Almost half (49%) of these costs resulted from injuries due to violence, while 27% of these costs were due to suicide and self-harm by means other than poison, and 24% resulted from suicide and self-harm – poison. Costs associated with violence were the largest segment of both health care (61%) and indirect costs (42%). Direct health care costs also accrued due to suicide and self-harm – poison (32%) and suicide and self-harm by means other than poison (7%). Indirect costs due to suicide and self-harm were split between poison-related cases (19%) and other causes (39%).
Manitoba ! 81
NEW BRUNSWICK
Since release of the 2009 Economic Burden of Injury Report, New Brunswick has implemented both structures and processes to help reduce the cost of injury in the province.
In 2010, the New Brunswick Trauma Program (NBTP) was established as a formalized partnership among Horizon Health Network, Vitalité Health Network, Ambulance New Brunswick and the New Brunswick Department of Health with a mandate that includes providing leadership and coordination to injury prevention initiatives across the province.
A provincial Injury Prevention Subcommittee was established with representation from a wide variety of both governmental and non-governmental stakeholders, including the NB Department of Public Safety, the Office of the Chief Medical Officer of Health (OCMOH), Work Safe NB and Safety Services New Brunswick. The province also ensured continued representation on both Atlantic Canadian and national injury prevention organizations, including the Atlantic Collaborative on Injury Prevention and the Canadian Collaborating Centres for Injury Prevention.
The NBTP and OCMOH collaborated to release the province’s first injury prevention strategy in 2012. The Framework for the Prevention of Unintentional Injury in New Brunswick sets out four strategic goals that would help lower the cost of injury in the population and reduce health inequalities:
1. To promote a common vision whereby everyone can contribute to the reduction of unintentional injuries.
2. To build the evidence base on unintentional injury, its root causes and impacts.
3. To promote the development of evidence-informed legislation, policies, programs and standards, with attention to population groups who may be at increased risk of unintentional injury.
4. To strengthen partnerships among stakeholders from different sectors, thus leveraging resources and efforts for optimal injury prevention results.
New Brunswick ! 82

The Cost of Injury in Canada 2015
Efforts have continued on a provincial scale to deepen our understanding of the injury cost and to reduce the injury rate among priority populations. In 2014, the NB Trauma Program implemented a comprehensive, integrated provincial trauma registry. The NB Trauma Registry captures emergency department and admission data for trauma patients seen at all regional hospitals. Together with reports from the Office of the Chief Medical Officer of Health, the NB Heath Council and published research on the epidemiology of severe trauma in New Brunswick, specific areas of interest in injury prevention include ongoing efforts on road safety, the reduction of falls in children, the reduction of falls in seniors, and the promotion of safe risk behaviours among youth.
Total cost of injury
In 2010, injuries cost 420 New Brunswickers their lives, and the province a total of $696 million.
In the same year injuries resulted in 6,215 hospitalizations, almost 77,000 emergency room visits and more than the permanent partial or total disability of 1,555 citizens.
Based on New Brunswick’s 2010 population of 753,044, this translates into an annual death rate due to injury of 56 per every 100,000 residents, an estimated 1,678 potential years of life lost per 100,000 people, and $924 in injury-related spending for every citizen of the province.
Table 44
Summary of findings, all injury, New Brunswick, 2010
Injury Deaths Hospitalizations
Emergency Room Visits
Permanent Partial
Disability
Permanent Total
Disability Total Economic Cost of Injury
420 6,215 76,801 1,440 115 $696 million
New Brunswick ! 83

The Cost of Injury in Canada 2015
Direct and indirect costs Of the total $696 million spent to address injuries in 2010 in New Brunswick, direct (health care) costs amounted to $400 million ($531 per capita) or 57% of total spending. Indirect costs accounted for the remaining 43%, totaling $296 million ($393 per capita).
Table 45
Injury by intent, New Brunswick, 2010
Intentional and unintentional injury In 2010 most injuries that occurred in New Brunswick were unintentional. Almost three quarters (71%) of deaths resulting from injury were unintentional, as were 88% of hospitalizations, 96% of emergency room visits, and 88% of permanent partial and 91% of permanent total disabilities. Intentional injuries accounted for 27% of deaths, 10% of hospitalizations, 4% of emergency room visits, 10% of permanent partial disabilities and 7% of permanent total disability. Injuries with undetermined intent made up the remaining events in all categories.
In 2010 in New Brunswick the majority of injury costs were also due to unintentional injuries. Eighty-four percent of the total cost, 89% ($354 million) of direct health care costs, and 78% ($230 million) of the indirect costs were spent addressing unintentional injuries. Costs related to intentional injuries made up 14% of the total injury costs, 9% of direct costs and 21% of indirect costs. Injuries with undetermined causes accounted for 2% of total spending.
Description Deaths Hospitalizations
Emergency Room Visits
Permanent Partial
Disability
Permanent Total
Disability
Unintentional 300 5,454 73,483 1,269 104
Intentional 115 604 2,869 138 9
Undetermined Intent/Other
5 157 449 33 <5
TOTAL 420 6,215 76,801 1,440 115
New Brunswick ! 84

The Cost of Injury in Canada 2015
Table 46
Total, direct, and indirect costs by intent of injury, New Brunswick, 2010
Injury by cause In 2010 suicide and self-harm was the greatest cause of death by injury (25%), followed by transport incidents (23%), and falls (20%). Deaths due to other (non-specific) unintentional causes made up 15% of all injury related deaths, unintentional poisonings were responsible for 10%, violence and drowning accounted for 2% each of deaths, while fire/burns, and events of undetermined intent each caused 1% of deaths.
Falls explained over half (55%) of all hospitalizations for injury while transport incidents accounted for 13%, other unintentional causes for 15% and suicide or self-harm for 8%. The categories of unintentional poisonings, and injuries with undetermined intent each accounted for 3% of hospitalizations, violence for 2% and fire or burns for 1%.
Emergency rooms visits for injuries totaled 76,801 in 2010. More than 40,300 (or 53%) of these visits were due to non-defined unintentional causes, while 30% resulted from falls and 8% were preceded by transport incidents. Among other causes of emergency room visits were violence (3%), unintentional poisoning (2%), being struck by or against sports equipment (2%), fire or burns (1%), suicide or self-harm (1%), and injuries of undetermined intent (1%).
DescriptionTotal costs
($ millions)Direct costs ($ millions)
Indirect costs ($ millions)
Unintentional $584 $354 $230
Intentional $98 $38 $61
Undetermined Intent/Other
$13 $8 $5
TOTAL $696 $400 $296
New Brunswick ! 85
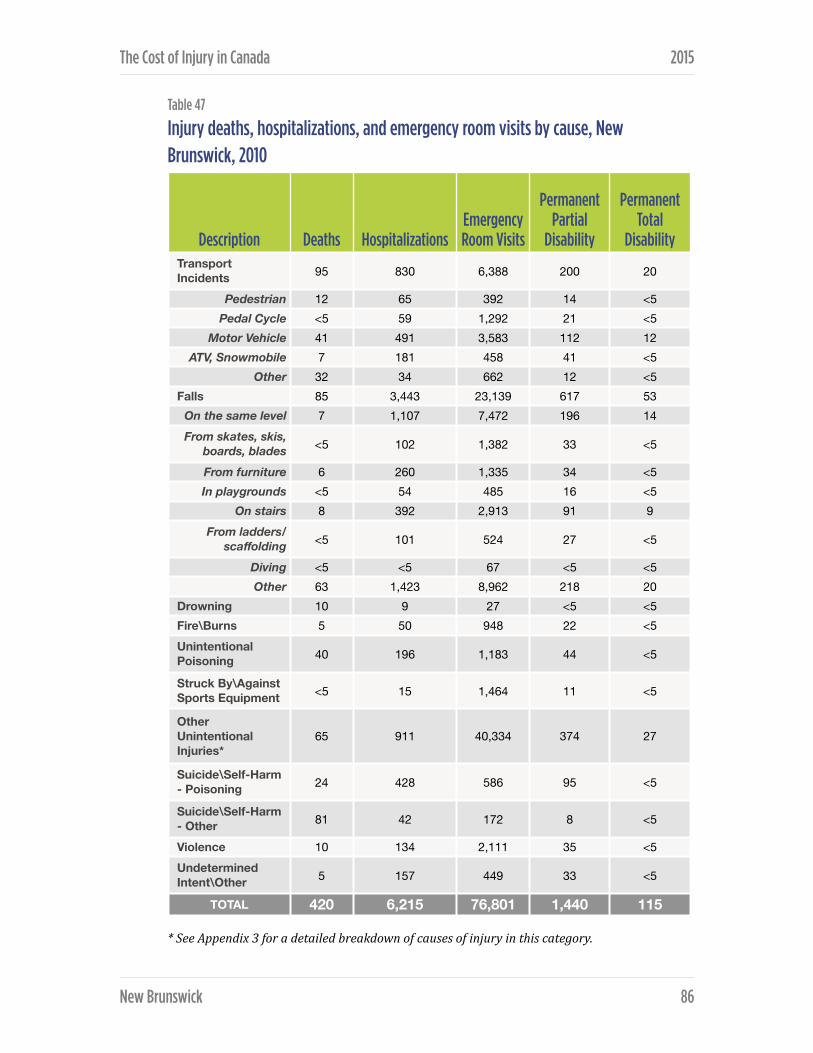
The Cost of Injury in Canada 2015
Table 47
Injury deaths, hospitalizations, and emergency room visits by cause, New Brunswick, 2010
* See Appendix 3 for a detailed breakdown of causes of injury in this category.
Description Deaths HospitalizationsEmergency Room Visits
Permanent Partial
Disability
Permanent Total
Disability Transport Incidents 95 830 6,388 200 20
Pedestrian 12 65 392 14 <5Pedal Cycle <5 59 1,292 21 <5
Motor Vehicle 41 491 3,583 112 12 ATV, Snowmobile 7 181 458 41 <5
Other 32 34 662 12 <5Falls 85 3,443 23,139 617 53
On the same level 7 1,107 7,472 196 14 From skates, skis,
boards, blades <5 102 1,382 33 <5
From furniture 6 260 1,335 34 <5In playgrounds <5 54 485 16 <5
On stairs 8 392 2,913 91 9 From ladders/
scaffolding <5 101 524 27 <5
Diving <5 <5 67 <5 <5Other 63 1,423 8,962 218 20
Drowning 10 9 27 <5 <5Fire\Burns 5 50 948 22 <5Unintentional Poisoning 40 196 1,183 44 <5
Struck By\Against Sports Equipment <5 15 1,464 11 <5
Other Unintentional Injuries*
65 911 40,334 374 27
Suicide\Self-Harm - Poisoning 24 428 586 95 <5
Suicide\Self-Harm - Other 81 42 172 8 <5
Violence 10 134 2,111 35 <5Undetermined Intent\Other 5 157 449 33 <5
TOTAL 420 6,215 76,801 1,440 115
New Brunswick ! 86

The Cost of Injury in Canada 2015
The leading cause of both permanent partial and permanent total disability was falls (43%, and 46%, respectively). Transport incidents were responsible 14% of the cases of permanent partial disability and 17% of the cases of permanent total disability, and other non-specific unintentional causes were the reason for — respectively —26% and 24% of partial and total permanent disability. Less frequent causes of partial disability were suicide or self-harm (7%), unintentional poisoning (3%), violence (2%), fire or burns (2%) or injuries of undetermined intent (2%). Total permanent disability also resulted from suicide or self-harm (4%), violence (3%), unintentional poisoning (2%), injuries of undetermined intent (2%), fire/burns (1%) and being struck by or against sport equipment (1%).
Table 48
Mortality, crude death rates (per 100,000 pop.) and total cost per capita by cause, New Brunswick, 2010
In 2010 in New Brunswick suicide and self-harm was responsible for the most injury deaths per capita (13.9 per 100,000 citizens), while the greatest injury-related per capita cost ($330 per person) resulted from falls.
Costs of injury by cause In New Brunswick the total costs of injuries was $696 million. Falls were responsible for the largest fraction of these costs making up 36% of totals costs, 43% of direct costs and 26% of indirect costs. Other unintentional injuries generated 24% of total costs, 28% of direct costs and 20% of indirect costs while transport incidents accounted for a further 17% of total costs, 14% of direct costs and 22% of indirect costs. Other causes of injury contributing to the overall costs were suicide and self-harm (11% total costs, 6% direct costs, 18% indirect costs); unintentional poisoning (4% total, 2% direct, 6% indirect); violence (3% total costs, 3% direct costs, 3% indirect costs); and injuries of undetermined intent (2% total, 2% direct, 2% indirect).
Cause DeathsDeath rate (per
100,000) Total CostsCosts per
capita
Transport Incidents 95 12.6 $120 million $160
Falls 85 11.3 $248 million $330
Suicide/Self-Harm 105 13.9 $78 million $103
Violence 10 1.3 $21 million $28
New Brunswick ! 87
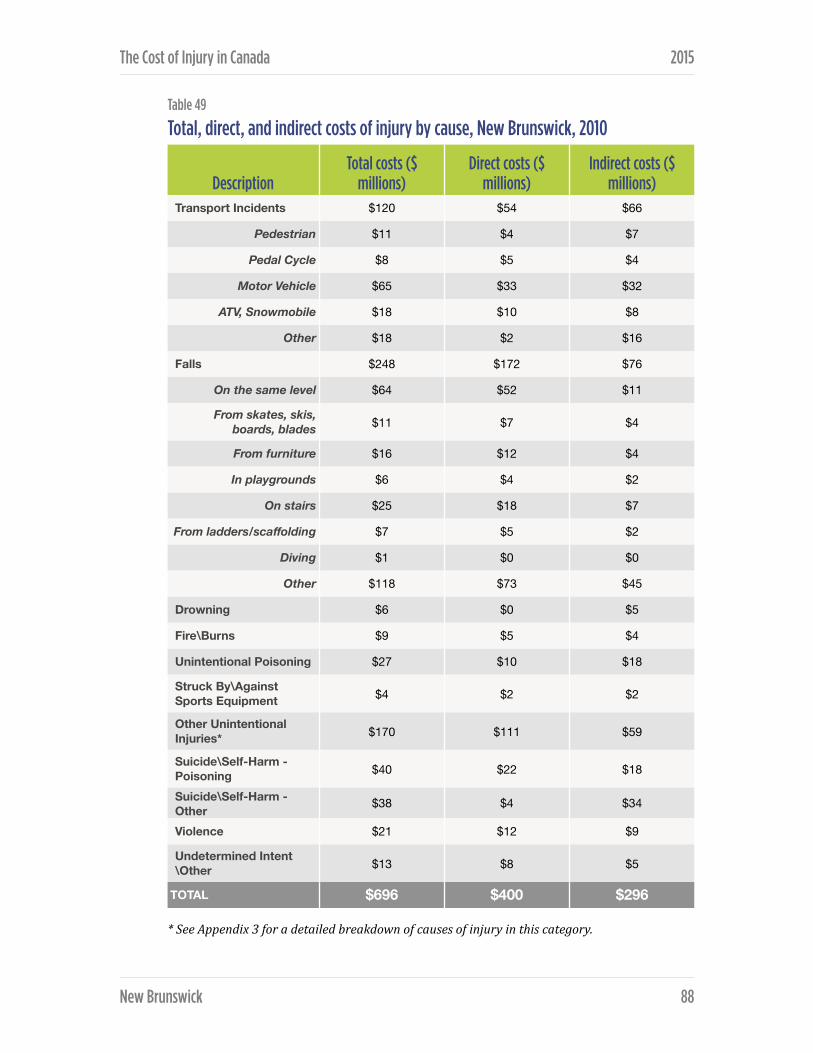
The Cost of Injury in Canada 2015
Table 49
Total, direct, and indirect costs of injury by cause, New Brunswick, 2010
* See Appendix 3 for a detailed breakdown of causes of injury in this category.
DescriptionTotal costs ($
millions)Direct costs ($
millions)Indirect costs ($
millions)Transport Incidents $120 $54 $66
Pedestrian $11 $4 $7
Pedal Cycle $8 $5 $4
Motor Vehicle $65 $33 $32
ATV, Snowmobile $18 $10 $8
Other $18 $2 $16
Falls $248 $172 $76
On the same level $64 $52 $11
From skates, skis, boards, blades $11 $7 $4
From furniture $16 $12 $4
In playgrounds $6 $4 $2
On stairs $25 $18 $7
From ladders/scaffolding $7 $5 $2
Diving $1 $0 $0
Other $118 $73 $45
Drowning $6 $0 $5
Fire\Burns $9 $5 $4
Unintentional Poisoning $27 $10 $18
Struck By\Against Sports Equipment $4 $2 $2
Other Unintentional Injuries* $170 $111 $59
Suicide\Self-Harm - Poisoning $40 $22 $18
Suicide\Self-Harm - Other $38 $4 $34
Violence $21 $12 $9
Undetermined Intent\Other $13 $8 $5
TOTAL $696 $400 $296
New Brunswick ! 88

The Cost of Injury in Canada 2015
Transport-related injuries by cause and associated costs Motor vehicles were responsible for 44% of injury-related deaths, and led to 59% of hospitalizations, 56% of emergency room visits, 56% of permanent partial disability and 59% of permanent total disability resulting from transport-related injuries.
Injury-related transport deaths also occurred due to non-specific transport incidents (34%), pedestrian injuries (13%), ATV or snowmobile events (7%) and cycling incidents (3%). After motor vehicles, 22% of hospitalizations for transport-related injuries resulted from ATV/snowmobile events, followed by pedestrian incidents (8%), cycling (7%), and other transit events (4%). The remaining reasons for transport-injury emergency room visits were incidents related to cycling (20%), other non-specific incidents (10%), ATVs or snowmobiles (7%) and pedestrians (6%).
In 2010, the cost of injuries due to transport incidents totaled $120 million, of which more than half (54%) was spent addressing injuries from motor vehicle related events. Injuries from motor vehicle events accounted for 60% of the health care cost of transport injuries, and 48% of indirect costs. Costs also occurred due to ATV and snowmobile incidents (15% of total, 19% of direct, 12% indirect), other non-specific incidents (15% total, 4% direct, 24% indirect), pedestrian incidents (9% total, 8% direct, 10% indirect) and cycling events (7% total, 9% direct, 6% indirect).
Fall-related injuries by cause and associated costs Nearly three quarters (74%) of fall-related deaths occurred due to non-specific types of falls, as did 41% of hospitalizations, 39% of emergency room visits, and 36% of permanent partial and total disabilities. Other causes of fall-related deaths were falls on stairs (9%), falls on the same level (8%), falls from furniture (7%), and falls from ladders/scaffolding (1%).
Other reasons for fall-related hospitalizations were falls on the same level (32%), falls on stairs (11%), falls from furniture (8%), falls from skates/skis/boards/ blades (3%), falls from ladders/scaffolding (3%), and falls on playgrounds (2%). Fall-related injury emergency room visits also resulted from falls from the same level (32%), on stairs (13%), from skates/skis/boards/blades or from furniture (each 6%), in playgrounds (2%), and from ladders or scaffolding (2%).
New Brunswick ! 89

The Cost of Injury in Canada 2015
The greatest overall costs due to falls can be attributed to non-specific fall events which made up 48% of the total costs, 43% of direct costs, and 59% of indirect spending. After non-specific reasons, falls on the same level accounted for the greatest portion (26%) of total fall-related injury costs (30% of direct costs and 15% indirect costs). Spending on fall-related injuries also went to address falls on stairs (10% total, 11% of direct and 9% of indirect), falls from furniture (6% total, 7% of direct and 5% of indirect), falls from skates/ski/boards/blades (4% total, 4% of direct and 6% of indirect), falls in playgrounds (3% total, 2% of direct and 3% of indirect), and falls from ladders or scaffolding (3% total, 3% of direct and 3% of indirect).
Intentional injuries by cause and associated costs Suicide and self-harm deaths account for 91% of all intentional injury deaths in New Brunswick in 2010. The leading cause of death was suicide or self-harm by method other than poison, while suicide by poisoning caused 21% of intentional deaths and violence the remaining 9%.
Suicide and self-harm injuries were responsible for 78% of intentional injury hospitalizations in 2010. The leading cause of hospitalization was suicide or self-harm – poison (71%), followed by violence (22%) and suicide or self-harm – other. Violence-related injuries led to almost three quarters (74%) of intentional injury emergency room visits while suicide/self-harm made up the remaining quarter (20% poison-related, 6% other causes). Suicide or self-harm by poison was the leading case of permanent partial and permanent total disability (69% and 49%, respectively) followed by violence (25% and 43%, respectively) and suicide or self-harm by other methods (6% and 8%, respectively).
More than $98 million was spent in 2010 in New Brunswick to address the direct and indirect costs associated with intentional injury. Forty percent of total costs addressed suicide or self-harm due to poisoning, 38% addressed suicide or self-harm by other means, and 21% addressed injuries due to violence. Of the direct health care costs associated with intentional injury, suicide or self-harm by poison resulted in 58% of the spending, other methods of suicide or self-harm precipitated 10% and the remaining 32% addressed injuries due to violence. Indirect costs were due 30% to suicide or self-harm using poison, 56% to other suicide or self-harm and 14% to violence.
New Brunswick ! 90

NEWFOUNDLAND AND LABRADOR
Injury prevention is one of the priority areas identified in Newfoundland and Labrador’s provincial Wellness Plan, Achieving Health and Wellness: Provincial Wellness Plan for Newfoundland and Labrador (2006-‐2008). The goal of the Wellness Plan is “to keep people healthy through the promotion of initiatives and support for people and communities”. The Wellness Plan represents a shared responsibility between government departments, regional health authorities, provincial networks, community organizations, and coalitions, who work together to implement legislation and initiatives, as well as provide additional support and direction for injury prevention.
Actions within the Wellness Plan fall under the Department of Seniors, Wellness and Social Development in the Healthy Living Division. Other departments, such as the Department of Service NL, are responsible for legislation and regulations for injury-related areas.
Unintentional injuries remain the focus for injury prevention within the Wellness Plan, with recent years particularly focusing on helmet use, distracted driving, child passenger safety, pedestrian safety and seniors falls prevention. Intentional injuries are addressed through other government initiatives such as the provincial Violence Prevention Initiative of the provincial Women’s Policy Office, or through the Department of Justice. Workplace injuries are addressed through the provincial Workplace, Health and Safety Compensation Commission.
Newfoundland and Labrador continues to build on the work of injury prevention networks in the province networks, and with Atlantic and national injury prevention collaborations. The Provincial Government continues to invest annually in the Newfoundland and Labrador Injury Prevention Coalition (NLIPC) and in partnership with the other Atlantic Provinces contributes funding for the Atlantic Collaborative for Injury Prevention (ACIP). In-kind support is provided to the NLIPC by Safety Services NL and other NLIPC members.
Newfoundland and Labrador ! 91

The Cost of Injury in Canada 2015
Total cost of injury
In 2010 injury cost the province of Newfoundland and Labrador $391 million and took the lives of 235 individuals.
In the same year injuries also resulted in 3,495 hospitalizations, nearly 52,666 visits to the emergency room, 893 cases of permanent partial disability and 70 cases of permanent total disability.
Based on the 2010 population of 541,761, injuries caused 43 deaths and 1,358 potential years of life lost per 100,000 residents and cost $749 per capita in direct and indirect expenditures.
Table 50
Summary of findings, all injury, Newfoundland and Labrador, 2010
Direct and indirect costs In Newfoundland and Labrador the overall costs of injuries in 2010 was $391 million. Nearly two thirds (64%) of the total costs were direct health care costs: $249 million ($476 per capita). Indirect costs totalled $142 million ($273 per capita).
Intentional and unintentional injury Most injuries that occurred in Newfoundland and Labrador in 2010 were unintentional. Unintentional injuries led to 66% of injury-related deaths, 85% of injury hospitalization, 96% of emergency room visit due to injury and 87% of injuries resulting in permanent partial or total disability. Intentional injuries were responsible for 30% of injury deaths, 12% of hospitalizations, 4% of emergency room visits, 11% of permanent partial disability and 8% of permanent total disability.
Injury Deaths Hospitalizations
Emergency Room Visits
Permanent Partial
Disability
Permanent Total
Disability Total Economic Cost of Injury
235 3,495 52,666 893 70 $391 million
Newfoundland and Labrador ! 92

The Cost of Injury in Canada 2015
Table 51
Injury by intent, Newfoundland and Labrador, 2010
Table 52
Total, direct, and indirect costs by intent of injury, Newfoundland and Labrador, 2010
Unintentional injuries accounted for 83% of total spending on injuries including 89% of direct costs, and 71% of indirect costs. Costs due to intentional injuries made up 15% of total costs (9% direct and 25% indirect) while the remaining 3% of costs were due to injuries of undetermined intent.
Injury by cause In Newfoundland and Labrador in 2010 the leading causes of death due to injury were suicide or self-harm, and injuries resulting from other (non-specified) unintentional causes. Suicide and self-harm accounted for 28% of all injury deaths while death due to other unintentional causes made up 26%. Deaths due to injury also resulted from transportation incidents (21%), falls (6%), drowning (9%), unintentional poisonings (2%), violence (2%), fires or burns (2%), and injuries of undetermined intent (4%).
Description Deaths Hospitalizations
Emergency Room Visits
Permanent Partial
Disability
Permanent Total
Disability
Unintentional 155 2,957 50,369 776 63
Intentional 70 427 1,984 94 6
Undetermined Intent/Other
10 111 312 23 <5
TOTAL 235 3,495 52,666 893 70
DescriptionTotal costs
($ millions)Direct costs ($ millions)
Indirect costs ($ millions)
Unintentional $6,782 $4,273 $2,508
Intentional $1,239 $388 $851
Undetermined Intent/Other
$174 $60 $114
TOTAL $8,195 $4,722 $3,473
Newfoundland and Labrador ! 93

The Cost of Injury in Canada 2015
Table 53
Injury deaths, hospitalizations, and emergency room visits by cause, Newfoundland and Labrador, 2010
* See Appendix 3 for a detailed breakdown of causes of injury in this category.
Description Deaths HospitalizationsEmergency Room Visits
Permanent Partial
Disability
Permanent Total
Disability Transport Incidents 50 489 4,432 124 12
Pedestrian 7 34 271 18 <5
Pedal Cycle <5 29 889 11 <5
Motor Vehicle 21 262 2,495 64 7
ATV, Snowmobile <5 131 318 30 <5
Other 17 33 461 10 <5
Falls 15 1,899 15,575 377 31
On the same level <5 792 5,048 145 11
From skates, skis, boards, blades <5 43 943 16 <5
From furniture <5 141 880 21 <5
In playgrounds <5 17 331 6 <5
On stairs <5 202 2,004 50 5
From ladders/scaffolding <5 59 367 17 <5
Diving <5 <5 46 <5 <5
Other 10 644 5,956 121 11
Drowning 20 <5 19 <5 <5
Fire\Burns 5 39 657 16 <5
Unintentional Poisoning 5 102 818 25 <5
Struck By\Against Sports Equipment <5 12 1,001 8 <5
Other Unintentional Injuries* 60 415 27,868 225 16
Suicide\Self-Harm - Poisoning 15 291 409 63 <5
Suicide\Self-Harm - Other 50 37 119 6 <5
Violence 5 99 1,457 25 <5
Undetermined Intent\Other 10 111 312 23 <5
TOTAL 235 3,495 48,966 879 70
Newfoundland and Labrador ! 94

The Cost of Injury in Canada 2015
More than half of injuries resulting in hospitalization were due to falls (54%). Transport incidents were the cause of 14% of hospitalization, followed by other unintentional injuries (12%), suicide or self-harm (9%), unintentional poisoning (3%), events of undetermined intent (3%), violence (3%) and fire/burns (1%).
The two main reasons for injury-related visits to the emergency room were other (non-specific) unintentional injuries (53%), and falls (30%). Additional reasonsfor emergency room visits were transport incidents (8%), violence (3%), unintentional poisoning (2%), being struck by or against sporting equipment (2%), fire or burns (1%), suicide or self-harm (1%), and events of unspecified intent (1%).
Falls were the leading cause of both permanent partial disability (42%), and permanent total disability (45%). Other reasons for these two outcomes included transport incidents (14% of partial disability and 17% of total disability) as well as other non-specific unintentional injuries (25% of partial disability and 23% of total disability). Less frequent causes of partial disability include suicide or self-harm (8%), violence (3%), intentional poisoning (3%), fire/burns (2%) and events of indeterminate intent (3%).
Table 54
Mortality, crude death rates (per 100,000 pop.) and total cost per capita by cause, Newfoundland and Labrador, 2010
In Newfoundland and Labrador the suicide/self harm was responsible for the highest injury-related death rate (12.5 per 100,000) while the highest per capita costs ($263) resulted from falls.
Cause DeathsDeath rate
(per 100,000) Total CostsCosts per
capita
Transport Incidents 50 9.2 $66 million $123
Falls 35 6.7 $137 million $263
Suicide/Self-Harm 65 12.5 $46 million $88
Violence 5 0.9 $13 million $23
Newfoundland and Labrador ! 95

The Cost of Injury in Canada 2015
Costs of injury by cause
Table 55
Total, direct, and indirect costs of injury by cause, Newfoundland and Labrador, 2010
* See Appendix 3 for a detailed breakdown of causes of injury in this category.
DescriptionTotal costs
($ millions)Direct costs ($ millions)
Indirect costs ($ millions)
Transport Incidents $66 $35 $31
Pedestrian $6 $3 $3
Pedal Cycle $6 $4 $2
Motor Vehicle $33 $19 $15
ATV, Snowmobile $12 $7 $5
Other $9 $2 $7
Falls $137 $111 $26
On the same level $50 $42 $7
From skates, skis, boards, blades $5 $3 $2
From furniture $9 $7 $2
In playgrounds $2 $1 $1
On stairs $16 $12 $4
From ladders/scaffolding $4 $3 $1
Diving $0 $0 $0
Other $51 $41 $9
Drowning $7 $0 $7
Fire\Burns $10 $6 $3
Unintentional Poisoning $9 $5 $4
Struck By\Against Sports Equipment $3 $2 $1
Other Unintentional Injuries* $92 $63 $29
Suicide\Self-Harm - Poisoning $25 $14 $10
Suicide\Self-Harm - Other $21 $2 $19
Violence $11 $6 $5
Undetermined Intent\Other $11 $5 $6
TOTAL $391 $249 $142
Newfoundland and Labrador ! 96

The Cost of Injury in Canada 2015
In 2010 injury costs in Newfoundland and Labrador were most often attributable to falls. Falls accounted for 35% of all costs, 44% of direct health care costs and 19% of indirect costs. Total costs also resulted from other non-specified unintentional injuries (24%), transport incidents (17%), suicide or self-harm (12%), violence (3%), cases with undetermined intent (3%), fire/burns (2%), drowning (2%), unintentional poisoning (2%), and being struck by/against sporting equipment (1%).
After falls, the main causes of direct costs were other (non-specific) unintentional injuries (25%), transportation incidents (14%) and suicide or self-harm (6%). Injury-related direct costs also accrued due to injuries from violence (2%), fire/burns (2%), unintentional poisoning (2%), undetermined intent (2%) and being struck by or against sporting equipment.
The primary causes of indirect injury costs were transportation events (22%), suicide and self-harm (21%), falls (19%) and other unintentional injuries (20%). The remaining 18% of indirect costs resulted from drowning (5%), violence (4%), injuries of undetermined intent (4%), unintentional poisonings (3%), fire or burn injuries (2%) and injuries due to being struck by or against sporting equipment (1%).
Transport-related injuries by cause and associated costs Motor vehicle incidents were the most common cause of transport-related injuries. They caused 42% of deaths, 54% of hospitalizations, 57% of emergency room visits, 52% of permanent partial disabilities and 56% of permanent total disabilities.
Remaining deaths due to transport injuries resulted from other non-specific events (34%), pedestrian events (14%), ATV or snowmobile related injuries (7%) and cycling (3%). Beyond motor vehicle incidents hospitalizations resulted from ATV or snowmobile events (27%), other transport incidents (7%), pedestrian incidents (7%), and cycling events (6%). Emergency room visits for transportation-related injuries were due 20% to cycling incidents, 10% to non-specific incidents, 7% to ATV or snowmobile accidents, and 6% to pedestrian events.
After motor vehicle accidents the causes of permanent partial disability in Newfoundland and Labrador in 2010 were ATV/snowmobile events (24%), cycling accidents (9%), other transportation incidents (8%) and pedestrian incidents (7%). Total permanent disability also resulted from ATV/snowmobile
Newfoundland and Labrador ! 97

The Cost of Injury in Canada 2015
incidents (21%), other non-specified events (7%), pedestrian incidents (8%) and cycling injuries (8%).
Motor vehicle events were also the greatest driver of transportation-related injury costs making up 50% of total costs, 54% of health care costs and 46% of indirect costs. ATV or snowmobile incidents were responsible for 21% of direct costs and 16% of indirect costs while cycling accidents resulted 11% of health care costs and 7% of indirect costs. The remaining direct and indirect costs were due to pedestrian events (8% and 9% respectively) and other non-specific transport incidents (6% and 22% respectively).
Fall-related injuries by cause and associated costs In 2010 in Newfoundland and Labrador, 15 individuals died due to injuries caused by falls. The majority (69%) of these fall-related deaths were due unspecified types of falls while deaths also occurred due to falling on stairs (13%), falling on the same level (8%), falling from furniture (8%) and falling from skates/skis/boards/blades (1%).
The main cause of fall-related hospitalizations were falls from the same level (42%). Other causes were other (non-specific) falls (34%), falls on stairs (11%), falls from furniture (7%), falls from ladders/scaffolding (3%), falls from stakes/skis/boards/blades (2%), and falls in play grounds (1%). Fall-related emergency room visits were due most often to other non-specific fall events (38%), followed by falls from the same level (32%), falls on stairs (13%), falls from furniture (6%), falls from sporting equipment (6%), falls in playgrounds (2%), and falls from ladders/scaffolding (2%).
The total costs associated with falls in Newfoundland and Labrador in 2012 was $137 million. Total costs were dominated by falls occurring on the same level (36%) and other non-specified types of falls (37%). Costs to address fall-related injuries also accrued due to falls on stairs (12%), from furniture (7%), off ladders or scaffolding (3%), from sports equipment (4%) and in playgrounds (2%).
Falls occurring on the same level generated 38% of direct costs and 28% of indirect costs related while other non-specific fall events resulted in 37% of direct and 36% of indirect costs. Direct costs also resulted from falls from furniture (7%) and falls on stairs (11%). Indirect costs occurred due to falls on stairs (15%), falls
Newfoundland and Labrador ! 98

The Cost of Injury in Canada 2015
from sporting equipment (7%), falls from furniture (6%), falls in playgrounds (4%) and falls from ladders or scaffolding (4%).
Intentional injuries by cause as associated costs In 2010 a total of 70 deaths occurred due to intentional injury. Most of these deaths resulted from suicide or self-harm by means other than poison (71%), while suicide or self-harm using poison accounted for 22% of deaths and violence led to the remaining 7%.
Intentional injury-related hospitalizations were most often the result of suicide or self-harm poisonings (68%), followed by events of violence (23%), and other suicide or self-harm cases (9%). The majority (73%) of emergency room visits for intentional injuries resulted from violence while 21% of visits were due to suicide or self-harm poisonings, and 6% occurred for other suicide or self-harm events. Intentional injury resulting in permanent disability occurred due suicide or self-harm – poison (67% of partial disability, 48% of total disability), violence (26% of partial disability, 42% of total disability) and suicide or self-harm by means other than poison (7% of partial disability, 10% of total disability).
The total costs associated with intentional injuries were dominated by suicide or self-harm poisoning (43%) and other suicide or self-harm events (37%) while violence accounted for 20% of total costs. The majority (64%) of direct health care costs accrued due to poison-related suicide or self-harm events, followed by violence (28%), and other suicide or self-harm events (9%). The highest portion of indirect costs was invested to address suicide or self-harm by means other than poison (55%), while 30% of these costs were due to poison-related suicide/self-harm events and the remaining 15% addressed injuries resulting from violence.
Newfoundland and Labrador ! 99

NOVA SCOTIA In 2004, Nova Scotia became the first province in Canada to develop a government supported comprehensive Injury Prevention Strategy. In 2009 this Strategy was renewed with involvement from many injury prevention partners and co-released by the provincial government and Injury Free Nova Scotia. The renewed strategy called Taking It to the Next Level, builds on what has been achieved since the introduction of the original strategy.
The renewed Strategy’s vision is for everyone in Nova Scotia working together to create healthy and safe communities. Objectives focus on reducing injuries, improving all aspects of the health of Nova Scotians and making injury prevention more visible in our communities. The Strategy provides stakeholders, both within and outside traditional boundaries of injury prevention, with a framework to guide activities – from planning and development to implementation and evaluation. This purpose reflects the need to make injury prevention more visible as an important aspect of healthy communities. This includes reducing disparity across the entire population and focusing on the sub-populations where the rates of injury are highest.
Priorities are based on surveillance, research, and consultation and include seniors’ falls, suicide and attempted suicide and road safety. Priority populations include:
❖ children and youth,
❖ older Nova Scotians (seniors), and
❖ other populations at increased risk of injury.
Priority settings are schools, workplaces, homes, communities, roads and streets, health care settings, recreation and leisure settings.
Although the Nova Scotia Department of Health & Wellness and Injury Free Nova Scotia provide overall leadership for the Strategy, it is a shared responsibility between many government departments (e.g. NS Department of Transportation & Infrastructure Renewal; Community Services), provincial organizations and community groups. Success of the Strategy is dependent on the involvement of all stakeholders who have either the mandate or ability to
Nova Scotia ! 100

The Cost of Injury in Canada 2015
positively influence the issue of injury. To action the Injury Prevention Strategy, the government supports many injury prevention organizations that focus on the key priority areas and populations.
There are numerous non-government organizations involved in injury prevention including, but not limited to, Injury Free Nova Scotia (IFNS), Child Safety Link, Atlantic Collaborative on Injury Prevention (ACIP), Safety Services Nova Scotia, the Division of Neurotrauma (QEII Hospital), Community Links, Canadian Mental Health Association, and the Ecology Action Centre. These groups often partner on projects. For example, ACIP provides a forum for collaboration and host an Atlantic injury prevention conference every two years. Child Safety Link, ACIP, IFNS, Department of Transportation & Infrastructure Renewal, Department of Health & Wellness and the Ecology Action Centre and others also partner on various road safety issues.
Total cost of injury
In 2010, injuries cost Nova Scotians $790 million and caused 510 deaths.
In the same year 6,436 hospitalizations and 96,107 visits to the emergency room resulted from injuries as did 1,506 cases of permanent partial disability and 119 cases of permanent total disability.
Table 56
Summary of findings, all injury, Nova Scotia, 2010
Based on a Nova Scotia population of 942,073 the annual mortality rate due to injury was 54 per 100,000 people. An estimated 1,367 potential years of life were lost for every 100,000 Nova Scotians, and the per capita cost of injury was $877.
Injury Deaths Hospitalizations
Emergency Room Visits
Permanent Partial
Disability
Permanent Total
Disability Total Economic Cost of Injury
510 6,436 96,107 1,506 119 $790 million
Nova Scotia ! 101

The Cost of Injury in Canada 2015
Direct and indirect costs The total costs of injury in 2010 were $790 million of which $546 million (69%, or $579 per capita) were direct health care costs and $245 million (31% or $260 per capita) were indirection costs.
Intentional and unintentional injury
Table 57
Injury by intent, Nova Scotia, 2010
Unintentional injuries made up the majority of injury-related deaths (75%), hospitalizations (88%), emergency room visits (96%), and permanent partial (88%) and total (90%) disabilities. Intentional injury accounted for one quarter of the 2010 injury related deaths, 11% of injury hospitalizations, 4% of emergency room visits, and — respectively — 10% and 9% of the cases of permanent partial and total disability. The remaining events were attributable to events of undetermined intent.
The cost of injury in Nova Scotia reflects the distribution of injury intent. Unintentional injuries account for $676 million of (85%) total costs including 91% of direct costs and 72% of indirect costs. Intentional injuries generated 13% of total costs associated with injuries, including 8% of direct costs and 26% of indirect expenditures. One percent of total costs were due to injuries of undetermined intent.
Description Deaths Hospitalizations
Emergency Room Visits
Permanent Partial
Disability
Permanent Total
Disability
Unintentional 380 5,643 91,927 1,329 107
Intentional 125 685 3,616 153 11
Undetermined Intent/Other
5 108 564 24 <5
TOTAL 510 6,436 96,107 1,506 119
Nova Scotia ! 102
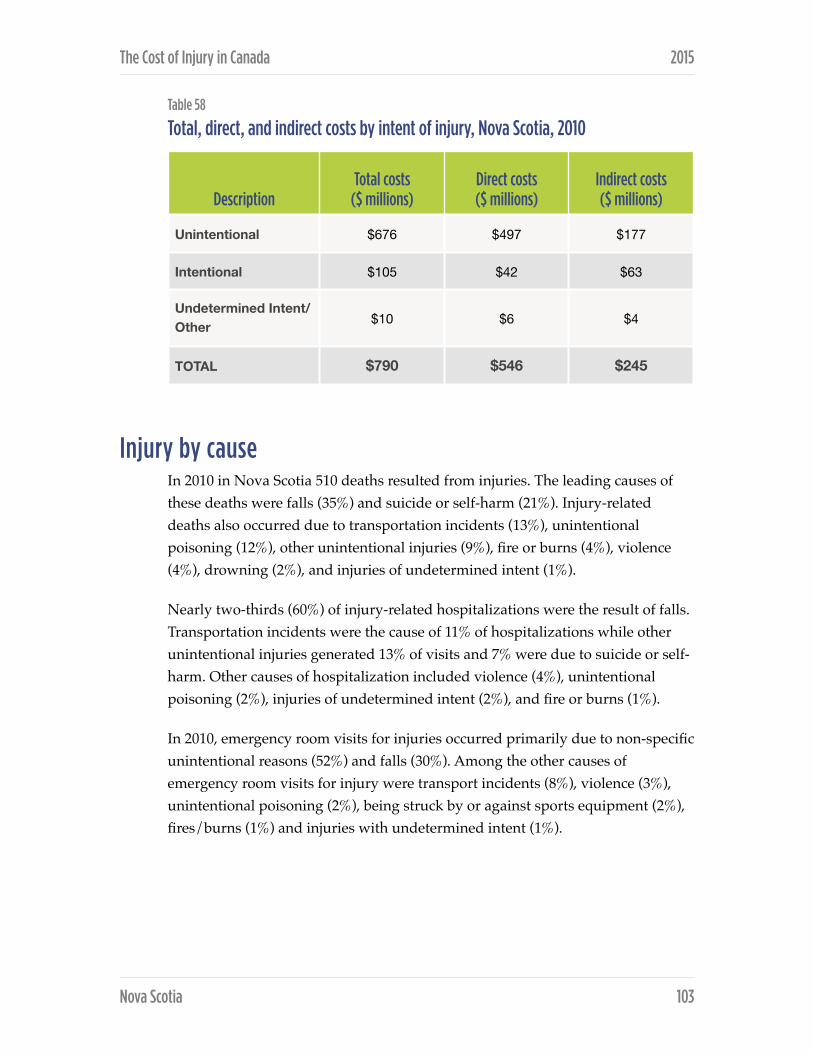
The Cost of Injury in Canada 2015
Table 58
Total, direct, and indirect costs by intent of injury, Nova Scotia, 2010
Injury by cause In 2010 in Nova Scotia 510 deaths resulted from injuries. The leading causes of these deaths were falls (35%) and suicide or self-harm (21%). Injury-related deaths also occurred due to transportation incidents (13%), unintentional poisoning (12%), other unintentional injuries (9%), fire or burns (4%), violence (4%), drowning (2%), and injuries of undetermined intent (1%).
Nearly two-thirds (60%) of injury-related hospitalizations were the result of falls. Transportation incidents were the cause of 11% of hospitalizations while other unintentional injuries generated 13% of visits and 7% were due to suicide or self-harm. Other causes of hospitalization included violence (4%), unintentional poisoning (2%), injuries of undetermined intent (2%), and fire or burns (1%).
In 2010, emergency room visits for injuries occurred primarily due to non-specific unintentional reasons (52%) and falls (30%). Among the other causes of emergency room visits for injury were transport incidents (8%), violence (3%), unintentional poisoning (2%), being struck by or against sports equipment (2%), fires/burns (1%) and injuries with undetermined intent (1%).
DescriptionTotal costs
($ millions)Direct costs ($ millions)
Indirect costs ($ millions)
Unintentional $676 $497 $177
Intentional $105 $42 $63
Undetermined Intent/Other $10 $6 $4
TOTAL $790 $546 $245
Nova Scotia ! 103

The Cost of Injury in Canada 2015
Table 59
Injury deaths, hospitalizations, and emergency room visits by cause, Nova Scotia, 2010
* See Appendix 3 for a detailed breakdown of causes of injury in this category.
Description Deaths HospitalizationsEmergency Room Visits
Permanent Partial
Disability
Permanent Total
Disability Transport Incidents 65 691 8,015 178 17
Pedestrian 9 63 492 16 <5Pedal Cycle <5 67 1,612 24 <5
Motor Vehicle 28 411 4,504 99 10 ATV, Snowmobile 5 93 574 23 <5
Other 21 57 833 16 <5Falls 180 3,886 28,951 669 56
On the same level 15 1,490 9,364 240 18 From skates, skis,
boards, blades <5 83 1,731 29 <5
From furniture 13 281 1,657 40 <5In playgrounds <5 49 597 16 <5
On stairs 16 370 3,652 80 8 From ladders/
scaffolding <5 106 651 27 <5
Diving <5 2 85 <5 <5Other 134 1,505 11,215 235 21
Drowning 10 9 34 <5 <5Fire\Burns 20 56 1,186 26 <5Unintentional Poisoning 60 157 1,480 37 <5
Struck By\Against Sports Equipment <5 24 1,829 15 <5
Other Unintentional Injuries*
45 820 50,432 304 21
Suicide\Self-Harm - Poisoning 24 385 738 86 <5
Suicide\Self-Harm - Other 81 68 217 11 <5
Violence 20 232 2,661 55 6 Undetermined Intent\Other 5 108 564 24 <5
TOTAL 510 6,436 96,107 1,408 112
Nova Scotia ! 104

The Cost of Injury in Canada 2015
In Nova Scotia, the leading cause of permanent disability in 2010 was falls which accounted for 44% of partial and 47% of total disability cases. Other unintentional injuries were responsible for 27% of cases of permanent partial disability and 24% of cases of permanent total disability while transport incidents were responsible for 12% and 15%, respectively. Among the other causes of permanent partial disability were suicide or self-harm (6%), and violence (4%), unintentional poisoning (2%), fire/burns (2%), injuries of undetermined intent (2%), and being struck by or against sporting equipment (1%).
Table 60
Mortality, crude death rates (per 100,000 pop.) and total cost per capita by cause, Nova Scotia, 2010
In Nova Scotia the highest injury-related death rate in 2010 was due to falls (19.1 deaths per 100,000 citizens). Falls were also responsible for the highest per capita cost — $259 per citizen.
Costs of injury by cause The total cost of injury in Nova Scotia in 2010 was $790 million including $546 million in direct health care costs and $245 million in indirect costs. Nearly one third (31%) of overall injury costs and 37% of direct costs were due to falls, while the largest drivers of indirect cost were transport incidents (19%) and suicide or self-harm (19%).
Cause DeathsDeath rate
(per 100,000) Total CostsCosts per
capita
Transport Incidents 65 6.9 $109 million $116
Falls 180 19.1 $243 million $259
Suicide/Self-Harm 105 11.1 $74 million $78
Violence 20 2.0 $32 million $34
Nova Scotia ! 105

The Cost of Injury in Canada 2015
Table 61
Total, direct, and indirect costs of injury by cause, Nova Scotia, 2010
* See Appendix 3 for a detailed breakdown of causes of injury in this category.
DescriptionTotal costs
($ millions)Direct costs ($ millions)
Indirect costs ($ millions)
Transport Incidents $109 $62 $47
Pedestrian $10 $5 $5
Pedal Cycle $10 $6 $4
Motor Vehicle $64 $40 $23
ATV, Snowmobile $11 $6 $5
Other $14 $4 $10
Falls $244 $199 $44
On the same level $80 $69 $12
From skates, skis, boards, blades $10 $6 $4
From furniture $17 $15 $3
In playgrounds $6 $4 $2
On stairs $24 $18 $6
From ladders/scaffolding $7 $5 $2
Diving $1 $1 $0
Other $98 $82 $16
Drowning $4 $0 $4
Fire\Burns $11 $5 $6
Unintentional Poisoning $34 $9 $25
Struck By\Against Sports Equipment $5 $3 $2
Other Unintentional Injuries* $268 $220 $48
Suicide\Self-Harm - Poisoning $38 $22 $16
Suicide\Self-Harm - Other $36 $5 $30
Violence $32 $14 $17
Undetermined Intent\Other $10 $6 $4
TOTAL $790 $546 $245
Nova Scotia ! 106

The Cost of Injury in Canada 2015
Of the total costs other non-specific unintentional injuries accounted for 34% of spending, transport incidents for 14%, suicide or self-harm for 9%, unintentional poisonings for 4% and violence for 4%. The remaining 4% of total costs were due to drowning , fire/burns , being struck by or against sports equipment , and injuries of undetermined intent (1% each).
While falls were the main driver of direct health care costs, transport incidents were responsible 11% of the expense, other non-defined unintentional injuries for 40%, and suicide and self-harm for 5%. Remaining health care costs were due to violence (3%), unintentional poisoning (2%), fire or burns (1%), being struck by or against sports equipment (1%) and injuries of undetermined intent (1%).
Indirect costs were most often due to transport incidents (19%), suicide and self-harm (19%) and falls (18%). Indirect costs were also accrued due to other unintentional injuries (20%), unintentional poisonings (10%), violence (7%), fire or burns (3%), drowning (2%), injuries of undetermined intent (2%) and sports equipment (1%).
Transport-related injuries by cause and associated costs Motor vehicle events were the main cause of transportation-related injury deaths in 2010 accounting for 28 (44%) of the total 65 deaths. Motor vehicle events were also the main cause of hospitalizations (59%), emergency room visits (56%), permanent partial disability (56%), and permanent total disability (59%) due to transportation-related injuries.
The remaining deaths due to transport injuries were attributable to other non-specified events (32%), pedestrian events (14%), ATV or snowmobile incidents (7%) and cycling (3%). Aside from motor vehicle incidents, transport-related hospitalization and emergency room visits were the result of: ATV or snowmobile incidents (13% and 7% respectively), cycling (10% and 20% respectively), pedestrian incidents (9% and 6% respectively), and other non-specific incidents (8% and 10% respectively).
In Nova Scotia the total cost of transport-related injuries was $109 million in 2010. Motor vehicle incidents generated $64 million (58%) of these costs, and were responsible for 65% of direct costs, and half of indirect expenses. Total costs were also attributable to other non-specific transportation injuries (13%), ATV or snowmobile incidents (11%), and pedestrian and cycling incidents (each 9%).
Nova Scotia ! 107

The Cost of Injury in Canada 2015
After motor vehicle incidents, direct costs due to transportation-related injuries were most often due to cycling (10%), followed by ATV or snowmobile events (10%), pedestrian incidents (8%) and other transport events (6%). The half of indirect costs not due to motor vehicle incidents accumulated due to non-specific transport incidents (22%), ATV or snowmobile events (11%), and cycling and pedestrian events (8% and 10%, respectively).
Fall-related injuries by cause and associated costs Non-specific falls were responsible for nearly three quarters (74%) of all fall-related deaths in Nova Scotia in 2010. Injury and death from falls also occurred due to falls on stairs (9%), falls from the same level (8%), and falls from furniture (7%), and falls from ladders/scaffolding (1%).
Of the falls resulting in injury hospitalization, most occurred due to falling on the same level (38%) and other (non-specific) falls (39%). Other fall types leading to hospitalization occurred on stairs (10%), from furniture (7%), off ladders or scaffolding (3%), from sports equipment (2%) and in playgrounds (1%). Similarly, the two most significant reasons for fall-related emergency room visits were falls on the same level (32%) and other non-specific falls (39%). Thirteen percent of falls leading to emergency room visits occurred on the stairs, 6% occurred from furniture, 6% occurred from skates, skis, boards or blades, while 2% resulted from falls from ladders or scaffolding, and a final 2% from falls in playgrounds.
In 2010 in Nova Scotia the costs associated with falls amounted to $244 million. The main drivers of that cost were falls on the same level ($80 million or 33%), and other non-specific types of falls ($98 million or 40%). Non-specific types of falls and falls on the same level were also the largest portion of total healthcare costs (41% and 34%, respectively) and indirect costs (36% and 26%, respectively).
Total costs also resulted from falls on stairs (10%), falls from furniture (7%), falls from sports equipment (4%), falls in playground (3%) and falls from ladders or scaffolding (3%). Nine percent of direct health care costs resulted from falls on stairs while costs also accumulated due to falls from furniture (7%), from skates/skis/boards/blades (3%), from ladders or scaffolding (2%) and from falls in playgrounds (2%). In addition to the two main categories noted above, indirect costs resulted from falls on stairs (13%), from sporting equipment (9%), from furniture (7%), in playground (5%), and from ladders/scaffolding (4%).
Nova Scotia ! 108

The Cost of Injury in Canada 2015
Intentional injuries by cause and associated costs In 2010 almost two-thirds (65%) of the 125 deaths due to intentional injuries resulted from suicide or self-harm by methods other than poison. Nineteen percent of these deaths was due to suicide or self-harm by poison, and the remaining 16% occurred due to violence.
Hospitalizations resulting from intentional injuries were dominated (56%) by cases due to suicide or self-harm using poison, while 34% hospitalizations resulted from violence and 10% occurred because of suicide or self-harm using other means. Violence accounted for 74% emergency room visits for intentional injuries while remaining visits occurred for suicide or self-harm poisoning (20%) and other types of suicide or self-harm (6%). Of the total 153 cases of permanent partial disability, 56% resulted from poisoning-related suicide or self-harm events, 36% were due to violence and the remaining 8% resulted from other suicide or self-harm events. Instances of permanent total disability due to intentional injury most often as a result of violence (53%) but also occurred as a result of suicide or self harm (poison 37%, other 10%).
Intentional injuries cost Nova Scotia $105 million in 2010. These total costs were distributed across suicide/self-harm due to poisonings (36%), suicide or self-harm – other (34%) and violence (30%). Direct and indirect costs were split between injuries due to poison-related suicide/self-harm (52% of direct, 25% of indirect), followed by violence (35% of direct, 27% of indirect), and other types of suicide or self-harm (13% of direct and 48% of indirect).
Nova Scotia ! 109
ONTARIO
In Ontario, injury prevention efforts are undertaken in a number of government ministries and organizations, including NGOs, with good collaboration to address cross ministerial/sectoral issues.
The Ministry of Health and Long Term Care (MOHLTC) has a provincial injury prevention strategy and the Chief Medical Officer of Health’s 2011 report Maintaining the Gains, Moving the Yardstick: Ontario Health Status Report, draws attention to the importance and magnitude of the issue of injuries in Ontario. Recently, MOHLTC has identified seniors’ falls as a priority and established an indicator to measure public health performance in this area. Public Health Ontario (PHO) is a government agency dedicated to protecting and promoting the health of all Ontarians and reducing inequities in health. PHO links public health practitioners, front-line health workers and researchers to the best scientific intelligence and knowledge from around the world. PHO provides expert scientific and technical advice in areas of public health including injury prevention.
The Ministry of Health and Long Term Care (MOHLTC) provides funding through Public Health Ontario (PHO) for a Health Promotion Resource Centre on injury prevention, the Ontario Injury Prevention Resource Centre (OIPRC), operated by Parachute. The OIPRC supports those working in public health; the province’s 36 public health units and 11 lead trauma hospitals. Injury prevention practice for public health units is guided by the Prevention of Injury and Substance Misuse Public Health Standard. For the centres comprising Ontario’s trauma system, injury prevention practice is part of maintaining trauma distinction through Accreditation Canada.
The Ministry of Transportation (MTO) is responsible for legislation and provides information as well as conducts and supports activities focused on driving safety, pedestrian, bicycle, snowmobile, school bus and child passenger safety. In the 2014 Speech from the Throne, Ontario’s priorities in strengthening road safety focuses on maintaining safe roads by continuing to address areas of concern (above) and reducing the emerging trend of drug-impaired driving with the goal of preserving Ontario’s ranking as one of the lowest fatality rate jurisdictions in North America. In addition, continuing to implement the province’s first-ever
Ontario ! 110

The Cost of Injury in Canada 2015
cycling strategy, #CycleON, and establishing a regulatory framework for autonomous vehicles and, working with the Minister of Health and Long-Term Care, stretcher transport services.
The overall vision of the Ministry of Labour is to foster safe, fair and healthy workplaces characterized by productive relationships and high performance that drive a vibrant, competitive economy and generate widespread benefits for all. The ministry contributes to achieving this vision and to the prosperity of Ontario by advancing healthy, safe, fair and productive relationships in the workplace and the broader community.
The Ministry’s objective is to create environments that make Ontario workplaces among the safest in the world. The Ministry works towards this by setting, communicating and enforcing Occupational Health Safety (OHS) laws that are designed to reduce or eliminate workplace injury or illness. The Ministry also works to prevent workplace illness and injury by implementing the priorities of its integrated occupational health and safety strategy. As part of the strategy, the ministry collaborates with its partners in Ontario’s OHS system with the twin objectives of improving the effectiveness of the OHS system while, at the same time, making workplaces more self-reliant.
The Prevention Council, with representation from a broad range of organizations and interests, advises the Minister of Labour and the Chief Prevention Officer on a wide range of occupational health and safety issues, including:
❖ prevention of workplace injuries and illnesses
❖ development of the provincial occupational health and safety strategy, and
❖ any significant proposed changes to funding and delivery of services under the Occupational Health and Safety Act.
The Centre for Health & Safety Innovation (CHSI) is a focal point for innovation and applied learning in the prevention and elimination of workplace injuries and illnesses, along with four sector-based health and safety associations. It is a key resource for employers, employees, and others seeking expertise and direction on how to make workplaces injury and illness-free.
The Ministry of Education released the Concussions Policy/Program Memorandum (PPM) in March 2014. This PPM outlines the expectations for Ontario school boards to develop and maintain a policy on concussion. The
Ontario ! 111

The Cost of Injury in Canada 2015
strategy includes components for awareness, prevention, identification, and management of concussions. To support the PPM, the Ministry developed a web portal that provides the most up-to-date information about preventing, identifying, and managing concussions. This work was done through a collaboration between the Ministry of Education, Ministry of Tourism, Culture and Sport and the Ministry of Health and Long-Term Care.
Total cost of injury
In 2010 injuries cost Ontario $8.8 billion and 5,785 lives.
In addition, injuries resulted in 72,289 hospitalizations, approximately 1.35 million visits to the emergency room, 18,660 cases of permanent partial disability, and 1,456 instances of permanent total disability.
Based on the provincial population of 13,135,063, in 2010 there were 44 injury-related deaths for every 100,000 Ontarians. Injuries also cost Ontario approximately 1,128 potential years of lost life years per 100,000 people and the per capita cost of injury was $693.
Table 62
Summary of findings, all injury, Ontario, 2010
Direct and indirect costs The total 2010 costs associated with injuries were $8.8 billion of which $5.1 billion (58% or $390 per capita) were direct health care costs, and $3.6 billion (42% or $277 per capita) were indirect.
Injury Deaths Hospitalizations
Emergency Room Visits
Permanent Partial
Disability
Permanent Total
Disability Total Economic Cost of Injury
5,785 72,289 1,350,611 18,660 1,456 $8.8 billion
Ontario ! 112

The Cost of Injury in Canada 2015
Intentional and unintentional injuries
Table 63
Injury by intent, Ontario, 2010
The vast majority of injuries in Ontario in 2010 were unintentional in nature. Unintentional injuries resulted in 73% of injury related deaths, 89% of injury hospitalizations, 96% of emergency room visits, 90% of permanent partial disability caused by injury, and 92% of injury-related permanent total disability. Conversely, intentional injuries resulted in 24% of related deaths, 9% of hospitalizations, 4% of emergency room visits, and — respectively — 9% and 7% of cases of partial and total disability. The remaining incidents were of an undetermined intent.
Table 64
Total, direct, and indirect costs by intent of injury, Ontario, 2010
Perhaps not surprising then is the fact that in 2010 injury spending focused on unintentional injuries. Of the total $8.8 billion spent on injuries in Ontario in
Description Deaths HospitalizationsEmergency Room Visits
Permanent Partial
Disability
Permanent Total
Disability
Unintentional 4,235 64,500 1,291,725 16,810 1,333
Intentional 1,360 6,702 51,124 1,594 107
Undetermined Intent/Other
190 1,087 7,888 256 16
TOTAL 5,785 72,289 1,350,611 18,660 1,456
DescriptionTotal costs
($ millions)Direct costs ($ millions)
Indirect costs ($ millions)
Unintentional $7,346 $4,668 $2,678
Intentional $1,239 $388 $851
Undetermined Intent/Other $174 $60 $114
TOTAL $8,759 $5,117 $3,642
Ontario ! 113
The Cost of Injury in Canada 2015
2010, $7.3 billion (84%) was invested to address unintentional injuries while $1.2 billion (14%) addressed intentional injuries and $174 million (2%) was spent on injuries with undetermined causes. Unintentional injuries accounted for 91% of direct spending and 74% of indirect spending while 8% of direct costs and 23% of indirect costs went to address intentional injuries. The remaining 2% of costs were related to injuries of undetermined intent.
Injury by cause In 2010 the leading causes of injury-related death in Ontario were falls (38%) and suicide or self-harm (20%). Injury deaths also occurred due to transport incidents (13%), unintentional poisoning (11%), other unintentional injuries (8%), violence (3%), injuries of undetermined causes (3%), drowning (2%) and fire/burns (1%).
In Ontario during 2010 more than half (57%) of hospitalizations for injuries occurred due to falls. An additional 17% of hospitalizations occurred due to other non-specific unintentional injuries, 11% resulted from transport incidents and suicide or self-harm events made up 7%. The remaining hospitalizations resulted from unintentional poisonings (4%), violence (3%), events of undetermined intent (2%), and fire or burns (1%).
The most frequent defined cause of emergency room for injuries visits in 2010 was falls, which accounted for 30% of visits. Other unintentional injuries were the reason for 53% of visits, while transport incidents made up 8% and violence 3%. Unintentional poisoning and being struck by or against sporting equipment each resulted in 2% of emergency room visits while suicide or self-harm, and events of undetermined intent contributed 1% each.
The leading cause of both permanent partial and permanent total disability due to injury were falls, making up 42% and 45% of these events, respectively. Among the other causes of permanent partial and total disability were other non-specific unintentional injuries (31% and 28% respectively), transportation incidents (11% and 14% respectively), suicide or self-harm (6% and 4% respectively), violence (3% and 4%, respectively) and unintentional poisoning (3% each). Less common causes of partial or total permanent disability were fire (2% or 1%, respectively), being struck by or against sports equipment (1% each), or injuries of indeterminate intent (1% each).
Ontario ! 114
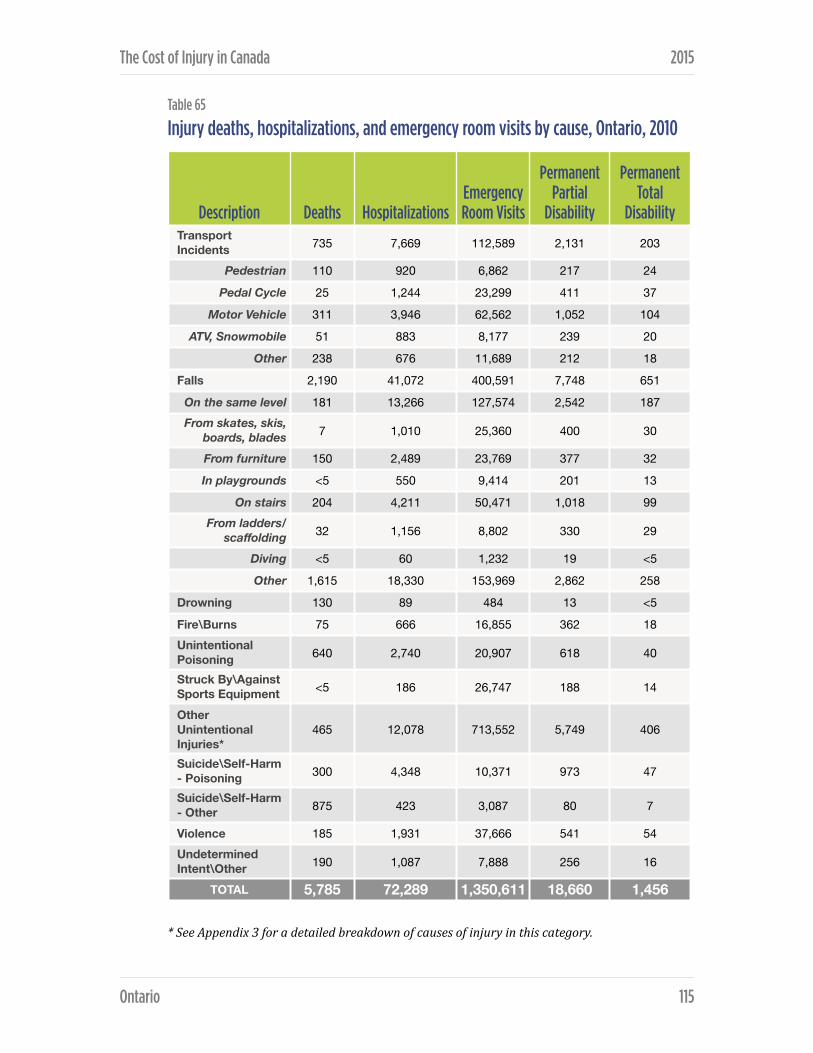
The Cost of Injury in Canada 2015
Table 65
Injury deaths, hospitalizations, and emergency room visits by cause, Ontario, 2010
* See Appendix 3 for a detailed breakdown of causes of injury in this category.
Description Deaths HospitalizationsEmergency Room Visits
Permanent Partial
Disability
Permanent Total
Disability Transport Incidents 735 7,669 112,589 2,131 203
Pedestrian 110 920 6,862 217 24
Pedal Cycle 25 1,244 23,299 411 37
Motor Vehicle 311 3,946 62,562 1,052 104
ATV, Snowmobile 51 883 8,177 239 20
Other 238 676 11,689 212 18
Falls 2,190 41,072 400,591 7,748 651
On the same level 181 13,266 127,574 2,542 187 From skates, skis,
boards, blades 7 1,010 25,360 400 30
From furniture 150 2,489 23,769 377 32
In playgrounds <5 550 9,414 201 13
On stairs 204 4,211 50,471 1,018 99 From ladders/
scaffolding 32 1,156 8,802 330 29
Diving <5 60 1,232 19 <5
Other 1,615 18,330 153,969 2,862 258
Drowning 130 89 484 13 <5
Fire\Burns 75 666 16,855 362 18 Unintentional Poisoning 640 2,740 20,907 618 40
Struck By\Against Sports Equipment <5 186 26,747 188 14
Other Unintentional Injuries*
465 12,078 713,552 5,749 406
Suicide\Self-Harm - Poisoning 300 4,348 10,371 973 47
Suicide\Self-Harm - Other 875 423 3,087 80 7
Violence 185 1,931 37,666 541 54 Undetermined Intent\Other 190 1,087 7,888 256 16
TOTAL 5,785 72,289 1,350,611 18,660 1,456
Ontario ! 115

The Cost of Injury in Canada 2015
Table 66
Mortality, crude death rates (per 100,000 pop.) and total cost per capita by cause, Ontario, 2010
Falls were responsible for the most injury deaths per capita (16.7 per 100,000 population), and generated the greatest per capita cost to residents of Ontario — $213.
Costs of injury by cause About one-third (32%) of the total $8.8 billion cost associated with injuries in Ontario in 2010 was due to falls while other unintentional injuries accounted for an additional 29% of this spending. Fourteen percent of total costs occurred due to transport incidents, 10% addressed suicide or self-harm injuries, 6% was spent on unintentional poisonings, and 4% on violence-related injuries. The remaining costs were related to drowning (1%), fire/burns (1%), sports equipment injuries (1%), and other injuries of undetermined intent (2%).
Direct costs amounted to $5.1 billion in 2010. Forty-one percent of these expenses addressed injury due to falls and 34% was spent responding to other unintentional injuries. Direct costs also arose from transport incidents (12%), suicide or self-harm (5%), unintentional poisoning (3%), violence (3%), fire or burns (1%), being stuck by or against sport equipment (1%), and other injuries of undetermined intent (1%).
Cause DeathsDeath rate
(per 100,000) Total CostsCosts per
capita
Transport Incidents 735 5.6 $1,233 million $94
Falls 2,190 16.7 $2,803 million $213
Suicide/Self-Harm 1,175 8.9 $895 million $68
Violence 185 1.4 $344 million $26
Ontario ! 116

The Cost of Injury in Canada 2015
Table 67
Total, direct, and indirect costs of injury by cause, Ontario, 2010
* See Appendix 3 for a detailed breakdown of causes of injury in this category.
DescriptionTotal costs
($ millions)Direct costs ($ millions)
Indirect costs ($ millions)
Transport Incidents $1,233 $625 $607
Pedestrian $141 $75 $66
Pedal Cycle $161 $91 $70
Motor Vehicle $630 $351 $279
ATV, Snowmobile $122 $60 $62
Other $178 $47 $131
Falls $2,803 $2,090 $713
On the same level $792 $624 $168
From skates, skis, boards, blades $148 $81 $68
From furniture $172 $135 $38
In playgrounds $82 $47 $36
On stairs $327 $234 $93
From ladders/scaffolding $99 $70 $29
Diving $11 $6 $5
Other $1,172 $894 $278
Drowning $70 $4 $66
Fire\Burns $124 $60 $64
Unintentional Poisoning $494 $134 $359
Struck By\Against Sports Equipment $68 $34 $34
Other Unintentional Injuries* $2,554 $1,719 $835
Suicide\Self-Harm - Poisoning $452 $209 $244
Suicide\Self-Harm - Other $443 $36 $408
Violence $344 $144 $200
Undetermined Intent\Other $174 $60 $114
TOTAL $8,739 $5,117 $3,642
Ontario ! 117

The Cost of Injury in Canada 2015
Most indirect costs were divided between falls (20%), suicide or self-harm (18%), other unintentional injuries (23%), and transportation incidents (17%). Additional reasons for indirect costs included unintentional poisoning (10%), violence (5%), injuries of undetermined intent (3%), drowning (2%), fire or burns (2%) and injuries associated with sport equipment (1%).
Transport-related injuries by cause and associated costs Motor vehicle incidents were responsible for 42% of transport-related injury deaths, as well as 51% of the hospitalizations, 56% of emergency room visits, 49% of permanent partial disability, and 51% of permanent total disability due to transport-related injuries.
Transport-related injury deaths were also attributable to other non-specific incidents (32%), pedestrian events (15%), ATV and snowmobile events (7%) and cycling incidents (3%). Other transportation-related reasons for hospitalization and emergency room visits were cycling incidents (16% and 21%, respectively), pedestrian-related events (12% and 6%, respectively), ATV and snowmobile events (12% and 7%, respectively), and non-specific transport incidents (9% and 10%, respectively).
In 2010 the total cost of injury due to transportation incidents was $1.2 billion. More than half (51%) of the total costs as well as 56% of direct health care spending and 46% of indirect spending were due to motor vehicle related incidents. Remaining direct costs arose from cycling (15%), pedestrian incidents (12%), ATV or snowmobile incidents (10%) or other non-specific transport incidents (8%). Indirect costs resulted from non-specific transport incidents (22%), cycling (11%), pedestrian incidents (11%) and ATV or snowmobile incidents (10%).
Fall-related injuries by cause and associated costs Aside from falls due to non-specific causes, falling on the same level was the leading cause of fall-related deaths (8%), hospitalization (32%), emergency room visits (32%) and permanent partial (33%) and total (29%) disability. Other (non-specific) falls accounted for 74% of fall deaths, 45% of related hospitalizations, 38% of emergency room visits and 37% of partial and 40% of total disability.
Ontario ! 118

The Cost of Injury in Canada 2015
Other causes of fall-related injury deaths were falls on stairs (9%), from furniture (7%), and from ladders of scaffolding (1%). Individuals were also hospitalized with fall-related injuries after falling on stairs (10%), falling from furniture (6%), falling from ladders of scaffolding (3%), falling from skates/skis/boards/blades (2%) and falling in playgrounds (1%). Thirteen percent of emergency room visits due to fall-related injuries were due to falls on stairs, while 6% were due to falls from skates/skis/boards/blades and additional 6% resulted from falls from furniture. Falls from ladders or scaffolding and falls in playground each resulted in 2% of the fall-related emergency room visits.
In 2010, Ontario spent a total of $2.8 billion addressing fall-related injuries. The two main drivers of these total costs were falls on the same level (28%) and other non-specific falls (42%). Forty-three percent of direct costs and 39% of indirect costs were spent on falls of non-specific nature while 30% of direct costs and 24% of indirect costs were invested to address injuries due to falls on the same level. Costs also arose from falls on stairs (12% of total costs, 11% of direct costs, 13% of indirect costs), falls from furniture (6% of total costs, 6% direct costs, 5% indirect costs), falls from sporting equipment (5% of total costs, 4% of direct costs, 9% of indirect costs), falls from ladders or scaffolding (4% of total costs, 3% of direct costs, and 4% of indirect costs) and falls in playgrounds (3% of total costs, 2% of direct costs, 5% of indirect costs).
Intentional injuries by cause and associated costs Suicide and self-harm accounted for 86% of intentional injury deaths in 2010, and made up 71% of hospitalizations, 26% of emergency room visits, 66% of permanent partial disability, and 50% of permanent total disability related to intentional injuries.
The leading cause of intentional injury death was suicide/self-harm by other means other than poison (64%) while suicide and self-harm by poisoning accounted for 22% of deaths and violence-related injuries for 14%. Intentional injury hospitalizations were dominated by suicide and self-harm by poisoning (65%), followed by injuries due to violence (29%) and suicide and self-harm by other means (6%). The main cause of emergency room visits for intentional injuries was violence (74%), while suicide and self-harm accounted for the remainder (20% due to poison, 6% other). Suicide and self-harm by poisoning resulted in 61% of the cases of permanent partial disability and 44% of the
Ontario ! 119

The Cost of Injury in Canada 2015
instances of permanent total disability. Permanent partial and total disability also resulted from violence (34% and 50%, respectively) and suicide and self-harm by other means (5% and 6%, respectively).
Of the $1.2 billion spent on intentional injuries in 2010, $452 million (36%) was spent on events of suicide or self-harm by poisoning, $443 million (36%) was invested in suicide and self-harm by other means and 28% or $344 million went to address violence-related injuries.
More than half (54%) of direct health care costs focused on suicide or self-harm by poisoning, 37% was spent on the costs of violence, and 9% addressed suicide and self-harm by other means. Indirect expenditures were dominated by costs associated with suicide and self-harm - other (48%), suicide and self-harm - poison (29%) and violence (23%).
Ontario ! 120

PRINCE EDWARD ISLAND
Injury prevention is a shared responsibility among various provincial government departments such as the Departments of Health and Wellness, Transportation and Infrastructure Renewal, Environment, Labour and Justice as well as Sport and Recreation with support from organizations and community partners.
The mandate of the Prince Edward Island Department of Transportation and Infrastructure Renewal is to contribute to economic development and the quality of life in this province by maintaining and enhancing, in an affordable way, the essential transportation systems and the services for the efficient and safe movement of people, goods, and services. Driving is a privilege and as drivers, everyone has a responsibility to make Island roads safe. The Ministry provides services, enforcement and information on issue such as seat belts, distracted driving, child safety seats, bicycle safety and ATVs, snowmobiles and off-highway vehicles to reduce the risk of serious injury or death on the road.
PEI’s Department of Health and Wellness’ Sport and Recreation division provides expertise, funding programs and support to a number of provincial, regional and local partners to lay the foundation for Islanders to enjoy the many benefits of participating in sport, being involved in recreational activities and living a healthy physically active life.
Department of Environment, Labour and Justice oversee a wide range of programs and activities in the areas of justice, public safety, environmental protection, enforcement and consumer and corporate services. Each division of the department works toward the protection of Islanders and the Island's environment by fostering safe communities, access to justice, sustainable environmental practices, and respect for the law.
In the Department of Education and Early Child Development, the theme of safety underpins the outcomes in Grades K-10 Physical Education (PE) and Grades 1-9 Health. The Grades K-9 goals in PE are interdependent and are of equal importance. Both the Prince Edward Island School Athletic Association (PEISAA) and PE and Health curriculum specialist refer to the Physical Education Safety Guidelines document for safety concerns. This is a joint
Prince Edward Island ! 121

The Cost of Injury in Canada 2015
venture between the Department of Education and Early Childhood Development, English Language School Board, and the PEISAA.
In addition, the Government of Prince Edward Island has been a supporter of the Atlantic Collaborative on Injury Prevention (ACIP) with annual contributions. ACIP is a partnership of injury prevention practitioners from both government and non-government organizations. The goal of ACIP is to reduce the burden of injury in Atlantic Canada.
The Island Network for Injury Prevention (INIP), a member of ACIP, has brought together different sectors – government and non-government – with particular focus on children’s and seniors’ falls and motor vehicle-related injuries and deaths involving children, youth, and seniors. A number of their funded projects have contributed to the enhanced awareness of injury and its prevention in PEI. Key PEI injury prevention leaders and senior’s falls experts were also instrumental in the development and pilot testing of the Canadian Falls Prevention Curriculum.
In 2012, a partnership of Recreation PEI and INIP, along with a number of provincial and community organizations worked together on the Public Health Agency of Canada’s Active and Safe Initiative (Tier 3). Activities within the Active and Safe Initiative focused on injury prevention in early child care centres, safer playgrounds, cycling, and helmet and concussion education. Family Resource Centres on PEI and the Brain Injury Association of PEI have continued to be active in the prevention of injury.
Total cost of injury
Injuries cost Prince Edward Island $105 million and 65 lives in 2010.
In the same year, 1,076 hospitalizations occurred due to injuries, and injuries led to 14,557 emergency room visits, 244 instances of permanent partial disability and 20 cases of permanent total disability.
In 2010, the population of Prince Edward Island (PEI) was 141,678, the rate due to injury was 46 per 100,000 residents and injuries resulted in an estimated 1,145
Prince Edward Island ! 122
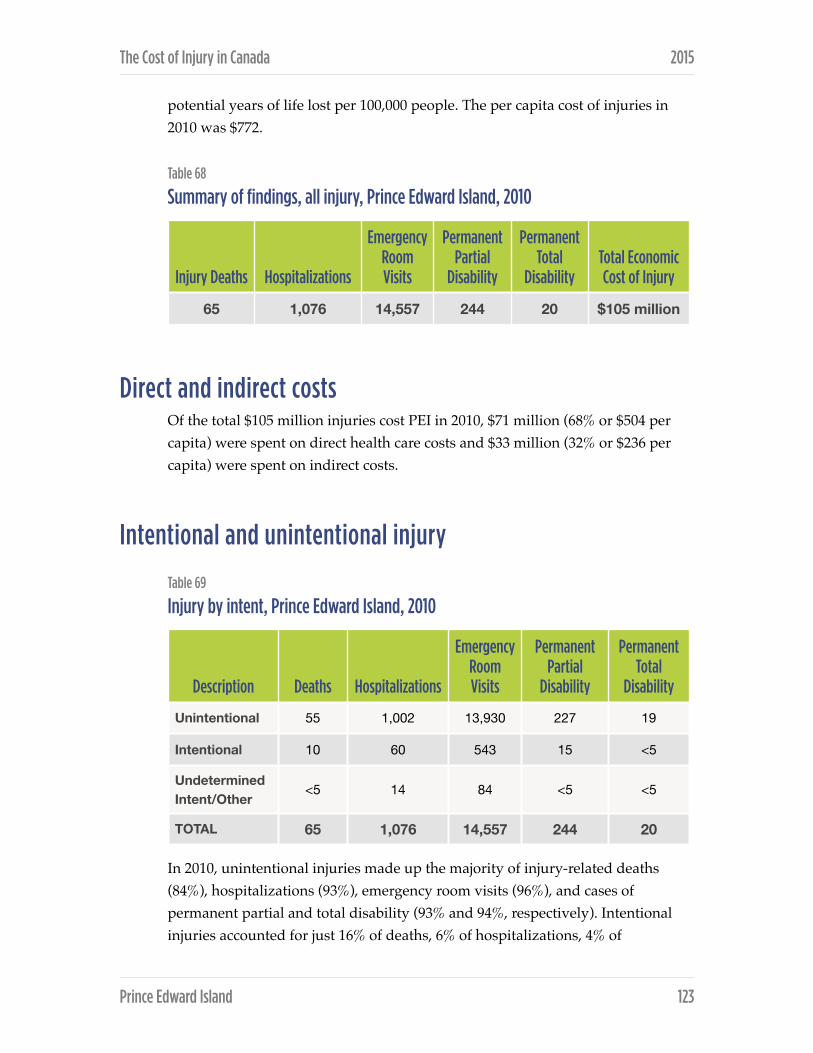
The Cost of Injury in Canada 2015
potential years of life lost per 100,000 people. The per capita cost of injuries in 2010 was $772.
Table 68
Summary of findings, all injury, Prince Edward Island, 2010
Direct and indirect costs Of the total $105 million injuries cost PEI in 2010, $71 million (68% or $504 per capita) were spent on direct health care costs and $33 million (32% or $236 per capita) were spent on indirect costs.
Intentional and unintentional injury
Table 69
Injury by intent, Prince Edward Island, 2010
In 2010, unintentional injuries made up the majority of injury-related deaths (84%), hospitalizations (93%), emergency room visits (96%), and cases of permanent partial and total disability (93% and 94%, respectively). Intentional injuries accounted for just 16% of deaths, 6% of hospitalizations, 4% of
Injury Deaths Hospitalizations
Emergency Room Visits
Permanent Partial
Disability
Permanent Total
Disability Total Economic Cost of Injury
65 1,076 14,557 244 20 $105 million
Description Deaths Hospitalizations
Emergency Room Visits
Permanent Partial
Disability
Permanent Total
Disability
Unintentional 55 1,002 13,930 227 19
Intentional 10 60 543 15 <5
Undetermined Intent/Other
<5 14 84 <5 <5
TOTAL 65 1,076 14,557 244 20
Prince Edward Island ! 123

The Cost of Injury in Canada 2015
emergency room visits, 6% of cases of permanent partial disability and 5% of cases of permanent total disability. The remaining events occurred due to injuries of undetermined intent.
Table 70
Total, direct, and indirect costs by intent of injury, Prince Edward Island, 2010
In 2010 the total cost of injuries in PEI was $105 million of which $94 million or 89% was spent on unintentional injuries. Unintentional injuries were responsible for 94% of direct health care costs and 79% of indirect costs. Intentional injuries accounted for just 10% of the overall cost of injuries including 5% of direct costs and 20% of indirect costs. Events of undetermined intent resulted in 1% of total costs.
Injury by cause In 2010 the leading causes of injury-related death in PEI were falls that accounted for 23% of deaths and other (unspecified) intentional injuries which made up an additional 23%. Transportation incidents were responsible for 15% of injury deaths, suicide and self-harm for 16%, and drowning, fire/burns and unintentional poisoning for 8% each.
Hospitalizations for injuries occurred most often due to falls (62%), followed by other unintentional injuries (17%) and transportation incidents (11%). Among the other reasons for hospitalization were suicide and self-harm (5%), unintentional poisoning (3%), and fire or burns, violence and injuries of undetermined intent which each contributed 1% of hospitalization cases.
DescriptionTotal costs
($ millions)Direct costs ($ millions)
Indirect costs ($ millions)
Unintentional $94 $66 $26
Intentional $10 $4 $7
Undetermined Intent/Other
$1 $1 $0
TOTAL $105 $71 $33
Prince Edward Island ! 124
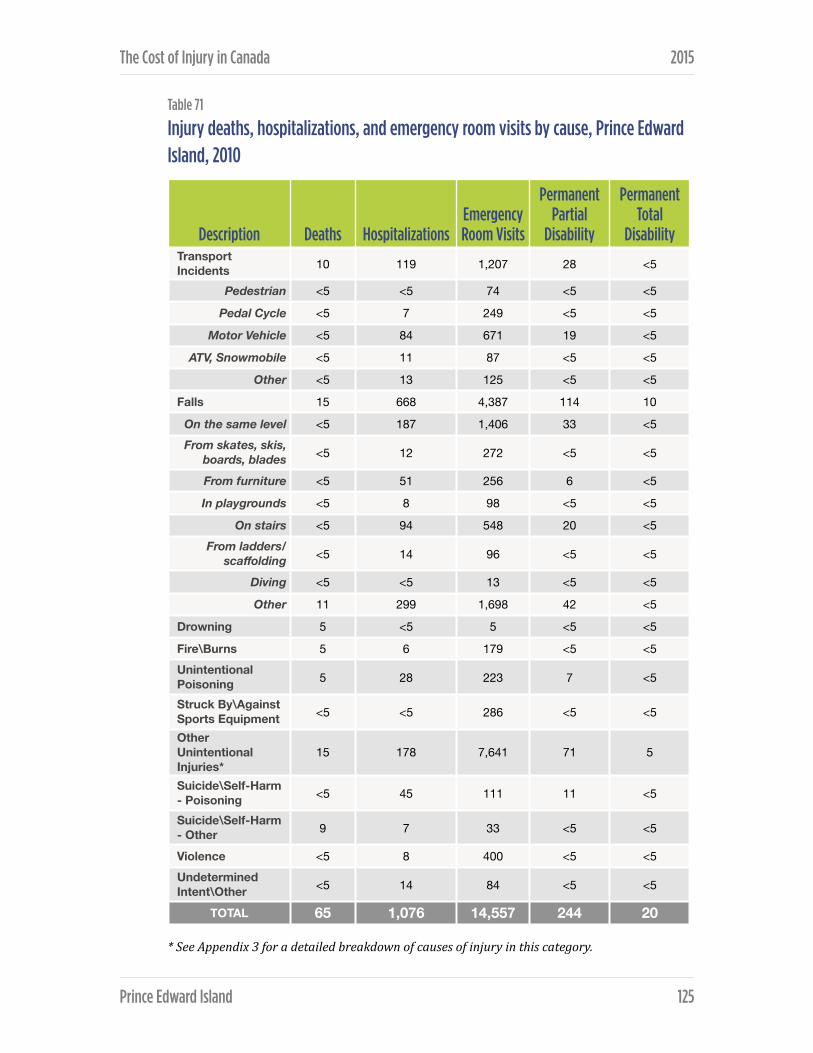
The Cost of Injury in Canada 2015
Table 71
Injury deaths, hospitalizations, and emergency room visits by cause, Prince Edward Island, 2010
* See Appendix 3 for a detailed breakdown of causes of injury in this category.
Description Deaths HospitalizationsEmergency Room Visits
Permanent Partial
Disability
Permanent Total
Disability Transport Incidents 10 119 1,207 28 <5
Pedestrian <5 <5 74 <5 <5
Pedal Cycle <5 7 249 <5 <5
Motor Vehicle <5 84 671 19 <5
ATV, Snowmobile <5 11 87 <5 <5
Other <5 13 125 <5 <5
Falls 15 668 4,387 114 10
On the same level <5 187 1,406 33 <5From skates, skis,
boards, blades <5 12 272 <5 <5
From furniture <5 51 256 6 <5
In playgrounds <5 8 98 <5 <5
On stairs <5 94 548 20 <5From ladders/
scaffolding <5 14 96 <5 <5
Diving <5 <5 13 <5 <5
Other 11 299 1,698 42 <5
Drowning 5 <5 5 <5 <5
Fire\Burns 5 6 179 <5 <5Unintentional Poisoning 5 28 223 7 <5
Struck By\Against Sports Equipment <5 <5 286 <5 <5
Other Unintentional Injuries*
15 178 7,641 71 5
Suicide\Self-Harm - Poisoning <5 45 111 11 <5
Suicide\Self-Harm - Other 9 7 33 <5 <5
Violence <5 8 400 <5 <5Undetermined Intent\Other <5 14 84 <5 <5
TOTAL 65 1,076 14,557 244 20
Prince Edward Island ! 125

The Cost of Injury in Canada 2015
The main injury types that lead to emergency room visits were other (non-specific) unintentional injuries (52%) and falls (30%). Transportation incidents resulted in 8% of emergency room visits while violence was the reason for 3% of visits, unintentional poisoning for 2%, being struck by or against sports equipment for 2%, suicide and self-harm for 1%, fires or burns for 1% and injuries of undetermined intent for a final 1%.
Falls accounted for 47% of partial disability cases due to injury and 50% of cases of total disability due to injury. Other events that caused partial disability were un-specific unintentional injuries (29%), transport incidents (12%), suicide and self-harm (5%), unintentional poisoning (3%), violence (1%), fire or burns (2%), and injuries of undetermined intent (1%). Permanent total disability also resulted from other unintentional injuries (26%) and transport incidents (14%), and suicide or self-harm (3%).
Table 72
Mortality, crude death rates (per 100,000 pop.) and total cost per capita by cause, Prince Edward Island, 2010
In PEI, falls resulted in the highest injury-related mortality rate (10.6 deaths per 100,000 population) and also generated the highest injury-related costs per capita ($340 per person).
Cost of injury by cause In 2010 almost half of injury-related spending resulted from falls. Forty-six percent of total injury spending including 57% of direct costs and 22% of all indirect costs were resulted from fall injuries.
Cause DeathsDeath rate
(per 100,000) Total CostsCosts per
capita
Transport Incidents 10 7.1 $14 million $95
Falls 15 10.6 $48 million $340
Suicide/Self-Harm 10 7.2 $9 million $63
Violence <5 <0.1 $1 million $10
Prince Edward Island ! 126

The Cost of Injury in Canada 2015
Table 73
Total, direct, and indirect costs of injury by cause, Prince Edward Island, 2010
* See Appendix 3 for a detailed breakdown of causes of injury in this category.
DescriptionTotal costs
($ thousands)Direct costs
($ thousands)Indirect costs ($ thousands)
Transport Incidents $13,504 $8,360 $5,144
Pedestrian $729 $407 $322
Pedal Cycle $1,049 $592 $457
Motor Vehicle $8,869 $5,985 $2,885
ATV, Snowmobile $1,348 $783 $564
Other $1,508 $592 $916
Falls $48,175 $40,898 $7,278
On the same level $9,585 $7,867 $1,718
From skates, skis, boards, blades $1,635 $967 $667
From furniture $2,666 $2,274 $392
In playgrounds $979 $612 $368
On stairs $13,809 $12,454 $1,355
From ladders/scaffolding $1,821 $1,636 $185
Diving $376 $212 $164
Other $17,304 $14,875 $2,429
Drowning $1,876 $35 $1,841
Fire\Burns $824 $482 $342
Unintentional Poisoning $3,604 $1,251 $2,353
Struck By\Against Sports Equipment $667 $379 $288
Other Unintentional Injuries* $24,904 $13,913 $7,938
Suicide\Self-Harm - Poisoning $3,851 $2,462 $1,389
Suicide\Self-Harm - Other $5,142 $317 $4,824
Violence $1,447 $904 $542
Undetermined Intent\Other $752 $529 $223
TOTAL $104,746 $71,348 $33,398
Prince Edward Island ! 127

The Cost of Injury in Canada 2015
Overall costs also accrued due to other un-specific unintentional injuries (24%), transportation incidents (13%), suicide or self-harm (9%), unintentional poisoning (3%), drowning (2%), violence (1%), being struck by or against sports equipment (1%), fire or burns (1%) and due to other injuries of undetermined intent (1%). Beyond falls, other unintentional injuries led to 22% of direct health care spending, 12% resulted from transport incidents, 4% was due to suicide or self-harm and 2% from unintentional poisoning. Violence, injuries of undetermined causes, being struck by or against sports equipment and, fire/ burns were each responsible for 1% of direct spending. Other injury types contributing to indirect costs were other (non-specific) unintentional injuries (27%), suicide or self-harm (19%), transport incidents (15%), unintentional poisoning (7%) and drowning (6%). The remaining four percent of indirect costs were associated with fire/burns (1%), violence (2%), being struck by or against sport equipment (1%) and injuries of indeterminate intent (1%).
Transport-related injuries by cause and associated costs Motor vehicle incidents were the main reason for transportation-related injury in 2010. They were associated with 40% of deaths, 71% hospitalizations, 56% of emergency room visits due to transportation incidents, 66% of cases of permanent partial disability, and 70% of cases of permanent total disability due to transportation injury. Deaths related to transport injury also occurred due to other (non-specific) incidents (33%), pedestrian incidents (20%), and ATV or snowmobile events (5%).
Hospitalization for injury due to transportation incidents also occurred due to other non-specified incidents (11%), ATV or snowmobile event (9%), cycling (6%) and pedestrian incident (3%). After motor vehicle reasons transport-related emergency room visits due to the following: cycling incidents (21%), other non-specific transport incidents (10%), ATV or snowmobile (7%) or pedestrian incidents (6%).
The cost of injuries resulting from transport incidents were mostly due to motor vehicle events (66% of total costs, 72% direct costs, 56% indirect costs). Direct health care costs also arose from ATV or snowmobile injuries (9%), other non-specific transport incidents (7%), cycling (7%) and pedestrian injury (5%). Indirect costs accumulated due to other non-specific transport incidents (18%), ATV or snowmobile injuries (11%), cycling (9%) and pedestrian injury (6%).
Prince Edward Island ! 128

The Cost of Injury in Canada 2015
Fall-related injuries by cause and associated costs After falls of un-specified nature, falling on the same level was the leading cause of fall-related hospitalization (28%), emergency room visits (32%), and permanent partial disability (28%). Fall-related deaths also occurred due to falls on stairs (9%), on the same level (8%), from furniture (7%), and falls from ladders/scaffolding (1%).
Other non-specific types of falls accounted for 45% of hospitalizations for fall injuries, for 39% of related emergency room visits and for 37% of fall-related permanent partial disability. Hospitalization due to fall injuries also occurred due to falling on stairs (14%), from furniture (8%), from ladders or scaffolding (2%), from skates/skis/boards or blades (2%), and falling in playgrounds (1%). Additional reasons for fall-related emergency room visits were falls on stairs (12%), from skates/skis/boards or blades (6%), from furniture (6%), in playgrounds (2%) and from ladders or scaffolding (2%).
In 2010 the costs of injury due to falls totaled $48.2 million of which more than a quarter was spent addressing injuries from falling on stairs (29%), or from other non-specified types of falls (36%). The leading causes of the $40.9 million in direct health care costs were falls on stairs (30%) and other non-specified types of falls (36%) followed by falls on the same level (19%), falls from furniture (6%), falls from ladders or scaffolding (4%), falls from skates/skis/boards or blades (2%), diving (1%) and falls in playgrounds (1%). Most indirect costs were due to falls on the same level (24%) and other non-specified types of falls (33%). Nineteen percent of indirect costs arose from falls on stairs, 9% from falls from skates/skis/boards or blades, 5% from falls from furniture, 5% from falls in playgrounds, 3% from falls from ladders or scaffolding, and 2% from diving.
Intentional injuries by cause and associated costs In PEI in 2010 all deaths due to intentional injury were due to suicide or self-harm; sixteen percent resulted from suicide or self-harm using poison, and 84% from suicide or self-harm by other means.
The leading cause of hospitalization due to intentional injury was suicide or self-harm using poison (75%), followed by injuries due to violence (13%) and finally injury resulting from suicide or self-harm by other methods (12%). Emergency room visits for intentional injuries were dominated by violence-related injuries
Prince Edward Island ! 129

The Cost of Injury in Canada 2015
(74%) and then suicide or self-harm by poison (20%) or other means (6%). Two thirds of instances of permanent partial disability resulting from intentional injury were due to suicide or self-harm by poison, 24% were due to violence, and 9% resulted from suicide or self-harm by other means.
The majority (86%) of total spending on intentional injuries was in response to injuries due to suicide or self-harm. Costs associated with intentional injuries were divided between suicide or self-harm – other (49% of total costs, 9% of direct costs and 71% of indirect costs), suicide or self-harm due to poison (37% of total costs, 67% of direct costs and 21% of indirect costs), and violence (14% of total costs, 25% of direct costs and 8% of indirect costs).
Prince Edward Island ! 130
QUEBEC
In Quebec, the network of public health organizations has been consistently active within the area of injury prevention for the last 20 years. The injury prevention initiatives in the province are an expression of the Loi sur la santé publique (The Public Health Act) and the Programme national de santé publique (The Provincial Public Health Program). The goal is to reduce the morbidity and mortality derived from non-intentional injuries as well as from violence and suicide. The principal axes of intervention are the reduction of mortality rates in road and offroad users, the decrease in falls and injuries at home, the decrease of mortality rates in sports and recreation, the reduction of abuse, negligence, and violence towards youth, domestic and sexual violence, and the decrease of the rates of suicide and attempted suicide. There is also a strong emphasis on collaboration with sectors other than public health, as many of the solutions to the questions of injury prevention flow from ministries other than the Ministry of Health.
The initiatives that have been implemented so far have yielded successful results in decreasing the number of injuries and deaths on the road, at home, and in sports and recreation. Successful initiatives have been those that have targeted individual behaviour, produced safer environments, or enforced safety regulations. As it was mentioned above, success has been dependent on collaborative efforts among a wide range of related stakeholders.
To a group of leading organizations in the field of injury prevention in the province, the WHO has offered the designation of Centre collaborateur OMS du Québec pour la promotion de la sécurité et la prévention des traumatismes (Quebec WHO Collaborating Centre for Safety Promotion and Injury Prevention). The Centre operates under the supervision of l’Institut national de santé publique du Québec and works closely with the World Health Organization and the Pan American Health Organization. The Centre addresses the safety and injury prevention needs of the international community as well as those of the international network of French-speaking safety and injury prevention organizations.
Quebec ! 131

The Cost of Injury in Canada 2015
Total cost of injury
In 2010 injuries cost the province of Quebec $5.7 billion and 3,440 lives.
During 2010, over 53,000 individuals were hospitalized due to injury and approximately 800,000 emergency visits were injury-related. Injury also led to 12,600 cases of permanent partial disability, and 1,012 instances of permanent total disability.
Given the provincial population of 7,929,365, in 2010 43 deaths due to injury occurred for every 100,000 Quebecers. Injury also cost the province an estimated 1,212 years of potential life per 100,000 residents and came with a per capita price tag of $746.
Table 74
Summary of findings, all injury, Quebec, 2010
Direct and indirect costs The direct health care costs of injury in Quebec in 2010 were $3.6 billion ($450 per capita) and made up 61% of the total spending ($5.7 billion). Indirect costs were $2.1 billion ($265 per capita), or 39% of total costs.
Intentional and unintentional injury The majority of injuries in Quebec in 2010 were unintentional. Sixty-three percent of injury deaths were unintentional and unintentional injuries were the reason for 90% of injury hospitalizations, 96% of emergency room visits, and 90% of injuries causing permanent partial or total disability. Intentional injuries led to 35% of
Injury Deaths Hospitalizations
Emergency Room Visits
Permanent Partial
Disability
Permanent Total
Disability
Total Economic Cost
of Injury
3,440 53,432 809,190 12,600 1,012 $5.7 billion
Quebec ! 132
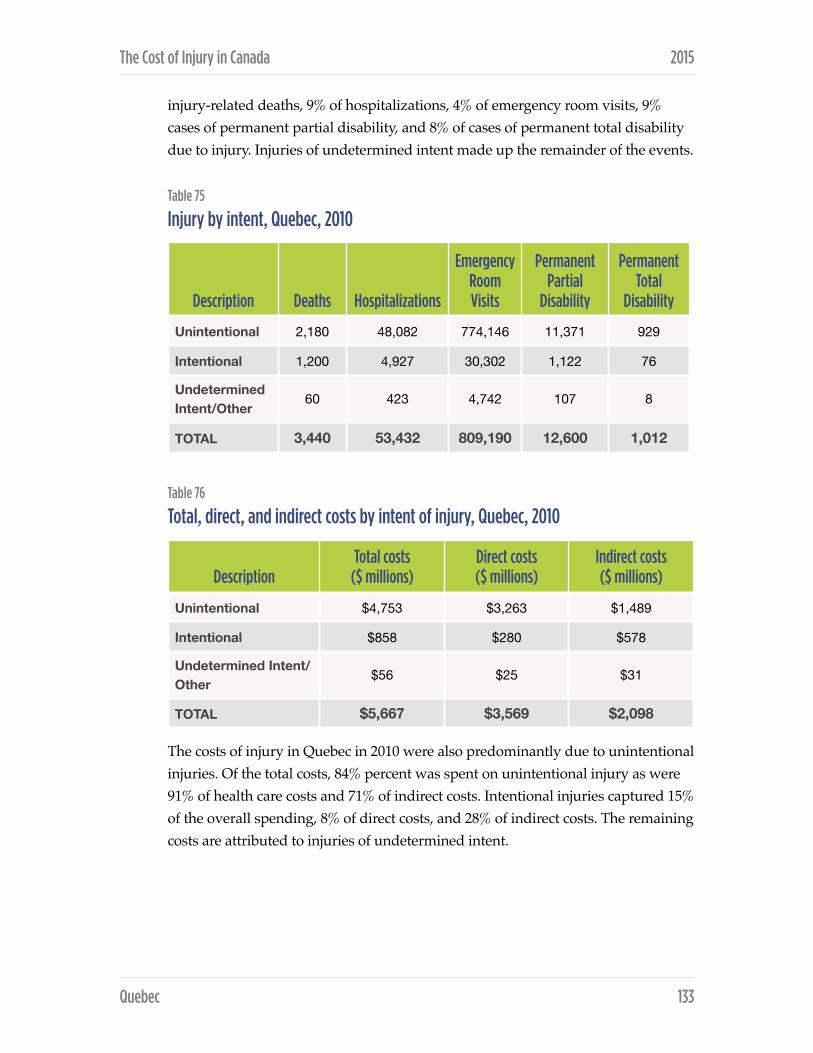
The Cost of Injury in Canada 2015
injury-related deaths, 9% of hospitalizations, 4% of emergency room visits, 9% cases of permanent partial disability, and 8% of cases of permanent total disability due to injury. Injuries of undetermined intent made up the remainder of the events.
Table 75
Injury by intent, Quebec, 2010
Table 76
Total, direct, and indirect costs by intent of injury, Quebec, 2010
The costs of injury in Quebec in 2010 were also predominantly due to unintentional injuries. Of the total costs, 84% percent was spent on unintentional injury as were 91% of health care costs and 71% of indirect costs. Intentional injuries captured 15% of the overall spending, 8% of direct costs, and 28% of indirect costs. The remaining costs are attributed to injuries of undetermined intent.
Description Deaths Hospitalizations
Emergency Room Visits
Permanent Partial
Disability
Permanent Total
Disability
Unintentional 2,180 48,082 774,146 11,371 929
Intentional 1,200 4,927 30,302 1,122 76
Undetermined Intent/Other
60 423 4,742 107 8
TOTAL 3,440 53,432 809,190 12,600 1,012
DescriptionTotal costs
($ millions)Direct costs ($ millions)
Indirect costs ($ millions)
Unintentional $4,753 $3,263 $1,489
Intentional $858 $280 $578
Undetermined Intent/Other
$56 $25 $31
TOTAL $5,667 $3,569 $2,098
Quebec ! 133
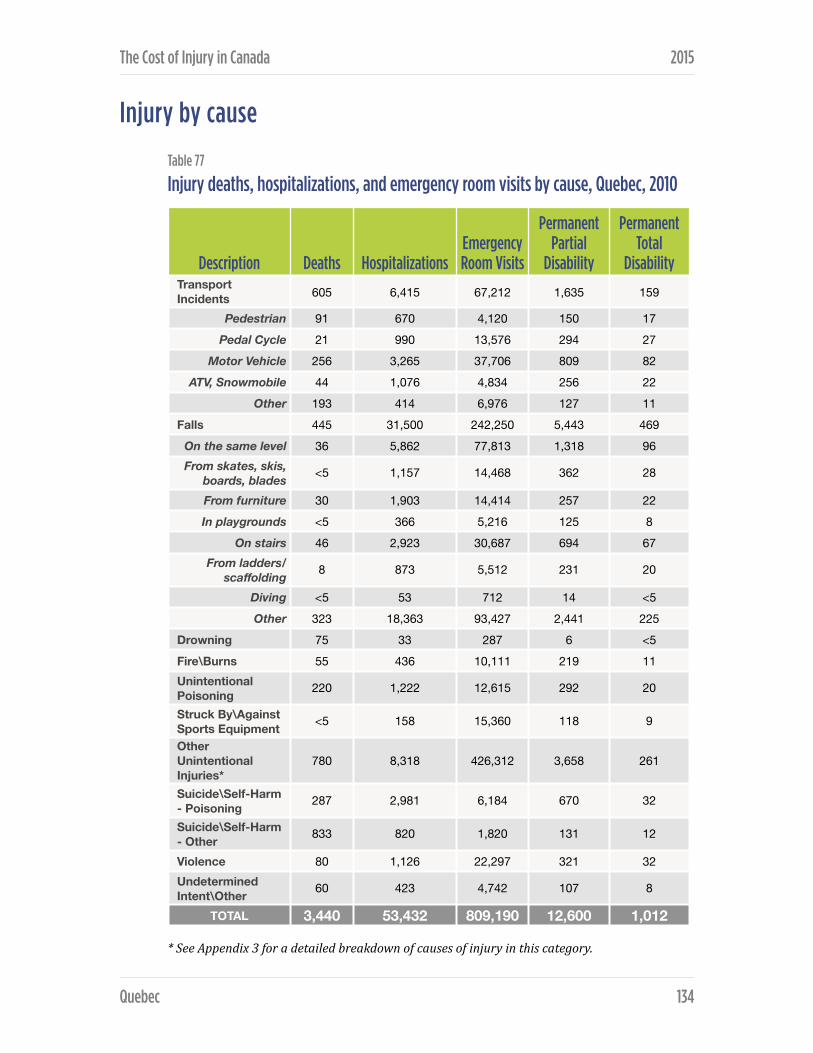
The Cost of Injury in Canada 2015
Injury by cause
Table 77
Injury deaths, hospitalizations, and emergency room visits by cause, Quebec, 2010
* See Appendix 3 for a detailed breakdown of causes of injury in this category.
Description Deaths HospitalizationsEmergency Room Visits
Permanent Partial
Disability
Permanent Total
Disability Transport Incidents 605 6,415 67,212 1,635 159
Pedestrian 91 670 4,120 150 17 Pedal Cycle 21 990 13,576 294 27
Motor Vehicle 256 3,265 37,706 809 82 ATV, Snowmobile 44 1,076 4,834 256 22
Other 193 414 6,976 127 11 Falls 445 31,500 242,250 5,443 469
On the same level 36 5,862 77,813 1,318 96 From skates, skis,
boards, blades <5 1,157 14,468 362 28
From furniture 30 1,903 14,414 257 22 In playgrounds <5 366 5,216 125 8
On stairs 46 2,923 30,687 694 67 From ladders/
scaffolding 8 873 5,512 231 20
Diving <5 53 712 14 <5Other 323 18,363 93,427 2,441 225
Drowning 75 33 287 6 <5Fire\Burns 55 436 10,111 219 11 Unintentional Poisoning 220 1,222 12,615 292 20
Struck By\Against Sports Equipment <5 158 15,360 118 9
Other Unintentional Injuries*
780 8,318 426,312 3,658 261
Suicide\Self-Harm - Poisoning 287 2,981 6,184 670 32
Suicide\Self-Harm - Other 833 820 1,820 131 12
Violence 80 1,126 22,297 321 32 Undetermined Intent\Other 60 423 4,742 107 8
TOTAL 3,440 53,432 809,190 12,600 1,012
Quebec ! 134
The Cost of Injury in Canada 2015
In 2010, one in three (33%) of injury-related deaths in Quebec were due to suicide or self-harm. Other non-specific unintentional injuries accounted for 23% of injury deaths followed by transport incidents (18%) and falls (13%). Among the other causes of death were unintentional poisoning (6%), and drowning, fire or burns, violence, and injuries of undetermined intent which each resulted in 2% of deaths.
Injury-related hospitalizations occurred overwhelmingly due to falls (59%). Other causes of hospitalization were other (non-specific) unintentional injuries (16%), transport incidents (12%), suicide or self-harm (7%), unintentional poisoning (2%), violence (2%), fire or burns (1%) and injuries of undetermined intent (1%).
In Quebec in 2010 the main causes of visits to the emergency room for injury were falls (30%) and other (non-specific) unintentional injuries (53%). Less frequent causes for emergency room visits were transportation incidents (8%), violence (3%), unintentional poisoning (2%), being struck by or against sport equipment (2%), fire or burns (1%) and injuries of undetermined intent (1%).
Falls were the leading cause of permanent partial disability (43%) and permanent total disability (46%), followed by other non-specific unintentional injuries (29% of partial disability and 26% of total disability) and transportation incidents (13% of partial disability and 16% of full disability). The remaining causes of permanent partial and total disability were suicide and self-harm (6% and 4%, respectively), unintentional poisoning (2% and 2%, respectively), fire or burns (2% and 1%, respectively), being struck by or against sporting equipment (1% each), and injuries of undetermined intent (1% each).In 2010 in Quebec the most prevalent cause of injury-related death was suicide or self-harm taking 14.1 lives for every 100,000 people. The most costly cause of injury was falls that had a per capita cost of $245.
Quebec ! 135
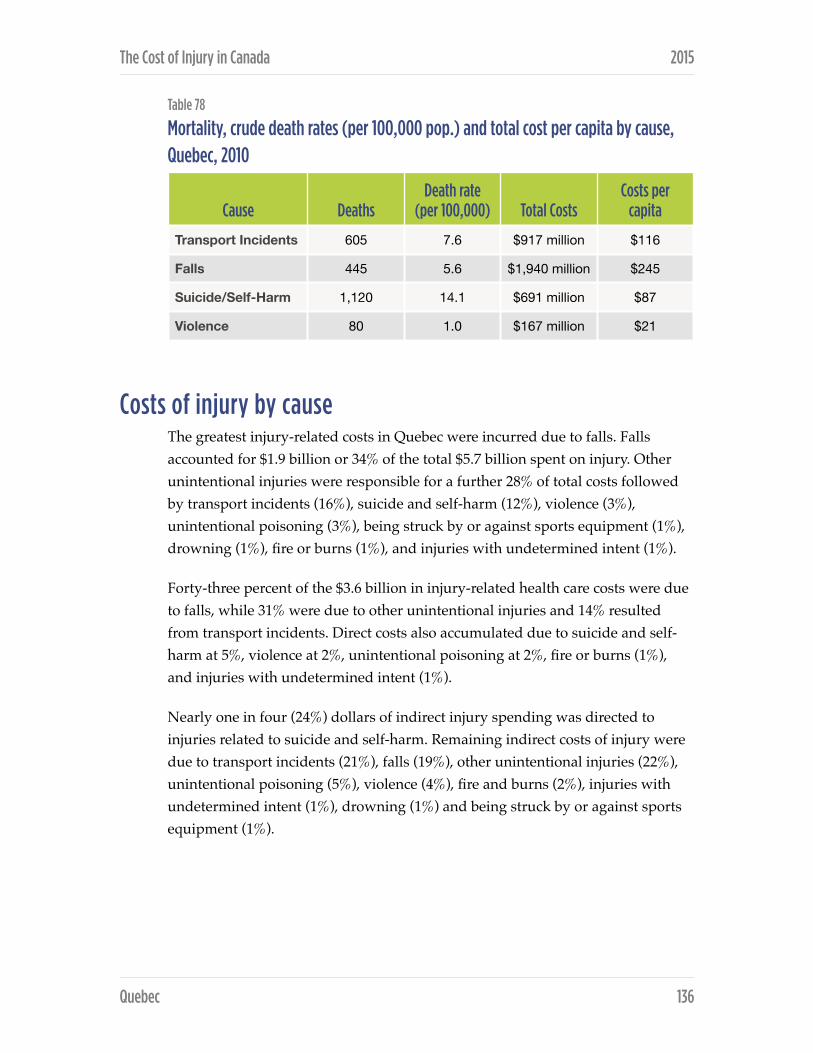
The Cost of Injury in Canada 2015
Table 78
Mortality, crude death rates (per 100,000 pop.) and total cost per capita by cause, Quebec, 2010
Costs of injury by cause The greatest injury-related costs in Quebec were incurred due to falls. Falls accounted for $1.9 billion or 34% of the total $5.7 billion spent on injury. Other unintentional injuries were responsible for a further 28% of total costs followed by transport incidents (16%), suicide and self-harm (12%), violence (3%), unintentional poisoning (3%), being struck by or against sports equipment (1%), drowning (1%), fire or burns (1%), and injuries with undetermined intent (1%).
Forty-three percent of the $3.6 billion in injury-related health care costs were due to falls, while 31% were due to other unintentional injuries and 14% resulted from transport incidents. Direct costs also accumulated due to suicide and self-harm at 5%, violence at 2%, unintentional poisoning at 2%, fire or burns (1%), and injuries with undetermined intent (1%).
Nearly one in four (24%) dollars of indirect injury spending was directed to injuries related to suicide and self-harm. Remaining indirect costs of injury were due to transport incidents (21%), falls (19%), other unintentional injuries (22%), unintentional poisoning (5%), violence (4%), fire and burns (2%), injuries with undetermined intent (1%), drowning (1%) and being struck by or against sports equipment (1%).
Cause DeathsDeath rate
(per 100,000) Total CostsCosts per
capita
Transport Incidents 605 7.6 $917 million $116
Falls 445 5.6 $1,940 million $245
Suicide/Self-Harm 1,120 14.1 $691 million $87
Violence 80 1.0 $167 million $21
Quebec ! 136

The Cost of Injury in Canada 2015
Table 79
Total, direct, and indirect costs of injury by cause, Quebec, 2010
* See Appendix 3 for a detailed breakdown of causes of injury in this category.
DescriptionTotal costs
($ millions)Direct costs ($ millions)
Indirect costs ($ millions)
Transport Incidents $917 $483 $434
Pedestrian $96 $51 $45
Pedal Cycle $111 $68 $43
Motor Vehicle $473 $271 $202
ATV, Snowmobile $116 $64 $53
Other $121 $30 $92
Falls $1,940 $1,540 $400
On the same level $404 $323 $81
From skates, skis, boards, blades $126 $77 $49
From furniture $119 $98 $21
In playgrounds $49 $29 $19
On stairs $209 $158 $51
From ladders/scaffolding $61 $46 $15
Diving $8 $5 $3
Other $964 $803 $160
Drowning $31 $2 $29
Fire\Burns $77 $38 $40
Unintentional Poisoning $172 $65 $108
Struck By\Against Sports Equipment $40 $22 $18
Other Unintentional Injuries* $1,575 $1,115 $460
Suicide\Self-Harm - Poisoning $310 $142 $167
Suicide\Self-Harm - Other $382 $49 $332
Violence $167 $89 $78
Undetermined Intent\Other $56 $25 $31
TOTAL $5,667 $3,569 $2,098
Quebec ! 137

The Cost of Injury in Canada 2015
Transport-related injuries and associated costs The leading cause of transport incident related injury was motor vehicle events. Motor vehicle incidents accounted for 42% of transport incident deaths as well as 51% of related hospitalizations, 56% of emergency room visits, 49% of permanent partial disability and 52% of permanent total disability. Deaths due to transport incidents also resulted from other transport incidents (32%), pedestrian incidents (15%), ATV or snowmobile incidents (7%), and cycling incidents (4%). Seventeen percent of hospitalizations due to transport-related injuries were due to ATV or snowmobile incidents, while 15% were due to cycling events, 10% resulted from pedestrian incidents and 6% were due to other transportation incidents. Emergency room visits were — after motor vehicle incidents — due to cycling (20%), other transport incidents (10%), ATV or snowmobile events (7%) and pedestrian incidents (6%).
Motor vehicle incidents were also the main driver of $916 million in costs associated with transport injuries. Half (52%) of total costs, 56% of direct health care expenses and 47% of indirect spending on transportation-related injuries was due to motor vehicle events. Costs also arose due to pedestrian incidents (10% of total, direct and indirect), cycling incidents (12% of total, 14% of direct, 10% of indirect), ATV or snowmobile incidents (13% of total, 13% of direct, 12% of indirect), and other transport incidents (13% of total, 6% of direct, 21% of indirect).
Direct costs also arose from cycling incidents (14%), ATV or snowmobile incidents (13%), pedestrian injuries (10%) and other transportation incidents (6%). Twenty-one percent of indirect costs resulted from other non-specified transportation events, while 12% resulted from ATV/snowmobile injuries, and pedestrian and cycling events each accounted for 10% of spending.
Fall-related injuries by cause and associated costs Almost three quarters (73%) of deaths due to fall injuries resulted from non-specific (other) fall events. Non-specific falls were also responsible for 58% of hospitalizations and 39% of visits to the emergency rooms visits, 45% of permanent partial disabilities and 48% of permanent total disabilities due to fall injuries.
Other causes of fall-related deaths were falls on stairs (10%), from the same level (8%), from furniture (7%), and falls from ladders of scaffolding (2%). Nine percent of hospitalizations due to fall injuries were precipitated by falls on stairs
Quebec ! 138

The Cost of Injury in Canada 2015
while falls on the same level were responsible for 8%, falls from furniture for 7%, falls from skates/skis/boards/blades for 4%, falls from ladders or scaffolding for 3%, and falls in playgrounds for 1%.
Total costs of injuries due to falls were $1.9 billion dollars in 2010 of which $1.5 billion were direct health care costs and $0.4 billion were indirect costs. After other non-specific causes, falls on the same level were the greatest driver of costs accounting for 21% of overall fall-related spending, 21% of direct health care costs and 20% of indirect spending. Other non-specified fall causes resulted in 50% of overall spending, 52% of direct costs and 40% of indirect spending.
Direct costs also arose from falls on stairs (10%), falls from furniture (6%), falls from skates/skis/boards/blades (5%), falls from ladders or scaffolding (3%), and falls in playgrounds (2%). Remaining indirect costs were due to falls on stairs (13%), falls from skates/skis/boards/blades (12%), falls from furniture (5%), falls on playgrounds (5%), falls from ladders or scaffolding (4%), and diving (1%).
Intentional injuries by cause and associated costs In 2010 suicide and self-harm accounted for 93% of unintentional injury death in Quebec. Suicide/self-harm by method other than poisoning was the leading cause of death (69%), followed by suicide/self-harm due to poisoning (24%), and death due to violence (7%).
Suicide or self-harm by means other than poisoning was also the predominant reason for hospitalization for intentional injuries accounting for 61% of all occurrences. Violence led to 23% of these hospitalizations followed by poison-related suicide or self-harm (17%). Emergency room visits due to intentional injuries were dominated by injury due to of violence (74%) while suicide/self-harm by poisoning resulted in 20% of the visits and suicide/self-harm by other means the remaining 6%. In 2010, suicide or self-harm by poisoning were responsible for 60% of permanent partial disability and 42% of permanent total disability, violence accounted for 29% of partial and 42% of total cases of disability and suicide or self-harm – other made up the remaining 12% of partial disability, and 16% of total disability.
Eighty percent of the cost associated with intentional injury were due to suicide or self-harm. Suicide or self-harm by means other than poisoning accounted for 44% of these costs, suicide or self-harm - poison for 36%, and violence for the
Quebec ! 139

The Cost of Injury in Canada 2015
remainder. Direct costs were dominated by suicide/self-harm by poisoning (51%) followed by violence (32%) and suicide or self-harm by means other than poisoning (18%). Conversely, the majority (58%) of indirect costs associated with intentional injury were the result of suicide or self-harm by means other than poisoning. Indirect costs were additionally due to suicide or self-harm by poisoning (29%) and injuries due to violence (14%).
Quebec ! 140

SASKATCHEWAN
In Saskatchewan, while there is no adopted injury prevention strategy for the province, several organizations and agencies are committed to the work necessary to prevent injuries. Various agencies work on specific injury areas.
The Acquired Brain Injury (ABI) Partnership Project is a partnership between Saskatchewan Government Insurance (SGI) and the Saskatchewan Ministry of Health and is recognized around the world for its innovation. Along with providing services and support for individuals with ABI and their families, the ABI Partnership Project funds four health region-based positions throughout the province that provide support and resources to communities in their efforts to prevent injury.
Since 1997, the ABI Partnership Project and Saskatchewan Government Insurance have been involved in a joint program to provide community grants for traffic safety and other injury prevention programs. The goal is to enable community groups to establish, enhance, and deliver programs that address safety issues in their communities. Since its inception, the grant program has provided funding to 1,900 applicants for a total of almost two million dollars. The ABI Partnership Project also provides funding to the Saskatchewan Prevention Institute for a dedicated full-time staff person to work in the area of child injury prevention. The Prevention Institute is also funded by SGI for a full-time staff person who provides child passenger safety technician training and expertise in the province.
Saskatchewan Government Insurance (SGI), a crown corporation, is the leading provincial agency in road safety and is dedicated to education, engineering, and enforcement. SGI works very closely with and provides funding to provincial law enforcement agencies to focus enforcement efforts and organize multi-agency projects. They also work with municipal and provincial highway engineers to collaborate on infrastructure safety improvements. SGI funds traffic safety positions for four of Saskatchewan’s tribal councils. The Traffic Safety Promotion team attends community events and schools to present on different road safety topics.
Saskatchewan ! 141

The Cost of Injury in Canada 2015
Saskatchewan experiences high numbers of fatalities related to motor vehicle crashes. To address this, the provincial government set up an all-party committee in 2013 to do extensive consultation around the province and create a list of recommendations. The Committee established 26 recommendations adopted by the government. These recommendations address stronger legislation, increased enforcement and better public awareness and education as well as collaboration between crown corporations and government ministries. The traffic safety issues targeted were occupant restraints, impaired driving (alcohol and drugs), speed, and distracted driving.
The Saskatchewan Ministry of Labour Relations and Workplace Safety (LRWS) encourages healthy and safe workplaces by establishing, promoting and enforcing employment and occupational health and safety standards. In 2008, the Ministry of Labour Relations and Workplace Safety and the Workers Compensation Board launched WorkSafe Saskatchewan, with the slogan Mission: Zero, in an effort to draw attention to and reduce the numbers of workplace injuries. Safe Saskatchewan is a non-profit organization led by a consortium of public, private, cooperative and not-for-profit sector partners. It works to expand the Mission: Zero message beyond industry. There are a number of industry-specific safety organizations that operate in the province.
There are several other provincial organizations, (such as the Saskatchewan Safety Council, Red Cross, St. John Ambulance, Life Saving Society), community-based organizations, located in health regions, and service provision agencies (ambulance, fire, police) that focus on injury prevention. Academic institutions, such as the Canadian Centre for Health and Safety in Agriculture and the Sports Medicine and Science Council of Saskatchewan, conduct research and provide services and training to the province.
In 2008, the Saskatchewan Comprehensive Injury Surveillance Report, 1995-2005 was produced through the joint efforts of several government ministries, agencies and stakeholders to provide government agencies, regional health authorities, other stakeholder organizations and communities with information for evidence-based planning and evaluation of injury prevention programs that impact on the population of Saskatchewan. The report contains descriptive statistical information on various aspects of injury occurrences in the province. The data for preparation of this report were drawn from a variety of sources including Canadian Community Health
Saskatchewan ! 142

The Cost of Injury in Canada 2015
Survey data and administrative databases housed at various Government of Saskatchewan ministries, Saskatchewan Government Insurance and the Saskatchewan Workers’ Compensation Board.
Total cost of injury
In 2010 injury cost residents of Saskatchewan $1.1 billion and led to 690 deaths.
In the same year injuries left 2,292 permanently partially or totally disable, led to 10,844 hospitalizations and prompted 110,312 emergency room visits.
With a 2010 population of 1,051,425 the death rate due to injury in 2010 was 66, approximately 9,953 potential years of life were lost per 100,000 people and injuries cost each resident $1,108.
Table 80
Summary of findings, all injury, Saskatchewan, 2010
Direct and indirect costs The total cost of injuries in 2010 was $1.1 billion including $605 million (54% or $576 per capita) in direct health care costs and $508 million (46% or $483 per capita) in indirect expenditures.
Intentional and unintentional injury In 2010, the majority of injuries in Saskatchewan resulted from unintentional events. Three quarters (76%) of deaths, 86% of hospitalizations, 96% of emergency room visits and 86% of cases of both partial and total permanent
Injury Deaths Hospitalizations
Emergency Room Visits
Permanent Partial
Disability
Permanent Total
Disability
Total Economic
Cost of Injury
690 10,844 110,312 2,292 186 $1.1 billion
Saskatchewan ! 143

The Cost of Injury in Canada 2015
disabilities arising from injury were unintentional in nature. Intentional events were responsible for 22% of the injury deaths, as well as 12% of hospitalizations, 4% of emergency room visits and 12% of permanent partial and total disability incidents. The remainder of events were of undetermined intent.
Table 81
Injury by intent, Saskatchewan, 2010
Table 82
Total, direct, and indirect costs by intent of injury, Saskatchewan, 2010
The cost of injury in Saskatchewan was also mostly due to unintentional injury. Unintentional injuries accounted for 82% of the overall $1.1 billion spent on injuries including 87% of direct costs and 77% of indirect costs. Just 12% of direct health care costs and 21% of indirect injury-related costs were due to intentional
Description Deaths Hospitalizations
Emergency Room Visits
Permanent Partial
Disability
Permanent Total
Disability
Unintentional 525 7,555 91,761 1,703 140
Intentional 155 1,339 4,102 272 21
Undetermined Intent/Other 10 183 627 40 2
TOTAL 690 9,077 96,489 2,014 164
DescriptionTotal costs
($ millions)Direct costs ($ millions)
Indirect costs ($ millions)
Unintentional $918 $526 $391
Intentional $177 $70 $107
Undetermined Intent/Other
$18 $9 $9
TOTAL $1,113 $605 $508
Saskatchewan ! 144

The Cost of Injury in Canada 2015
injuries. Injuries of undetermined intent cost the province a total of $18 million, or 2% of total costs.
Injury by cause The two leading causes of injury-related death in Saskatchewan in 2010 were falls (25%) and transport incidents (23%). Other causes of death due included suicide and self-harm (19%), other unintentional injuries (12%), unintentional poisoning (11%), violence (4%), drowning (3%), fires or burns (1%), and other injuries of undetermined intent (1%).
In Saskatchewan in 2010 falls were the leading cause of hospitalizations resulting from injury accounting for 52% of stays. An additional 13% of injury hospitalizations resulted from transport incidents, while 15% were due to other non-specific unintentional injuries, 6% resulted from suicide or self-harm and 6% followed violence. Other reasons for hospitalization were unintentional poisoning (4%), injuries of undetermined intent (2%) and fire or burns (1%).
Slightly less than one-third of injury-related visits to the emergency room in 2010 were due to falls (30%) or other unintentional injuries (52%). Less common reasons for emergency room visits were transport incidents (8%), violence (3%), being struck by or against sports equipment (2%), unintentional poisoning (2%), fires/burns (1%), suicide or self-harm (1%), and injuries with undetermined intent (1%).
The most common reason for permanent partial and permanent total disability was falls (40% and 42% respectively). Injury-related partial disability also occurred as a result of other unintentional injuries (26%), transport incidents (14%), suicide or self-harm (6%), violence (6%), unintentional poisoning (4%) as wells as fire/ burns or injuries of undetermined intent (each 2%), and being struck by or against sports equipment (1%). Instances of permanent total disability also resulted from other unintentional injuries (23%), transport incidents (18%), violence (8%), suicide or self-harm (4%), unintentional poisoning (3%), fire/burns (1%), and being struck by/against sport equipment (1%).
Saskatchewan ! 145

The Cost of Injury in Canada 2015
Table 83
Injury deaths, hospitalizations, and emergency room visits by cause, Saskatchewan, 2010
* See Appendix 3 for a detailed breakdown of causes of injury in this category.
Description Deaths HospitalizationsEmergency Room Visits
Permanent Partial
Disability
Permanent Total
Disability Transport Incidents 160 1,457 8,978 331 33
Pedestrian 21 154 550 32 <5Pedal Cycle 5 91 1,905 32 <5
Motor Vehicle 71 751 4,935 163 17ATV, Snowmobile 11 263 663 59 5
Other 53 198 925 45 <5Falls 175 5,603 33,469 917 77
On the same level 14 1,786 10,470 302 22 From skates, skis,
boards, blades <5 102 2,095 37 <5
From furniture 12 366 2,146 44 <5In playgrounds <5 125 833 36 <5
On stairs 15 508 4,077 119 12 From ladders/
scaffolding <5 158 690 37 <5
Diving <5 <5 102 <5 <5Other 130 2,555 13,055 340 31
Drowning 20 14 40 <5 <5Fire\Burns 10 128 1,373 40 <5Unintentional Poisoning 75 446 1,708 86 5
Struck By\Against Sports Equipment <5 29 2,204 18 <5
Other Unintentional Injuries*
85 1,645 57,812 586 43
Suicide\Self-Harm - Poisoning 29 587 813 127 5
Suicide\Self-Harm - Other 101 99 247 16 <5
Violence 25 653 3,042 130 15 Undetermined Intent\Other 10 183 627 40 <5
TOTAL 690 9,077 96,489 2,292 186
Saskatchewan ! 146

The Cost of Injury in Canada 2015
Table 84
Mortality, crude death rates (per 100,000 pop.) and total cost per capita by cause, Saskatchewan, 2010
In 2010 falls resulted in the highest injury-related death rate in Saskatchewan: 16.6 deaths per 100,000 population. Falls also generated the highest per capita injury costs with a price tag of $303 per resident.
Costs of injury by cause In Saskatchewan in 2010 injury-related costs totalled $1.1 billion. More than a quarter of total costs arose from fall injuries (29%) and injuries due to transport incidents (22%). Total costs also accumulated due to other unintentional injuries (23%), suicide or self-harm (10%), violence (6%), unintentional poisoning (6%), fire and burns (2%), injuries of undetermined intent (2%), and being struck by or against sports equipment (1%).
Direct health care costs made up just over half of total costs and were most often due to falls (38%) and other unintentional injuries (26%). Seventeen percent of direct injury costs were the result of transport incidents, while injuries due to violence contributed 6% of costs, suicide and self-harm 6%, unintentional poisoning 3%, injuries with undetermined intent 1%, fire or burns 1% and being struck by or against sports equipment a final 1%.
Transport incidents were responsible for 28% of indirect costs, falls for 17% and other unintentional injuries for an additional 20%. Less prominent reasons for indirect costs included suicide or self-harm (14%), unintentional poisoning (8%), violence (7%), injuries with undetermined intent (2%), drowning (2%), fire or burns (2%) and being struck by/against sports equipment (1%).
Cause DeathsDeath rate
(per 100,000) Total CostsCosts per
capita
Transport Incidents 160 15.2 $243 million $232
Falls 175 16.6 $318 million $303
Suicide/Self-Harm 130 12.4 $107 million $102
Violence 25 2.4 $70 million $67
Saskatchewan ! 147

The Cost of Injury in Canada 2015
Table 85
Total, direct, and indirect costs of injury by cause, Saskatchewan, 2010
* See Appendix 3 for a detailed breakdown of causes of injury in this category.
DescriptionTotal costs
($ millions)Direct costs ($ millions)
Indirect costs ($ millions)
Transport Incidents $244 $104 $140
Pedestrian $29 $14 $15
Pedal Cycle $14 $7 $7
Motor Vehicle $122 $56 $65
ATV, Snowmobile $31 $15 $16
Other $48 $12 $36
Falls $319 $232 $86
On the same level $88 $68 $20
From skates, skis, boards, blades $15 $8 $8
From furniture $19 $14 $5
In playgrounds $16 $9 $7
On stairs $36 $25 $10
From ladders/scaffolding $11 $7 $4
Diving $1 $0 $0
Other $132 $100 $33
Drowning $11 $1 $10
Fire\Burns $17 $7 $10
Unintentional Poisoning $62 $21 $41
Struck By\Against Sports Equipment $7 $3 $4
Other Unintentional Injuries* $259 $158 $101
Suicide\Self-Harm - Poisoning $48 $29 $19
Suicide\Self-Harm - Other $59 $5 $54
Violence $70 $36 $34
Undetermined Intent\Other $18 $9 $9
TOTAL $1,113 $605 $508
Saskatchewan ! 148

The Cost of Injury in Canada 2015
Transport-related injuries and associated costs In Saskatchewan in 2010 transport-related injuries occurred most often due to motor vehicle incidents. Forty-four percent of transport-related injury deaths were due to motor vehicle incidents as were 52% of hospitalizations, 55% of emergency room visits, 49% of partial disability and 53% of total disability arising from injury.
Injury deaths due to transport incidents also occurred as a result of other non-specific transport causes (33%), pedestrian incidents (13%), ATV or snowmobile incidents (7%) and cycling events (3%). After motor vehicle events transport injury hospitalizations resulted from ATV or snowmobile incidents (18%), other non-specified transport incidents (14%), pedestrian (11%) and cycling incidents (6%). Twenty-one percent of emergency room visits for transport-related injuries were due to cycling incidents, 10% were due to non-specific transit incidents, and ATV/snowmobile and pedestrian incidents resulted in 7% and 6% of visits, respectively.
Transport-related injuries cost Saskatchewan $244 million in 2010. Motor vehicle incidents were responsible for 50% of total costs, 54% of health care costs and 47% of indirect costs. Other non-specific transit incidents contributed 20% of total costs, 11% of direct costs and 26% of indirect costs while pedestrian incidents were responsible for 12% of total, 13% of direct and 11% of direct costs. Costs also arose from ATV and snowmobile incidents (13% of total, 15% of direct, 11% of indirect) and cycling incidents (6% total, 7% of direct and 5% of indirect).
Fall-related injuries and associated costs In 2010, nearly three quarters (74%) of deaths due to fall injuries resulted from non-specific (other) fall events. Non-specific falls were also responsible for 46% of hospitalizations and 39% of visits to the emergency rooms visits, 37% of permanent partial disabilities and 41% of permanent total disabilities due to fall injuries.
Other causes of fall-related deaths were falls on stairs (9%), from the same level (8%), from furniture (7%), from ladders/scaffolding (2%) and from sports equipment (1%). Falls-related hospitalization resulted from falling on the same level (32%), on stairs (9%), from furniture (7%), from ladders or scaffolding (3%), in playgrounds (2%) and from skates/skis/boards/blades (2%). Falling on the
Saskatchewan ! 149
The Cost of Injury in Canada 2015
same level led to 31% of all fall-related emergency room visits while falls on stairs were responsible for 12%, falls from skates/skis/boards/blades 6%, falls from furniture 6%, falls in playgrounds 2% and falls from ladders or scaffolding a final 2%.
Total costs of injuries due to falls were $318 million dollars in 2010. After non-specific fall causes which accounted for 42% of total costs, falls from the same level made up the largest segment of total costs, at 28%. Total costs also accumulated due to falls on stairs (11%), from furniture (6%), from skates/skis/boards/blades (5%), in playgrounds (5%), and from leaders or scaffolding (4%). Twenty-nine percent of direct health care costs resulted from falling on the same level and other non-specific fall events contributed 43% of these costs. Further health care costs resulted from falls on stairs (11%), from furniture (6%), in playgrounds (4%), from skates/skis/boards/blades (3%), and from ladders and scaffolding (3%). Indirect costs were most often the result of falls from the same level (23%) and other non-specific fall events (38%) but also resulted from falls on stairs (12%), falls from skates/skis/boards/blades (9%), falls in playgrounds (8%), falls from furniture (5%), and falls from ladders or scaffolding (5%).
Intentional injuries by cause and associated costs Eighty-four percent of deaths due to intentional injuries were the result of suicide and self-harm, as were 51% of hospitalizations, 26% of emergency room visits, 53% of permanent partial disability due 32% of permanent total disability due to intentional injuries.
Deaths due to intentional injury occurred most often due to suicide or self-harm by means other than poisoning (65%), while suicide or self-harm poison accounted for 19% of deaths and violence for the remaining 16%. Hospitalizations and emergency room visits due to intentional injuries occurred most often due to violence (49% and 74%, respectively). Other reasons for hospitalizations and emergency room visits were suicide or self-harm due to poisoning (44% of hospitalizations, 20% emergency room visits), and suicide and self-harm by means other than poison (7% of hospitalizations, 6% emergency room visits). Permanent partial and total disability due to intentional injury resulted most often due to violence, 48% and 68% of cases respectively. Suicide or self-harm – poison accounted for 47% of partial and 25% of total disability while
Saskatchewan ! 150

The Cost of Injury in Canada 2015
suicide or self-harm by means other than poisoning was the cause of 6% of partial and 7% of total disability cases.
The total cost of intentional injuries in Saskatchewan in 2010 was $177 million of which 60% was the result of suicide and self-harm (27% poison related, 33% other means), and 40% resulted from violence. Just over half (52%) of direct costs related to intentional injuries was spent on injuries resulting from violence, while 41% were spent on suicide or self-harm by means poisoning, and 7% on suicide or self-harm by means other than poisoning. Indirect costs were due 50% to suicide or self-harm by other means, 32% to violence and 18% suicide or self-harm by poison.
Saskatchewan ! 151
APPENDIX 1: Methodology
Economic approach The analyses underlying the current report were conducted using an incidence costing, human capital approach. That is, the population of Canadian residents injured in 2010 was costed over the lifetime of injured individuals. The costs, both direct and indirect, were discounted to a present value in 2010 at 3% per annum. Indirect costs, in accordance with the human capital methodology, included only foregone earnings calculated as average earnings, adjusted by the participation rate and unemployment rate, over the relevant period within the working life of an individual from ages 15 to 64 years inclusive. A real wage growth rate of 1% per year was assumed.
The perspective for this report is societal. The viewpoint for cost-of-illness studies has a bearing on the schedule of costs to be included. For example, from a societal perspective, transfer payments such as Canada Pension Plan (CPP), disability, and social assistance are not considered costs since they are a reallocation of resources and the net effect of the transfer to society is zero. Others argue that personal transfers should be included as a cost since, if illness did not occur, then transfer payments could be used for other purposes, such as reducing the deficit. It should be noted that if this study were conducted from the perspective of the federal government, then transfer payments would be considered a cost. Similarly, other perspectives can be adopted such as that of the patient, the insurer, or even the trauma surgeon, each of which will impact on what are considered costs.
Incidence costing Cost-of-illness studies generally follow one of two approaches—incidence costing or prevalence costing. For conditions which are short-run in nature or which are steady-state chronic health problems, both approaches produce the same results. For policy makers wanting to control current health care expenditures, the prevalence approach is highly appropriate. However, if policy makers want to assess the benefits of preventing or reducing/ameliorating the
Appendix 1: Methodology ! 152

The Cost of Injury in Canada 2015
incidence of specific health problems, then the incidence approach is more useful and accurate. The prevalence approach assigns the costs of the major illness “to the years in which they are borne or are directly associated.” The major 13
limitation with this approach is that the full episode of illness, which may span multiple years or a full lifespan, is not captured. For example, longitudinal assessments of the burden of illness associated with hip fractures have found the burden to extend well beyond the initial hospitalization and to vary greatly depending on the disposition of individual cases.
The incidence approach involves “estimating the lifetime direct and indirect costs of the new cases of a condition or group of conditions which have their onset (incidence) in a given year.” Unlike the former method, this approach 14
emphasizes that “it is necessary to estimate not only the direct costs of these new cases accruing in the first year, but also the present value of direct costs (the stream of costs associated with the given health problem) which may accrue in the future, until the patient dies.” The stream of future costs is discounted to a 15
present value. Hence, with this approach, the cost of an injury occurrence (i.e., full episode) can be compared to the cost associated with the prevention of that injury. Under the incidence approach, prevention costs are actually investments, (e.g., $1 invested in bicycle helmets averts $29 in injury costs) and unmanaged injury risks are incremental costs. For example, motorcyclists who do not wear helmets increase the burden of injury on society, while wearing a helmet reduces hospitalization costs by more than $6,000 per patient.
Human capital Cost-of-illness studies distinguish and measure both direct costs (the value of resources used to treat the persons incurring the illness) and indirect costs (the value lost to society as a result of the illness in question). Direct costs are composed of all the goods and services used for the diagnosis, treatment, continuing care, rehabilitation, and terminal care of people experiencing a major illness or impairment, usually categorized according to major diagnosis or
Hartunian NS, Smart CN, Thompson MS. The incidence and economic costs of cancer, motor vehicle injuries, coronary heart 13
disease, and stroke: A comparative analysis. American Journal of Public Health 1980; 70:1249-‐1260, at 1250.
Scitovsky AA. Estimating the direct costs of illness. Millbank Memorial Fund Quarterly/Health and Society 1982;60:463-‐491, 14
at 474.
IBID15
Appendix 1: Methodology ! 153
The Cost of Injury in Canada 2015
diagnosis groupings, such as case mix groupings related to cancer or heart problems. These cost categories include expenditures for hospitalization, outpatient care, nursing home care, home care, services of physicians and other health professionals, pharmaceuticals, rehabilitation, as well as the costs of prostheses, appliances, eyeglasses, hearing aids, and speech devices necessary to help the patient overcome the impairments associated with the major illness. Also included are the administrative costs of third-party payers (public and private) who fund such expenses.
Indirect costs represent the losses due to goods and services that are not produced as a result of the impairment. The value of time lost from work and homemaking due to morbidity, disability, and premature mortality is measured by earnings data and the market value of unperformed homemaking services.
Under the human capital methodology, indirect costs are societal productivity losses, which account for the injured individual’s inability to perform his or her major activities. Under this methodology, indirect costs are generally captured through measuring foregone/lost income. The human capital method is the predominant approach used to derive indirect costs in the economic cost of illness/ injury literature. It has been suggested that this method produces a conservative or lower bound estimate of indirect costs given that costs are assigned to people 15 to 64 years of age inclusive. As well, costs are not assigned to those who leave the workforce to provide informal care to injured or ill family members. Finally, like the vast majority of studies employing the human capital method, we do not use a shadow pricing approach to value the lost productivity of those outside the workforce.
As well as these economic costs, there are certain intangible costs associated with injuries, such as pain and suffering, economic dependence, and social isolation. While these costs are difficult to quantify in economic terms, they are costs nonetheless and should at least be identified. Too many Canadians have their lives and those of their families irrevocably changed forever as a result of injury. This report did not attempt to quantify these costs and, hence, the indirect costs cited can be considered conservative.
Appendix 1: Methodology ! 154

The Cost of Injury in Canada 2015
The Electronic Resource Allocation Tool (ERAT) It is important to capture the lifetime costs associated with an injury. For example, the available cost data associated with a spinal cord injury resulting in permanent paralysis are generally limited to hospital costs and the lifetime costs are essentially unknown. In order to capture the full episodic costs associated with the various types of injury, this report employed the approach initially developed by SMARTRISK for The Economic Burden of Unintentional Injury in Canada, and utilized in its subsequent report, The Economic Burden of Unintentional Injury in Ontario.
An Electronic Resource Allocation Tool (ERAT) was developed, providing a classification and costing framework based on existing provincial injury data and data available from the injury costing literature. In essence, the ERAT combines existing data with variables from the literature in order to model full episodic costs for unintentional and intentional injuries. The ERAT is a flexible tool that can be updated as new data become available and according to changes in population, injury incidence, and treatment patterns and costs.
The ERAT consists of a series of spreadsheets designed to calculate the incidence costs of injury. The tool was created to fulfill two major objectives:
❖ To supply modelling and estimation techniques required to fill critical gaps in the available data;
❖ To serve as a resource tool that can be used by researchers and public health officials at the provincial and local level to support resource allocation, policy development, and decision-making.
Modelling and estimation techniques Detailed injury data are available for deaths, hospitalized cases, and persons who are treated in the emergency/outpatient department. Injuries that are not treated in a hospital are not captured or reported through a central body. Furthermore, there is a large data gap for hospitalized injuries that require ongoing care outside a hospital setting for either a short period or for a longer term of permanent disability.
Appendix 1: Methodology ! 155

The Cost of Injury in Canada 2015
Overall, the data gaps point towards two key analytical challenges:
❖ Estimating the type, number, and cost of non-hospitalized injuries, and
❖ Building the full episode of care for hospitalized injuries resulting in short-term and long-term disabilities.
The analytic strategy used to address these methodological problems involved an extensive search through scientific literature to find numbers and ratios that could be used to fill the data gaps. Having obtained these, the full episode of injury has been evaluated to include estimates of permanent disability and non-hospitalized cases, as well as population size and mix. Once adjusted, the tool calculates total costs, as well as costs for each injury type. The resource tool has been designed to allow for constant updating of current injury and cost information.
Data sources and definitions In order to document the direct and indirect costs of injury from an incidence costing perspective, it was essential to have information on the complete episode associated with each of the injuries. This must cover the range of cases from those dealt with completely in a hospital setting to those which encompass institutional, ambulatory, rehabilitation, home care, and other related costs over long periods of recovery or, in extreme cases, during the remaining period of an individual’s life expectancy.
The following sources of data were used in this report:
❖ The Public Health Agency holdings of the Hospital Morbidity Database (HMDB) from the Canadian Institute for Health Information (CIHI) contained the required data on hospitalizations related to injuries.
❖ Resource Intensity Weights (RIWs) from CIHI were used to attach average costs to the hospital episodes derived from the DAD.
❖ National Ambulatory Care Reporting System (NACRS) data for Ontario contained data that were used to develop non-hospitalized injury statistics for all provinces..
Appendix 1: Methodology ! 156
The Cost of Injury in Canada 2015
❖ Statistics Canada Vital Statistics Death Database accessed from the Canadian Socio-Economic Information Management System (CANSIM) was used to estimate lost productivity due to premature deaths.
❖ Unemployment rates, labour force participation rates, and average wage rates obtained from Statistics Canada’s CANSIM database were used to estimate the monetary value of the productivity losses resulting from morbidity and premature death.
❖ Population data obtained from Statistics Canada’s CANSIM database were used in the calculation of direct and indirect costs related to injuries.
While the above hospital and death data are necessary, they are not nearly sufficient to allow for a comprehensive documentation of all costs associated with injuries in Canada. While the National Ambulatory Care Reporting System (NACRS) at CIHI currently catalogues emergency room visits in Ontario, there is nothing to indicate the nature and extent of all the out-of-hospital treatment resulting from injuries. In order to get around these rather significant data limitations, proxy measures that would provide the complete picture had to be developed.
An extensive search of the literature revealed a major study in the United States. Miller’s Databook on Nonfatal Injury: Incidence, Costs and Consequences proved to be instrumental in helping to fill the large gaps by providing missing data and coefficients. This groundbreaking work allowed for a more complete estimate of the economic cost of unintentional injury in Canada by providing a mechanism to calculate:
❖ Direct morbidity costs for out-of-hospital treatment related to injuries, using ratios of episodes and related costs of non-hospitalized to hospitalized cases from the United States; and
❖ Incidence of both permanent partial and total disability using coefficients that relate these episodes and related costs (both direct and indirect) to the incidence of hospitalized and non-hospitalized cases from the United States.
Injury death data Statistics Canada vital statistics on deaths (CVS:D) were accessed using CANSIM for the 2010 calendar year. The external cause of injury was classified according
Appendix 1: Methodology ! 157

The Cost of Injury in Canada 2015
to the International Classification of Diseases, 10th revision (ICD-10). An algorithm developed by SMARTRISK expanded these data to include information on age and gender at the provincial level. Mortality costs were restricted to indirect costs related to earnings lost due to death, over what would have been the remaining working life of individuals had they lived.
Hospitalized injuries The Public Health Agency of Canada provided the acute hospital separation data analysis from their holdings of the Canadian Institute for Health Information (CIHI) Hospital Morbidity Database (HMDB) . The case-level data included Resource Intensity Weights (RIWs), length of hospital Stay (LOS), ICD-10 external cause of injury codes, ICD-10 nature of injury codes (N-code), province of residence, age, and sex for the 2010/11 fiscal year.
A small percentage of people died in hospital. These were included as both a hospitalization and a death as these cases generated both direct hospitalization costs and indirect mortality costs. However, this means that total injury cases cannot simply be obtained as the sum of deaths, hospitalizations, and non-hospitalized cases.
Hospital costs were estimated using the average inpatient cost per weighted case. Medical and rehabilitation costs were calculated using provincial hospital costs, in conjunction with the distribution of ICD-10 N-codes by ICD-10 external cause of injury codes derived from CIHI hospital data, and coefficients derived from Table 5.6 of Miller’s Databook. Indirect costs were limited to lost earnings during hospitalization.
Emergency room visits Injuries resulting in an emergency room visit were determined directly from the Ontario NACRS data and extended to all provinces by using Ontario incidence-to-population ratios on respective provincial populations.
In cases where treatment was initiated in an emergency department, with a subsequent hospital admission, the case would be included in both non-hospitalized and hospitalized categories in order to capture treatment costs in both settings.
Appendix 1: Methodology ! 158
The Cost of Injury in Canada 2015
Medical and rehabilitation costs were calculated using provincial hospital costs, in conjunction with the distribution of ICD-10 N-codes by ICD-10 external cause of injury codes derived from CIHI hospital data, and coefficients derived from Tables 5.6 and 5.9 of Miller's Databook.
Disability Permanent partial and permanent total disability from injury were estimated using both hospitalized and non-hospitalized injury in conjunction with the distribution of ICD-10 N-codes by ICD-10 external cause of injury codes derived from CIHI hospital data, and coefficients derived from Tables 4.12 and 4.15 of Miller's Databook.
Long-term medical costs were calculated using hospital costs in conjunction with coefficients derived from Tables 3.1 and 3.2 of the Databook, while the indirect cost associated with income loss was assumed to be 100% for total permanent disability, and 17% for partial permanent disability.
Population denominators Estimates of populations by age, gender, and province for 2010 were obtained from Statistics Canada.
Caveats and data limitations Provincial hospitalization data has been classified using the 10th Edition (ICD-10 CA) since 2002/03, while provincial mortality data has been so classified since 2000. However, the coefficients presented in Miller’s Databook on Nonfatal Injury: Incidence, Costs and Consequences are based upon injury data classified using International Classification of Disease, 9th Edition (ICD-9) groupings. As a result, the tables used from this publication required translation to ICD-10 code groupings. This was not a major task, but did involve a few minor judgment calls.
The coefficients derived from Miller’s Databook are based upon non-fatal injuries in the United States in the mid-1990s. This report assumes that these coefficients are similar to those that would be obtained from a Canadian study.
Appendix 1: Methodology ! 159
The Cost of Injury in Canada 2015
Costs will also vary according to the degree of disability and, hence, the disability coefficients from the United States related to two disability categories (partial or total) were applied to the Canadian population. Again, it was assumed that the American and Canadian situations were comparable.
The information in this Report can be considered a conservative estimate given data on doctor visits, clinic visits and toll on individuals are not accounted for. There may be variations in data between this report and provincial reports. This is due to the date when data are collected.
Appendix 1: Methodology ! 160

CONCLUSION
This Report has quantified the staggering cost of injury for Canadian children, seniors, families, our health care system, and to Canadian society. Preventable injury is the leading cause of death for Canadians aged one to 44, and claims the lives of more children in Canada than all other causes.
The costs continue to rise year after year. The loss of 15,866 Canadian lives and $26.8 billion is both heartbreaking, and unsustainable.
In the period 2004-2010, Canada’s age standardized death rate fell to 34.19. However, with the dramatic aging of Canada’s population, the age-standardized death rate is expected to remain basically flat over the next 20 years. By continuing on the current trajectory, forecasts show that by 2035 injuries will kill 26,390 Canadians, and cost $75 billion.
The good news is that the vast majority of the injuries described in this Report are both predictable and preventable. We know when they happen and under what conditions. We know who is at risk and who is not, and we increasingly know what works and what does not with respect to prevention.
These injuries can be prevented, lives can be saved, and a significant drain on our public resources can be avoided.
And as our capacity to monitor, report on, and coordinate effective action to prevent injury grows, our rationale for inaction diminishes. We encourage consideration of the costs of current inaction against the backdrop of Canada’s aging population, shrinking labour force, and over burdened health care system.
The clock is ticking. Effective action to prevent injury can help to alleviate the human and economic cost we all currently bear. It is time to take comprehensive, effective action that will prevent injuries and save lives.
Conclusion ! 161

APPENDIX 2: ICD-10 Code Classifications by Detailed Cause
Unintentional injuries Transport Incidents - Pedestrian V01 - V09
Transport Incidents - Pedal Cycle V10 - V19
Transport Incidents - Motor Vehicle V20 - V29, V40 - V79
Transport Incidents - ATV, Snowmobile V30 - V39, V86
Transport Incidents - Motor Vehicle (includes motorcycle, car, bus, truck) V20-V29, V40-V79
Falls - On the same level W00 - W01
Falls - From skates, skis, boards, blades W02
Falls - From furniture W06 - W08
Falls - In playgrounds W09
Falls - On stairs W10
Falls - From ladders/scaffolding W11 - W12
Falls - Diving W16
Falls - Other W03 - W05, W13 - W15, W17 - W19
Drowning V90, V92, W65 - W74
Fire/Burns X00 - X19
Unintentional Poisoning X40 - X49
Appendix 2: ICD-10 Code Classifications ! 162

The Cost of Injury in Canada 2015
Struck by/against Sports Equipment W21
Other Unintentional Injuries W20, W22 - W64, W75 - W99, X20 - X39, X50, X58, X59
Intentional injuries Suicide/Self-Harm - Poisoning X60 - X69
Suicide/Self-Harm - Other X70 - X84
Violence X85 - X99, Y00 - Y09
Undetermined Intent/Other Y10 - Y36
Appendix 2: ICD-10 Code Classifications ! 163

APPENDIX 3: External Causes Included in Other Unintentional Injuries
Struck by thrown, projected, or falling object (e.g., falling tree branch) W20
Other Exposure to inanimate mechanical forces (e.g., contact with broken glass) W22-49
Exposure to animate mechanical forces (e.g., bitten or struck by dog) W50-64
Other accidental threats to breathing (e.g., choking on food) W75-84
Exposure to electric current, radiation and extreme ambient air temperature and
Pressure W85-99
Contact with venomous animals and plants X20-29
Exposure to forces of nature (e.g., lightning) X30-39
Overexertion and strenuous or repetitive movements (e.g., lifting heavy objects) X50
Accidental exposure to other and unspecified factors (e.g., unspecified cause of
fracture) X58 - X59
Appendix 3: External Causes Included ! 164