COST EVALUATION OF PRODUCING DIFFERENT AGGREGATE · PDF fileCOST EVALUATION OF PRODUCING...
14
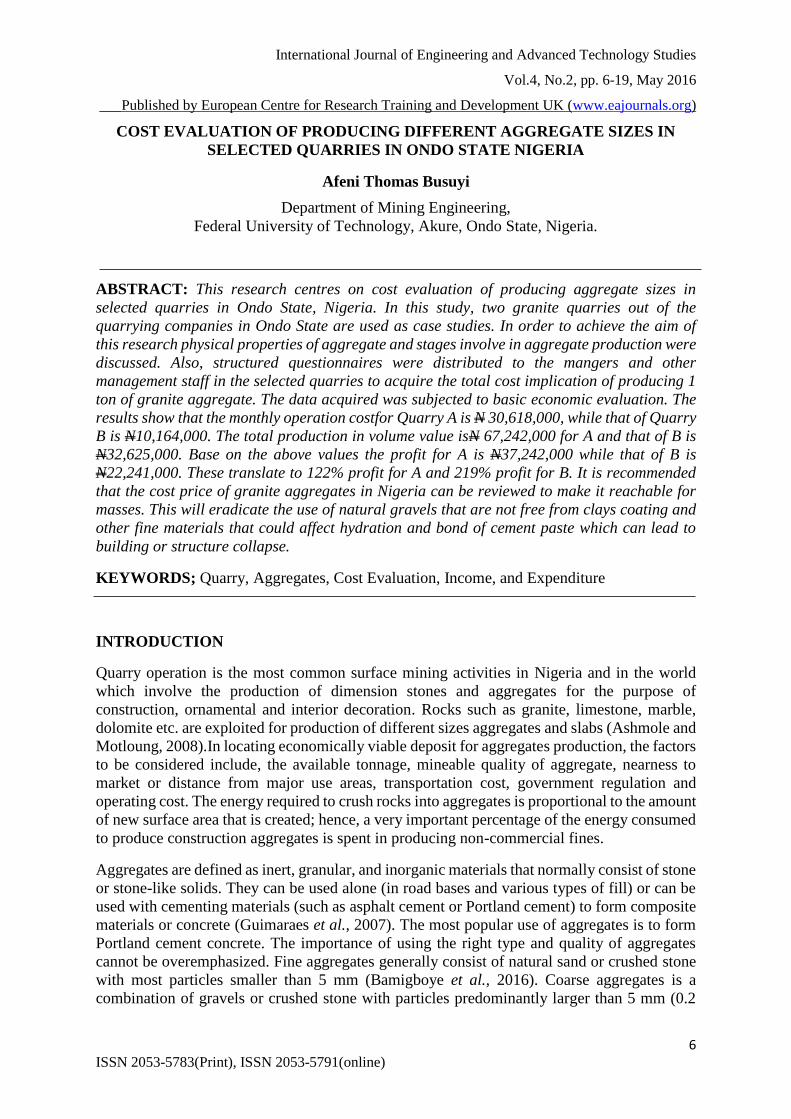
International Journal of Engineering and Advanced Technology Studies Vol.4, No.2, pp. 6-19, May 2016 ___Published by European Centre for Research Training and Development UK (www.eajournals.org) 6 ISSN 2053-5783(Print), ISSN 2053-5791(online) COST EVALUATION OF PRODUCING DIFFERENT AGGREGATE SIZES IN SELECTED QUARRIES IN ONDO STATE NIGERIA Afeni Thomas Busuyi Department of Mining Engineering, Federal University of Technology, Akure, Ondo State, Nigeria. ABSTRACT: This research centres on cost evaluation of producing aggregate sizes in selected quarries in Ondo State, Nigeria. In this study, two granite quarries out of the quarrying companies in Ondo State are used as case studies. In order to achieve the aim of this research physical properties of aggregate and stages involve in aggregate production were discussed. Also, structured questionnaires were distributed to the mangers and other management staff in the selected quarries to acquire the total cost implication of producing 1 ton of granite aggregate. The data acquired was subjected to basic economic evaluation. The results show that the monthly operation costfor Quarry A is N 30,618,000, while that of Quarry B is N10,164,000. The total production in volume value isN 67,242,000 for A and that of B is N32,625,000. Base on the above values the profit for A is N37,242,000 while that of B is N22,241,000. These translate to 122% profit for A and 219% profit for B. It is recommended that the cost price of granite aggregates in Nigeria can be reviewed to make it reachable for masses. This will eradicate the use of natural gravels that are not free from clays coating and other fine materials that could affect hydration and bond of cement paste which can lead to building or structure collapse. KEYWORDS; Quarry, Aggregates, Cost Evaluation, Income, and Expenditure INTRODUCTION Quarry operation is the most common surface mining activities in Nigeria and in the world which involve the production of dimension stones and aggregates for the purpose of construction, ornamental and interior decoration. Rocks such as granite, limestone, marble, dolomite etc. are exploited for production of different sizes aggregates and slabs (Ashmole and Motloung, 2008).In locating economically viable deposit for aggregates production, the factors to be considered include, the available tonnage, mineable quality of aggregate, nearness to market or distance from major use areas, transportation cost, government regulation and operating cost. The energy required to crush rocks into aggregates is proportional to the amount of new surface area that is created; hence, a very important percentage of the energy consumed to produce construction aggregates is spent in producing non-commercial fines. Aggregates are defined as inert, granular, and inorganic materials that normally consist of stone or stone-like solids. They can be used alone (in road bases and various types of fill) or can be used with cementing materials (such as asphalt cement or Portland cement) to form composite materials or concrete (Guimaraes et al., 2007). The most popular use of aggregates is to form Portland cement concrete. The importance of using the right type and quality of aggregates cannot be overemphasized. Fine aggregates generally consist of natural sand or crushed stone with most particles smaller than 5 mm (Bamigboye et al., 2016). Coarse aggregates is a combination of gravels or crushed stone with particles predominantly larger than 5 mm (0.2
Transcript of COST EVALUATION OF PRODUCING DIFFERENT AGGREGATE · PDF fileCOST EVALUATION OF PRODUCING...
International Journal of Engineering and Advanced Technology Studies
Vol.4, No.2, pp. 6-19, May 2016
___Published by European Centre for Research Training and Development UK (www.eajournals.org)
6 ISSN 20535783(Print), ISSN 20535791(online)
COST EVALUATION OF PRODUCING DIFFERENT AGGREGATE SIZES IN
SELECTED QUARRIES IN ONDO STATE NIGERIA
Afeni Thomas Busuyi
Department of Mining Engineering,
Federal University of Technology, Akure, Ondo State, Nigeria.
ABSTRACT: This research centres on cost evaluation of producing aggregate sizes in
selected quarries in Ondo State, Nigeria. In this study, two granite quarries out of the
quarrying companies in Ondo State are used as case studies. In order to achieve the aim of
this research physical properties of aggregate and stages involve in aggregate production were
discussed. Also, structured questionnaires were distributed to the mangers and other
management staff in the selected quarries to acquire the total cost implication of producing 1
ton of granite aggregate. The data acquired was subjected to basic economic evaluation. The
results show that the monthly operation costfor Quarry A is N 30,618,000, while that of Quarry
B is N10,164,000. The total production in volume value isN 67,242,000 for A and that of B is
N32,625,000. Base on the above values the profit for A is N37,242,000 while that of B is
N22,241,000. These translate to 122% profit for A and 219% profit for B. It is recommended
that the cost price of granite aggregates in Nigeria can be reviewed to make it reachable for
masses. This will eradicate the use of natural gravels that are not free from clays coating and
other fine materials that could affect hydration and bond of cement paste which can lead to
building or structure collapse.
KEYWORDS; Quarry, Aggregates, Cost Evaluation, Income, and Expenditure
INTRODUCTION
Quarry operation is the most common surface mining activities in Nigeria and in the world
which involve the production of dimension stones and aggregates for the purpose of
construction, ornamental and interior decoration. Rocks such as granite, limestone, marble,
dolomite etc. are exploited for production of different sizes aggregates and slabs (Ashmole and
Motloung, 2008).In locating economically viable deposit for aggregates production, the factors
to be considered include, the available tonnage, mineable quality of aggregate, nearness to
market or distance from major use areas, transportation cost, government regulation and
operating cost. The energy required to crush rocks into aggregates is proportional to the amount
of new surface area that is created; hence, a very important percentage of the energy consumed
to produce construction aggregates is spent in producing non-commercial fines.
Aggregates are defined as inert, granular, and inorganic materials that normally consist of stone
or stone-like solids. They can be used alone (in road bases and various types of fill) or can be
used with cementing materials (such as asphalt cement or Portland cement) to form composite
materials or concrete (Guimaraes et al., 2007). The most popular use of aggregates is to form
Portland cement concrete. The importance of using the right type and quality of aggregates
cannot be overemphasized. Fine aggregates generally consist of natural sand or crushed stone
with most particles smaller than 5 mm (Bamigboye et al., 2016). Coarse aggregates is a
combination of gravels or crushed stone with particles predominantly larger than 5 mm (0.2
International Journal of Engineering and Advanced Technology Studies
Vol.4, No.2, pp. 6-19, May 2016
___Published by European Centre for Research Training and Development UK (www.eajournals.org)
7 ISSN 20535783(Print), ISSN 20535791(online)
in.) and generally between 9.5 mm and 37.5 mm ( 3⁄8 in. and 1½in.). Some natural aggregate
deposits, called pit-run gravel, consist of gravel and sand that can be readily used in concrete
after minimal processing. Aggregates must conform to certain standards for optimum
engineering use i.e. they must be clean, hard, strong, durable particles free of absorbed
chemicals, coatings of clay, and other fine materials in amounts that could affect hydration and
bond of the cement paste (PCA, 2015). Aggregate particles that are friable or capable of being
split are undesirable. Aggregates containing any appreciable amounts of shale or other shaly
rocks, soft and porous materials, Coarse aggregate should be avoided; certain types of chert
should be especially avoided since they have low resistance to weathering and can cause
surface defects such as popouts. Identification of the constituents of an aggregate cannot alone
provide a basis for predicting the behaviour of aggregates in service. Visual inspection will
often disclose weaknesses in coarse aggregates. Service records are invaluable in evaluating
aggregates (Vasarhely and Bobet, 2000).This research discusses cost evaluation in the total
process of aggregate production from extraction through processing.
Classification of Aggregate
According to Zongjin (2014), aggregates can be divided into several categories according to
different criteria.
In accordance with size:
i. Coarse aggregate: Aggregates predominately retained on the No. 4 (4.75 mm) sieve.
For mass concrete, the maximum size can be as large as 150 mm.
ii. Fine aggregate (sand): Aggregates passing No.4 (4.75 mm) sieve and predominately
retained on the No. 200 (75 μm) sieve.
In accordance with sources:
i. Natural aggregates: This kind of aggregate is taken from natural deposits without
changing their nature during the process of production such as crushing and
grinding. Some examples in this category are sand, crushed limestone, and gravel.
ii. Manufactured (synthetic) aggregates: This is a kind of man-made materials
produced as a main product or as an industrial by-product. Examples are blast
furnace slag, lightweight aggregate (e.g. expanded perlite), and heavy weight
aggregates (e.g. iron ore or crushed steel).
In accordance with unit weight
i. Light weight aggregate: This type of aggregate has a unit weight of less than 1120
kg/m3. The corresponding concrete has a bulk density less than 1800 kg/m3.
(Cinder, blast furnace slag, volcanic pumice).
ii. Normal weight aggregate: This type has unit weight of 1520-1680 kg/m3. The
concrete made with this type of aggregate has a bulk density of 2300-2400 kg/m3.
iii. Heavy weight aggregate: This has a unit weight that is greater than 2100 kg/m3. The
bulk density of the corresponding concrete is greater than 3200 kg/m3.
International Journal of Engineering and Advanced Technology Studies
Vol.4, No.2, pp. 6-19, May 2016
___Published by European Centre for Research Training and Development UK (www.eajournals.org)
8 ISSN 20535783(Print), ISSN 20535791(online)
Physical Properties of Aggregates
The physical properties of aggregates refer to the physical structure of the particles that make
up the aggregate.
Absorption, Porosity, and Permeability
The internal pore characteristics are very important properties of aggregates. The size, the
number, and the continuity of the pores through an aggregate particle may affect the strength
of the aggregate, abrasion resistance, surface texture, specific gravity, bonding capabilities, and
resistance to freezing and thawing action (David, 2015). Absorption relates to the particle's
ability to take in a liquid. Porosity is a ratio of the volume of the pores to the total volume of
the particle. Permeability refers to the particle's ability to allow liquids to pass through. If the
rock pores are not connected, a rock may have high porosity and low permeability.
Surface Texture
Surface texture is the pattern and the relative roughness or smoothness of the aggregate particle.
Surface texture plays a big role in developing the bond between an aggregate particle and a
cementing material. A rough surface texture gives the cementing material something to grip,
producing a stronger bond, and thus creating a stronger hot mix asphalt or Portland cement
concrete. Surface texture also affects the workability of hot mix asphalt, the asphalt
requirements of hot mix asphalt, and the water requirements of Portland cement concrete. Some
aggregates may initially have good surface texture, but may polish smooth later under traffic.
These aggregates are unacceptable for final wearing surfaces. Limestone usually falls into this
category. Dolomite does not, in general, when the magnesium content exceeds a minimum
quantity of the material (Balamurali, 2014).
Strength and Elasticity
Strength is a measure of the ability of an aggregate particle to stand up to pulling or crushing
forces. Elasticity measures the "stretch" in a particle. High strength and elasticity are desirable
in aggregate base and surface courses. These qualities minimize the rate of disintegration and
maximize the stability of the compacted material. The best results for Portland cement concrete
may be obtained by compromising between high and low strength, and elasticity. This permits
volumetric changes to take place more uniformly throughout the concrete.
Density And Specific Gravity
Density is the weight per unit volume of a substance. Specific gravity is the ratio of the density
of the substance to the density of water.
Definitions
Density (D): weight per unit volume (excluding the pores inside a single aggregate)
D = 𝑊𝑒𝑖𝑔ℎ𝑡
𝑉𝑠𝑜𝑙𝑖𝑑 (1)
Bulk density: the volume includes the pores inside a single aggregate.
BD = 𝑊𝑒𝑖𝑔ℎ𝑡
𝑉𝑠𝑜𝑙𝑖𝑑+𝑉𝑝𝑜𝑟𝑒𝑠 (2)
International Journal of Engineering and Advanced Technology Studies
Vol.4, No.2, pp. 6-19, May 2016
___Published by European Centre for Research Training and Development UK (www.eajournals.org)
9 ISSN 20535783(Print), ISSN 20535791(online)
BD can be either BDSSD or BDAD according to the moisture condition of aggregate when it is
weighed.
Specific gravity (SG): mass of a given substance divided by unit mass of an equal volume of
water (it is the density ratio of a substance to water). As an example, specific gravity
information about a particular aggregate helps in determining the amount of asphalt needed in
the hot mix asphalt. If an aggregate is highly absorptive, the aggregate continues to absorb
asphalt, after initial mixing at the plant, until the mix cools down completely. This process
leaves less asphalt for bonding purposes; therefore, a more porous aggregate requires more
asphalt than a less porous aggregate. The porosity of the aggregate may be taken into
consideration in determining the amount of asphalt required by applying the three types of
specific gravity measurements.
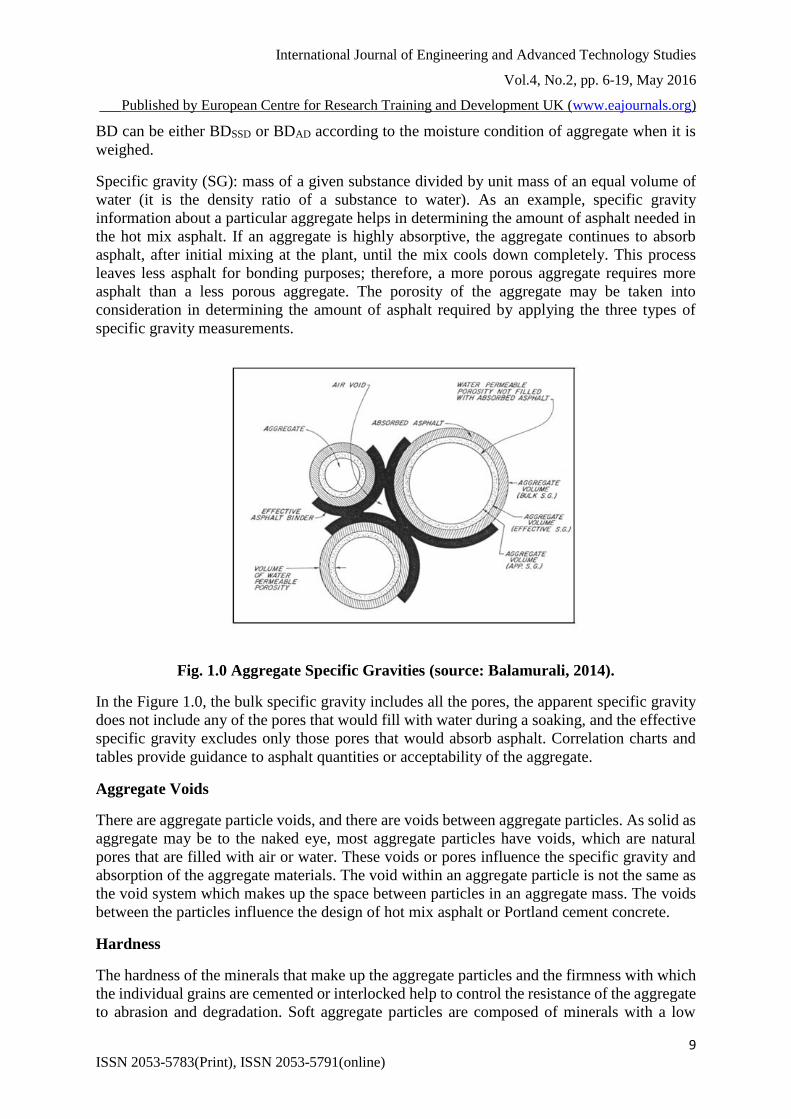
Fig. 1.0 Aggregate Specific Gravities (source: Balamurali, 2014).
In the Figure 1.0, the bulk specific gravity includes all the pores, the apparent specific gravity
does not include any of the pores that would fill with water during a soaking, and the effective
specific gravity excludes only those pores that would absorb asphalt. Correlation charts and
tables provide guidance to asphalt quantities or acceptability of the aggregate.
Aggregate Voids
There are aggregate particle voids, and there are voids between aggregate particles. As solid as
aggregate may be to the naked eye, most aggregate particles have voids, which are natural
pores that are filled with air or water. These voids or pores influence the specific gravity and
absorption of the aggregate materials. The void within an aggregate particle is not the same as
the void system which makes up the space between particles in an aggregate mass. The voids
between the particles influence the design of hot mix asphalt or Portland cement concrete.
Hardness
The hardness of the minerals that make up the aggregate particles and the firmness with which
the individual grains are cemented or interlocked help to control the resistance of the aggregate
to abrasion and degradation. Soft aggregate particles are composed of minerals with a low
International Journal of Engineering and Advanced Technology Studies
Vol.4, No.2, pp. 6-19, May 2016
___Published by European Centre for Research Training and Development UK (www.eajournals.org)
10 ISSN 20535783(Print), ISSN 20535791(online)
degree of hardness. Weak particles have poor cementation. None of this type is acceptable. The
Mohs Hardness Scale is frequently used for determination of mineral hardness. Although there
is no recognizable specification or requirement which pertains to Mohs Hardness Scale, the
interpretation, concept, and use of this scale is useful for the field identification of potentially
inferior aggregates (Neville, 2011).
Stages Involved In Aggregate Production
Aggregate production involve various stages which include the development of the quarry by
taken the coordinate of the site, stripping, drilling, stemming, blasting (its accessories),
mucking and loading, haulage and crushing. These stages also refer to unit of operation of
mining. The sequence of unit of operation utilized to accomplish mine exploitation is called
the cycle operation.
Development and Planning of the Mine
Mine development involves the excavations needed to establish the infrastructure necessary
for stope production and to prepare for the future continuity of operations.
Stripping Operation
As a first step, a producer is required to designate a detailed stripping procedure for each and
every deposit that is mined. The overburden is stripped with an excavator, and is placed in large
dump trucks known as haul trucks. Haul trucks are designed for earth moving across rugged
environment. Overburden is a waste rock consisting of consolidated and unconsolidated
material that must be removed to expose the underlying ore body. It is desirable to remove as
little overburden as possible in order to access the ore of interest.
Drilling Operation
Drilling can be define as an artificial creation of cavity or hole in an ore body for samples
collection for further analysis, for casing sinking and for placement explosive. Drilling is very
important in mining and it determines the cost of production. Some factors influencing the rate
of bit penetration includes: type and size of drill, bit size; bit type and condition, drill mounting,
torque capacity, compressor pressure, flushing medium, lubrication, thrust, rotational speed,
rock type and structure. Drilling is of different types:
i. Primary Drilling: This is done on insitu rock with drilling machine of different type
sach as ROC 601, ROC 301, CM 348, which are powered by compressors. Primary
drilling must give a definite operation in order to carry out primary blasting such as
diameter of the holes, bench height of the rock, burden and spacing on the rock.
ii. Secondary Drilling: This is done on already fragmented rock of larger sizes
(boulders) for purpose of size reduction by the means of secondary blasting. It is
carried out by using a Jack Hammer, which is powered by a pneumatic compressor.
It is also give room for proper haulage to the crushing.
Blasting Operation
Blasting is defined as a fragmentation of rock by means of explosives and its accessories for
the subsequent extraction or process (Sushil, 1997). After the blast holes have been drilled to
the requirement, the next operation is to the charge the holes with explosives and blast. The
International Journal of Engineering and Advanced Technology Studies
Vol.4, No.2, pp. 6-19, May 2016
___Published by European Centre for Research Training and Development UK (www.eajournals.org)
11 ISSN 20535783(Print), ISSN 20535791(online)
size of the drilling bit is a major factor in the choice of explosive to be used. Both the low
explosives and high explosives are used. The low explosive used is ANFO and the high
explosive used is Gelatine dynamite. Increasing the quantity of fuel added to the ammonium
nitrate will result into red fumes being produced after blasting. So, 96% of ammonium nitrate
and 4% of diesel oil are mixed together to give the required ANFO. In other words, for every
25kg of explosive, 1.75 litres of diesel oil is added, Use a long bamboo rod to through the drill
holes of about 6m depth. Make primer cartridge (i.e. explosive cartridge primer cord). Do the
primer charge and insert an explosive cartridge primer into each drilled hole. Load the holes
after primer charge with high explosives and ANFO. Stem/seal the holes with granite chips.
Connect all the charged holes together (either in series or parallel). Insert MS Delay detonator
in between each holes connected and clipped plain detonator with shock tube. Insert shock
tubes into the Blasting Machine or Exploder and fire. Escape from danger area to safe place,
500m away using a fast moving vehicle. After the blast, go back and check the outcome
(result).The quantity of explosive is also function of the drilling depth and rock mass (Sharma,
2012).
Loading
After blasting operation has been carried out, the fragmented rock materials are usually loaded
into dump trucks and tippers. Both front – end loader and back – hoe shovel are used for loading
fragmented rock materials into dump trucks for haulage. The back-hoe shovel (crawler
mounted) is capable of removing hanging rocks on the quarry face.
Haulage of Material
The fragmented rocks are transported by haulage (primarily horizontal movement) to the
primary crusher. As the blasting cannot be absolutely perfect, boulders bigger than the normal
requirement (1.5m) are kept aside for secondary blasting so that they can pass through the
hopper to the jaw crusher.
Crushing Process
Crushing is the process of reducing blasted rocks into smaller sizes needed for use such as in
construction of bridges, tunnels, roads and building activities (Hadin, 2001).Crushing of
fragmented rocks are unit of communition and particle sizing. The crushing plant is an
assemblage of primary crusher and secondary crusher. The following product sizes (granite)
can be obtained by methods of screening immediately after crushing:
Table 1.0: Different Aggregate Sizes by Method of Screening
¾ inch down
(oversize)
32 – 70mm
¾ inch 19 – 25mm
½ inch 5 – 19mm
Stone dust 0 – 5mm
International Journal of Engineering and Advanced Technology Studies
Vol.4, No.2, pp. 6-19, May 2016
___Published by European Centre for Research Training and Development UK (www.eajournals.org)
12 ISSN 20535783(Print), ISSN 20535791(online)
Cost Estimating
An estimate is a judgment, forecast or prediction. A cost therefore is a judgment or opinion of
the cost of a process, project, product or services. It is a prediction or forecast of what a work
output or work activity will cost (Rodney, 1991). According to the Society of Cost Estimating
and Analysis (SCEA), estimating is the art of approximating the probable worth or cost of an
activity based on information available at that time. Cost finding is the process by which the
company obtain estimates of the costs of producing a product, providing a service, performing
a function, or operating a department.
The most fully developed methods of costs finding are used to estimate the costs that have been
incurred in a factory to manufacture a specific products. The simplest of these methods is
known as process costing. In this method, the accountant first accumulates the costs of each
production operation or process for a specified time frame. This sum is then restated as an
average by dividing the total costs of production by total output in the period. The process
costing can be used whenever the output of an individual processes is reasonably uniform or
homogenous, as in cement manufacturing, flour milling, other relatively continuous production
processes.
The second method is job - order costing, which is used when individual production centres
or department work on a variety of products rather than just one during a typical time period.
Two categories of factory cost are recognised under this method: prime cost and factory
overhead costs. Prime costs are those that can be traced directly to a specific batch, or job lot
of products (Pava, 2014). These are the direct labour and direct materials cost of production.
Overhead costs, on the other hand, are those that can be traced only to the departmental
operations or to the factory as a whole and not to individual job – orders the salary of a
departmental operations or to the factory as a whole and not to individual job – orders the salary
of a departmental supervisor is an example of an overhead cost. Direct materials and labour
costs are recorded on the job – order cost sheets for each job. Although not traceable to
individual jobs, overhead costs are generally assigned to them by means of overhead rates i.e.
the ratio of total overhead costs to total production volume for a time given period (Robert and
Lesile, 2000).
The third method of cost finding, activity-based costing, is based on the fact that many costs
are driven by factors other than product volume. The first task is to identify the activities that
drive costs. The next step is to estimate the costs that are driven by each activity and to state
them as averages per unit of activity. Management can use these averages to guide its efforts
to reduce costs.
METHODOLOGY
Description of the Study Areas
The two quarries sites used as a case study in this research lies between 6°N - 7°N, and 4°E -
6°E at an altitude of between 0 to 1365m. QuarryA is sited in Ijare town while Quarry B is
sited in Iju -Itaogbolu(along Itaogbolu – Akure road) all in Ondo State. Both quarries are sited
International Journal of Engineering and Advanced Technology Studies
Vol.4, No.2, pp. 6-19, May 2016
___Published by European Centre for Research Training and Development UK (www.eajournals.org)
13 ISSN 20535783(Print), ISSN 20535791(online)
in towns that are closed to the state capital – Akure. The stones are reputed to have compressive
strength of between 164 and 173MPa while the tensile strength is between 10.78 and 12MPa.
Fig 2: Map of Ondo State (Google Map 2015).
International Journal of Engineering and Advanced Technology Studies
Vol.4, No.2, pp. 6-19, May 2016
___Published by European Centre for Research Training and Development UK (www.eajournals.org)
14 ISSN 20535783(Print), ISSN 20535791(online)
Data Collection
Questionnaire were administered to the two quarries to acquire necessary data such as
personnel, production schedule, production rate, production cost, remuneration/emoluments
with their salary and so on.
Data Analysis and Presentation
Data obtained from the company were critically analysed, examined and processed. Statistical
analysis were carried out on the data and presented with the use of some statistical tools. These
tools include the following: Bar chart, Pie Chart, Analysis of variance, Correlation analysis.
All these methods are the most appropriate because the information gathered from respondent
deals with qualitative product produced in tons/annum and sales made in Naira and cost of
production.
Definition of some Economic Terms
(a) Total Revenue: This denotes the total productivity of ore reserve in sales of output.
(b) Total Capital Cost: This is the total investment or amount of money needed to finance the
purchasing of capital goods such as factory machines and equipment.
(c) Total Fixed Cost: This is a type of cost that does not vary with the quantity produced and
in short run does not alter with the changes in the amount produced.
(d) Total Variable Cost: On the other hand, this cost varies with changes in the level of output.
These include raw material expenses, labour wages, drilling and blasting costs etc.
(e) Marginal Cost: This is the cost incurred as additional cost to total cost in producing one
more unit of output. It first decline as production expands but ultimately begin to rise.
(f) Marginal Revenue: This is addition made to the total revenue by sale of one more unit of
output.
(g) Production Cost: This is the cost incurred during the production. It varies significantly
depending on the available inputs needed for production to take place. For production to take
place, money is expended on the following:
i. Labour/ salary of employees;
ii. Energy costs, fuel consumption, explosive and power supply;
iii. Equipment costs, repairs and maintenance costs;
iv. Miscellaneous costs and;
v. Government revenue, taxes and royalty.
(h) Total Cost: This is the total expenses incurred in reaching a particular level of output.
(i) Taxation or Government revenue: It is paid to boost local government, state and federal
government depending on what demand e.g. federal ministry of mines and steel development
takes royalty.
International Journal of Engineering and Advanced Technology Studies
Vol.4, No.2, pp. 6-19, May 2016
___Published by European Centre for Research Training and Development UK (www.eajournals.org)
15 ISSN 20535783(Print), ISSN 20535791(online)
Cost Estimate and Profit/Loss Calculation
Let Overall cost = 𝑃𝑟𝑜𝑑𝑢𝑐𝑡𝑖𝑜𝑛 𝑐𝑜𝑠𝑡 + 𝑔𝑜𝑣𝑒𝑟𝑛𝑒𝑚𝑛𝑡 𝑟𝑒𝑣𝑒𝑛𝑢𝑒 ……...(3)
Cost per tonne = 𝑝𝑟𝑜𝑑𝑢𝑐𝑡𝑖𝑜𝑛 𝑐𝑜𝑠𝑡
𝑇𝑜𝑡𝑎𝑙 𝑜𝑢𝑡𝑝𝑢𝑡…………………………………………..…(4)
Total revenue = 𝑜𝑢𝑡𝑝𝑢𝑡 𝑝𝑒𝑟 𝑎𝑛𝑛𝑢𝑚 × 𝑠𝑒𝑙𝑙𝑖𝑛𝑔 𝑝𝑟𝑖𝑐𝑒 𝑝𝑒𝑟 𝑡𝑜𝑛 ………(5)
Profit = 𝑡𝑜𝑡𝑎𝑙𝑟𝑒𝑣𝑒𝑛𝑢𝑒 − 𝑝𝑟𝑜𝑑𝑢𝑐𝑡𝑖𝑜𝑛𝑐𝑜𝑠𝑡………………………………. (6)
Estimation Techniques
Average Operating Cost
Total cost realized from ton produce per day
Profit = Revenue – Production Cost
To calculate for the estimation and profit, the following are required; capital, life span, cost
per year, production cost, cost per ton, revenue and profit.
RESULTS
The data collected were analysed and presented in the tables below.
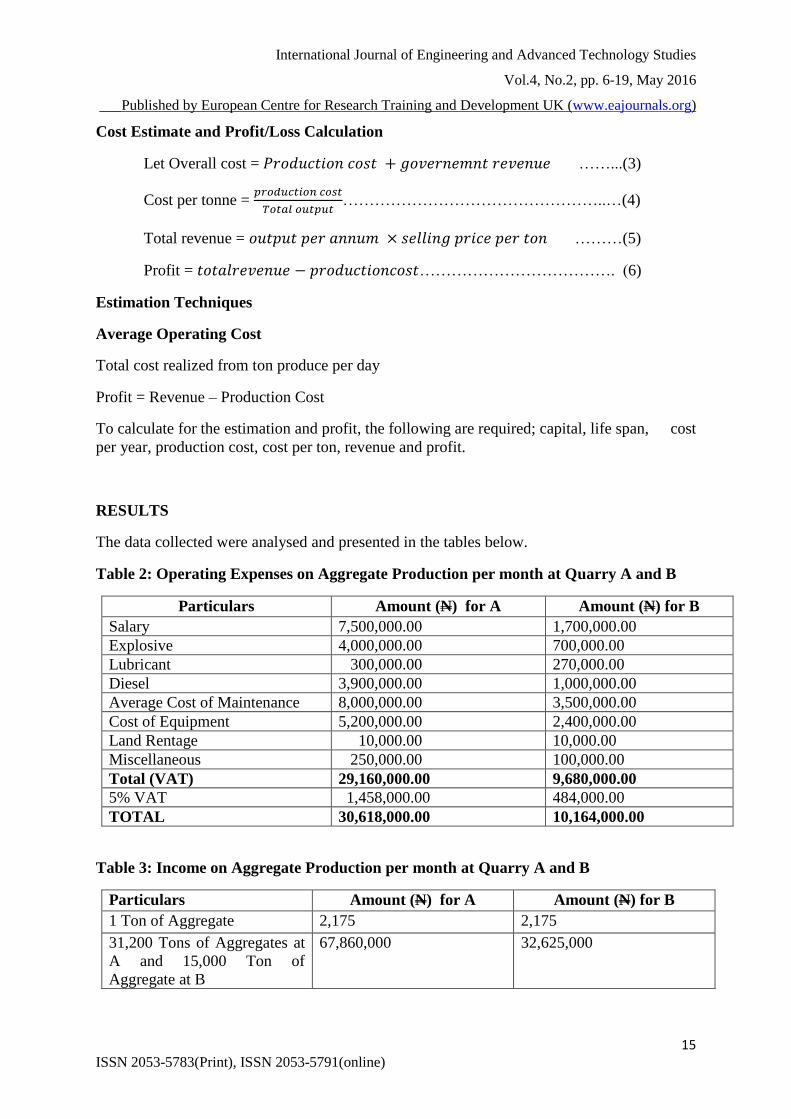
Table 2: Operating Expenses on Aggregate Production per month at Quarry A and B
Particulars Amount (N) for A Amount (N) for B
Salary 7,500,000.00 1,700,000.00
Explosive 4,000,000.00 700,000.00
Lubricant 300,000.00 270,000.00
Diesel 3,900,000.00 1,000,000.00
Average Cost of Maintenance 8,000,000.00 3,500,000.00
Cost of Equipment 5,200,000.00 2,400,000.00
Land Rentage 10,000.00 10,000.00
Miscellaneous 250,000.00 100,000.00
Total (VAT) 29,160,000.00 9,680,000.00
5% VAT 1,458,000.00 484,000.00
TOTAL 30,618,000.00 10,164,000.00
Table 3: Income on Aggregate Production per month at Quarry A and B
Particulars Amount (N) for A Amount (N) for B
1 Ton of Aggregate 2,175 2,175
31,200 Tons of Aggregates at
A and 15,000 Ton of
Aggregate at B
67,860,000 32,625,000
International Journal of Engineering and Advanced Technology Studies
Vol.4, No.2, pp. 6-19, May 2016
___Published by European Centre for Research Training and Development UK (www.eajournals.org)
16 ISSN 20535783(Print), ISSN 20535791(online)
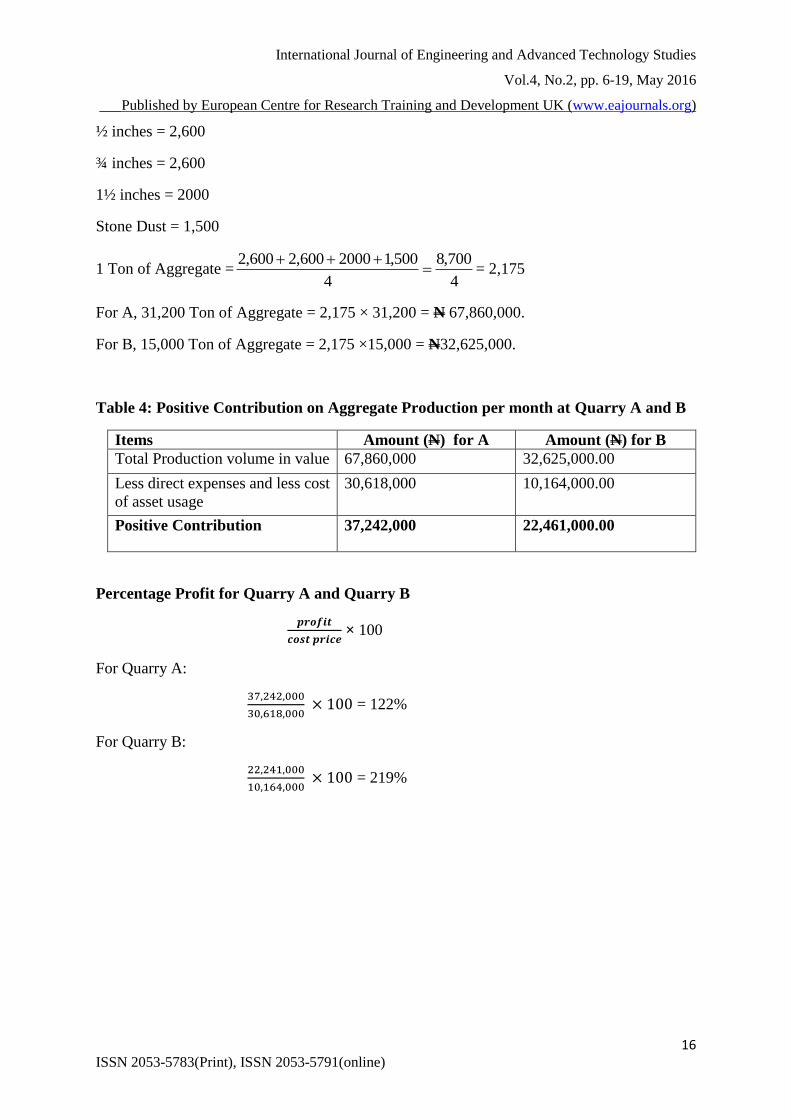
½ inches = 2,600
¾ inches = 2,600
1½ inches = 2000
Stone Dust = 1,500
1 Ton of Aggregate =4
700,8
4
500,12000600,2600,2
= 2,175
For A, 31,200 Ton of Aggregate = 2,175 × 31,200 = N 67,860,000.
For B, 15,000 Ton of Aggregate = 2,175 ×15,000 = N32,625,000.
Table 4: Positive Contribution on Aggregate Production per month at Quarry A and B
Items Amount (N) for A Amount (N) for B
Total Production volume in value 67,860,000 32,625,000.00
Less direct expenses and less cost
of asset usage
30,618,000 10,164,000.00
Positive Contribution 37,242,000 22,461,000.00
Percentage Profit for Quarry A and Quarry B
𝒑𝒓𝒐𝒇𝒊𝒕
𝒄𝒐𝒔𝒕 𝒑𝒓𝒊𝒄𝒆 × 100
For Quarry A:
37,242,000
30,618,000 × 100 = 122%
For Quarry B:
22,241,000
10,164,000 × 100 = 219%
International Journal of Engineering and Advanced Technology Studies
Vol.4, No.2, pp. 6-19, May 2016
___Published by European Centre for Research Training and Development UK (www.eajournals.org)
17 ISSN 20535783(Print), ISSN 20535791(online)
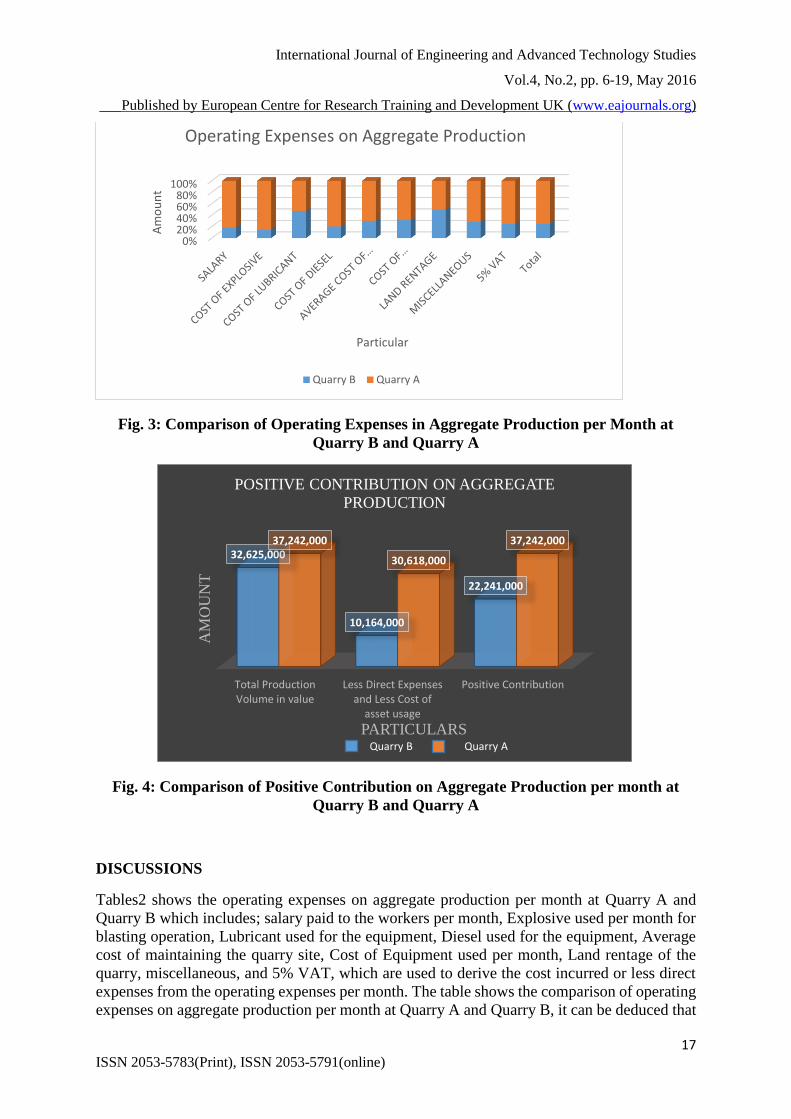
Fig. 3: Comparison of Operating Expenses in Aggregate Production per Month at
Quarry B and Quarry A
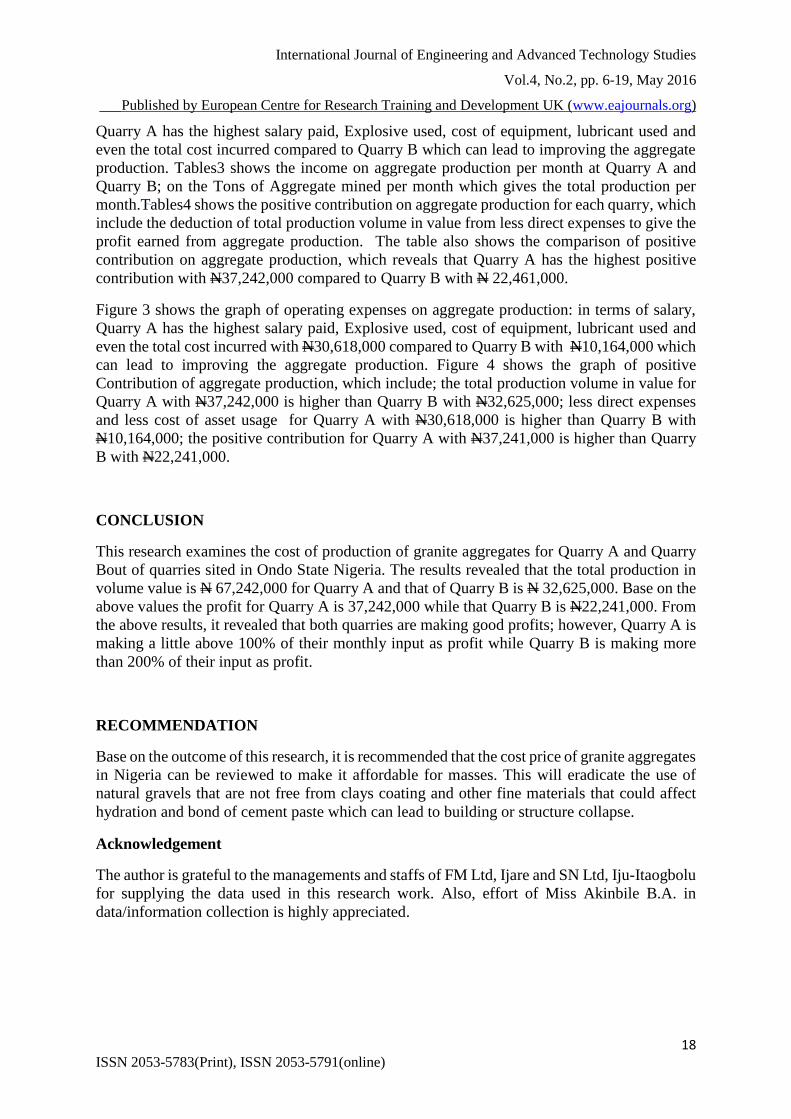
Fig. 4: Comparison of Positive Contribution on Aggregate Production per month at
Quarry B and Quarry A
DISCUSSIONS
Tables2 shows the operating expenses on aggregate production per month at Quarry A and
Quarry B which includes; salary paid to the workers per month, Explosive used per month for
blasting operation, Lubricant used for the equipment, Diesel used for the equipment, Average
cost of maintaining the quarry site, Cost of Equipment used per month, Land rentage of the
quarry, miscellaneous, and 5% VAT, which are used to derive the cost incurred or less direct
expenses from the operating expenses per month. The table shows the comparison of operating
expenses on aggregate production per month at Quarry A and Quarry B, it can be deduced that
0%20%40%60%80%
100%
Am
ou
nt
Particular
Operating Expenses on Aggregate Production
Quarry B Quarry A
Total ProductionVolume in value
Less Direct Expensesand Less Cost of
asset usage
Positive Contribution
32,625,000
10,164,000
22,241,000
37,242,000
30,618,000
37,242,000
AM
OU
NT
PARTICULARS
POSITIVE CONTRIBUTION ON AGGREGATE
PRODUCTION
Quarry AQuarry B
International Journal of Engineering and Advanced Technology Studies
Vol.4, No.2, pp. 6-19, May 2016
___Published by European Centre for Research Training and Development UK (www.eajournals.org)
18 ISSN 20535783(Print), ISSN 20535791(online)
Quarry A has the highest salary paid, Explosive used, cost of equipment, lubricant used and
even the total cost incurred compared to Quarry B which can lead to improving the aggregate
production. Tables3 shows the income on aggregate production per month at Quarry A and
Quarry B; on the Tons of Aggregate mined per month which gives the total production per
month.Tables4 shows the positive contribution on aggregate production for each quarry, which
include the deduction of total production volume in value from less direct expenses to give the
profit earned from aggregate production. The table also shows the comparison of positive
contribution on aggregate production, which reveals that Quarry A has the highest positive
contribution with N37,242,000 compared to Quarry B with N 22,461,000.
Figure 3 shows the graph of operating expenses on aggregate production: in terms of salary,
Quarry A has the highest salary paid, Explosive used, cost of equipment, lubricant used and
even the total cost incurred with N30,618,000 compared to Quarry B with N10,164,000 which
can lead to improving the aggregate production. Figure 4 shows the graph of positive
Contribution of aggregate production, which include; the total production volume in value for
Quarry A with N37,242,000 is higher than Quarry B with N32,625,000; less direct expenses
and less cost of asset usage for Quarry A with N30,618,000 is higher than Quarry B with
N10,164,000; the positive contribution for Quarry A with N37,241,000 is higher than Quarry
B with N22,241,000.
CONCLUSION
This research examines the cost of production of granite aggregates for Quarry A and Quarry
Bout of quarries sited in Ondo State Nigeria. The results revealed that the total production in
volume value is N 67,242,000 for Quarry A and that of Quarry B is N 32,625,000. Base on the
above values the profit for Quarry A is 37,242,000 while that Quarry B is N22,241,000. From
the above results, it revealed that both quarries are making good profits; however, Quarry A is
making a little above 100% of their monthly input as profit while Quarry B is making more
than 200% of their input as profit.
RECOMMENDATION
Base on the outcome of this research, it is recommended that the cost price of granite aggregates
in Nigeria can be reviewed to make it affordable for masses. This will eradicate the use of
natural gravels that are not free from clays coating and other fine materials that could affect
hydration and bond of cement paste which can lead to building or structure collapse.
Acknowledgement
The author is grateful to the managements and staffs of FM Ltd, Ijare and SN Ltd, Iju-Itaogbolu
for supplying the data used in this research work. Also, effort of Miss Akinbile B.A. in
data/information collection is highly appreciated.
International Journal of Engineering and Advanced Technology Studies
Vol.4, No.2, pp. 6-19, May 2016
___Published by European Centre for Research Training and Development UK (www.eajournals.org)
19 ISSN 20535783(Print), ISSN 20535791(online)
REFERENCES
Ashmole, I. and Motloung, M. (2008): Dimension stone: The latest trends in exploration and
production technology. The South African Institute of Mining and Metallurgy (published
conference work – surface mining), pp. 36 - 70
Balamurali, A. (2014):Effect of Specific Gravity on Aggregate Varies the Weight Of Concrete
Cube. SSRG International Journal of Civil Engineering (SSRG-IJCE) – volume1 issue 3
pp. 1 - 9
Bamigboye, G.O., Ede, A.N., Umana, U.E., Odewumi, T.O. and Olowu, O.A. (2016):
Assessment of strength characteristics of concrete made from locally sourced gravel
aggregate from South-South Nigeria. British Journal of Applied Science &Technology
BJAST 12(5): 1-10.
David, W. (2015):Physical quality requirements for aggregates used in asphalt plant. Available
online at: https://www.linkedin.com/pulse/physical-quality-requirements-aggregates-
used-asphalt-david-wang?forceNoSplash=true
Guimaraes, M.S., Valdes, J.R., Palomino, A.M. and Santamarina, J.C. (2007): Aggregate
production – fines generation during rock crushing. International Journal of Mineral
Processing, vol. 81, issue 4; pp. 237 – 247.
Hardin B.O, (2001): Crushing of Soil Particles, ASCE Journal of Geotechnical and Geo-
environmental Engineering 111 (10), pp. 1177 – 1192.
Neville, A.M. (2011): Properties of concrete. 5th Edition, Pearson Education Limited
Edinburgh Gate, Harlow, Essex CM20 2JE, England. 2866 p.
Pava, M.L. (2014): Managerial accounting. Available online at:
http://www.britannica.com/topic/accounting/Managerial-accounting
Portland Cement Association - PCA, (2015): Cement and concrete basics – aggregates.
Available online at: www.cement.org
Robert R. and Lesile G.E. (2000): Mining Industry and Developing Countries, 2nd Edition
World Bank Research Publication, USA, ppg 314 – 326.
Rodney, D.S. (1991): Cost estimating; 2 edition, John Wiley and Son Inc. New York. 384 p.
Sharma, P.D. (2012): Rock breakage and blast design considerations in open pit. Available
online at: https://miningandblasting.wordpress.com/category/explosives/
Sushil, B. (1997): Engineering rock blasting operations. A.A. Balkema Publishers, old post
road, Brookfield, VT 05036, USA. 195p
Vasarhelyi B, and Bobet A, (2000): Modeling of Crack Initiation, Propagation and Coalescence
in Uniaxial compression, Rock Mechanics and Rock Engineering 33 (2), pp. 119 – 139.
William, H. (2012): Aggregate resources Act. Ontario, Canada. Available online at:
https://www.ontario.ca/laws
Zongjin L. (2014): Lecture note on Construction materials – Aggregate. Available online at:
http://www.readbag.com/teaching-ust-hk-civl111-chapter3.