Cost Estimation and Engineering Economics - Dave...
45
Cost Estimation and Engineering Economics ENAE 483/788D - Principles of Space Systems Design U N I V E R S I T Y O F MARYLAND Cost Estimation and Engineering Economics • Cost Sources • Vehicle-level Costing Heuristics • Learning Curves • 2 Case Studies • Inflation • Cost Discounting • Return on Investment • Cost/Benefit Ratios • Life Cycle Costing • Cost Spreading 1 © 2012 David L. Akin - All rights reserved http://spacecraft.ssl.umd.edu
Transcript of Cost Estimation and Engineering Economics - Dave...
Cost Estimation and Engineering EconomicsENAE 483/788D - Principles of Space Systems Design
U N I V E R S I T Y O FMARYLAND
Cost Estimation and Engineering Economics
• Cost Sources• Vehicle-level Costing Heuristics• Learning Curves• 2 Case Studies• Inflation• Cost Discounting• Return on Investment• Cost/Benefit Ratios• Life Cycle Costing• Cost Spreading
1
© 2012 David L. Akin - All rights reservedhttp://spacecraft.ssl.umd.edu
Cost Estimation and Engineering EconomicsENAE 483/788D - Principles of Space Systems Design
U N I V E R S I T Y O FMARYLAND
Cost Analysis
• Direct Costs - directly related to designing, testing, building, and operating the system
• Indirect Costs - required to do business, but not directly associated with development or operations– Management– Profit– Non-operational facilities– Overhead
2
Cost Estimation and Engineering EconomicsENAE 483/788D - Principles of Space Systems Design
U N I V E R S I T Y O FMARYLAND
Direct Cost Breakdown
• Non-recurring costs - only incurred once in program, such as design
• Recurring costs - reoccur throughout the life of the program– Per vehicle– Per flight– Per year
3
Cost Estimation and Engineering EconomicsENAE 483/788D - Principles of Space Systems Design
U N I V E R S I T Y O FMARYLAND
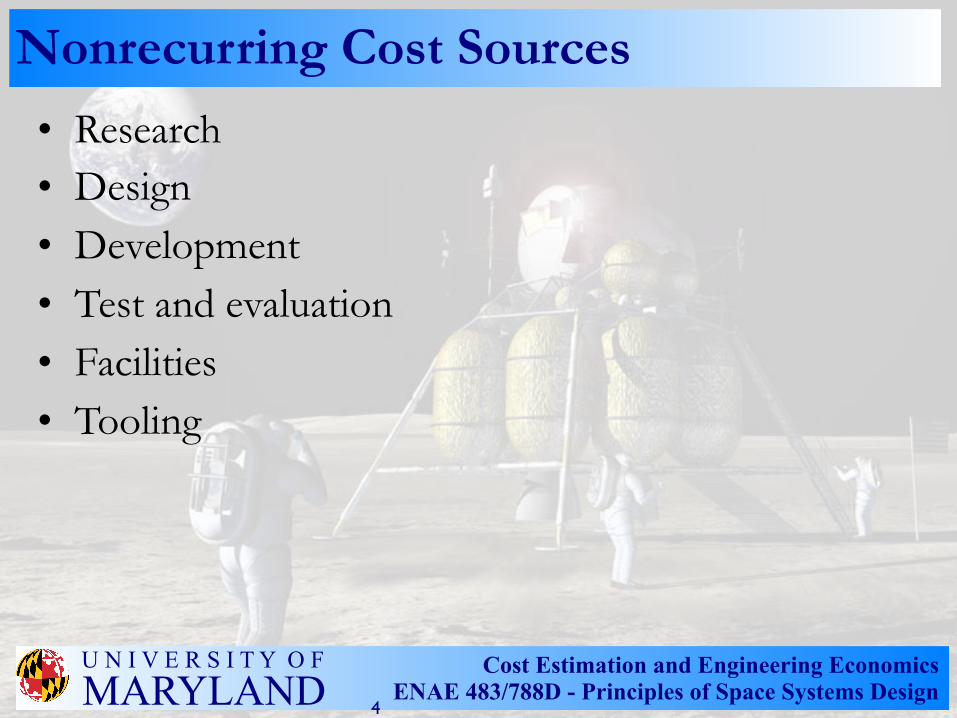
Nonrecurring Cost Sources
• Research• Design• Development• Test and evaluation• Facilities• Tooling
4
Cost Estimation and Engineering EconomicsENAE 483/788D - Principles of Space Systems Design
U N I V E R S I T Y O FMARYLAND
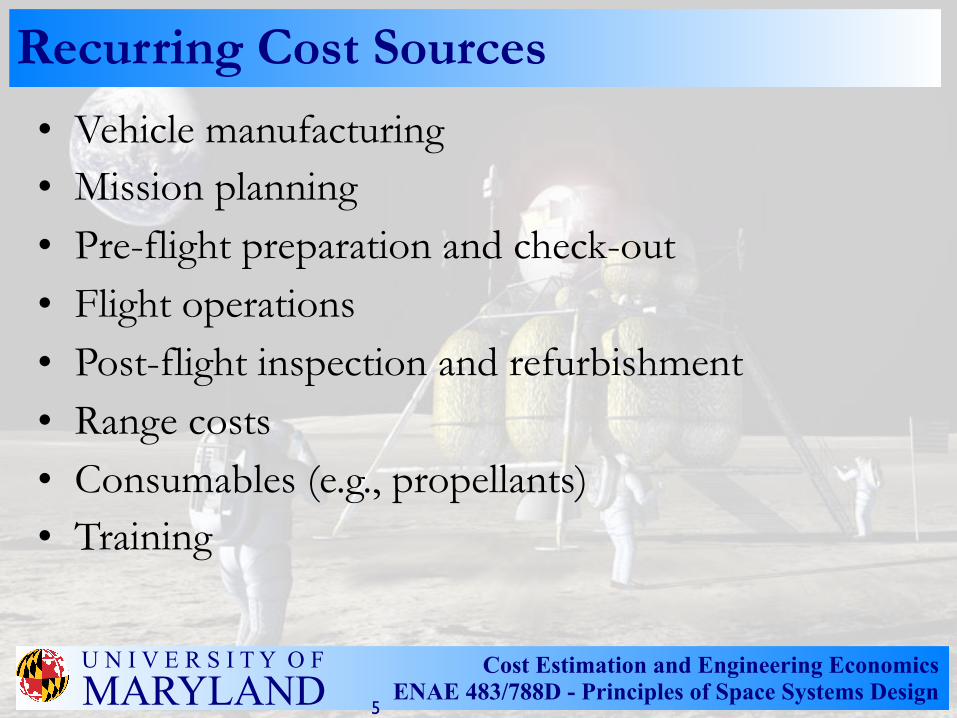
Recurring Cost Sources
• Vehicle manufacturing• Mission planning• Pre-flight preparation and check-out• Flight operations• Post-flight inspection and refurbishment• Range costs• Consumables (e.g., propellants)• Training
5
Cost Estimation and Engineering EconomicsENAE 483/788D - Principles of Space Systems Design
U N I V E R S I T Y O FMARYLAND
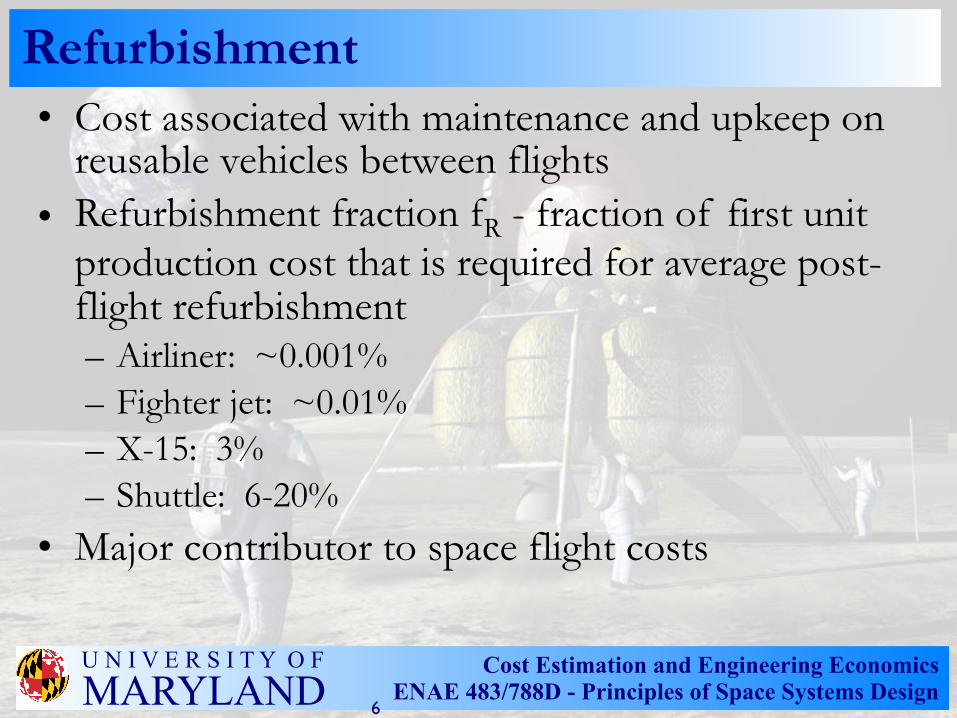
Refurbishment• Cost associated with maintenance and upkeep on
reusable vehicles between flights• Refurbishment fraction fR - fraction of first unit
production cost that is required for average post-flight refurbishment– Airliner: ~0.001%– Fighter jet: ~0.01%– X-15: 3%– Shuttle: 6-20%
• Major contributor to space flight costs
6
Cost Estimation and Engineering EconomicsENAE 483/788D - Principles of Space Systems Design
U N I V E R S I T Y O FMARYLAND
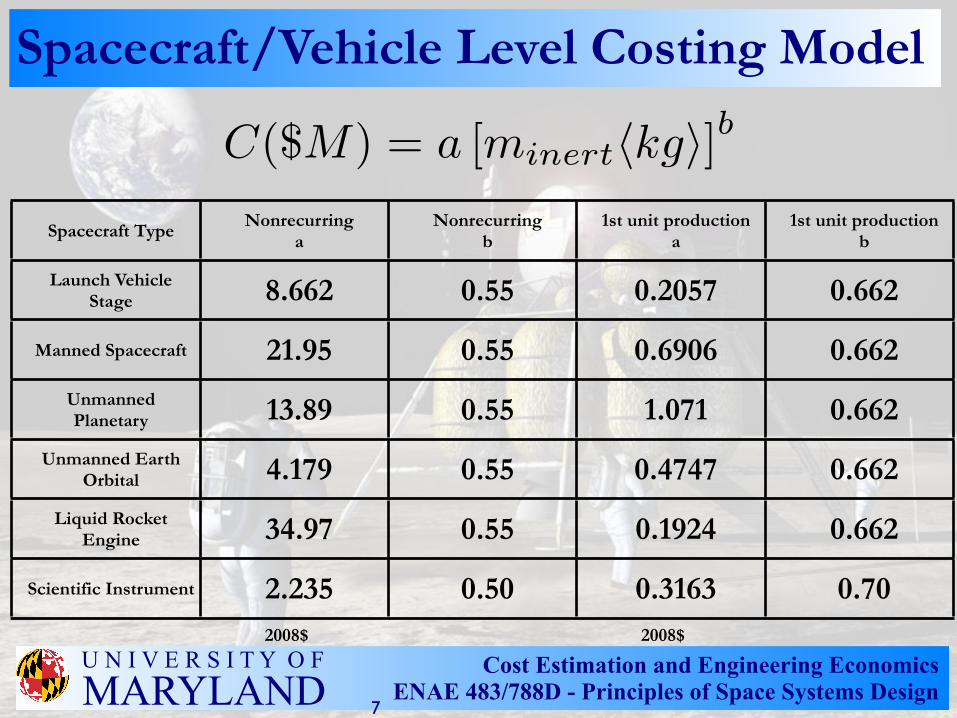
Spacecraft/Vehicle Level Costing Model
Spacecraft Type Nonrecurringa
Nonrecurringb
1st unit productiona
1st unit productionb
Launch Vehicle Stage 8.662 0.55 0.2057 0.662
Manned Spacecraft 21.95 0.55 0.6906 0.662Unmanned Planetary 13.89 0.55 1.071 0.662
Unmanned Earth Orbital 4.179 0.55 0.4747 0.662
Liquid Rocket Engine 34.97 0.55 0.1924 0.662
Scientific Instrument 2.235 0.50 0.3163 0.702008$ 2008$
7
C($M) = a [minert�kg�]b
Cost Estimation and Engineering EconomicsENAE 483/788D - Principles of Space Systems Design
U N I V E R S I T Y O FMARYLAND
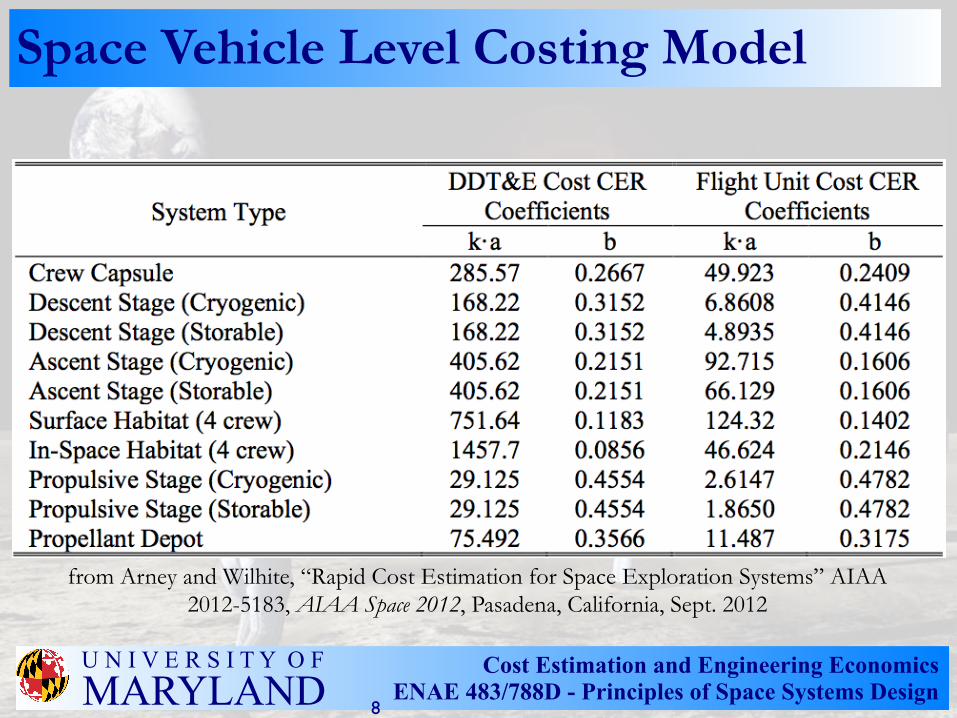
Space Vehicle Level Costing Model
8
from Arney and Wilhite, “Rapid Cost Estimation for Space Exploration Systems” AIAA 2012-5183, AIAA Space 2012, Pasadena, California, Sept. 2012
Cost Estimation and Engineering EconomicsENAE 483/788D - Principles of Space Systems Design
U N I V E R S I T Y O FMARYLAND
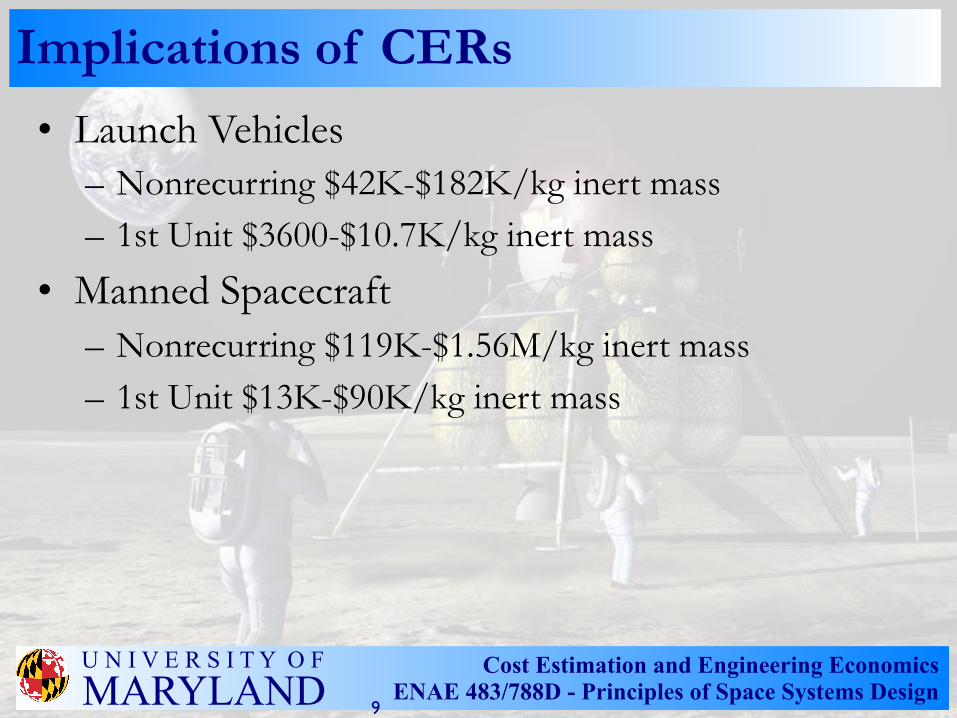
Implications of CERs
• Launch Vehicles– Nonrecurring $42K-$182K/kg inert mass– 1st Unit $3600-$10.7K/kg inert mass
• Manned Spacecraft– Nonrecurring $119K-$1.56M/kg inert mass– 1st Unit $13K-$90K/kg inert mass
9
Cost Estimation and Engineering EconomicsENAE 483/788D - Principles of Space Systems Design
U N I V E R S I T Y O FMARYLAND
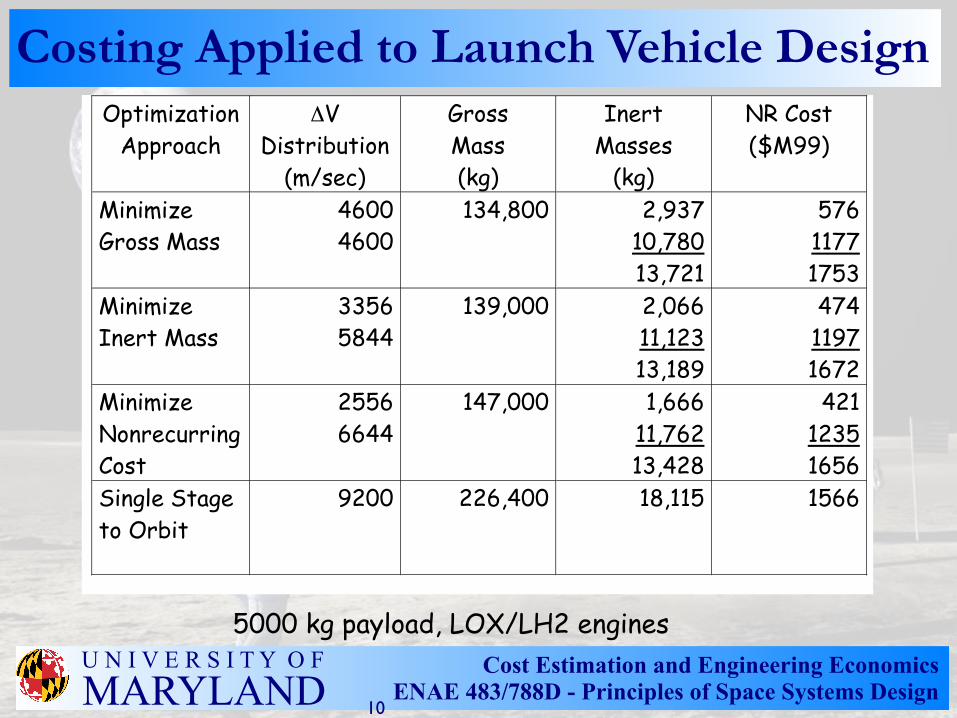
Costing Applied to Launch Vehicle DesignOptimization
ApproachΔV
Distribution(m/sec)
GrossMass(kg)
InertMasses
(kg)
NR Cost($M99)
MinimizeGross Mass
46004600
134,800 2,93710,78013,721
57611771753
MinimizeInert Mass
33565844
139,000 2,06611,12313,189
47411971672
MinimizeNonrecurringCost
25566644
147,000 1,66611,76213,428
42112351656
Single Stageto Orbit
9200 226,400 18,115 1566
5000 kg payload, LOX/LH2 engines
10
Cost Estimation and Engineering EconomicsENAE 483/788D - Principles of Space Systems Design
U N I V E R S I T Y O FMARYLAND
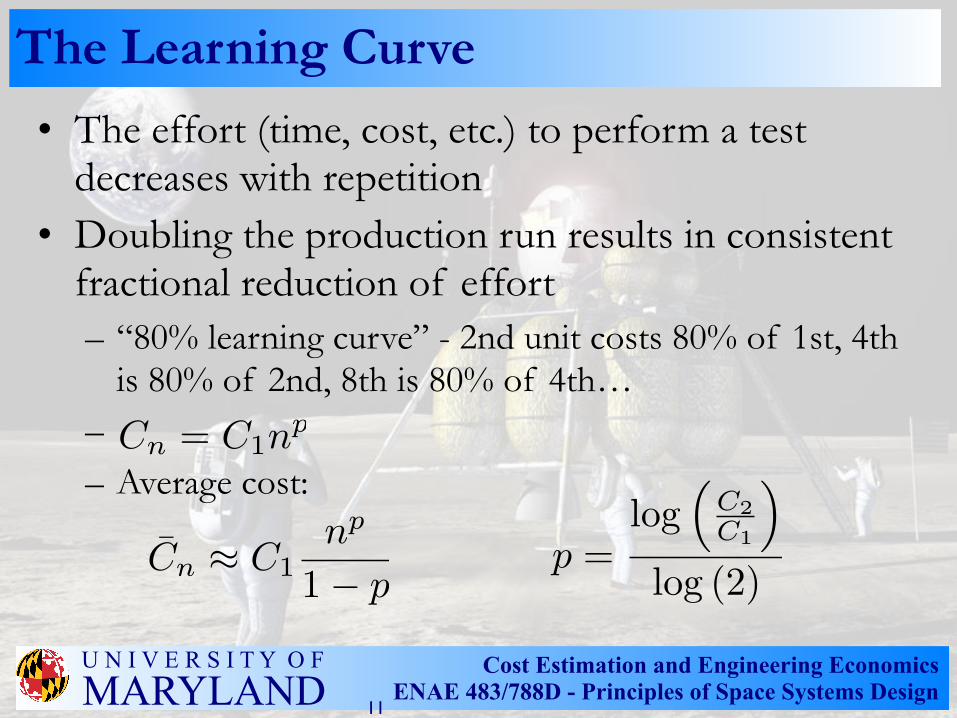
The Learning Curve
• The effort (time, cost, etc.) to perform a test decreases with repetition
• Doubling the production run results in consistent fractional reduction of effort– “80% learning curve” - 2nd unit costs 80% of 1st, 4th
is 80% of 2nd, 8th is 80% of 4th…– – Average cost:
11
Cn = C1np
C̄n ≈ C1np
1− pp =
log�
C2C1
�
log (2)
Cost Estimation and Engineering EconomicsENAE 483/788D - Principles of Space Systems Design
U N I V E R S I T Y O FMARYLAND
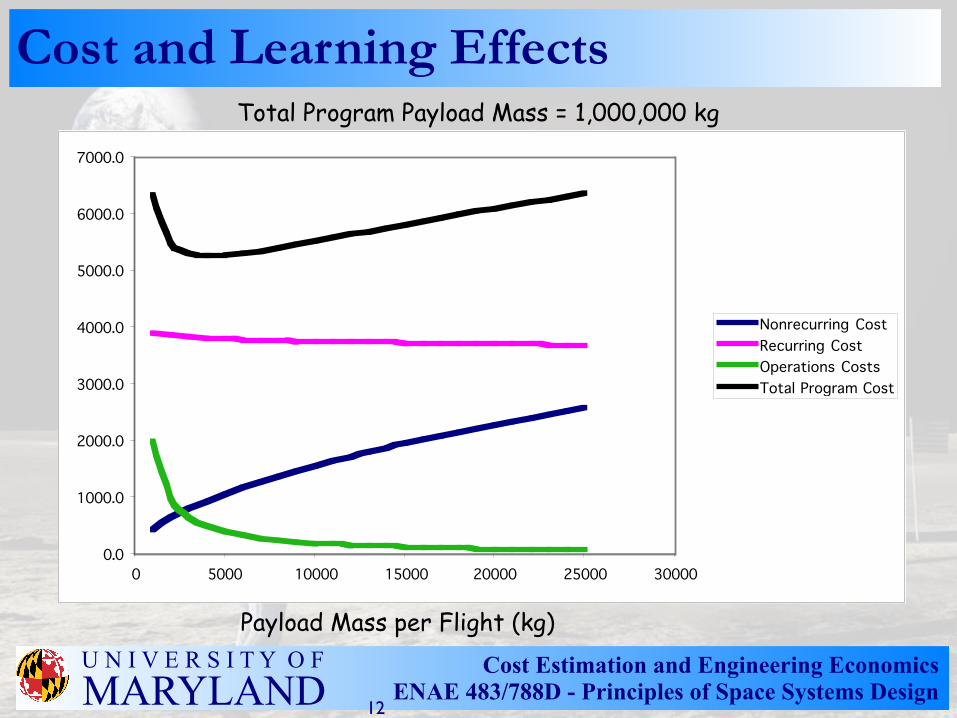
Cost and Learning EffectsTotal Program Payload Mass = 1,000,000 kg
Payload Mass per Flight (kg)
0.0
1000.0
2000.0
3000.0
4000.0
5000.0
6000.0
7000.0
0 5000 10000 15000 20000 25000 30000
Nonrecurring CostRecurring CostOperations CostsTotal Program Cost
12
Cost Estimation and Engineering EconomicsENAE 483/788D - Principles of Space Systems Design
U N I V E R S I T Y O FMARYLAND
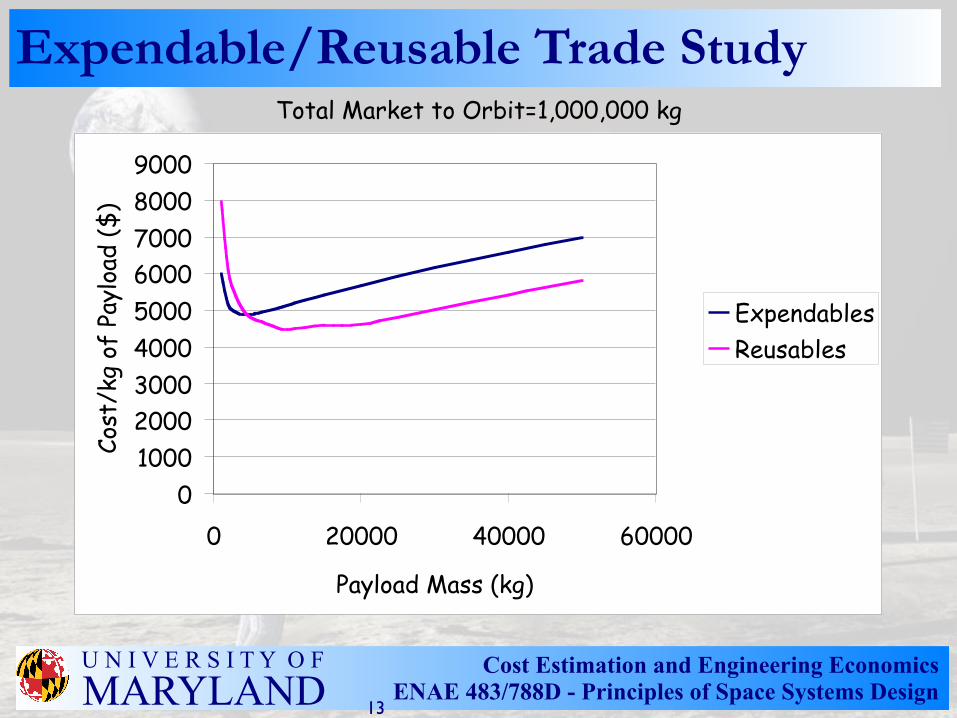
Expendable/Reusable Trade StudyTotal Market to Orbit=1,000,000 kg
0100020003000400050006000700080009000
0 20000 40000 60000
Payload Mass (kg)
Cost
/kg
of P
aylo
ad ($
)
ExpendablesReusables
13
MARYLAND • MICHIGAN • NORTH CAROLINA • WASHINGTON
RLVInstitute
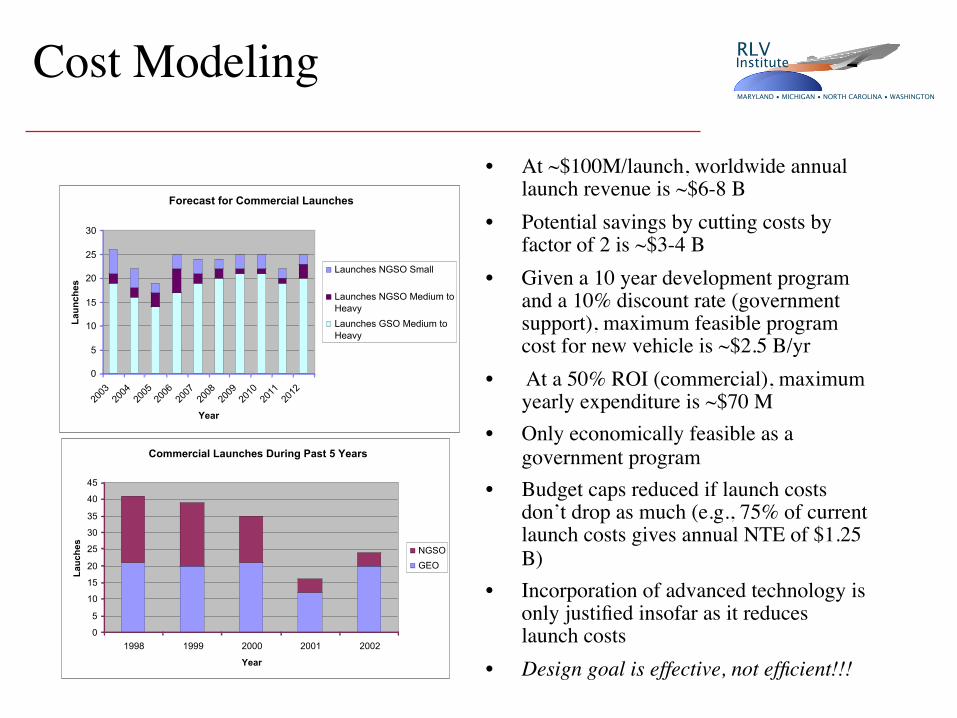
Forecast for Commercial Launches
0
5
10
15
20
25
30
2003
2004
2005
2006
2007
2008
2009
2010
2011
2012
Year
Laun
ches
Launches NGSO Small
Launches NGSO Medium toHeavyLaunches GSO Medium toHeavy
Commercial Launches During Past 5 Years
0
5
10
15
20
25
30
35
40
45
1998 1999 2000 2001 2002
Year
Lauc
hes
NGSOGEO
Cost Modeling
• At ~$100M/launch, worldwide annual launch revenue is ~$6-8 B
• Potential savings by cutting costs by factor of 2 is ~$3-4 B
• Given a 10 year development program and a 10% discount rate (government support), maximum feasible program cost for new vehicle is ~$2.5 B/yr
• At a 50% ROI (commercial), maximum yearly expenditure is ~$70 M
• Only economically feasible as a government program
• Budget caps reduced if launch costs don’t drop as much (e.g., 75% of current launch costs gives annual NTE of $1.25 B)
• Incorporation of advanced technology is only justified insofar as it reduces launch costs
• Design goal is effective, not efficient!!!
MARYLAND • MICHIGAN • NORTH CAROLINA • WASHINGTON
RLVInstituteParametric Cost Analysis
• Preliminary model developed to bound problem, identify critical parameters
• Assumptions:– Total program launch mass 20,000 MT– Program lifetime 20 years– NASA SLVLC model for cost estimates– 80% learning curve– Vehicle modeled as LOX/LH2 SSTO (δ=0.08;
Isp=420 sec avg.)
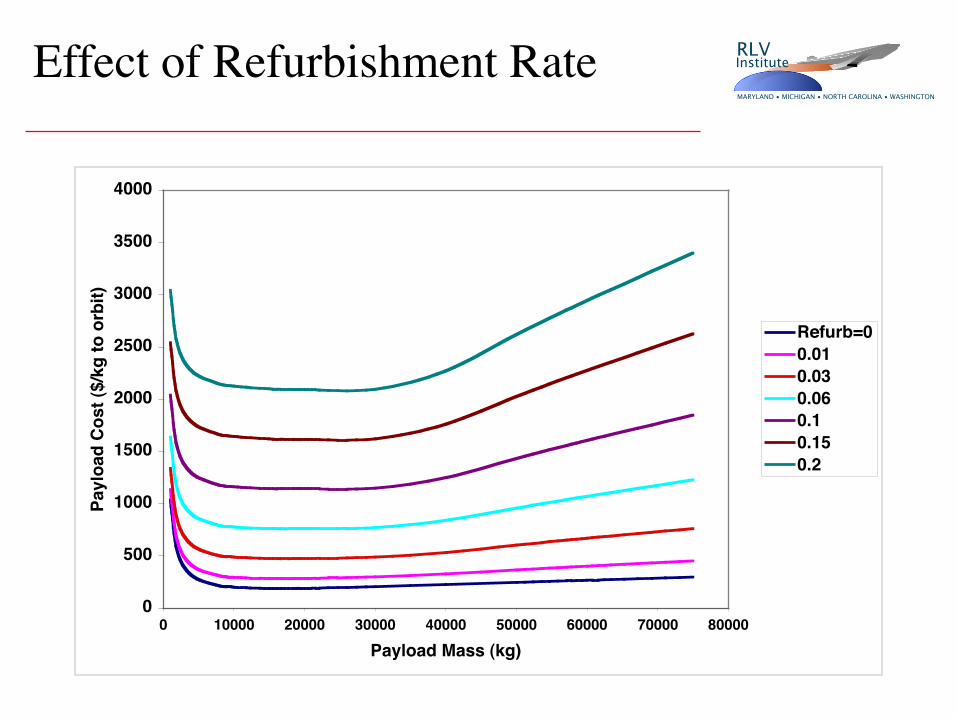
MARYLAND • MICHIGAN • NORTH CAROLINA • WASHINGTON
RLVInstituteEffect of Refurbishment Rate
0
500
1000
1500
2000
2500
3000
3500
4000
0 10000 20000 30000 40000 50000 60000 70000 80000
Payload Mass (kg)
Payl
oad
Cos
t ($/
kg to
orb
it)
Refurb=00.010.030.060.10.150.2
MARYLAND • MICHIGAN • NORTH CAROLINA • WASHINGTON
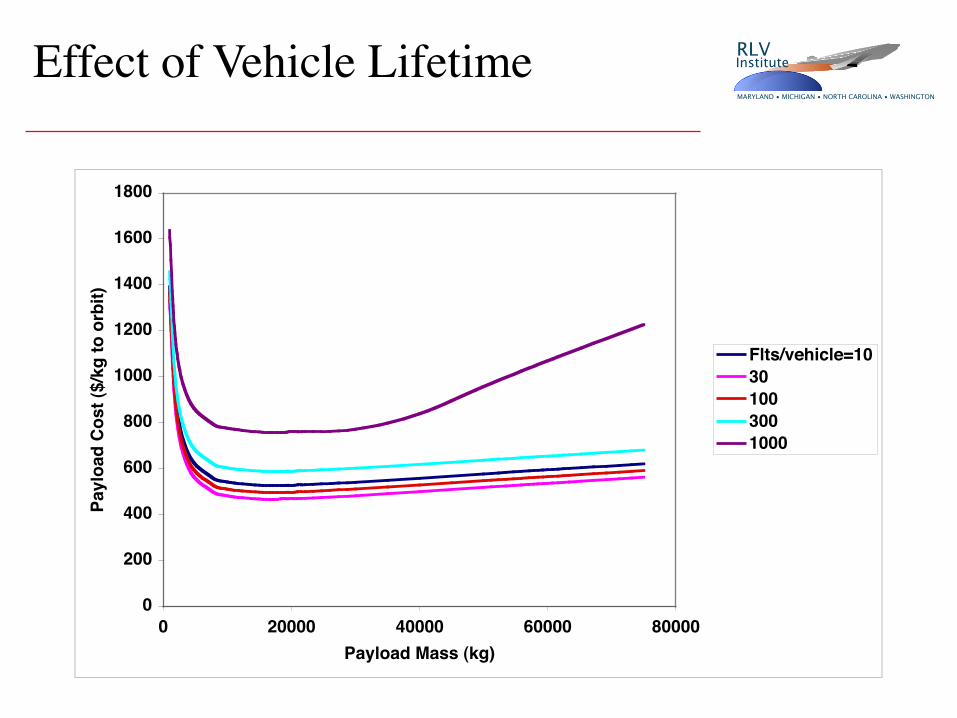
RLVInstituteEffect of Vehicle Lifetime
0
200
400
600
800
1000
1200
1400
1600
1800
0 20000 40000 60000 80000Payload Mass (kg)
Payl
oad
Cos
t ($/
kg to
orb
it)
Flts/vehicle=10301003001000
MARYLAND • MICHIGAN • NORTH CAROLINA • WASHINGTON
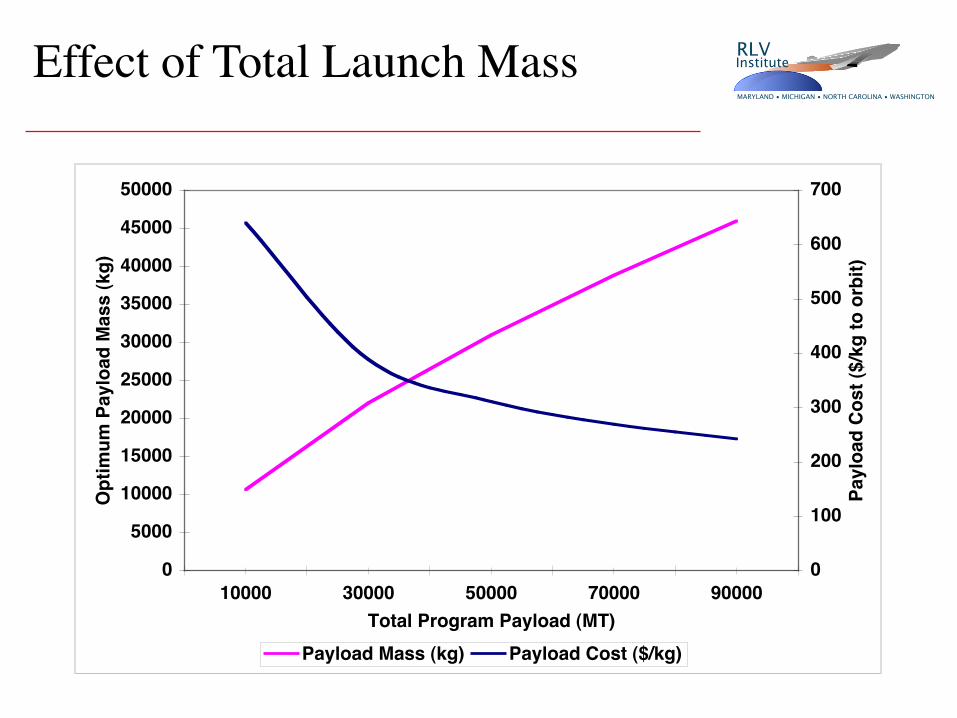
RLVInstituteEffect of Total Launch Mass
0
5000
10000
15000
20000
25000
30000
35000
40000
45000
50000
10000 30000 50000 70000 90000Total Program Payload (MT)
Opt
imum
Pay
load
Mas
s (k
g)
0
100
200
300
400
500
600
700
Payl
oad
Cos
t ($/
kg to
orb
it)
Payload Mass (kg) Payload Cost ($/kg)
MARYLAND • MICHIGAN • NORTH CAROLINA • WASHINGTON
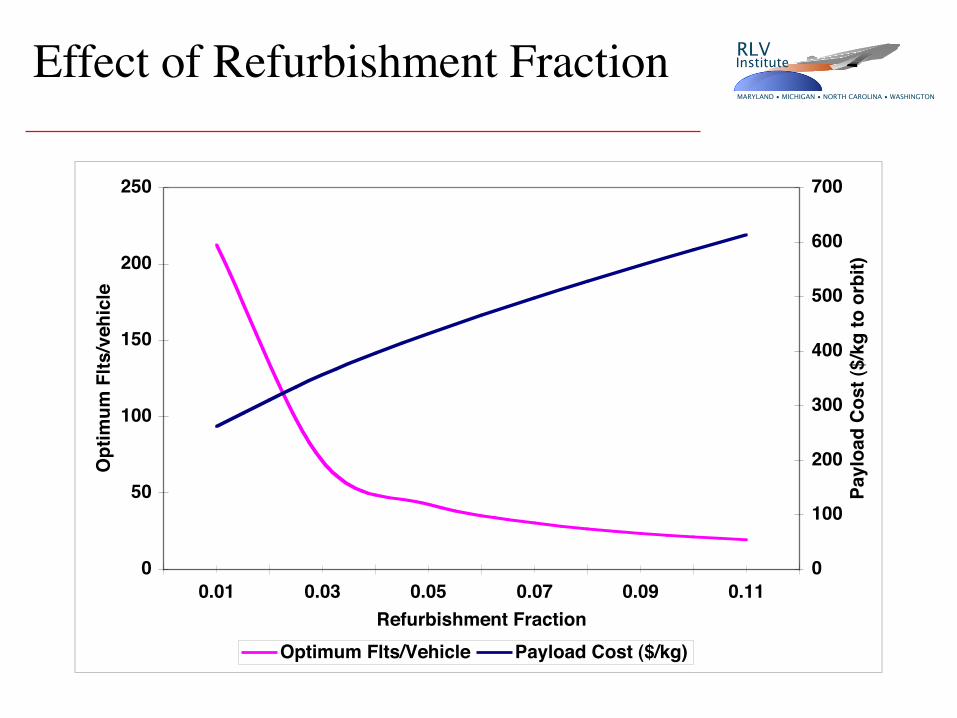
RLVInstituteEffect of Refurbishment Fraction
0
50
100
150
200
250
0.01 0.03 0.05 0.07 0.09 0.11Refurbishment Fraction
Opt
imum
Flts
/veh
icle
0
100
200
300
400
500
600
700
Payl
oad
Cos
t ($/
kg to
orb
it)
Optimum Flts/Vehicle Payload Cost ($/kg)
MARYLAND • MICHIGAN • NORTH CAROLINA • WASHINGTON
RLVInstituteCosting Conclusions (to date)
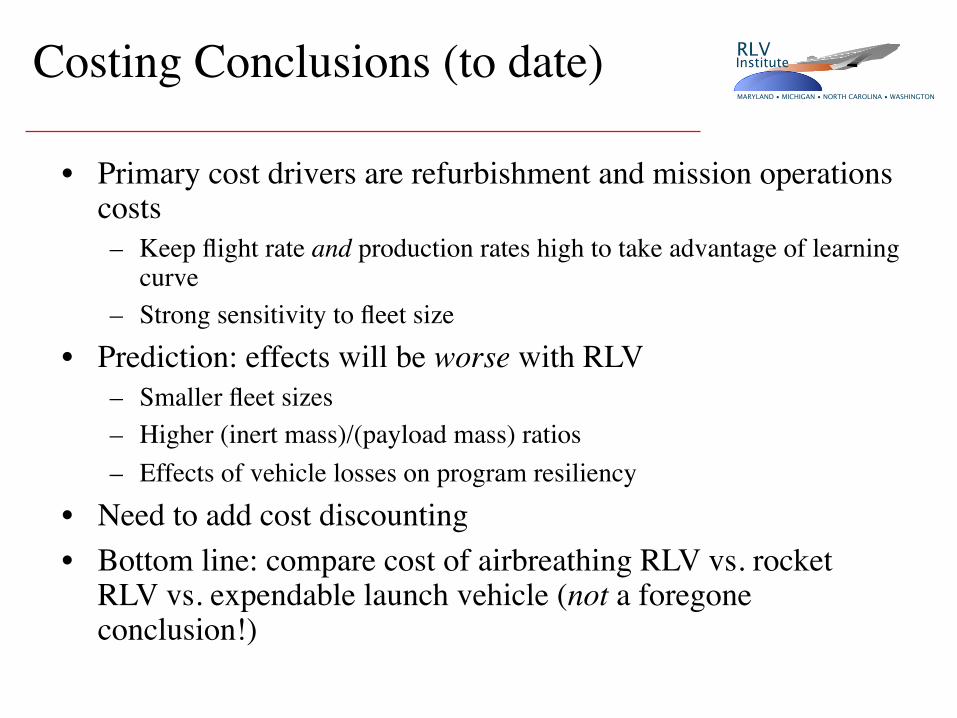
• Primary cost drivers are refurbishment and mission operations costs– Keep flight rate and production rates high to take advantage of learning
curve– Strong sensitivity to fleet size
• Prediction: effects will be worse with RLV– Smaller fleet sizes– Higher (inert mass)/(payload mass) ratios– Effects of vehicle losses on program resiliency
• Need to add cost discounting • Bottom line: compare cost of airbreathing RLV vs. rocket
RLV vs. expendable launch vehicle (not a foregone conclusion!)
Cost Estimation and Engineering EconomicsENAE 483/788D - Principles of Space Systems Design
U N I V E R S I T Y O FMARYLAND
Inflation
• As money supply and economy expand, buying power of money decreases
• A fixed sum of money is worth less from year to year
• “Real year dollars” - what specific year the money is quoted for (e.g., “$M2000”)
• “Constant year dollars” - costing multiyear program based on buying power in single specified year (inflation added later)
21
Cost Estimation and Engineering EconomicsENAE 483/788D - Principles of Space Systems Design
U N I V E R S I T Y O FMARYLAND
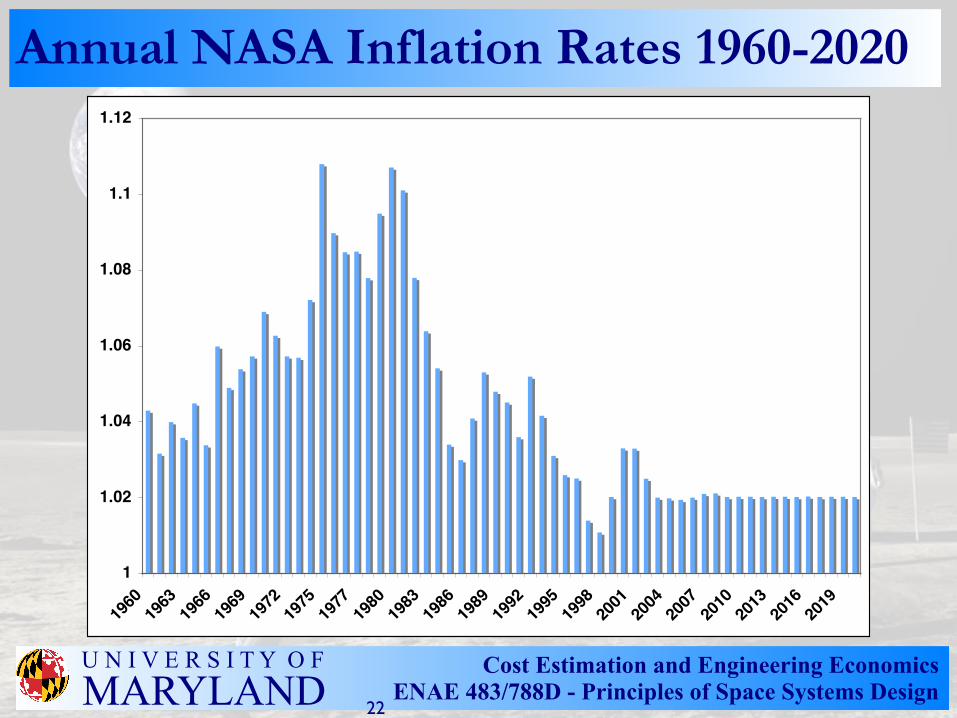
Annual NASA Inflation Rates 1960-2020
1
1.02
1.04
1.06
1.08
1.1
1.12
196019631966196919721975197719801983198619891992199519982001200420072010201320162019
22
Cost Estimation and Engineering EconomicsENAE 483/788D - Principles of Space Systems Design
U N I V E R S I T Y O FMARYLAND
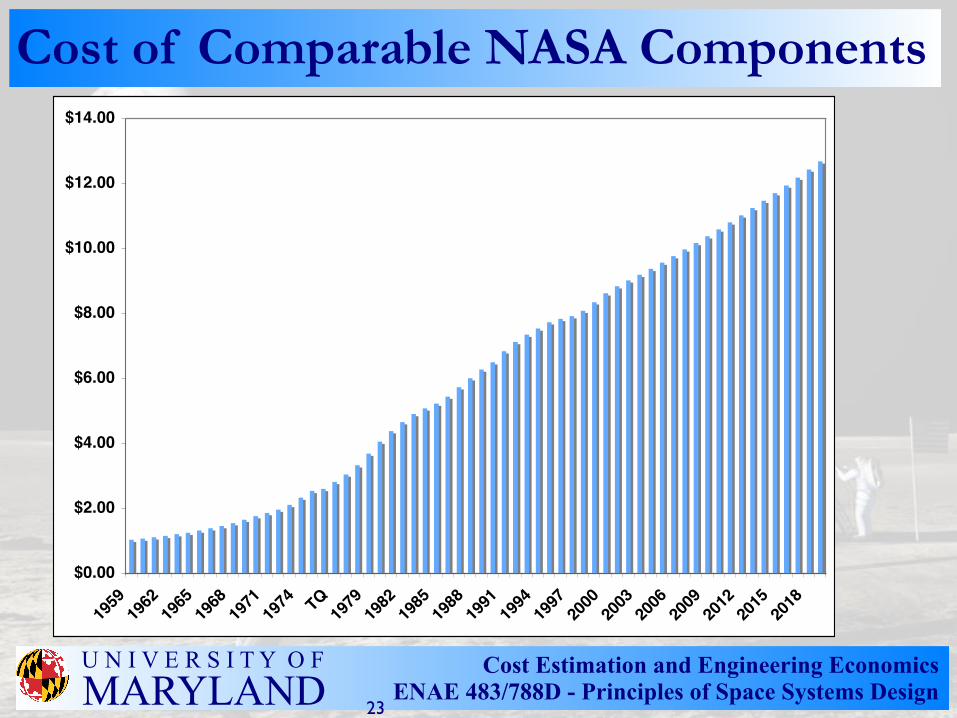
Cost of Comparable NASA Components
$0.00
$2.00
$4.00
$6.00
$8.00
$10.00
$12.00
$14.00
195919621965196819711974 TQ 19
791982198519881991199419972000200320062009201220152018
23
Cost Estimation and Engineering EconomicsENAE 483/788D - Principles of Space Systems Design
U N I V E R S I T Y O FMARYLAND
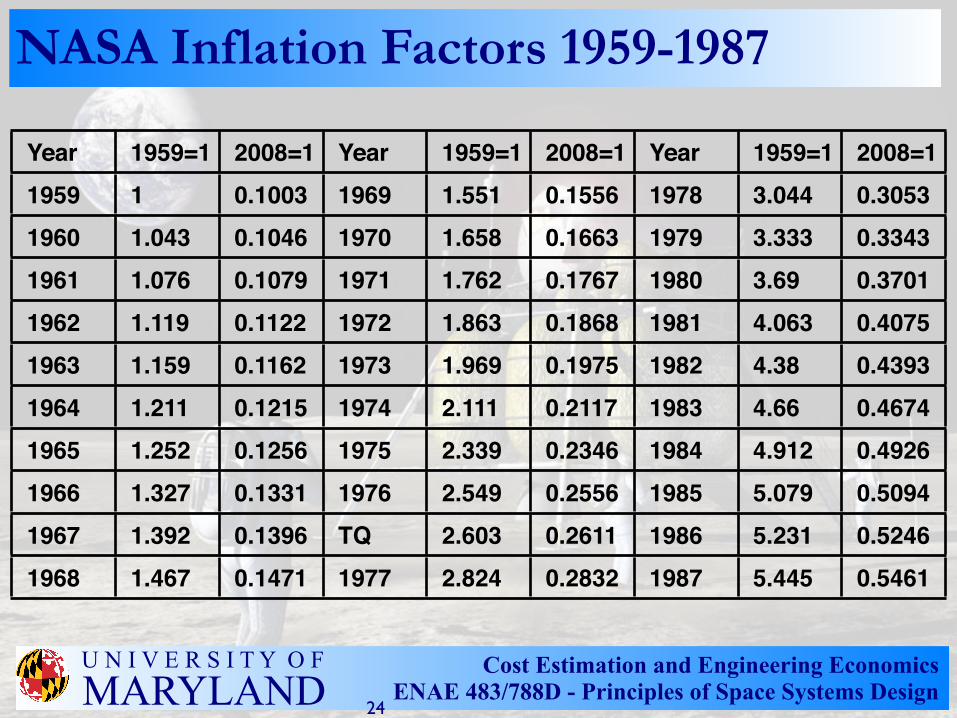
NASA Inflation Factors 1959-1987
Year 1959=1 2008=1 Year 1959=1 2008=1 Year 1959=1 2008=11959 1 0.1003 1969 1.551 0.1556 1978 3.044 0.30531960 1.043 0.1046 1970 1.658 0.1663 1979 3.333 0.33431961 1.076 0.1079 1971 1.762 0.1767 1980 3.69 0.37011962 1.119 0.1122 1972 1.863 0.1868 1981 4.063 0.40751963 1.159 0.1162 1973 1.969 0.1975 1982 4.38 0.43931964 1.211 0.1215 1974 2.111 0.2117 1983 4.66 0.46741965 1.252 0.1256 1975 2.339 0.2346 1984 4.912 0.49261966 1.327 0.1331 1976 2.549 0.2556 1985 5.079 0.50941967 1.392 0.1396 TQ 2.603 0.2611 1986 5.231 0.52461968 1.467 0.1471 1977 2.824 0.2832 1987 5.445 0.5461
24
Cost Estimation and Engineering EconomicsENAE 483/788D - Principles of Space Systems Design
U N I V E R S I T Y O FMARYLAND
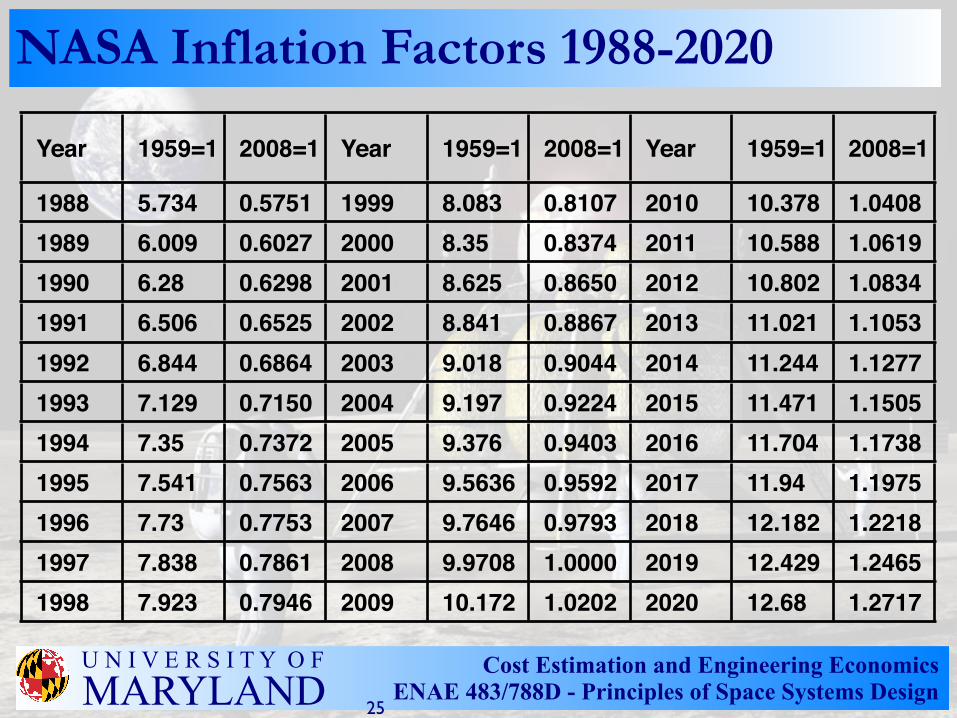
NASA Inflation Factors 1988-2020
Year 1959=1 2008=1 Year 1959=1 2008=1 Year 1959=1 2008=1
1988 5.734 0.5751 1999 8.083 0.8107 2010 10.378 1.04081989 6.009 0.6027 2000 8.35 0.8374 2011 10.588 1.06191990 6.28 0.6298 2001 8.625 0.8650 2012 10.802 1.08341991 6.506 0.6525 2002 8.841 0.8867 2013 11.021 1.10531992 6.844 0.6864 2003 9.018 0.9044 2014 11.244 1.12771993 7.129 0.7150 2004 9.197 0.9224 2015 11.471 1.15051994 7.35 0.7372 2005 9.376 0.9403 2016 11.704 1.17381995 7.541 0.7563 2006 9.5636 0.9592 2017 11.94 1.19751996 7.73 0.7753 2007 9.7646 0.9793 2018 12.182 1.22181997 7.838 0.7861 2008 9.9708 1.0000 2019 12.429 1.24651998 7.923 0.7946 2009 10.172 1.0202 2020 12.68 1.2717
25
Cost Estimation and Engineering EconomicsENAE 483/788D - Principles of Space Systems Design
U N I V E R S I T Y O FMARYLAND
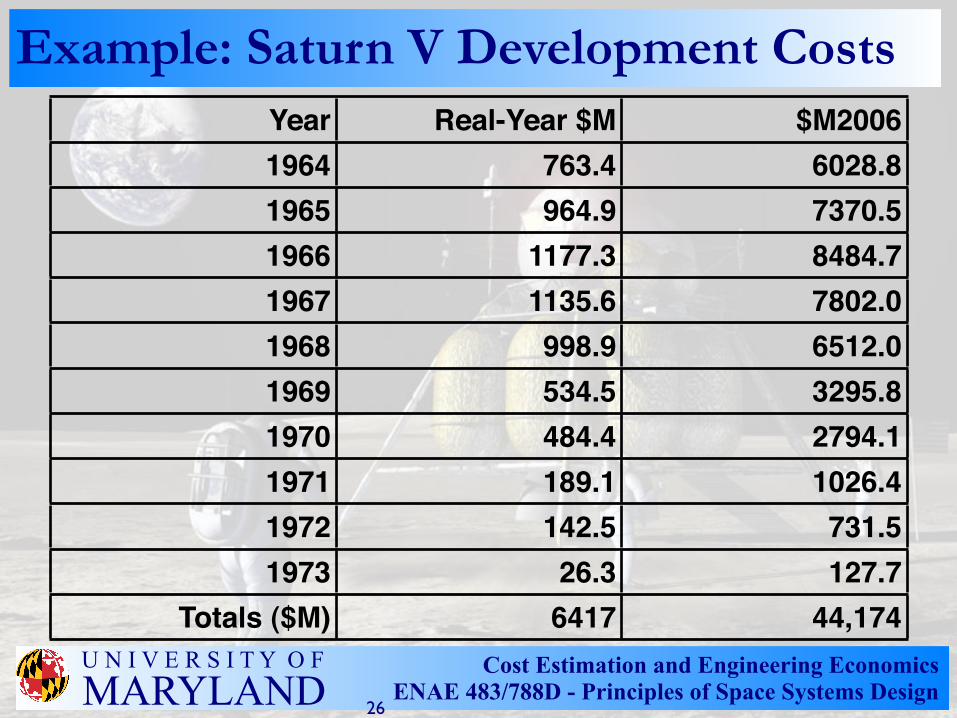
Example: Saturn V Development CostsYear Real-Year $M $M20061964 763.4 6028.81965 964.9 7370.51966 1177.3 8484.71967 1135.6 7802.01968 998.9 6512.01969 534.5 3295.81970 484.4 2794.11971 189.1 1026.41972 142.5 731.51973 26.3 127.7
Totals ($M) 6417 44,174
26
Cost Estimation and Engineering EconomicsENAE 483/788D - Principles of Space Systems Design
U N I V E R S I T Y O FMARYLAND
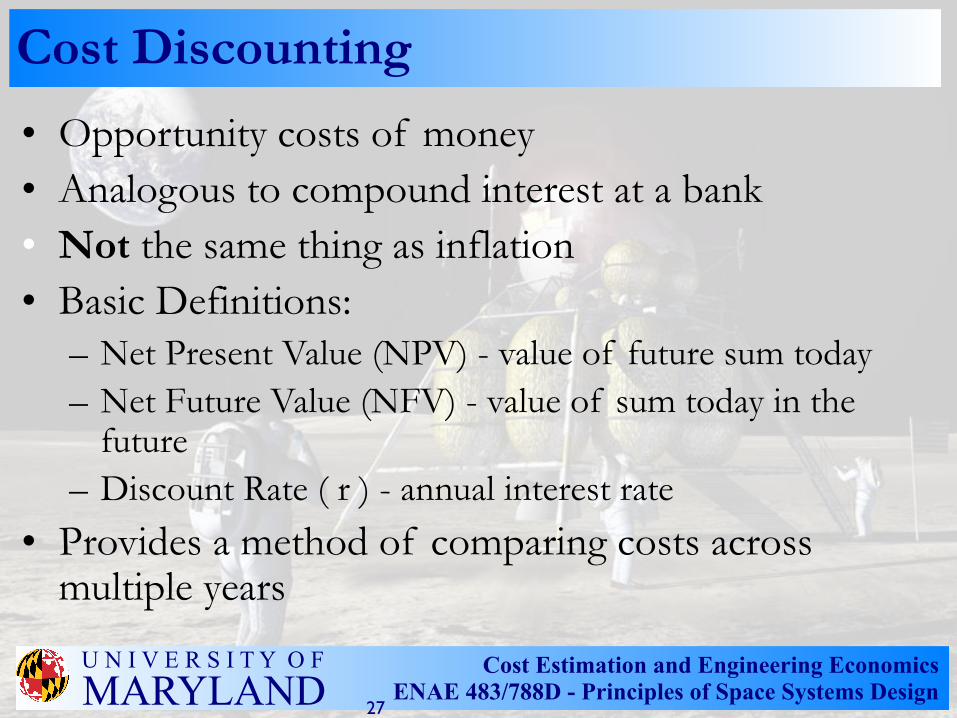
Cost Discounting
• Opportunity costs of money• Analogous to compound interest at a bank• Not the same thing as inflation• Basic Definitions:
– Net Present Value (NPV) - value of future sum today– Net Future Value (NFV) - value of sum today in the
future– Discount Rate ( r ) - annual interest rate
• Provides a method of comparing costs across multiple years
27
Cost Estimation and Engineering EconomicsENAE 483/788D - Principles of Space Systems Design
U N I V E R S I T Y O FMARYLAND
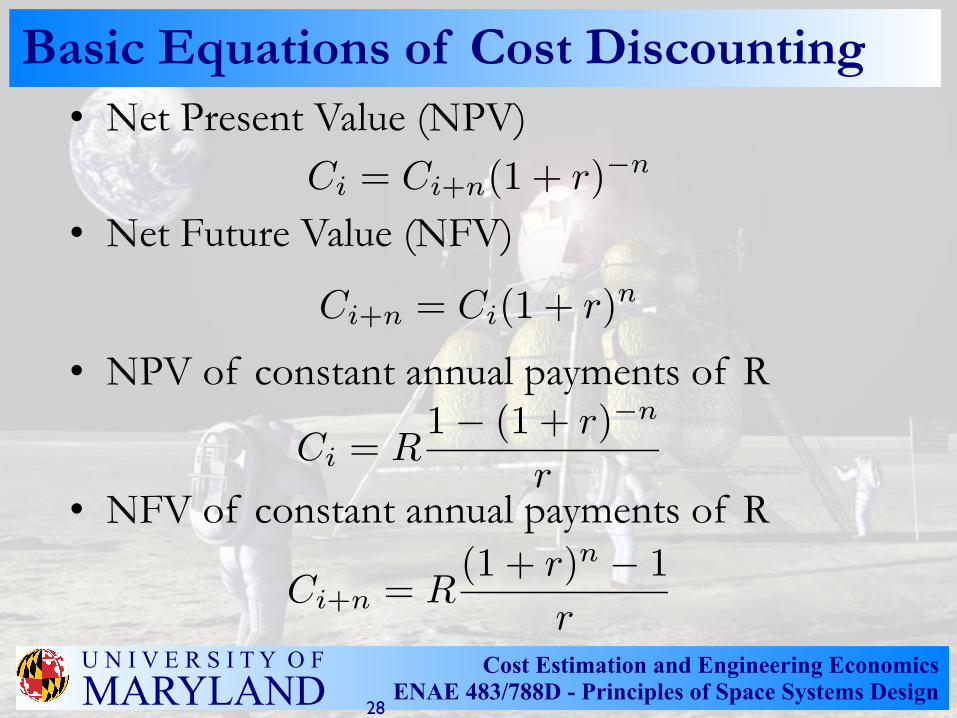
Basic Equations of Cost Discounting• Net Present Value (NPV)
• Net Future Value (NFV)
• NPV of constant annual payments of R
• NFV of constant annual payments of R
28
Ci = Ci+n(1 + r)−n
Ci+n = Ci(1 + r)n
Ci+n = R(1 + r)n − 1
r
Ci = R1− (1 + r)−n
r
Cost Estimation and Engineering EconomicsENAE 483/788D - Principles of Space Systems Design
U N I V E R S I T Y O FMARYLAND
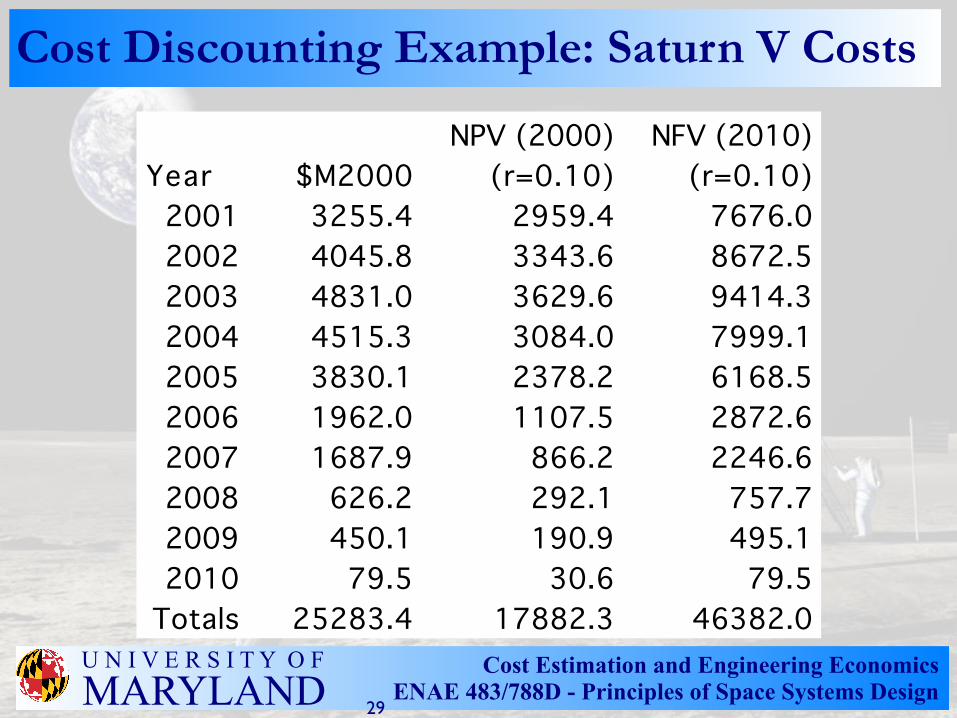
Cost Discounting Example: Saturn V Costs
NPV (2000) NFV (2010)Year $M2000 (r=0.10) (r=0.10)
2001 3255.4 2959.4 7676.02002 4045.8 3343.6 8672.52003 4831.0 3629.6 9414.32004 4515.3 3084.0 7999.12005 3830.1 2378.2 6168.52006 1962.0 1107.5 2872.62007 1687.9 866.2 2246.62008 626.2 292.1 757.72009 450.1 190.9 495.12010 79.5 30.6 79.5
Totals 25283.4 17882.3 46382.0
29
Cost Estimation and Engineering EconomicsENAE 483/788D - Principles of Space Systems Design
U N I V E R S I T Y O FMARYLAND
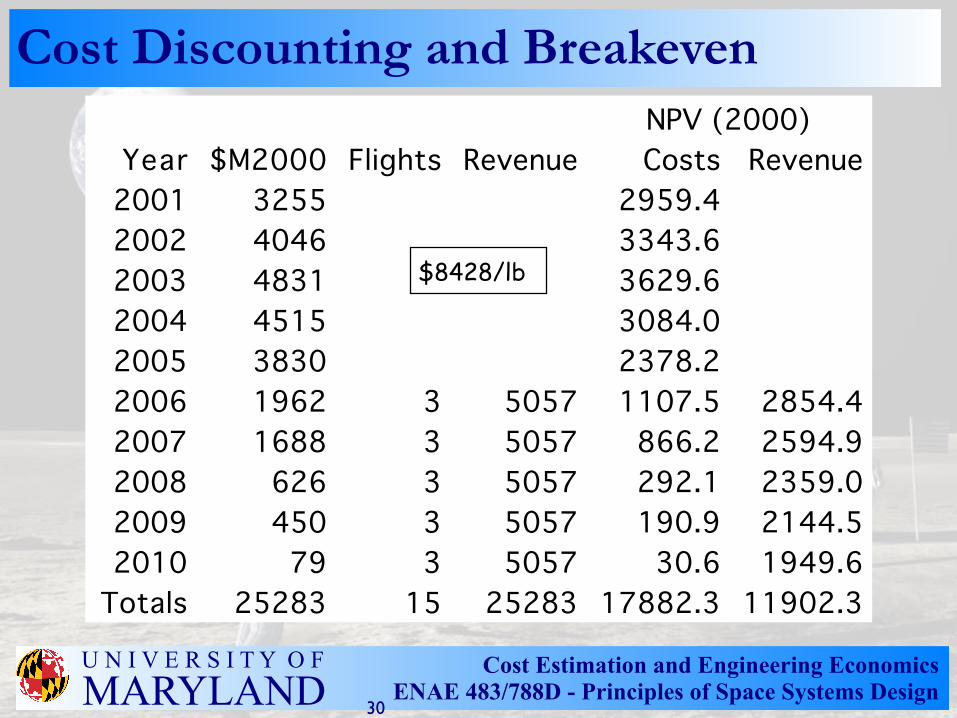
Cost Discounting and Breakeven
Year $M2000 Flights Revenue Costs Revenue2001 3255 2959.42002 4046 3343.62003 4831 3629.62004 4515 3084.02005 3830 2378.22006 1962 3 5057 1107.5 2854.42007 1688 3 5057 866.2 2594.92008 626 3 5057 292.1 2359.02009 450 3 5057 190.9 2144.52010 79 3 5057 30.6 1949.6
Totals 25283 15 25283 17882.3 11902.3
NPV (2000)
$8428/lb
30
Cost Estimation and Engineering EconomicsENAE 483/788D - Principles of Space Systems Design
U N I V E R S I T Y O FMARYLAND
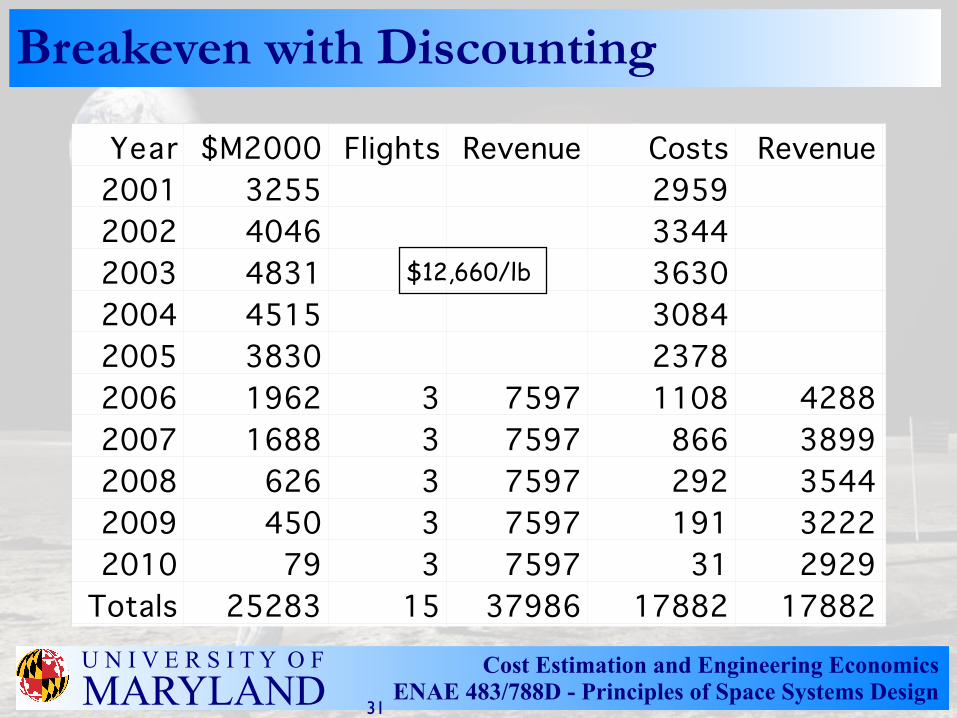
Breakeven with Discounting
Year $M2000 Flights Revenue Costs Revenue2001 3255 29592002 4046 33442003 4831 36302004 4515 30842005 3830 23782006 1962 3 7597 1108 42882007 1688 3 7597 866 38992008 626 3 7597 292 35442009 450 3 7597 191 32222010 79 3 7597 31 2929Totals 25283 15 37986 17882 17882
$12,660/lb
31
Cost Estimation and Engineering EconomicsENAE 483/788D - Principles of Space Systems Design
U N I V E R S I T Y O FMARYLAND
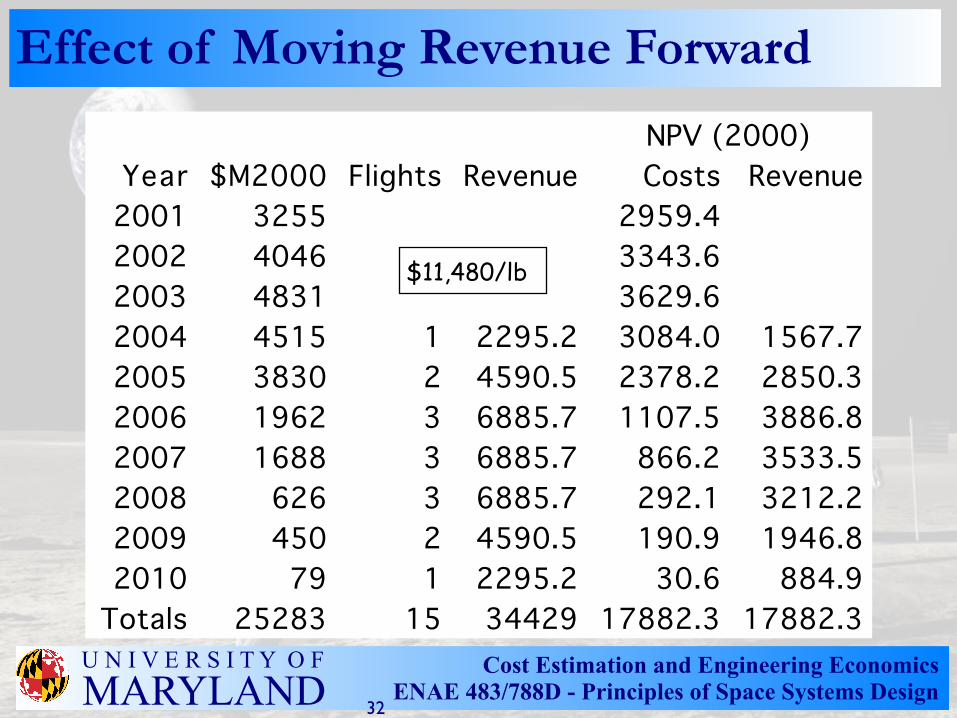
Effect of Moving Revenue Forward
Year $M2000 Flights Revenue Costs Revenue2001 3255 2959.42002 4046 3343.62003 4831 3629.62004 4515 1 2295.2 3084.0 1567.72005 3830 2 4590.5 2378.2 2850.32006 1962 3 6885.7 1107.5 3886.82007 1688 3 6885.7 866.2 3533.52008 626 3 6885.7 292.1 3212.22009 450 2 4590.5 190.9 1946.82010 79 1 2295.2 30.6 884.9
Totals 25283 15 34429 17882.3 17882.3
NPV (2000)
$11,480/lb
32
Cost Estimation and Engineering EconomicsENAE 483/788D - Principles of Space Systems Design
U N I V E R S I T Y O FMARYLAND
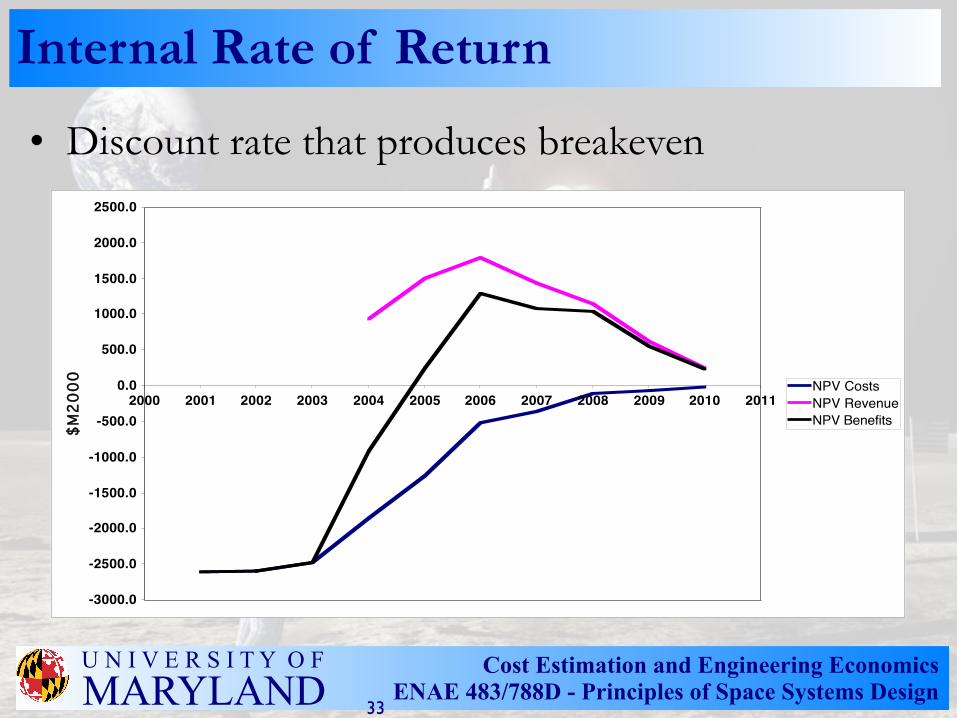
Internal Rate of Return
• Discount rate that produces breakeven
-3000.0
-2500.0
-2000.0
-1500.0
-1000.0
-500.0
0.0
500.0
1000.0
1500.0
2000.0
2500.0
2000 2001 2002 2003 2004 2005 2006 2007 2008 2009 2010 2011
$M20
00 NPV CostsNPV RevenueNPV Benefits
33
Cost Estimation and Engineering EconomicsENAE 483/788D - Principles of Space Systems Design
U N I V E R S I T Y O FMARYLAND
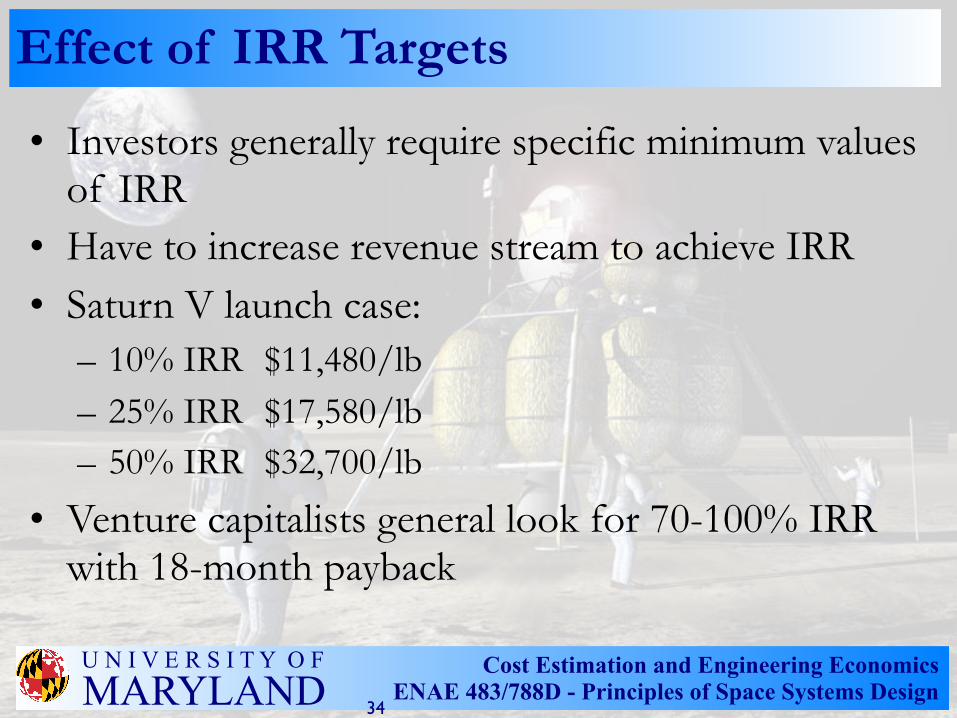
Effect of IRR Targets
• Investors generally require specific minimum values of IRR
• Have to increase revenue stream to achieve IRR• Saturn V launch case:
– 10% IRR $11,480/lb– 25% IRR $17,580/lb– 50% IRR $32,700/lb
• Venture capitalists general look for 70-100% IRR with 18-month payback
34
Space Systems Laboratory – University of Maryland
Low
-Cos
t Ret
urn
to th
e M
oon
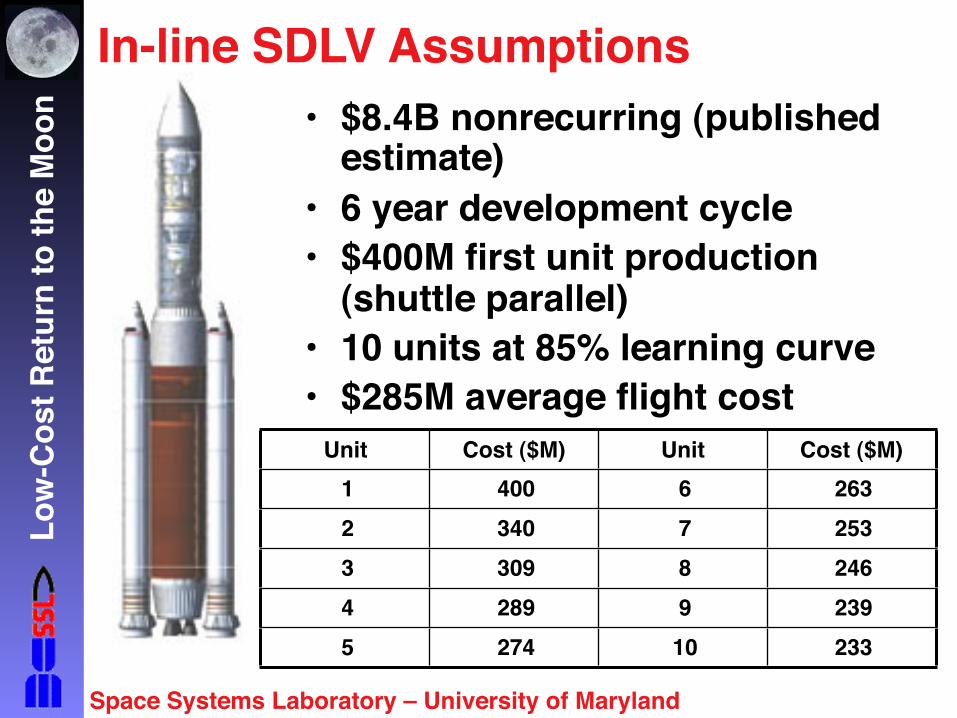
In-line SDLV Assumptions• $8.4B nonrecurring (published
estimate)• 6 year development cycle• $400M first unit production
(shuttle parallel)• 10 units at 85% learning curve• $285M average flight cost
Unit Cost ($M) Unit Cost ($M)1 400 6 2632 340 7 2533 309 8 2464 289 9 2395 274 10 233
Space Systems Laboratory – University of Maryland
Low
-Cos
t Ret
urn
to th
e M
oon
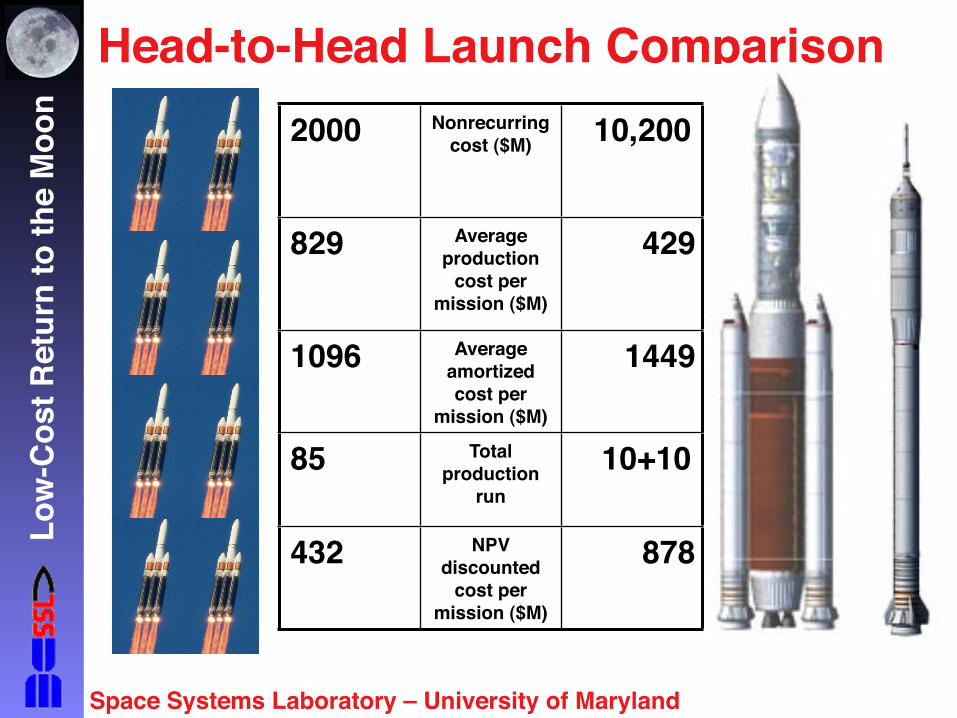
Head-to-Head Launch Comparison2000 Nonrecurring
cost ($M) 10,200
829 Average production
cost per mission ($M)
429
1096 Average amortized cost per
mission ($M)
1449
85 Total production
run10+10
432 NPV discounted
cost per mission ($M)
878
Space Systems Laboratory – University of Maryland
Low
-Cos
t Ret
urn
to th
e M
oon
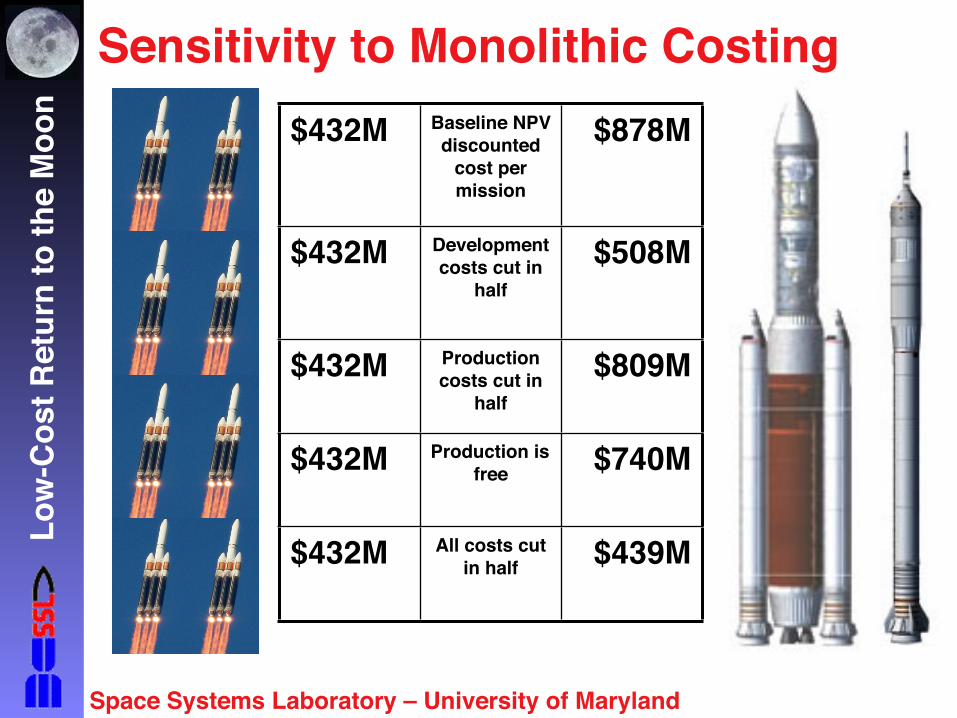
Sensitivity to Monolithic Costing$432M Baseline NPV
discounted cost per mission
$878M
$432M Development costs cut in
half$508M
$432M Production costs cut in
half$809M
$432M Production is free $740M
$432M All costs cut in half $439M
Cost Estimation and Engineering EconomicsENAE 483/788D - Principles of Space Systems Design
U N I V E R S I T Y O FMARYLAND
Cost Spreading Estimation
• Programs very seldom occur in a single funding year
• Costs are not constant from year to year– Low start-up costs– High costs during vehicle development and fabrication– Low end-of-life costs
• Costs are estimated using a beta function• Calculation worksheet at
http://cost.jsc.nasa.gov/beta.html
38
Cost Estimation and Engineering EconomicsENAE 483/788D - Principles of Space Systems Design
U N I V E R S I T Y O FMARYLAND
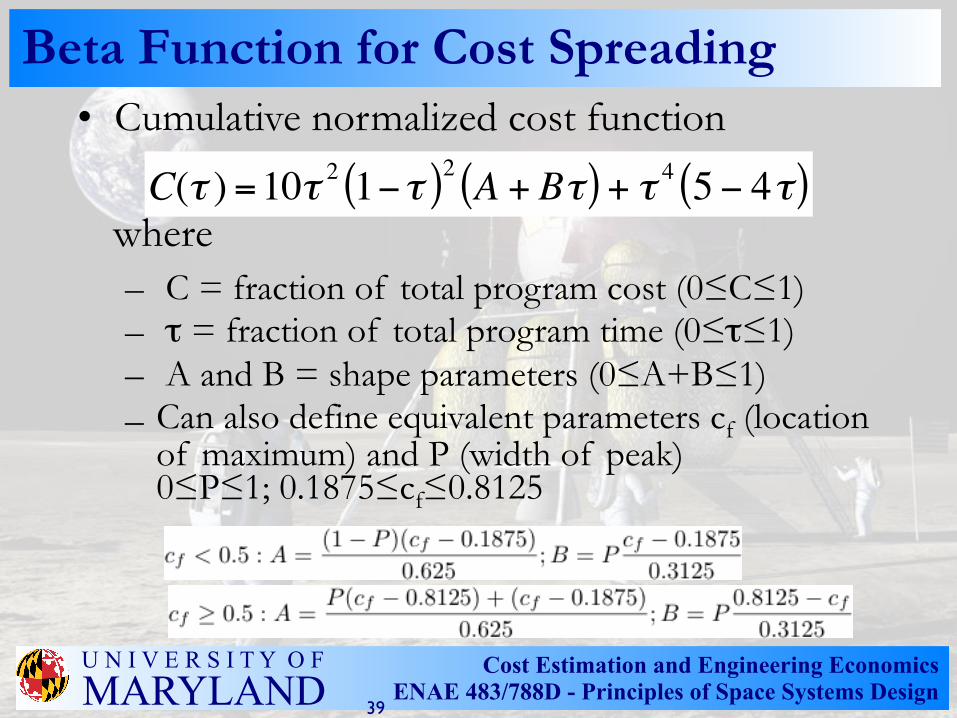
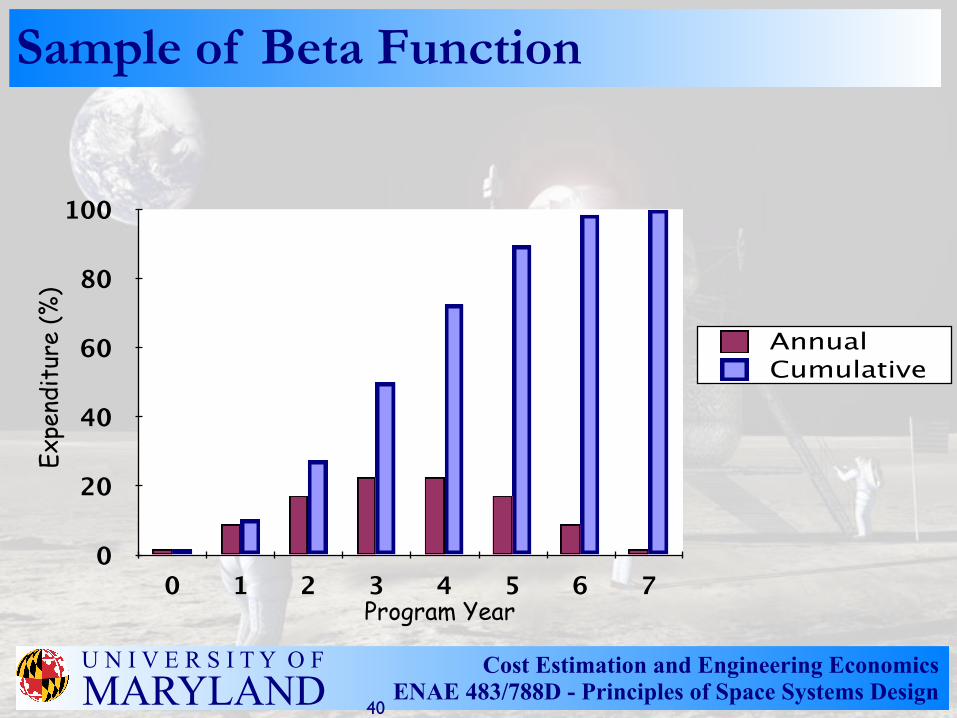
Beta Function for Cost Spreading• Cumulative normalized cost function
where – C = fraction of total program cost (0≤C≤1)– τ = fraction of total program time (0≤τ≤1)– A and B = shape parameters (0≤A+B≤1)– Can also define equivalent parameters cf (location
of maximum) and P (width of peak)0≤P≤1; 0.1875≤cf≤0.8125
€
C(τ ) =10τ 2 1−τ( )2 A + Bτ( ) + τ 4 5 − 4τ( )
39
Cost Estimation and Engineering EconomicsENAE 483/788D - Principles of Space Systems Design
U N I V E R S I T Y O FMARYLAND
Sample of Beta Function
Program Year
Expe
ndit
ure
(%)
0
20
40
60
80
100
0 1 2 3 4 5 6 7
AnnualCumulative
40
Cost Estimation and Engineering EconomicsENAE 483/788D - Principles of Space Systems Design
U N I V E R S I T Y O FMARYLAND
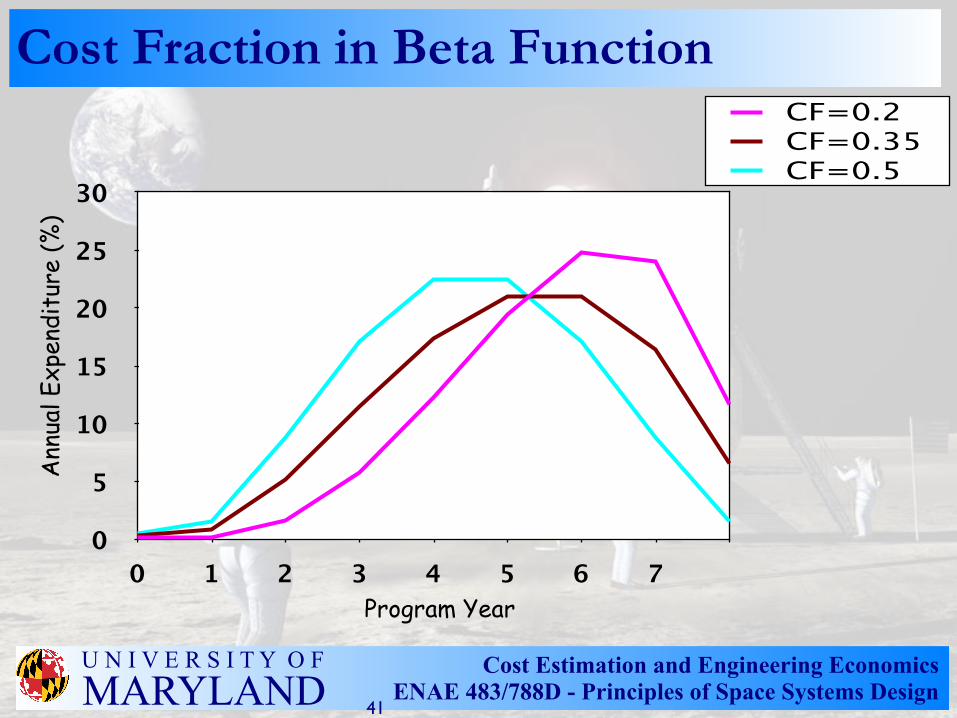
Cost Fraction in Beta Function
0
5
10
15
20
25
30
0 1 2 3 4 5 6 7
CF=0.2CF=0.35CF=0.5
Program Year
Ann
ual E
xpen
ditu
re (%
)
41
Cost Estimation and Engineering EconomicsENAE 483/788D - Principles of Space Systems Design
U N I V E R S I T Y O FMARYLAND
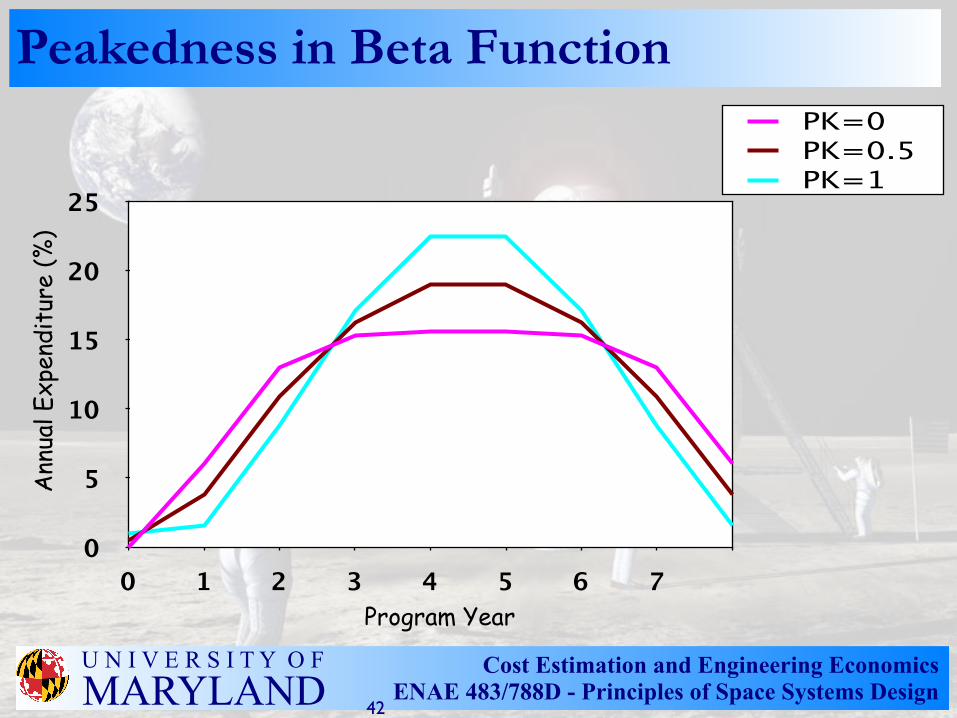
Peakedness in Beta Function
Program Year
Ann
ual E
xpen
ditu
re (%
)
0
5
10
15
20
25
0 1 2 3 4 5 6 7
PK=0PK=0.5PK=1
42
Cost Estimation and Engineering EconomicsENAE 483/788D - Principles of Space Systems Design
U N I V E R S I T Y O FMARYLAND
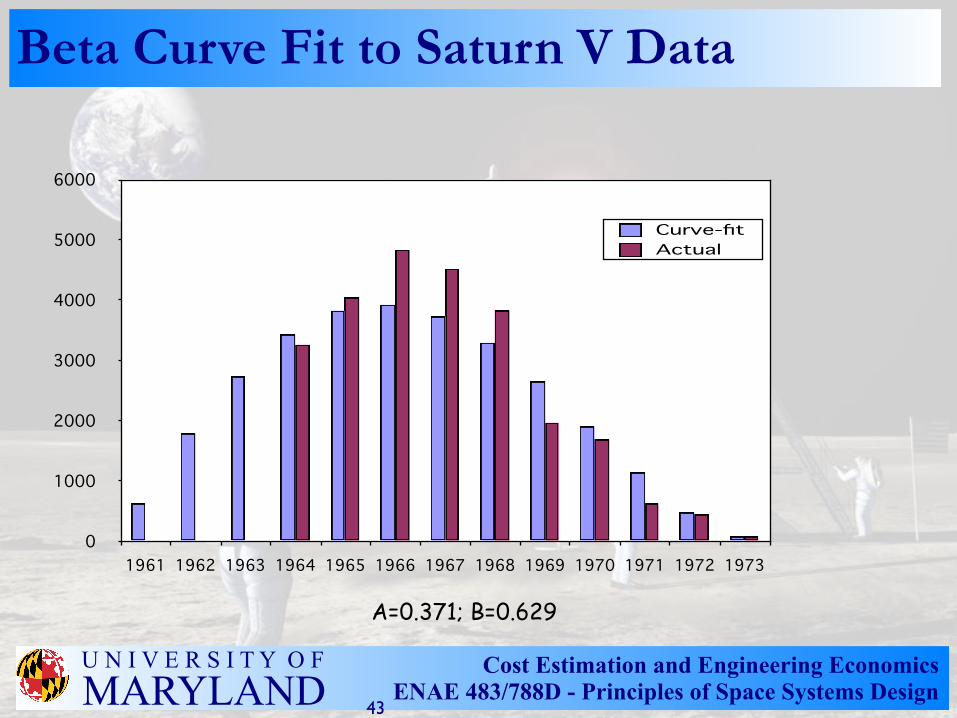
Beta Curve Fit to Saturn V Data
0
1000
2000
3000
4000
5000
6000
1961 1962 1963 1964 1965 1966 1967 1968 1969 1970 1971 1972 1973
Curve-fitActual
A=0.371; B=0.629
43
Cost Estimation and Engineering EconomicsENAE 483/788D - Principles of Space Systems Design
U N I V E R S I T Y O FMARYLAND
References
• Richard de Neufville and Joseph H. Stafford, Systems Analysis for Engineers and Managers McGraw-Hill, 1971
44
Cost Estimation and Engineering EconomicsENAE 483/788D - Principles of Space Systems Design
U N I V E R S I T Y O FMARYLAND
Web-Based Costing References
• NASA Cost Estimation Web Sitehttp://cost.jsc.nasa.gov/index.htm
• Vehicle-Level Costing Modelshttp://cost.jsc.nasa.gov/SVLCM.html
• Inflation Adjustmenthttp://cost.jsc.nasa.gov/inflate.html
• Learning Curveshttp://cost.jsc.nasa.gov/learn.html
45


![Cost Estimation and Engineering Economics · inerthkgi] b. Cost Estimation and Engineering Economics ENAE 483/788D - Principles of Space Systems Design. U N I V E R S I T Y O F. MARYLAND.](https://static.fdocuments.in/doc/165x107/611d8ac93ea549238b3b1dcb/cost-estimation-and-engineering-economics-inerthkgi-b-cost-estimation-and-engineering.jpg)