Cost-effectiveness of first-line therapy for HIV-infected...
55
Ciaranello et al. First-line ART for HIV-infected children Cost-effectiveness of first-line antiretroviral therapy for HIV-infected African children less than three years of age: Supplemental Appendix Andrea Ciaranello, MD, MPH et al. 1
-
Upload
dinhnguyet -
Category
Documents
-
view
216 -
download
0
Transcript of Cost-effectiveness of first-line therapy for HIV-infected...

Ciaranello et al. First-line ART for HIV-infected children
Cost-effectiveness of first-line antiretroviral therapy for
HIV-infected African children less than three years of age:
Supplemental Appendix
Andrea Ciaranello, MD, MPH
et al.
1

Ciaranello et al. First-line ART for HIV-infected children
INTRODUCTION
This appendix is included to provide methodologic details to supplement the description of the methods in
the manuscript text, as well as additional model output and results.
2

Ciaranello et al. First-line ART for HIV-infected children
METHODS
Model structure
We have previously described in detail the structure of the CEPAC-Pediatric natural history model,
reflecting HIV disease progression in the absence of ART (Ciaranello et al, PLoS ONE, 2013).1 Here, we
provide additional detail about the impact of ART in the CEPAC-Pediatric model. Full details of model
structure, data sources, and procedures for initiating new collaborative projects are also available on the
CEPAC website, at http://web2.research.partners.org/cepac/model.html.
Infants enter the CEPAC-Pediatric model following HIV infection in utero, during delivery, or during
breastfeeding, and are simulated until death. The model tracks true CD4%/CD4 and HIV RNA level,
although clinical decisions are made based on observed information, such as symptomatic illness or
CD4%/CD4 or RNA levels measured according to specified laboratory monitoring strategies. In each
month, children can remain in care or be lost to follow-up; if they are lost to follow-up, they are assumed
to stop ART, and to return to care if a severe opportunistic infection (OI) occurs.
We establish criteria by which children are modeled to initiate first-line ART, including age, observed
CD4% or CD4 count, and/or development of opportunistic infections. For each ART regimen, we specify
an “efficacy,” defined as the probability of suppressing HIV RNA to <400 copies/mL (c/mL), and the
time point by which this occurs (usually 24 or 28 weeks). Each regimen also confers monthly medication
costs, as well as gains in CD4% or CD4 count for children with suppressed HIV RNA. Children who
initially suppress HIV RNA at 24 or 48 weeks face a monthly risk of virologic failure thereafter (“late
failure”). Following virologic failure, HIV RNA slowly rises to a “set point” that is determined as a
function of HIV RNA level at birth. For this analysis, we do not model a state of sustained, low-level
viremia (RNA between 400 and 5,000 copies/mL without further increase in RNA over time). After
virologic failure, there is a 12-month delay until CD4% or CD4 count begins to decline at pre-ART rates,
3

Ciaranello et al. First-line ART for HIV-infected children
leading to increased monthly risks of opportunistic infections and death, until the next effective ART
regimen (if available) is initiated. For children who fail ART, we assign clinical criteria (number and type
of opportunistic infections), immunologic criteria (decline in CD4% or CD4 count), or virologic criteria
(increase in HIV RNA) by which this failure is detected, as well as the type and frequency of monitoring
and confirmatory testing. After observed failure, patients can be switched to the next available line of
therapy. We can also incorporate a reduction in mortality and opportunistic infection risks for children on
ART, independent of CD4 level and HIV RNA suppression, as observed in adults; this parameter was
used for model calibration (see below).2
For each simulated infant, the model tracks clinical events, changes in CD4% or CD4 count, and the
amount of time spent in each health state. After an individual simulated patient has died, the next infant
enters the model. Large cohorts (1 million-10 million patients) are simulated in order to generate model
outcomes that are stable to within 0.005 life-years (base-case) or 0.05 life-years (sensitivity analyses).
Once the entire cohort has been simulated, summary statistics are tallied, including number and type of
clinical events, the proportion alive each month, health care costs in each month, and life expectancy
(mean for the cohort).
Model input data
Data used as input parameters for the CEPAC-Pediatric model are described in the main manuscript, and
selected data inputs are shown in Manuscript Table 1. Appendix Table A includes all model input
parameters.
The base-case analyses used data from P1060. We then repeated all analyses using RNA suppression and
CD4 changes on suppressive ART from the PENPACT-1 trial (Table 1).3 PENPACT-1 included older
children (median age, 6.5 years) and a range of medications; for this analysis, we limited data to children
4

Ciaranello et al. First-line ART for HIV-infected children
<3 years of age at trial entry treated with nevirapine or lopinavir/ritonavir. In contrast to P1060,
PENPACT-1 found non-significantly higher rates of RNA suppression at 24 weeks with first-line
nevirapine (77%) compared to first-line lopinavir/ritonavir (72%).
Model calibration
Natural history model calibration
We first calibrated our model to fit observed data for children in the absence of ART. This is described in
Ciaranello et al, PLoS ONE, 2013.1 In brief, we first internally validated the CEPAC-Pediatric model to
assess the accuracy of model structure. We did this by using input data from the IeDEA East Africa
region, and ensuring that model-projected survival and OI rates matched the data used as inputs.4 We next
calibrated the model to pooled survival rates from >1,300 children with in utero or intrapartum HIV
infection in 12 PMTCT studies, pooled by the UNAIDS Child Survival Group.5,6 This involved increasing
the rates of HIV-related mortality to account for survivor biases and differences in treatment availability
for children in the IeDEA cohort compared to children in the pooled UNAIDS analysis.1
On-ART model calibration
We next calibrated our model to fit observed data for children treated with ART. We had two types of
calibration targets: mortality and OI rates, and rates of switching from first-line to second-line ART.
1. Calibration to observed OI and mortality rates
In the P1060 trial, observed event rates were as follows over 72 weeks of follow-up: WHO Stage 3:
9.30/100PY, WHO Stage 4: 0.73/100PY, tuberculosis: 5.60/100PY, and mortality: 3.29/100PY. In
adults, a reduction in risks of OIs and death has been reported for patients on ART, regardless of whether
ART is suppressive and in addition to the reduction in risk conferred by improvements in CD4 count
alone, although data remain equivocal.2 We used adult data on this "ART effect" for simulated subjects
5

Ciaranello et al. First-line ART for HIV-infected children
after the age of 13. In the absence of data on a similar ART effect in children, we used this parameter to
calibrate the model for children <13 years of age to fit observed OI and mortality rates in the P1060 trial.
The model includes a relative risk reduction in OI incidence and in mortality >30 days after OI diagnosis
(“chronic mortality”) for children on ART, relative to children at the same CD4%/CD4 level not on ART.
We separately varied the relative reduction in monthly OI risks and the relative reduction in monthly
“chronic” mortality risks for children on ART, from 0-100%. Our goal was to identify a multiplier for
mortality and a multiplier for OI risk that could be used in all analyses; in order to increase the
comparability of all model results, we did not seek to identify different multipliers for children presenting
at different ages, or for different first-line ART regimens, for example.
We first attempted to match the mortality rates observed in the P1060 trial (3.29/100PY). We conducted
multiple model runs for a cohort of children presenting to care at age 12 months. We used the first-line
nevirapine strategy for these calibration analyses, in order to be conservative with respect to mortality
(model-projected mortality was slightly higher with first-line nevirapine than with first-line
lopinavir/ritonavir; we anticipated that the first-line lopinavir/ritonavir results using the calibrated
multipliers would thus be closer to P1060 results). We evaluated model-projected average mortality rates
over the first 2 years of observation (from 12 through 35 months of age) and over the first 4 years of
observation (from 12 through 59 months). The best fit to the P1060-observed mortality rate was found
with relative risk reductions of 85-95% (Appendix Table B; highlighted in yellow).
Holding the relative risk reduction in mortality at 90% (the midpoint of this range), we next compared
model-generated OI rates using these multipliers to P1060-observed rates of WHO stage 3, WHO stage 4,
and tuberculosis events. These were found to match most closely when the relative reduction in OI risk
was 85%. (Appendix Table C, middle columns). Results are also shown in Appendix Table C for a range
of OI and mortality risk reduction values, for comparison.
6

Ciaranello et al. First-line ART for HIV-infected children
Finally, we compared the life expectancies projected to result from relative reductions in OI risk of 85-
95% and relative reductions in mortality risk of 90-95% (Appendix Table C, right column). There are no
empiric data to inform the life expectancy of HIV-infected African children treated with modern ART
regimens. Based on projected results for adults, we felt that life expectancies in the 27-28-year range,
observed with relative risk reductions of 85% and 90%, were most reasonable.7 We thus selected relative
risk reductions of 85% for mortality and 90% for opportunistic infection as our final calibrated
parameters. In sensitivity analyses, we varied these values widely from 0-100%.
2. Calibration to observed rates of switch from first-line to second-line ART
In preliminary analyses, we modeled perfect compliance with current recommendations for monitoring
the effectiveness of first-line ART and for switching to second-line ART when needed. These were based
on WHO 2010 and 2013 guidelines. In our initial analyses, monitoring included CD4 and RNA
monitoring at 6 and 12 months after ART initiation, then every 12 months thereafter. Detection and
confirmation of first-line ART failure was only possible after more than 24 weeks on ART, and was
modeled as follows:
Virologic failure: Observed RNA >5,000 copies/mL, confirmed by a second RNA test at least 1
month after the first
Immunologic failure: Observed CD4% <10% (for children <5 years old) or CD4 count <100/µL
(for children >5 years old), confirmed by a second CD4/CD4% test at least 1 month after the first
Clinical failure: Observed new or recurring WHO Stage 4 or TB event, confirmed with a
CD4/CD4% test at least 1 month after the clinical event.
In clinical practice, there may be both delays in detection of failure of first-line ART and intentional time
lags between observation of failure and switching to second-line ART (related to attempts to improve
adherence, concerns about toxicity of second-line ART, or lack of available second-line ART in
7

Ciaranello et al. First-line ART for HIV-infected children
appropriate formulations for age). This results in a wide range of reported rates of switching to second-
line ART in the published literature (Appendix Table D).3,8-15
For our final base-case analyses, we sought to model switching strategies that were based on current
guidelines, but that also seemed realistic to clinicians practicing in resource-limited settings and led to
rates of switching to second-line ART that were within published ranges. We created three scenarios to
encompass the range of published values: 1) a switch to second-line immediately after confirmation of
first-line ART failure as described above (as in our initial analyses); 2) a scenario in which patients and
providers deliberately waited 6 months between confirmation of failure and switch to second-line ART
(for example, reflecting a delay to availability of second-line formulations, or an attempt at an adherence
intervention prior to switching); and 3) a scenario without RNA monitoring, in which patients switched 6
months after clinical or CD4-based detection and confirmation of first-line ART failure (Appendix Table
E). Based on these results, we chose for our final base-case analysis the second scenario, which included
a deliberate 6-month delay between confirmation of failure and switch to second-line ART.
Sensitivity analyses
The model accounts for first-order uncertainty (between-patient variability) through the microsimulation
of large cohorts of patients. Following the guidance of the International Society for Pharmacoeconomics
and Outcomes Research, we examine the impact of second-order uncertainty (uncertainty in data
parameters and assumptions) through wide-ranging univariate and multivariate sensitivity analyses on all
model input parameters and assumptions.16 In addition to the sensitivity analyses described in the main
manuscript, we also examined variations in many treatment strategies, at the request of the WHO
Maternal-Child Health HIV Guidelines Committee.17,18
8

Ciaranello et al. First-line ART for HIV-infected children
Parameters and strategies varied in sensitivity analyses included:
HIV disease progression: rate of CD4%/CD4 decline, OI risks, and HIV-related mortality risks
were varied from 0.5 to 2.0x the base-case values alone and in combination
Loss to follow-up rates: 0, 0.2, 0.4, or 0.8% per month. These were varied equally for all ART
regimens (the impact of tolerability differences between regimens was reflected in rates of late
virologic failure, rather than in differential rates of loss to follow-up).
ART initiation:
o WHO 2010 guidelines: ART initiation in all children <24 months of age; ART initiation
in children 24-35 months of age with CD4 <25% or WHO Stage 3/4 disease19
ART monitoring and switching:
o CD4 monitoring: none; every 6, 12, or 24 months; and every 6 months only before
initiation of ART (with only RNA monitoring thereafter)
o RNA monitoring: none; every 6, 12, or 24 months
o Clinic visits: every 3, 6, or 12 months
o ART switching policies: 0, 6, and 12-month delay between detection of failure and
initiation of second-line ART; require both observed clinical or virologic failure AND
CD4 ≤10% or ≤100 cells/µL
ART-related clinical outcomes:
o Time horizon for initial RNA suppression: 24, 48 weeks
o First-line ART efficacy (suppression to RNA <400 copies/mL at 24 or 48 weeks): use of
the clinical and virologic outcomes from the subgroup of children enrolling before 3
years of age and treated with nevirapine or lopinavir/ritonavir in the PENPACT-1 trial
o Risk of “late” virologic failure (after initial RNA suppression to <400 copies/mL at 24 or
48 weeks): 0.46%/month (0.5 x base case), 3.6%/month (4 x base case), varied both
separately and together for each first- and second-line regimen9

Ciaranello et al. First-line ART for HIV-infected children
o Efficacy of second-line lopinavir/ritonavir-based ART, second-line NNRTI-based ART,
or both (RNA suppression to <400 copies/mL at 24 or 48 weeks): range from 10-80%
o CD4-independent impact of ART on OI and “chronic” mortality risk: Calibrated risk
reductions (see above) applied from ages 0-5, 0-13, and lifelong; risk reductions of 0-
100%
o In scenarios without HIV RNA monitoring, assume that remaining on a failing first-line
nevirapine leads to accumulation of drug resistance, with lower efficacy of second-line PI
(40, 50, 60%)
ART availability:
o One line of ART only
o Identical second-line ART regimen in both first-line lopinavir/ritonavir and first-line
nevirapine (two total lines of ART); costs and efficacy based on darunavir/ritonavir
(DRV/r) as an example, although this is not widely available nor approved for young
children
o Equal third-line ART in both strategies, again based on darunavir/ritonavir (first-line
lopinavir/ritonavir/second-line NNRTI/third-line darunavir/ritonavir; first-line
nevirapine/second-line LPV/r/third-line darunavir/ritonavir)
o Darunavir/ritonavir is available for second-line ART, but only following first-line
lopinavir/ritonavir (comparing first-line nevirapine/second-line lopinavir/ritonavir to
first-line lopinavir/ritonavir/second-line darunavir/ritonavir)
o Darunavir/ritonavir is available, and NNRTIs are not used following PI failure
(comparing first-line nevirapine/second-line lopinavir/ritonavir/third-line
darunavir/ritonavir to first-line lopinavir/ritonavir/second-line darunavir/ritonavir).
o Delay switching in children <3 years of age failing first-line LPV/r until they are able to
take efavirenz. In first-line lopinavir/ritonavir: children who fail first-line
10

Ciaranello et al. First-line ART for HIV-infected children
lopinavir/ritonavir before age 3 years remain on this failing regimen, and switch to
efavirenz when they reach 3 years of age (those failing after age 3 switch to efavirenz
immediately)
Costs:
o All ART costs halved, doubled (separately and together for each regimen)
o All clinical care costs halved, doubled
Discount rate (annual): 0% and 3% (base case), 5%, 8%
11

Ciaranello et al. First-line ART for HIV-infected children
RESULTS
Results of the base-case analysis and key sensitivity analyses are shown in the main manuscript. Here, we
highlight a few key findings in addition to those reported in the main manuscript. All other sensitivity
analyses listed in the Appendix Methods above did not lead to changes in policy conclusions, except
where noted in the manuscript: first-line lopinavir/ritonavir remained more effective and less expensive
than first-line nevirapine (results available from authors on request).
ART-related reduction in OI and mortality risk. When ART led to no relative reduction in
opportunistic infection and mortality risks at any age (compared to children or adults with the same
CD4%/CD4 count not on ART), life expectancies for both ART strategies were substantially lower
than in the base case (undiscounted LE: 10.9-11.7 years; Appendix Table A). First-line
lopinavir/ritonavir became both more effective and more expensive than first-line NVP, yet remained
very cost-effective in both countries. At intermediate values of this CD4-independent effect of ART,
and when this risk varied with age throughout childhood, adolescence, and adulthood, policy
conclusions were unchanged from the base case. While policy conclusions did not change when these
risks were varied with age, newly emerging data from long-term follow-up of adolescents will better
inform the lifetime projections for HIV-infected children.20
Comparisons between South Africa and Cote d’Ivoire healthcare costs. There were two key differences in
analyses using Côte d’Ivoire costs, compared to the base case analyses using costs from South Africa
(Manuscript Figure 1, Appendix Figure A, Appendix Table G). First, pediatric ART (with either regimen)
was very cost-effective, but was never cost-saving, even in the short-term, using Côte d’Ivoire costs.
Second, the time required for first-line lopinavir/ritonavir to become cost-saving compared to first-line
nevirapine was much longer using Côte d’Ivoire costs (26.4 years; Figure A, closed arrow) than using
South Africa costs (8.7 years; Manuscript Figure 1, closed arrow). Both results occur because clinical
care costs are much lower in Côte d’Ivoire than in South Africa, but medication costs are similar. The 12

Ciaranello et al. First-line ART for HIV-infected children
care costs saved by averting opportunistic infections and mortality with ART compared to no ART do not
offset the costs of the ART medications themselves. The care costs saved by averting opportunistic
infections and mortality with more effective lopinavir/ritonavir-based ART take much longer in Côte
d’Ivoire than in South Africa to offset the higher medication costs of lopinavir/ritonavir compared to
nevirapine.
Patient outcomes over time. The proportion of the modeled cohort that remains on first-line ART, has
switched to second-line ART, has become lost to follow-up, or has died at each month of the simulation is
shown in Appendix Figure B.
13

Ciaranello et al. First-line ART for HIV-infected children
Appendix Table A. Model input parameters (including those shown in Manuscript Table 1)
I. Natural History Clinical Inputs Value SourcesCD4% at presentation to care, by age
6 months 25% 21
12 months 22%24 and 36 months 19%
Rate of CD4%/ CD4 decline a Monthly Risk (%)4,22<3 months of age (CD4%) 4.0%
3-59 months of age (CD4%) 0.5% ≥60 months of age (CD4 cells/µL, range by HIV RNA) 3.0-6.4
Risk of clinical events (range by CD4%) a Monthly Risk (%)<6 months of age
WHO Stage 3 event (except tuberculosis) 5.2-7.8 4,22
WHO Stage 4 event (except tuberculosis) 1.6-3.5Tuberculosis (any body site) 0.5-1.1
6-59 months of ageWHO Stage 3 event (except tuberculosis) 3.3-11.6 4,22
WHO Stage 4 event (except tuberculosis) 1.4-6.4Tuberculosis (any body site) 0.8-3.8
≥60 months of ageMild fungal infection 1.8-3.1 4,22
Visceral bacterial infection 0.04-0.71WHO Stage 3 or 4 visceral disease 0.03-1.4WHO Stage 3 or 4 mucocutaneous disease 0.03-2.3Other WHO Stage 3 or 4 disease 0.02-0.73Other severe disease 0.19-1.7Other mild disease 2.4Tuberculosis (any body site) 0.03-1.7
Risk of death within 30 days of clinical event a 30-day risk (%)0-59 months of age
After WHO Stage 3 or 4 event 13.5 4,22
After TB event 11.1≥60 months of age
Mild fungal infection 0.5 4,22
Visceral bacterial infection 2.9WHO Stage 3 or 4 visceral disease 9.2WHO Stage 3 or 4 mucocutaneous disease 2.4Other WHO Stage 3 or 4 disease 20.0Other severe disease 6.7Other mild disease 0.4Tuberculosis (any body site) 1.8
Risk of HIV-related death (range by age, CD4%/CD4, and history of prior opportunistic disease) a
Monthly risk (%)0.1-40.8
23
14

Ciaranello et al. First-line ART for HIV-infected children
Appendix Table A, continued. Model input parameters (including those shown in Manuscript Table 1)
I. Natural History Clinical Inputs, continued Value SourcesRisk of non AIDS-related mortality (range by age in yearly
intervals, sex, country)Monthly risk (%)
23<12 months of age 0.41-0.4912-60 months of age 0.055-13 years of age 0.0113-18 years of age 0.01>18 years of age 0.01-0.10
Loss to follow-up prior to ART initiation 0.2 (sensitivity analysis: 0-0.8) 24,25
II. ART Clinical Inputs Value SourcesART efficacy: HIV RNA <400c/mL at 24 weeks [48 weeks] on ART b
P1060 PENPACT-1
Derived from3,26,27
First-line nevirapine strategy Nevirapine (in first-line ART) 75% [72%] 77% [73%]Lopinavir/ritonavir (in second-line ART) 75% [70%] 81% [70%]
(Sensitivity analysis: 10-80%)First-line lopinavir/ritonavir strategy
Lopinavir/ritonavir (in first-line ART) 91% [86%] 72% [72%]Nevirapine (in second-line ART) 75% [71%] 74% [66%]
(Sensitivity analysis: 10-80%)DRV-based regimen (sensitivity analysis) 95% (assumption)
CD4% increase on suppressive ART (first 6 months, after 6 months): children <60 months of age
Monthly increase
1st or 2nd line NNRTI regimen 2.2%, 0.7% Derived from3,26,271st or 2nd line PI regimen 1.9%, 0.4%
2nd or 3rd line DRV-based regimen (sensitivity analysis) 1.9%, 0.4% (assumption)CD4 increase on suppressive ART (first 6 months, after 6 months): any regimen, children ≥60 months of age
67.3, 3.4 cells/µL 28
Probability of virologic failure after initial suppression c Monthly riskAny regimen 0.91%
(Sensitivity analysis: 0.5-3.6%)Derived
from3,26,27
Reduction in event risk for patients on ART Relative risk reduction (%) d (sensitivity analysis: 0-100)
Risk of opportunistic infection (age 0-13) 85 2
Risk of opportunistic infection (age 13+) 32Mortality risk (age 0-13) 90Mortality risk (age 13+, range by CD4) 55-96%
Loss to follow-up after ART initiation 0.2 (sensitivity analysis: 0-0.8) 24,25
15

Ciaranello et al. First-line ART for HIV-infected children
Appendix Table A, continued. Model input parameters (including those shown in Manuscript Table 1)
III. Cost Inputs e Cost ( 2012 USD) SourcesOpportunistic infection care (per event; range by type of OI)
South Africa (<60 months of age) $1,420-2,490 29
Côte d’Ivoire (<60 months of age) $120-420 30
South Africa (≥60 months of age) $310-1,070 22
Côte d’Ivoire (≥60 months of age) $60-420 30
Routine care (per month, range by CD4) f
South Africa (<60 months of age) $25-205 22,31
Côte d’Ivoire (<60 months of age) $30-40 30,32
South Africa (≥60 months of age) $25-205 22,31
Côte d’Ivoire (≥60 months of age) $30-40 30,32
Care in the last month of lifeSouth Africa $800 22,31
Côte d’Ivoire $65 30,32
Antiretroviral regimen costs (per month, range by age/weight) g
Lopinavir/ritonavir (liquid: age <3 years (base-case) or <5 years (sensitivity analyses)
$17-27(Sensitivity analysis: ↑1-15x)
33,34
Lopinavir/ritonavir (pediatric or adult tablets) $13-29Nevirapine (pediatric or adult tablets) $3-8Nevirapine/zidovudine/lamivudine (pediatric or adult
tablets)$6-8
Abacavir/lamivudine (pediatric or adult tablets) $8-18Zidovudine/lamivudine (pediatric or adult tablets) $4-9Efavirenz (pediatric or adult tablets, age ≥3 years) $3-7Darunavir/ritonavir/abacavir/lamivudine (in sensitivity analyses only)
$36-$92
WHO: World Health Organization. TB: tuberculosis.a. In sensitivity analyses, all HIV-related event risks were varied from 0.5-2.0 x base-case values, due to lack of empiric data suggesting other ranges to examine. WHO Stage 4, Stage 4, and TB events were defined according to WHO classifications for HIV disease staging in children. b. ART efficacy: probability of suppressing HIV RNA to <400 copies/mL by 24 weeks (in base-case analysis) or 48 weeks (in sensitivity analysis) after initiation of ART.3,26,27 Due to small numbers of children and similar suppression rates on second-line ART in the P1060 trial (second-line NNRTI: n=9, 24-week suppression = 75%; second-line PI: n=48, 24-week suppression = 74%), we assigned a suppression rate of 75% to both second-line regimens.c. The monthly risk of virologic failure for those who initially suppress on ART was calculated from the difference in suppression risks at the earliest (24 or 48 weeks, depending on modeled scenario) and latest observed time point in the P1060 and PENPACT-1 trials.d. Compared to children not on ART with similar CD4 (see text)e. In sensitivity analyses, all costs were varied from 0.5-2.0 times the costs shown.f. Routine clinical care costs include CD4 and viral load monitoring, according to the modeled scenario. g. Monthly ART drug doses were calculated for children ages 0-13 years old based on the WHO weight-based dosing recommendations. Daily doses were then multiplied by unit drug costs from the May 2012 Clinton Health Access Initiative (CHAI) ARV price list to determine monthly ART costs by age and weight. All children were assumed to receive liquid/syrup drug formulations until age 3 years for lopinavir/ritonavir (5 years in sensitivity analyses), and until age 6 months for all other medications, for which dispersible tablets are available. After these ages, children were assumed to transition to pediatric or adult tablet formulations based on weight-based dosing recommendations. Fixed dose combinations were assumed to be used where available.34 In the absence of data on DRV/r costs for children, we assumed third-line ART would have costs equal to twice first-line LPV/r-based regimen costs.
16

Ciaranello et al. First-line ART for HIV-infected children
Appendix Table B: Calibration of the CD4-independent impact of ART: Identification of multipliers producing closest fit to observed mortality for children presenting to care at 12 months of age, treated with the first-line nevirapine strategy
Relative risk reduction (for mortality; OI risk) aRate/100PY
(2-year average)Rate/100PY
(4-year average)P1060: observed mortality rate (comparator; median follow-up: 72-weeks) 3.29
100%, 100% 2.57 1.8795%, 95% 3.38 2.6290%, 95% 3.98 3.0295%, 90% 4.04 3.2390%, 90% 4.67 3.6585%, 90% 5.34 4.2590%, 75% 6.62 5.4075%, 85% 7.28 5.5475%, 75% 8.59 6.7450%, 85% 10.56 7.7390%, 50% 9.66 8.1325%, 85% 13.82 9.8790%, 25% 12.54 10.7150%, 50% 15.25 11.760%, 85% 17.14 12.0490%, 0% 15.24 13.1925%, 25% 21.59 16.520%, 0% 27.72 21.07
Yellow highlighting indicates model projections that best fit mortality data from the P1060 trial (please see text).a. Compared to children not on ART with similar CD4 (see text).
17

Ciaranello et al. First-line ART for HIV-infected children
Appendix Table C: Projected mortality and opportunistic infection rates, reflecting a range of values for the CD4-independent impact of ART on mortality and OI risk a
Mortalityrate/100PY b
WHO3Rate/100PY
WHO4Rate/100PY
TB Rate/100PY Model-projected life expectancy (undiscounted,
years)P1060 Trial 3.29 9.30 0.73 5.60 n/aBest-fitting model resultsReduction in OI risk of 85%, reduction in mortality risk of 90% (applied to ages 0-13) c CEPAC – first-line NVP
4.25 10.11 4.74 2.66 27.61
CEPAC – first-line LPV/r
3.98 9.45 4.36 2.41 28.79
Range of model results: lower bound of event risksReduction in OI risk of 95%, reduction in mortality risk of 95% (applied lifelong) c CEPAC – first-line NVP
2.62 5.15 2.43 1.35 40.39
CEPAC – first-line LPV/r
2.51 4.90 2.29 1.26 41.09
Range of model results: upper bound of event risksNo reduction in OI risk or mortality risk (applied lifelong) c CEPAC – first-line NVP
21.07 45.34 20.29 11.41 10.90
CEPAC – first-line LPV/r
19.68 44.01 19.40 10.77 11.64
a. Results are shown for a cohort of children presenting to care at 12 months of age.b. P1060 mortality rates were observed over a median duration of follow-up of 72 weeks. Model-projected rates were calculated over 4 years of follow-up, to generate more stable estimates.c. Compared to children not on ART with similar CD4 (see text). Except where noted, values derived from adults were applied after age 13 (Appendix Table A).2
18

Ciaranello et al. First-line ART for HIV-infected children
Appendix Table D: Published rates of switching from first- to second-line pediatric ART Study Name Study
LocationStudy Size
Study years Median Age ART Regimen Switches to Second-line
Sauvageot et al, Pediatrics 20108
Africa and Asia
3,936 2002-2008 2.6 years(1.7-3.7)
d4T/3TC/NVP: 39.7%d4T/3TC/EFV: 1.3%AZT/3TC/NVP: 49.8%AZT/3TC/EFV: 0.7%Other: 8.5%
33 patients (0.8%) switched to second-line ART after median time of 27.3 months
Probability of remaining on first-line regimen after 24 months of ART was 0.99. Values were not significantly different when stratified by age at initiation.
EPPICC9 13 European countries
(9 cohorts)
437 1996-2008 3.7 months 3-drug NNRTI based: 24%4-drug NNRTI based: 14%Boosted PI with two NRTIs: 15%Unboosted PI with 2-3 NRTIs:38%PI and NNRTI with/out NRTI or 3 NRTIs: 8%
18% (77/437) switched to second-line ART after median f/u of 5.9 years
84% (41/49 with information available) switched due to treatment failure
4 drug NNRTI or boosted PI regimens were slower to switch
PENPACT-13 North America,
South America, Europe
263 2002-2005 3.5 years LPV/r based: 25%NFV based: 24%RTV or FPVr/r: 1%EFV-based: 31%NVP-based: 19%
188 children (71%) were still on first-line ART after median 5 years of follow up (23% switch at 5y)
60/263 switched to second-line (28 PI group, 32 NNRTI group)
15/263 discontinued ART after first-line ART
Prendergast et al, AIDS 200810
South Africa 63 2003-2005 26 days ZDV/3TC/NFV/NVP 10/63 (16%) infants started second-line ART within 1 year
5/10 due to concurrent TB treatment 4/10 due to virological failure 1/10 both
CHIPS (Walker et al, AIDS 2004)11
UK and Ireland
265 1996-2003 4.2 years 108/265 (41%) PI containing regimen126/265 (48%) NNRTI containing regimen2/265 (1%) both PI and NNRTI containing regimen29/265 (11%) ABC and other NRTIs7 children started LPV/r28 started a four-drug regimen
6 months post ART, 197/265 (87%) still on initial ART regimen with 99% still considered to be on first-line ART (1% switch at 6m)
19

Ciaranello et al. First-line ART for HIV-infected children
Appendix Table D: Published rates of switching from first-line to second-line pediatric ART, continuedStudy Name Study
LocationStudy Size
Study years Median Age ART Regimen Switches to Second-line
Davies et al, JAIDS 201112
South Africa 5,485 1999-2008 42 months d4T and 3TC based: 89%NVP as 3rd drug: 5%EFV as 3rd drug: 55%LPV/r as 3rd drug: 33%RTV as 3rd drug: 7%
Probability of failure (second elevated value > 1,000 copies/mL) by 36 months: 19.3%
Of those with virologic failure, 59% had never been virologically suppressed. After >1 year of follow-up post failure, 38% were switched to second-line.
Probability of switching to second-line by 3 years after ART initiation for all children = 6.2%.
Median time to switch from failure = 5.7 months
A PI-based initial regimen was negatively associated with switching.
Bacha et al, BMC ID 201213
Ethiopia 1,186 2005-2011 6.22 years d4T/3TC/NVP: 32.7%d4T/3TC/EFV: 8.9%AZT/3TC/NVP: 25.3%AZT/3TC/EFV: 30.4%
14.1% of children had evidence of first-line failure
5.9% clinical failure only 6.7% immunologic failure only 1.5% had immunologic and clinical failure Of those with failure, 14.4% were identified
as having failed first-line ART and switched to second-line.
Mean time of fail detection: 19.7 months Mean time to switch: 24 months
ARROW14 Uganda and Zimbabwe
1,206 2007-2008 5.9 years (clinical
monitoring)
6.0 years (routine lab monitoring)
Group A: NNRTI/3TC/ABC (n=397)Group B: NNRTI/3TC/ABC/AZT for 36 weeks, then stop AZT (n=404)Group C: NNRTI/3TC/ABC/AZT for 36 weeks, then stop NNRTI (n=405)
Clinical Monitoring: 28 children (5%) switched to second-line after median 4 years (median time to switch = 2.8 years)
Routine Lab Monitoring (no viral load monitoring): 35 children (6%) switched to second-line after median 4 years (median time to switch = 2.2 years)
CHER15 South Africa 377 2005-2007 7.4 weeks LPV/r + AZT + 3TC 7 children (1.9%) switch to second-line over 5 years – with viral load monitoring
Abbreviations: d4T: stavudine, 3TC: lamivudine, NVP: nevirapine, EFV: efavirenz, AZT: zidovudine, NNRTI: non-nucleoside reverse transcriptase inhibitor, ART: antiretroviral therapy, PI: protease inhibitor (boosted: combined with low-dose ritonavir), NRTI: nucleoside reverse transcriptase inhibitor, LPV/r: lopinavir/ritonavir, NFV: nelfinavir, RTV: ritonavir, FPV: fosamprenavir, TB: tuberculosis, ABC: abacavir.
20

Ciaranello et al. First-line ART for HIV-infected children
Appendix Table E: Modeled proportion of cohort on second-line ART at key time points a
Years Post ART Initiation
Switch immediately after confirmation of failure
Wait 6 months after failure confirmation to switch
No RNA monitoring; switch 6 months after confirmation of failure
(comparison)First-line NVP First-line LPV/r First-line NVP First-line LPV/r First-line NVP First-line LPV/r
6 Months 0.00% 0.00% 0.00% 0.00% 0.00% 0.00%12 Months 22.80 % 8.40% 0.01% 0.01% 0.00% 0.00%24 Months 22.84% 9.46% 21.23% 7.89% 4.33% 1.93%36 Months 28.24% 16.83% 21.59% 9.22% 6.32% 2.61%48 Months 32.76% 23.02% 26.86% 16.33% 10.07% 3.96%60 Months 37.16% 28.86% 32.36% 23.46% 14.15% 5.64%
NVP: nevirapine; LPV/r: lopinavir/ritonavir; ART: antiretroviral therapy; LE: life expectancy (years)a. Results are shown for a cohort of children presenting to care at 12 months of age. Proportions are of the original presenting cohort; children who die or are lost to follow-up are included in the denominator of each calculation. When limited to children in care and on ART, proportions on second-line ART will be higher than those shown here.
21

Ciaranello et al. First-line ART for HIV-infected children
Appendix Table F. Sensitivity analysis results (including results from Manuscript Table 3)
ART StrategyUndiscounted
LE (Years)DiscountedLE (Years)
Discounted Lifetime Costs
($US 2012)
Incremental cost-effectiveness ratio ($/years life saved)
A. South AfricaPresenting Age = 6 months
No ART 2.50 2.23 8,520First-line LPV/r 27.45 16.31 20,620 860First-line NVP 26.29 15.81 21,960 Dominateda
Presenting Age = 12 months (base-case, as reported in main manuscript)No ART 2.83 2.52 10,290First-line LPV/r 28.79 17.11 21,950 800First-line NVP 27.61 16.59 23,370 Dominated
Presenting Age = 24 monthsNo ART 3.54 3.09 12,650First-line LPV/r 28.71 17.10 22,590 710First-line NVP 27.52 16.59 24,060 Dominated
Presenting Age = 35 months No ART 4.71 4.03 14,420First-line LPV/r 29.46 17.60 23,240 650First-line NVP 28.36 17.11 24,790 Dominated
One line of ART available No ART 2.83 2.52 10,290First-line NVP 22.42 14.57 24,890 1,210First-line LPV/r 23.84 15.31 26,490 2,190
Stop second-line ART at failureNo ART 2.83 2.52 10,290First-line NVP 23.76 15.03 17,360 565First-line LPV/r 25.18 15.74 17,760 570
Require CD4 confirmation ( ≤10% or ≤100 cells/µL) of observed first-line ART failureNo ART 2.83 2.52 10,290First-line NVP 27.23 16.35 23,850 Weakly dominatedb
First-line LPV/r 28.64 16.95 24,040 950No HIV RNA monitoring available
No ART 2.83 2.53 10,300First-line LPV/r 28.69 16.96 22,240 830First-line NVP 27.09 16.25 22,760 Dominated
Third line ART = DRV/r for both strategiesNo ART 2.83 2.52 10,290First-line LPV/r 32.90 18.32 25,520 960First-line NVP 31.83 17.92 25,670 Dominated
No CD4 or viral load monitoringNo ART 2.83 2.52 10,280First-line LPV/r 26.78 16.26 24,620 1,040First-line NVP 25.51 15.65 25,490 Dominated
22

Ciaranello et al. First-line ART for HIV-infected children
Appendix Table F. Sensitivity analysis results, continued
ART Strategy(ordered by cost)
Undiscounted LE (Years)
DiscountedLE (Years)
Discounted Lifetime Costs
($US 2012)
Incremental cost-effectiveness ratio ($/years life saved)
A. South Africa, continued.Second-line ART = DRV/r for both strategies
No ART 2.83 2.52 10,290First-line NVP 29.02 17.12 28,040 1,220First-line LPV/r 30.07 17.56 28,680 1,470
DRV/r follows LPV/r in first-line LPV/r (no change to first-line NVP) No ART 2.83 2.52 10,290First-line NVP 27.61 16.59 23,370 930First-line LPV/r 30.07 17.56 28,680 5,460
DRV/r follows LPV/r in both strategies (NNRTIs not used in second-line after first-line LPV/r)No ART 2.83 2.52 10,290First-line NVP 31.83 17.92 25,670 1,000First-line LPV/r 30.07 17.56 28,680 Dominated
PENPACT-1 ART efficaciesNo ART 2.83 2.52 10,290First-line LPV/r 29.28 16.96 22,240 Weakly dominatedFirst-line NVP 30.42 17.39 22,370 810
Second-line NNRTI efficacy = 40%No ART 2.83 2.52 10,290First-line LPV/r 26.51 16.26 23,010 930First-line NVP 27.61 16.59 23,370 1,110
1.7x late failure for first-line LPV/r (1.5%/month: first-line NVP becomes more effective) e
No ART 2.83 2.52 10,290First-line LPV/r 27.12 16.58 22,050 840First-line NVP 27.61 16.59 23,370 185,090
2.1x late failure for first-line LPV/r (1.9%/month: first-line NVP more effective and cost-effective) e
No ART 2.83 2.52 10,290First-line LPV/r 26.60 16.38 22,070 850First-line NVP 27.61 16.59 23,370 6,310
4.5x cost of liquid LPV/r ($80-105 per month for children <3 years of age)No ART 2.83 2.52 10,290First-line NVP 28.77 16.59 23,480 Weakly dominatedFirst-line LPV/r 27.58 17.10 23,510 910
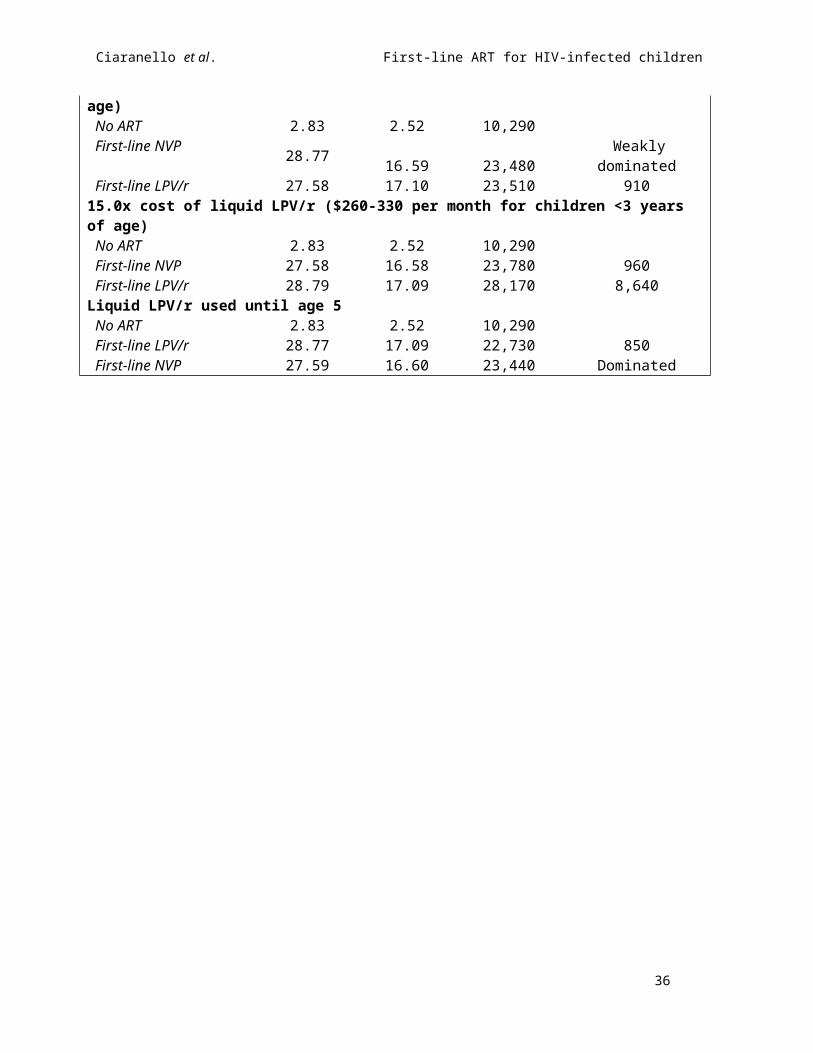
15.0x cost of liquid LPV/r ($260-330 per month for children <3 years of age)No ART 2.83 2.52 10,290First-line NVP 27.58 16.58 23,780 960First-line LPV/r 28.79 17.09 28,170 8,640
Liquid LPV/r used until age 5No ART 2.83 2.52 10,290First-line LPV/r 28.77 17.09 22,730 850First-line NVP 27.59 16.60 23,440 Dominated
23

Ciaranello et al. First-line ART for HIV-infected children
Appendix Table F. Sensitivity analysis results, continued
ART Strategy(ordered by cost)
Undiscounted LE (Years)
DiscountedLE (Years)
Discounted Lifetime Costs
($US 2012)
Incremental cost-effectiveness ratio ($/years life saved)
A. South Africa, continued.Intermediate additional impact of ART (relative risk reductions: 50% for OI, 50% for mortality, applied lifelong)c
No ART 2.83 2.52 10,290First-line LPV/r 19.83 12.27 16,810 670First-line NVP 18.71 11.69 17,190 Dominated
Additional impact of ART applied only to ages 0-13No ART 2.83 2.52 10,290First-line LPV/r 23.09 15.08 17,970 610First-line NVP 22.13 14.63 18,950 Dominated
No CD4-independent impact of ART (relative risk reductions: 0% for OI, 0% for mortality, applied lifelong)c
No ART 2.83 2.52 10,290First-line NVP 10.91 7.44 12,250 400First-line LPV/r 11.67 7.89 12,430 420
Discount rate: 5% per yearNo ART 2.83 2.36 9,660First-line LPV/r 28.79 13.16 16,100 600First-line NVP 27.61 12.85 17,100 Dominated
Discount rate: 8% per yearNo ART 2.83 2.17 8,910First-line LPV/r 28.79 9.70 11,400 330First-line NVP 27.61 9.52 11,960 Dominated
B. Cote d’Ivoire healthcare costs d
Presenting Age = 6 monthsNo ART 2.49 2.24 1,600First-line LPV/r 27.46 16.31 14,360 910First-line NVP 26.30 15.80 14,710 Dominated
Presenting Age = 12 months No ART 2.83 2.52 1,820First-line LPV/r 28.79 17.11 15,120 910First-line NVP 27.62 16.58 15,480 Dominated
Presenting Age = 24 monthsNo ART 3.55 3.09 2,180First-line LPV/r 28.74 17.10 15,170 930First-line NVP 27.53 16.60 15,570 Dominated
Presenting Age = 35 monthsNo ART 4.71 4.03 2,680First-line LPV/r 29.48 17.60 15,720 960First-line NVP 28.36 17.14 16,200 Dominated
24

Ciaranello et al. First-line ART for HIV-infected children
Appendix Table F. Sensitivity analysis results, continued
ART Strategy(ordered by cost)
Undiscounted LE (Years)
DiscountedLE (Years)
Discounted Lifetime Costs
($US 2012)
Incremental cost-effectiveness ratio ($/years life saved)
B. Cote d’Ivoire healthcare costs, continued One line of ART available
No ART 2.83 2.52 1,820First-line NVP 22.40 14.59 12,410 880First-line LPV/r 23.86 15.29 16,030 5,130
Stop second-line ART at failureNo ART 2.83 2.52 1,820First-line NVP 23.73 15.05 12,420 850First-line LPV/r 25.21 15.77 13,480 1,480
Require CD4 confirmation ( ≤10% or ≤100 cells/µL) of observed first-line ART failureNo ART 2.83 2.52 1,820First-line NVP 27.23 16.36 14,900 950First-line LPV/r 28.63 16.95 16,240 2,280
No HIV RNA monitoring availableNo ART 2.84 2.52 1,820First-line NVP 27.11 16.25 13,340 840First-line LPV/r 28.69 16.96 14,330 1,390
Third-line ART = DRV/r for both strategiesNo ART 2.83 2.52 1,820First-line NVP 31.77 17.94 20,580 1,220First-line LPV/r 32.88 18.35 21,130 1,330
No CD4 or viral load monitoringNo ART 2.83 2.53 1,820First-line NVP 25.50 15.66 12,190 790First-line LPV/r 26.79 16.25 13,150 1,600
Second-line ART = DRV/r for both strategiesNo ART 2.83 2.52 1,820First-line NVP 28.99 17.15 21,450 1,340First-line LPV/r 30.09 17.55 22,780 3,250
DRV/r follows LPV/r in first-line LPV/r (no change to first-line NVP) No ART 2.83 2.52 1,820First-line NVP 27.62 16.58 15,480 970First-line LPV/r 30.09 17.55 22,780 7,470
DRV/r follows LPV/r in both strategies (NNRTIs not used in second-line after first-line LPV/r)No ART 2.83 2.52 1,820First-line NVP 31.77 17.94 20,580 1,220First-line LPV/r 30.09 17.55 22,780 Dominated
PENPACT ART efficaciesNo ART 2.83 2.52 1,820First-line LPV/r 29.24 16.95 15,000 910First-line NVP 30.33 17.37 16,030 2,400
25

Ciaranello et al. First-line ART for HIV-infected children
Appendix Table F. Sensitivity analysis results, continued
ART Strategy(ordered by cost)
Undiscounted LE (Years)
DiscountedLE (Years)
Discounted Lifetime Costs
($US 2012)
Incremental cost-effectiveness ratio ($/years life saved)
B. Cote d’Ivoire healthcare costs, continued Second-line NNRTI efficacy = 40%
No ART 2.83 2.52 1,820First-line LPV/r 26.48 16.26 14,520 930First-line NVP 27.62 16.58 15,480 3,010
Second-line NNRTI efficacy = 15%No ART 2.83 2.52 1,820First-line LPV/r 24.81 15.65 14,090 940First-line NVP 27.62 16.58 15,480 1,500
1.7x late failure for first-line LPV/r (1.5%/month: first-line NVP becomes more effective) e
No ART 2.83 2.52 1,820First-line LPV/r 27.14 16.56 14,260 890First-line NVP 27.62 16.58 15,480 56,160
2.0x late failure for first-line LPV/r (1.8%/month: first-line NVP more effective and cost-effective) e
No ART 2.83 2.52 1,820First-line LPV/r 26.71 16.43 14,050 880First-line NVP 27.62 16.58 15,480 9,560
3.5 cost of liquid LPV/r ($65-85 per month for children <3 years of age)No ART 2.83 2.52 1,820First-line NVP 27.58 16.58 15,560 980First-line LPV/r 28.81 17.10 16,240 1,300
Liquid LPV/r used until age 5No ART 2.83 2.52 1,820First-line NVP 27.55 16.56 15,530 Weakly dominatedFirst-line LPV/r 28.80 17.09 15,910 970
Intermediate CD4-independent impact of ART (relative risk reductions: 50% for OI, 50% for mortality, applied lifelong)b
No ART 2.83 2.52 1,820First-line NVP 18.67 11.71 11,000 Weakly dominatedFirst-line LPV/r 19.79 12.29 11,140 960
CD4-independent impact of ART applied only to ages 0-13No ART 2.83 2.52 1,820First-line LPV/r 23.13 15.07 13,490 930First-line NVP 22.16 14.63 13,500 Dominated
No CD4-independent impact of ART (relative risk reductions: 0% for OI, 0% for mortality, applied lifelong)d
No ART 2.83 2.52 1,820First-line NVP 10.89 7.45 7,160 Weakly dominatedFirst-line LPV/r 11.62 7.89 7,550 1,070
26

Ciaranello et al. First-line ART for HIV-infected children
Appendix Table F. Sensitivity analysis results, continued
ART Strategy(ordered by cost)
Undiscounted LE (Years)
DiscountedLE (Years)
Discounted Lifetime Costs
($US 2012)
Incremental cost-effectiveness ratio ($/years life saved)
B. Cote d’Ivoire healthcare costs, continued Discount rate: 5% per year
No ART 2.83 2.36 1,710First-line LPV/r 28.79 13.17 11,810 930First-line NVP 27.61 12.85 11,860 Dominated
Discount rate: 8% per yearNo ART 2.83 2.17 1,580First-line NVP 27.61 9.52 8,660 960First-line LPV/r 28.79 9.70 8,850 1,050
LE: life expectancy. ICER: incremental cost-effectiveness analysis. ART: antiretroviral therapy. LPV/r: lopinavir/ritonavir. NVP: nevirapine. DRV/r: darunavir/ritonavir. ART: antiretroviral therapy. Costs are in 2012 USD. Discounting is at 3%/year unless otherwise indicated.a. Dominated: Here, refers to a strategy that is more expensive and less effective than its alternative.b. Weakly dominated: Here, refers to extended dominance: the incremental cost-effectiveness ratio (ICER) of the non-dominated strategy compared to the dominated strategy is less than the ICER of the dominated strategy compared to no ART, indicating that the dominated strategy is an inefficient use of healthcare resources.c. Compared to children or adults at similar CD4% or CD4 not on ART (see text).d. Incremental cost-effectiveness ratios (ICERs) are generally lower in sensitivity analyses for South Africa than for Côte d'Ivoire because in South Africa, the costs of HIV-related healthcare are high, relative to the costs of ART; in Côte d'Ivoire, care costs are low, relative to ART costs. Much of the difference between first-line NVP and first-line LPV/r are due to differences in drug costs, rather than differences in care costs. Sensitivity analyses that change the relative drug costs between the two strategies lead to larger cost differences in Côte d'Ivoire than they do in South Africa.
27

Ciaranello et al. First-line ART for HIV-infected children
APPENDIX TABLE G. Projected costs and survival by year after presentation to care a
A. South Africa costs (HIV-infected children, presenting to care at 12 months of age) Proportion Alive Cumulative CostsYear No ART 1st Line PI 1st Line NNRTI No ART 1st Line PI 1st Line NNRTI0 1.00 1.00 1.00 0 0 01 0.63 0.94 0.93 3,060 1,510 1,4002 0.40 0.90 0.90 5,200 2,530 2,3903 0.24 0.88 0.87 6,720 3,380 3,2304 0.16 0.85 0.84 7,770 4,150 4,0005 0.14 0.85 0.84 8,150 4,870 4,7406 0.12 0.84 0.83 8,500 5,560 5,4507 0.10 0.83 0.82 8,810 6,220 6,1508 0.09 0.82 0.81 9,070 6,890 6,8609 0.07 0.81 0.80 9,290 7,530 7,55010 0.06 0.80 0.79 9,470 8,150 8,23011 0.05 0.79 0.78 9,620 8,750 8,88012 0.04 0.78 0.77 9,740 9,320 9,52013 0.04 0.77 0.75 9,840 9,910 10,20014 0.03 0.75 0.74 9,930 10,490 10,86015 0.03 0.74 0.72 9,990 11,040 11,49016 0.02 0.72 0.70 10,050 11,570 12,11017 0.02 0.71 0.68 10,090 12,090 12,71018 0.02 0.69 0.66 10,130 12,600 13,29019 0.01 0.67 0.65 10,160 13,090 13,85020 0.01 0.65 0.63 10,180 13,570 14,40021 0.01 0.63 0.61 10,200 14,030 14,93022 0.01 0.61 0.59 10,220 14,480 15,44023 0.01 0.60 0.57 10,230 14,920 15,92024 0.01 0.58 0.55 10,240 15,340 16,39025 0.00 0.56 0.53 10,250 15,740 16,84026 0.00 0.54 0.51 10,260 16,130 17,27027 0.00 0.52 0.49 10,260 16,500 17,68028 0.00 0.50 0.47 10,270 16,860 18,08029 0.00 0.48 0.45 10,270 17,200 18,45030 0.00 0.46 0.43 10,280 17,530 18,800
28

Ciaranello et al. First-line ART for HIV-infected children
APPENDIX TABLE G. Projected costs and survival by year after presentation to care B. Côte d'Ivoire costs (HIV-infected children, presenting to care at 12 months of age)
YearProportion Alive Cumulative Costs
No ART 1st Line PI 1st Line NNRTI No ART 1st Line PI 1st Line NNRTI0 1.00 1.00 1.00 0 0 01 0.63 0.94 0.93 600 1,060 8902 0.40 0.90 0.90 970 1,910 1,6103 0.24 0.88 0.87 1,210 2,650 2,2804 0.16 0.85 0.84 1,360 3,340 2,9105 0.14 0.85 0.84 1,440 4,030 3,5506 0.12 0.84 0.83 1,500 4,680 4,1607 0.10 0.83 0.82 1,560 5,290 4,7508 0.09 0.82 0.81 1,610 5,900 5,3509 0.07 0.81 0.80 1,650 6,480 5,93010 0.06 0.80 0.79 1,680 7,030 6,48011 0.05 0.79 0.78 1,700 7,550 7,01012 0.04 0.78 0.77 1,730 8,040 7,51013 0.04 0.77 0.75 1,740 8,520 8,02014 0.03 0.75 0.74 1,760 8,970 8,51015 0.03 0.74 0.72 1,770 9,390 8,97016 0.02 0.72 0.70 1,780 9,780 9,41017 0.02 0.70 0.68 1,790 10,160 9,82018 0.02 0.69 0.66 1,790 10,510 10,21019 0.01 0.67 0.64 1,800 10,840 10,58020 0.01 0.65 0.62 1,800 11,160 10,93021 0.01 0.63 0.60 1,800 11,450 11,26022 0.01 0.61 0.58 1,810 11,720 11,58023 0.01 0.59 0.57 1,810 11,980 11,87024 0.01 0.58 0.55 1,810 12,220 12,14025 0.00 0.56 0.52 1,810 12,440 12,40026 0.00 0.54 0.50 1,810 12,660 12,64027 0.00 0.52 0.48 1,810 12,850 12,87028 0.00 0.50 0.47 1,810 13,040 13,08029 0.00 0.48 0.45 1,820 13,210 13,28030 0.00 0.46 0.43 1,820 13,370 13,460
a. These are model results that form the basis of Manuscript Figure 1 and Appendix Figure A.
29

Ciaranello et al. First-line ART for HIV-infected children
APPENDIX FIGURE LEGEND
Figure A. Projected survival and costs with alternative first-line pediatric ART regimens.
Results are shown for the sensitivity analysis using Côte d’Ivoire costs, for presenting to care at 12
months of age. The proportion of patients alive is on the left-hand vertical axis (blue lines) and the per-
person cumulative costs are on the right-hand vertical axis (black lines). Survival and per-person costs are
projected over 20 years (240 months) since presentation to care, shown on the horizontal axis. The no
ART strategy is represented by solid lines, first-line NVP by dashed lines, and first-line LPV/r by dotted
lines. The arrow indicates the time after presentation when first-line LPV/r becomes cost-saving
compared to first-line NVP: 317 months (26.4 years; see Appendix Results text). LPV/r:
lopinavir/ritonavir. NVP: nevirapine. ART: antiretroviral therapy.
Figure B. Patient outcomes over time. For both modeled first-line ART regimens, the proportion of the
modeled cohort that remains on first-line ART, has switched to second-line ART, has become lost to
follow-up, or has died at each month of the simulation is shown in Appendix Figure B. Panel A shows
results for the first-line nevirapine strategy, and panel B for the first-line lopinavir/ritonavir strategy.
LTFU: lost to follow-up; ART 1: first-line ART; ART 2: second-line ART.
30

Ciaranello et al. First-line ART for HIV-infected children
Figure A. Projected survival and costs with alternative first-line pediatric ART regimens: Côte d'Ivoire
0 13 26 39 52 65 78 91 1041171301431561691821952082212342472602732862993123253383510
0.1
0.2
0.3
0.4
0.5
0.6
0.7
0.8
0.9
1
0
2,000
4,000
6,000
8,000
10,000
12,000
14,000
16,000
Months Since Presentation to Care
Prop
ortio
n A
live
Per-person Cum
ulative Costs ($)
Survival No ART 1st Line NVP 1st Line LPV/rCost No ART 1st Line NVP 1st Line LPV/r
31

Ciaranello et al. First-line ART for HIV-infected children
Figure B. Patient outcomes over time.
A.
B.
32

Ciaranello et al. First-line ART for HIV-infected children
REFERENCES
1. Ciaranello AL, Morris BL, Walensky RP, et al. Validation and calibration of a computer
simulation model of pediatric HIV infection. PLoS ONE. 2013;8(12):e83389.
2. Losina E, Yazdanpanah Y, Deuffic-Burban S, et al. The independent effect of highly active
antiretroviral therapy on severe opportunistic disease incidence and mortality in HIV-infected
adults in Côte d'Ivoire. Antivir Ther. 2007;12(4):543-551.
3. Babiker A, Castro nee Green H, Compagnucci A, et al. First-line antiretroviral therapy with a
protease inhibitor versus non-nucleoside reverse transcriptase inhibitor and switch at higher
versus low viral load in HIV-infected children: an open-label, randomised phase 2/3 trial. Lancet
Infect Dis. Apr 2011;11(4):273-283.
4. Ciaranello AL, Lu Z, Ayaya S, et al. Incidence of WHO Stage 3 and 4 events, tuberculosis, and
mortality in untreated, HIV-infected children enrolling in care before 1 year of age: an IeDEA
(International Epidemiologic Databases to Evaluate AIDS) East Africa regional analysis. Pediatr
Infect Dis J. 2014;33(6):623-629.
5. Becquet R, Marston M, Dabis F, et al. Children who acquire HIV infection perinatally are at
higher risk of early death than those acquiring infection through breastmilk: a meta-analysis.
PLoS One. 2012;7(2):e28510.
6. Marston M, Becquet R, Zaba B, et al. Net survival of perinatally and postnatally HIV-infected
children: a pooled analysis of individual data from sub-Saharan Africa. Int J Epidemiol. Jan 18
2011;40(2):385-396.
7. Johnson LF, Mossong J, Dorrington RE, et al. Life expectancies of South African adults starting
antiretroviral treatment: collaborative analysis of cohort studies. PLoS Med.
2013;10(4):e1001418.
8. Sauvageot D, Schaefer M, Olson D, Pujades-Rodriguez M, O'Brien DP. Antiretroviral therapy
outcomes in resource-limited settings for HIV-infected children <5 years of age. Pediatrics. May
2010;125(5):e1039-1047.
33

Ciaranello et al. First-line ART for HIV-infected children
9. Judd A. Early antiretroviral therapy in HIV-1-infected infants, 1996-2008: treatment response and
duration of first-line regimens. AIDS. Nov 28 2011;25(18):2279-2287.
10. Prendergast A, Mphatswe W, Tudor-Williams G, et al. Early virological suppression with three-
class antiretroviral therapy in HIV-infected African infants. AIDS. Jul 11 2008;22(11):1333-1343.
11. Walker AS, Doerholt K, Sharland M, Gibb DM. Response to highly active antiretroviral therapy
varies with age: the UK and Ireland Collaborative HIV Paediatric Study. AIDS. Sep 24
2004;18(14):1915-1924.
12. Davies MA, Moultrie H, Eley B, et al. Virologic failure and second-line antiretroviral therapy in
children in South Africa--the IeDEA Southern Africa collaboration. J Acquir Immune Defic
Syndr. Mar 2011;56(3):270-278.
13. Bacha T, Tilahun B, Worku A. Predictors of treatment failure and time to detection and switching
in HIV-infected Ethiopian children receiving first line anti-retroviral therapy. BMC Infect Dis.
2012;12:197.
14. Anti-Retroviral Research for Watoto. ARROW Trial. 2013. Accessed 11 Nov 2014 at
http://www.arrowtrial.org/default.asp.
15. Cotton MF, Violari A, Otwombe K, et al. Early time-limited antiretroviral therapy versus
deferred therapy in South African infants infected with HIV: results from the children with HIV
early antiretroviral (CHER) randomised trial. Lancet. 2013;S0140-6736(13):61409-61409.
16. Briggs AH, Weinstein MC, Fenwick EA, Karnon J, Sculpher MJ, Paltiel AD. Model parameter
estimation and uncertainty: a report of the ISPOR-SMDM Modeling Good Research Practices
Task Force--6. Value Health. Sep-Oct 2012;15(6):835-842.
17. Ciaranello A, Babiker A, Doherty K, et al. First-line ART regimens for HIV-infected children: A
model-based cost-effectiveness analysis. Paper presented at: World Health Organization Maternal
and Child Health Guidelines Development Group Meeting; December 11-13, 2012; Geneva,
Switzerland.
34

Ciaranello et al. First-line ART for HIV-infected children
18. World Health Organization. Consolidated guidelines on the use of antiretrovirals for the treatment
and prevention of HIV infection, 2013. Accessed on 19 Nov 2014 at
http://www.who.int/hiv/pub/guidelines/arv2013/download/en/index.html.
19. World Health Organization. Antiretroviral therapy for HIV infection in infants and children:
Recommendations for a public health approach. 2010. Accessed on 21 Nov 2014 at
http://www.who.int/hiv/pub/paediatric/infants2010/en/index.html.
20. Myer L, Zar HJ. Cape Town Adolescent Antiretroviral Cohort (CTAAC). University of Cape
Town, South Africa: Eunice Kennedy Shriver National Institute of Child Health and Human
Development; R01 HD07451; 2012.
21. Embree J, Bwayo J, Nagelkerke N, et al. Lymphocyte subsets in human immunodeficiency virus
type 1-infected and uninfected children in Nairobi. Pediatr Infect Dis J. Apr 2001;20(4):397-403.
22. Holmes CB, Wood R, Badri M, et al. CD4 decline and incidence of opportunistic infections in
Cape Town, South Africa: implications for prophylaxis and treatment. J Acquir Immune Defic
Syndr. Aug 1 2006;42(4):464-469.
23. United Nations. World Population Prospects: The 2008 Revision. 2009. Accessed on 19 Nov
2014 at http://www.un.org/esa/population/publications/wpp2008/wpp2008_highlights.pdf.
24. Sutcliffe CG, van Dijk JH, Bolton C, Persaud D, Moss WJ. Effectiveness of antiretroviral therapy
among HIV-infected children in sub-Saharan Africa. Lancet Infect Dis. Aug 2008;8(8):477-489.
25. Ciaranello A, Chang Y, Margulis A, et al. Effectiveness of pediatric ART in resource-limited
settings: a systematic review and meta-analysis. Clin Infect Dis. 2009;49(12):1915-1927.
26. Violari A, Lindsey JC, Hughes MD, et al. Nevirapine versus ritonavir-boosted lopinavir for HIV-
infected children. N Engl J Med. Jun 21 2012;366(25):2380-2389.
27. Palumbo P, Lindsey JC, Hughes MD, et al. Antiretroviral treatment for children with peripartum
nevirapine exposure. N Engl J Med. Oct 14 2010;363(16):1510-1520.
28. Tuboi SH, Brinkhof MW, Egger M, et al. Discordant responses to potent antiretroviral treatment
in previously naive HIV-1-infected adults initiating treatment in resource-constrained countries:
35
Ciaranello et al. First-line ART for HIV-infected children
the antiretroviral therapy in low-income countries (ART-LINC) collaboration. J Acquir Immune
Defic Syndr. May 1 2007;45(1):52-59.
29. Thomas LS. Costing of HIV/AIDS services at a tertiary level hospital in Gauteng Province.
Faculty of Health Sciences, University of Witwatersrand, South Africa;2006.
30. Anglaret X, Chene G, Attia A, et al. Early chemoprophylaxis with trimethoprim-
sulphamethoxazole for HIV-1-infected adults in Abidjan, Côte d'Ivoire: a randomised trial.
Cotrimo-CI Study Group. Lancet. May 1 1999;353(9163):1463-1468.
31. Cleary S, Chitha W, Jikwana S, Okorafor OA, Boulle A. Health Systems Trust: South African
Health Review. 2005. Accessed 18 Nov 2014 at http://www.healthlink.org.za/publications/682.
32. Yazdanpanah Y, Losina E, Anglaret X, et al. Clinical impact and cost-effectiveness of co-
trimoxazole prophylaxis in patients with HIV/AIDS in Côte d'Ivoire: a trial-based analysis. AIDS.
Aug 12 2005;19(12):1299-1308.
33. Clinton Health Access Initiative. Antiretroviral (ARV) Ceiling Price List. 2012. Accessed on 18
Nov 2014 at
http://d2pd3b5abq75bb.cloudfront.net/2012/07/12/15/03/07/163/CHAI_ARV_Ceiling_Price_List
_May_2012.pdf.
34. Doherty K, Essajee S, Penazzato M, Holmes C, Resch S, Ciaranello AL. Estimating age-based
antiretroviral therapy costs for HIV-infected children in resource-limited settings based on World
Health Organization weight-based dosing recommendations. BMC Health Services Research.
2014;14(201).
36