Cost-effectiveness assessment of energy efficiency obligation
97
Master of Science Thesis KTH School of Industrial Engineering and Management Energy Technology EGI-2013-060MSC Division of Energy and Climate Studies SE-100 44 STOCKHOLM Cost-effectiveness assessment of energy efficiency obligation schemes - implications for Swedish industries Maria Xylia [email protected]
Transcript of Cost-effectiveness assessment of energy efficiency obligation
Master of Science Thesis
KTH School of Industrial Engineering and Management
Energy Technology EGI-2013-060MSC
Division of Energy and Climate Studies
SE-100 44 STOCKHOLM
Cost-effectiveness assessment of energy
efficiency obligation schemes -
implications for Swedish industries
Maria Xylia

ii
Master of Science Thesis EGI 2013-060MSC
Cost-effectiveness assessment of energy
efficiency obligation schemes - implications
for Swedish industries
Maria Xylia
Approved
Examiner
Semida Silveira
Supervisor
Johannes Morfeldt
Commissioner
Contact person
Abstract
This thesis is an investigation of whether an energy efficiency obligation scheme would be cost-effective
for the Swedish industrial sector. The basic guidelines of the scheme were constructed based on the
characteristics proposed in the Energy Efficiency Directive and the previously implemented schemes in
other EU Member States. In order to measure the cost effectiveness of the scheme for the industries, a
Cost Benefit Analysis was performed. The results of the study show that the participation of the industries
in an energy efficiency obligation scheme seems to be cost effective, and the Benefit to Cost Ratios of the
analysis where ranging in numbers higher than one, showing that the benefits outweigh the costs. The
scheme is in general more cost effective when scenarios assuming high policy intensity for the whole
economy of the country are used as input for the calculation of the BCRs, which are also affected
positively when higher fuel prices scenarios are adopted. The obligation should be placed upon the
distributors, since the prices of energy distribution are administratively regulated. There is opportunity of
financial benefits for the Swedish industries from agreements of energy savings delivery to the distributors
in order for them to fulfill their obligation. These benefits will support the cost recovery of the
investments for the energy savings measures. The possibility of certificate trading in the context of the
scheme is another option that can create opportunities for financial gains and stimulate further the energy
market. Basing the costs inputs from other EU Member States offers an insight on how these costs could
be formed in the case of Sweden, but they cannot be taken as a complete calculation of the scheme’s
financial effects. As a result, this study does not offer a final conclusion on the cost-effectiveness of the
scheme; it rather serves as a means of support of the final conclusion regarding the cost-effectiveness of
energy efficiency obligation schemes for the Swedish industries.
Keywords: energy efficiency obligation scheme, CBA, BCR, Sweden, industry, iron and steel industry, white certificates, PFE,
EED, cost-effectiveness

iii
Table of Contents
Abstract ........................................................................................................................................................................... ii
List of Figures ................................................................................................................................................................ v
List of Tables ................................................................................................................................................................. vi
List of Abbreviations .................................................................................................................................................. vii
List of Unit Conversions ...........................................................................................................................................viii
Summary ........................................................................................................................................................................ ix
Acknowledgements ...................................................................................................................................................... xi
1 Introduction .......................................................................................................................................................... 1
1.1 Motivation .................................................................................................................................................... 1
1.2 Objective ...................................................................................................................................................... 4
1.3 Methodology ................................................................................................................................................ 4
1.3.1 Definition of the Cost – Benefit Analysis (CBA) ......................................................................... 6
1.3.2 Externalities affecting the economic efficiency of a policy scheme .......................................... 8
2 Energy efficiency improvement in the Swedish energy intensive industries ............................................10
2.1 Improving the energy efficiency of the iron and steel industry .........................................................12
3 Overview of policies for improving energy efficiency .................................................................................16
3.1 Experiences from the Swedish program for improving energy efficiency (Programmet för
energieffektivisering – PFE) .................................................................................................................................16
3.1.1 Outline ...............................................................................................................................................17
3.1.2 Coverage ............................................................................................................................................18
3.1.3 Impact and Results ..........................................................................................................................19
3.1.4 Cost-effectiveness ............................................................................................................................22
3.2 Energy efficiency obligation schemes in the EU .................................................................................22
3.2.1 Experience from other EU countries ...........................................................................................22
3.2.2 The EU Energy Efficiency Directive (EED) ..............................................................................25
3.2.3 Design of an energy efficiency obligation scheme .....................................................................27
3.3 Effects of the energy efficiency obligation scheme from the industry perspective........................29
3.3.1 Making the scheme cost-effective for the industry ....................................................................29
3.3.2 Energy efficiency obligation schemes from an energy systems efficiency perspective –
Waste heat utilization .........................................................................................................................................32
3.4 Implementation of an energy efficiency obligation scheme from an economic and policy
perspective ...............................................................................................................................................................33
3.4.1 Ability of the energy efficiency obligation scheme to address energy savings measures .....33
3.4.2 Costs of energy efficiency obligation schemes for other EU Member States ........................34
3.4.3 Comparison of energy efficiency obligation schemes and voluntary agreements .................35
3.4.4 Alternative policy instruments to replace PFE ...........................................................................36
4 Background of the Cost-Benefit Analysis ......................................................................................................37
iv
4.1.1 Calculation of energy savings potential of the industry .............................................................38
4.1.2 The PRIMES model ........................................................................................................................40
4.1.3 The future prices of electricity and other fuel types ...................................................................41
4.1.4 Energy consumption in the industry ............................................................................................43
4.1.5 Summary of energy saving potentials ...........................................................................................45
5 Cost-Benefit Analysis of Energy Efficiency Obligation Schemes ..............................................................48
5.1 Benefits of the energy saving measures .................................................................................................48
5.2 Costs of the energy-saving measures .....................................................................................................50
5.3 Cost-effectiveness of the energy efficiency obligation scheme .........................................................55
5.4 Market conformity and competitiveness ...............................................................................................57
5.5 Effects on the market for energy services .............................................................................................58
5.6 Follow-on effects of the instruments.....................................................................................................59
5.7 Interactions with other existing instruments ........................................................................................60
5.8 Political enforceability ..............................................................................................................................62
5.9 Financeability .............................................................................................................................................62
6 Discussion ...........................................................................................................................................................64
7 Conclusions .........................................................................................................................................................66
Bibliography .................................................................................................................................................................67
APPENDIX I: ENERGY SAVING POTENTIAL IN THE INDUSTRY ...................................................73
APPENDIX II: ENERGY SAVING POTENTIAL IN THE ENERGY INTENSIVE INDUSTRIES 74
APPENDIX III: ENERGY SAVING POTENTIAL IN THE IRON AND STEEL INDUSTRY .........75
APPENDIX IV: ENERGY CONSUMPTION IN THE INDUSTRY ...........................................................76
APPENDIX V: AVOIDED ENERGY COSTS ..................................................................................................77
APPENDIX VI: COSTS OF THE ENERGY EFFICIENCY OBLIGATION SCHEME ........................84

v
List of Figures
FIGURE 2-1: EXAMPLES OF TECHNICAL MEASURES FOR ENERGY EFFICIENCY IMPROVEMENT (TANAKA 2011) .......... 11 FIGURE 2-2: ENERGY USAGE IN THE SWEDISH IRON AND STEEL INDUSTRY BY FUEL FOR THE YEARS 1970-
2012(COAL AND COAL GAS, OIL, ELECTRICITY AND LPG/NATURAL GAS RESPECTIVELY) (JERNKONTORET
2013)......................................................................................................................................................................................... 12 FIGURE 2-3: A SIMPLIFIED PROCESS CHART FOR THE STEELMAKING PROCESSES (JOHANSSON AND SÖDERSTRÖM
2010)......................................................................................................................................................................................... 13 FIGURE 3-1: PROGRAM FLOW CHART (INSTITUTE FOR INDUSTRIAL PRODUCTIVITY 2012) ............................................. 17 FIGURE 3-2: COMPARISON OF ELIGIBLE AND PARTICIPATING COMPANIES CATEGORIZED BY ELECTRICITY
CONSUMPTION (STENQVIST AND NILSSON 2011) ........................................................................................................... 19 FIGURE 3-3 – A. EX-ANTE DEEMED ELECTRICITY SAVINGS FROM LISTED MEASURES OF THE SECOND-YEAR REPORT,
AS COMPARED TO THE COST RAISING EFFECT OF A FICTIVE MINIMUM TAX B. EX-POST MEASURED OR
ENGINEERING ESTIMATED ELECTRICITY SAVINGS FROM LISTED AND ADDITIONAL MEASURES OF THE FIFTH-
YEAR REPORT, AS COMPARED TO THE COST-RAISING EFFECT OF A FICTIVE MINIMUM TAX. SOURCE:
(STENQVIST AND NILSSON 2011) ....................................................................................................................................... 21 FIGURE 3-4: POLICY MEASURES PROFILE FOR THE INDUSTRIAL SECTOR IN SWEDEN (ENERGIMYNDIGHETEN 2012)
................................................................................................................................................................................................... 26 FIGURE 3-5: EVALUATION OF THE ENERGY EFFICIENCY OBLIGATION SCHEME RELATED TO OTHER POLICY
INSTRUMENTS FROM THE DANISH ENERGY AGENCY BASED ON THE COST OF ENERGY SAVINGS OF EACH
SCHEME (DANISH ENERGY ASSOCIATION 2011) ............................................................................................................. 31 FIGURE 4-1: STRUCTURE OF METHODOLOGY THAT WAS USED TO CALCULATE THE ENERGY EFFICIENCY
POTENTIALS (FRAUNHOFER ISI 2009) ............................................................................................................................... 38 FIGURE 4-2: MARKAL SYSTEMS ARCHITECTURE (PROFU I GÖTEBORG AB 2012) ........................................................... 41 FIGURE 4-3: FINAL ENERGY CONSUMPTION BY FUEL TYPE IN THE INDUSTRY SECTOR OF SWEDEN FOR THE YEARS
2002-2011 (EUROSTAT 2013) ............................................................................................................................................... 44 FIGURE 4-4:FINAL ENERGY CONSUMPTION BY FUEL TYPE IN THE ENERGY INTENSIVE INDUSTRIES OF SWEDEN FOR
THE YEARS 2002-2011 (EUROSTAT 2013) .......................................................................................................................... 44 FIGURE 4-5: FINAL ENERGY CONSUMPTION BY FUEL TYPE IN THE IRON AND STEEL INDUSTRY OF SWEDEN FOR THE
YEARS 2002-2011 (EUROSTAT 2013) .................................................................................................................................. 45 FIGURE 4-6: TOTAL, ELECTRICITY AND FUELS SAVING POTENTIAL FOR THE INDUSTRY IN THE YEARS 2012-2020
PRESENTED FOR LPI, HPI AND TECHNICAL SCENARIO ................................................................................................ 46 FIGURE 4-7: TOTAL, ELECTRICITY AND FUELS SAVING POTENTIAL FOR THE ENERGY INTENSIVE INDUSTRIES IN THE
YEARS 2012-2020 PRESENTED FOR LPI, HPI AND TECHNICAL SCENARIO ................................................................ 46 FIGURE 4-8: TOTAL, ELECTRICITY AND FUELS SAVING POTENTIAL FOR THE IRON AND STEEL INDUSTRY IN THE
YEARS 2012-2020 PRESENTED FOR LPI, HPI AND TECHNICAL SCENARIO ................................................................ 47 FIGURE 5-1: AVOIDED ENERGY COSTS FROM ACHIEVING THE ENERGY SAVING POTENTIALS IN THE INDUSTRY IN
SWEDEN................................................................................................................................................................................... 49 FIGURE 5-2: AVOIDED ENERGY COSTS FROM ACHIEVING THE ENERGY SAVING POTENTIALS IN THE ENERGY
INTENSIVE INDUSTRIES ........................................................................................................................................................ 50 FIGURE 5-3: AVOIDED ENERGY COSTS FROM ACHIEVING THE ENERGY SAVING POTENTIALS IN THE IRON AND
STEEL INDUSTRY .................................................................................................................................................................... 50 FIGURE 5-4:CALCULATION OF THE COSTS FOR THE INDUSTRY’S CASE OF AN ENERGY EFFICIENCY OBLIGATION
SCHEME FOR SWEDEN BASED ON THE COSTS OF THE RESPECTIVE SCHEMES OF DENMARK, ITALY AND
FRANCE/ADMINISTRATIVE COSTS CALCULATED ACCORDING TO ENERGIMYNDIGHETEN’S ESTIMATION ........ 53 FIGURE 5-5: CALCULATION OF THE COSTS FOR THE ENERGY INTENSIVE INDUSTRIES’ CASE OF AN ENERGY
EFFICIENCY OBLIGATION SCHEME FOR SWEDEN BASED ON THE COSTS OF THE RESPECTIVE SCHEMES OF
DENMARK, ITALY AND FRANCE/ADMINISTRATIVE COSTS CALCULATED ACCORDING TO
ENERGIMYNDIGHETEN’S ESTIMATION ............................................................................................................................. 54 FIGURE 5-6:CALCULATION OF THE COSTS FOR THE IRON AND STEEL INDUSTRY’S CASE OF AN ENERGY EFFICIENCY
OBLIGATION SCHEME FOR SWEDEN BASED ON THE COSTS OF THE RESPECTIVE SCHEMES OF DENMARK, ITALY
AND FRANCE/ADMINISTRATIVE COSTS CALCULATED ACCORDING TO ENERGIMYNDIGHETEN’S ESTIMATION54 FIGURE 5-7:AVERAGE BCR BY SECTOR DERIVED FROM THE ADAPTATION OF DATA FROM THE SCHEMES OF
DENMARK, ITALY AND FRANCE FOR SWEDEN/ADMINISTRATIVE COSTS CALCULATED ACCORDING TO
ENERGIMYNDIGHETEN ESTIMATION/ REFERENCE SCENARIO OF FUTURE DEVELOPMENT OF FUEL PRICES .... 55

vi
FIGURE 5-8:AVERAGE BCR BY SECTOR DERIVED FROM THE ADAPTATION OF DATA FROM THE SCHEMES OF
DENMARK, ITALY AND FRANCE FOR SWEDEN/ADMINISTRATIVE COSTS CALCULATED ACCORDING TO
ENERGIMYNDIGHETEN ESTIMATION/HIGHER FOSSIL FUEL PRICES SCENARIO ....................................................... 56
List of Tables
TABLE 3-1: REPORTED ANNUAL ELECTRICITY SAVINGS FROM TECHNICAL AND O&M MEASURES
(ENERGIMYNDIGHETEN 2007) ........................................................................................................................................... 20 TABLE 3-2: EU COUNTRIES WITH CURRENTLY ACTIVE ENERGY EFFICIENCY OBLIGATIONS SCHEMES (LEES,
EUROPEAN EXPERIENCE OF WHITE CERTIFICATES 2007) ........................................................................................... 23 TABLE 3-3: PROPOSAL FOR THE DESIGN OF AN ENERGY EFFICIENCY OBLIGATION SCHEME (WITH TRADING)
(FRAUNHOFER ISI 2012) ...................................................................................................................................................... 27 TABLE 3-4: DESIGN AND MARKET EFFECT OF ENERGY EFFICIENCY OBLIGATION SCHEMES IN GREAT BRITAIN (GB),
ITALY (IT), FRANCE (FR) AND DENMARK (DK) (FRAUNHOFER ISI 2012) ................................................................ 28 TABLE 3-5: ANALYSIS AND EVALUATION OF DIFFERENT POLICY OPTIONS FOR ENERGY EFFICIENCY OBLIGATION
SCHEMES IN THE EU (EUROPEAN COMMISSION 2011) (R=RESPECTS PRINCIPLES OF
SUBSIDIARITY/PROPORTIONALITY, C=COHERENT, = NEUTRAL EFFECT, + POSITIVE EFFECT, ++ VERY
POSITIVE EFFECT, +++OPTIMAL EFFECT, - NEGATIVE EFFECT) .................................................................................. 29 TABLE 3-6: COMPARISON OF THE TARGET AND SIZE OF THE ENERGY EFFICIENCY OBLIGATIONS IN THE EU AS OF
2008 (LEES 2012) ................................................................................................................................................................... 34 TABLE 4-1: DISCOUNT RATES USED IN PRIMES AND THE DATA BASE ON ENERGY SAVING POTENTIALS
(FRAUNHOFER ISI 2009) ...................................................................................................................................................... 39 TABLE 4-2: ESTIMATION FOR THE FUEL PRICES DEVELOPMENT FOR THE SWEDISH ENERGY MARKET – REFERENCE
SCENARIO (ENERGIMYNDIGHETEN 2013); (ENERGY EU 2013); (SPBI 2013) ........................................................... 43 TABLE 4-3: ESTIMATION FOR THE FUEL PRICES DEVELOPMENT FOR THE SWEDISH ENERGY MARKET – HIGHER
FOSSIL FUEL PRICES SCENARIO (ENERGIMYNDIGHETEN 2013); (ENERGY EU 2013); (SPBI 2013) ....................... 43 TABLE 5-1: ADMINISTRATIVE COSTS FOR THE ENERGY EFFICIENCY OBLIGATION SCHEME – EU ESTIMATION AND
ENERGIMYNDIGHETEN ESTIMATION (EUROPEAN COMMISSION 2011); (ENERGIMYNDIGHETEN 2012) ............ 52 TABLE 5-2: PROGRAM AND INVESTMENT COSTS FOR THE ENERGY EFFICIENCY OBLIGATION SCHEME – DATA FROM
THE DANISH, ITALIAN AND FRENCH OBLIGATION SCHEMES (MIKKELSEN 2012); (GIRAUDET, BODINEAU AND
FINON 2011); (JOSHI 2012); (LEES 2012) ........................................................................................................................... 53

vii
List of Abbreviations
BCR Benefit-Cost Ratios
BAT Best available technologies
BAU Business as usual
CRF Capital Recovery Factor
CCS Carbon Capture and Storage
CERT Carbon Emission Reduction Target
CDQ Coke Dry Quenching
CHP Combined heat and power
CFLs Compact fluorescent lamps
CBA Cost-benefit analysis
DRI Direct-Reduced Iron
ETS Emissions Trading Scheme
EED Energy Efficiency Directive
ETD Energy Tax Directive
ETSAP Energy Technology Systems Analysis Program
EIA Environmental Impact Assessment
EC European Commission
EU European Union
GHG Greenhouse gas
HPI High Policy Intensity Scenario
IPCC Intergovernmental Panel on Climate Change
IEA International Energy Agency
LCCE Levelized Costs of Conserved Energy
LPG Liquefied Petroleum Gas
LPI Low Policy Intensity Scenario
MEEP Measures of Energy Efficiency Performance
NEEAPs National Energy Efficiency Action Plans
NPV Net Present Value
ODEX Energy efficiency index of industry
O&M Operation and Maintenance
PCM Phase change material
PFE Programmet för Energieffektivisering
(Program for improving energy efficiency)
SEC Specific Energy Consumption

viii
SMEs Small and medium enterprises
SPBI Svenska Petroleum och Biodrivmedel Institutet
(Swedish Petroleum and Biofuels Institute)
SNG Synthetic natural gas
TES Thermal energy storage
TPV Thermophotovoltaic methods
TRT Top pressure recovery turbines
List of Unit Conversions
1€ = 8.58SEK (currency retrieved on 2013-04-26)
1DKK = 1.2SEK (currency retrieved on 2013-04-26)
1ktoe = 11.63GWh
1 MJ = 0.277kWh
ix
Summary
The research question that was raised initially was whether an energy efficiency obligation scheme would
be cost-effective for the Swedish industrial sector. Of course the obligation policy schemes have a variety
of characteristics but for the purpose of this study the basic guidelines were constructed based on the
characteristics proposed in the Energy Efficiency Directive (EED) and the previously implemented
schemes in other EU Member States.
The industrial sector of Sweden was chosen because of its importance for the Swedish economy and the
large potential of energy savings that could be achieved from its industries. The energy intensive
industries, such as the iron and steel industry, were in focus because of their large share in the total energy
consumption of the sector and opportunities of energy savings from various energy carriers and their
previous participation and established interest in energy efficiency improvement policy schemes, such as
PFE (a Swedish policy program for increasing energy efficiency in energy intensive industries).
In the first chapters of this study a wide and comprehensive literature review was made for the
investigation of the opportunities of energy efficiency improvements in the industrial sector from a
technical and a policy point of view. PFE not only brought an impressive amount of energy savings from
the participating energy intensive industries but also paved the way for delivery of energy savings from
energy intensive industries. It also proved that the correct incentives to the industry result in successful
policy implementation. The EED suggests the creation of an energy efficiency obligation scheme as an
effective means of reaching the desired energy savings targets for the year 2020, and the basic outline of a
design of such a scheme is analyzed in comparison with other EU Member States’ respective obligation
schemes.
The study of the energy savings potentials of the different sectors shows that the participation of the
industries in an energy savings policy instrument is vital in order for Sweden to reach the energy efficiency
improvement goals set for 2020 at national level. Thus, it is very important that the policy scheme that will
be implemented for energy savings in the future offers the right incentives for the industries in order to
increase their willingness to participate at the highest level possible.
In order to measure the cost effectiveness of an energy efficiency obligation scheme for the industries, a
Cost Benefit Analysis (CBA) was performed. The criteria for it were both quantitative and qualitative,
because the implementation of a policy is the source of effects on societal and financial levels that can be
studied using secondary observations and qualitative information.
Regarding the quantitative part of the CBA, the monetary benefits of the energy efficiency obligation
scheme were calculated and compared with the costs of implementation for all the participating parties,
yielding the ratio of the benefits to costs (BCR). This ratio represents the cost efficiency of the scheme,
meaning money gained to money spent for implementing the measures required by the scheme.
The monetary benefits were calculated based on the multiplication of the energy saving potential of the
different industrial sectors up to 2020 with the projection of the energy prices of different energy carriers
in the future, giving the energy costs that the industries would avoid by implementing the energy efficiency
measures.
The costs of the scheme were calculated for the actor of administration of the scheme (the government),
the obliged actor of the scheme (the energy distribution companies) and the implementers of measures
(the industries). Since there has not been a clear estimation of the costs of an energy efficiency obligation
scheme for Sweden, these costs were approximated based on costs for similar schemes in other EU
countries (Denmark, France and Italy) and administrative costs provided by the EU and
Energimyndigheten. This approximation reduces the accuracy of the cost calculation, since it is not based
on data exclusively for Sweden, but the literature research on energy efficiency obligation schemes in the
EU shows that although the nature and targets of the schemes are different, the costs are fluctuating in
the same range when measured per kWh of energy saved per capita.

x
The results of the study show that the participation of the industries in an energy efficiency obligation
scheme seems to be cost effective, and the BCRs of the quantitative analysis where ranging in numbers
higher than one, showing that the benefits outweigh the costs. The scheme is more cost effective when
scenarios assuming high policy intensity for the whole economy of the country are used as input for the
calculation of the BCRs, which are also affected positively when higher fuel prices scenarios are adopted.
The experience from other EU countries, which have implemented energy efficiency obligation schemes,
shows that when the participating actors are offered the appropriate incentives, the scheme is cost-
effective.
Placing the energy savings obligation upon the distributors of energy ensures that no unfair competition
or unreasonable energy price rise occur, since the prices of energy distribution are administratively
regulated. The industries can exploit the fact that the distributors will most probably not be able to fulfill
the obligation on their own. The distributors may therefore subsidize implementation of energy efficiency
measures in the industries in order to fulfill their obligation. Thus, there is an opportunity of financial
benefits in an energy services market for the Swedish industries and these benefits will support the cost
recovery of the investments for the implementation of the energy savings measures. The possibility of
certificate trading in the context of the scheme is another option that can create opportunities for financial
gains and further stimulate energy efficiency improvements in industry as well as the energy services
market.
The implications of an energy efficiency obligation scheme for the industries are studied under an energy
systems efficiency perspective and it is shown that including energy savings from waste heat utilization in
the scheme can result in collaboration between industries and energy distributors, resulting in achieving
higher energy efficiency and financial gains for the industries.
The cost effectiveness of an energy efficiency obligation scheme cannot be ultimately proven, because of
the fact that no sufficient data is available on costs for investments that would be required for energy
savings measures in order to reach the energy savings targets set. Basing the cost calculations on the cost
information from other EU Member States offers insight to how these costs could be formed in the case
of Sweden, but further research is required to provide final conclusions about the energy efficiency
obligation scheme’s financial effects.

xi
Acknowledgements
The author would like to thank everyone that made the submission of this thesis possible. It is the most
rewarding feeling to see the fruits of hard work taking shape and being just as one has planned them to be.
I would like to thank Professor Semida Silveira for offering me the right piece of advice at exactly the
moment when I most needed it. I couldn’t find anything that would correspond to a proper
acknowledgement, except of a large “thank you” to my supervisor, Johannes Morfeldt, for trusting me and
helping me so much with this thesis with his knowledge and feedback. I couldn’t wish for a better thesis
supervisor than him. Also many thanks to my family and friends, who however far away from me in terms
of distance, were always right there supporting me. Finally, I want to thank Konstantinos for being the
piece of my life that makes me feel that nothing is impossible to achieve and always gives me strength to
carry on.

1
1 Introduction
1.1 Motivation
In today’s society, sustainability is the key target in order to ensure that mankind will have a prosperous
future. Only by following sustainable paths of development the constrained resources of the earth will be
preserved as the demand for them rises dramatically. As a result, technological innovation and regulated
use of resources are essential in achieving economic growth while simultaneously sustaining the demands
of the environment (McKinsey and Company 2006).
The productivity of industrial processes can be achieved via energy improvements that in addition to
reducing the energy consumption bring other non-energy related benefits, such as lower maintenance
costs, increased production and safer conditions of work (Worrell, et al. 2003).
A report by the IEA on energy trends in the Nordic countries, suggests that by 2050 the direct industry
emissions should be reduced by 60% from the 2010 levels. Thus, there is a need for decarbonization of
the energy production (IEA 2013). The Nordic countries are characterized by a high share of energy
intensive industries, and an energy usage per unit of GDP higher than the OECD average (except for
Denmark). Thus, the Nordic industry should cut its fossil fuel usage by 20% on a collective level, which
motivates aggressive policy measures (IEA 2013). Energy efficiency improvements offer a great potential
for energy savings and emissions’ reduction and policies should facilitate the implementation of measures
for efficiency improvements by all means (IEA 2013).
Energy savings from efficiency improvement must not be confused with energy savings resulting from
decrease in the demand for energy, for example when there is a lower rate of production. The link
between energy efficiency and sustainability is the CO2 emissions reduction resulting from energy saving
measures implemented. Lower CO2 emissions are needed to reach the goals of climate change mitigation,
in the context of sustainability. Energy efficiency measures result in economic returns and development,
while contributing to sustainability goals. Thus, efficiency improvements compensate the effects caused
by the increase of economic activity and the growth of the world’s population, which affect the energy
consumption trends globally (Intergovernmental Panel on Climate Change (IPCC) 2007).
Sweden is a notable example of an economy highly dependent on energy intensive industries (Thollander
and Ottosson 2010). The sum of energy usage for the two largest branches of energy intensive industries,
the pulp and paper industry and the iron and steel industry, corresponds to around half the amount of the total
energy usage of the industrial sector at the national level (Energimyndigheten 2012). This indicates the
need for implementing policies that would provide incentives for energy saving actions within energy
intensive industries in a cost effective way.
The iron and steel industry is considered an energy intensive industry due to the high temperatures
needed for the production of steel products. The iron and steel industry accounts for approximately 15%
of the total final industrial energy use in Sweden, or 21.2 TWh in 2010. In a report developed by the
Swedish Energy Agency (Energimyndigheten), it is stated that the energy intensive industries indeed have
“This chapter provides an introduction to the thesis work. This includes the motivation
of the thesis, the objectives, and method followed in the investigation. Since the cost-
effectiveness investigation is tackled with the method of the CBA, the basic principles of
it are also presented in this section.”

2
a significant energy savings potential, and that incentives for investments in energy efficiency
improvements could facilitate achieving the 15 TWh of energy savings estimated as possible in the
coming years (Energimyndigheten 2012).
The Swedish energy intensive industries are the focus of this study because of their double importance to
the Swedish decision makers. Firstly, these industries have a large potential for energy savings and thus
their active participation in the energy efficiency policies is crucial to achieve the desired energy efficiency
savings at a national level (Energimyndigheten 2012). Secondly, the Swedish energy intensive industries
are an important part of the Swedish economy. Since the costs related to energy are a significant part of
their overall costs, any effects of new energy policies have a direct impact (positive or negative) on the
economic development and revenues of these industries and consequently the Swedish economy as a
whole.
The European Union (EU) is highly focused on achieving its energy consumption reduction target of
20% by the year 2020. However, the estimations state that this might not be possible to achieve without a
drastic change in policies and implementation of policy instruments by the member states, which will
bring the EU back on track towards the goals for 2020. The interest in achieving higher energy systems
efficiency is globally rising and several notions, such as the EU Energy Efficiency Directive (EED) and
the separate National Energy Efficiency Action Plans (NEEAPs) for each EU member state, are taken
towards that direction (Scheuer 2011).
The European Parliament’s Directive 2012/27/EU on energy efficiency (Energy Efficiency Directive-
EED) requests for several changes to be made among all sectors of the economy connected to energy
production and consumption. For the industrial sector, it is expected that a higher level of energy savings
awareness arises since the legally binding measures of EED will step up the efforts of efficient energy
usage at the national level and remove barriers in the energy market (European Commission 2012).
According to EED, all the large enterprises1 should perform energy audits at least every four years.
The cogeneration of heat and electricity will be promoted in order to improve energy efficiency at the
systems level (European Parliament 2012). By using the systems approach, the investigation of any system
has more generality in its logical framework and increased concern in the fundamental objectives that
should be achieved (Bode and Holstein 2013). Thus, instead of focusing on a process level when it comes
to cogeneration, the focus should broaden to a holistic perspective. That way, one can define the system
boundaries in order to include waste heat utilization as a process that increases the overall efficiency of
the industrial plant.
Implementation of energy efficiency obligation schemes is included in the EED, and schemes are already
being applied in some European countries, i.e. Italy, France, UK, and Denmark (World Energy Council
2007) and could be an option for Sweden as well. The term “obligation” in an energy efficiency policy
context means that the actor upon whom the obligation is placed is required to deliver a specific amount
of energy savings, which will be verified by the regulating authority of the scheme. In case the obligation’s
requirements are not met, the obliged actor faces penalties for non-compliance.
The trading of certificates is optional and any country that introduces such a scheme decides if trading is a
viable option for the country in question. The certificates are widely known as white certificates, in a
comparison to the green certificates which are defined as an official record that proves the generation of a
certain amount of electricity from renewable energy sources. The green certificate system is already in
place within the EU (Haas 2001). Hence, alongside the green certificates, based on electricity generation
from renewable energy sources, come the white certificates, which are considered as an official record
that proves a reduction of energy consumption leading to an energy efficiency increase. The incentives
offered by the adoption of a white certificates trading system can lead industries to introduce
breakthrough technologies or improve existing technologies to align with best-practice (Oda, et al. 2012).
1Enterprises with more than 250 employees and an annual turnover exceeding 50 million euros are defined as large enterprises (European Commision 2003)
3
The Program for Energy Efficiency Improvement (Programmet för Energieffektivisering-PFE)
implemented by Energimyndigheten in Sweden is another way of encouraging energy efficiency
improvements in energy intensive industries. This voluntary program started in 2004 and had as a goal to
provide incentives for the increase of energy efficiency in energy intensive industries in exchange for tax
reductions. PFE has showed encouraging results and the energy intensive industries that participated
successfully implemented measures for improving their energy efficiency, in exchange for being exempted
from the EU minimum electricity tax (Nilsson and Stenqvist 2011). The industries that participated
achieved a saving of 1.45 TWh/year during the first five–year period of the program, which was double
the amount of what was expected (Energimyndigheten 2012).
Although PFE had quite impressive results, it can no longer be implemented as the EU has introduced a
regulation of industry energy subsidies, and PFE is violating that regulation with the tax exemptions it
offers (Energimyndigheten 2012). Since the PFE program has to be terminated, Energimyndigheten and
all the actors connected to the energy market have to collaborate in the introduction of a new policy
scheme covering their energy efficiency improvement goals and simultaneously complying with the
respective EU regulations.
Energimyndigheten has investigated the quota systems as a policy option for Sweden (Energimyndigheten,
2010).) The term quota system means a system that requires the achievement of a specified percentage of
energy savings each year, occasionally represented by an amount of certificates in the market, in the case
where trading of certificates exists. The quota system in the context of an energy efficiency obligation
scheme serves as the method of signifying the amount of energy savings required to be incorporated in
the obligation each year. The report of Energimyndigheten on the cost effectiveness of such a quota
system in the case of Sweden (Energimyndigheten 2012) and white certificates trading experience from
other EU countries (Energimyndigheten 2010) initiated the discussion on whether or not a possible
implementation of a quota system would be cost-effective in the case of the Swedish energy market, with
its specific characteristics and diversity of actors.
For the case of the energy intensive iron and steel industry, as stated officially from the Swedish Steel
Producer’s Association (Jernkontoret), there is an interest in the entitlement to certificates for electricity
production from excess heat that would lead to profit from investments into such installations, especially
in cases where there is no district heating demand (Jernkontoret 2012).
It is important to understand that adjusting to a new policy scheme for energy efficiency is not only
related with the policy-making organizations. The implications for industries are also important to assess,
such as the opportunities that these schemes provide and how they can be utilized in order to increase
industry competitiveness. The improvement of energy systems efficiency, for example in the context of
an energy efficiency obligation, can lead to a substantial conservation of resources, decrease of production
costs and financial competitiveness in the market (Oda, et al. 2012).
The study will be mainly focused on the energy intensive industries, particularly the iron and steel
industry, where applicable. The iron and steel industry was chosen to be under focus instead of other
energy intensive industries, for example the pulp and paper industry, because it can particularly benefit
from achieving energy savings in the context of an energy efficiency obligation scheme, whereas the pulp
and paper industry have the additional possibility of benefits from green certificates from the use of
biomass as their feedstock. Moreover, the iron and steel sector can benefit from a scheme that includes all
types of energy carriers because of the high usage of coal for their production processes. The
investigation of the effects of an energy efficiency obligation scheme on an industry as the one of iron
and steel is appealing, since the competition in the field is hard and at a global level. Thus energy policies
implemented within Sweden may affect their competitiveness worldwide.
The proposed energy efficiency obligation scheme will be explained on the basis of its design and the
experience from other countries’ implementation of similar schemes will be useful in making the

4
necessary comparisons. Moreover, the comparison with the successful PFE for the energy intensive
industries will be a source of information and will offer insight to the industries’ view on policy matters.
1.2 Objective
The purpose of this thesis is to investigate in a thorough way the possibilities of implementation of an
energy efficiency obligation scheme in Sweden. The assessment should prove whether such a scheme is
cost-effective or not and to what extent and level of success it can replace the current regulations and
policies that are required to be changed, due to EU regulations.
This thesis aim to (i) provide new insight on the current trends in policy-making for increasing energy systems efficiency, (ii) provide recommendations for the implementation of policy schemes in the Swedish context, and (iii) show the implications of the various options for Swedish industry. The Swedish case is especially interesting since the PFE experience offers a lot of information about how electricity efficiency can be increased in industry and provides a basis for discussing the implementation of an energy efficiency obligation scheme.
Research question:
Could the implementation of an energy efficiency obligation scheme in Sweden be cost-effective and what are the implications for the industrial sector?
1.3 Methodology
The above stated objectives were reached by applying a cost-benefit analysis (CBA) for the energy efficiency
obligation scheme. A CBA is defined as “a procedure for evaluating the desirability of a project by weighting benefits
against costs” (European Commission 1997). In this particular case, the method was applied both in
quantitative and qualitative terms, as for the assessment of a policy scheme not all benefits or costs can be
quantified. However, the societal or political extensions, or long-term costs and benefits, that cannot be
identified and quantified from a direct approach are indirectly and consequently linked to the scheme
(external costs and benefits) and therefore were taken into consideration on the basis of how they affect
the scheme’s implementation and results. The success of an energy efficiency scheme is based on the
acceptance of the actors affected by it and, thus, there are costs or benefits of a conceptual nature along
with those of tangible nature and, hence, all of them were objectively assessed in the context of the
analysis.
Firstly, a literature research was carried out on the benefits that the energy efficiency obligations and voluntary agreements ensure and the ways that their goals are usually met. The PFE program experience was exposed, along with the incentives offered for its implementation and the results that these brought to the companies that already participated in the program.
The next step was a literature review of the impact of introducing an energy efficiency obligation scheme
with the possibility of trading of certificates. The method of implementation of this scheme was presented
in a Swedish context, whereas the previous experience of the implementation of similar schemes in other
EU countries was an important source for comparisons. The newest regulations posed from the EU were
presented, as well as their impact on the formulation of future energy policies. The point of view of
different actors related to the implementation of the scheme was exposed based on their statements and
opinions about the energy efficiency obligations’ viability, advantages and drawbacks.
As the background knowledge related to the policy scheme that was to be evaluated was developed, the
next step was to perform the CBA itself. The criteria of the CBA that were assessed for this study were
customized so that they fit the context of energy efficiency policies. The inspiration for the list of criteria
came from the CBA performed in Fraunhofer ISI’s report on a CBA for a German energy efficiency
obligation scheme.
These criteria namely are the benefits and costs of the scheme, the market conformity and
competitiveness of actors achieved in the context of the scheme, the effects caused in the market of

5
energy services by the implementation of such a scheme, the distribution of the effects of the scheme in
all societal actors related to it (otherwise stated in the analysis as the follow-on effects of the policy
instruments), the interaction that the energy efficiency obligation scheme has with other energy related
policies, the views about the scheme from the different political actors (political enforceability) and the
financing abilities of the scheme in the long term (financeability).
From these eight criteria, only the two first (benefits and costs) were quantified in the context of this
study. The other six criteria are more related to market issues, effects and externalities that can be
quantified via specific modeling procedures that were outside of the context of this thesis. However, since
these criteria signify the societal importance and effects of the scheme, they were reviewed and assessed
qualitatively in order for a full overview of the scheme’s impact to be developed.
The two quantifiable criteria, the benefits and costs were calculated on an annual level until 2020. This
year was chosen as the end year of the analysis, because it represents the year that the EU 20/20/20 goals
should be achieved. Thus, the EU Member States are designing their policies under the influence of these
goals set by the EU for 2020. In addition, since the data collected are based on projections resulting from
models of the scenarios of energy usage in the future, 2020 serves as a relatively close date for making
safer assumptions and estimations that are likely to be proven true. The energy efficiency landscape will be
improved until 2020, but not in a so radical way as to not be able to follow its development in the future
and make estimations for it.
The method for calculating the benefits of the scheme is based on the combination of the results of two
separate models that provide estimations for the energy savings potentials and the development of the
energy prices in the future. Additionally to that, there was the question of what share in the industrial
energy usage each fuel represents. For this, data from the years 2002-2011 from Eurostat were used for
calculating the shares that each fuel has in the Swedish industry’s energy consumption. Since the trends of
these shares’ development was proven to be stable in the years that the data were provided for, it was
assumed that the fuel shares are most likely going to remain stable in the years until 2020 as well, and they
were used as such in the analysis.
Having each fuel’s share and price projection in the future made it possible to calculate the energy costs
that are avoided from reaching the whole of the energy savings potential that the Swedish industry was
estimated to be able to offer. These avoided energy costs represent the quantifiable benefits that the scheme
has for the industries. The assumption that the whole energy savings potential is reached was made in
order to illustrate the impact that an intensive policy implementation with commitment to the energy
savings goals might have on energy efficiency improvements. Although it is not sure whether these
potentials will be reached (most sources claim the opposite), it is essential to have this assumption to serve
as a guideline for the capabilities of energy savings and resulting benefits that the industry can have.
The other quantifiable criterion of the CBA, the costs of implementing the energy efficiency obligation
scheme, were calculated based on information and data from the other EU countries that have already
implemented energy efficiency obligation schemes and Energimyndigheten which provides some primary
estimations for the cost of such a scheme for Sweden. The assumption for the costs calculation was made
on the basis that the other countries implementing energy efficiency obligation schemes, although
different in amounts of energy savings or total costs of implementation, showed similar costs of the
scheme per capita. As a result, it is assumed that the costs of implementing energy efficiency measures in
the context of a Swedish energy efficiency obligation scheme can be very similar to the costs for the other
countries. However, Sweden has a unique industry sector and its characteristics and implications from
them are stated throughout this report in order for the reader to create an image of the differences of the
Swedish case related to the other EU Member States.
As a result, the costs of the scheme for a possible Swedish case are presented as comparisons resulting
from the energy potentials and the costs per energy unit for each EU country of comparison. Hence, there
are various scenarios representing the different countries’ costs, the different policy intensity scenarios and

6
price development scenarios. The presentation and analysis of the different combination of these
scenarios methodologically represents a sensitivity analysis for the costs and benefits of the scheme
according to different scenarios.
The identification of the system’s cost-effectiveness was done through the calculation of the Benefit-Cost
Ratios (BCR), which are the ratio of the quantifiable benefits of the energy efficiency obligation scheme
(the avoided energy costs in the analysis) divided by the costs of implementation of the scheme. The costs
of benefits were related only to the industrial sectors that were investigated and not Sweden on a national
level. If the BCR is higher than one (BCR > 1), than the scheme is considered as cost effective and viable
for application (Baudry, et al. 2011).
Although the BCRs were calculated only for the quantified criteria of the CBA, the qualitative criteria
should be evaluated as well when finally assessing the cost effectiveness of the scheme. The qualitative
criteria are analyzed based on information from other sources about the impacts of energy efficiency
obligation schemes, for example from market analyses of obligation schemes’ impacts (for the
distributional the market effects of the scheme and its barrier overcoming abilities), social effects’ analysis
(for the distributional effects of the scheme) and unofficial sources, such as feedback from the involved
with the scheme actors or workshop results (for the political enforceability of the scheme). Again the
analyses of other countries’ obligation schemes were used as sources of information.
However, there are effects and issues that were not part of the criteria of the CBA while still being very
important for drawing the whole picture about the cost-effectiveness of an energy efficiency obligation
scheme for the industries. These are analyzed in Chapter 6, as discussion related to the cost-effectiveness
of energy efficiency obligation schemes from a point of view coming more from the industry’s side.
The examples of CBAs related to energy policy implementations that were studied in the literature review
are usually reviewing the policy system at the national level and include all energy consuming sectors. The
novelty with this thesis is that it focuses particularly on the industry sector, specifically highlighting the
effects on industry by implementing an energy efficiency obligation scheme. It should be understood that
although a policy scheme might seem cost-effective at the national level, it might be problematic for some
sectors participating in the scheme, causing, as a result, frictions and reluctance in the implementation of
the desired measures because of the alleged costs that may exceed the expected benefits.
1.3.1 Definition of the Cost – Benefit Analysis (CBA)
This section offers information about the execution of CBAs, in order to see how CBAs are implemented
in general in the context of energy policies. CBA has been used in several cases for evaluation of policies
related to energy issues. Among those examples from the literature is the report of the Fraunhofer
Institute (Fraunhofer ISI 2012), investigating the cost effectiveness of various policy schemes for energy
savings in Germany and the report on energy policies and risks in the market for the CPB Netherlands
Bureau for Economic Policy Analysis (Jeroen De Joode, et al. 2004). Other CBAs have also been
performed for the evaluation of the EU 20/20/20 package (Tol 2012) and energy efficiency programs in
the domestic sector (Suerkemper, et al. 2012; Clinch and Healy 2001).A CBA for the energy efficiency
obligation scheme in France, Italy and UK has been performed by Giraudet,et. al. (2011). The guidelines
to perform a CBA in the context of energy policies can be found in the EU’s Guide to CBA (European
Commission 1997) and the report of the U.S. Environmental Protection Agency, discussing the best
practices, methods and issues for the energy policy-makers (Environmental Protection Agency 2008).
CBA is usually connected with Environmental Impact Assessment (EIA). Since an EIA requires the
consideration of all impacts, such as ecological, economic and social, the CBA is the tool that offers an
efficient presentation of the net effects of a policy, by economically evaluating the impacts of it (Hundloe,
et al. 1990).
The results of a CBA can be expressed in various ways, for example internal rate of return, net present
value and BCR. However, the costs and benefits can be difficult to estimate, because the estimation

7
process is difficult when dealing with external costs and benefits of the system under analysis. In addition,
effects that may occur in a longer time span are more difficult to estimate correctly and fully. Even then,
though, the worth of the unquantifiable elements of the analysis should not be diminished and the
decision-makers, using these elements’ expression in qualitative terms, should consider them in their
decision-making.
Energy policies have a social impact that should be presented in the analysis in a measurable form. Great
caution should be taken when weighing the social value of an element, because market imperfections can
lead to output prices that do not represent the social value of the element (European Commission 1997).
In other words, this means that when a policy is evaluated on simplified terms, the costs and benefits of
the implementers or the directly affected from the policy are taken into account, but if the CBA is seen
from the social perspective as well, then the costs and benefits that society has to bear for the
implementation of the policy have to be measured accordingly and added to the overall cost and benefit
balance. In some cases the effect that the policy under evaluation has to society cannot be disregarded and
changes the whole outcome of the CBA.
Generally, a CBA is built up by the following elements (European Commission 1997):
Project identification
Definition of objectives
Feasibility and option analysis
Financial analysis
Socio-economic costs
Socio-economic benefits
Discounting
Economic rate of return
Other evaluation criteria
Sensitivity and risk analysis
A tangible and easily quantifiable indicator of cost effectiveness is the Levelized Costs of Conserved
Energy (LCCE), which is expressed in cent/kWh. This indicator compares directly the avoidable costs of
an energy supply system under the application of a certain policy. The LCCE is calculated as follows:
, with
where
NPV = Net Present Value = The value of a stream of cash flows when this is converted to a sum
of cash for all the lifetime of the policy applied to a specific year though, usually the first one of the
policy’s implementation. The present represents the base point for summing all the cash flows. The
NPV is the net value or benefit of a project that can be valued when all the costs and benefits related
to the analysis have been discounted to the present by using the discount rate’s value.
CRF = Capital Recovery Factor = The ratio of a constant annuity divided by the present value of receiving that annuity under a given time duration. An annuity is a terminating flow of payments that are fixed, meaning that they are periodically received during a specific time period.
i = Real Discount Rate = A measure of the time value of money. On an annual basis, it is the interest divided by the capital (with the interest included). This is translated in simpler terms to using the initial value after a year at its nominal state and seeing the value at present as the nominal value without the discount. Thus, future values are discounted to the present. The discount rate is a very important choice in energy climate policies’ calculations, because a policy affects the capital costs in a
8
long-term perspective and the value of the invested capital in the future should be calculated carefully in order to identify the cost effectiveness of the policy. The process of discounting is based on adjusting the value of a cost or benefit in the future to the present by multiplying with the discount rate as a coefficient that is reduced with time.
n = Measure Lifetime (years).
The levelized cost represents a constant value that, if summed for each year of the period of the policy
implementation, one would get the net present value equal to the actual values added each year, since
these values increase each year according to the discount rates. Thus, levelized costs are used to represent
the cost of the energy savings resulting from different efficiency measures, which naturally have different
lifespans of implementation.
Since the data for the costs for the comparison with the other EU Member States with energy efficiency
obligation schemes were related to factual data coming from official sources, it is assumed that these costs
are already levelized, thus there was no process of calculating the LCCEs in the report, as this was already
calculated for the data included in the costs calculations.
1.3.2 Externalities affecting the economic efficiency of a policy scheme
A subject related to the correct attribution of energy savings is the term of additionality, according to which
only net energy savings additional to the business as usual (BAU) conditions should be accounted for
(Staniaszek and Lees 2012). The establishment of the BAU needs consideration in order to set realistic
energy savings goals and the threshold is usually set from EU regulations or at the national level. Energy
savings above that threshold are the ones that should be accounted in the policy scheme.
When an energy efficient measure already has a large market share of implementation, the measure is
excluded from the qualified measures of the scheme, because of additionality issues, as in the case of
Denmark’s energy efficiency obligation scheme exclusion of compact fluorescent lamps (CFLs) and
white/brown appliances from the list of eligible measures (Staniaszek and Lees 2012).
Environmental Protection Agency (2008) suggests that for the evaluation of the policy, the net energy
savings should be accounted instead of gross savings. Hence, the “gross-to-net” principle is used, where as a
first step the gross energy savings are calculated and afterwards they are corrected by subtracting the
savings that are not linked to the scheme’s actions themselves, hence producing the net energy savings
(Reichl and Kollmann 2010). The gross energy savings are used for cases of forecasting, while the net
energy savings are used for cases of policy evaluations (Reichl and Kollmann 2010). For this thesis, since
the study is based on energy savings potentials in the future and not real values of energy savings, the
gross energy savings are used for the quantitative part of the CBA, while offering some insight on the
externalities that affect the net energy savings is included in the qualitative evaluation part of the CBA.
The following market effects are externalities that affect the economic efficiency of a scheme. These
effects are a result of the distributional nature of any policy, which comes to affect all the market. In order
to avoid the negative effects of these externalities in the context of an energy policy scheme, there is a
need of careful evaluation and accounting of the energy savings directly linked to the scheme’s framework
effects, that justifies the aforementioned views.
Free rider effect / Deadweight effect
The free rider effect is a specific case of additionality. The free riders are customers that take advantage of
the incentives via rebates or cost savings from energy efficiency programs for implementing measures
under the program’s duration, which would have been implemented even without entering the program
(Environmental Protection Agency 2008).
Installation rate

9
The installation rate of the measures is an issue that should be addressed, as, in some cases, the higher
efficiency equipment installed might be bypassed for later, removed in the future, or not installed at all
(Environmental Protection Agency 2008),.
Persistence/Failure
Possible failures of the equipment before it has fulfilled its expected lifetime of operation result in lower
savings that cancel the saving estimates set by the program (Environmental Protection Agency 2008).
Rebound effect
Some measures may of course result in considerable savings during a time period, however they also
result in high-energy consumption before or after the period that the savings occur (Environmental
Protection Agency 2008). Alternatively, there is a rebound effect coming from the initial fall on the energy
prices because of the higher efficiency measures that leads to higher demand and consumption of energy
that is immediately apparent in the case of electricity for instance (Hanley, et al. 2009). Thus, in order to
ensure the positive effects of the energy efficiency effect and prevent the effects of the rebound effect
resulting in higher energy usage because of the fall of electricity prices, there should be a balance between
them by introducing higher taxes on energy usage or carbon emissions (Hanley, et al. 2009).
Spillover/Free drivers
Spillover is the opposite to the free rider effect, meaning that there is the possibility that some customers
will adopt energy efficiency measures due to influence of information related to energy savings resulting
from the program, although they are not participating in the program (Environmental Protection Agency
2008). In addition, the can be a spillover effect towards another energy carrier than the one specified in
the policy scheme. For example, PFE was aimed to electricity savings, but because of the general
efficiency improvements in the industries, there was a spillover effect to other energy carriers except of
electricity. The direct financial contribution of the free drivers to the program should be examined when
the policy is analyzed.

10
2 Energy efficiency improvement in the Swedish energy
intensive industries
There are various ways of measuring the industrial energy efficiency and they all have different
applications and purposes. The measures of energy efficiency performance (MEEP) are the following
(Tanaka 2008):
absolute energy consumption,
energy intensity,
diffusion of specific energy-saving technology, and
thermal efficiency frameworks.
MEEPs are useful for policy design during the development of the framework of regulations, the policy
application and the evaluation following the policy’s implementation. The criteria that the policy-makers
need to take into account are the reliability, the verifiability and the feasibility of the MEEPs (Tanaka,
2008).
The large potential that the industry has for energy savings makes it an attractive target for energy
efficiency improvement, climate mitigation and energy security increase (Tanaka 2011). The diversity of
the sector in technologies and processes used, the products that are manufactured, the energy sources
used, the energy prices as well as the political and economic situations makes it complex to coordinate the
policies in order to achieve the best possible combination of measures. The technical measures that can be
adopted in the industries for achieving improvements in energy efficiency have a large variety (see Figure
2-1) and are divided in these basic categories (Tanaka 2011):
Maintenance, refurbishment and retuning if the equipment to avoid the degradation of efficiency
that comes naturally in the years passing and from the shifts in the parameters that are related to
the processes.
Retrofitting, replacement and retirement of no longer in use equipment, process lines and
facilities in favor of their technologically new and state of the art counterparts.
Heat management development in order to minimize heat loss and waste energy by (for example
utilization of waste heat and materials and insulation installation).
Process control improvement, something which increases energy and materials efficiency and as
a result the productivity of the general processes.
Streamlining processes, meaning the elimination of the processing steps and the use of new
concepts of production.
Recycling and re-using of materials and products.
Process productivity increase, meaning the decrease of the reject rates of products and the
increase of the material yields.
Implementing the right policies in that context facilitates the technical efforts that are stated above. A
successful policy is the one that can incentivize, directly or indirectly, the industrial sector into incorporate
measures for technical improvement and energy efficiency increase (Tanaka 2011).
“This chapter presents the subject of energy efficiency improvements in the industry from
a technical point of view. The chapter is divided in two sections; one about efficiency
improvements in the energy intensive industries and one that is focused specifically on
the technical measures that can increase efficiency in iron and steel industrial plants.”

11
Figure 2-1: Examples of technical measures for energy efficiency improvement (Tanaka 2011)
Energimyndigheten (2013) estimates that until 2030 the industrial energy usage in Sweden will rise due to
a relatively strong economic growth. In order to mitigate as much as possible the effects and the amount
of this increase of energy consumed, there is a need for energy efficiency improvements in the industrial
sector. The expected growth for the industrial sector according to this scenario would be 22 TWh (from
156 TWh in 2007 to 178 TWh in 2030, which corresponds to a growth of 12.3%). It is understood that, if
the industry realizes its potential for energy savings, the increase in energy demand could be minimized.
Projections on energy consumption in Sweden are also given in a report on energy policies in the IEA
countries. The industrial energy consumption is expected to increase by 28.5% until 2030, because of a
fast economic growth of the industrial sector and economic recovery. The industrial sector’s growth will
lead to growth in electricity and coal usage, particularly in the iron and steel and pulp and paper industries.
Specifically, the energy consumption will have grown by 24.2% by 2020, and the consumption will be
more stabilized afterwards, with a growth rate of 4.3% (IEA 2013) in the next ten years until 2030. IEA’s
estimation of the industry’s growth in Sweden is thus more than double the amount that
Energimyndigheten estimates, as shown in the previous paragraph.
In general, the share of the energy intensive industries in the total final energy consumption of the
industry sector remains more or less the same, regardless of the growth rate, and differences in energy
usage of specific sectors (for example the pulp and paper industry and the iron and steel industry) that are
observed in the past few years still need to prove whether they will be established as a situation in the
future or not (Energimyndigheten 2013).
Currently a number of policies exist that affect the use of energy in the industrial sector. These policies
interact with each other in order to overcome market failures, but they are also conflicting with each other
sometimes due to political reasons. Market failure is an economic term that describes the inefficient
allocation of goods or services within a free market. In the context of industrial energy efficiency
improvement, the energy efficiency gap is a market failure, because the market fails to overcome the barriers

12
that inhibit the implementation of measure and practices in the industries that would lead to cleaner
production processes. In this way, obviously cost-effective energy efficiency measures are gradually
diffused and not implemented (Jaffe and Stavins 1994). The variety of possible barriers that result in
failures in the energy market is wide and the interactions of the various elements of the system should be
seen under a systems perspective approach (Chai and Yeo 2012).
The efficient use of energy is affected and promoted in economic terms by the energy prices’ development
and the policy instruments should be able to resolve the market failures by addressing them from as close
as possible (Mansikkasalo, Michanek and Söderholm 2011)
2.1 Improving the energy efficiency of the iron and steel
industry
All the applicable measures that can be proposed for the improvement of the energy efficiency of the
plant should be carefully studied and evaluated from a systems perspective in order to decide about their
feasibility of implementation into the existing systems of the industry.
The iron and steel industry is particularly energy intensive because of the high temperatures that need to
be produced for the steel making processes. As a result, high heating value fuels are needed, which results
in the high consumption of coal related to the other fuels’ usage in this industry (see Figure 2-2). The
electricity and LPG usage are almost stable in the years from 1970 to 2012, but the oil usage has dropped
significantly and continues decreasing.
Figure 2-2: Energy usage in the Swedish iron and steel industry by fuel for the years 1970-2012(coal and coal gas, oil, electricity and LPG/natural gas respectively) (Jernkontoret 2013)
The steelmaking processes are divided into two main categories: the iron ore based process, which is
named integrated steelmaking and the scrap-based process, which is named secondary steelmaking.
In the process of integrated steelmaking, the coal is firstly turned to coke and gas by heating in furnaces
and then this coke, together with iron ore pellets, limestone and other additives are fed to a blast furnace
for the production of steel under high temperatures. When the hot metal reaches the desired levels of
carbon content (around 4.5%), it is tapped from the furnace and led to the steelworks with railcars in
order to have its chemical composition adjusted. After the cooling and injection of oxygen the steel with a
carbon content lower than 1.7% is ready for the casting and rolling processes (SSAB Communications
2012).

13
The secondary steel making process, or scrap-based process, is an energy efficient alternative of steel
production, because of the use of steel scrap for the production of new quantities of steel in a large
recycling system. In this way, the Earth’s resources are preserved and the otherwise useless scrap becomes
useful again. The sorting of scrap steel should be made carefully regarding the various alloys and
additives, because not all scrap types are suitable for secondary steel making. The scrap melting takes
place in twin-shell, electric-arc furnaces. In the first shell the scrap is preheated by using natural gas as a
fuel, while in the second furnace the scrap is melted with the use of electric energy. The chemical
composition of the steel is adjusted then in ladles metallurgy furnaces before the casting processes (SSAB
Communications 2012).
Figure 2-3: A simplified process chart for the steelmaking processes (Johansson and Söderström 2010)
There are several measures that can be taken for increasing the energy efficiency of a steel producing
plant as proposed in the paper of Johansson and Söderström (2010). Some them are the following:
Electricity and district heating production with combined heat and power (CHP)
The combustible gases that are produced from the furnaces in the steel plant can be the input in
CHP plants that can generate electricity and district heating. These gases however do not have
the required heating value for electric power production because of their low temperature and
they can be used for district heat production only, unless they are mixed with coke oven gas for
electricity production.
Electricity can also be produced from top pressure recovery turbines (TRT), which use excess
heat and pressure resulting from the blast furnace. (Zeng, Lan and Huang 2009) states that TRT
can generate approximately 40-60 kWh of electricity per ton of iron produced. TRT is used in
large steel mills worldwide and the electricity produced by them can cover up to 30% of the
energy demand of the air blowers of the blast furnace.
Lately, the integration of Organic Rankine Cycles (ORC) and Kalina Cycles in steel plants has
made the exploitation of low-grade excess heat possible. The ORC utilizes an organic working
fluid and the Kalina Cycle, a water and ammonia mixture. The working fluids’ vaporization
temperatures vary between 30 to 300oC. Their efficiencies are 8.1% for the ORC and 12.8% for
the Kalina cycle (Asp, Wiklund and Dahl 2008).
Finally, the heat radiation generated by the processes can be exploited with thermophotovoltaic
methods (TPV). Their operational temperatures range between 1000 to 1800oC. Blast furnace
slag and slabs are suitable for TPV.

14
Coke Dry Quenching (CDQ)
Instead of the traditional ways of drying coke in the ovens, new procedures are introduced, where
the coke is cooled with the help of inert gases in special dry cooling plants, thus decreasing the
CO2 emissions and giving the opportunity for heat recovery via the production of steam and
electricity. This dry quenching technology can result in 35% energy recovery in the coke drying
ovens (Zeng, Lan and Huang 2009).
Methane reforming of coke oven gas
Syngas contains carbon monoxide and hydrogen in varying percentages and is the product of a
process named methane reforming from natural gas. Coke oven gases can be a source for
methane reforming as well. By adopting technologies for syngas production in the iron and steel
plants, a reduction of methane and carbon dioxide emissions can be achieved (Lundgren, et al.
2008).
Fuel Conversion
It is very difficult to substitute coke for another fuel in the large blast furnaces, because coke
ensures gas permeability and also secures the right temperature of processes and drainage.
However, there is a possibility of substituting coke with charcoal in small furnaces, as it has been
implemented in Brazil (Fujihara, Goulart and Moura 2005). Some industries, use an amount of
alternative fuels other than coke, such as pulverized coal, fuel oil, natural gas or plastics. Biomass
can replace some of the coke and can be considered a sustainable fuel, but its disadvantages is its
low heating value which results in very large amounts of this fuel needed for the furnace.
At present, the iron and steel industry uses fuels for the heating furnaces, such as oil, LPG and
natural gas. By substituting these fuels with biomass, a reduction in the carbon dioxide emissions
could be reached. It is better to convert the biomass to synthetic natural gas (SNG) in order to
increase the biomass' heating value before the fuel burning process in the furnaces. The
conversion happens via gasification and anaerobic digestion. There are research results stating
that by 2020 it will be possible to have a 10% substitution of LPG with gas resulting from
gasification process with biomass or waste as an input in Swedish steel production processes
(Jernkontoret 2009).
Complementary Direct-Reduced Iron (DRI) plant
Usually steel scrap is the material fed to the electric arc furnace in secondary steelmaking, but
there has been a proposition of a technology for DRI plants named MIDREX to substitute or
mix the steel scrap with direct-reduced iron from an integrated DRI plant to the secondary steel
plant, when steel scrap shortage occurs. This DRI plant can work additionally to the blast furnace
processes and also has less investment costs related to the installation of a blast furnace for
instance. Therefore, it is a cost-efficient option, which reduces the CO2 emissions by 40% related
to a blast furnace process (Tennies, Metius and Kopfle 2010). However, the emission reduction is
the case only for DRI plants that use natural gas as their energy source (MIDREX Technologies
2013) and not for cases where coal is the energy source of the plant. In that case the emissions
are actually higher.
DRI is produced from the direct reduction of iron ore by a reducing gas, which is a product from
natural gas or coal. Therefore, the integration of DRI plants in the steel making processes is
advised for cases where the natural gas process is relatively low.
Hot water from cooling beds
The cooling beds of the furnace produce convective heat and radiation that when recovered, can
be useful as hot water for district heating purposes or heating purposes at the steel mill. Studies
have shown that a 40% of this heat can be indeed recovered by heat exchangers for the radiation

15
heat and copper pipes with water as working fluid or solar heating panels for the radiation heat (J.
Nilsson 2003).
Industrial Symbiosis
Industrial symbiosis is a systemic relationship where at least two industries with no relation are
involved in an exchange of materials, water, energy or information for their benefit, which is
greater in a collective way than it would have been if the industries’ actions were performed
individually (Chertow 2000). A very well-known example of industrial symbiosis is the city of
Kallundborg in Denmark.
Considering the above, the iron and steel industry can have great potential of efficiency increase
by introducing industrial symbiotic relations with other industries. By doing that, the iron and
steel industry can exchange its outputs, such as waste heat or waste output material with fuel or
reducing agents needed for its processes.
Thermal energy storage (TES)
TES is a good solution when the excess heat which is an industry output can be utilized but isn’t,
because of the long distances between the industrial plant and the end-user. The two main
technologies of TES that are being investigated are the following:
i. Sorption technology, with energy storage as sensible heat in a liquid or solid medium
ii. Latent heat storage, where a phase change is conducted to a phase change material (PCM) and the energy for the phase change is therefore stored into the material
iii. Storage as chemical energy or products in reversible chemical reactions with special storage material, in which research is now applied in order to increase their temperature range (Agyenim, et al. 2010) (Martin and Setterwall 2008)
Analyzing the option for energy recovery that could lead to the efficiency improvement of steel plants,
(Johansson and Söderström 2010) concludes that are more applicable options for an integrated steel plant
than a scrap-based steel plant, because of the larger number of energy flows in integrated steel plants,
which consequently result in larger amounts of excess energy.
These options for efficiency improvement need motivation for installing in the iron and steel industry and
possible high electricity prices can be such motivation. In cases of industries that are active in the district
heating market, the main concern is the viability and the reliability of the heat supply from a long-term
point of view (Johansson and Söderström 2010). One factor for this to succeed is to secure the financial
viability and cost-effectiveness of such projects. The other factor is to ensure that the network can sustain
this heat supply according to the district heating demand.
Johansson and Söderström (2010) states the fossil fuel substitution with biomass is not highly likely to
happen in the near future in Sweden, but Carbon Capture and Storage (CCS), DRI and renewable energy
sources’ integration are more likely to be implemented in the case of the Swedish industry. Heat recovery
and electricity production from ORC and Kallina cycles are also a favorable options.

16
3 Overview of policies for improving energy efficiency
3.1 Experiences from the Swedish program for improving
energy efficiency (Programmet för energieffektivisering –
PFE)
PFE was introduced in 2004 by Energimyndigheten and around 100 energy intensive companies
participated in its first phase of five years. PFE is a voluntary agreement (VA) between
Energimyndigheten and the companies, for exemption of the minimum tax on electricity imposed by the
EU. In exchange for this exemption, the companies are expected to fulfill the following requirements:
conduction of an energy audit and analysis of the energy system of the company,
identification of possible cost-effective electricity saving measures,
implementation and certification of an energy management system for the company,
introduction of energy efficient procurement routines and planning of projects and
introduction of specified practices for efficiency gains (Stenqvist and Nilsson 2011).
Energimyndigheten states that the gross impact of PFE was electricity savings of 1,450GWh/year, while
the investment costs amounted to 708 million SEK. In total, 1247 measures were taken towards
improving energy efficiency (Energimyndigheten 2011).
PFE is mainly focused on electricity efficiency improvements, since electricity is the main energy carrier in
the industrial sector. However, the data from Energimyndigheten on the energy usage in the different
industrial sectors and different fuel sources proves that electricity only contributes to around 1/3 of the
total energy consumption in the industrial sector. They also prove that around 2/3 of the industrial
energy usage occurs in energy intensive industries like the pulp and paper and iron and steel industry
(Energimyndigheten 2012). Energy intensive industries such as these do not have electricity as their
primary energy carrier, as it is shown above, and thus, a program that would incorporate more energy
carriers would be more suitable for these industries and successful in overall energy savings.
Using electricity as the energy carrier was giving the Swedish energy intensive industries an advantage,
because of the low prices at which the companies were purchasing electricity. However, since the Swedish
electricity market was integrated with the European and the EU-ETS (Emissions Trading System) was
introduced, the advantage has been lost for the Swedish industries. Thus, the increase in electricity prices
has been a concern for the Swedish industry for at least ten years (Stenqvist and Nilsson 2011).
The industrial electricity consumption was untaxed in Sweden until 2004, when criticism from the EU
was placed upon Sweden for this matter because of the inconsistencies created in the common European
“This chapter offers insight into policies that aim to increase energy efficiency in the
industrial sector. The policies considered are: the Swedish program PFE for energy
intensive industries; the experience that other EU countries have from energy efficiency
obligation schemes; and the outline of the EED showing how it tackles the issue of
energy savings and the basic principles for designing an energy efficiency obligation
scheme. The final sections address issues related to the motivation for the industry to
participate in energy efficiency obligations schemes, a comparison between PFE and
energy efficiency obligation schemes and possible alternative policy instruments.”
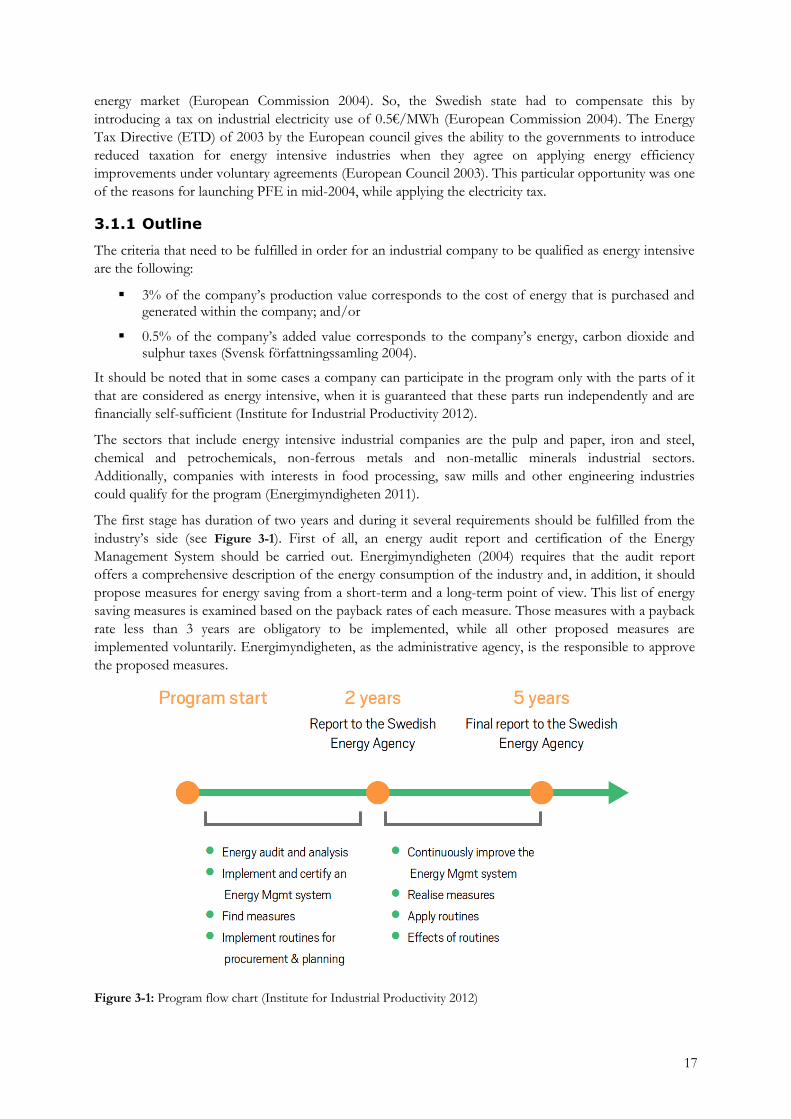
17
energy market (European Commission 2004). So, the Swedish state had to compensate this by
introducing a tax on industrial electricity use of 0.5€/MWh (European Commission 2004). The Energy
Tax Directive (ETD) of 2003 by the European council gives the ability to the governments to introduce
reduced taxation for energy intensive industries when they agree on applying energy efficiency
improvements under voluntary agreements (European Council 2003). This particular opportunity was one
of the reasons for launching PFE in mid-2004, while applying the electricity tax.
3.1.1 Outline
The criteria that need to be fulfilled in order for an industrial company to be qualified as energy intensive
are the following:
3% of the company’s production value corresponds to the cost of energy that is purchased and generated within the company; and/or
0.5% of the company’s added value corresponds to the company’s energy, carbon dioxide and sulphur taxes (Svensk författningssamling 2004).
It should be noted that in some cases a company can participate in the program only with the parts of it
that are considered as energy intensive, when it is guaranteed that these parts run independently and are
financially self-sufficient (Institute for Industrial Productivity 2012).
The sectors that include energy intensive industrial companies are the pulp and paper, iron and steel,
chemical and petrochemicals, non-ferrous metals and non-metallic minerals industrial sectors.
Additionally, companies with interests in food processing, saw mills and other engineering industries
could qualify for the program (Energimyndigheten 2011).
The first stage has duration of two years and during it several requirements should be fulfilled from the
industry’s side (see Figure 3-1). First of all, an energy audit report and certification of the Energy
Management System should be carried out. Energimyndigheten (2004) requires that the audit report
offers a comprehensive description of the energy consumption of the industry and, in addition, it should
propose measures for energy saving from a short-term and a long-term point of view. This list of energy
saving measures is examined based on the payback rates of each measure. Those measures with a payback
rate less than 3 years are obligatory to be implemented, while all other proposed measures are
implemented voluntarily. Energimyndigheten, as the administrative agency, is the responsible to approve
the proposed measures.
Figure 3-1: Program flow chart (Institute for Industrial Productivity 2012)

18
The first stage of the program also includes the introduction of routines of procurement of electrical
equipment, which is classified as high consuming. The above stated actions are within the field of energy
efficient project planning, which the company is expected to implement when entering this phase of the
PFE. Life cycle cost analysis for all the routines of the company is very important for the decision-making
procedures and, thus, energy efficient equipment is preferred for the reduction of the consumption of
energy of the company (Energimyndigheten 2006).
The first report at the end of the first stage is submitted to Energimyndigheten for reviewing the level at
which the requirements have been met and the overall amount of electricity savings expected from these
measures. The second stage is 3 years long and is dedicated to the implementation of all the proposed
measures of the first stage. All of the measures, routines and obligations in the context of the Energy
Management System implementation should be applied (Stenqvist and Nilsson 2011). After the
completion of the 5 years of the program’s duration, a final report is submitted to Energimyndigheten for
the assessment of the results of all the efficiency improvement measures that were applied.
The goal to be achieved is the energy efficiency improvements in the context of PFE to be equivalent to
the improvements that would occur if the industrial electricity use tax was applied (Svensk
författningssamling 2004). The trade-off between the implementation of PFE’s measures of efficiency
improvement and the tax application has its base on the fact that all the PFE measures taken ultimately
substitute the effects of the tax application. As Stenqvist and Nilsson (2011) state, PFE “builds on the theory
that the attention raising effect of its components (e.g., the Energy Management System and the routines) will offset the
impacts of the removed tax on electricity”.
PFE is classified by Stenqvist and Nilsson (2011) as a medium-term voluntary agreement, which basically
offers incentives to the energy intensive industries to enter the agreement by offering tax rebates in
exchange for fulfilling the obligation of the program. From the taxonomy suggested by Price (2005), PFE
is categorized together with other programs related to tax policies for energy consumption and
greenhouse gases emissions in terms of the program’s implementation and eligible actors.
Voluntary agreements such as PFE can be classified among both prescriptive and economic policies. Prescriptive
policies are regulations and agreements that compel specific actions to the industries and these actual
promises must be held towards the government (Tanaka 2011). These agreements target industrial aspects
as equipment efficiency, plant or process efficiency and energy management techniques. In addition to
that, the policies that are categorized as economic include taxes and tax reductions, directed financial
support (meaning subsidies or loans), cap and trade schemes, and segregated energy prices with the goal of
influencing the cost-effectiveness that technical actions could have (Tanaka 2011).
PFE is regulated by law (Svensk författningssamling 2004), which defines all the necessary details
regarding the binding agreements. Small room for negotiations and alterations are left.
Energimyndigheten is responsible for reviewing the compliance of the participating companies with the
agreement’s terms and in case that the targets are not met, the participation in the program is terminated
and hence the tax that was exempted has to be paid for the whole time period. The process makes PFE a
rather advanced voluntary agreement and instead of being just a policy instrument it becomes a package
of instruments that help in applying the desired measures, but also complicates the task of evaluating the
implementation (Stenqvist and Nilsson 2011).
3.1.2 Coverage
In Sweden, 1,250 industrial companies are considered as energy intensive according to
Energimyndigheten (2005). At the end of the first phase in March 2007, 95 companies submitted their
report (Energimyndigheten 2007) and after that 20 companies entered the program while a few number
of companies left the program (Stenqvist and Nilsson 2011). From these numbers, one can notice that
only around 10% of the eligible energy intensive companies have actually entered the program. The
grouping of the industrial companies that entered PFE according to their electricity use is presented in the
following chart:
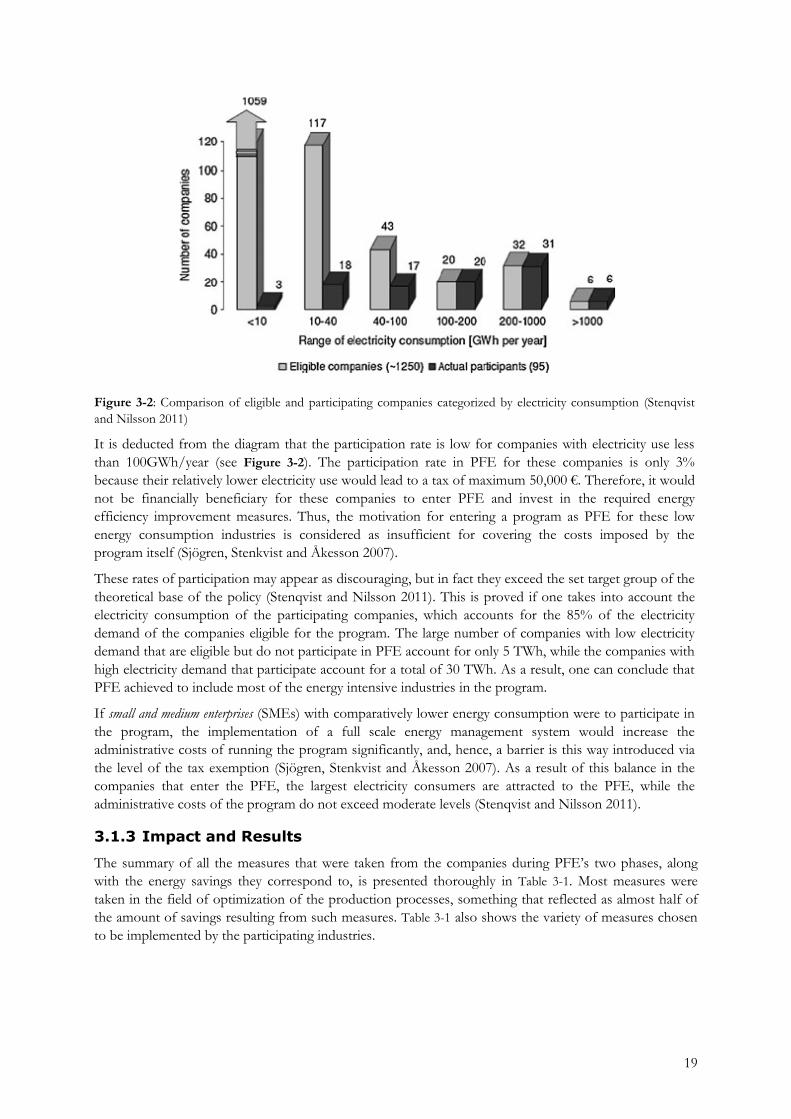
19
Figure 3-2: Comparison of eligible and participating companies categorized by electricity consumption (Stenqvist
and Nilsson 2011)
It is deducted from the diagram that the participation rate is low for companies with electricity use less
than 100GWh/year (see Figure 3-2). The participation rate in PFE for these companies is only 3%
because their relatively lower electricity use would lead to a tax of maximum 50,000 €. Therefore, it would
not be financially beneficiary for these companies to enter PFE and invest in the required energy
efficiency improvement measures. Thus, the motivation for entering a program as PFE for these low
energy consumption industries is considered as insufficient for covering the costs imposed by the
program itself (Sjögren, Stenkvist and Åkesson 2007).
These rates of participation may appear as discouraging, but in fact they exceed the set target group of the
theoretical base of the policy (Stenqvist and Nilsson 2011). This is proved if one takes into account the
electricity consumption of the participating companies, which accounts for the 85% of the electricity
demand of the companies eligible for the program. The large number of companies with low electricity
demand that are eligible but do not participate in PFE account for only 5 TWh, while the companies with
high electricity demand that participate account for a total of 30 TWh. As a result, one can conclude that
PFE achieved to include most of the energy intensive industries in the program.
If small and medium enterprises (SMEs) with comparatively lower energy consumption were to participate in
the program, the implementation of a full scale energy management system would increase the
administrative costs of running the program significantly, and, hence, a barrier is this way introduced via
the level of the tax exemption (Sjögren, Stenkvist and Åkesson 2007). As a result of this balance in the
companies that enter the PFE, the largest electricity consumers are attracted to the PFE, while the
administrative costs of the program do not exceed moderate levels (Stenqvist and Nilsson 2011).
3.1.3 Impact and Results
The summary of all the measures that were taken from the companies during PFE’s two phases, along
with the energy savings they correspond to, is presented thoroughly in Table 3-1. Most measures were
taken in the field of optimization of the production processes, something that reflected as almost half of
the amount of savings resulting from such measures. Table 3-1 also shows the variety of measures chosen
to be implemented by the participating industries.

20
Type of end-use technology Second-year report Fifth-year report
No. of
measures
GWh
elec.
savings
% of
savings
No. of
measures
GWh
elec.
savings
% of
savings
Production processes: large variety of
measures, often involves optimization
of motor-related processes 243 354 49 312 443 48
Pumping systems: VSD control and
replacement of pumping equipment 214 142 20 289 154 17
Compressed air systems: sealing air
leakage, measures on compressors and
vacuum systems 78 76 10 118 94 10
Indirect elec. efficiency and other
measures: electric boilers, phase
compensation, control of motor
heaters 65 64 9 107 93 10
Industrial motors: installation of
efficient motors, VSD control 85 30 4 140 55 6
Fan systems: VSD control on different
industrial fan applications, e.g., drying
and de-dusting 58 22.5 3 90 34 4
Space heating and ventilation: heat
recovery and demand controlled
HVAC equipment 50 21 3 71 19 2
Cooling systems: optimization and
replacement of cooling machines 19 10 1.5 26 15 2
Lighting systems: time and presence
controlled lighting 48 6.5 1 110 10 1
Totals from technical and O&M
measures 860 726 100 1254 917 100
Table 3-1: Reported annual electricity savings from technical and O&M measures (Energimyndigheten 2007)
In addition to these savings, Energimyndigheten (2011) states that the following energy savings were
reported:
Electricity savings due to energy efficient routines: 174 GWh/year from project planning and 36 GW iron/year from procurement practices.
Supplementary electricity saving measures: 323 GWh/year from measures of various characteristics with a large impact on energy consumption and are under a separate category.
Energimyndigheten (2011) states that the gross annual impact of PFE was 1,450 GWh/year, a figure
which tremendously exceeds the initially set goal of energy savings of 375 GWh/year and also exceeds the
goal of 1,000 GWh/year of energy savings that was set at the end of the first phase of the program. This
set of data justifies the success of PFE and validates its correspondence to known policy theories. The
significant increase in energy savings at the end of the program, related to the initially set goals, can be
explained by the fact that the companies were cautious in identifying and listing only the necessary
measures for energy efficiency improvement dictated by their legal agreement in the first phase of the
program. Hence, at the beginning of the program the expectations were moderate, but the companies
showed willingness and spent resources in their efforts for increasing the energy savings by introducing
more measures during the second phase of the program.

21
The annual savings that occurred from the companies’ participation in PFE exceed in general both the
target level of the program and the average performance level. Figure 3-3 shows that the ex-post
evaluation of the program has a much higher average level of energy savings for the participating
companies than that that the ex-ante evaluation estimated. In both cases, the target level of energy savings
is exceeded.
Figure 3-3 – a. Ex-ante deemed electricity savings from listed measures of the second-year report, as compared to the cost raising effect of a fictive minimum tax b. Ex-post measured or engineering estimated electricity savings from listed and additional measures of the fifth-year report, as compared to the cost-raising effect of a fictive minimum tax. Source: (Stenqvist and Nilsson 2011)
Stenqvist and Nilsson (2011) claim that this behavior from the companies’ side can be explained by the
following phenomena:
The energy management system
The energy management systems were fully introduced in the companies only after the second
year and, as a result, their effect is applicable during the later three years of the program for the
participating companies in the first phase of PFE. This is the reason why the largest share of
energy savings impact is noticed in the later years of PFE and reaches 700GWh. The routines
directly related with the energy management system are stated to produce energy savings of 210
GWh/year and the other about 500 GWh/year achieved via technical and operational and
maintenance measures, which were administered by the energy management system. Although
the energy management system implementation cannot be viewed as a direct reason of energy
efficiency improvement, the companies have expressed their claims that these systems helped in
the organization of the energy system of the company and therefore the improvement of its
efficiency.
The legally binding agreement
The legal nature of PFE, although a voluntary agreement, was strong. The legislation that
accompanied PFE led the companies that participated into being cautious in the electricity saving
measures they were listing for implementation, in fear of not being able to fulfill an excess of
targets with overestimated figures that would be difficult to be subsidized. As the program
evolved in its later years, the companies had secured the necessary funds and the needed
knowledge to implement additional measures.
The development of electricity prices
The variation and increase of electricity prices is always a threat for energy intensive industries.
For example, the “cost reductions resulting from lower energy use” and “the threat of rising energy prices” are
the first and fourth most important reasons to pursue energy efficiency improvements in the

22
Swedish pulp and paper industry (Thollander and Ottosson 2008). This shows a trend among the
Swedish industries, which is based on the fear of the future evolution of the electricity prices and
the impact this might have on the industries themselves. This motivation cannot be directly
related to PFE, but the fact that the program emphasizes intensively on electricity saving
measures and energy efficiency improvements, in addition with the support to the companies
overcoming difficulties in realizing these measures, makes it a valuable motivational factor for the
energy intensive industries to pay attention to energy saving practices that were previously not
considered.
The net impact of PFE is affected by externalities such as the free rider and spillover effect, which were
defined in Section 1.3.2 and the double counting effect. The double counting effect is defined as the effect that
might potentially exist when there is overlapping of the energy savings’ allocation to different policies
(Stenqvist and Nilsson 2011).
Stenqvist and Nilsson (2011) investigated these effects influence on the net impact of PFE. About the
free rider effect, they state that the energy audits resulted in additional energy savings measures that the
ones identified before it. On the other hand, there were technical measures and operation and
management measures that were known before the energy audits. They conclude that the electricity
savings of PFE resulting from the free rider effect are reaching 40% of the total savings.
Regarding the spillover, Stenqvist and Nilsson (2011) observe that there was a general energy efficiency
improvement in the participating industries, which was not only limited to electricity, but spread to other
energy carriers as well due to the spillover effect. The measures implemented resulted in savings of heat
and fuel of 950GWh/year, as reported.
Regarding the double counting effect, there is low risk of double counting because the savings required
are specifically electricity savings, which are carefully identified, monitored and cross checked by
Energimyndigheten, and thus no interference with other policies occurs in that case. The participating
industries have also to report to only one agency (Energimyndigheten) and thus the risks of double
counting are reduced even more.
A bottom-up approach should be implemented into the evaluation of the accuracy of these factors and
their final effect on the net impact of PFE. An evaluation plan as such would contribute in identifying the
next energy policies that the results of PFE could be useful to (Stenqvist and Nilsson 2011).
3.1.4 Cost-effectiveness
The cost effectiveness of PFE is assessed based on the cost per saved amount of energy (€/kWh) and if
the analysis is based on the society perspective the costs of savings included are those placed upon the
government and the end users, which are, in that case, the companies participating in the program. If the
deprecation period of the savings measures is set to 12 years and the discount rate to 4%, among other
assumptions, the cost of saved energy is calculated to be between 0.0093 and 0.0136 €/kWh of electricity
saved (Stenqvist and Nilsson 2011). The cost-effectiveness of PFE is then proved by the fact that the
wholesale electricity prices in the period of PFE’s first implementation (2006-2009) have been between
0.029 €/kWh and 0.051 €/kWh (Nord Pool Spot AS 2011). Thus the cost of implementing the energy
savings measures have been lower than the avoided costs from electricity purchases and the program can
be assessed as successful in terms of cost-effectiveness achieved.
3.2 Energy efficiency obligation schemes in the EU
3.2.1 Experience from other EU countries
White certificates can have a varying form of definition, as the approach to each case varies according to
the sector and the targets that the energy policies are accustomed to. In general, white certificates can be
defined as a policy scheme that includes all forms of energy efficiency obligations, which relate,
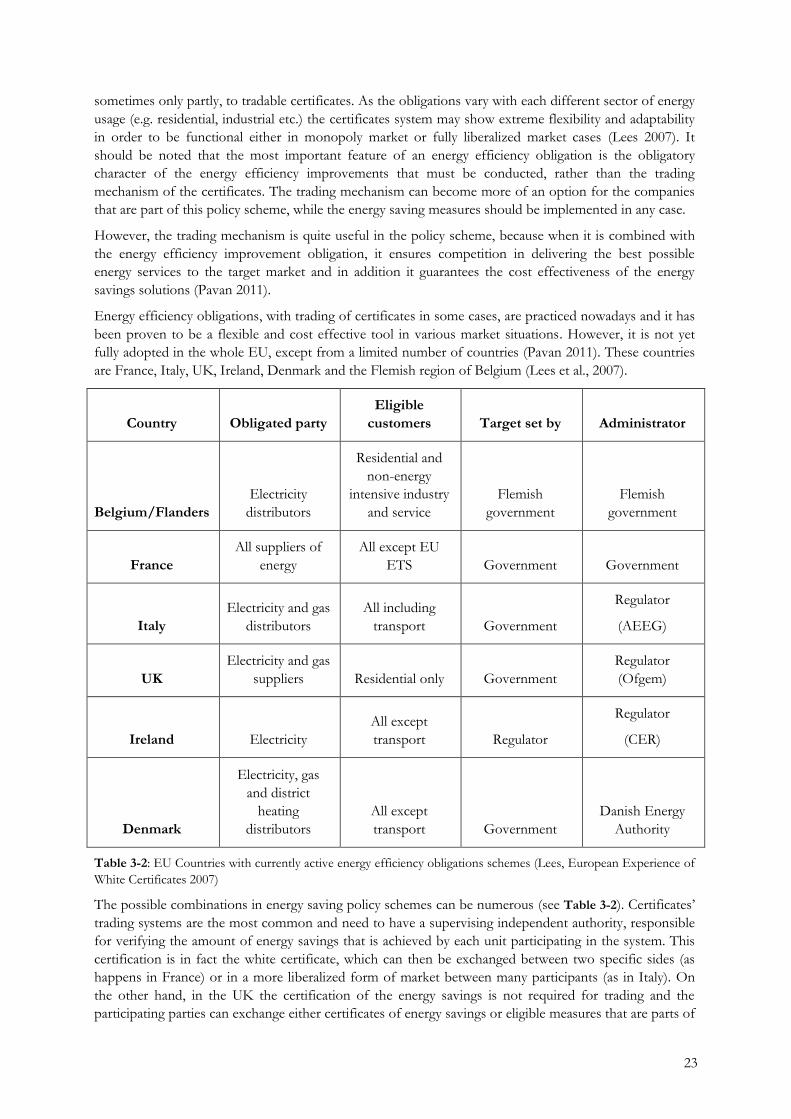
23
sometimes only partly, to tradable certificates. As the obligations vary with each different sector of energy
usage (e.g. residential, industrial etc.) the certificates system may show extreme flexibility and adaptability
in order to be functional either in monopoly market or fully liberalized market cases (Lees 2007). It
should be noted that the most important feature of an energy efficiency obligation is the obligatory
character of the energy efficiency improvements that must be conducted, rather than the trading
mechanism of the certificates. The trading mechanism can become more of an option for the companies
that are part of this policy scheme, while the energy saving measures should be implemented in any case.
However, the trading mechanism is quite useful in the policy scheme, because when it is combined with
the energy efficiency improvement obligation, it ensures competition in delivering the best possible
energy services to the target market and in addition it guarantees the cost effectiveness of the energy
savings solutions (Pavan 2011).
Energy efficiency obligations, with trading of certificates in some cases, are practiced nowadays and it has
been proven to be a flexible and cost effective tool in various market situations. However, it is not yet
fully adopted in the whole EU, except from a limited number of countries (Pavan 2011). These countries
are France, Italy, UK, Ireland, Denmark and the Flemish region of Belgium (Lees et al., 2007).
Country Obligated party
Eligible
customers Target set by Administrator
Belgium/Flanders
Electricity
distributors
Residential and
non-energy
intensive industry
and service
Flemish
government
Flemish
government
France
All suppliers of
energy
All except EU
ETS Government Government
Italy
Electricity and gas
distributors
All including
transport Government
Regulator
(AEEG)
UK
Electricity and gas
suppliers Residential only Government
Regulator
(Ofgem)
Ireland Electricity
All except
transport Regulator
Regulator
(CER)
Denmark
Electricity, gas
and district
heating
distributors
All except
transport Government
Danish Energy
Authority
Table 3-2: EU Countries with currently active energy efficiency obligations schemes (Lees, European Experience of
White Certificates 2007)
The possible combinations in energy saving policy schemes can be numerous (see Table 3-2). Certificates’
trading systems are the most common and need to have a supervising independent authority, responsible
for verifying the amount of energy savings that is achieved by each unit participating in the system. This
certification is in fact the white certificate, which can then be exchanged between two specific sides (as
happens in France) or in a more liberalized form of market between many participants (as in Italy). On
the other hand, in the UK the certification of the energy savings is not required for trading and the
participating parties can exchange either certificates of energy savings or eligible measures that are parts of

24
projects from third parties. In addition, the UK trading scheme does not require a formal authority
authorizing the trading (Pavan 2011).
The benefits of a white certificates trading system vary according to each party of interest as follows:
the regulatory authorities can track the progress of achieving the targets set by the energy policies,
the parties that are obliged to conform with the targets have a chance to fulfill their obligation by purchasing the needed certificates, and
the parties that are able to create and sell certificates can have an additional source of revenue, which is cost effective and has a low risk combined with financial rewards (Capozza 2007).
The countries where energy efficiency obligation schemes have been introduced present several options
in terms of choice of the targeted sector and how the energy savings are measured. Italy and the Flemish
region of Belgium use primary energy as indicator of energy savings, while Denmark and France use final
energy savings. The UK uses the obligation of Carbon Emission Reduction Target (CERT), which is
expressed in CO2 emissions savings (Bertoldi, et al. 2010). The targets are set either on an annual or multi-
annual scale, usually one of 3 years, which ensures stability in the compliance to the targets but gives
space for adjustments to the targets based on market observations (Bertoldi, et al. 2010).
In a market of tradable certificates, the project size that should be certified and the time of validity of the
certificate are important factors influencing the market’s characteristics. There should be rules defining
the banking and borrowing of certificates’ policies. The property right (ownership) is another factor to
consider about white certificate markets. The property right owner of a white certificate could be either
the party responsible for the execution of the energy saving measure, the party responsible for financing
the measure implementation or the party responsible for providing the space where the execution of the
energy saving measure takes place. So, with each different approach to the property right of the
certificates, the market’s nature differs (Bertoldi, et al. 2010).
The certificate trading market has certain rules in order to ensure its liquidity, as Waide and Buchner
(2008) state:
infrastructure for the minimization of transaction costs,
market places with very good functioning processes, and
registries and low administrative requirements in order to perform the trading.
The business models of the parties participating in an obligation scheme, with or without the trading
option basically do not change by engaging in energy saving measures, at least from a short term point of
view. The characteristics that govern the design of these schemes, such as the saving targets, their time
scale (annual or longer), the decision on the obliged parties and the eligible energy consuming sectors and
the liberalization policies of the energy saving measures market are subject of the national policy schemes
and must be managed on such levels (Bertoldi, et al. 2010). Nevertheless, all these schemes should be
designed in order to be cost effective and agree with the energy efficiency targets set.
A well-designed and functioning market is based on the standardization of measurement techniques for
the values of interest and trustworthy verification methods. By ensuring these two, the market operation
is more efficient and reliable and the transaction costs for the participants and the project developers
become lower. One of these standardized methodologies is that of “deemed savings”, which will be
discussed further in the sections to come. Regulating the market by minimum buy-out prices and
penalties has proven to be successful based on the experience of countries applying white certificates’
trading (Bertoldi, et al. 2010).
The targets set by the certificates’ trading regulating authority should be sufficiently high in order to make
the obliged actors reduce their costs of compliance, something that happens by trading in bigger ratios,
which consequently makes the trading processes more cost-effective. As Bertoldi, et al. (2010) states,
“trading is expected to deliver cost efficiency gains when energy-saving targets are set sufficiently high with respect to the
25
existing economic saving potential in the sectors covered by obligations. The more challenging the obligation is, the greater the
benefit of trading as it brings diversity in the marginal costs of compliance among trading parties”.
Even if the trading schemes have not always been applied in cases of energy saving obligation schemes,
most countries implementing such schemes believe that trading is the best option in the future, but first a
significant level of knowledge must be acquired in order to analyze their costs and benefits (Lees 2007).
3.2.2 The EU Energy Efficiency Directive (EED)
The EU EED from the 25th October 2012 (European Parliament 2012) states as potential policy
instruments for achieving energy savings both energy efficiency obligations and energy saving funds. The
introduction of energy efficiency obligation schemes is suggested in its articles.
Article 7 of the EED states that the final energy suppliers or the distribution network operators of all the
Member States are obliged to annual energy savings reaching 1.5% of each previous year’s energy sales by
volume, excluding transport (European Parliament 2012). This means for the case of Sweden an amount
of energy savings around 3 TWh (Energimyndigheten 2012). The design of the scheme is left by the
European Union to be quite flexible as each Member State can select the way they prefer to reach the
target. Thus, alternative policy schemes can be used instead of only a savings quota in order to achieve the
target energy savings.
The questions that have risen among almost all of the Member States about the cost and benefit relation
of the introduction of these energy efficiency obligation schemes are yet to be answered. The effect of
these policies should be investigated under a macroeconomic perspective, taking into account the
perspectives of the affected actors at the national level as a first step.
The 2012/27/EU Directive and the impact assessment accompanying it attempt to close the gap between
the target of 20% energy savings by 2020 and progress up until now (European Commission 2011). The
objectives of the EED are stated as the following, according to (European Commission 2011):
stimulation of political commitment to energy efficiency,
activation of cost-effective implementation of potential demand-side measures, particularly in the
buildings and industry sector,
support of a commercial market for delivery of energy efficiency improvements,
equal market rules for all the actors in the energy efficiency market,
simplification of the legislative framework for energy efficiency to decreased administrative costs,
provision of understandable and correct information about the energy use for the consumers,
introduction of supply-side measures that ensure a cost effective transformation, transmission and
distribution of energy, and
support for the establishment of “smart grids”, encouraging energy efficiency improvements.
The countries that have already applied various types of energy efficiency obligation schemes are useful
sources of information to take into account when designing a policy scheme. For the case of Sweden,
Energimyndigheten has previously published some reports that investigate the effects of such schemes in
other EU countries that have applied them (especially Denmark) and have tried to analyze the possibilities
of application of similar schemes in Sweden. As a result, Energimyndigheten states that the application of
a compulsory quota system should not be introduced in Sweden, due to its lack of cost-effectiveness,
particularly compared to the cost-effectiveness of existing instruments (Energimyndigheten 2012). It is
also stated that since a quota system is not the only instrument to achieve energy savings, other
instruments, or the combination of them, can lead to the achievement of the set goals.
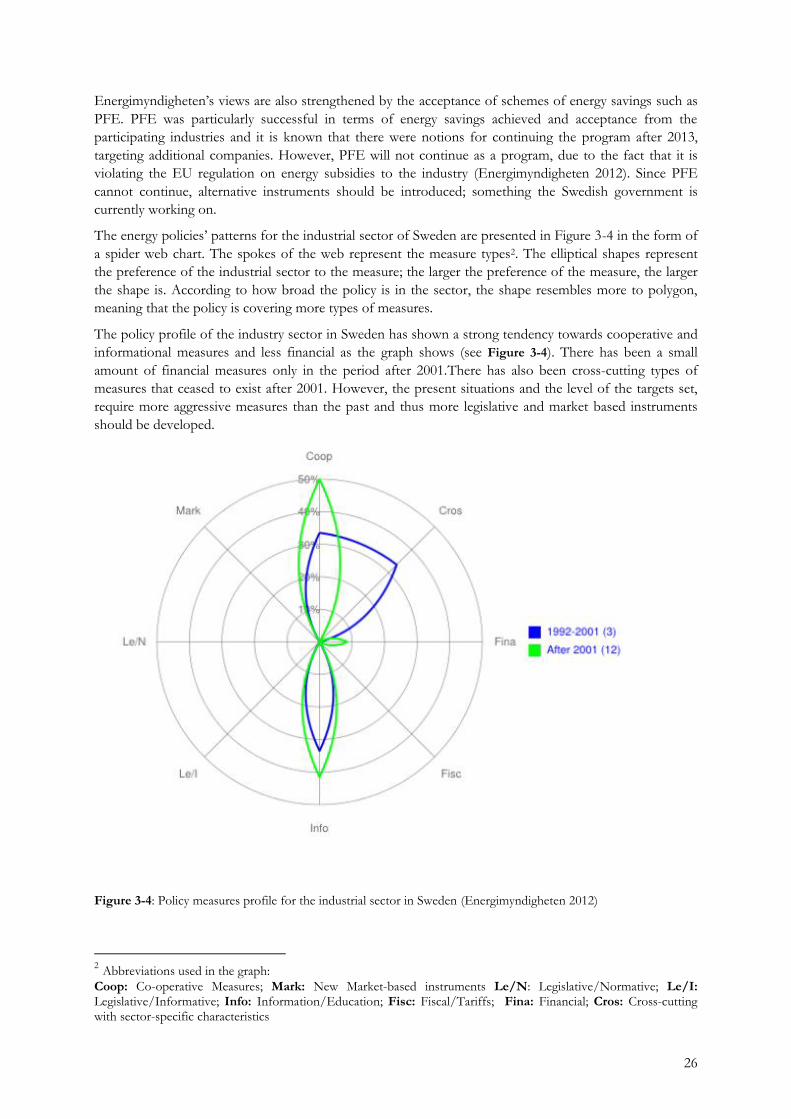
26
Energimyndigheten’s views are also strengthened by the acceptance of schemes of energy savings such as
PFE. PFE was particularly successful in terms of energy savings achieved and acceptance from the
participating industries and it is known that there were notions for continuing the program after 2013,
targeting additional companies. However, PFE will not continue as a program, due to the fact that it is
violating the EU regulation on energy subsidies to the industry (Energimyndigheten 2012). Since PFE
cannot continue, alternative instruments should be introduced; something the Swedish government is
currently working on.
The energy policies’ patterns for the industrial sector of Sweden are presented in Figure 3-4 in the form of
a spider web chart. The spokes of the web represent the measure types2. The elliptical shapes represent
the preference of the industrial sector to the measure; the larger the preference of the measure, the larger
the shape is. According to how broad the policy is in the sector, the shape resembles more to polygon,
meaning that the policy is covering more types of measures.
The policy profile of the industry sector in Sweden has shown a strong tendency towards cooperative and
informational measures and less financial as the graph shows (see Figure 3-4). There has been a small
amount of financial measures only in the period after 2001.There has also been cross-cutting types of
measures that ceased to exist after 2001. However, the present situations and the level of the targets set,
require more aggressive measures than the past and thus more legislative and market based instruments
should be developed.
Figure 3-4: Policy measures profile for the industrial sector in Sweden (Energimyndigheten 2012)
2 Abbreviations used in the graph:
Coop: Co-operative Measures; Mark: New Market-based instruments Le/N: Legislative/Normative; Le/I: Legislative/Informative; Info: Information/Education; Fisc: Fiscal/Tariffs; Fina: Financial; Cros: Cross-cutting with sector-specific characteristics

27
3.2.3 Design of an energy efficiency obligation scheme
The Fraunhofer Institute for Systems and Innovation Research (Fraunhofer ISI) in Germany has
published a comprehensive report on the potential of application of a market-oriented energy obligation
scheme in Germany.
Design elements Design proposal
Reference of the savings target
Reference final energy, saved final energy quantities weighted with primary-energy factors
Differentiation of the saving target
No explicit differentiation of the saving target by fuel source (consequently no differentiation in the energy-saving certificates); however, weighting should be done by applying primary energy factors (see above).
Fuel sources subject to quotas No specification required from an analytical perspective.
Selection of obligated actors
All suppliers of the fuel sources are subject to the quota unless they fall below a threshold value yet to be set; if required different approaches(e.g. for electricity, natural gas, district heating: consumer suppliers, heating oil: distributors).
Specification of the scope
Broad scope, all energy savings within the approved final energy consumption sectors can be accounted for (with the exception of transport); efficiency measures for processes that are directly subject to ETS are excluded.
Admissibility of types of measure
No restriction to measures that can be standardized, but also ad-mission of heterogeneous (non-standardizable) measures. Measures in the information/ motivation sector cannot be accounted for.
Promotion of innovation No differentiation in the accounting of measures.
Principles for selecting the baseline
General orientation toward the market average
Buildings: EnEV
Devices: product-specific minimum requirements (if implementation measure available)
Processes: process-specific benchmarks oriented at the best 10% (analogous to the allocation rules for emissions trading)
Selection of the accounting period
One-off accounting: for all measures the anticipated saving are dis-counted across the entire life cycle of a measure and allocated to the year of their implementation
Length of the obligation period
4 years; validity period of the certificates is limited to the respective obligation period
Mechanisms for increasing flexibility
Buy-out permissible; banking (i.e. transfer of saving titles to the following obligation period) permissible but restricted to 20% of the savings for
each obligated company.
Allocation of costs No specification necessary from an analytical perspective
Compliance check Permissible actors
Federal Agency for Energy Efficiency (BfEE) (no specification necessary from an analytical perspective).
No restrictions
Basic requirements for certificates
Electronic document within a national registration scheme (operated under state supervision); national register without interface to foreign registers.
ETS interface
No link
Table 3-3: Proposal for the design of an energy efficiency obligation scheme (with trading) (Fraunhofer ISI 2012)
This scheme’s design elements (see Table 3-3) provide the layout needed for starting the cost benefit
analysis, by identifying the related costs and benefits of each action related to the design parameters.

28
Fraunhofer ISI (2012) recommends the use of a broad scope with a few restrictions in the fuels sources,
the sectors participating and the energy efficiency saving measures. This is especially important for the
industry sector, because the potential companies under obligation can then use a wide variety of energy
saving measures that are more likely to be cost-effective.
Any efficiency measures that are linked to the Emissions Trading Scheme (ETS) should be excluded
because of the effect of double counting. This is the situation when credits are provided for both the EU
emissions allowance and energy efficiency obligation schemes, which undermines the EU ETS CO2 cap
(NERA Economic Consulting 2005).
The most important aspect of the design of the scheme is the choice of the level of the baseline, because
only energy savings that are higher than the baseline should be included in the obligation. If the average of
the current stock is set as the baseline, then the baseline standard is not set ambitiously enough and a big
amount of savings would be included in the obligation. However, in reality this represents a deadweight effect,
meaning that measures that would anyway be taken would be eligible for certificate issuing (see the free
rider/deadweight effect explanation in Section 1.3.1). Thus, the market average is recommended as a safer
baseline standard than the average stock value for the success of the energy obligation scheme, because it
is usually defined by legitimate standards (Fraunhofer ISI 2012).
The energy savings can be accounted in terms of primary energy, like in the case of the UK and Italy, or in
terms of final energy, like in France and Denmark (see Table 3-4). The latter case has a wider approach to
all of the energy consuming sectors instead of focusing on the energy producing sectors only. All schemes
except of Denmark allow certificate trading, with differences in the intensity of it. For example in Italy the
trading is higher than the two other countries. The UK energy efficiency obligation scheme is giving
incentives for energy savings in the buildings sector, whereas the other schemes include other sectors as
well.
Design features Impact tendency
Reference primary energy
Reference final energy
Preference of measures in the power industry (GB, IT)
Preference of measures in the fuel (FR, DK)
Accounting over lifetime
No consideration of the technical lifetime
Incentive for measures in the building sector (GB, FR)
Preference of short term measures (IT, DK)
Wide scope
Limited scope
Higher intensity of trade (IT)
Lower intensity of trade (GB, FR)
Definition of standardized measures
Other measures
Low transaction cost (GB)
Danger of heading for less efficient potentials (FR, IT)
Higher transaction cost (IT)
Theoretical enhancement of meeting the quota (DK)
Table 3-4: Design and market effect of energy efficiency obligation schemes in Great Britain (GB), Italy (IT), France
(FR) and Denmark (DK) (Fraunhofer ISI 2012)
The EED propose four different policy options in the context of implementing an energy efficiency
obligation scheme. These options were evaluated in the EU’s impact assessment for the EED (European
Commission 2011) for the EU Member States, according to their effectiveness, efficiency and coherence
(see Table 3-5). Option B1 and B2 show limited levels of effectiveness. An overall assessment of efficiency
is difficult to perform at a national level, and as the energy savings market will perform below its potential
by implementing these options, the market barriers for energy savings will continue to exist. Nevertheless,
there is no conflict with other EU policies, because of these options’ moderate character. The
introduction of energy saving obligations in the options B3 and B4 will cause a higher level of

29
effectiveness, because a clear amount of energy will be saved in order to comply with the obligations’
requirement, and thus such an energy efficiency policy will have enforced reliability. Option B4 requires an
amount of 1.5% of annual savings, because of the harmonization of the EED’s requirements instead of
setting a savings goal on a national level. Option B4 shows higher levels of effectiveness than B3, without
in a negative way affecting the economic, social or environmental impacts (European Commission 2011).
As a result, if Option B4 is introduced with the addition of tradable quotas, higher levels of efficiency and
cost-effectiveness can be achieved related to Option B3, as long as harmonization (in the levels of
ambition and counting methods) is used for the reduction of the administrative costs that such a system
has (European Commission 2011).
Evaluation criteria
Policy Options
Subsidiarity/
Proportionality
Effectiveness
Efficiency
Coherence
OVERALL
Option B1: Retain the
current approach R = = = =
Option B2: Repeal the current ESD provisions
without replacement
R = = C =
Option B3: Require all Member States to introduce energy saving obligations while leaving their design
for determination by Member States
R ++ ++ C ++
Option B4: As B3 but with harmonization of key design
features (targeted sectors, level of ambition and counting methods)
R +++ +++ C +++
Table 3-5: Analysis and evaluation of different policy options for energy efficiency obligation schemes in the EU (European Commission 2011) (R=respects principles of Subsidiarity/Proportionality, C=coherent, = neutral effect, + positive effect, ++ very positive effect, +++optimal effect, - negative effect)
3.3 Effects of the energy efficiency obligation scheme from
the industry perspective
3.3.1 Making the scheme cost-effective for the industry
The criticizers of energy efficiency obligation schemes claim that the implementation of such schemes
contains the danger of exploitation by the energy companies. This is based on the presumption that the
energy companies will pass all the costs of the implementation of measures to the end-users. According to
the critics, the energy efficiency improvements might result in increases of the volume of energy that is
transported instead of decreasing it, due to rebound effects (see Section 1.3.2). However, the Danish
experience shows that a proper regulation of the policy context and the building of trust and offering of a
free choice of measures can lead to a sustained increase of the energy efficiency in the end users sector
(Danish Energy Association 2011). The same report states that the impact on the national budget from
the energy efficiency obligation scheme was minimal, while it provided a source of economic growth from
the investments that were made.
In the case of France, the largest share of the costs is passed to the taxpayers, in the form of measure
subsidies and tax credits. This raises questions about the equity of the scheme, since the obliged parties

30
finance only 10% of the scheme. The rest is financed by the end users and taxpayers (Giraudet, Bodineau
and Finon 2011). This is negative example of how an energy efficiency obligation scheme becomes a
burden for the taxpayers. In general, the transition of the costs to the tax credit system, although is offered
as an option in the EED, should be avoided. In contrast, the example of Denmark shows that while the
costs are placed mostly on the obliged parties, the efficiency obligation scheme is still cost-effective.
Avoiding scattering the costs among all the taxpayers secures a better “image” of the scheme and in the
case of the industry, there needs to be a firm assurance that the duties and costs of the obliged from EED
parties will not be placed upon them instead.
Since the amount of measures that the obliged parties are capable of taking is not large enough to cover
the obligation, the task of implementation of the measures is passed from the obliged parties to third party
companies that can produce energy savings by choosing measures suitable to them. Thus, a steady cash
flow is produced for energy efficiency services and the energy services market is established (Danish
Energy Association 2011). As the third party companies participating can have energy savings as their total
or partial business, the companies of the industrial sector can implement energy savings measures, which
will lead to energy savings. These savings are conveyed to the obliged parties, which are in need of
reaching their target of energy savings for the given period of time, as the scheme’s operational principles
impose. The third party companies can make a contract of energy savings that should be delivered with
the obliged parties.
These energy savings can be translated in the form of certificates, but in the case of Denmark for example,
the trading is only allowed between the obliged parties (Danish Energy Association 2011). However, in
Italy and France not just the obliged companies can earn certificates, but even the third party companies
can earn certificates for energy savings, which will be subsequently traded and bought at a certain cost
from the obliged companies (Lees 2012). For the case of Italy, where there has been a more active trading
market than in France, the majority of these certificates are earned by companies that cannot be defined as
energy service companies (ESCOs) according to EU’s definition (Lees 2012). The experiences from Italy
and France can be translated to the Swedish case as an opportunity to produce energy savings that can be
purchased from the obliged energy distributor companies in the form of certificates, if an energy
efficiency obligation scheme is designed to allow such forms of certificate trading.
The cost of the implementation of measures can be subsidized by the contract agreement between the
obliged energy company and the third party companies to an extent that is decided based on the
desirability of the measure and the probability that other financial incentives are offered for the
implementation of the measure (Lees 2012). In that case, the industries, which have an efficiency
improving potential, can invest in measures that can be supported financially in the context of the
obligation to deliver energy savings to the obliged actor and simultaneously increase their productivity and
cost effectiveness thanks to the efficiency improvements.
The energy savings should be well documented and verified by an independent source, for example the
authorities responsible for the implementation of the energy efficiency obligation scheme on a national
level. In the Danish energy efficiency obligation scheme, for example, the savings are listed and divided in
three categories (accountable, direct savings and deemed savings) and the energy companies implementing
the measures must have a quality assurance system, which is audited every second year (Danish Energy
Association 2011).
The energy efficiency obligation scheme can tackle issues like the free-rider effect and additionality as they
were defined in Section 1.3.2, when legal agreements between the distributors and the third party
companies are issued before the implementation of the measures that will result in savings counted after
the corroboration of the contract.
The costs of target implementation in the case of Denmark based from the benchmarks that were made
public in January 2012 show that the average cost per saved kWh is 0.05 €/kWh saved for all distributors
(Danish Energy Association 2011). The results also showed that the costs of saved energy were lower than

31
the expected and, in addition, for 2010 higher energy savings occurred than the originally expected
amount. That shows that under the efficiency obligation, the performance of the companies that are
entitled to deliver energy savings is actually exceeding the initial estimations, which can be a result of the
efficient management of the overall scheme’s system and the provision of support, both financial and
administrative, to the implementers of the energy savings measures.
The Danish Energy Agency motivates an energy efficiency obligation on the distributors, stating among
other issues that the obligation scheme practically does not affect the national budget. On the contrary, it
is an efficient instrument in the disposal of energy policy makers. It is also stated that the scheme has
offered the energy services market a new and strong start for energy services demand. The scheme was
assessed as cost effective and there was competition between the new actors that entered the market,
which ensured the cost effective achieving of the energy savings targets. In addition, during the years the
energy savings targets are increasing and the obliged parties are successfully delivering the required savings
consistently. The penalty system is an important part of the scheme and needs to be well defined. The
Danish distributors may lose the license of energy distribution if the set annual targets are not fulfilled
(Danish Energy Association 2011). Figure 3-5 justifies that the costs of energy savings for the Danish case
are actually lower in the case of an energy efficiency obligation scheme than other instruments for energy
efficiency improvements.
Figure 3-5: Evaluation of the energy efficiency obligation scheme related to other policy instruments from the
Danish Energy Agency based on the cost of energy savings of each scheme (Danish Energy Association 2011)
One might contemplate on what would be the motivation for the industries to enter the energy efficiency
obligation scheme, since the obligation of energy savings is not placed upon them, but on the energy
suppliers or distributors of energy. One might also note that the investments that need to be made from
the industries, particularly the energy intensive ones, would be large and would accumulate on the overall
costs of operation, probably reducing the competitiveness of the industries in the already competitive
global market. Representatives of the industry have expressed these fears informally, however, these fears
are not justified, since the improvements of energy efficiency in these large industries can be beneficiary in
the long term.
First of all, the implementation of energy savings measures, however the large investments costs that
initially occur, ensures low payback periods for the industry, as stated previously for the case of Denmark.
This is because of the avoided costs of energy that the companies would otherwise have to pay. This is a
very important factor to consider in favor of introducing energy savings measures, since the prognosis for
the energy prices show that there will be a significant rise of prices in the future. This will trigger much
higher costs of energy for large energy intensive industries, which already have nevertheless an important

32
share of their costs of operation originating from their energy consumption. Thus, it can be assumed that
the energy intensive industries will more or less have to implement energy savings measures. Including
these measures in the context of an agreement with the obliged parties of an energy efficiency obligation
can only lead to benefits for the companies, since the obliged actors that need to ensure that they will
fulfill their obligation will subsidize some of the investments the industries will make in energy savings.
From this last remark comes the second factor that proves why the industries should be motivated to
participate in a Swedish energy efficiency obligation scheme. The energy suppliers or distributors are
obliged to fulfill the agreement on energy savings that they have made with the state. In case that the
obligation is not fulfilled, they are required to pay penalties, otherwise known as costs of non-compliance. In
the case of Denmark, the costs of non-compliance for the distributors include financial sanctions and the
risk of losing their license for energy distribution (Tengvad 2013). In France, the costs of non-compliance
for the energy suppliers are reaching 20 €/MWh (170 SEK/MWh) (Lees 2010). If this is the case, once
the obliged actors do not fulfill the energy savings obligation, they have to pay a penalty and this naturally
will be passed through to the end users via the energy prices. Thus, the industries or the other customers
will have one way or another to eventually pay for the energy savings, however the crucial difference is
whether this will have the benefit of achieving energy savings on their own instead of increasing their
energy costs by the rises in energy prices that the costs of non-compliance for the distributors will result
to.
All of the above can be the motivation for the industry to enter the energy efficiency obligation scheme by
utilizing their large potential of energy savings for their profit by making investments that are subsidized
and decreasing their energy costs, instead of leaving the energy prices to rise because of the measures that
the distributors would have to take in order to fulfill their energy savings obligation. This is particularly the
case for the energy intensive industries, since they have large energy costs and simultaneously they have a
vast energy savings potential to exploit.
3.3.2 Energy efficiency obligation schemes from an energy systems
efficiency perspective – Waste heat utilization
District heating is among the energy carriers that are eligible for energy savings in the context of the EED
(European Parliament 2012). The energy efficiency obligation schemes of the other EU Member States
have in some cases incorporated the district heating suppliers, for example in the case of Denmark, where
for 2010 around 35% of the total energy savings in the context of the scheme were achieved from the
district heating distributor companies (Danish Energy Association 2011). Although the savings potentials
from the district heating were not available for Sweden’s industry and thus were not incorporated in the
CBA, it is worth stating that the possibility of including district heating in the obligation will facilitate the
achievement of the target energy savings of Sweden and would be an ideal case for the energy intensive
industries in particular to participate in the scheme by providing to the distributors energy savings from
their large opportunities from waste heat utilization.
Waste heat recovery can offer in terms of efficiency improvement according to the Swedish Steel Producer’s
Association (Jernkontoret). The possibility of using waste heat recovery in the plants for electricity
production purposes could be profitable when under a certain policy scheme that would make district
heating production cost-effective for the industries, because in this way the barrier of the lack of district
heating demand nearby the industries will be overcome by the participation in a scheme of national level.
The reason that the iron and steel industry would be interested in that is stated to be the cost that the
long-term rise of the electricity prices in Sweden may have (Jernkontoret, 2012).
Jernkontoret (2012) states in addition that there is an interest in the entitlement to certificates for
electricity production from excess heat, which would lead to profit from investments into such
installations, especially in cases where there is no district heating demand. It can be deducted from this
that however doubtful energy intensive industries are towards the effects of an energy savings obligation
on them, the possibility of incorporating district heating in the scheme, makes them more willing to
33
participate in the scheme. The policy-makers should exploit such an opportunity and the entrance of
energy intensive industries in the obligation scheme should be promoted and incentivized.
The calculations of the energy savings that result in energy efficiency improvement in energy intensive
industries in the context of an obligation scheme should be a careful process, as many issues arise from
the methods of calculation and indicators used. The indicator of specific energy consumption (SEC) included in
the energy efficiency index of industry (ODEX) used from the EU to indicate the iron and steel industry’s
energy intensity fails to capture the actual energy efficiency improvements of the iron and steel industry.
The SEC in ODEX is not counting the activity of the intermediate sectors of the iron and steel
production plants and thus is not sufficient (Morfeldt and Silveira 2013).
Another issue when accounting the energy savings in the industries is the correct definition of the
boundaries. Currently, there is no consensus on a global level of how the boundaries of the iron and steel
sector industries should be defined (Morfeldt and Silveira 2013). Three possible boundaries that could be
selected would be the process level boundary, the mill level boundary and the mill site boundary (Siitonen,
et al. 2010). According to the choice of boundary, the energy flows are changing of course and as a result
different energy savings can be recorded. Many problems related to energy efficiency calculation in the
iron and steel industry can be avoided by a clear definition of the system boundaries (Siitonen, Tuomaala
and Ahtila 2010). This clear definition is very important for all the industries nevertheless, in order to
account the energy efficiency improvements on the same basis, thus avoiding effects such as double
counting and other effects that were stated in Section 1.3.1 of this report.
Iron and steel plants that have CHP production are self-producers of energy and thus the question is
raised about whether this energy production from CHP should be accounted among the electricity sector
or the heat-producing sector (Siitonen, et al. 2010). Widening the system boundaries of the plant can
include district heating production in the energy balances of the system and results in energy efficiency
improvements that can be incorporated in the efficiency obligation scheme.
Viewing the matter from the system boundary perspective, the expansion of the boundary around an
industry, allows the investigation of the attractiveness and profitability of collaboration between
companies, industrial sectors as a whole and the energy suppliers or distributors (Thollander, et al. 2010).
This offers a whole new spectrum of possibilities in studying energy efficiency improvements instead of
studying the industrial plants as stand-alone components of a system.
3.4 Implementation of an energy efficiency obligation
scheme from an economic and policy perspective
3.4.1 Ability of the energy efficiency obligation scheme to address
energy savings measures
The energy efficiency obligation schemes are in fact an intervention from the state’s side to the energy
market, in a similar way as the one for the EU ETS scheme or the green certificates for renewable energy.
If the scheme is well designed, there is clear evidence that it will help overcome barriers that prevent the
implementation of energy efficiency measures (Lees 2012).
The high initial differential costs of the introduction of an energy efficient product decrease with time, as
the market penetration of the product gradually increases (Lees 2012). This result is expected due to the
effect of the economies of scale. Additionally, the obligated actors become more efficient in delivering the
required energy savings and thus the costs of saving an energy unit decrease over time as well (Lees 2012).
This remark proves that although the initial costs of implementation of an energy efficiency obligation
scheme may be high, their effect becomes positive in a long term perspective, taking into account the
energy services market development and the effect that the new investments should have on energy
savings delivery viewed for longer periods of time.

34
Energy efficiency obligation schemes, when well designed, can work both for “low hanging fruit” measures
and more difficult, and costly to implement, long term energy savings delivering measures (Lees 2012).
This is explained based on the decrease of energy efficiency measures’ cost over time. As these costs
decrease due to the economies of scale and the energy efficiency activity increases, the disappearance of
the cheaper by then low hanging fruit measures is balanced from the effects of the longer term efficiency
measures and the energy demand decreases as well.
3.4.2 Costs of energy efficiency obligation schemes for other EU Member
States
The costs of saved energy for each different efficiency obligation scheme in the EU are divided per person
in Table 3-6Error! Reference source not found. in order to facilitate the comparison between the
schemes, because of the large differences between each country in terms of size of energy market and
division of sectors of energy consumption.
It is particularly difficult to compare the targets because of their varying nature (primary or final energy,
annual or cumulative savings etc.). However, Table 3-6 shows that except from the case of the UK, the
annual costs were quite similar when expressed in terms of costs per person. That is an important
parameter to consider when evaluating the validity of the comparison between the other EU countries’
schemes and a scheme that could be possible for the Swedish case. Although the way to reach the targets,
the size of them or the way to measure them is different, the final outcome is much similar when
expressed in financial terms, and thus the comparison of these schemes is applicable.
Country Type of target Current size of target
Estimated annual
investment by
companies in million
€
{€/person}
Belgium/Flanders 1st year primary energy 0.6 TWh annual 26 {4}
France
Lifetime delivered
energy 54 TWh over 3 years 180 {3}
Italy
Cumulative 5 year
primary energy 2.2 Mtoe in 2008 190 {3}
UK Lifetime CO2 154 Mt CO2 in 3 years 900 {15}
Denmark 1st year delivered energy 0.82 TWh annual 25 {5}
Table 3-6: Comparison of the Target and Size of the Energy Efficiency Obligations in the EU as of 2008 (Lees 2012)
Another factor to consider is the method of accrediting the energy savings. The energy savings can be
accredited annually or in terms of lifetime energy savings. The annual counting of energy savings is
criticized because of the discrimination against measures of longer life time, meaning that two energy
saving measures can have the same cost and energy savings each year, but they may differ in their lifetime
and thus their real impact on energy savings is distorted or not properly accounted in the long term (Lees
2010). That is important in the case of the industry, where the measures that result in large amounts of
energy savings are usually very costly, but they have a long term energy saving impact that balances their
investment costs.

35
3.4.3 Comparison of energy efficiency obligation schemes and voluntary
agreements
Voluntary agreements with the incentive of rebates and energy efficiency obligations that can be open to
certificate trading are both policies with the goal to achieve energy efficiency increase by offering
incentives to implementers. However, the same goal can be reached with different approaches. In
comparison, both advantages and disadvantages of each policy approach need to be appreciated.
Transue and Felder (2010) state that “white certificate approaches that depend on market-clearing prices generate much
larger upfront incentive outlays than rebate programs”, based on a quantitative model they made in order to
compare the two schemes. However, they also state that the administration costs or the rate of
participation can affect these results that dynamically, so additional research is need in order to safely
determine their respective cost-effectiveness.
Voluntary agreements based on rebate payments (in the form of the Swedish PFE, the rebates are the
electricity tax exemptions) are straightforward to implement, because of their predetermined character of
payment. In this way, the administrative costs are not high and the program can be quite cost effective.
The efficiency obligations with the option of trading, on the other hand, have the obligation level set by
the policymakers but the choice of measures is up to the obligated parties. The certificate payment can be
performed once or annually. They can provide profit maximization, by dynamically minimizing the costs
of measure implementation and the demand and supply loop of feedback approximates the energy
efficiency targets effectively (Transue and Felder 2010). Leaving the market rules to adjust the certificate
pricing is more complex to implement, but the results are better in terms of adjusting dynamically the
incentive level and the target of savings.
The goals of energy savings and the eventual energy savings potential for each case examined are the two
factors that ultimately define the costs and benefits of each program (Transue and Felder 2010). Because
energy efficiency obligations with certificate trading are a more dynamic policy tool, the aforementioned
statement is more important, since the policy makers should have a constant and comprehensive
monitoring of the potential for energy efficiency measures’ implementation and especially during the
process of the setting of the savings goals, without overestimating in any case the available opportunities
and motivation for efficiency improvement.
Another difference between PFE and the energy efficiency obligation scheme proposed in this analysis is
the fact that PFE aims only at energy savings resulting from the use of electricity as the energy carrier,
while the obligation scheme considers all energy carriers as eligible for energy savings measures. This is
important in order to include all of the saving potential of the industries, particularly energy intensive ones
as the iron and steel industry and pulp and paper industry, which have other energy carriers as their main
sources of energy. Including all energy carriers in the scheme ensures higher savings of energy and higher
flexibility for the industries to implement various measures. This makes a large difference in a long-term
perspective, since the effects that the PFE would have in the long-term future were not investigated and
there is no proof that the intensity of energy savings would be the same if the “low-hanging” fruits were
reached under the voluntary agreement. Thus, a more intense policy, such as the obligation schemes, is
needed.
PFE has undisputedly improved the industry’s energy management techniques and the industries that
participated in the program are positive towards it. However, PFE has disadvantages that economic policy
instruments do not happen to have. The reason for that is the strong presence of the government
regulation of the system and the asymmetries of information in the process of determining the baseline of
the scheme (Mansikkasalo, et al. 2011). This decreases the program’s possible cost-effectiveness as a
result.
PFE was important because it facilitated the creation of an efficient energy management system for the
energy intensive industries that participated in it, making it easier to implement attractive measures for

36
increasing energy efficiency, but it ultimately cannot replace the role of the pricing mechanisms of the
energy carriers (Mansikkasalo, et al. 2011). Just as in the case of energy efficiency obligations, PFE alone
was not the reason for the implementation of the energy savings measures; the avoided energy costs
resulting from the measures was the main reason for the industries to join this programs. The difference
between PFE and energy efficiency obligations lies in the fact that the obligation schemes are not so
strictly regulated by the government, but their regulation is more left to the rules of the free market,
something which creates opportunities of financial profits for the participating companies.
3.4.4 Alternative policy instruments to replace PFE
Since PFE cannot be continued, all the possible policy alternatives, including energy efficiency obligation
schemes, are being discussed by the Swedish government in order to design a new policy instrument that
fulfills the requirements of the EED (Björkman 2013). The Ministry of Enterprise, Energy and
Communications (in Swedish Näringsdepartementet) have undertaken the issuing of a report proposing
the new policy scheme by the end of 2013 (Björkman 2013). A possible transformation of PFE could be,
according to estimations, to have a much stronger focus on technological improvements and innovations,
such as CCS in the industries (Mansikkasalo, et al. 2011). In addition, the tax exemptions would be
excluded from the program, as the EU considers them illegal, as stated previously.
In the paper “Voluntary agreements with white certificates for energy efficiency improvement as a hybrid
policy instrument” a hybrid between voluntary agreements and white certificates schemes is proposed as
an alternative policy instrument for energy savings. The analysis of the instrument in the paper shows that
this combination of schemes actually delivers results more successfully than the two different instruments
would deliver alone (Oikonomou, et al. 2009). The white certificates scheme functions as a market
mechanism that stimulates investments that reaches beyond the lower cost efficiency measures, namely
the “low-hanging fruits”. The participants would have the incentives of the voluntary agreements with a
form of rebate system as a way of avoiding stricter future policies and the certificate system would
function as a system of delivery of extra credits when the obliged actors (energy suppliers and distributors)
together with the third party companies implement ambitious measures and deliver energy savings higher
than the defined baseline energy savings (Oikonomou, et al. 2009).
This paper proposes the scheme of the voluntary agreement to cover large time periods of 5-10 years, in
order to allow the higher cost strategic measures with longer payback periods to be implemented and the
certificate scheme to cover a period of 3-5 years in order to ensure the necessary liquidity of the market
(Oikonomou, et al. 2009). The result of the combination of voluntary agreements and certificates’ trading
in this scheme is that the less cost-effective measures are included in the BAU scenario covered by the
voluntary agreements in exchange of rebates, while the costlier measures are included in the certificates’
scheme in order to achieve higher cost-effectiveness via the exploitation of the market rules of trading,
overcoming in this way the financial barriers towards energy efficiency improvement measures
(Oikonomou, et al. 2009).
37
4 Background of the Cost-Benefit Analysis
The criteria for performing a CBA in the context of an energy efficiency obligation scheme were
determined by Fraunhofer ISI (2012) and are presented in the following section.
The CBA criteria are the following:
Scope and quality of the energy saving measures
This criterion indicates how suitable an instrument is for meeting the targets defined for energy
saving. The evaluation is done for the individual instrument options and by defining the limits of
the measure to meet the targets.
Costs of the energy saving measures
The cost paths applying to the actors of each one of the instruments proposed is calculated.
Market conformity and competitiveness of the instrument options
This criterion is examined in relation with the obliged actors and energy service providers. From
this evaluation, the conditions needed for the development of certificate trading are identified.
Market for energy services
The effects that apply to the market by the instruments under investigations are examined.
Follow-on effects of the instruments
These effects include distributional and structural effects and trends of energy prices and are
discussed qualitatively
Interactions with existing instruments
Any new instrument introduced, naturally has to encounter the already existing policy landscape,
which affects its way of application and effects.
Political enforceability
The opinions of the different actors should be defined in the discussion about the policy and the
way the actors are affected should be considered. This can be the basis of the enforceability of the
options the instrument can have in the political environment.
Financeability of the instruments
Each instrument has a different approach to funding techniques and the budget independence of
the instrument should be examined.
“In this chapter, the background needed for performing the CBA is built, including all
necessary information from other sources, transformation of data and preliminary
calculations. Most importantly, the energy savings potentials for the industry, the energy
intensive industries and finally the iron and steel industry are presented. The models
that were used for the estimations and analysis are described. This chapter also includes
information on the various sectors’ energy usage and the projections for the prices of
fuels used in the industry in the future.”

38
4.1.1 Calculation of energy savings potential of the industry
The variations in the economic development of various sectors make it difficult to provide reliable
projections of the energy usage of the industry in the future (Energimyndigheten 2013). As a result it is
difficult to create a model that will represent the energy efficiency potential of the Swedish industry in the
future. The projection of the future values of energy consumption and potential energy savings are
essential in calculating the part of the benefits of the energy efficiency obligation scheme in the CBA. The
comparison between the earnings from the energy savings and the costs of implementation will conclude
whether the scheme is cost-effective.
In this study, the projection data from the model created for a report on the “Energy Savings Potentials in
EU Member States, Candidate Countries and EEA Countries” were used. This report was a result of a
project, which had as partners the Fraunhofer-Institute for Systems and Innovation Research (Germany),
ENERDATA (France), Institute of Studies for the Integration of Systems (Italy), Technical University
(Austria), and Wuppertal Institute for Climate, Environment and Energy (Germany) and was carried out
on behalf of the European Commission Directorate-General Energy and Transport. The project report on
the energy savings potential is accompanied by an online database of the energy savings potential divided
by sectors, fuels and technologies used for savings for each country under investigation (Fraunhofer ISI
2009).
The potentials that are calculated for the “Energy Savings Potentials in EU Member States, Candidate
Countries and EEA Countries” report are based on a scenario approach that derives from the drivers
stated in the “European Energy and Transport Trends to 2030 (Update 2005)” (Mantzos and Capros
2006), which use data from the PRIMES model. PRIMES is an energy market equilibrium engineering-
economic model used for long-term study and evaluation of the structural changes in the energy markets
(National Technical University of Athens - EM3 Lab 2013). The drivers were updated in 2009, thus there
are more recent data to take into account in some cases, but not yet throughout the study.
The authors of the “Energy Savings Potentials” report state that during the validation of the drivers, they
discovered differences between some drivers in the EU projections in the “Trends to 2030” report and
the drivers used on a national level from the EU member states. The drivers’ values have significant
impact of the energy efficiency potential’s value. Although, the authors disagree in some cases with the
EU drivers’ projections, they use these values for their own calculation, in order to keep the report
consistent with the EU projections (Fraunhofer ISI 2009).
Figure 4-1: Structure of methodology that was used to calculate the energy efficiency potentials (Fraunhofer ISI
2009)

39
The calculations for the energy efficiency and energy savings potentials of the model are evaluated from
the demand side and based on the bottom-up simulation tool MURE (Mesures d'Utilisation Rationnelle
de l'Énergie), the Odyssee Energy Efficiency Indicators in Europe Database, which is used as a calibration
tool of the model for several factors (see structure in Figure 4-1). MURE is structured in four different
energy demand sectors (residential, transport, industry and services) and describes the impact on them of
various energy efficient technologies. The online database is suitable for external communication of the
model results, since the presentation of them is highly informative, accessible to the user and easy to
manage. The project team stated that adaptations were made to the data provided by the databases in case
where there was not sufficient data provided by the PRIMES model, although the attempts of adaptation
were limited in order to keep a uniform approach to the EU model, as stated before, although the project
team states to have doubts about the values of some indicators (Fraunhofer ISI 2009).
The different scenarios for which the projections were made are the following (Fraunhofer ISI 2009):
Low Policy Intensity Scenario (LPI): continued high barriers to energy efficiency combined with
low policy efforts for overcoming these barriers and high discount rates for investing in energy
efficiency
High Policy Intensity Scenario (HPI): barrier removal for energy efficiency measures’
implementation combined with high policy efforts for overcoming these barriers and low
discount rates for investing in energy efficiency.
Technical Scenario: this scenario includes the diffusion of BAT to the highest possible level,
considering the technical limits of it of course. It represents the energy savings potential that
would be achieved if all the BAT were implemented in all sectors, whatever their costs might be,
making it a very difficult to practically implement scenario. It is expensive, but some options for
energy efficiency technology investments are still realistic and technologically viable. From one
point of view, it represents the highest possible level of energy savings that could be reached, and
thus serves as an indicator of the whole potential that one sector might have.
The discount rates used for assumptions by this database are illustrated in Table 4-1, in comparison with
the respective PRIMES discount rates:
Fraunhofer ISI Study
PRIMES LPI HPI
Industry 12% 30% 8%
Services and
households
12% 8% 6%
Households 17.5% 8% 4%
Private passenger
transport
17.5% 8% 4%
Trucks and inland
navigation
12% 8% 6%
Public transport
energy investment
8% 8% 4%
Table 4-1: Discount rates used in PRIMES and the data base on energy saving potentials (Fraunhofer ISI 2009)

40
The definition of the discount rates is an important assumption made in the context of the modeling that
is related to how fast the investment costs for the efficiency measures are recovered through the
beneficiary energy savings they produce. Thus, the discount rate’s value is an important factor in the final
calculation of the cost-effectiveness of the scheme, since they reflect in the energy savings potential. The
discount rates used in PRIMES are generally higher than those assumed for the calculations in
Fraunhofers ISI’s energy savings potentials report. LPI scenario has higher discount rates for energy
efficiency investments, but the barriers to energy efficiency are continuously high, while HPI has lower
discount rates, but the barriers to energy efficiency are overcome (Fraunhofer ISI 2009). The discount
rates in Fraunhofer ISI’s report are closer as well to the suggested discount rates for removing barriers to
energy efficiency investments cost-effectively on a national level, as suggested by the reports of
Fraunhofer ISI (2012) and European Commission (2011).
Additionally to the discount rates, the other assumptions made in the context of the model’s projection
calculations were (Fraunhofer ISI 2009):
Conservative energy price assumptions,
Stabilized final energy consumption in the LPI scenario, while HPI and Technical Scenario
decrease the final energy demand by 2020 compared to the baseline scenario,
The implementation of measures proposed by the NEEAPs are included in the model, and their
range of effects corresponds to the range of effect that LPI has, and
Early action measures undertaken from 1995 to 2007 under the previous Energy Services EED
are not included in the savings potentials and are seen as part of the baseline scenario.
4.1.2 The PRIMES model
PRIMES is an energy system partial equilibrium model that simulates the energy system as a whole, both
from the demand and supply side. The energy system is represented both from a bottom-up approach and a
top-down approach. The bottom-up approach is based on engineering and explicit technology choices, while
the top-down approach is based on microeconomic decisions made by the agents of the system (Capros
2011). PRIMES can be used for general purposes and produces projections to the future that are used for
scenario building and policy impact analysis (Capros, Mantzos, et al. 2010).
The bottom-up approach, also called inductive reasoning or synthesis, is a system combining a set of sub-
systems. Thus, the original sub-systems that are taken into consideration become finally parts of a greater
system (Trochim 2006).
The top-down approach, on the contrary, also called deductive reasoning or decomposition, analyses trends at
the macro level and consists of the process of breaking down the system into sub-systems in order to
provide better insight to the trends. The overview of the general system is formulated, but at the first level
there is no detail about the sub-systems. Details on the sub-system come on the second level of the
analysis (Trochim 2006).
PRIMES is a market-oriented model, meaning that the market equilibrium prices are defining the energy
balances (Capros 2011). The model is suited for evaluation of policy impacts, such as impacts from tax
imposing, tradable permits or certificates, energy efficiency policies, technology supporting policies and
energy and environmental policies. The data projections start from 2010 and cover the period until 2050
by five years periods.
The two scenarios that PRIMES considers are the 2009 Baseline and the Reference Scenario. The 2009
Baseline scenario assumes that the EU develops in the following years under the current trends and
policies and includes measures taken until April 2009, meaning that includes several energy efficiency
measures and the ETS targets. The Reference scenario has the same basis as the 2009 Baseline, but it also
includes policies adopted between April 2009 and December 2009 and in addition, assumes that the
targets of the Renewables directive 2009/28/EC and the GHG Effort sharing decision 2009/406/EC are
accomplished (Capros, Mantzos, et al. 2010). This scenario includes the energy savings targets set for 2020

41
by the EU member states and is used as a benchmark for policy scenario evaluation on a long-term basis.
These two scenarios are the basis for the development of LPI, HPI and Technical scenarios of the Energy
savings potentials of Fraunhofer (2009).
4.1.3 The future prices of electricity and other fuel types
For the estimation of the future energy sources prices, data from Energimyndigheten was used. More
specifically, the information was provided from the long-term prognosis of the development of the
Swedish energy systems from 2007 until 2030. Energimyndigheten does not publish any form of
prognosis for the energy prices without first basing them of the forecast of fuel prices conducted by the
International Energy Agency (IEA) (Energimyndigheten 2013). Since the Swedish share of the global
market for fossil fuels is relatively small, it is assumed that changes in Swedish demand for these fuels do
not affect prices and in addition it is also assumed that there are no limitations in the amount of fossil
fuels that Swedish companies and consumers can be supplied with (Energimyndigheten 2013). The
Swedish energy system design is affected by the Nordic electricity market’s development as well as the EU
and Swedish energy and environmental policy. The future development of the prices was projected using
two scenarios (Energimyndigheten 2013):
Reference Scenario: the parliament and government decisions remain the same during the period
under study. A sensitivity analysis of various factors is included in the calculations of the model.
Higher Fossil Fuel Prices Scenario: fossil fuel prices under the forecast period are significantly
higher than in the Reference Scenario. The electricity prices are assumed to be higher as well.
The fossil fuel and electricity prices projections for the long-term prognosis were calculated with the help
of MARKAL (Market Allocation) model adjusted for the Nordic market of energy (Energimyndigheten
2013). Therefore, MARKAL-NORDIC includes a description of the stationary energy systems in the four
Nordic countries of Sweden, Norway, Finland and Denmark (see details in
Figure 4-2). This model is scientifically acclaimed, mainly because of the international organization ETSAP
(Energy Technology Systems Analysis Program) that since 1977 manages the model and its further
development, and is a result of one of the "Implementing agreements" within the IEA (Profu i Göteborg
AB 2012).

42
Figure 4-2: MARKAL systems architecture (Profu i Göteborg AB 2012)
The results from the MARKAL-NORDIC model for the fuel prices in Sweden are shown in the two
Tables 4-2 and 4-3 below. Each Table refers to one of the two different prices development scenarios
(Reference and Higher Fossil Fuel Prices) and uses 2007 as the base year. In the Tables the prices’
projection to 2020 are only shown but the calculations reach up to 2030.
The fuels selected for the analysis are the most widely used fuel types by the Swedish industry. These are
fuel oil No.1, fuel oil No.2-5, coal, natural gas, electricity, LPG and wood and wood waste. According to
Eurostat’s Data for the final consumption of the industrial sectors of Sweden for 2011 these types of fuels
represent 10,567 ktoe of the final energy consumption, while the total final energy consumption is 11,115
ktoe (Eurostat 2013). Thus, the fuels selected correspond to around 95% of the total final energy
consumption of Sweden’s industry. District heating is not considered an energy carrier and therefore was
not included in the analysis.
The projection for the fuel prices from Energimyndigheten did not include LPG and there was no
information about Swedish prices for LPG. An alternative method for calculating it was selected. Firstly,
the average price for LPG after refining, transportation and distribution was calculated for all the EU
countries (where information was available) and afterwards the energy tax posed on LPG in Sweden was
added. The value of the energy tax on LPG is retrieved from information provided by the Swedish
Petroleum and Biofuels Institute (Svenska Petroleum och Biodrivmedel Institutet - SPBI). The estimation
of the development of the prices was made based on the trends seen in other liquid fuels and natural gas.
A short description of the fuel types selection is listed below:
Fuel oil No.1: This type of fuel is also called thin fuel oil and is also defined as diesel oil. It is
mainly used for heating purposes by the industries (Energimyndigheten/Statistika Centralbyrån
2009).
Fuel oil No.2-5: Also called thick fuel oil types. Like fuel oil No.1 there used mostly for heating
purposes, and they are divided into two categories according to their sulfur content (larger or
smaller than 1%) (Energimyndigheten/Statistika Centralbyrån 2009).
Coal: The Swedish industry mostly uses coke coal and its consumption is particularly large
especially in energy intensive industries as the iron and steel industry
(Energimyndigheten/Statistika Centralbyrån 2009). The coke oven gas that is used mainly in the
iron and steel industry and other mining industries is produced by the heating coal with no or

43
limited oxygen supply is not included in the analysis, since it is a fuel product derived inside the
industrial plant, and thus is not considered among the eligible energy carriers of the EED. Taking
into account the coke oven gas as an energy carrier might result in double counting effects
(Energimyndigheten/Statistika Centralbyrån 2009). The same applies for blast furnace gas as
energy carrier as well.
Natural gas: Natural gas consists up to a high percentage of methane and is imported from
abroad in the case of Sweden (Energimyndigheten/Statistika Centralbyrån 2009).
Electricity: Electricity represents the largest percentage of usage as an energy carrier in the
industrial sector (Energimyndigheten/Statistika Centralbyrån 2009).
LPG: Liquefied Petroleum Gas (LPG) is called gasol in Swedish and represents the propane and
butane gases that derive from oil or natural gas. LPG is stored in very low temperatures, which
are the reason why it has a liquid form (Energimyndigheten/Statistika Centralbyrån 2009). It is
used in industrial process. In 2012, the iron and steel industry used 50% of the overall LPG
supply in Sweden, while the pulp and paper industry used 18% (Energigas Sverige 2013).
Wood and Wood Waste: Wood and wood waste are considered a renewable energy source, in the
category of biomass and are used as an energy carrier mainly in the pulp and paper industry
(Energimyndigheten/Statistika Centralbyrån 2009).
öre/kWh 2007 2020 Average Price 2007-2020
Fuel Oil No.1 45.6 67.7 56.65
Fuel Oil No.2-5 34.3 45.5 39,9
Coal 17.5 17.2 17.35
Natural Gas 28.9 39.8 34.35
Electricity 32.9 56.1 44.5
LPG 76 104.6 98.5
Wood and Wood Waste 108 163 135.5
Table 4-2: Estimation for the fuel prices development for the Swedish energy market – Reference scenario
(Energimyndigheten 2013); (Energy EU 2013); (SPBI 2013)
öre/kWh 2007 2020 Average Price 2007-2020
Fuel Oil No.1 56.1 84.3 70.2
Fuel Oil No.2-5 40.2 54.1 47.15
Coal 18.1 17.8 17.95
Natural Gas 34.2 48.6 41.4
Electricity 39 59.1 46
LPG 76 107.9 119.7
Wood and Wood Waste 108 163 135.5
Table 4-3: Estimation for the fuel prices development for the Swedish energy market – Higher fossil fuel prices
scenario (Energimyndigheten 2013); (Energy EU 2013); (SPBI 2013)
4.1.4 Energy consumption in the industry
For the calculation of the benefits of the scheme, which are the costs of the avoided energy consumption
deriving from the achievement of the energy savings potentials of the industrial sectors, the shares of
energy usage divided by fuel type are required. In this way, the shares of each fuel in final energy
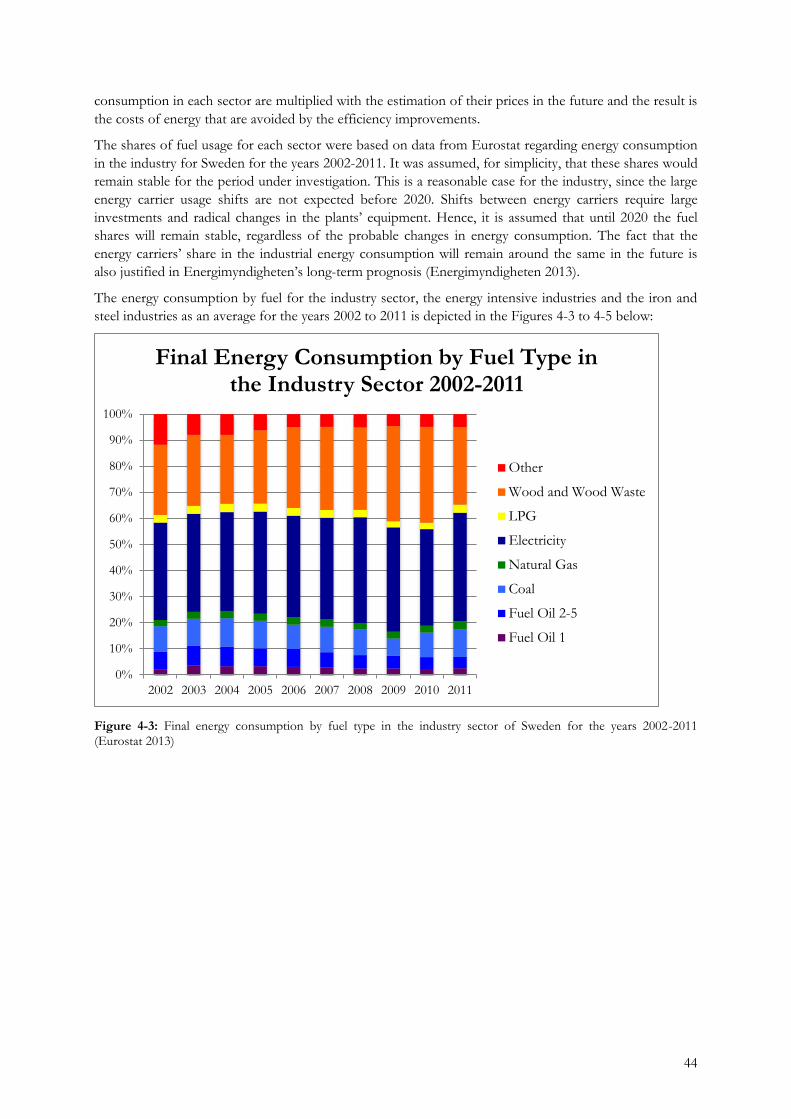
44
consumption in each sector are multiplied with the estimation of their prices in the future and the result is
the costs of energy that are avoided by the efficiency improvements.
The shares of fuel usage for each sector were based on data from Eurostat regarding energy consumption
in the industry for Sweden for the years 2002-2011. It was assumed, for simplicity, that these shares would
remain stable for the period under investigation. This is a reasonable case for the industry, since the large
energy carrier usage shifts are not expected before 2020. Shifts between energy carriers require large
investments and radical changes in the plants’ equipment. Hence, it is assumed that until 2020 the fuel
shares will remain stable, regardless of the probable changes in energy consumption. The fact that the
energy carriers’ share in the industrial energy consumption will remain around the same in the future is
also justified in Energimyndigheten’s long-term prognosis (Energimyndigheten 2013).
The energy consumption by fuel for the industry sector, the energy intensive industries and the iron and
steel industries as an average for the years 2002 to 2011 is depicted in the Figures 4-3 to 4-5 below:
Figure 4-3: Final energy consumption by fuel type in the industry sector of Sweden for the years 2002-2011 (Eurostat 2013)
0%
10%
20%
30%
40%
50%
60%
70%
80%
90%
100%
2002 2003 2004 2005 2006 2007 2008 2009 2010 2011
Final Energy Consumption by Fuel Type in the Industry Sector 2002-2011
Other
Wood and Wood Waste
LPG
Electricity
Natural Gas
Coal
Fuel Oil 2-5
Fuel Oil 1
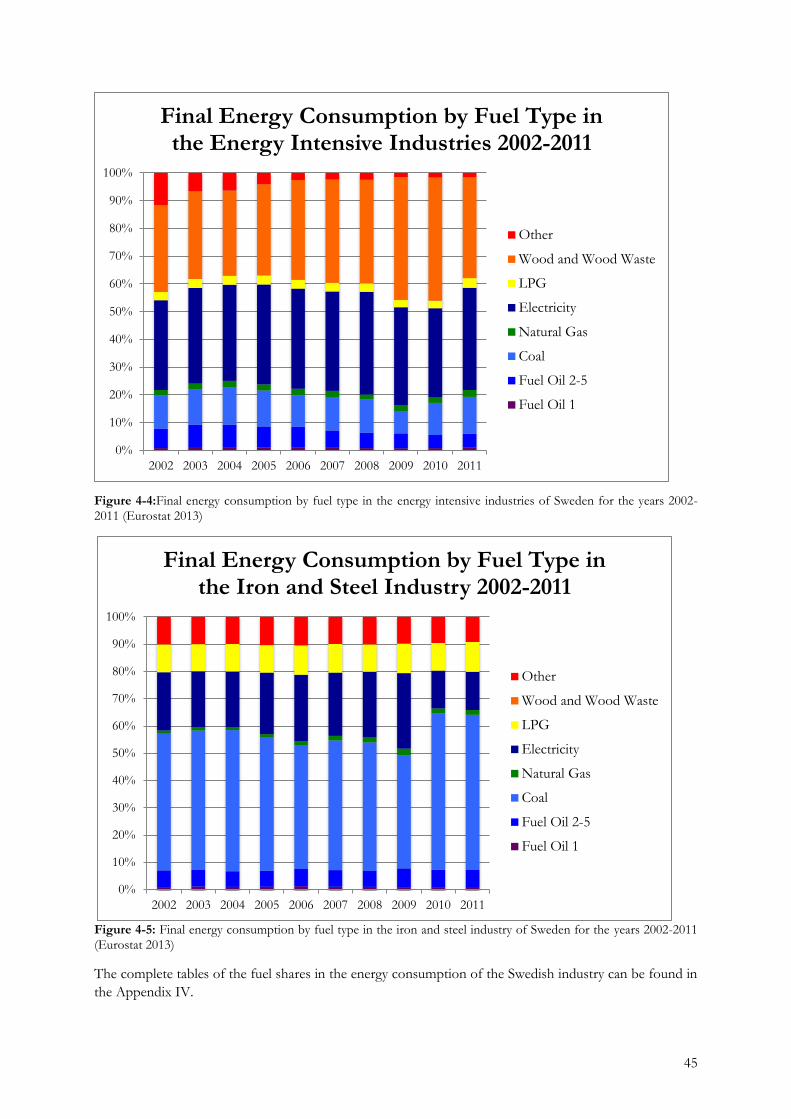
45
Figure 4-4:Final energy consumption by fuel type in the energy intensive industries of Sweden for the years 2002-2011 (Eurostat 2013)
Figure 4-5: Final energy consumption by fuel type in the iron and steel industry of Sweden for the years 2002-2011 (Eurostat 2013)
The complete tables of the fuel shares in the energy consumption of the Swedish industry can be found in
the Appendix IV.
0%
10%
20%
30%
40%
50%
60%
70%
80%
90%
100%
2002 2003 2004 2005 2006 2007 2008 2009 2010 2011
Final Energy Consumption by Fuel Type in the Energy Intensive Industries 2002-2011
Other
Wood and Wood Waste
LPG
Electricity
Natural Gas
Coal
Fuel Oil 2-5
Fuel Oil 1
0%
10%
20%
30%
40%
50%
60%
70%
80%
90%
100%
2002 2003 2004 2005 2006 2007 2008 2009 2010 2011
Final Energy Consumption by Fuel Type in the Iron and Steel Industry 2002-2011
Other
Wood and Wood Waste
LPG
Electricity
Natural Gas
Coal
Fuel Oil 2-5
Fuel Oil 1

46
As shown from the figures, electricity is the most widely used energy carrier in the industry, while wood
and wood waste are dominant in the energy intensive industries. This is explained by the large share of
energy consumption for the pulp and paper industry in the total. Finally, the iron and steel industry uses
mainly coal as its energy carrier, followed by electricity and LPG. Insight to fuel switching and energy
efficiency in the iron and steel industry’s processes is presented in Chapter 2.
4.1.5 Summary of energy saving potentials
In this section, the energy savings potential for different scenario combinations for the case of Sweden are
presented. The potentials are calculated for the industry sector in general, the energy intensive industries
and the iron and steel industry respectively for the three scenarios used in the PRIMES-MURE Database
(LPI, HPI, Technical). In addition, the energy saving potential will be presented in terms of total final
energy savings, electricity savings and fuel savings. As a result, nine different scenarios are presented in the
following tables. The energy savings potentials are presented graphically by each different scenario and by
each sector under investigation.
The complete tables of the energy savings potentials for the three different sectors and three different
scenarios investigated for the years from 2012 to 2020 are listed in the Appendices I to III.
Figure 4-6: Total, electricity and fuels saving potential for the industry in the years 2012-2020 presented for LPI, HPI and Technical scenario
0.00
0.50
1.00
1.50
2.00
2.50
Energy savings in the industry 2012-2020
LPI HPI Technical
Total Electricity Fuels
TWh/yr

47
Figure 4-7: Total, electricity and fuels saving potential for the energy intensive industries in the years 2012-2020 presented for LPI, HPI and Technical scenario
Figure 4-8: Total, electricity and fuels saving potential for the iron and steel industry in the years 2012-2020 presented for LPI, HPI and Technical scenario
The Figure 4-6, Figure 4-7 and Figure 4-8 show that the largest percentage of the annual energy savings
target for Sweden could be covered of the industrial sector alone (2.22 TWh/year on the total energy
consumption when the target is 3 TWh/year). This large potential indicates the significance of the
0
0.5
1
1.5
2
2.5
Energy savings in the energy intensive industries 2012-2020
LPI HPI Technical
0
0.01
0.02
0.03
0.04
0.05
0.06
0.07
0.08
0.09
0.1
Energy savings in the iron and steel industry 2012-2020
LPI HPI Technical
TWh/yr
TWh/yr
Total Electricity Fuels
Total Electricity Fuels

48
participation of an as large as possible part of the Swedish industrial sector in any policy instrument for
energy efficiency improvements that will be introduced.
Additionally, it was observed that the potential of the industry is built up by the potential of the energy
intensive industries (around 82%), which indicates the importance of the participation of the energy
intensive industries in order for the industrial sector to achieve a considerable amount of energy savings in
the future. The iron and steel industry covers 25% of the energy savings potential of the energy intensive
industries.
49
5 Cost-Benefit Analysis of Energy Efficiency Obligation
Schemes
As stated in Section 1.3, a CBA is procedure that is adopted for the evaluation of the desirability of a
project under investigation, by the benefits resulting from it against the costs, and this will be done in the
following sections of this Chapter. Each section is dedicated to a criterion of the CBA as defined in
Chapter 4, which is analyzed either on quantitative or on qualitative terms according to its nature.
The quantitative criteria of the CBA are the following:
Benefits of the energy savings measures
Costs of the energy saving measures
From the comparison of the values of these two criteria the cost-effectiveness of the scheme is calculated in the form of BCRs.
The qualitative criteria are analyzed afterwards and they are the following:
Market conformity and competitiveness of the instrument options
Market for energy services
Follow-on effects of the instruments
Interactions with existing instruments
Political enforceability
Financeability of the instruments
The energy efficiency obligation scheme that was evaluated for the case of Sweden, highlighting the
perspective of the industrial sector has the following characteristics, complying with the EED:
The obliged parties are the energy distributors, as proposed for the case of Sweden from Energimyndigheten for reasons discussed in section 5.3.
The energy savings obligation level is placed at a national level, but complies with the EED, by requiring annual energy savings of 1.5% related to the previous year’s energy sales.
All types of energy carriers except of district heating are included.
Savings from all final energy users are counted.
The transport sector is excluded from the obligation.
The costs are distributed upon final energy customers.
5.1 Benefits of the energy saving measures
In general, the criteria used for the evaluation of the scope and qualities of the energy savings measures
are the following (Fraunhofer ISI 2012):
“In this chapter, the CBA is performed, both in quantitative and qualitative terms.
The benefits of the energy efficiency obligation scheme are calculated, as well as the costs
of it, based on input that was presented in the previous chapter. In addition to the
quantitative parameters, the qualitative parameters are analyzed as well. The criteria
of the CBA are based on criteria used in similar studies and the steps of the process
are explained. In cases where no sufficient data is provided for Sweden, the information
coming from the other EU schemes is used in approximation as a measure of
comparing with the Swedish case.”
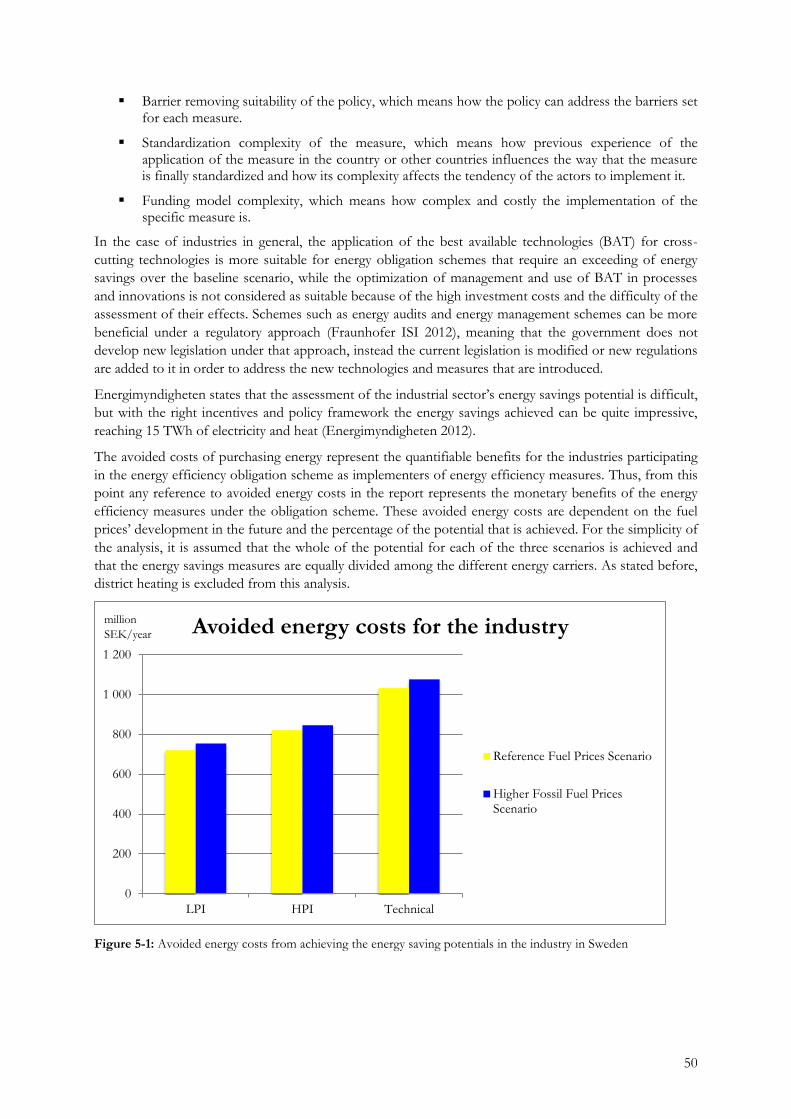
50
Barrier removing suitability of the policy, which means how the policy can address the barriers set for each measure.
Standardization complexity of the measure, which means how previous experience of the application of the measure in the country or other countries influences the way that the measure is finally standardized and how its complexity affects the tendency of the actors to implement it.
Funding model complexity, which means how complex and costly the implementation of the specific measure is.
In the case of industries in general, the application of the best available technologies (BAT) for cross-
cutting technologies is more suitable for energy obligation schemes that require an exceeding of energy
savings over the baseline scenario, while the optimization of management and use of BAT in processes
and innovations is not considered as suitable because of the high investment costs and the difficulty of the
assessment of their effects. Schemes such as energy audits and energy management schemes can be more
beneficial under a regulatory approach (Fraunhofer ISI 2012), meaning that the government does not
develop new legislation under that approach, instead the current legislation is modified or new regulations
are added to it in order to address the new technologies and measures that are introduced.
Energimyndigheten states that the assessment of the industrial sector’s energy savings potential is difficult,
but with the right incentives and policy framework the energy savings achieved can be quite impressive,
reaching 15 TWh of electricity and heat (Energimyndigheten 2012).
The avoided costs of purchasing energy represent the quantifiable benefits for the industries participating
in the energy efficiency obligation scheme as implementers of energy efficiency measures. Thus, from this
point any reference to avoided energy costs in the report represents the monetary benefits of the energy
efficiency measures under the obligation scheme. These avoided energy costs are dependent on the fuel
prices’ development in the future and the percentage of the potential that is achieved. For the simplicity of
the analysis, it is assumed that the whole of the potential for each of the three scenarios is achieved and
that the energy savings measures are equally divided among the different energy carriers. As stated before,
district heating is excluded from this analysis.
Figure 5-1: Avoided energy costs from achieving the energy saving potentials in the industry in Sweden
0
200
400
600
800
1 000
1 200
LPI HPI Technical
Avoided energy costs for the industry
Reference Fuel Prices Scenario
Higher Fossil Fuel PricesScenario
million
SEK/year

51
Figure 5-2: Avoided energy costs from achieving the energy saving potentials in the energy intensive industries
Figure 5-3: Avoided energy costs from achieving the energy saving potentials in the iron and steel industry
The avoided energy costs are higher in the Technical Scenario of energy savings, because the potential of
energy savings is higher as well. Since larger amounts of energy are saved under this scenario, the costs of
energy for the companies to pay are lower. (see Figures 5-1 to 5-3 and Appendix V for details). The
avoided energy costs are naturally higher in the case of the Higher Fossil Fuel Prices Scenario because the
energy prices are higher and, as a result, the higher amount of energy saved results in higher avoided
energy costs.
5.2 Costs of the energy-saving measures
The costs for achieving the energy saving measures include: (i) the administrative costs of implementation
set-up, the operation and monitoring, and the final program implementation; and (ii) the additional
investment costs, which are the costs of investing in a specific energy saving technology related to the
0
200
400
600
800
1 000
1 200
LPI HPI Technical
Avoided energy costs for energy intensive industries
Reference Fuel Prices Scenario
Higher Fossil Fuel PricesScenario
0
5
10
15
20
25
30
35
40
45
LPI HPI Technical
Avoided energy costs in the iron and steel industry
Reference fuel Prices Scenario
Higher Fossil Fuel Prices Scenario
million
SEK/year
million
SEK/year

52
costs of the respective standard technology. The costs are identified by their dependence on the respective
type of energy saving measure and how they are dependent of the type of program implemented.
According to Energimyndigheten, the results of the program implementation in the other EU members,
especially by investigating Denmark’s case, can be considered quite good, but the Swedish industry is
different than Denmark’s, for instance because the Swedish industry is more energy intensive
(Energimyndigheten 2012).
The continuous need for verification of the estimated values of the energy measures and the unique nature
of the energy measures undertaken by each industry means that the administrative costs of an energy
efficiency obligation scheme in the industry can be quite high.
The iron and steel industry is an energy intensive industry and in the case where energy saving measures
need to be taken there are two options. First, there is the option of “peripheral” measures of minor
nature, that although minor, result in important energy savings because of the energy intensity of the
industry. Secondly, there are the energy savings that are achieved in the core production processes, which
achieve vast amounts of energy savings but are also very costly to implement. If the correct policy
framework that incentivizes the implementation of major effect measures and the opportunities of
financial benefits from entering the energy services market are ensured, then the industries will be
motivated to include energy efficiency improvements in their agenda. Thus, the main driving forces of
energy efficiency improvements in the energy intensive industries are the stable regulatory frameworks
provided and the market growth (Energimyndigheten 2012).
The key element of discussion for an energy efficiency obligation system implementation for energy
intensive industries in Sweden is how the system could replace PFE effectively. It has also been proposed
to incorporate other forms of energy savings than electricity in a next version of PFE, based on
experience from other EU countries. By doing so, more companies can participate in the future program,
especially smaller ones, since PFE has not proven to be cost-effective for these companies in its current
form. The energy policies in Sweden are in favor of informational and advisory tactics and using this kind
of tactics for smaller companies can lead to energy efficiency improvement (Stenqvist and Nilsson 2011).
By comparing the repayment periods for investments in the industrial sector under the energy efficiency
obligation system in Denmark and PFE, it can be shown that PFE had a better level of cost-effectiveness,
since its repayment period was 1.5 year compared to 2 years for Denmark’s energy efficiency obligation
scheme (Energimyndigheten 2012). However, a great amount of PFE’s cost-effectiveness is based on tax
rebates and since that is no longer possible, the impact to energy efficiency improvements of any program
implemented in the future will most probably be smaller.
The Impact Assessment of the EED by the European Commission (2011) presents some cost estimations
for an energy efficiency savings obligation scheme. Although the method of calculations that derived these
estimations is not presented, these values can serve as a good starting point for assessing the costs of the
implementation of such a scheme in Sweden.
The report states specifically that the costs of complying with the quota obligation for the companies
would be between 90 - 260SEK/MWh (10 - 30 €/MWh), while the administrative costs would reach a
cost of 0.2 SEK/MWh (0.02€/MWh) (European Commission 2011). Energimyndigheten (2012),
however, finds these values questionable since no method of calculation or reference is indicated in the
report, and thus there are doubts about whether unclear assumptions were made or even whether there
was a problem of miscalculation. Because of these doubts, Energimyndigheten (2012) includes an
alternative estimation of the costs of an energy efficiency obligation, based on the Swedish experience
from the electricity certificate system. In this estimation, the administrative costs of the energy efficiency
obligation scheme could reach 7 million SEK/year, giving an administrative cost of 2.3 SEK/MWh
(Energimyndigheten 2012). This difference in the estimation between the European Commission and
Energimyndigheten makes it difficult to reach a conclusion about the administrative costs for
implementation, and, hence, both scenarios were analyzed within the scope of this study.
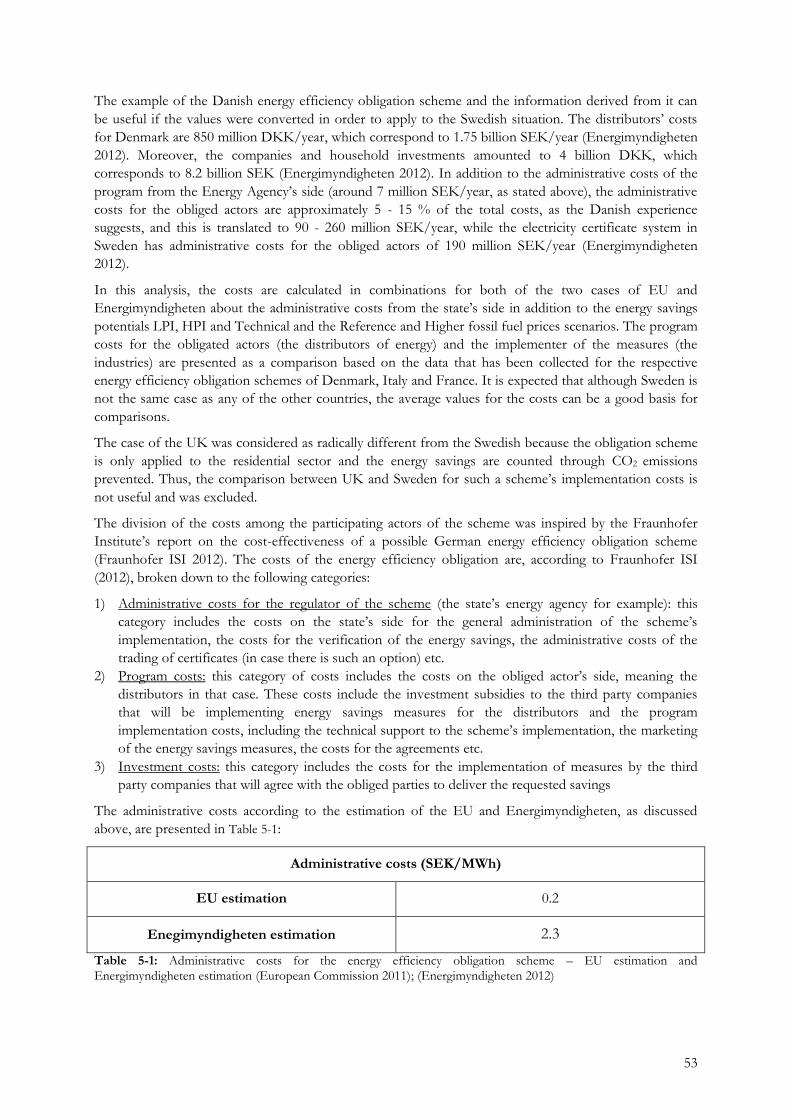
53
The example of the Danish energy efficiency obligation scheme and the information derived from it can
be useful if the values were converted in order to apply to the Swedish situation. The distributors’ costs
for Denmark are 850 million DKK/year, which correspond to 1.75 billion SEK/year (Energimyndigheten
2012). Moreover, the companies and household investments amounted to 4 billion DKK, which
corresponds to 8.2 billion SEK (Energimyndigheten 2012). In addition to the administrative costs of the
program from the Energy Agency’s side (around 7 million SEK/year, as stated above), the administrative
costs for the obliged actors are approximately 5 - 15 % of the total costs, as the Danish experience
suggests, and this is translated to 90 - 260 million SEK/year, while the electricity certificate system in
Sweden has administrative costs for the obliged actors of 190 million SEK/year (Energimyndigheten
2012).
In this analysis, the costs are calculated in combinations for both of the two cases of EU and
Energimyndigheten about the administrative costs from the state’s side in addition to the energy savings
potentials LPI, HPI and Technical and the Reference and Higher fossil fuel prices scenarios. The program
costs for the obligated actors (the distributors of energy) and the implementer of the measures (the
industries) are presented as a comparison based on the data that has been collected for the respective
energy efficiency obligation schemes of Denmark, Italy and France. It is expected that although Sweden is
not the same case as any of the other countries, the average values for the costs can be a good basis for
comparisons.
The case of the UK was considered as radically different from the Swedish because the obligation scheme
is only applied to the residential sector and the energy savings are counted through CO2 emissions
prevented. Thus, the comparison between UK and Sweden for such a scheme’s implementation costs is
not useful and was excluded.
The division of the costs among the participating actors of the scheme was inspired by the Fraunhofer
Institute’s report on the cost-effectiveness of a possible German energy efficiency obligation scheme
(Fraunhofer ISI 2012). The costs of the energy efficiency obligation are, according to Fraunhofer ISI
(2012), broken down to the following categories:
1) Administrative costs for the regulator of the scheme (the state’s energy agency for example): this
category includes the costs on the state’s side for the general administration of the scheme’s
implementation, the costs for the verification of the energy savings, the administrative costs of the
trading of certificates (in case there is such an option) etc.
2) Program costs: this category of costs includes the costs on the obliged actor’s side, meaning the
distributors in that case. These costs include the investment subsidies to the third party companies
that will be implementing energy savings measures for the distributors and the program
implementation costs, including the technical support to the scheme’s implementation, the marketing
of the energy savings measures, the costs for the agreements etc.
3) Investment costs: this category includes the costs for the implementation of measures by the third
party companies that will agree with the obliged parties to deliver the requested savings
The administrative costs according to the estimation of the EU and Energimyndigheten, as discussed
above, are presented in Table 5-1:
Administrative costs (SEK/MWh)
EU estimation 0.2
Enegimyndigheten estimation 2.3
Table 5-1: Administrative costs for the energy efficiency obligation scheme – EU estimation and
Energimyndigheten estimation (European Commission 2011); (Energimyndigheten 2012)

54
The values for the program and investment costs for each EU country’s scheme which is under
consideration, are presented in Table 5-2:
(SEK/MWh) Denmark Italy France
Program costs 90.0 11.0 30.0
Investment costs 390.0 160.0 290.0
Table 5-2: Program and investment costs for the energy efficiency obligation scheme – Data from the Danish, Italian and French obligation schemes (Mikkelsen 2012); (Giraudet, Bodineau and Finon 2011); (Joshi 2012); (Lees 2012)
The costs of implementing the energy savings obligation schemes based on data from the other countries
that implemented energy efficiency obligation schemes are presented in Figures 5-4 to 5-6. Although the
administrative costs according to the EU and Energimyndigheten differ a lot per MWh, they are very
small compared to the program and investments costs, as seen in the tables above. As a result, the
participation of the administrative costs in the total costs is very small for both of the estimations of them
and does not exceed 1% for all investigated scenarios and sectors. Hence, for simplicity reasons only the
case of the Energimyndigheten administrative costs estimation is shown in all the following diagrams. This
estimation was chosen because the data provided with it appear to be more credible and based on the
previous Swedish experience from the electricity certificate system. Analytical data on the costs
calculations can be found in the Appendix VI.
Figure 5-4:Calculation of the costs for the industry’s case of an energy efficiency obligation scheme for Sweden based on the costs of the respective schemes of Denmark, Italy and France/Administrative costs calculated according to Energimyndigheten’s estimation
0
200
400
600
800
1 000
1 200
Denmark comparison Italy comparison France comparison
Comparison of cost scenarios for the industry
LPI
HPI
Technical
million SEK/
year

55
Figure 5-5: Calculation of the costs for the energy intensive industries’ case of an energy efficiency obligation
scheme for Sweden based on the costs of the respective schemes of Denmark, Italy and France/Administrative costs
calculated according to Energimyndigheten’s estimation
Figure 5-6:Calculation of the costs for the iron and steel industry’s case of an energy efficiency obligation scheme
for Sweden based on the costs of the respective schemes of Denmark, Italy and France/Administrative costs
calculated according to Energimyndigheten’s estimation
The Figures 5-4 to 5-6 show that in the case of comparison with the Danish energy efficiency obligation
scheme the costs are the highest, while the Italian scheme’s comparison has significantly lower costs. In
any case, the Technical Scenario of energy savings potential shows the higher costs, because the larger the
potential that is covered by the scenario, the higher the capital that needs to be spent in order to realize it.
The low costs of the Italian energy efficiency obligation scheme could be explained by the payments that
are granted to the distributors for every ton oil equivalent that is saved (100€/toe=857SEK/toe) as a form
0
100
200
300
400
500
600
700
800
900
1000
Denmark Italy France
Comparison of cost scenarios for the energy intensive industries
LPI
HPI
Technical
0
5
10
15
20
25
30
35
40
45
Denmark comparison Italy comparison France comparison
Comparison of cost scenarios for the iron and steel industry
LPI
HPI
Technical
million SEK/
year
million SEK/ year
Denmark comparison Italy comparison France comparison

56
of cost-recovery of the scheme for the distributors. The taxpayers cover these payments and they are
considered as a transfer within the scheme. As a result, they are not counted in the external costs of the
scheme (Giraudet, Bodineau and Finon 2011).
5.3 Cost-effectiveness of the energy efficiency obligation
scheme
The BCR is calculated for each different scenario from the division of the avoided energy costs with the
average costs that are derived from the approximation of the costs that Sweden would spend according to
the costs that the other EU countries spent for the implementation of the energy efficiency obligation
scheme. The avoided energy costs represent the quantifiable part of the benefits of the scheme and thus
the numerator of the BCR, while the costs of the implementation of the scheme are the denominator of
the BCR. Having a BCR that exceeds one represents a cost-effective scheme, as stated in Section 1.3.1,
meaning that the benefits overcome the costs of the scheme.
The Figures 5-7 and 5-8 depict these BCRs by sector and scenarios for the fuel prices’ development.
Figure 5-7:Average BCR by sector derived from the adaptation of data from the schemes of Denmark, Italy and
France for Sweden/Administrative costs calculated according to Energimyndigheten estimation/ Reference scenario
of future development of fuel prices
0.00
0.20
0.40
0.60
0.80
1.00
1.20
1.40
1.60
1.80
2.00
Industry Energy intensive industries Iron and steel industry
Average BCR by sector / Reference scenario for fossil fuel prices
LPI
HPI
Technical

57
Figure 5-8:Average BCR by sector derived from the adaptation of data from the schemes of Denmark, Italy and
France for Sweden/Administrative costs calculated according to Energimyndigheten estimation/Higher fossil fuel
prices scenario
In general, all of the cases show that the scheme is cost-effective for the different sectors, since the BCRs
are all higher than 1. When looking at the BCRs for the Reference scenario of the fuel prices’
development in the future, the BCRs are lower than those for the case of the Higher Fossil Fuel Prices
scenario. This is explained by the fact that the avoided costs of energy are higher for the industries in case
the fuel prices rise higher in the future, something that makes it more cost-effective to implement an
energy efficiency obligation scheme that will result in energy savings.
The energy savings potential scenario with the higher cost-effectiveness is not so clear in all levels of the
industry. In the case of the iron and steel industry the lower energy savings scenario LPI is more cost-
effective. In contrast, the HPI and Technical scenarios have very similar BCRs, which are higher than the
LPI scenario, in the cases of the industrial sector and the energy intensive industries. These differences are
explained by the fact that the potential of energy savings for the iron and steel industry in the years until
2020 is not as high as it should be in order to allow the avoided energy costs to exceed the costs of
implementation of the scheme as much as for the industrial sector as a whole or the energy intensive
industries. Thus, the lower intensity scenario of energy savings LPI is assessed as more cost-effective for
the iron and steel industry only.
The BCRs shown in the previous figures are close with the analysis that states that independent evaluation
of energy efficiency obligation schemes in the EU member countries that have implemented them show
that the overall cost of energy savings distributed between all the involved parties is lower than the energy
market prices by a factor of two to six (Lees 2012).
It is shown from the figures that the scheme is slightly more cost-effective when policies of higher
intensity are implemented. Nevertheless, the direct costs of the program do not exceed the benefits from
the saved energy, as Section 5.1 and 5.2 showed. The amount of information available for the investment
costs that would be indirectly placed upon the end users for the energy efficiency measures
implementation is not sufficient or credible enough in order to incorporate it in this analysis. In any case,
the investments that were made from the industry’ side for the energy efficiency obligation scheme in
Denmark had a payback time of 2-3 years (Danish Energy Association 2011).
0.00
0.20
0.40
0.60
0.80
1.00
1.20
1.40
1.60
1.80
2.00
Industry Energy intensive industries Iron and steel industry
Average BCR by sector / Higher fossil fuel prices scenario
LPI
HPI
Technical

58
Another issue that needs to be addressed is that under all cases of approximation of the costs for Sweden,
the administrative costs remained particularly low and almost negligible related to the investment costs or
the program subsidies. That indicates the cost-effectiveness of the scheme from an administrative point of
view. The low ratio of administrative costs to direct program costs (both for the distributors and the end
users) shows that most of the overall scheme’s costs are related to the implementation of energy efficiency
measures.
5.4 Market conformity and competitiveness
The imposition of an energy efficiency obligation scheme, which is directly applicable to energy
companies or industrial sectors, is the policy approach that is the most market-related. The issuing of
certificates represents the quantity control agent of the scheme and can be characterized as market-
oriented and competition boosting because of the presence of the trading element.
As a result, several points can be made about the basic market effects of an energy efficiency obligation. It
is a fact that such a scheme is more convenient for large companies than smaller ones, because of the
scaling effects that result in smaller costs that need to be expended for large companies due to easier
absorption of administrative and program costs that occur for a large company (Fraunhofer ISI 2012).
This remark is particularly important for the iron and steel industry. The large size of the plants facilitate
financial scaling effects and, thus, the costs of implementation of trading is distributed evenly without
becoming too much of a burden for the company. The companies that are obligated and have a well-
designed distribution structure have better implementation chances than companies that are new in the
market and do not succeed in customer proximity. Again, iron and steel companies have a well-designed
structure and market relations, with good energy saving potential (partially because of the energy intensity
of such industries) and thus they can sustain a trading system. On the other hand, this aforementioned
potential also requires costly investments in long-term delivering measures, so the benefits related to the
costs of these investments should be considered in order to rule out the chance that the potential of
energy efficiency improvements becomes a barrier instead of having a positive effect.
Energimyndigheten states that the energy efficiency obligation should be on the distributor’s level
(Energimyndigheten 2012). The EED leaves the choice of the obliged actor to the Member States, and
some countries have placed it on the distributors, while others on the suppliers of energy. Since for the
markets of district heating, oil, biogas and biomass there is usually no distinct separation between
distributors and suppliers, the electricity and natural gas markets’ condition, where this distinction exists,
play the most important part in the decision for the placement of the obligation.
If the energy efficiency obligation is placed upon the suppliers, meaning the utility companies,
Energimyndigeten observes that the customer loyalty will be increased, resulting in limitation in the
market movements (Energimyndigheten 2012). In addition, there is skepticism regarding issues of
unfairness in the market about the fact that the big utility companies are well equipped when it comes to
the matter of energy services, and thus their position in the market will be extremely consolidated by
beating down the smaller companies’ competition (Fraunhofer ISI 2012). It is natural that the smaller
supplier companies will have a hard time initiating efficiency measures among the end users, because they
have a larger difficulty in achieving the direct customer contact that the larger companies have due to their
better management structure and promotion and advertising funds. Thus, large suppliers can persuade
end-users to implement measures suiting for them easier. The distributors in general show a more neutral
approach to the matter and this justifies Energimyndigheten’s view. The market should under all
circumstances be protected from any attempts of companies to benefit from their close connections to a
monopoly for marketing themselves and beating their competition.
The energy prices on the suppliers side are subject to a liberalized market and in the case where the
obligation is posed on them, the energy prices will be unregulated, leaving an opportunity for
unreasonable rises in order for the energy suppliers to recover the costs of the obligations scheme

59
(Holmberg 2013). Thus, it is better that the obligation is placed on the distributors, whose prices are
regulated.
If the obligation is placed upon the energy suppliers in a liberalized energy market, the cost of complying
with the obligation is a cost of business, as the other environmental requirements are. As a result, this cost
will be passed to the end-user. If the obligation is placed upon the distributor, the costs are passed in the
regulated tariff that is again charged to the end-users (Lees 2012), but since this market is regulated, the
price increases can be at least controlled.
The electricity producers seem to benefit from an energy efficiency obligation system since they can have
low cost and efficient energy production, which they could incorporate in the scheme as eleigible energy
savings. On the contrary, district heating producers are afraid that the possibility of reduction of waste
heat output from the industries will disrupt the balance between supply and demand and since the heating
and cooling markets are highly competitive, they will be unable to increase their prices in order to get
compensation (Fraunhofer ISI 2012). However, large electricity producers are often district heating
suppliers as well, which makes their level of commitment to the obligation schemes difficult to analyze.
The differences between the development of energy markets in Denmark, which has implemented an
energy efficiency obligation scheme, and Sweden, which has not, cannot be easily appreciated because
there is not a common base for comparison between the two countries. As a result, one cannot predict
ultimately the effects in the development of the dynamic characteristics of the Swedish energy market
from the implementation of an obligation scheme and whether such a scheme can in fact promote the
dynamic characteristics of it in order to overcome barriers that cause market failures.
5.5 Effects on the market for energy services
Introducing an energy efficiency obligation scheme with trading can offer strength to the market for
energy efficiency services and allure new actors into the game. A financial program for the energy market
will stimulate the energy services to make bigger efforts. The problem comes when assessing how this
scheme may affect companies that are not in a position to introduce energy saving measures. Another
problem arises when defining what an “energy service” is. In the other countries that have implemented
such schemes, the term is commonly used in a wider way than just services that directly relate to
commercializing energy, meaning that any action that can be related to energy saving actions or
improvements in the systems is included in the scheme.
On a first note, an energy efficiency obligation scheme increases the market for energy services, because it
stimulates the actors participating in it to take saving actions for the companies themselves or for selling
to customers interested in covering their obligation. The simplicity of entrusting the market actors with
the obligations of energy saving, and then letting the market operate on its own for reaching the desired
goals, increases the cost-effectiveness of the scheme. The energy efficiency obligation effects become
more complex for established services that have been present in the market. Other influencing factors
include the market size and how the measures are configured (Fraunhofer ISI 2012). The broad definition
that is used for the energy services market eventually leads to the problem of high concentration of actors,
which is favoring predatory competition with profit for the large energy providers who can distribute a
bigger amount of certificates in the market. However, the use of a narrower definition is not favored
either, since the actors’ number then would be particularly low and the market will not operate effectively,
leading to its deterioration. Thus, the only solution for this double problem could be the introduction of
new services and the further extension of the market (Fraunhofer ISI 2012).
In the case where a narrower definition is used in order to prevent the predatory competition that would
discourage small actors, there are a number of actions that need to be taken in order to avoid the
aforementioned deterioration of the market. First of all, there should be a market barrier removing policy,
by regulatory schemes and risk minimizing for start-ups. The political guidance and the protective
measures, can lead the actors to offer energy services that were not available before, or expand the use of

60
other services. This can help in expanding the market in a healthy way, but also proves that an energy
saving quota scheme cannot function correctly without the support of the right regulatory policies.
5.6 Follow-on effects of the instruments
The follow-on effects of the policy are difficult to quantify. For example, the distribution effects, the
impact on the energy prices of the policy’s implementation or the rebound effect need special modeling in
order to be quantified, and that exceeds the scope of this thesis.
The distribution effects of a policy can be divided into the costs that are directly related to the various
actors and the costs that are passed on within the market’s system. The latter can be a dangerous factor of
the energy efficiency obligation scheme, since the energy producing obligated companies will pass on the
operational and administrational costs of the program’s implementation to the energy-buying customers
(Fraunhofer ISI 2012). This concern has been expressed in Sweden, where many energy intensive
industries operate and are depending on large utility companies for energy supply.
Strong regulations are needed in order to avoid such effects on the market. The problem can expand in
the market and create a lot of inequalities, with Fraunhofer ISI (2012) stating that although the heavy
users, like energy intensive industries, are initially burdened financially with high energy prices, the burden
shifts from them to customer segments with low flexibility of demand, for example private households
and smaller companies, when implementing an energy efficiency obligation scheme. The burden is even
higher for low-income households where the energy costs are uneven to the income, than the higher-
income households. Moreover, these households usually are not benefited from the policy’s energy
savings because they do not have the capital to invest in energy saving measures. The only possibility for
these households to benefit from an energy efficiency obligation scheme is if the scheme provides specific
measures that would be beneficiary for this sector of private households. Under all means, such a
situation, with an energy efficiency obligation scheme that would burden low income instead of heavy
actors of the energy market, would be against any social justice and thus Sweden should ensure that this
would not be the Swedish version of the implementation of the scheme.
Figure 5-14 shows how the effects of the implementation of an energy efficiency obligation scheme are
distributed in all the spectrum of involved actors. The obliged actors are subsidizing financially the
investments of the implementers of measures, but the capital needed for these investments is retrieved
from the costs that they place in turn to their customers, along with the administrative costs of the
program for the obliged actor, as they are explained in Section 5.2. The part of the state is supporting
these administrative costs from its side, but in general the design of the obligation scheme, as the figure
shows, is based on the cost recovery of the costs for the obliged actors from their customers.
Figure 5-14: Distributional effects of important energy efficiency policies (Schlomann and Eichhammer 2009)
For the matter regarding future energy price effects and their dependence of the energy efficiency
obligation scheme, it should be understood that the price increase that the instrument introduces

61
primarily, leads to an increase of the profitability of the energy savings investments that are imposed
afterwards in the context of the scheme and thus the energy savings goals become more achievable
(Fraunhofer ISI 2012). As a result, one can conclude that although the effect of the energy saving
obligation scheme on the energy prices seems negative initially, it can be later discovered that has actually
a positive outcome for the scheme since it increases the willingness of the market actors to reduce their
energy consumption via energy saving measures in order to reduce their costs of energy consumption.
This of course can be particularly proved for the case of energy intensive industries, where energy costs
are large due to the large energy consumption.
Another follow-on effect that is stated by Energimyndigheten (2012) is the conflicts of interest between
an energy efficiency obligation scheme and the renewable energy targets of Sweden. That means that
when companies are placed with an obligation to fulfill they will prefer to provide solutions for the
efficiency of the classic sources energy consumption, instead of promoting renewable energy solutions,
which can possibly affect the country’s emissions of greenhouse gases.
5.7 Interactions with other existing instruments
If a new energy efficiency policy is to be introduced in Sweden, certain actions should be taken in order to
ensure smooth interaction with the already existing policies and instruments. Since energy policies are
usually based on already applied EU regulations, it can be concluded that each instrument has a
complementary role in fulfilling the requirements of the respective EU regulation that each Member State
has to comply with.
The interactions with existing instruments that a new energy saving obligation scheme would trigger are
according to Fraunhofer ISI (2012) the following:
The baseline scenario selection according to which the savings will be accounted in order to establish the certificates trading system and the financing of the instruments is based on the interaction of the expected outcomes of the new energy efficiency obligation and the existing accounting of energy savings without an incentives program.
The selection of the measures to be approved based on the validity of the scope and the targeted sectors of the obligation scheme are based on interactions with financial funds and programs.
In the case of incentive programs, where there is financing from funds, there are interactions because of cases of dual financing from different funds.
The goal of any interaction of a new scheme with existing schemes is to maximize the effect of savings of
energy. Under that target, all synergies are utilized with the already existing instruments and particularly
the taxes of energy and electricity. That is expressed via the selection of the appropriate baseline, which is
fundamental for the success of the program. Additionally, the energy savings measures that are selected
should be approved for achieving the scope of the energy saving obligation.
Energimyndigheten has previously investigated whether an energy efficiency obligation scheme would be
appropriate for interaction with the existing policy instruments in Sweden. Their reviews conclude that
such an obligation system should not be introduced in Sweden, or at least it should be introduced under a
manner based on resemblance with voluntary agreements’ achievements (Energimyndigheten 2012).
The arguments of Energimyndigheten against the introduction of white certificates trading are the
following:
On terms of economic efficiency, a white certificates trading system is not capable of correcting any market failures that cannot be already corrected by existing instruments (Energimyndigheten 2012).
This argument is the basic argument of the parties against the white certificates trading introduction in Sweden, because there is the notion that the already existing policy instruments have managed to deliver quite good results and the energy market in general operates well under

62
the existing regulations. The example of PFE’s success is a strong argument of the opposition to certificates’ trading, but since PFE can no longer continue because of the new regulations of the EU, alternative choices should be considered, and an option such as white certificates cannot be neglected, once that other EU members have successfully implemented it.
Regarding the effects on the energy usage, the fact that the energy savings certifications are related to estimated values in order to calculate the quota results in differences between the real energy usage and the certified from the obligation scheme usage (Energimyndigheten 2012).
The goals for energy savings for the year 2020 are not going to be achieved only in the context of an energy efficiency obligation scheme with certificates trading. The main problem is a lack of cost effectiveness of the system as a stand-alone option, as some reports have shown that it is not able to achieve the targets without any assistance of auxiliary instruments (Energimyndigheten 2012).
However, the reports stating that do not have a clear explanation why this cost effectiveness is not achieved and this has yet to be proved.
Regarding the interaction with existing instruments of the Swedish energy policies, it is sure that a white certificate trading system will affect and consequently be affected by the EU Emissions Trading System and Certificates, however one should not view those two instruments complementary to one another. There is of course the danger of overlapping between the two trading systems, which will result in double counting effects (Energimyndigheten 2012).
The interaction with other policy instruments can be beneficiary for the cost-effectiveness of an energy
efficiency obligation scheme in Sweden. From the example of other EU countries, the incorporation of
other underlying goals except of energy savings increases the cost-effectiveness of the system. These goals
may be for example poverty reduction, production independence, carbon emission reduction, or energy
market improvement (Energimyndigheten 2012). All these interconnected goals increase the economic
efficiency of the system as a whole instead of focusing entirely on energy savings. Under those
circumstances, the connection of the energy efficiency obligation to other instruments and goals increases
the potential of success of white certificates’ trading.
The alignment of an energy efficiency obligation scheme, as proposed in the EED, with other existing
policies of the EU, provides a unified framework of policies that have the shared goal of achieving the
targets of 2020. More specifically, energy efficiency obligation schemes interact with other EU policies
causing the following results (European Commission 2011):
Reduction of greenhouse gas (GHG) emissions up to 2020, contributing cost-effectively to
reaching EU’s stated objective;
Creation of possibilities of committing to GHG emissions’ reduction after 2020;
Promotion of economic recovery and increase of competitiveness of the European industries, in
line with the Europe 2020 strategy;
Increase in security of energy supply, which, as stated in the Energy 2020 Strategy, results in a
lower amount of energy imports into the EU because of the lower energy demands;
Creation of jobs and energy poverty reduction, as EU’s social agenda requires; and
Environmental impact reduction of extraction of energy sources, their treatment and waste and
finally their transmission and distribution.
Regarding the externalities that affect the economic efficiency of a policy, as discussed in Section 1.3.2,
there is a need of surveys on the participating actors and market data in order to determine the free rider,
rebound and spillover effect, which affect the amount of energy savings that are related to the energy
efficiency obligation scheme. The surveys for the evaluation of these effects are costly, and if the target is
to keep the program evaluation costs to around 1-2% of the total program costs, then these evaluation
techniques are applicable only when large energy savings occur (Thomas 2005).
The savings resulting from the free rider effect are not included in the program’s savings, but are
accounted in the baseline. Solutions such as predetermining the amount of energy savings a measure can

63
bring are potentially capable of minimizing the free rider effect. If the program of the energy market
transformation via the introduction of the scheme is not including the appropriate financial incentives for
the participants, then there is a danger that the whole impact of the program is created by a spillover effect
(Thomas 2005).
In all cases, the effect of the above-mentioned externalities should be quantified and subtracted from the
amount of energy savings, in order to have the net impact of the scheme, without the effects that the
interactions with other instruments might cause.
5.8 Political enforceability
The actors involved in the scheme represent different political forces that endorse or not the final
introduction of the program in the energy market. Their views are not always objective and differ from the
pure scientific methods that prove the applicability and success possibilities of the program in the first
place.
When it comes to political interactions for an energy efficiency obligation scheme, the first of the groups
that are interested are the groups that are subjected to the energy saving obligation. In addition, political
actors that ensure the establishment process of the scheme are involved. Furthermore, actors such as
consumer and environmental associations can be involved and try to enforce their opinion regarding the
introduction of the new scheme (Fraunhofer ISI 2012).
From the state’s point of view, there are no plans at the moment of introducing an energy efficiency
obligation scheme in Sweden, but the intention of the government is to meet the requirements of EED
regarding the energy savings targets, although with different policy instruments that are under
development, including taxation and a policy package designed for industries (Holmberg 2013). There is
the opinion that an energy efficiency obligation scheme will not be particularly helpful for the industries
because the energy intensive industries are already aware of the energy savings they can achieve and do
not need additional information or guidance from outside actors as the energy services companies
(Holmberg 2013).
The state is against imposing taxes on a national level for the cost recovery of the scheme, since that
would be unfair for the society and would raise issues of competitiveness for the Swedish industries
abroad as well (Holmberg 2013). In addition, Energimyndigheten indicates the issue of which energy
energy carriers eligible for energy savings in the context of EED should be incorporated in the context of
a Swedish energy efficiency obligation scheme, for example whether wood and wood waste or coal should
be included as energy carriers to the industries, since the energy is produced within the plant’s boundaries
and is not purchased from a third party as the EED requires.
From the industries’ point of view, there is reluctance against the energy efficiency obligation schemes
placed as an obligation of energy savings for them, as that would decrease their competitiveness due to
high costs of production in the already highly competitive global market.
However, there is interest in the implementation of energy savings at the systems level from increased use
of waste heat for district heating, among other services, under a certificate scheme, as Jernkontoret (2012)
states.
5.9 Financeability
The potential of a policy scheme is strongly related to the financing options that are provided to
implement it. If a program proves to have ensured financial support in the future, it is highly likely that it
will be successful in pursuing its goal of cost effectiveness in addition to its energy saving goals.
In the case of energy efficiency obligations the financeability of the scheme is strongly related to the
distribution of the additional costs throughout the system and until the final energy price, which should be
somehow regulated (Fraunhofer ISI 2012). The certificate trading option is the refinancing factor of this

64
scheme, which can cover partially the costs of the program. The remaining financing needed is provided
by private and public funds of the affected actors, and the ratio between the private and public financial
support of the scheme needs to be carefully decided after investigation (Fraunhofer ISI 2012).
It is useful at this point to take into account the experience that the countries that have implemented
energy saving obligation schemes have to offer. Trading is part of the British energy saving obligation
scheme, which are addressed to the domestic sector and refinanced from distributing the additional costs
to the wholesale end user energy price (Lees 2007). In France, trading is permitted too, but the costs for
the implementation of the energy saving measures are not distributed to the end user because of the fixed
gas and electricity prices. Thus, the investments are refinanced through the taxes imposed (Lees 2007).
The UK has acknowledged that the distributional model for financing of the obligation scheme cannot
quite cover the costs of the program investments for efficiency improvements in the domestic building
sector, thus from October 2012, a new regulation was introduced for the financing of building
renovations called the Green Deal. With the Green Deal, instead of imposing the costs of the investments
in the final electricity price and the end customers, a new credit model will be introduced (U.K.
Government Digital Service 2013; Dowson, et al. 2012).
For the case of Italy, a part of the program costs is covered by taxpayers and another part is covered by
the free market of certificate trading. In Denmark, the quota obligation is placed on the distributors but
the costs are distributed to the end customers, but there is a specified limit up to where these costs can
reach (Lees 2007).
For the financeability of an energy efficiency obligation scheme funding of measures without budget limits
can be allowed, although the common follow up effect of higher energy prices for compensating for the
program’s costs leads to discontent of the groups that are affected (Fraunhofer ISI 2012). This is the
reason that usually such schemes have low levels of acceptance from the affected actors, such as energy
customers, industry etc.
With the exception of Italy, trading of surplus certificates of energy savings is de facto not taking place.
This leads to a lack of funds for the scheme that is compensated via tax paying or auxiliary financing
mechanisms (for example the Green Deal in the UK). Because of the limited amount of private funds
investing in the scheme’s implementation, based on the limited amount of certificate trading that is
eventually allowed in these countries, it is evident that an energy efficiency obligation scheme cannot
achieve financeability without supplementary instruments that ensure a steady funding of the program
(Fraunhofer ISI 2012).

65
6 Discussion
Based on the results of the study, the participation of the industries of Sweden in a national energy
efficiency obligation scheme seems to be cost effective, according to the results of the CBA, the
experience from the other EU countries with obligation schemes and the suggestions regarding the design
of the scheme that would ensure that sufficient incentives have been offered to the industries.
The quantitative analysis’ results were expressed with BCR from the benefits calculated divided by the
average costs of implementation spent. These BCRs were calculated for the industry as a whole, the
energy intensive industries and the iron and steel industry. The results show that the scheme’s benefits
exceed the costs of implementation in all cases, with the ratio ranging from around 1.41 to 1.93. The BCR
was influenced firstly from the energy savings achieved according to each of the different potentials
investigated and the future energy prices scenarios. As a result, the scheme is more cost-effective when
more intensive policies are implemented and for the scenario where the fossil fuel prices are higher.
The accuracy of the aforementioned results could be increased if the energy savings potentials and the
costs were further analyzed in the future. The model that gave the potentials (PRIMES) is not up to date
with the new developments regarding energy efficiency in the EU that are resulting from the
implementation of the EED.
The final conclusions about the cost-effectiveness of the system should be based on further research of
the matter and the establishment of an accurate model for estimating the exact effect of the policy on the
Swedish energy market and its participating actors. Thus, a better model for the energy savings in the
Swedish industrial sector with comprehensive information about the division of the savings among the
different energy carriers and sectors and a complete calculation of the costs that the investments in energy
efficiency would have is needed and could be an extension of this study that will improve the results’
credibility.
Regarding the qualitative part of the CBA, it was attempted for this study to offer an as wide as possible
view of the position of the different actors related to the energy efficiency obligation scheme, from a
societal, political and business perspective. The review of the opinions regarding the energy efficiency
obligation schemes shows that there is reluctance in accepting a possible implementation of the system
and the main factors growing the skepticism is to whom the obligation for energy savings will be placed
and the capital that will be required to be spent for fulfilling the obligation.
Regarding the matter of who would be the obliged actor in the scheme, this study proposes that it should
be the distributors of energy, agreeing with the view of Energimyndigheten. In this way, it is ensured that
there will be no unfair competition and unreasonable rises in energy prices, since the prices of energy
distribution are administratively regulated, on contrast with the energy prices of supply which are regulated
in a liberalized energy market.
Regarding the costs of investments, which happen to be the biggest concern of the industry, the
calculations about the costs and BCRs in Chapter 5 and the information provided in Section 3.4.2 show
that the investment costs can be covered effectively, if the scheme is designed correctly. As the experience
from the other EU countries has shown, the investment costs in efficiency measures from the industries
were able to have low payback times, for example 2-3 years for the case of Denmark. The fact that the
“This chapter includes the discussion resulting from the investigation of the costs and
benefits that an energy efficiency obligation scheme would have in Sweden. Based on the
previous chapters, a clear overview of how energy efficiency policies work is by now
formulated and their cost-effectiveness and other related issues can be discussed on the
basis of the plethora of data and information that was accumulated.

66
obliged actors of the scheme will most probably not be able to reach their targets on their own, creates a
market gap that the large energy intensive industries should exploit.
As a result, the industries can act as third party companies that will form official agreements with the
obliged actors for the delivery of a predefined amount of energy savings in exchange for subsidies to their
investment on energy efficiency measures. Thus, the industries can implement energy savings measures
that will decrease the costs of energy consumption for them and in addition get financial support for these
investments from the obliged parties of the energy efficiency obligation. The benefits of participating in
the scheme are increased on top of that when one takes into account the rise of the energy prices that is
expected in the future, as the projections included in this report show, which would increase even more
the costs of energy for the companies. From this point of view, the participation of the industries in the
energy efficiency obligation as third party actors delivering requested energy savings is a no loss situation.
Moreover, the initial costs of the implementation of the energy savings measures will decrease over time
because of the economies of scale effect that occurs as the penetration of the efficiency measure rises in
the market. The increase of the efficiency that the companies will be able to deliver the savings will
additionally decrease the costs of energy savings in the future and the effect of the investments in the long
term will be positive for the companies.
Energy efficiency obligation schemes, when well designed, can work both for “low hanging fruit”
measures and more difficult and costly to implement long term energy savings delivering measures (Lees
2012). This is explained based on the decrease of energy efficiency measures’ cost over time. As these
costs decrease due to the economies of scale and the energy efficiency activity increases, the disappearance
of the cheaper by then low hanging fruit measures is balanced from the effects of the longer term
efficiency measures and the energy demand decreases as well.
The correct design of the policy scheme is an important parameter in order to achieve the healthy
regulation of the energy services market. At this point, the experience that PFE has offered to the state
and the participating energy intensive industries is valuable. PFE will serve as the basis of knowledge for
implementing successfully an energy efficiency savings oriented policy in the future. In the context of
PFE, all the participating companies developed advanced energy management systems and achieved
energy savings. Its positive results are a sign that the industries can deliver energy savings successfully
when they are motivated correctly. PFE does not accept new applicants and will not continue after 2017,
due to EU regulations, and nevertheless it was aimed only at electricity savings, whereas there is a need in
the context of the EED to incorporate all eligible energy carriers in the energy efficiency policy in order to
reach the desired amount of energy savings.
The energy efficiency obligation schemes are not so strictly government regulated as a voluntary
agreement such as PFE, and thus more financial profit opportunities are created in the energy market for
the participating in the obligation companies. An energy efficiency obligation scheme that would allow
trading of certificates would result in further stimulation of the energy market for investing in energy
savings measures that reach above the “low-hanging fruits”.

67
7 Conclusions
The research question was whether the implementation of an energy efficiency obligation scheme for
Sweden would be cost-effective for the Swedish industries. The estimation of the cost-effectiveness based
on the comparison with the energy efficiency obligation schemes of other EU countries in the context of
the CBA included in this study shows that the scheme would be cost effective. However, there is no
sufficient data provided regarding the costs of the investments that would be made into energy savings
measures in order to reach the set energy savings targets. Basing the costs calculations on the costs
information from other EU Member States offers an insight on how these costs could be formed in the
case of Sweden, but they cannot be taken as a finalized and complete cost calculation of the energy
efficiency obligation scheme’s financial effects.
In addition, the use of different models for the estimation of energy savings potentials and future energy
prices has a factor of uncertainty, since no model or estimation can substitute the real cases of
development of these values in the future. Any prediction of them is useful, but the adoption of a unified
and up to date modeling approach of the system as a whole would lead to the highest possible level of
trusting that the estimations made correspond to the actual values in the future.
As a result, this study does not offer a final conclusion on the cost-effectiveness of the scheme; it rather
serves as a means of support of the final conclusion regarding the cost-effectiveness and design
parameters of energy efficiency obligation schemes for the Swedish industries. The final decision about
the cost-effectiveness is not up to this study to reach, but it can provide useful information and inputs that
would assist the decision process itself.
The results of the CBA show that the cost effectiveness of the energy efficiency obligation scheme rises
when the intensity of the policy measures is higher. This highlights the importance of having a stricter
direction of energy policies in the future that will ensure the reaching of the ambitious EU energy and
climate mitigation targets. Voluntary agreements like PFE served well in motivating the industrial sector
towards energy savings but seem to lack the ability to address measures that would exceed the baseline
equally good as energy efficiency obligations would.
It should be noted that the energy efficiency obligation scheme that is described in this study is not
binding for the industries, since they are not among the obliged actors of the scheme, and thus they are
not officially required to deliver energy savings to fulfill any obligation. However, on a societal perspective
of the matter, the industries should participate as third party companies and support the attempts of
achieving higher energy efficiency, as their contribution in energy savings is vital for Sweden to achieve its
goals for 2020 and secure low levels of energy consumption on a national level in the future.
“The discussion related to the various policies, their cost-effectiveness and the
possibilities that an energy efficiency obligation scheme would create for the Swedish
industry in the future is rich, and has many things that need to be investigated and
analyzed, exceeding the limits of this thesis. However, the basic points that need to be
addressed are discussed in this final chapter.”
68
Bibliography
Agyenim, F., N. Hewitt, P. Eames, and M. Smyth. "A review of materials, heat transfer and phase change
problem formulation for latent heat thermal energy storage systems." Renewable and Sustainable Energy
Reviews 2, no. 14 (2010): 615-628.
Asp, B., M. Wiklund, and D. Dahl. Use of the steel industry’s residual energies for power generation - an efficient
resource utilization for electricity generation (Användning av stålindustrins restenergier för elproduktion – Ett effektivt
resursutnyttjande för elproduktion. Report no JK98400, Jernkontoret, Jernkontorets forskning D826, 2008.
Baudry, P., D. Osso, F. Suerkemper, and S. Thomas. Cost-Benetfit Analysis of Energy Efficiency Programmes in
Liberalised Electricity and Gas Markets. Poster, European Center and Laboratories for Efficiency Reasearch
(ecleer), Wuppertal: ecleer, 2011.
Bertoldi, P., S. Rezessy, E. Lees, P. Baudry, A. Jeandel, and N. Labanca. "Energy supplier obligations and
white certificate schemes: Comparative analysis of experiences in the European Union." Energy Policy, no.
38 (2010): 1455-1469.
Björkman, T. "On the new efficiency improvement policy instruments from the Swedish government."
Personal Communication. March 20, 2013.
Bode, H.W., and W.K. Holstein. "Systems Engineering." Encyclopædia Britannica Online Academic Editio.
Encyclopædia Britannica Inc.,. April 29, 2013.
Capozza, Antonio. "IEA DSM TASK XIV: White Certificates Trading." IEA-DSM Workshop on Energy
Efficiency Certificate Trading. Milan: IEA , 2007. 1-2.
Capros, P. "The PRIMES Energy System Model." The PRIMESEnergy System Model - E3MLab. 2011.
http://www.e3mlab.ntua.gr/manuals/PRIMsd.pdf (accessed April 22, 2013).
Capros, P., L. Mantzos, N. Tasios, A. De Vita, and Kouvaritakis N. EU energy trends to 2030-Update 2009.
Directorate-General for Energy in collaboration with Climate Action DG and Mobility and Transport DG
, Luxemburg: Directorate-General for Energy in collaboration with Climate Action DG and Mobility and
Transport DG , 2010.
Chai, K.H, and C. Yeo. "Overcoming energy efficiency barriers through systems approach—A conceptual
framework." Energy Policy 46, no. 2012 (2012): 460-472.
Chertow, MR. "Industrial Symbiosis:Literature and Taxonomy." Annual Review of Energy and the Environment,
no. 25 (2000): 313-337.
Clinch, J.P., and J.D. Healy. "Cost-benefit analysis of domestic energy effciency." Energy Policy , no. 29
(2001): 133-124.
Danish Energy Association. " Why obligation schemes are the solution for European Union Member
States during the financial crisis - Experiences from Denmark where energy efficiency obligations have
been used as an innovative way to mobilise funds for investments in energy efficiency outside state
budgets." Online Report , Copenhagen, 2011.
Dowson, M., A. Pooleb, D. Harrison, and G. Susman. "Domestic UK retrofit challenge: Barriers,
incentives and current performance leading into the Green Deal." Energy Policy 50, no. November 2012
(2012): 294-305.
Energigas Sverige. Statistik. April 12, 2013. http://www.energigas.se/Energigaser/Gasol/Statistik
(accessed April 22, 2013).
Energimyndigheten. "Energiläget i siffror 2012." Statistic Report, 2012.
Energimyndigheten. Energimyndighetens handbok om rutiner för inköp och projektering inom PFE. Report,
Eskilstuna: Swedish Energy Agency, 2006.

69
Energimyndigheten. Energy Efficiency Policies and Measures in Sweden,ODYSSEE-MURE 2010 , Monitoring of
EU and national energy efficiency targets. Report, Eskilstuna: Energimyndigheten, 2012.
Energimyndigheten. Handbok för kartläggning och analys av energianvändning—tips och råd från Energimyndigheten.
Report, Eskilstuna: Swedish Energy Agency, 2004.
Energimyndigheten. Konsekvenser av kvotplikt för energieffektivisering. ER 2012:07, Eskilstuna: Statens
Energimyndigheten, 2012.
Energimyndigheten. Långsiktsprognos 2012 . ER 2013:03 , Eskilstuna: Energimyndigheten, 2013.
Energimyndigheten. List of reported measures from the second year report. Report, Eskilstuna: Swedish Energy
Agency, 2007.
Energimyndigheten. Programmet för energieffektivisering: Erfarenheter och resultat efter fem år med PFE. Report ET
2011:01, Eskilstuna: Swedish Energy Agency, 2011.
Energimyndigheten. Resultat från programmet: Slutredovisning per företag. April 15, 2011. http://www.energi
myndigheten.se/sv/Foretag/Energieffektivisering-i-foretag/ PFE/Om-PFE/Resultat-fran-programmet/
(accessed January 10, 2013).
Energimyndigheten. Skattebefrielse på el—för effektiv energianvändning i industrin. Report, Eskilstuna: Swedish
Energy Agency, 2005.
Energimyndigheten. Vita certifikat : Erfarenheter från några europeiska länder och en behovsanalys för Sverige utifrån
de. ER 2010:34, Eskilstuna: Energimyndigheten, 2010.
Energimyndigheten/Statistika Centralbyrån. Årliga energibalanser 2007 – 2008 . Eskilstuna:
Energimyndigheten, 2009.
Energy EU. LPG and Heating oil prices. May 3, 2013. http://www.energy.eu/ (accessed May 3, 2013).
Environmental Protection Agency. Understanding Cost-Effectiveness of Energy Efficiency Programs: Best Practices,
Technical Methods, and Emerging Issues for Policy-Makers. Report, National Action Plan for Energy Efficiency,
Washington D.C.: Environmental Protection Agency, 2008.
European Commision. "Commission recommendation of 6 May 2003 concerning the definition of micro,
small and medium-sized enterprises." Official Journal of the European Union, May 2003.
European Commission . "Comission decides in the Swedish energy tax system 2002 to 2005." Europa Press
Releases Rapid. June 30, 2004. http://europa.eu/rapid/press-release_IP-04-833_en.htm (accessed January
30, 2013).
European Commission. Annexes to the impact assessment accompanying the document directive of the european
parliament and of the council on energy efficiency and amending and subsequently repealing Directives 2004/8/EC and
2006/32/EC. SEC(2011) 779 final, Brussels: European Commission, 2011.
European Commission. Energy Efficiency Directive. October 2012.
http://ec.europa.eu/energy/efficiency/eed/eed_en.htm (accessed April 29, 2013).
European Commission. Guide to Cost-Benefit Analysis of Major Projects (In the context of EC Regional Policy).
Report, Brussels: European Commission, 1997.
European Commission. Impact Assessment Accompanying the document Directive of the European Parliament and of
the Council on energy efficiency and amending and subsequently repealing Directives 2004/8/EC and 2006/32/EC.
SEC(2011) 779 final, Brussels: European Commission, 2011.
European Council. Council Directive 2003/96/EC of 27 October 2003 restructuring the Community framework for
the taxation of energy products and electricity,. Council Directive, Brussels: European Council , 2003.
European Parliament. "Directive 2012/27/EU of the European Parliament and of the Council of 25
October 2012 on energy efficiency." Official Journal of the European Union 55 (November 2012): 3-58.

70
Eurostat. Statistics Database/Energy statistics - supply, transformation, consumption. March 20, 2013.
http://epp.eurostat.ec.europa.eu/portal/page/portal/statistics/search_database (accessed April 05, 2013).
Fraunhofer ISI. Cost/benefit analysis of the introduction of market-oriented instruments for realizing final energy savings
in Germany. Executive Summary, Fraunhofer Institute for Systems and Innovation Research (Fraunhofer
ISI) , Ecofys Germany GmbH , Öko-Institut e.V. , Karlsruhe: Fraunhofer ISI, 2012.
Fraunhofer ISI. Data Base on Energy Saving Potentials. 03 15, 2009. http://www.eepotential.eu/esd.php
(accessed 04 02, 2013).
Fraunhofer ISI, Enerdata, Technical University of Vienna,Wuppertal Institute for Climate, Environment
and Energy WI. Study on the Energy Savings Potentials in EU Member States, Candidate Countries and EEA
Countries. Final Report, Karlsruhe/Grenoble/Rome/Vienna/Wuppertal2009: European Commission
Directorate-General Energy and Transport, 2009.
Fujihara, MA, LC Goulart, and G. Moura. "Cultivated Biomass for Pig Iron Industry in Brazil." Edited by
S. Silveira. Bioenergy - Realizing the potential (Elsevier Ltd. ), 2005: 189-199.
Giraudet, L.G., L. Bodineau, and D. Finon. The costs and benefits of white certificate schemes. Report No.29,
Paris: C.I.R.E.D., 2011.
Haas, R. "Environmental Terminology and Discovery Service (ETDS)." European Environment Agency.
2001.
http://glossary.eea.europa.eu/terminology/concept_html?term=green%20certificate%20(electricity)
(accessed April 29, 2013).
Hanley, N., P.J. McGregor, J.K. Swales, and K. Turner. "Do increases in energy efficiency improve
environmental quality and sustainability?" Ecological Economics 68 (2009): 692-709.
Holmberg, R. "Clarifications related to Energimyndigheten "Konsekvenser av kvotplikt för
energieffektivisering" report." Personal Communication. April 19, 2013.
Hundloe, T., G.T. McDonald, J. Ware, and L. Wilks. "Cost-Benefit Analysis and Environmental Impact
Assessment." Environmental Impact Assessment, no. 10 (1990): 55-68.
IEA. Energy Policies of IEA Countries: Sweden - 2013 Review. Excerpt from: The framework: energy policy and
climate change, Paris: OECD/IEA, 2013.
IEA. "Nordic Energy Technology Perspectives." Report, Paris, 2013.
Institute for Industrial Productivity . "Sweden Programme for Improving Energy Efficiency in Energy
Intensive Industries (PFE)." Factsheet, Washington D.C., 2012.
Intergovernmental Panel on Climate Change (IPCC). Climate Change 2007: Mitigation. Contribution of Working
Group III to the Fourth Assessment Report of the Intergovernmental Panel on Climate Change. Assessment Report,
Cambridge: Cambridge University Press, 2007.
Jaffe, A.B., and R.N Stavins. "The energy-efficiency gap. What does it mean?" Energy Policy 22, no. 10
(1994): 804-810.
Jernkontoret. Energianvändning. 2013.
http://www.jernkontoret.se/stalindustrin/statistik/energianvandning/index.php (accessed April 30,
2013).
Jernkontoret. Energy, Energy supply. 06 06, 2012.
http://www.jernkontoret.se/english/energy_and_environment/Energy_energy_supply/index.php
(accessed 12 06, 2012).
Jernkontoret. Reduced use of fossil energy in the steel industry through high temperature gasification. Report,
Jernkontoret, 2009.

71
Jeroen De Joode, J., D. Kingma, M. Lijesen, M. Mulder, and V. Shestalova. Energy Policies and Risks on
Energy Markets A cost-benefit analysis. Cost Benefit Analysis, The Hague: Netherlands Bureau for Economic
Policy Analysis, 2004.
Johansson, M., and M. Söderström. "Options for the Swedish steel industry e Energy efficiency measures
and fuel conversion." Energy 36, no. 1 (October 2010): 191-198.
Joshi, B. Best Practices in Designing and Implementing Energy Efficiency Obligation Schemes. Research Report Task
XXII of the International Energy Agency Demand Side Management Programme, Stockholm: IEA DSM-
RAP (Regulatory Assistance Project), 2012.
Lees, E. Energy efficiency obligations – the EU experience (eceee briefing for DG Energy on EU energy efficiency
obligations on energy companies and their importance in meeting climate change and energy security challenges). Stockholm:
European Council for an Energy Efficient Economy (eceee), 2012.
Lees, E. European and South American Experience of White Certificates . Case Study on Energy Efficiency
Measures and Policies , WEC-ADEME , 2010.
Lees, E. European Experience of White Certificates. Report, WEC ADEME project on energy efficiency
policies, World Energy Council- French Environment and Energy Management Agency, 2007.
Lundgren, J., B. Asp, M. Larsson, and C. Grip. "Methanol production at an integrated steel mill ." 18th
International congress of Chemical and Process Engineering. Prague, 2008.
Mansikkasalo, A., G. Michanek, and P. Söderholm. Industrins energieffektivisering - styrmedlens effekter och
interaktion. Rapport 6460, Stockholm: Naturvårdsverket, 2011.
Mantzos, L., and P. Capros. European Energy and Transport Trends to 2030-Update 2005. Directorate-General
for Energy and Transport, Brussels: European Communities, 2006.
Martin, V., and F. Setterwall. "Mapping of Waste Heat potential for Heat Transportation from SSAB
Oxelösund Steel Works. Ecostorage Sweden AB." 2008.
McKinsey and Company. The McKinsey Quarterly. New York: McKinsey and Company, 2006.
MIDREX Technologies. Midrex - Overview. 2013.
http://www.midrex.com/handler.cfm/cat_id/186/section/technology (accessed April 29, 2013).
Mikkelsen, K.M. Why efficiency obligation schemes are the solution for European member states during the financial crisis.
Report, Copenhagen: Danish Energy Association, 2012.
Morfeldt, J., and S. Silveira. "Capturing Energy Efficiency in European Iron and Steel Production - a
Comparison of ODEX and MPI/DEA Approaches." 2013.
National Technical University of Athens - EM3 Lab. The PRIMES model. April 16, 2013.
http://www.e3mlab.ntua.gr/e3mlab/index.php?option=com_content&view=category&id=35&Itemid=8
0&lang=en (accessed April 16, 2013).
NERA Economic Consulting. Interactions of the EU ETS with Green and White Certificate Schemes. Summary
Report for Policy Makers, London: European Commission Directorate-General Environment, 2005.
Nilsson, J. Heat recovery from cooling beds in the iron and steel industry: Heat from the cooling beds - 100 times better
than solar (Värmeåtervinning från svalbäddar inom järn- och stålindustrin: Värme från svalbäddar – 100 gånger bättre än
solvärme) . Report no. 809, Jernokontoret, 2003.
Nilsson, L.J., and C. Stenqvist. "Energy efficiency in energy-intensive industries—an evaluation of the
Swedish voluntary agreement PFE." Energy Efficiency, no. 5 (July 2011): 225-241.
Nord Pool Spot AS. Elspot prices. 2011. http://www.nordpoolspot.com/ (accessed April 23, 2013).
Oda, J., K. Akimoto, T. Tomoda, M. Nagashima, K. Wadaa, and F. Sano. "International comparisons of
energy efficiency in power, steel, and cement industries." Energy Policy, 01 2012: 118-129.

72
Oikonomou, V., M.K. Patel, W. Van der Gaast, and M. Rietbergen. "Voluntary agreements with white
certificates for energy efficiency improvement as a hybrid policy instrument." Energy Policy 2009, no. 37
(2009): 1970-1982.
Pavan, Marcella. "Tradable white certificates: experiences and perspectives." Energy Efficiency 2012, no. 5
(January 2011): 83-85.
Price, L. "Voluntary agreements for energy efficiency or GHG emissions reduction in industry: an
assessment of programs around the world." ACEEE Summer Study on Energy Efficiency in Industry.
Washington D.C.: American Council for an Energy- Efficient Economy, 2005.
Profu i Göteborg AB. Beräkningar med MARKAL-NORDIC inför Långsiktsprognos 2012. Mölndal,:
Energimyndigheten, 2012.
Reichl, J., and A. Kollmann. "Strategic homogenisation of energy efficiency measures: an approach to
improve the efficiency and reduce the costs of the quantification of energy savings." Energy Policy 3, no. 3
(2010): 189-201.
Scheuer, S. Energy demand in the EU:Comparison of forecasts and ambitions . A contributing research paper to
Energy Savings 2020: how to triple the impact of energy saving policies in Europe, European Climate
Foundation, 2011.
Schlomann, B., and W. Eichhammer. Energy Efficiency Policies in the EU - Lessons from the Odysee-MURE project
. Report, ADEME, 2009.
Siitonen, S., M. Tuomaala, and P. Ahtila. "Variables affecting energy efficiency and CO2 emissions in the
steel industry ." Energy Policy 38, no. 2010 (2010): 2477–2485.
Sjögren, H., M. Stenkvist, and H. Åkesson. PFE: Effekter av elskatt. Report, Eskilstuna: ÅF-Process on
behalf of the Swedish Energy Agency, 2007.
SPBI. Statistik/Skatter årsvis. Svenska Petroleum och Biodrivmedel Institutet. 2013.
http://spbi.se/statistik/skatter/ (accessed May 3, 2013).
SSAB Communications. "The Steel Book." SSAB. 2012.
http://www.ssab.com/global/ssab/brochures/en/001_the%20steel%20book.pdf (accessed January 10,
2013).
Staniaszek, D., and E. Lees. Determining Energy Savings for Energy Efficiency Obligation Schemes. Report, RAP,
2012.
Stenqvist, C., and J. Nilsson. "Energy efficiency in energy-intensive industries—an evaluation of the
Swedish voluntary agreement PFE." Energy Efficiency 2012, no. 5 (July 2011): 225-241.
Suerkemper, f., S. Thomas, D. Osso, and P. Baudry. "Cost-effectiveness of energy efficiency
programmes—evaluating the impacts of a regional programme in France." Energy Efficiency , no. 5 (2012):
121-135.
Svensk författningssamling. SFS 2004:1196 Lag om program för energieffektivisering. Law, Stockholm: Svensk
föfattningssamling, 2004.
Tanaka, K. Assessing measures of energy efficiency performance and their application in industry. IEA information
paper, IEA, 2008.
Tanaka, K. "Review of policies and measures for energy efficiency in industry sector." Energy Policy 39, no.
2011 (2011): 6532–6550.
Tengvad, R. "The Danish Model – how energy efficiency works." Danish Energy Association, February
20, 2013.

73
Tennies, WL, GE Metius, and JT Kopfle. Breakthrough technologies for the millennium. Charlotte, USA: Midrex
Technologies, Inc. , 2010.
Thollander, P., and M. Ottosson. "An energy efficient Swedish pulp and paper industry—exploring
barriers to and driving forces for cost-effective energy efficiency investments." Energy Efficiency 1, no. 1
(2008): 21-34.
Thollander, P., and M. Ottosson. "Energy management practices in Swedish energy-intensive industries."
Journal of Cleaner Production 18, no. 12 (2010): 1125-1133.
Thollander, P., I.L. Svensson, and L. Trygg. " Analyzing variables for district heating collaborations
between energy utilities and industries ." Energy 35, no. 9 (2010): 3649-3656.
Thomas, S. The Quantitative Targets for Energy Savings Proposed by the Draft Directive on Energy End-Use Efficiency
and Energy Services – how to Define, how to Monitor them. Report, Wuppertal: Wuppertal Institute for Climate
Environment Energy, 2005.
Tol, R. S.J. "A cost–benefit analysis of the EU 20/20/2020 package." Energy Policy (Elsevier Science B.V.)
49, no. 2012 (2012): 288-295.
Transue, M., and F.A. Felder. "Comparison of energy efficiency incentive programs: Rebates and white
certificates." Utilities Policy 18 (2010) 103–111 18 (2010): 103-111.
Trochim, W.M.K. Deduction & Induction. 2006. http://www.socialresearchmethods.net/kb/dedind.php
(accessed April 23, 2013).
U.K. Government Digital Service. Green Deal: energy saving for your home or business. April 04, 2013.
https://www.gov.uk/green-deal-energy-saving-measures/how-the-green-deal-works (accessed April 15,
2013).
Waide, P., and B. Buchner. "Utility energy efficiency schemes: saving obligations and trading." Energy
Efficiency 1, no. 4 (2008): 297-311.
World Energy Council. "European Experience of White Certificates - WEC ADEME project on energy
efficiency policies." 2007.
Worrell, E., J. Laitnerb, M. Rutha, and H. Finmanb. "Productivity benefits of industrial energy efficiency
measures." Energy 28, no. 11 (January 2003): 1081-1098.
Zeng, S., Y. Lan, and J. Huang. "Mitigation paths for Chinese iron and steel industry to tackle global
climate change." Internation Journal for Greenhouse Gas Control 3, no. 6 (2009): 675-682.

74
APPENDIX I: ENERGY SAVING POTENTIAL IN THE
INDUSTRY
The total, electricity and fuels saving potentials for the whole of the industrial sector are depicted in the
following tables.
Unit 2010 2012 2015 2016 2020
Annual energy saving potential 2012-2020(TWh)
Economic (LPI) GWh 6,756 9,858 14,512 16,081 22,360 1.56275
Economic (HPI) GWh 7,837 11,367 16,663 18,449 25,593 1.77825
Technical GWh 9,512 13,791 20,209 22,481 31,570 2.22237
Appendix Table 1: Sweden-Total energy saving potential in the industry (Data from Database on Energy Saving
potentials) (Fraunhofer ISI 2009)
Unit 2010 2012 2015 2016 2020
Annual energy saving potential 2012-2020(TWh)
Economic (LPI) GWh 3,430 5,737 9,198 10,388 15,151 1.17675
Economic (HPI) GWh 4,070 6,656 10,535 11,853 17,128 1.30900
Technical GWh 4,267 6,914 10,884 12,226 17,593 1.33487
Appendix Table 2: Sweden-Electricity saving potential in the industry (Data from Database on Energy Saving
Potentials) (Fraunhofer ISI 2009)
Unit 2010 2012 2015 2016 2020
Annual energy saving potential 2012-2020(TWh)
Economic (LPI) GWh 3,326 4,126 5,326 5,702 7,209 0.38537
Economic (HPI) GWh 3,767 4,712 6,128 6,595 8,465 0.46912
Technical GWh 5,244 6,877 9,326 10,256 13,977 0.88750
Appendix Table 3: Sweden-Fuels saving potential in the industry (Data from Database on Energy Saving Potentials)
(Fraunhofer ISI 2009)

75
APPENDIX II: ENERGY SAVING POTENTIAL IN THE
ENERGY INTENSIVE INDUSTRIES
Unit 2010 2012 2015 2016 2020
Annual energy saving potential 2012-2020(TWh)
Economic (LPI) GWh 4,861 7,275 10,896 12,169 17,267 1.24900
Economic (HPI) GWh 5,814 8,601 12,780 14,253 20,151 1.44375
Technical GWh 7,117 10,492 15,559 17,471 25,128 1.82950
Appendix Table 4: Sweden-Total saving potential in the energy intensive industries (Data from Database on Energy
Saving Potentials) (Fraunhofer ISI 2009)
Unit 2012 2015 2020
Annual energy saving potential 2012-
2020(TWh)
Economic (LPI) GWh 2,314 6,802 11,570 1.15700
Economic (HPI) GWh 2,815 7,883 13,185 1.29625
Technical GWh 2,976 8,140 13,535 1.31987
Appendix Table 5: Sweden-Electricity saving potential in the energy intensive industries (Data from Database on
Energy Saving Potentials) (Fraunhofer ISI 2009)
Unit 2012 2015 2020
Annual energy saving potential 2012-
2020(TWh)
Economic (LPI) GWh 2,547 4,094 5,697 0.39375
Economic (HPI) GWh 2,999 4,897 6,966 0.495875
Technical GWh 4,141 7,419 11,593 0.93150
Appendix Table 6: Sweden-Fuels saving potential in the energy intensive industries (Data from Database on Energy
Saving Potentials) (Fraunhofer ISI 2009)

76
APPENDIX III: ENERGY SAVING POTENTIAL IN THE
IRON AND STEEL INDUSTRY
Unit 2010 2012 2015 2016 2020
Annual energy saving potential 2012-2020(TWh)
Economic (LPI) GWh 349 451 605 653 849 0.04975
Economic (HPI) GWh 558 702 919 981 1233 0.06637
Technical GWh 767 953 1,233 1,316 1,651 0.08725
Appendix Table 7: Sweden-Total saving potential in the iron and steel industry (Data from Database on Energy
Saving Potentials) (Fraunhofer ISI 2009)
Unit 2012 2015 2020
Annual energy saving potential 2012-
2020(TWh)
Economic (LPI) GWh 291 523 733 0.05525
Economic (HPI) GWh 314 570 767 0.05662
Technical GWh 326 570 779 0.05662
Appendix Table 8: Sweden-Electricity saving potential in the iron and steel industry (Data from Database on Energy
Saving Potentials) (Fraunhofer ISI 2009)
Unit 2012 2015 2020
Annual energy saving potential 2012-
2020(TWh)
Economic (LPI) GWh 58 82 116 0.00725
Economic (HPI) GWh 244 349 466 0.02775
Technical GWh 441 663 872 0.05387
Appendix Table 9: Sweden-Fuels saving potential in the iron and steel industry (Data from Database on Energy
Saving Potentials) (Fraunhofer ISI 2009)
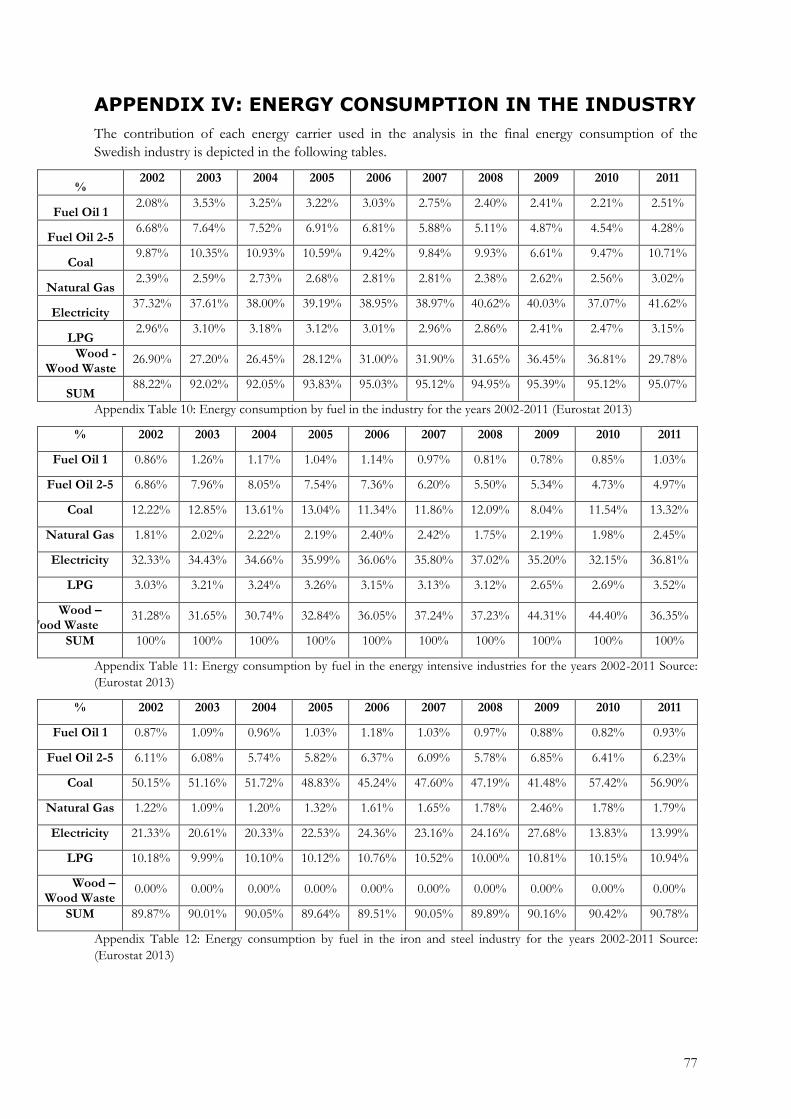
77
APPENDIX IV: ENERGY CONSUMPTION IN THE INDUSTRY
The contribution of each energy carrier used in the analysis in the final energy consumption of the
Swedish industry is depicted in the following tables.
% 2002 2003 2004 2005 2006 2007 2008 2009 2010 2011
Fuel Oil 1 2.08% 3.53% 3.25% 3.22% 3.03% 2.75% 2.40% 2.41% 2.21% 2.51%
Fuel Oil 2-5 6.68% 7.64% 7.52% 6.91% 6.81% 5.88% 5.11% 4.87% 4.54% 4.28%
Coal 9.87% 10.35% 10.93% 10.59% 9.42% 9.84% 9.93% 6.61% 9.47% 10.71%
Natural Gas 2.39% 2.59% 2.73% 2.68% 2.81% 2.81% 2.38% 2.62% 2.56% 3.02%
Electricity 37.32% 37.61% 38.00% 39.19% 38.95% 38.97% 40.62% 40.03% 37.07% 41.62%
LPG 2.96% 3.10% 3.18% 3.12% 3.01% 2.96% 2.86% 2.41% 2.47% 3.15%
Wood -Wood Waste
26.90% 27.20% 26.45% 28.12% 31.00% 31.90% 31.65% 36.45% 36.81% 29.78%
SUM 88.22% 92.02% 92.05% 93.83% 95.03% 95.12% 94.95% 95.39% 95.12% 95.07%
Appendix Table 10: Energy consumption by fuel in the industry for the years 2002-2011 (Eurostat 2013)
% 2002 2003 2004 2005 2006 2007 2008 2009 2010 2011
Fuel Oil 1 0.86% 1.26% 1.17% 1.04% 1.14% 0.97% 0.81% 0.78% 0.85% 1.03%
Fuel Oil 2-5 6.86% 7.96% 8.05% 7.54% 7.36% 6.20% 5.50% 5.34% 4.73% 4.97%
Coal 12.22% 12.85% 13.61% 13.04% 11.34% 11.86% 12.09% 8.04% 11.54% 13.32%
Natural Gas 1.81% 2.02% 2.22% 2.19% 2.40% 2.42% 1.75% 2.19% 1.98% 2.45%
Electricity 32.33% 34.43% 34.66% 35.99% 36.06% 35.80% 37.02% 35.20% 32.15% 36.81%
LPG 3.03% 3.21% 3.24% 3.26% 3.15% 3.13% 3.12% 2.65% 2.69% 3.52%
Wood –Wood Waste
31.28% 31.65% 30.74% 32.84% 36.05% 37.24% 37.23% 44.31% 44.40% 36.35%
SUM 100% 100% 100% 100% 100% 100% 100% 100% 100% 100%
Appendix Table 11: Energy consumption by fuel in the energy intensive industries for the years 2002-2011 Source:
(Eurostat 2013)
% 2002 2003 2004 2005 2006 2007 2008 2009 2010 2011
Fuel Oil 1 0.87% 1.09% 0.96% 1.03% 1.18% 1.03% 0.97% 0.88% 0.82% 0.93%
Fuel Oil 2-5 6.11% 6.08% 5.74% 5.82% 6.37% 6.09% 5.78% 6.85% 6.41% 6.23%
Coal 50.15% 51.16% 51.72% 48.83% 45.24% 47.60% 47.19% 41.48% 57.42% 56.90%
Natural Gas 1.22% 1.09% 1.20% 1.32% 1.61% 1.65% 1.78% 2.46% 1.78% 1.79%
Electricity 21.33% 20.61% 20.33% 22.53% 24.36% 23.16% 24.16% 27.68% 13.83% 13.99%
LPG 10.18% 9.99% 10.10% 10.12% 10.76% 10.52% 10.00% 10.81% 10.15% 10.94%
Wood –Wood Waste
0.00% 0.00% 0.00% 0.00% 0.00% 0.00% 0.00% 0.00% 0.00% 0.00%
SUM 89.87% 90.01% 90.05% 89.64% 89.51% 90.05% 89.89% 90.16% 90.42% 90.78%
Appendix Table 12: Energy consumption by fuel in the iron and steel industry for the years 2002-2011 Source:
(Eurostat 2013)
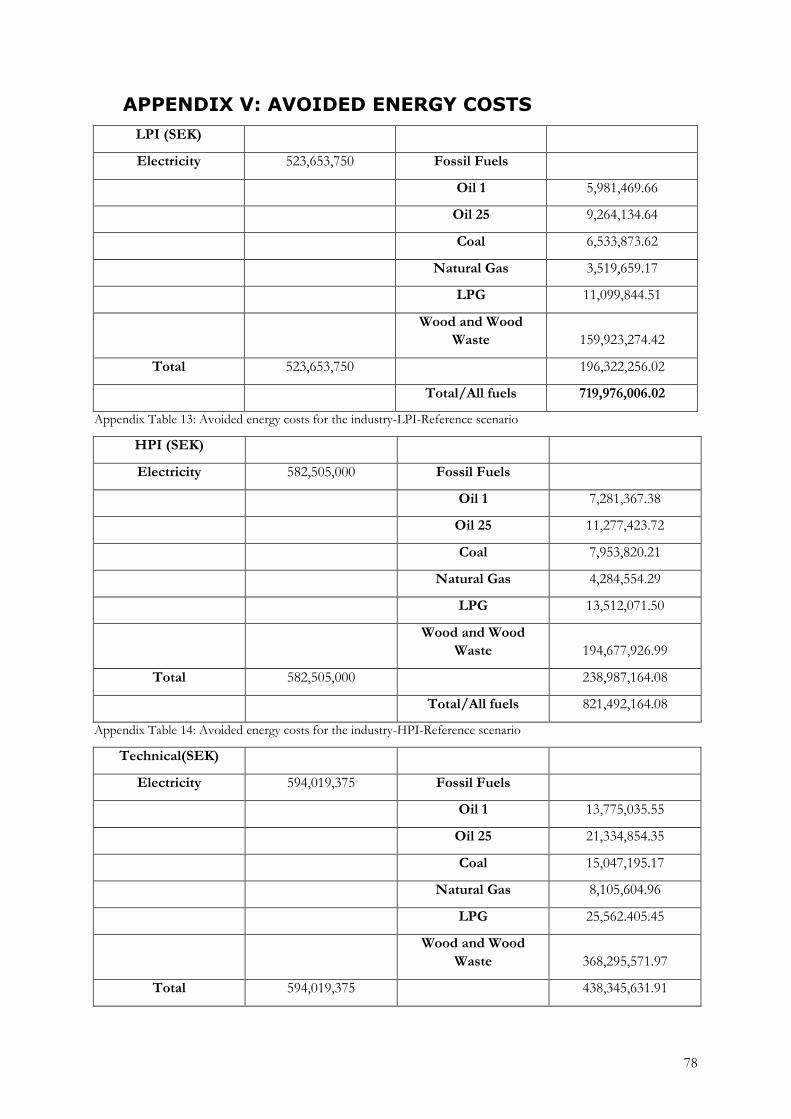
78
APPENDIX V: AVOIDED ENERGY COSTS
LPI (SEK)
Electricity 523,653,750 Fossil Fuels
Oil 1 5,981,469.66
Oil 25 9,264,134.64
Coal 6,533,873.62
Natural Gas 3,519,659.17
LPG 11,099,844.51
Wood and Wood
Waste 159,923,274.42
Total 523,653,750
196,322,256.02
Total/All fuels 719,976,006.02
Appendix Table 13: Avoided energy costs for the industry-LPI-Reference scenario
HPI (SEK)
Electricity 582,505,000 Fossil Fuels
Oil 1 7,281,367.38
Oil 25 11,277,423.72
Coal 7,953,820.21
Natural Gas 4,284,554.29
LPG 13,512,071.50
Wood and Wood
Waste 194,677,926.99
Total 582,505,000
238,987,164.08
Total/All fuels 821,492,164.08
Appendix Table 14: Avoided energy costs for the industry-HPI-Reference scenario
Technical(SEK)
Electricity 594,019,375 Fossil Fuels
Oil 1 13,775,035.55
Oil 25 21,334,854.35
Coal 15,047,195.17
Natural Gas 8,105,604.96
LPG 25,562.405.45
Wood and Wood
Waste 368,295,571.97
Total 594,019,375
438,345,631.91

79
Total/All fuels 1,032,365,006.91
Appendix Table 15: Avoided energy costs for the industry-Technical-Reference scenario
LPI (SEK)
Electricity 541,305,000 Fossil Fuels
Fuel Oil 1 7,412,165.41
Fuel Oil 2-5 10,947,467.38
Coal 6,759,828.90
Natural Gas 16,009,105.73
LPG 11,397,897.74
Wood and Wood
Waste 159,923,274.42
Total 541,305,000
212,449,739.57
Total/All fuels 753,754,739.57
Appendix Table 16: Avoided energy costs for the industry-LPI-Higher fossil fuel prices scenario
HPI (SEK)
Electricity 602,140,000 Fossil Fuels
Fuel Oil 1 9,022,983.06
Fuel Oil 2-5 13,326,579.65
Coal 8,228,880.27
Natural Gas 5,163,916.96
LPG 13,874,897.89
Wood and Wood
Waste 194,677,926.99
Total 602,140,000
244,295,184.82
Total/All fuels 846,435,184.82
Appendix Table 17: Avoided energy costs for the industry-HPI-Higher fossil fuel prices scenario
Technical (SEK)
Electricity 614,042,500 Fossil Fuels
Fuel Oil 1 17,069,858.70
Fuel Oil 2-5 25,211,488.29
Coal 15,567,559.27
Natural Gas 9,769,200.74
LPG 26,248,807.63
Wood and Wood Waste 368,295,571.97
Total 614,042,500
462,162,486.61
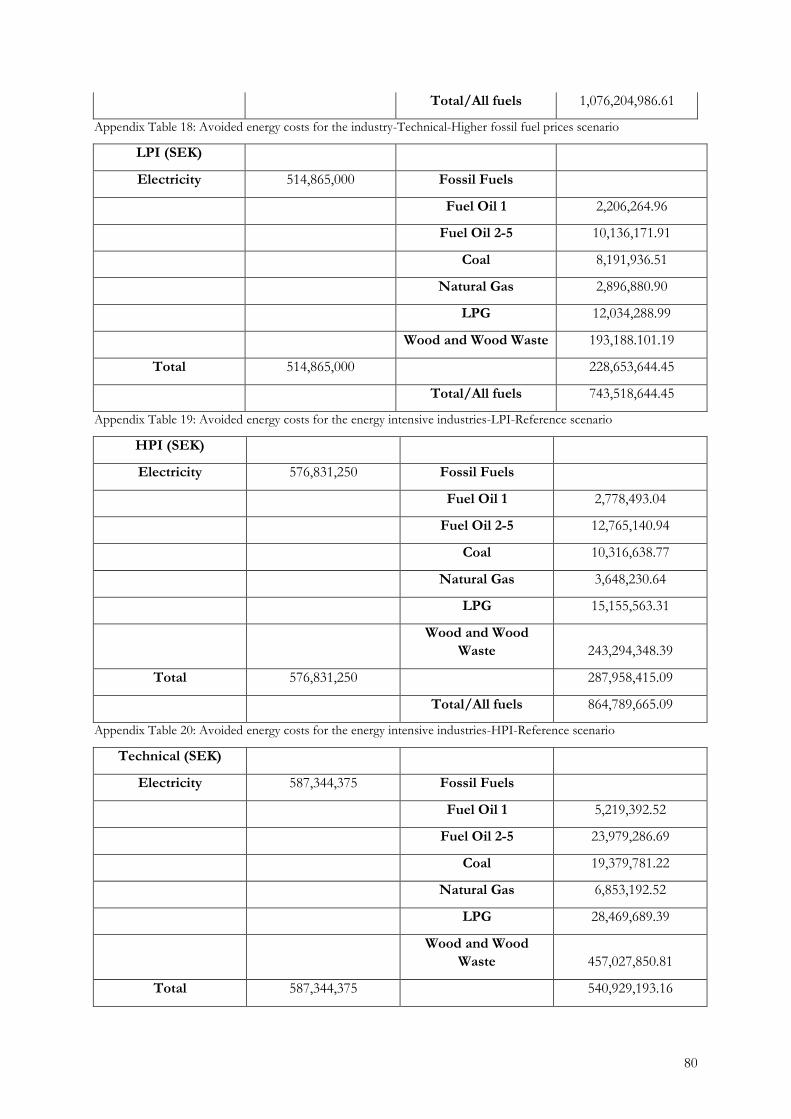
80
Total/All fuels 1,076,204,986.61
Appendix Table 18: Avoided energy costs for the industry-Technical-Higher fossil fuel prices scenario
LPI (SEK)
Electricity 514,865,000 Fossil Fuels
Fuel Oil 1 2,206,264.96
Fuel Oil 2-5 10,136,171.91
Coal 8,191,936.51
Natural Gas 2,896,880.90
LPG 12,034,288.99
Wood and Wood Waste 193,188.101.19
Total 514,865,000
228,653,644.45
Total/All fuels 743,518,644.45
Appendix Table 19: Avoided energy costs for the energy intensive industries-LPI-Reference scenario
HPI (SEK)
Electricity 576,831,250 Fossil Fuels
Fuel Oil 1 2,778,493.04
Fuel Oil 2-5 12,765,140.94
Coal 10,316,638.77
Natural Gas 3,648,230.64
LPG 15,155,563.31
Wood and Wood
Waste 243,294,348.39
Total 576,831,250
287,958,415.09
Total/All fuels 864,789,665.09
Appendix Table 20: Avoided energy costs for the energy intensive industries-HPI-Reference scenario
Technical (SEK)
Electricity 587,344,375 Fossil Fuels
Fuel Oil 1 5,219,392.52
Fuel Oil 2-5 23,979,286.69
Coal 19,379,781.22
Natural Gas 6,853,192.52
LPG 28,469,689.39
Wood and Wood
Waste 457,027,850.81
Total 587,344,375
540,929,193.16

81
Total/All fuels 1,128,273,568.16
Appendix Table 21: Avoided energy costs for the energy intensive industries-Technical-Reference scenario
LPI (SEK)
Electricity 532,220,000 Fossil Fuels
Fuel Oil 1 2,733,977.05
Fuel Oil 2-5 11,977,957.53
Coal 8,475,231.14
Natural Gas 3,491,437.24
LPG 12,357,433.94
Wood and Wood
Waste 193,188,101.19
Total 532,220,000
232,224,138.09
Total/All fuels 764,444,138.09
Appendix Table 22: Avoided energy costs for the energy intensive industries-LPI-Higher fossil fuel prices scenario
HPI (SEK)
Electricity 596,275,000 Fossil Fuels
Fuel Oil 1 3,443,075.23
Fuel Oil 2-5 15,084,621.44
Coal 10,673,410.14
Natural Gas 4,396,994.13
LPG 15,562,520.78
Wood and Wood
Waste 243,294,348.39
Total 596,275,000
292,454,970.10
Total/All fuels 888,729,970.10
Appendix Table 23: Avoided energy costs for the energy intensive industries-HPI-Higher fossil fuel prices scenario
Technical (SEK)
Electricity 607,142,500 Fossil Fuels
Fuel Oil 1 6,467,808.57
Fuel Oil 2-5 28,336,425.25
Coal 20,049,975.38
Natural Gas 8,259,742.95
LPG 29,234,158.01
Wood and Wood
Waste 457,027,850.81
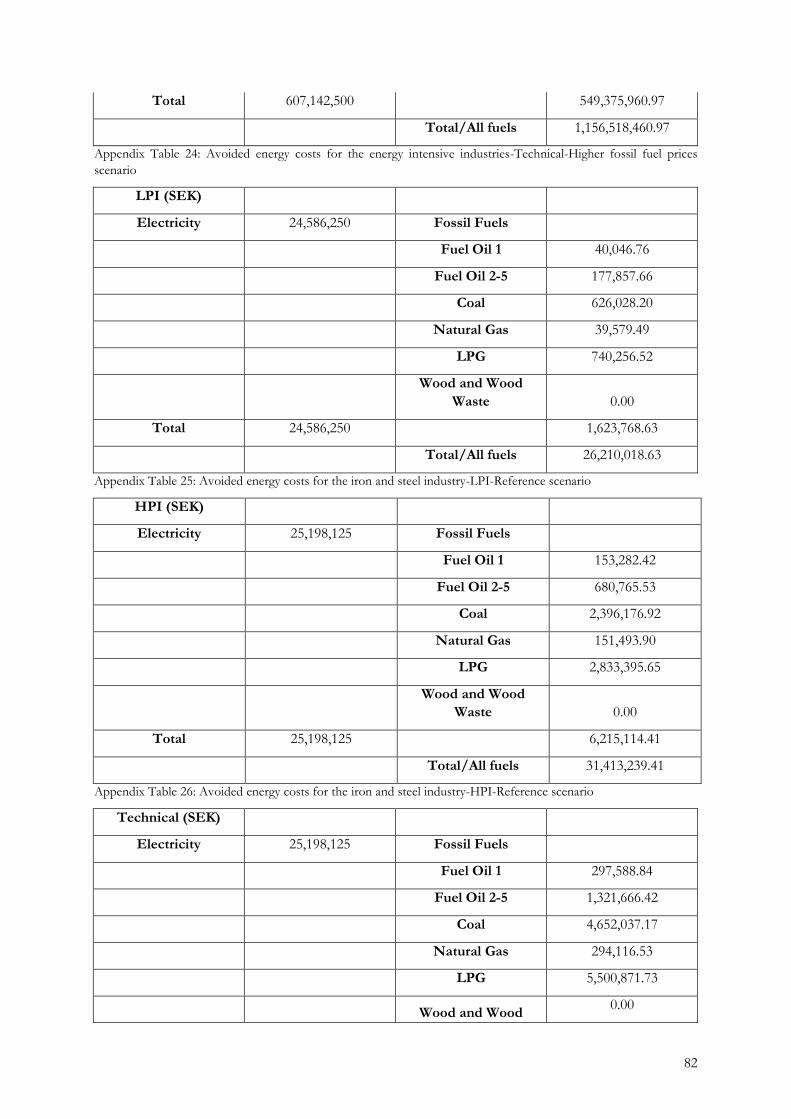
82
Total 607,142,500
549,375,960.97
Total/All fuels 1,156,518,460.97
Appendix Table 24: Avoided energy costs for the energy intensive industries-Technical-Higher fossil fuel prices
scenario
LPI (SEK)
Electricity 24,586,250 Fossil Fuels
Fuel Oil 1 40,046.76
Fuel Oil 2-5 177,857.66
Coal 626,028.20
Natural Gas 39,579.49
LPG 740,256.52
Wood and Wood
Waste 0.00
Total 24,586,250
1,623,768.63
Total/All fuels 26,210,018.63
Appendix Table 25: Avoided energy costs for the iron and steel industry-LPI-Reference scenario
HPI (SEK)
Electricity 25,198,125 Fossil Fuels
Fuel Oil 1 153,282.42
Fuel Oil 2-5 680,765.53
Coal 2,396,176.92
Natural Gas 151,493.90
LPG 2,833,395.65
Wood and Wood
Waste 0.00
Total 25,198,125
6,215,114.41
Total/All fuels 31,413,239.41
Appendix Table 26: Avoided energy costs for the iron and steel industry-HPI-Reference scenario
Technical (SEK)
Electricity 25,198,125 Fossil Fuels
Fuel Oil 1 297,588.84
Fuel Oil 2-5 1,321,666.42
Coal 4,652,037.17
Natural Gas 294,116.53
LPG 5,500,871.73
Wood and Wood 0.00

83
Waste
Total 25,198,125
12,066,280.68
Total/All fuels 37,264,405.68
Appendix Table 27: Avoided energy costs for the iron and steel industry-Technical-Reference scenario
LPI (SEK)
Electricity 25,415,000 Fossil Fuels
Fuel Oil 1 49,625.46
Fuel Oil 2-5 210,175.16
Coal 647,677.59
Natural Gas 47,702.79
LPG 760,133.90
Wood and Wood
Waste 0.00
Total 25,415,000
1,715,314.90
Total/All fuels 27,130,314.90
Appendix Table 28: Avoided energy costs for the iron and steel industry-LPI-Higher fossil fuel prices scenario
HPI (SEK)
Electricity 26,047,500 Fossil Fuels
Fuel Oil 1 189,945.73
Fuel Oil 2-5 804,463.53
Coal 2,479,041.82
Natural Gas 182,586.53
LPG 2,909,478.04
Wood and Wood
Waste 0.00
Total 26,047,500
6,565,515.66
Total/All fuels 32,613,015.66
Appendix Table 29: Avoided energy costs for the iron and steel industry-HPI-Higher fossil fuel prices scenario
Technical (SEK)
Electricity 26,047,500 Fossil Fuels
Fuel Oil 1 368,768.52
Fuel Oil 2-5 1,561,818.84
Coal 4,812,914.53
Natural Gas 354,481.05
LPG 5,648,581.24

84
Wood and Wood
Waste 0.00
Total 26,047,500
12,746,564.18
Total/All fuels 38,794,064.18
Appendix Table 30: Avoided energy costs for the iron and steel industry-Technical-Higher fossil fuel prices scenario

85
APPENDIX VI: COSTS OF THE ENERGY EFFICIENCY
OBLIGATION SCHEME
Costs
(SEK/kWh) LPI HPI Technical
1.Administrative costs
State
i.Energimyndigheten 0.0023 3,594,325 4,089,975 5,111,462.50
ii.EU 0.0002 268,167.9 305,147.7 381,359.55
2.Program Costs
i.Denmark Comparison 0.0900 140,647,500 160,042,500 200,013,750
ii.Italy Comparison 0.0110 17,190,250 19,560,750 24,446,125
iii.France Comparison 0.0300 46,882,500 53,347,500 66,671,250
3.Investment Costs
Implementer of measures
i.Denmark Comparison 0.3900 609,472,500 693,517,500 866,726,250
ii.Italy Comparison 0.1600 250,040,000 284,520,000 355,580,000
iii.France Comparison 0.2900 453,197,500 515,692,500 644,488,750
Appendix Table 31: Costs of implementation of the energy efficiency obligation scheme regarding the industry for
LPI, HPI and Technical scenario
Costs
(SEK/kWh) LPI HPI Technical
1.Administrative costs
State
i.Energimyndigheten 0.0023 3,594,325 4,089,975 5,111,462.50
ii.EU 0.0002 268,167.90 305,147 381,359.55
2.Program Costs
i.Denmark Comparison 0.0900 140,647,500 160,042,500 200,013,750
ii.Italy Comparison 0.0110 17,190,250 19,560,750 24,446,125
iii.France Comparison 0.0300 46,882,500 53,347,500 66,671,250
3.Investment Costs
Implementer of measures
i.Denmark Comparison 0.3900 609,472,500 693,517,500 866,726,250
ii.Italy Comparison 0.1600 250,040,000 284,520,000 355,580,000
iii.France Comparison 0.2900 453,197,500 515,692,500 644,488,750
Appendix Table 32: Costs of implementation of the energy efficiency obligation scheme regarding the energy
intensive industries for LPI, HPI and Technical scenario

86
Costs
(SEK/kWh) LPI HPI Technical
1.Administrative costs
State
i.Energimyndigheten 0.0023 114,425 152,662.50 200,675
ii.EU 0.0002 8,537.10 11,389.95 14,972.10
2.Program Costs
i.Denmark Comparison 0.0900 4,477,500 5,973,750 7,852,500
ii.Italy Comparison 0.0110 547,250 730,125 959,750
iii.France Comparison 0.0300 1,492,500 1,991,250 2,617,500
3.Investment Costs
Implementer of measures
i.Denmark Comparison 0.3900 19,402,500 25,886,250 34,027,500
ii.Italy Comparison 0.1600 7,960,000 10,620,000 13,960,000
iii.France Comparison 0.2900 14,427,500 19,248,750 25,302,500
Appendix Table 33: Costs of implementation of the energy efficiency obligation scheme regarding the iron and steel
industry for LPI, HPI and Technical scenario