Cost Effectiveness Analysis (CEA) Best Practices - Wisconsin
41
$ Cost Effectiveness Analysis (CEA) Best Practices Juan F. Quintana CRNA, DNP
Transcript of Cost Effectiveness Analysis (CEA) Best Practices - Wisconsin

$
Cost Effectiveness Analysis (CEA)Best PracticesJuan F. Quintana CRNA, DNP

CEA
CEA• powerful tool• prioritize resources for health care.
“CEA lies at the heart of perhaps the ultimate health policy question: how can we get good value for our money?”we get good value for our money? (Neumann, 2005)

CEACEA
Opposition: “Isn’t cost effectiveness analysis just a smoke-screen foranalysis just a smoke screen for cutting costs at the expense of quality? “ (Eddy 1992)quality? (Eddy, 1992)

Qualityy
Over 50 years
at least 25 studies
Results - essentially no difference inResults - essentially no difference in outcomes
Anesthesia is very good!!!

QualityQuality
RTI (2010)
Needleman, J. and A. F. Minnick (2009).
Simonson D C M Ahern et al (2007)Simonson, D. C., M. Ahern, et al. (2007).

Quality
6 SigmaThe level of errors per million procedures under anesthesia
S (approaches 6 Sigma (Lema, 2003; Luchsinger & Pexton, 2004).

Cost Identification AnalysisCost Identification Analysisby Juan F. Quintana CRNA, MHS, DNP
• The most frequently utilized in anesthesia.
• Utilized when outcomes are EQUAL, but the cost of comparable outcomes IS NOTNOT.
• A rigorous determination of the costs.
“The presumed goal for this analysis is to find the least-expensive way to achieve th t ” (S 1997)the outcomes.” (Sperry, 1997)

T i CEA t E id BT i CEA t E id BTying CEA to Evidence BaseTying CEA to Evidence Base
and and
EvidenceBasedCost Efficiency Based
R ltResults
Best Anesthesia Practice Models

Academic Center for Evidence
Academic Center for Evidence-BasedPractice (ACE) Star model
• knowledge transformation• integrates old and new concepts of
improving care • provides a framework to organize EBP• provides a framework to organize EBP
processes and approaches (Stevens, 2004).)

Knowledge TransformationKnowledge TransformationggDiscovery
of
Evidence S
of KnowledgeEvaluation ++
Summary
ACE Star Model
++
Translation into Practice
RecommendationsIntegration into
Practice + Recommendations+

Discovery of KnowledgeDiscovery of Knowledgey gy g
WWWLiterature review
Anesthesia
Are US healthcare facilities optimizing revenue by using efficient anesthesia practiceAnesthesia
ProvidersAdministrators
efficient anesthesia practice models to meet the requirements of their anesthetizing locations?
Does an increase in CRNA autonomy leads to cost
saving?saving?

Knowledge TransformationKnowledge TransformationggDiscovery
of
Evidence S
of KnowledgeEvaluation ++
Summary
ACE Star Model
++
Translation into Practice
RecommendationsIntegration into
Practice + Recommendations+

CEA
Evidence SummaryEvidence Summaryyy
Provider BenefitsCosts Educational
Costs
Time Off
Needs Analysis

CEA
Evidence SummaryNeeds Analysis
1US spends more than any othercountry on Healthcarecountry on Healthcare
Healthcare exceeds 16% of GDP2
Anesthesia Stipends continue to Increase3
Healthcare Reform 4

Evidence SummaryC t C t
Evidence SummaryC t C tCurrent CostsCurrent Costs
1
Perspectives
Healthcare Facilities
p
Patients/Insurance
2
Provider Costs
MD $300-350k/year
CRNA$140-160k/year

Evidence SummaryEd ti l C t
Evidence SummaryEd ti l C tEducational CostsEducational Costs
1BS d 4
MD
BS degree = 4 yearsMed School = 4 yearsResidency = 4 yearsTotal time = 12 yearsMD y
Less 3 years = 9 yearsAverage cost $635,348
2BS(N) degree = 4 yearsAcute Care = 1 5 years**
CRNA
Acute Care = 1.5 yearsCRNA Education = 2.7 years
Total time = 9.2 yearsLess 1.5 years = 5.2 years
Average Cost $59,153

Evidence Summary Benefits
Benefits 30-35% of Salary:
HealthcareHealthcare
Life Insurance
Di biliDisability
Retirement
~ Neutral Both benefit Neutral Both benefit

Evidence SummaryTime Off
MDA 4-8 weeks /year
CRNA 4-6 weeks /yearCRNA 4 6 weeks /year
A 5 k ili d f hi dAverage 5 weeks utilized for this study

Knowledge TransformationKnowledge TransformationggDiscovery
of
Evidence S
of KnowledgeEvaluation ++
Summary
ACE Star Model
++
Translation into Practice
RecommendationsIntegration into
Practice + Recommendations+

Translation into PracticeTranslation into PracticeTranslation into PracticeTranslation into PracticeAnesthesia Practice ?
ModelsAnesthesiologistsOnly
?
1Physicians administer
all anesthesia
1
3CollaborativeAnesthesia Care Team CRNA
Only2
3 4
MD and CRNA
MD medically directs
2 4 CRNAsCRNAs
administerworking together
2-4 CRNAs administer all
anesthesia

Translation into PracticeTranslation into Practice
AVERAGES
C i F t (CF)
AVERAGES
Conversion Factor (CF):
Non-Teaching - $32.00
T hi $31 00Teaching - $31.00
(Abouelish, 2001; Beirstein, 2003, Kheterpal,2009)

Translation into Practice
Determination of Total Procedures Per DayAVERAGES
Determination of Total Procedures Per Day
Average units/procedure 90 ming p(6 TM or 1.5 hours)• Average turnover time + 30 ming• Average time/procedure = 120 min• (2 hours)• Routine operating hours 8 Hrs/day• Total time per procedure 2 Hrs/procedure
4 procedures/day(Harders, 2007; Dexter, 2005)

Translation into PracticeTranslation into PracticeAVERAGES
Units /Procedure
Non-Teaching facility 10 units
Teaching Facility 12 unitsg y

Translation into PracticeTranslation into PracticeAVERAGES
Potential Reimb. Non-Teaching (12)
$32/unit x 10 units = $320/procedure$32/unit x 10 units = $320/procedure
$320/proc. x 4.5/day = $1440/day
12 x $1440/day x 255 days/year
$4 134 751/ *= $4,134,751/year**Reduced by cost of billing (8%)

Translation into PracticeTranslation into PracticeAVERAGES
Potential Reimb. Teaching (36)
$31/unit x 12 units = $372/procedure$31/unit x 12 units = $372/procedure
$372/procedures x 4/day = $1488/day
36 x $1488/day x 255 days/year
$12 567 053/ *= $12,567,053/year**Reduced by cost of billing

Translation into PracticeTranslation into Practice
Anesthesiologist OnlyCost in Non-Teaching Facility 12 locations
16 MDs x $350,000 = $5,600,000/year
Potential Reimbursement = $4,134,751/year
Net Gain/Loss = -$1,465,249/yearNet Gain/Loss $1,465,249/year

Translation into PracticeTranslation into Practice
CollaborativeCost in Non-Teaching Facilities with 12 locations
3 MDA x $350,00+ 13 CRNAs x $180,000 = $3,390,000/year
Potential Reimbursement = $4,134,751/year
Net Gain/Loss = $ 744,751/year

Translation into PracticeTranslation into Practice
CRNA Only
Cost16 providers x $200,000 = $3,200,000/year
P t ti l R i b t $4 134 751/Potential Reimbursement = $4,134,751/year
Net Gain/Loss = $ 934 751/yearNet Gain/Loss $ 934,751/year

Translation into PracticeTranslation into Practice
ACT - Non-Teaching Facilities 12 locationsCost (1:4 ratio)( )
4.5 MDA x $321,000+ 16 CRNAs x $160,000 = $4,004,500/year$ , $ , , y
Potential Reimbursement = $4,134,751/year
Net Gain/Loss = $ 130,251/year

Translation into PracticeTranslation into Practice
ACT - Non-Teaching Facilities adjusted for Delays r/t Medicaladjusted for Delays r/t Medical Direction (12 Locations)
C t $4 004 500/Cost = $4,004,500/yearPotential Reimb. =$3,674,494/yearNet Gain/Loss = -$330,006/year
Translation into PracticeTranslation into Practice
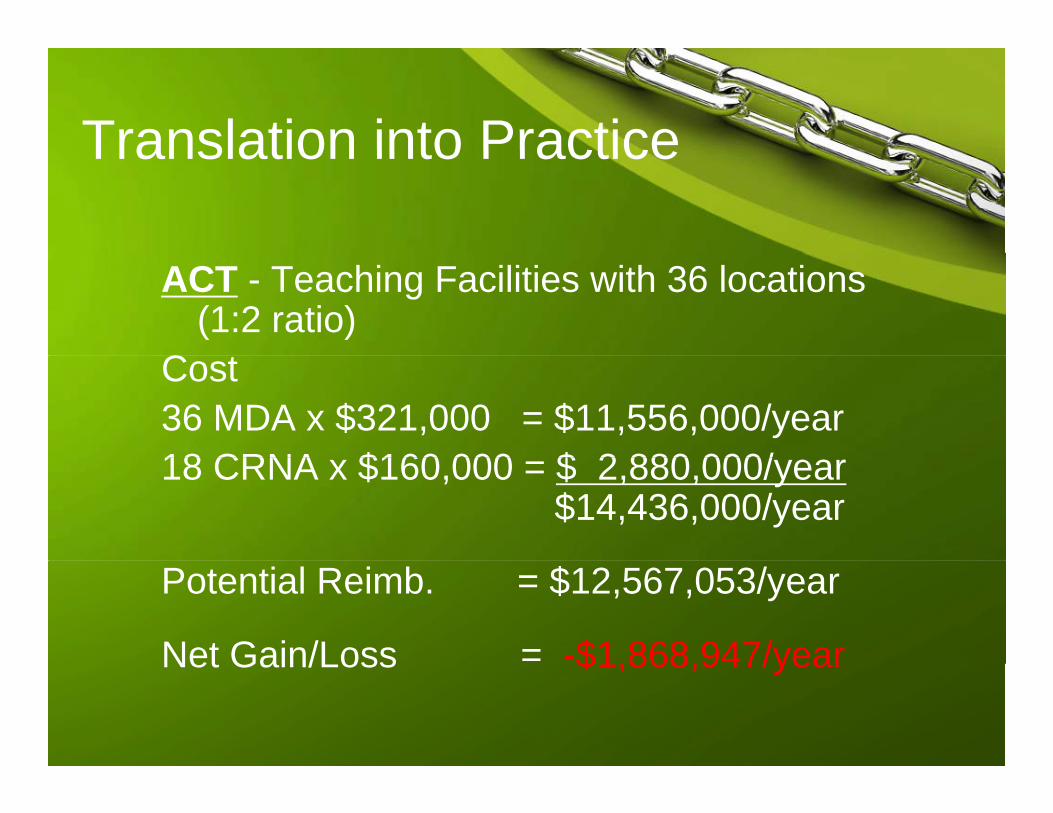
ACT - Teaching Facilities with 36 locations (1:2 ratio)
C tCost36 MDA x $321,000 = $11,556,000/year18 CRNA $160 000 $ 2 880 000/18 CRNA x $160,000 = $ 2,880,000/year
$14,436,000/year
Potential Reimb. = $12,567,053/year
Net Gain/Loss = -$1 868 947/yearNet Gain/Loss $1,868,947/year

Translation into PracticeTranslation into Practice
ACT - Teaching Facilities adjusted for Delays r/t Medical Direction (16 locations)
Costs = $14,436,000/yearPotential Reimb. = $10,996,171/yearNet Gain/Loss = -$3,439,829/year, , y

Knowledge TransformationKnowledge TransformationggDiscovery
of
Evidence S
of KnowledgeEvaluation ++
Summary
ACE Star Model
++
Translation into Practice
RecommendationsIntegration into
Practice + Recommendations+

Integration & EvaluationIntegration & Evaluation
CRNACollaborative
ACTACT
MD

Knowledge TransformationKnowledge TransformationggDiscovery
of
Evidence S
of KnowledgeEvaluation ++
Summary
ACE Star Model
++
Translation into Practice
RecommendationsIntegration into
Practice + Recommendations+

StudyStudy
Question 1 - Yes and No, Some US facilities optimize anesthesia practice p pmodels
Question 2 - Increased CRNA autonomy definitely results inautonomy definitely results in increased cost-effectiveness

REFERENCESREFERENCES• American Association of Nurse Anesthetist Website. Retrieved
January 10 2009 @January 10, 2009 @ http://www.aana.com/BecomingCRNA.aspx?ucNavMenu_TSMenuTargetID=18&ucNavMenu_TSMenuTargetType=4&ucNavMenu_TSMenuID=6&id=1018.
• Babineau, T., J., Becker, J., Gibbons, G., Sentovich, S., Hess, D., Robertson, S., and Stone, M., (2004). The 鼎ost of Operative Training for Surgical Residents. Archives of Surgery,Operative Training for Surgical Residents. Archives of Surgery, 139, 366-370.
• Bierstein, K., (2002). Survey of Hospital Administrators About A th i C A i S i t f A th i l i tAnesthesia Coverage. American Society of Anesthesiologists Newsletter, September, (66), 9. ASA Website. Retrieved January 12, 2009 @ http://www.asahq.org/Newsletters/2002/9 02/pract 0902.htmp q g _ p _

ReferencesReferencesBridges, M., and Diamond, D.,L., (1999). The Financial Impact
of Teaching Surgical Residents in the Operating Roomof Teaching Surgical Residents in the Operating Room. American Journal of Surgery,177, 28-32.
Coalition for Nurses in Advance Practice, (2009). Advanced , ( )Practice Nurses: A Focused, Less Expensive Education Equals, High Value Provider. CNAP. Website. Retrieved January 11, 2009 @ http://www cnaptexas org/apn/whatis asp#researchhttp://www.cnaptexas.org/apn/whatis.asp#research
Kaufmann, T., Schuepfer, G., and Konrad, C., J., (2008). Factors Influencing Anesthesia Induction Time- Is There a gRole of Teaching and Case Urgency? ASA Annual Meeting Abstracts, Anesthesiology, 109, A137.

ReferencesKheterpal, S., Tremper, K., Shanks, A., and Morris,
M., (2009). Six-Year Follow-Up on Work Force , ( ) pand Finances of the United States Anesthesiology Training Programs: 2000 to 2006. Anesthesia & Analgesia 108 263-272Analgesia,108, 263-272.
Kuttner, R., (2008). Market-based Failure - A Second Opinion on U.S. Health Care Costs. New England Journal of Medicine, 358(6), 549-551.
Lema, M., J., (2003). Ventilations: Safe Anesthetic Practice Fact Fantasy or Folly? AmericanPractice – Fact, Fantasy or Folly? American Society of Anesthesiologists Newsletter, 67,6. ASA Website. Retrieved January 30, 2009 @
// / / / /http://www.asahq.org/Newsletters/2003/06_03/ventilations06_03.html.

ReferencesReferencesLuchsinger, J., and Pexton, C., (2004). HRO is Key Concept for
Health Care Anesthesia Patient Safety FoundationHealth Care.Anesthesia Patient Safety Foundation Newsletter, summer, 2004. APSF Website. Retrieved January 30, 2009 @ http://www.apsf.org/resource_center/newsletter/2004/sumer/11hro.htm
Sperry, R., (1997). Principles of Economic Analysis. Anesthesiology, May, 86(5), 1197-1205.
Stevens, K. R., (2004). ACE Star Model of EBP: Knowledge Transformation. Academic Center forEvidence-based Practice. The University of Texas Health Science Center at San Antonio Website Retrieved Jan 12 2008 @San Antonio. Website. Retrieved Jan 12, 2008 @ www.acestar.uthscsa.edu
Tremper, K., Shanks, A., Morris, M., (2007). Five-year follow-up on the work force and finances of United Stateson the work force and finances of United States anesthesiology training programs: 2000 to 2005. Anesthesia & Analgesia, 104, 863–868.