Cost Effective Reuse of Produced Water In the … · Cost Effective Reuse of Produced Water In the...
23
Cost Effective Reuse of Produced Water In the Permian Basin Oil & Gas Environmental Conference Dallas, TX December, 2013 Steve Jester , Sr. Principal Environmental Engineer ConocoPhillips With Credit to: Ramesh Sharma, Staff Process Engineer, ConocoPhillips Austin Shields, Associate Completions Engineer, ConocoPhillips
Transcript of Cost Effective Reuse of Produced Water In the … · Cost Effective Reuse of Produced Water In the...

Cost Effective Reuse of Produced Water
In the Permian Basin
Oil & Gas Environmental Conference Dallas, TX
December, 2013
Steve Jester, Sr. Principal Environmental Engineer ConocoPhillips
With Credit to:
Ramesh Sharma, Staff Process Engineer, ConocoPhillips
Austin Shields, Associate Completions Engineer, ConocoPhillips

ConocoPhillips’ Corporate Water Sustainability Position:
As a responsible global energy company committed to sustainable development, we recognize that fresh water is an essential natural resource for communities, businesses, and ecosystems. Global population growth will increase demand for fresh water and all users – domestic, agriculture, and industry – will need to effectively manage supplies to meet demands. ConocoPhillips produces and utilizes water in its operations. We are committed to the development of water management practices that conserve and protect fresh water resources and enhance the efficiency of water utilization at our facilities. We will assess, measure, and monitor our fresh water usage and based on these assessments we will manage our consumption and strive to reduce the potential impact to the environment from wastewater disposal.

Water Life Cycle - Value Chain
Fresh Water
Flowback/ Produced
Water
Sources
Disposal
Logistics Uses
Drilling and Completions Transport
Treatment Treated
Produced Water
Storage
Storage
Transport
Non-fresh Water

Water Management in Hydraulic Fracturing – The Dilemma!
4
Need 50,000 to 100,000 bbls of water for drilling and completion Wells produce <100% water after completion Each step in the water life cycle comes with a cost Is reuse the best alternative? Availability, quality and logistics are key issues
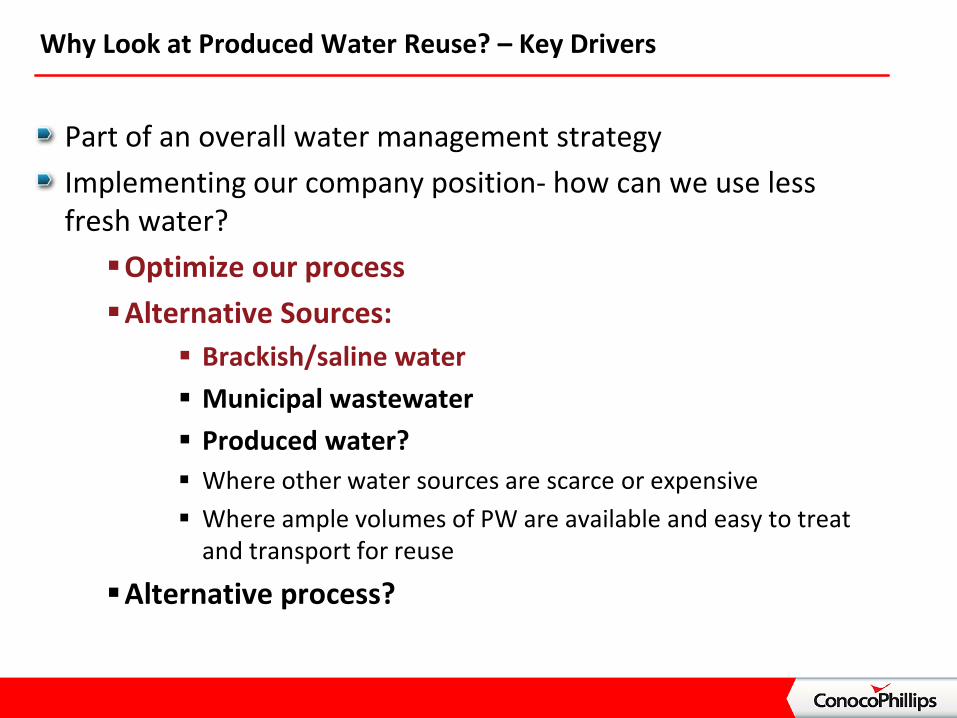
Why Look at Produced Water Reuse? – Key Drivers
Part of an overall water management strategy Implementing our company position- how can we use less fresh water? Optimize our process Alternative Sources:
Brackish/saline water Municipal wastewater Produced water? Where other water sources are scarce or expensive Where ample volumes of PW are available and easy to treat
and transport for reuse
Alternative process?
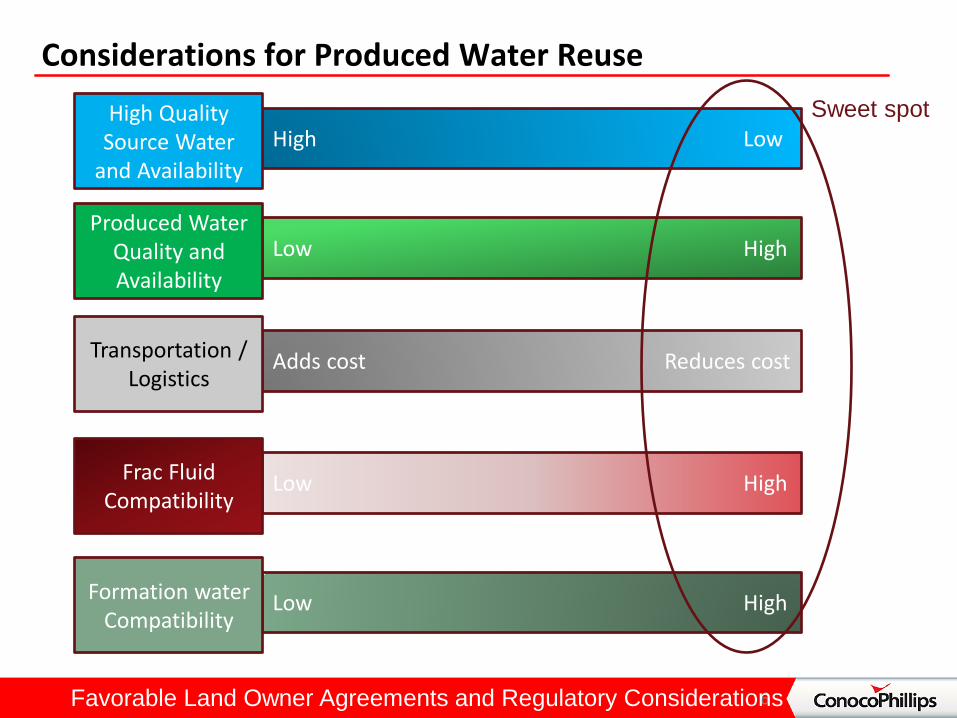
Considerations for Produced Water Reuse
6
Low High Produced Water
Quality and Availability
High Low High Quality
Source Water and Availability
Adds cost Reduces cost Transportation / Logistics
Low High Frac Fluid Compatibility
Low High Formation water Compatibility
Sweet spot
Favorable Land Owner Agreements and Regulatory Considerations
7
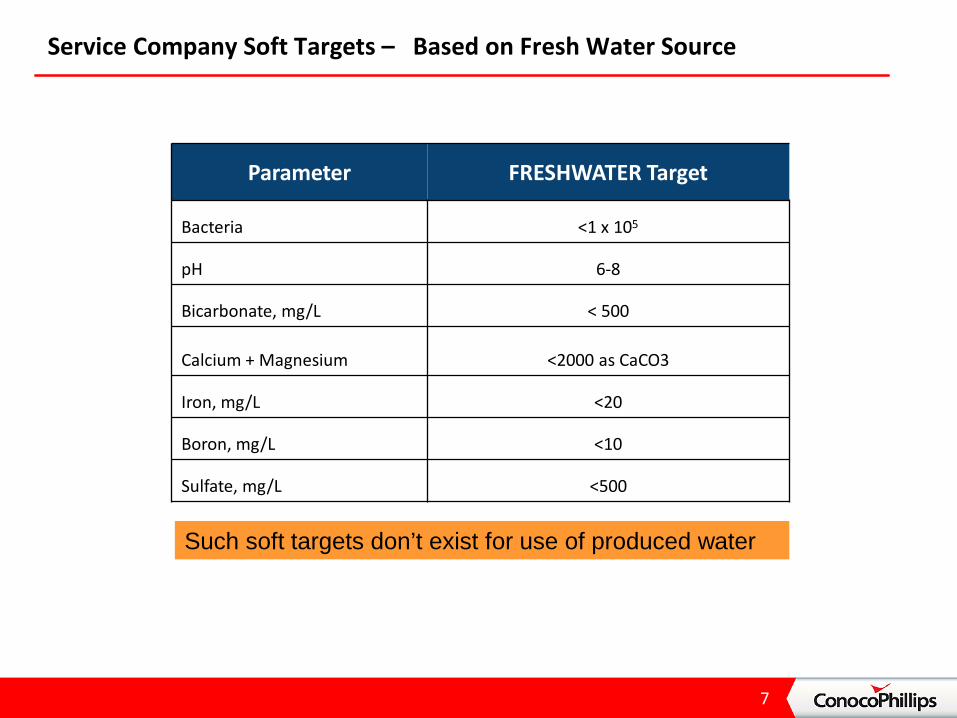
Service Company Soft Targets – Based on Fresh Water Source
Parameter FRESHWATER Target
Bacteria <1 x 10⁵
pH 6-8
Bicarbonate, mg/L < 500
Calcium + Magnesium <2000 as CaCO3
Iron, mg/L <20
Boron, mg/L <10
Sulfate, mg/L <500
Such soft targets don’t exist for use of produced water

pH
Ferric iron (Fe+3)
Ferrous iron (Fe+2)
Total hardness
Magnesium (Mg+2)
Calcium (Ca+2)
Specific gravity
Chlorides (Cl-)
Carbonate (CO3-2)
Bicarbonate (HCO-3)
Sulfate (SO4-2)
Phosphate (PO4-3)
Silica (SI+4)
Boron (B+3)
Total dissolved solids (TDS)
Total suspended solids (TSS)
Bacteria
Water Quality Impacts on Fracturing Fluids
Total Fe >25 ppm Impacts hydration and thermal stability of polymer. Dilute or dump.
Cl- New CMC systems are intolerant
Interferes with buffers in crosslink systems. Some friction reducers are prone to precipitation.
SO4-2 >200 ppm Interferes with delayed
metallic crosslinkers. High temperature thermal stability also impacted. Precipitate out.
HCO3-1 >600 ppm
Requires pH adjustment for polymer hydration. Impacts Zr crosslinkers (delay and/or stability)
SI-4 Interferes metallic crosslinkers. PO4-3 ties of metallic
crosslinkers. Reduces fluid performance.
Too High > 9.0 poor hydration. Too Low < 6.0 poor dispersion.
Degradation of Organic Polymers Even after the bacteria have been killed their enzymes are still problematic
B >4 ppm can cause crosslinking in guar gelling agents.
Typical ionic species identified and quantified in source water analysis.
Nearly every produced water will push these limits
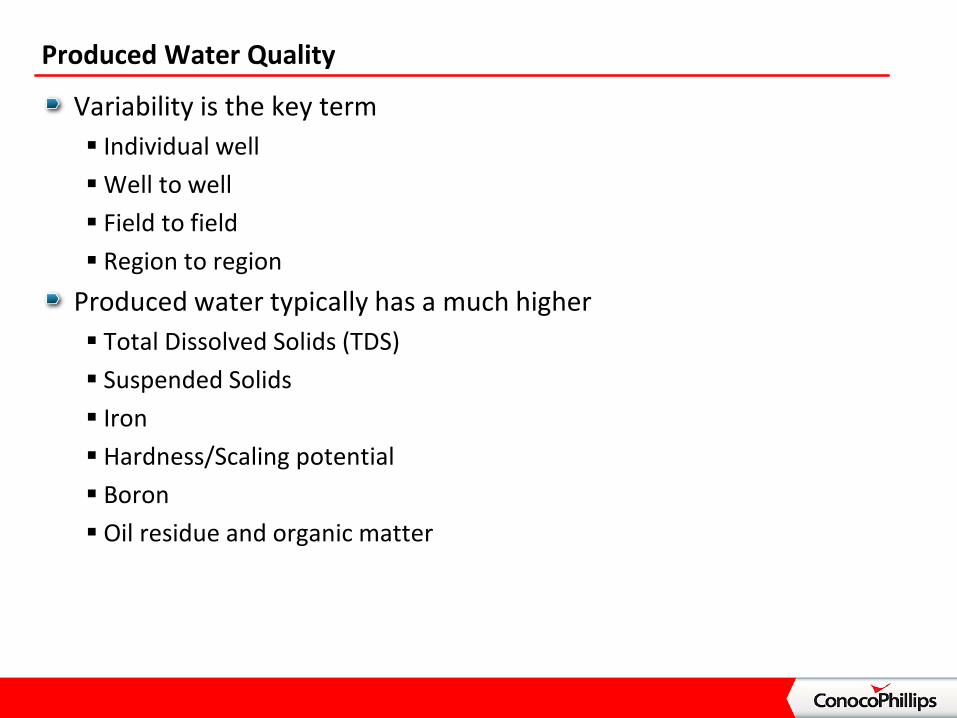
Produced Water Quality
Variability is the key term Individual well Well to well Field to field Region to region
Produced water typically has a much higher Total Dissolved Solids (TDS) Suspended Solids Iron Hardness/Scaling potential Boron Oil residue and organic matter

West Texas Water Management Challenges Fresh water constraints compounded by drought Purchase and Transportation costs for water sourcing Produced water locally available, but > 400 ppm H2S >1000 ppm oil (periodic)
10
Tank Battery, 7000 bwpd capacity Produced water

Laboratory to Field Implementation: Treatability Testing
11
Produced water: 400 ppm H2S Rxn with Peroxide Scavenger Elemental Sulfur
Right to Left: Unfiltered sample, 10 micron filtered, and 5 micron filtered
Right to Left: 10 micron filter, 5 micron filter
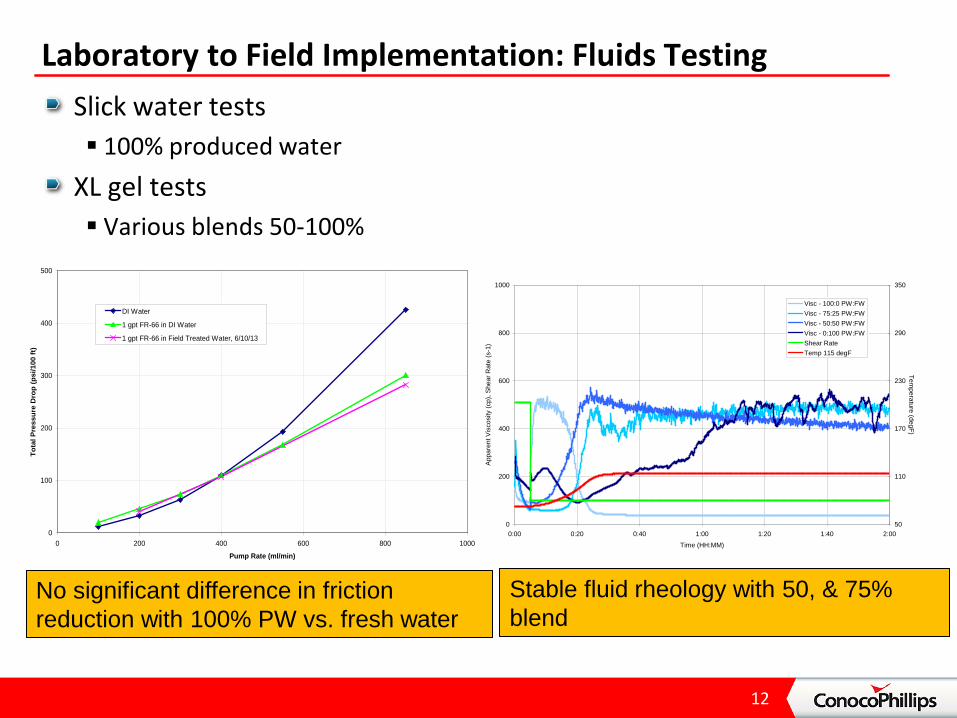
Laboratory to Field Implementation: Fluids Testing Slick water tests 100% produced water
XL gel tests Various blends 50-100%
12
0
100
200
300
400
500
0 200 400 600 800 1000
Pump Rate (ml/min)
Tota
l Pre
ssur
e D
rop
(psi
/100
ft)
DI Water
1 gpt FR-66 in DI Water
1 gpt FR-66 in Field Treated Water, 6/10/13
No significant difference in friction reduction with 100% PW vs. fresh water
Stable fluid rheology with 50, & 75% blend
0
200
400
600
800
1000
0:00 0:20 0:40 1:00 1:20 1:40 2:00
Time (HH:MM)
Appa
rent
Vis
cosi
ty (c
p), S
hear
Rat
e (s
-1)
50
110
170
230
290
350
Temperature (degF)
Visc - 100:0 PW:FWVisc - 75:25 PW:FWVisc - 50:50 PW:FWVisc - 0:100 PW:FWShear RateTemp 115 degF

Formation Water Compatibility, and Biological Control
Parameter Untreated Treated
Calcium 2160 2000
Magnesium 826 1166
Sodium 20,026 17,353
Barium 0 0
Chloride 35,500 31,950
Bicarbonate 915 329
Sulfate 1470 2120
TDS 60,897 56,662
Oil and grease
139-1000 42-148
H2S 400-450 <0.5
13
Ionic composition did not change significantly. No formation water compatibility issues identified
Parameter Untreated CFU/mL
Treated CFU/mL
Acid Producing Bacteria
10-1000 0
Sulfate Reducing Bacteria
10-1000 0
General Heterotrophy Bacteria
1-10 0
- PW treatment and biocide program was effective - No re-appearance seen after five days

Test Location
14
Central Tank Battery
Well 2
Well 1

Pilot Execution
15
Reaction (2x 500 bbl frac tank)
Solids Removal
Containment Pad Transfer
Flow back/produced water
Containment (frac tanks)
Oxidant addition Residual oxidant scavenging
Biocide
Feed Reaction tanks
5 um bag filter
Chemical pumps Hydrogen peroxide
H2S removed as element sulfur
Treated water tanks
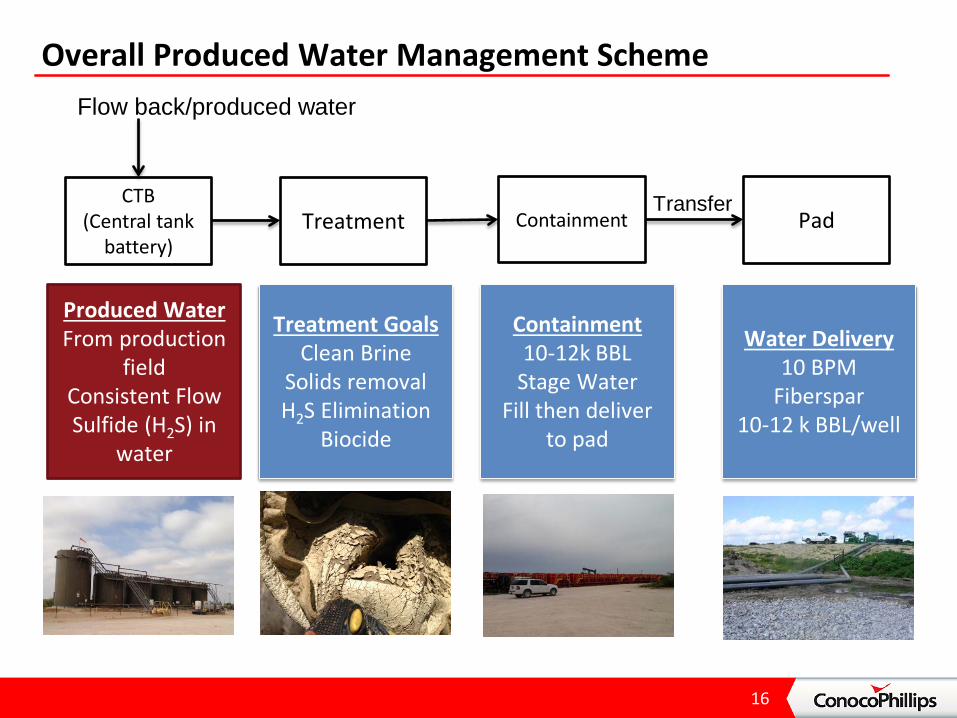
Overall Produced Water Management Scheme
16
CTB (Central tank
battery) Treatment Containment Pad
Transfer
Produced Water From production
field Consistent Flow Sulfide (H2S) in
water
Treatment Goals Clean Brine
Solids removal H2S Elimination
Biocide
Containment 10-12k BBL
Stage Water Fill then deliver
to pad
Water Delivery 10 BPM
Fiberspar 10-12 k BBL/well
Flow back/produced water
Containment

Completion: Vertical Well Stimulation
Surface TD 1,120
Stg 4 20# Borate XL
Stg 3 20# Borate XL
Stg 2 Slick Water
Stg 1 Slick Water
TD 7,500
FORMATION DEPTHS TVD
Vertical Well 4 stage frac
Frac Fluid

Stage-wise Progression
18
Bench Scale
• Due-diligence performed • Identified the treatment scheme
Pilot
Single stage 5000 BBL
• Well 1: Stg # 3 - 100% Slick Water; Stg # 4 -20% blend XL gel
Demonstration
All 4 stages 8300 BBL
• Well 2: Stg # 1 & 2-100% Slick Water; Stg 3&4: 50% blend XL gel
Reduced fresh water consumption for a vertical well by 75%
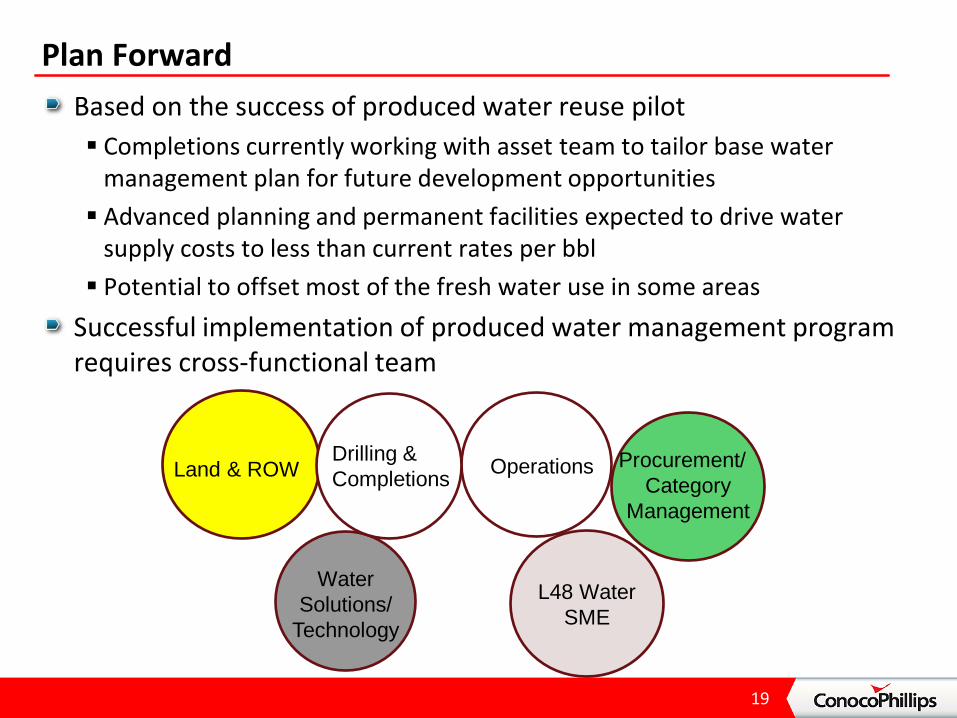
Plan Forward Based on the success of produced water reuse pilot Completions currently working with asset team to tailor base water
management plan for future development opportunities Advanced planning and permanent facilities expected to drive water
supply costs to less than current rates per bbl Potential to offset most of the fresh water use in some areas
Successful implementation of produced water management program requires cross-functional team
19
Drilling & Completions Operations Procurement/
Category Management
L48 Water SME
Water Solutions/
Technology
Land & ROW

Key Results “Fit-for-purpose” treatment scheme implemented H2S removal + microbial inactivation + suspended solids removal No changes to ionic composition (salinity remained same) Produced water going to same formation, so no compatibility issues
identified Demonstrated that produced water reuse with minimal treatment is possible for these vertical well completions The developed treatment scheme is cost effective and easily scalable Potential to offset more than 75% fresh water consumption for most
vertical jobs Completions program is now tied to water management plan Lower water supply costs, less environmental impact, no trucking Improved operational efficiency – locally abundant resource
Potential game-changer for horizontal well fracturing program
20

Questions?

Backup Slides

Challenge High Oil Content
23
Oil remaining in tanks after skimming
Vacuum pump to skim the oil