Cost Effective Muni Broadband Design
33
Cost Effective Muni Broadband Feasibility Studies Broadband Consulting Firms generally provide useless white paper service availability & demographics data Richard Frank 518-491-7768 email: [email protected] OSP Design & Construction Mapping analyzes the data to plan optimal routes between target locations , estimate actual construction costs to determine if there is a business case
-
Upload
rich-frank -
Category
Internet
-
view
381 -
download
0
Transcript of Cost Effective Muni Broadband Design

Cost Effective Muni Broadband Feasibility Studies
Broadband Consulting Firms generally provide useless
white paper service availability & demographics data
Richard Frank 518-491-7768 email: [email protected]
OSP Design & Construction
Mapping analyzes the data to plan optimal routes between target locations , estimate actual construction costs to determine if there is a business case

Service Provider data factored into route planning

Look at Overall Wire line and Wireless Service Availability

GIS spatial data determines areas lacking access

Existing Businesses within 1000 ft. of proposed fiber routes

(GPON) Gigabit Passive Optical Network Architecture is a cost effective design solution
Gigabit Ethernet FTTH configurations use the least amount of electronics and Outside Plant equipment and are the most cost effective to deploy and operate. Below are two of the most common deployment strategies
An efficient FTTH Gigabit Ethernet Ring (E-Ring)
FTTH Gigabit Ethernet deployment is a Point to Point Ethernet network.

Factor in Network Equipment Cost Per Premises
Equipment cost per home passed and per connection (FTTx/VDSL will be $250.00 and FTTH/GPON will be $150.00), Based on 2014 cost of equipment. We assume a 5% annual reduction in unit costs of GPON equipment. We expect the cost per premises passed for FTTC/VDSL and FTTB/VDSL to rise. GPON budget assumes 30% of households to commit to service before rollout starts. Below chart illustrates cost per premises (USD) FTTC/VDSL pass FTTB/VDSL pass FTTx/VDSL connect FTTH/GPON pass FTTH/GPON connect

Fiber Design Efficiencies cost savings
1. Drive teams dispatched to drive up and
down streets in a target area to determine
Aerial vs. Underground construction
2. Drive teams sketch proposed routes and
send to CAD to create prelim field
drawings, usually takes weeks to convert
field notes to actual drawings for the field
3. After prelim route drawings created in
CAD drive teams re dispatched to collect
pole data & construction details for CDs
4. Field data collected sent in to complete
pole applications, ROW permits and to
the CAD Dept. to create a set of actual
Construction Drawings
1. Aerial vs. Underground assessment
completed via raster images embedded in
GIS mapping takes days vs. weeks or
months
2. Route drawings are created in mapping as
part of the assessment process. A few clicks
and you print scaled field drawings for
survey teams.
3. The scaled GIS drawings go to the field so
teams can collect pole data & verify
underground constructability.
4. Field data can be collected and input
electronically to create CDs. Mapping
utilities can auto complete pole
applications, determine municipalities to
contacted for permits.
Traditional Method Our Approach

Aerial & Underground Fiber Build Cost Synopsis
Some communications providers have excess fiber strands. Fiber count in cables ranges from 6 to 24 near residences and individual businesses to more than 1,000 on backbone routes. The cost of a 6-count fiber cable is $2,000 per mile, while an 864-count cable is $50,000 per mile, implying a marginal cost of approximately $50 per fiber per mile. Actual costs for fiber purchase or lease, of course, reflect market costs and depend on the total availability of fiber over the route–and are thus, typically, considerably higher; however, fiber lease or purchase may be a serious consideration over routes where construction is difficult or costly and considerable fiber has already been installed (e.g., river crossings, tunnels).
Aerial Versus Underground Typical construction is a mixture of aerial and underground techniques. Aerial construction can be completed for $20,000 per mile. Aerial construction may be more expensive when poles are crowded or when the utility pole owner charges high rates for access. Worst-case costs can be $100,000 per mile (which usually would lead a network owner to build underground or over another route). Underground construction also has a wide cost range. In areas where restoration is not important and long continuous runs are possible (e.g., rural areas, in dirt, on the side of interstate roads), “plowing” the fiber into the ground is an inexpensive option— approximately $40,000 per mile. In more built-up areas, directional boring is necessary, because it is less destructive to the right-of-way and requires less restoration. Boring is more expensive, approximately $60,000 to $100,000 per mile. Boring also limits the amount of cable and conduit that can be built. (Two 2-inch conduit is a typical limit, corresponding to four medium-sized fiber optic cables.)

Drawings created in GIS mapping software. Right of Way, Geography and
Demographic Spatial data is imported and analyzed to make the business case.
Please note the elaborate geocompression analytical tools in the drop down window
A few clicks and we print scaled field drawings for teams to drive.

Aerial vs. Underground route assessments are completed using embedding Raster
images translucently in the background of our GIS mapping software. Screen shot below shows a mile high view of a given target area. GIS designs eliminates the need for field teams driving every road in
the area to see if poles exist on streets for aerial route planning. Red dots are poles for aerial placement, blue dots are vault
placements for underground routes (purple lines).

Screenshot below is zoomed into the center of previous mile high Raster imagery view.
Designing in a virtual world significantly reduces overall engineering time and cost. How we use imagery to find existing poles for aerial cable routing.
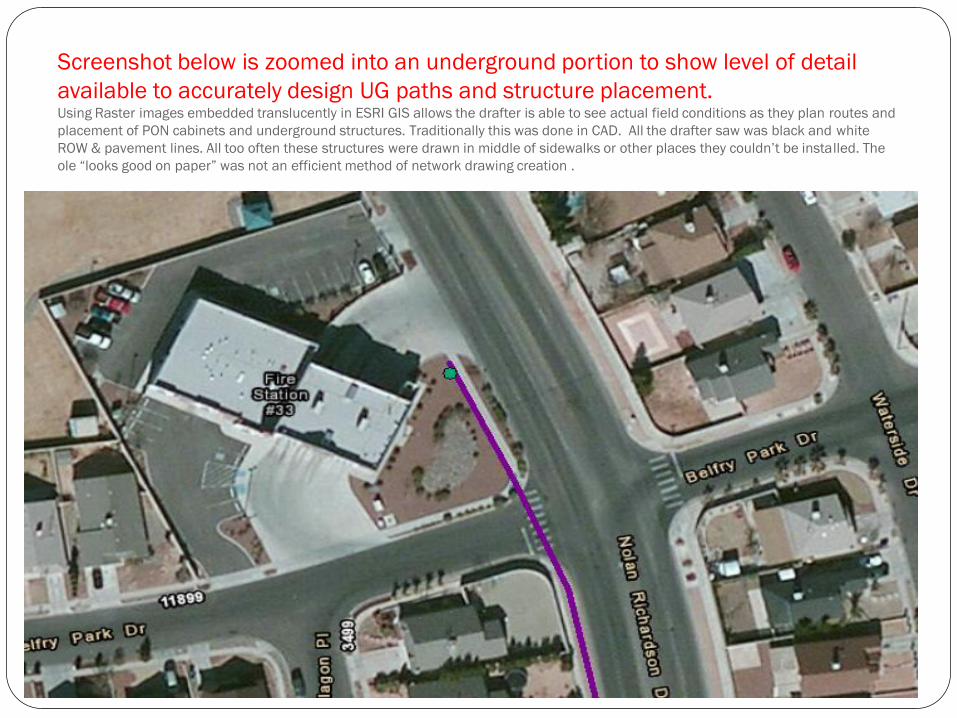
Screenshot below is zoomed into an underground portion to show level of detail
available to accurately design UG paths and structure placement. Using Raster images embedded translucently in ESRI GIS allows the drafter is able to see actual field conditions as they plan routes and
placement of PON cabinets and underground structures. Traditionally this was done in CAD. All the drafter saw was black and white
ROW & pavement lines. All too often these structures were drawn in middle of sidewalks or other places they couldn’t be installed. The
ole “looks good on paper” was not an efficient method of network drawing creation .

Below depicts how we use Google Earth or Bing street view feature to conduct a
virtual survey of planned routes. In doing so we assess the extent of aerial make
ready and identify UG constructability issues. Note this street is very light make ready (only one cable attached) and has existing UG fiber. You can see the fiber
optic cable marker post.
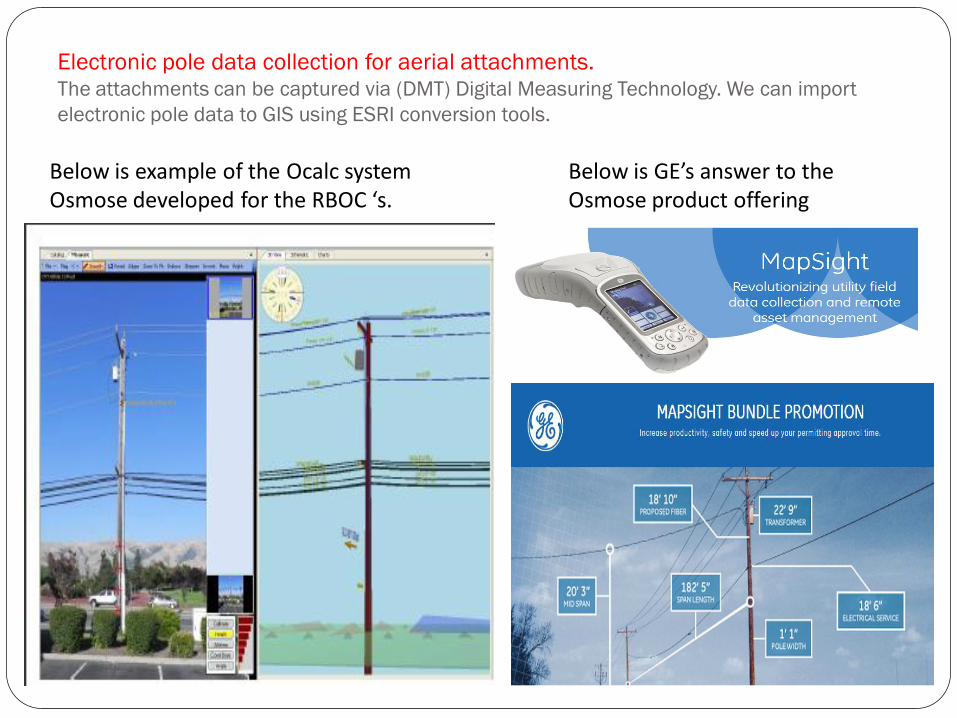
Electronic pole data collection for aerial attachments. The attachments can be captured via (DMT) Digital Measuring Technology. We can import
electronic pole data to GIS using ESRI conversion tools.
Below is example of the Ocalc system Osmose developed for the RBOC ‘s.
Below is GE’s answer to the Osmose product offering
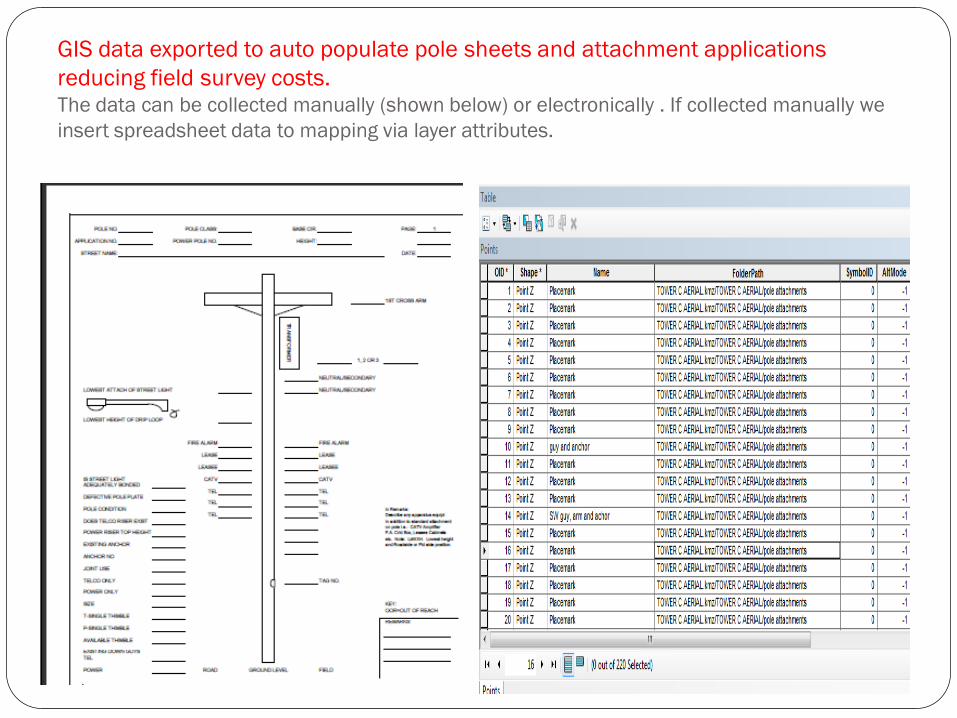
GIS data exported to auto populate pole sheets and attachment applications
reducing field survey costs. The data can be collected manually (shown below) or electronically . If collected manually we
insert spreadsheet data to mapping via layer attributes.

GIS mapping utilities also determine municipalities, agencies and pole owners to be
contacted for cable attachments, ROW, zoning and permitting.
Below is a sample Pole Attachment Application
Below is a typical neighborhood demographic shown in spatial data

Screenshot below is of GIS data exported to Google Earth. Google Earth is
available via free download. Is user friendly allowing us to publically share
mapping designs with stakeholders and the general public alike.

Remaining Slides are representative of
source data analyzed for route selections Below cover sheet from our NYS Rural Broadband Case Study


State of New York
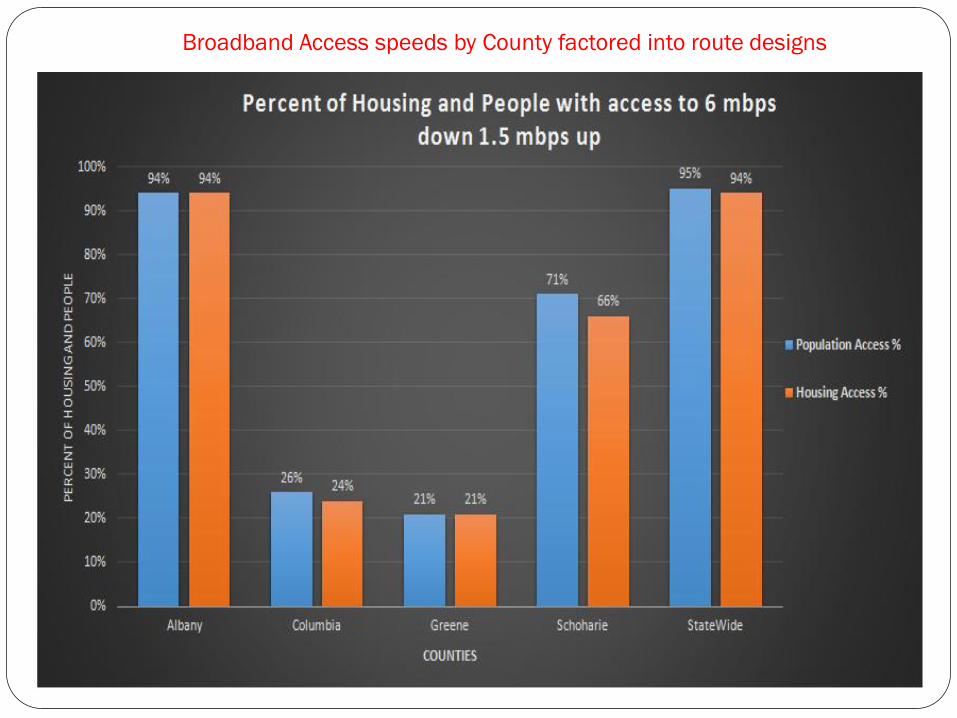
Broadband Access speeds by County factored into route designs

Broadband Access Demographics

Columbia County Supporting Charts

Columbia County Supporting Charts

Albany County Supporting Charts

Albany County Supporting Charts

Greene County Supporting Charts

Schoharie County Supporting Charts
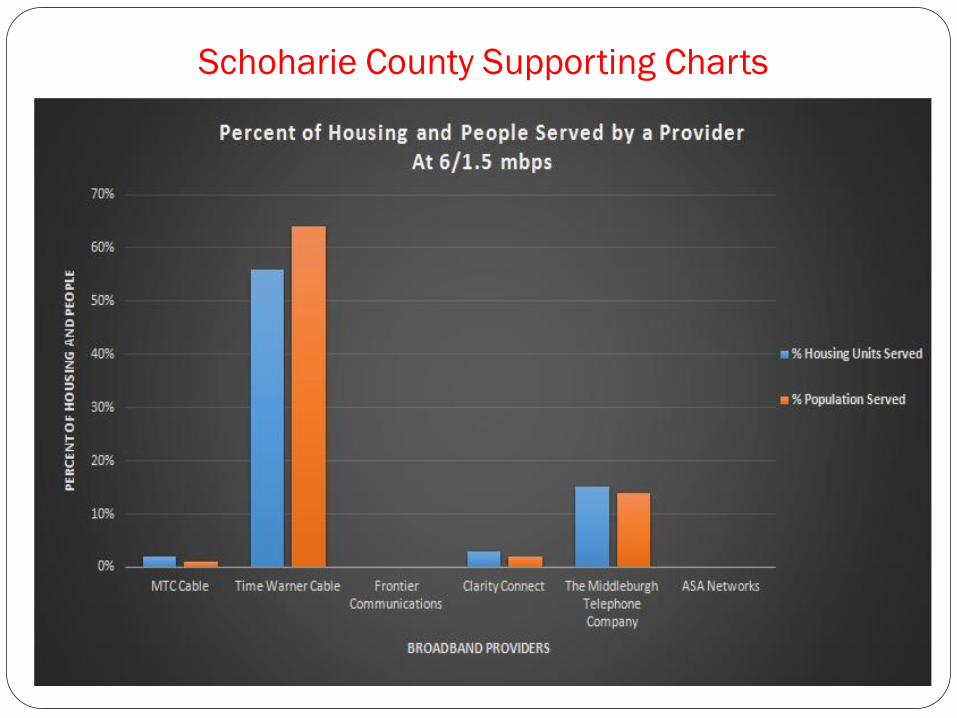
Schoharie County Supporting Charts

Income levels are also factored into route designs