Cost Cutting Has Emerged as a Focus of Lender...
13
© 2018 Fannie Mae. Trademarks of Fannie Mae. 1 Cost Cutting Has Emerged as a Focus of Lender Competitiveness Economic and Strategic Research (ESR) Published June 21, 2018
Transcript of Cost Cutting Has Emerged as a Focus of Lender...
© 2018 Fannie Mae. Trademarks of Fannie Mae. 1
Cost Cutting Has Emerged as a Focus of Lender
Competitiveness
Economic and Strategic Research (ESR)
Published June 21, 2018

© 2018 Fannie Mae. Trademarks of Fannie Mae. 2
Disclaimer
Opinions, analyses, estimates, forecasts, and other views of Fannie Mae's Economic & Strategic Research (ESR) group or survey respondents included in these materials should not be construed as indicating Fannie Mae's business prospects or expected results, are based on a number of assumptions, and are subject to change without notice. Howthis information affects Fannie Mae will depend on many factors. Although the ESR group bases its opinions, analyses, estimates, forecasts, and other views on information it considers reliable, it does not guarantee that the information provided in these materials is accurate, current, or suitable for any particular purpose. Changes in the assumptions or the information underlying these views could produce materially different results. The analyses, opinions, estimates, forecasts, and other views published by the ESR group represent the views of that group or survey respondents as of the date indicated and do not necessarily represent the views of Fannie Mae or its management.
Q2 2018 Mortgage Lender Sentiment Survey®

© 2018 Fannie Mae. Trademarks of Fannie Mae. 3
Cost Cutting Has Emerged as a Focus of Lender Competitiveness.
Housing Employment
Mortgage industry payrolls are
trending sideways, although they
were elevated in April, and may
be approaching the cyclical
peak.
Lenders view “collecting borrower information”
and “ensuring property value” as the top
opportunity areas for efficiency gains.
Business Priorities to Improve or Maintain Competitiveness
“Cost cutting” jumped from the second least important
business priority last year to the third most important priority
this year.
“Consumer-facing technology,” “business process
streamlining,” and “cost cutting” are lenders’ top business
priorities in that order for 2018 to improve or maintain
competitiveness.
• Purchase mortgage applications fell every week in May, sending the average monthly
volume 2.9 percent below April’s average reading.
• Mortgage rates have risen about 80 basis points since September 2017, pushing
refinance activity down sharply.
• The for-sale inventory of existing homes has remained below the year-ago level for
nearly three years.
• The industry average profit margin is negative for Q1 2018, with pre-tax production
losses of 8 basis points (a loss of $118 on each loan originated).*
Market Environment
* Source: MBA Quarterly Mortgage Bankers Performance Report https://www.mba.org/publications/insights/articles/current-issue/mba-chart-of-the-
week-imb-production-profit-and-volume?_zs=84rwB1&_zl=iIJV4
• Year-to-date existing home sales through April were 0.7 percent
below the level during the same period last year.
• Pending home sales declined 2.1 percent on an annual basis in
April, marking the fourth consecutive year-over-year drop.
Executive Summary
© 2018 Fannie Mae. Trademarks of Fannie Mae. 4
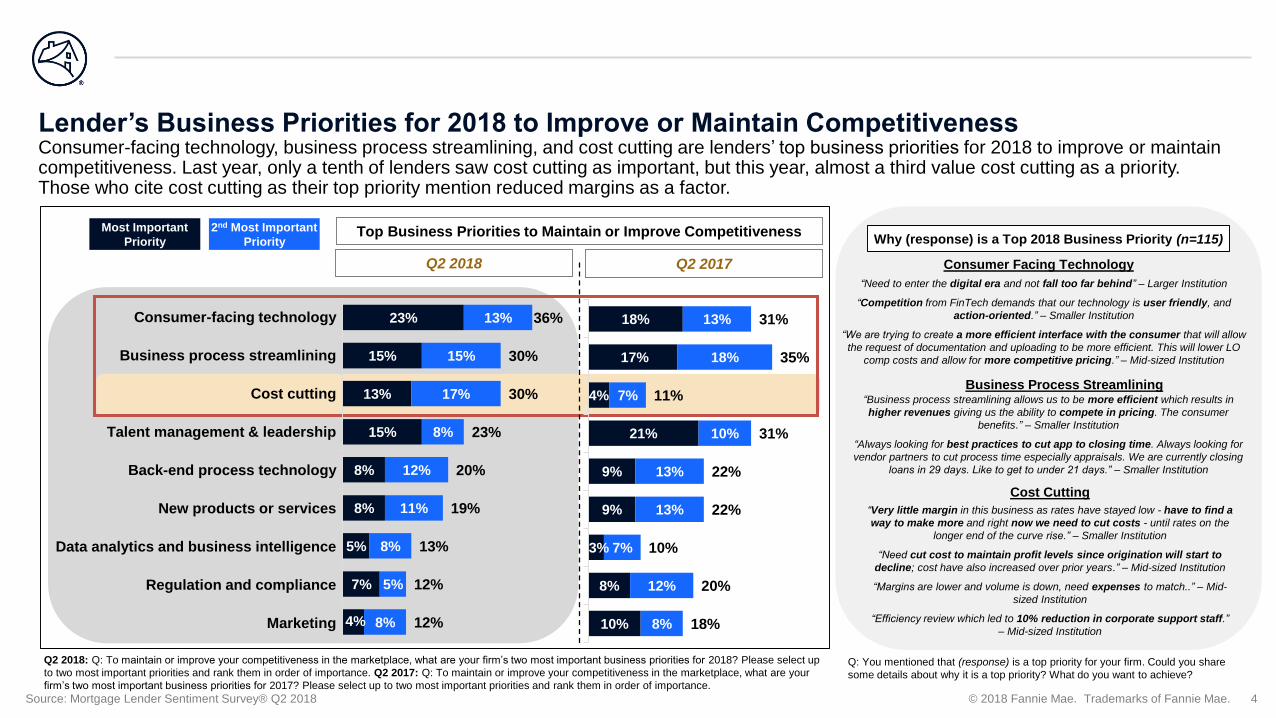
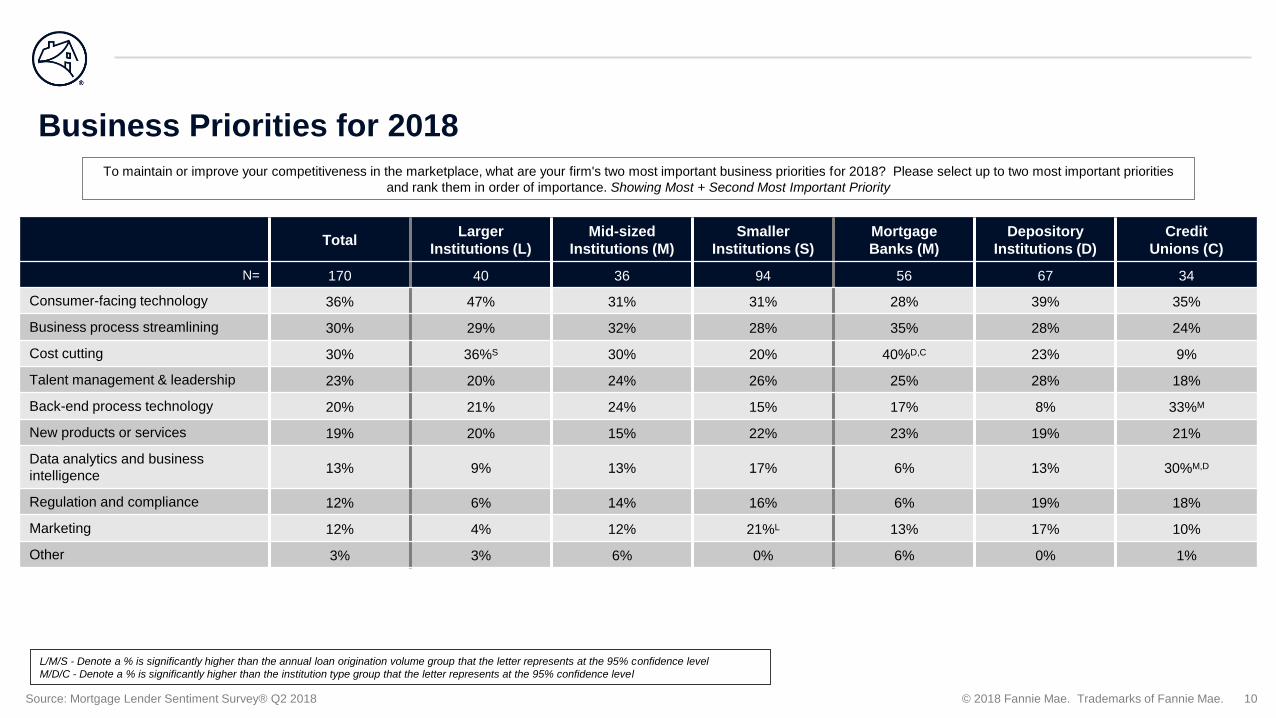
Lender’s Business Priorities for 2018 to Improve or Maintain CompetitivenessConsumer-facing technology, business process streamlining, and cost cutting are lenders’ top business priorities for 2018 to improve or maintain competitiveness. Last year, only a tenth of lenders saw cost cutting as important, but this year, almost a third value cost cutting as a priority. Those who cite cost cutting as their top priority mention reduced margins as a factor.
Q2 2018: Q: To maintain or improve your competitiveness in the marketplace, what are your firm’s two most important business priorities for 2018? Please select up
to two most important priorities and rank them in order of importance. Q2 2017: Q: To maintain or improve your competitiveness in the marketplace, what are your
firm’s two most important business priorities for 2017? Please select up to two most important priorities and rank them in order of importance.
Source: Mortgage Lender Sentiment Survey® Q2 2018
Q2 2018
Most Important
Priority
2nd Most Important
Priority
Consumer-facing technology
Business process streamlining
Cost cutting
Talent management & leadership
Back-end process technology
New products or services
Data analytics and business intelligence
Regulation and compliance
Marketing
Why (response) is a Top 2018 Business Priority (n=115)
Business Process Streamlining
Consumer Facing Technology
Cost Cutting
18%
17%
4%
21%
9%
9%
3%
8%
10%
13%
18%
7%
10%
13%
13%
7%
12%
8%
31%
35%
11%
31%
22%
22%
10%
20%
18%
Q: You mentioned that (response) is a top priority for your firm. Could you share
some details about why it is a top priority? What do you want to achieve?
“Business process streamlining allows us to be more efficient which results in
higher revenues giving us the ability to compete in pricing. The consumer
benefits.” – Smaller Institution
“Always looking for best practices to cut app to closing time. Always looking for
vendor partners to cut process time especially appraisals. We are currently closing
loans in 29 days. Like to get to under 21 days.” – Smaller Institution
Q2 2017
“Very little margin in this business as rates have stayed low - have to find a
way to make more and right now we need to cut costs - until rates on the
longer end of the curve rise.” – Smaller Institution
“Need cut cost to maintain profit levels since origination will start to
decline; cost have also increased over prior years.” – Mid-sized Institution
“Margins are lower and volume is down, need expenses to match..” – Mid-
sized Institution
“Efficiency review which led to 10% reduction in corporate support staff.”
– Mid-sized Institution
“Need to enter the digital era and not fall too far behind” – Larger Institution
“Competition from FinTech demands that our technology is user friendly, and
action-oriented.” – Smaller Institution
“We are trying to create a more efficient interface with the consumer that will allow
the request of documentation and uploading to be more efficient. This will lower LO
comp costs and allow for more competitive pricing.” – Mid-sized Institution
Top Business Priorities to Maintain or Improve Competitiveness
23%
15%
13%
15%
8%
8%
5%
7%
4%
13%
15%
17%
8%
12%
11%
8%
5%
8%
36%
30%
30%
23%
20%
19%
13%
12%
12%

© 2018 Fannie Mae. Trademarks of Fannie Mae. 5
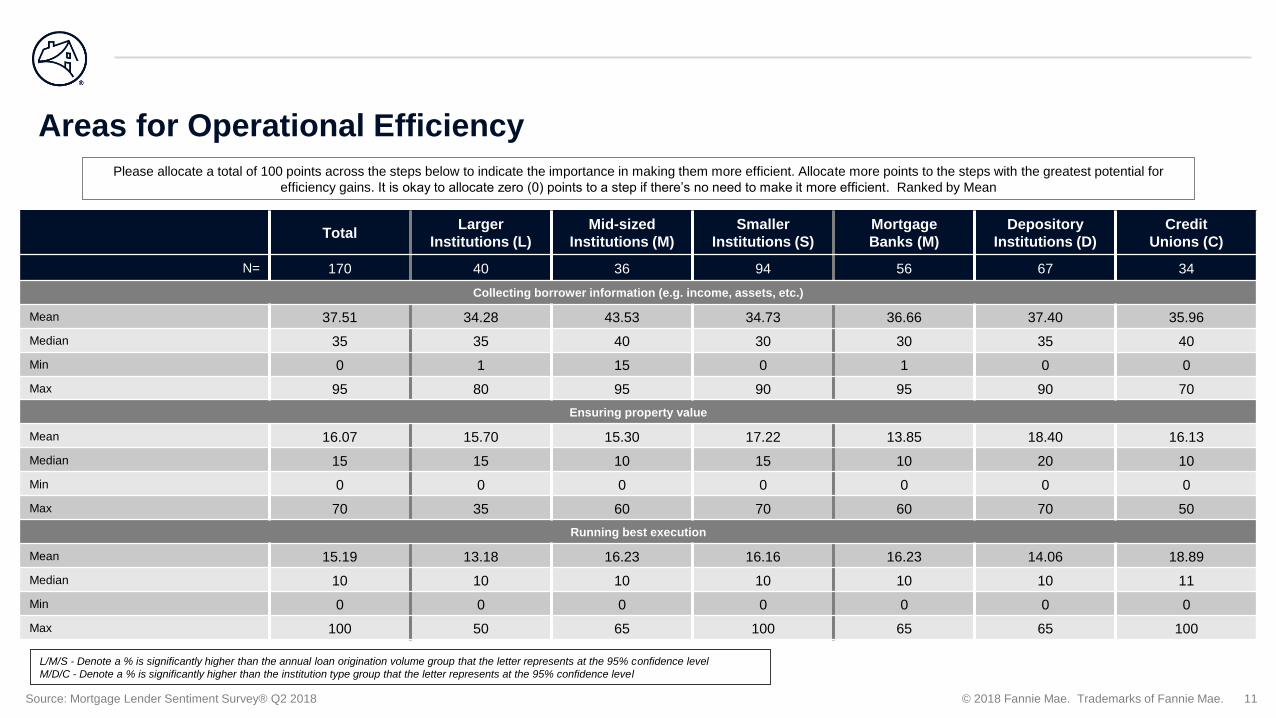
Efficiency Gains That Can be Made in the Mortgage ProcessLenders view “collecting borrower information” and “ensuring property value” as the top opportunity areas for efficiency gains. Insurance-related areas are viewed as less critical.
Q: Operational efficiency has been a top priority for many lenders. Listed below are some steps of the mortgage origination and delivery process. Which steps are your firm’s biggest pain points and represent the biggest opportunities for efficiency
gains? Please allocate a total of 100 points across the steps below to indicate the importance in making them more efficient. Allocate more points to the steps with the greatest potential for efficiency gains. It is okay to allocate zero (0) points to a step
if there’s no need to make it more efficient.
35
15
10 10
5 5 5
Collecting borrowerinformation (e.g.
income, assets, etc.)
Ensuring propertyvalue
Running best execution Collecting anddelivering loan
documents to investors
Obtaining and ensuringclear title
Confirming adequatehazard insurance
Obtaining mortgageinsurance
Where do Lenders think Efficiency Gains can be made in the Mortgage Origination and Delivery Process?Showing Median amount of points allocated per category from distributing 100 points across the categories below
Source: Mortgage Lender Sentiment Survey® Q2 2018
© 2018 Fannie Mae. Trademarks of Fannie Mae. 6
86
75
38
9
-8
46
42
32
60
67
55
22
33
73 74
24
10
46
40
9
-8
-20
0
20
40
60
80
100
'13 '14 '15 '16 '17 '18
Pre-Tax Production Profit (bps per loan)
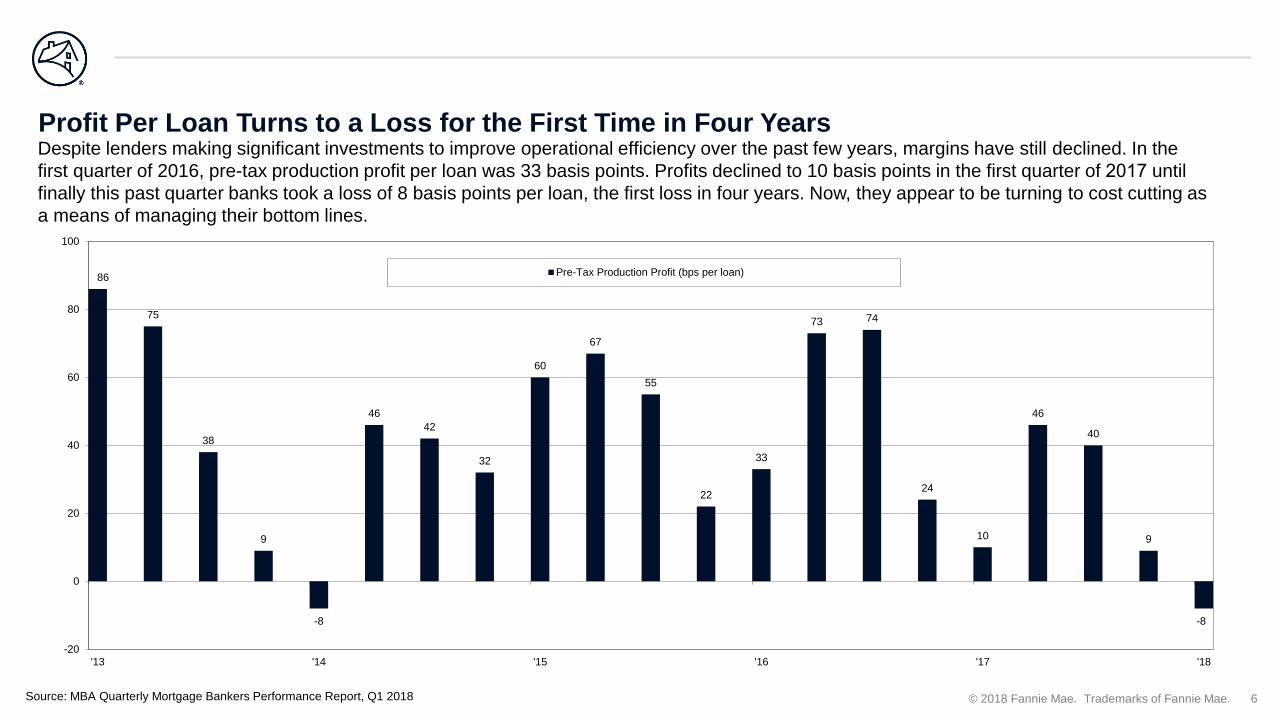
Profit Per Loan Turns to a Loss for the First Time in Four YearsDespite lenders making significant investments to improve operational efficiency over the past few years, margins have still declined. In the
first quarter of 2016, pre-tax production profit per loan was 33 basis points. Profits declined to 10 basis points in the first quarter of 2017 until
finally this past quarter banks took a loss of 8 basis points per loan, the first loss in four years. Now, they appear to be turning to cost cutting as
a means of managing their bottom lines.
Source: MBA Quarterly Mortgage Bankers Performance Report, Q1 2018

© 2018 Fannie Mae. Trademarks of Fannie Mae. 7
Home Sales Fall Amid Low Inventory and Rising Mortgage Rates
Source: Census Bureau, National Association of REALTORS®, Freddie Mac
New and Existing Home Sales Both Fall
The Monthly Average 30-Year Fixed Mortgage Rate Hits a Seven-
Year High in May
0.0
0.2
0.4
0.6
0.8
1.0
1.2
1.4
2
3
4
5
6
7
8
'05 '06 '07 '08 '09 '10 '11 '12 '13 '14 '15 '16 '17 '18
SA
AR
, M
illi
on
s o
f U
nit
s
Existing Home Sales
New Home Sales (Right Axis)
2.0%
3.0%
4.0%
5.0%
6.0%
7.0%
8.0%
9.0%
'99 '00 '01 '02 '03 '04 '05 '06 '07 '08 '09 '10 '11 '12 '13 '14 '15 '16 '17 '18
Fre
dd
ie M
ac 3
0-Y
ear
Fix
ed
-Rate
M
ort
ga
ges:
U.S
. (%
)
1.4
1.6
1.8
2.0
2.2
2.4
Jan Feb Mar Apr May Jun Jul Aug Sep Oct Nov DecE
xis
tin
g H
om
es A
vail
ab
le f
or
Sale
(N
SA
, M
illi
on
s o
f u
nit
s)
2015 2016
2017 2018
Year-over-Year Declines in For-Sale Inventories of Existing
Homes Continue Unabated
• Existing and new home sales both declined in April, to 5.46
million and 662,000 seasonally adjusted annualized rate
(SAAR), respectively. Year-to-date existing home sales through
April were 0.7 percent below the level during the same period
last year.
• Mortgage rates have risen about 80 basis points since
September 2017, pushing refinance activity down sharply.
• The for-sale inventory of existing homes has remained below
the year-ago level for nearly three years.

© 2018 Fannie Mae. Trademarks of Fannie Mae. 8
Mortgage Industry Payrolls Trend Sideways Amid Worsening Home Sales OutlookPending home sales fell 1.3 percent in April from March, and on an annual basis, they declined 2.1 percent, marking the fourth consecutive year-over-year drop. Purchase mortgage applications fell every week in May, sending the average monthly volume 2.9 percent below April’s average reading. While hiring among nonbanks and mortgage brokers remained elevated in April, hovering near expansion highs, mortgage industry employment may be approaching the cyclical peak.
90
95
100
105
110
115
120
160
180
200
220
240
260
280
'12 '13 '14 '15 '16 '17 '18
Mortgage Applications for Purchase Index (Monthly Average)
Pending Home Sales Index (Right Axis)
100
150
200
250
300
350
400
450
500
550
'90 '92 '94 '96 '98 '00 '02 '04 '06 '08 '10 '12 '14 '16 '18
Em
plo
ym
en
t: R
eal E
sta
te C
red
it &
Mo
rtg
ag
e a
nd
No
nm
ort
ga
ge
Lo
an
Off
icers
(S
A,
Th
ou
s.)
Near-Term Outlook for Home Sales Worsens Level of Mortgage Industry Payrolls Moves Horizontally
Source: Mortgage Bankers Association, National Association of REALTORS®, Bureau of Labor Statistics
© 2018 Fannie Mae. Trademarks of Fannie Mae. 9
Appendix
Business Priorities and Operational Efficiency
© 2018 Fannie Mae. Trademarks of Fannie Mae. 10
Business Priorities for 2018
L/M/S - Denote a % is significantly higher than the annual loan origination volume group that the letter represents at the 95% confidence level
M/D/C - Denote a % is significantly higher than the institution type group that the letter represents at the 95% confidence level
To maintain or improve your competitiveness in the marketplace, what are your firm's two most important business priorities for 2018? Please select up to two most important priorities
and rank them in order of importance. Showing Most + Second Most Important Priority
TotalLarger
Institutions (L)
Mid-sized
Institutions (M)
Smaller
Institutions (S)
Mortgage
Banks (M)
Depository
Institutions (D)
Credit
Unions (C)
N= 170 40 36 94 56 67 34
Consumer-facing technology 36% 47% 31% 31% 28% 39% 35%
Business process streamlining 30% 29% 32% 28% 35% 28% 24%
Cost cutting 30% 36%S 30% 20% 40%D,C 23% 9%
Talent management & leadership 23% 20% 24% 26% 25% 28% 18%
Back-end process technology 20% 21% 24% 15% 17% 8% 33%M
New products or services 19% 20% 15% 22% 23% 19% 21%
Data analytics and business
intelligence13% 9% 13% 17% 6% 13% 30%M,D
Regulation and compliance 12% 6% 14% 16% 6% 19% 18%
Marketing 12% 4% 12% 21%L 13% 17% 10%
Other 3% 3% 6% 0% 6% 0% 1%
Source: Mortgage Lender Sentiment Survey® Q2 2018
© 2018 Fannie Mae. Trademarks of Fannie Mae. 11
Areas for Operational Efficiency
L/M/S - Denote a % is significantly higher than the annual loan origination volume group that the letter represents at the 95% confidence level
M/D/C - Denote a % is significantly higher than the institution type group that the letter represents at the 95% confidence level
Please allocate a total of 100 points across the steps below to indicate the importance in making them more efficient. Allocate more points to the steps with the greatest potential for
efficiency gains. It is okay to allocate zero (0) points to a step if there’s no need to make it more efficient. Ranked by Mean
TotalLarger
Institutions (L)
Mid-sized
Institutions (M)
Smaller
Institutions (S)
Mortgage
Banks (M)
Depository
Institutions (D)
Credit
Unions (C)
N= 170 40 36 94 56 67 34
Collecting borrower information (e.g. income, assets, etc.)
Mean 37.51 34.28 43.53 34.73 36.66 37.40 35.96
Median 35 35 40 30 30 35 40
Min 0 1 15 0 1 0 0
Max 95 80 95 90 95 90 70
Ensuring property value
Mean 16.07 15.70 15.30 17.22 13.85 18.40 16.13
Median 15 15 10 15 10 20 10
Min 0 0 0 0 0 0 0
Max 70 35 60 70 60 70 50
Running best execution
Mean 15.19 13.18 16.23 16.16 16.23 14.06 18.89
Median 10 10 10 10 10 10 11
Min 0 0 0 0 0 0 0
Max 100 50 65 100 65 65 100
Source: Mortgage Lender Sentiment Survey® Q2 2018

© 2018 Fannie Mae. Trademarks of Fannie Mae. 12
Areas for Operational Efficiency (Continued)
L/M/S - Denote a % is significantly higher than the annual loan origination volume group that the letter represents at the 95% confidence level
M/D/C - Denote a % is significantly higher than the institution type group that the letter represents at the 95% confidence level
Please allocate a total of 100 points across the steps below to indicate the importance in making them more efficient. Allocate more points to the steps with the greatest potential for
efficiency gains. It is okay to allocate zero (0) points to a step if there’s no need to make it more efficient.
TotalLarger
Institutions (L)
Mid-sized
Institutions (M)
Smaller
Institutions (S)
Mortgage
Banks (M)
Depository
Institutions (D)
Credit
Unions (C)
N= 170 40 36 94 56 67 34
Collecting and delivering loan documents to investors
Mean 13.35 16.71 11.30 12.06 15.63 10.31 12.05
Median 10 10 10 10 10 10 10
Min 0 0 0 0 0 0 0
Max 94 94 50 50 94 40 40
Obtaining and ensuring clear title
Mean 7.20 8.12 5.49 8.00 7.30 7.60 7.13
Median 5 10 5 5 5 5 5
Min 0 0 0 0 0 0 0
Max 40 30 20 40 40 30 35
Confirming adequate hazard insurance
Mean 5.59 5.79 4.76 6.22 5.48 6.59 4.67
Median 5 5 5 5 5 5 5
Min 0 0 0 0 0 0 0
Max 50 20 20 50 30 50 20
Source: Mortgage Lender Sentiment Survey® Q2 2018

© 2018 Fannie Mae. Trademarks of Fannie Mae. 13
Areas for Operational Efficiency (Continued)
L/M/S - Denote a % is significantly higher than the annual loan origination volume group that the letter represents at the 95% confidence level
M/D/C - Denote a % is significantly higher than the institution type group that the letter represents at the 95% confidence level
Please allocate a total of 100 points across the steps below to indicate the importance in making them more efficient. Allocate more points to the steps with the greatest potential for
efficiency gains. It is okay to allocate zero (0) points to a step if there’s no need to make it more efficient.
TotalLarger
Institutions (L)
Mid-sized
Institutions (M)
Smaller
Institutions (S)
Mortgage
Banks (M)
Depository
Institutions (D)
Credit
Unions (C)
N= 170 40 36 94 56 67 34
Obtaining mortgage insurance
Mean 5.08 6.22 3.41 5.60 4.84 5.64 5.18
Median 5 5 5 5 5 5 5
Min 0 0 0 0 0 0 0
Max 33 30 10 33 30 33 15
Source: Mortgage Lender Sentiment Survey® Q2 2018