Cost-Benefit Analysis of the Cocoa Livelihoods Program in...
38
2 Cost-Benefit Analysis of the Cocoa Livelihoods Program in Sub-Saharan Africa Francis Tsiboe, Graduate Student 206 Agriculture Building Annex University of Arkansas Fayetteville, Arkansas, 72701 [email protected] Lawton Lanier Nalley, Ph.D. 217 Agriculture Building University of Arkansas Fayetteville, Arkansas, 72701 [email protected] Bruce L. Dixon, Ph.D 215 Agriculture Building University of Arkansas Fayetteville, Arkansas, 72701 [email protected] Jennie S. Popp, Ph.D 218b Agriculture Building University of Arkansas Fayetteville, Arkansas, 72701 [email protected] Jeff Luckstead, Ph.D 223 Agriculture Building University of Arkansas Fayetteville, Arkansas, 72701 [email protected] Selected Paper prepared for presentation at the Southern Agricultural Economics Association (SAEA) Annual Meeting, Atlanta, Georgia, January 31-February 3, 2015 Copyright 2015 by [Tsiboe et. al.]. All rights reserved. Readers may make verbatim copies of this document for non-commercial purposes by any means, provided this copyright notice appears on all such copies.
Transcript of Cost-Benefit Analysis of the Cocoa Livelihoods Program in...

2
Cost-Benefit Analysis of the Cocoa Livelihoods Program in Sub-Saharan Africa
Francis Tsiboe, Graduate Student
206 Agriculture Building Annex
University of Arkansas
Fayetteville, Arkansas, 72701
Lawton Lanier Nalley, Ph.D.
217 Agriculture Building
University of Arkansas
Fayetteville, Arkansas, 72701
Bruce L. Dixon, Ph.D
215 Agriculture Building
University of Arkansas
Fayetteville, Arkansas, 72701
Jennie S. Popp, Ph.D
218b Agriculture Building
University of Arkansas
Fayetteville, Arkansas, 72701
Jeff Luckstead, Ph.D
223 Agriculture Building
University of Arkansas
Fayetteville, Arkansas, 72701
Selected Paper prepared for presentation at the Southern Agricultural Economics
Association (SAEA) Annual Meeting, Atlanta, Georgia, January 31-February 3, 2015
Copyright 2015 by [Tsiboe et. al.]. All rights reserved. Readers may make verbatim copies of this
document for non-commercial purposes by any means, provided this copyright notice appears on
all such copies.

3
Abstract
Billions of dollars flow into low-income countries each year to help alleviate poverty. Assessing the
effectiveness of these dollars is necessary to measure program success and to allocate such funds among
competing projects. This study measures the impact of the first phase of the Cocoa Livelihood Program
(CLPI), a current World Cocoa Foundation project sponsored by the Bill and Melinda Gates Foundation.
The project seeks to improve the livelihood of over 200,000 small cocoa producers in Sub-Saharan Africa
via training, crop diversification and farmer based organizations. Using data collected from 2,048 pre and
post CLPI interviews of cocoa producers in Ghana, Cote d’ivoire, Nigeria and Cameroon, the economic
impact of the CLPI program can be estimated. The results show that yield enhancements attributable to
CLPI are 36%, 38%, 49% and 24% in Ghana, Côte D’Ivoire, Nigeria and Cameroon, respectively. Using a
total program cost of $158-$200 per beneficiary and estimated annual benefits of $86-$152 per beneficiary
over 25 years, the benefit- cost ratios were estimated to range from $13 to $22 for every dollar spent on
human capital development.

4
1. Introduction
Cocoa market liberalization throughout West Africa during the Structural Adjustment Programs (SAPs) in
the mid-nineteen eighties has fostered competition in the local cocoa markets and has increased the
producer’s share of cocoa revenues. However, simultaneous institutional reforms during the liberalization
process have resulted in decreased levels of public goods such as research and extension in the agricultural
arena throughout West Africa. In response, the research and extension service gap left by the SAP’s has
been partially filled by Non-Governmental Organizations (NGOs) as well as official foreign assistance from
governments.1 The donors (private, NGO’s and governments) who remain active in funding development
programs in low income-countries are increasingly searching for higher resolution metrics useful for
evaluating the effectiveness of any funding decision. Thus, to adequately measure the impacts of a
development programs, monitoring and evaluation teams must be inherently results-oriented using
appropriate data to support claims (UNDP, 2009). However, evaluating the full impact and success of donor
sponsored development programs in low income-countries has proved challenging due to difficulties
inherent with measuring impacts at the individual producer level. According to Duflo et al. (2008) studies
evaluating development programs at the producer level presuppose these programs to be limited in space
and scope, hence these studies fail to account for accumulated costs and/or benefits that persist beyond the
program implementation period. Development programs to facilitate human capital acquisition such as a
Farmer Field School (FFS) can generate benefits that persist beyond the funded project life span.
Secondly, these studies are highly reliant on randomized controlled trials (RCTs) for impact evaluation of
programs which inadequately estimate the combined effect of programs that have multiple components
(Gunning and Elbers, 2013). By ignoring the post-training intertemporal dimension of development
programs, such as the impacts of accumulated human capital acquired during training and the interaction
of their multiple components in project evaluation, researchers may not fully capture a program’ total net
1 A list of all abbreviations and their definitions is given in the Appendix.

5
benefits. Therefore, comprehensive program evaluation approaches must be utilized when evaluating
programs with multiple components to give future donors a complete estimate of project investment returns.
With these points in mind, this study analyzes phase one of the Cocoa Livelihood Program (CLPI), a current
World Cocoa Foundation (WCF) project sponsored by the Bill and Melinda Gates Foundation. The CLPI
seeks to double the income of approximately 200,000 smallholder cocoa-growing households in Ghana,
Cote d’Ivoire, Nigeria and Cameroon. On-the-ground, primary data were collected from 2,048 cocoa farms
in Ghana, Ivory Coast, Cameroon, and Nigeria both pre and post CLPI. Using this rich dataset and applying
a difference-in-differences modeling method, this study sets out to (1) estimate the annual yield increases
associated with the CLPI, (2) estimate the net present value (NPV) of these benefits over the 25 year
productive life of a cocoa tree (noting that while CLPI is only funded for four years, the resulting
accumulated human capital is amortized over the productive life of the tree), and (3) estimate the benefit-
cost-ratio (BCR) for the CLPI program in each of the project’s four West African countries.

6
2. Literature Review
2.1 Cocoa Production in Sub-Saharan Africa
Cocoa is the largest agricultural commodity exported in Sub-Saharan Africa (SSA) at about seven billion
US dollars in 2012 and six billion in 2011 (UN Comtrade, 2013). Approximately 70% of the world’s cocoa
exports originate from West Africa: in 2010/11 Côte d’Ivoire accounted for 37% of world cocoa exports,
followed by Ghana (24%), Nigeria (7%) and Cameroon (6%) (ICCO, 2012a). Cocoa exports account for
15% of GDP in Côte d’Ivoire, 11% in Ghana, 3% in Cameroon and 1% in Nigeria2. Over 90% of cocoa
production in these countries is produced by about two million small scale household farms, on two-to-four
hectare plots6 and productivity ranging from 300-400kg/ha and with low input usage (WCF, 2009, 2014b).
Cocoa accounts for 60-90% of the income of cocoa producing households in SSA (the majority of which
live on less than $2/day (WCF, 2012)) with a per capita daily income estimated in the range of $1.09 to
$1.76 (Fairtrade Foundation, 2011; WCF, 2009). The low income of cocoa producers is a function of low
productivity per hectare as well as low farm gate prices: Ghanaian cocoa farmers receive approximately
70% of the free on board (FOB) price of cocoa; however, Ivorian cocoa farmers receive 40% of the FOB
price due to export taxes imposed by the government. Other drivers of low prices in Côte d’Ivoire, the
largest world cocoa producer, include little or no access to market information, misunderstanding of quality
requirements, high transport cost and individual rather than group selling (Wegner, 2012).
According to Fairtrade Foundation, (2011), the current share of the price of chocolate paid by consumers
in high income countries received by cocoa producers has decreased from 16% to 6% since the 1980s.
Cocoa productivity of 436kg/ha, 595kg/ha, 292kg/ha and 383kg/ha, respectively in Ghana, Côte d'Ivoire,
Nigeria and Cameron, is relatively low compared to yields of 345kg/ha, 460kg/ha 556kg/ha and 894kg/ha,
respectively, in Brazil, Colombia, Indonesia and Malaysia, (FAO, 2014). The low cocoa productivity in
2 Derived from cocoa export share estimates retrieved from ICCO (2010, 2012b) and exports of goods and
services (% of GDP) estimates retrieved from the World Bank (2013)

7
West Africa can be partially attributed to the limited knowledge of improved production techniques and
farm management skills (Wegner, 2012). Of more critical concern in SSA is farmer’s access to inputs such
as fertilizers and financing to enhance productivity. Field tests in Ghana and Côte d'Ivoire by Yara, a global
fertilizer company, have demonstrated that yield can be increased by over 300% with a combination of
good agricultural practices and appropriate input application (IDH, 2011).
2.2 Impact of Structural Adjustment Programs on Cocoa
The SAPs instituted by the World Bank and International Monetary Fund in the mid nineteen eighties led
to the liberalization of the cocoa market throughout West Africa. The main objective of the SAP in Sub-
Saharan Africa was to improve economic efficiency by linking the domestic cocoa market to the world
market through greater ‘pass-though’ of the world cocoa price to the farmer. Nigeria was the first to
liberalize in 1986, followed by Cameroon (1994), Côte d’Ivoire (1998-2002) with Ghana having a partial
liberalized cocoa sector since 1992-93 regulated by the Ghana Cocoa Board (COCOBOD) (Gilbert, 2009).
Gilbert (2009) suggests that two main liberalization models emerged in SSA via the SAPs. The first is the
pure liberalization model, where the government is absent from the sector so farmers face low taxation but
are constrained by few public services, such as agricultural extension, as typical of Nigeria and Cameroon.
The second is the partial liberalization model in which the government remains active in the sector while
farmers pay significant levels of taxation but obtain a high level of services (farmer training, input subsidies
and seed distribution) as typified by Ghana. Gilbert (2009) finds that Côte d’Ivoire sits between these two
institutional structures and manages to experience all the drawbacks of liberalization without any of the
potential benefits of state involvement. The reform process in Côte d’Ivoire is characterized by high export
taxation, low farm gate price, and little extension service to farmers. Also in Côte d’Ivoire local companies
are absent from cocoa export due to multinationals dominating the sector.
Even though the liberalization process has led to increased competition in internal markets and has
increased the producer’s share of the world prices (with the exception of Côte d’Ivoire), institutional

8
reforms add an additional dimension. Before the SAPs, some of the parastatals (an agency owned or
controlled wholly or partly by the government) were responsible for providing a range of rural services
such as marketing and distribution of agricultural inputs and outputs and could also include provision of
extension services and credit (Ahmed and Lipton, 1997). Scaling down the activities of parastatals and
replacing them with private institutions has led to a decline in extension services, agricultural research, and
rural banking that play an integral role in tree crop production enterprises like cocoa (Nyemeck et al. 2008;
Wilcox and Abbott, 2006). This decline in public funding, together with a decline in official development
assistance to SSA of about 35% between 1980 and 2005 in real terms, resulted in fewer funds to implement
agricultural development programs in SSA and across the low-income world (Cabral, 2007).
The absence of free or subsidized fungicides, herbicides, fertilizers, and technical training following
liberalization led to declining per hectare yields and increasing revenue volatility for cocoa producers,
particularly for the rural poor who live on marginalized land susceptible to weather and yield variability
(Nyemeck et al., 2008). Such variability can lead to lower output, sale of productive assets, reduced
consumption, and/or reduced investments in education if problems persist (Hill and Torero, 2009).
Currently agricultural loans to cocoa farmers come in the form of input packages, primarily through
programs offered to farmer based organizations like the Cocoa Abrabopa Program (CAP) in Ghana: where
farmers are supplied inputs (fertilizer, pesticides and fungicides) on credit, and extension services for which
farmers repay the cost upon selling their crop, or through programs offered to individual farmers by non-
governmental organizations (NGOs) such as the WCF-CLPI.
2.3 Developmental Assistance in the Cocoa Industry
Despite the importance of cocoa in providing income for more than two million households, producers face
issues such as (1) yield loss due to pests and diseases (30% loss annually), (2) outdated farming techniques
and limited availability of improved cocoa varieties, (3) limited organizational support, (4) education and
health issues, and (5) labor practices which often involve children working on cocoa farms at the expense

9
of attending school (ICI, 2011). To minimize the occurrences of the aforementioned issues, a global
movement, backed by leading firms in the world’s cocoa and chocolate industry, has arisen to help ensure
that cocoa growing households and their communities are able to reap sustainable benefits form cocoa
farming (ICI, 2011). As part of this movement, the World Cocoa Foundation (WCF) and the International
Cocoa Initiative (ICI) were formed to collaborate with national plans enacted by governments. Since 2000,
this global movement (in form of programs, partnerships, foundations) is working to (1) increase farmer’s
income through training programs, crop diversification and farmer organizations, (2) encourage sustainable
cocoa farming that maintains or enhances the ecosystem, (3) eradicate child labor and improving the access
of children to higher quality education (ICI, 2011). The ICI was established by the “Harkin-Engel Protocol,”
in 2002 in response to reports of child labor practices on cocoa farms in West Africa. ICI works to eliminate
child labor in cocoa-producing countries by collaborating with the various players in the cocoa industry,
national governments and civil society organizations. The World Cocoa Foundation (WCF) was founded
in 2000 for the purpose of promoting social and economic development as well as environmental
stewardship in cocoa-growing communities. Serving as a facilitator, WCF brings together donors, industry
members, producing country governments, research institutes and non-governmental organizations to
achieve its goals through public-private partnerships (WCF, 2014a).
2.4 The WCF Cocoa Livelihood Program (CLPI)
The WCF Cocoa Livelihood Program (CLP) is a ten-year program. Its first phase (CLPI) ended in January
2014 and the second phase (CLPII) spans from February 2014 to January 2019. The aim of CLPI, funded
at 40 million dollars by the Bill and Melinda Gates Foundation and Matching Grants, was to double the
income of approximately 200,000 smallholder cocoa-growing households in Ghana, Côte d'Ivoire, Nigeria
and Cameron. The CLPI objectives were to (1) improve market efficiency and build capacity of farmers
and farmer organizations, (2) increase production and quality of cocoa at the farm level, and (3) improve
competitiveness by increasing farm diversification (Ndiaye et al. (2013). The program’s key activities

10
included: (1) professionalizing farmer organizations by providing training in leadership, governance,
accounting, quality analysis and group marketing, (2) providing improved planting material and financing
mechanisms for improved access to credit for inputs through collaborative credit schemes based on risk
sharing of multiple private sector partners, (3) production and input training taught using either the Farmer
Field Schools (FFS) or Video Viewing Clubs approaches, (4) farmer business skills training (FBS) which
equipped farmers with tools for planning, economic analysis and decision-making built on technical
recommendations for cocoa production, nutrition related issues and, farm and household financial
management, and (5) providing Business Service Centers (BSC) which provided microfinance access to
farmers (Ndiaye et al. (2013).
2.5 Past Impact Assessments of Development Programs
Gockowski et al. (2010) conducted a case study of Farmer Field School (FFS) implemented in Ghana to
provide feedback in an effort to close the yield gap across the West African cocoa belt. Their results showed
that yield enhancement attributable to FFS training was 14% per hectare for 225 randomly sampled cocoa
farmers who were among the 829 cocoa farmers enrolled in the 30 field schools across Ghana. They
concluded that farmers achieved this 14% yield enhancement mainly by increasing their own labor input
and hiring more laborers, and selectively applying the set of field management (pruning, shade
management, and proper phytosanitary control), and human capital knowledge acquired in the FFS training.
The case study concluded it was clear that the FFS training had statistically significant impacts on the
beneficiary farmer’s productivity.
In 2007 Opoko et al. (2009) conducted an impact assessment of the Cocoa Abrabopa Program (CAP) in
Ghana under the auspices of Wienco’s Farmer Based Organization (FBO), Cocoa Abrabopa Association
(an FBO working with cocoa farmers with the objective to improve livelihoods, established by Wienco, a
cocoa input dealer), and the Center for the Study of African Economies. Through CAP, farmers were
supplied inputs (fertilizer, pesticides and fungicides) on credit, and extension services which they repaid

11
upon selling their crop. Both CAP and CLPI are similar in that producers obtain inputs on credit. The study
analyzed data on 83 non-participating farmers and 158 participating farmers collected from the 2007/08
and 2008/09 growing seasons in Ghana. The study estimated that the program resulted in a 43% revenue
increase for participating farmers, and subsequent revenue to cost ratio of 2.5. The study also found that
inappropriate use of inputs in terms of timing and application rates was a common production problem,
thus increasing farmers access to inputs is only one part of the solution: training and other human capital
pertaining to proper input usage is also needed.
Norton et al. (2013) conducted a cost-benefit analysis of a portion of CLPI in Ghana, but from a limited
sample of producers from the 2010/11 growing season. Their results showed that the CLPI in Ghana
increased average cocoa yield by 75.24% per hectare. This increased yield, if incorporated into an optimal
phased replanting rotation, would have increased net present value (NPV) by $401.00 per hectare annually.
Using a training cost of $252, they estimated the BCR of CLPI at 80:1 Even though the current study and
Norton et al. (2013) seek to estimate yield enhancement attributable to CLPI, they differ in methodology
and the scope of the data used. Norton et al. (2013) used data on only CLPI participants from Ghana and
only one growing season (2010/11) whereas this study uses data from both CLPI and Non-CLPI participants
collected from both pre- (2009/10) and post (2012/13) CLPI periods across all CLPI countries. Unlike
Norton et al. (2013) which utilized a conventional regression approach, this study employs the more robust
difference-in-differences model. Of importance, the Norton et al. (2013) study used 239 farmer
observations in Ghana while this study utilizes 2,048 farm level observations from Ghana, Cote d’ivoire,
Nigeria and Cameroon to estimate CLPI yield enhancements in each country.
2.6 The Difference-in-differences Model
An often used method in preliminary analysis of impact of policy intervention, and upon which many other
methods including the difference-in-differences are formulated is the one group before and after

12
intervention design. To motivate the advantages of the difference-in-differences model, consider the
simplest design as given in Meyer (1995, p. 154):
ititit XY 00 0xεE itit (1)
where Yit is the response variable of interest (in our applications, cocoa yields) for the ith individual in period
t, t = 0, 1 and i = 1… N. The variable Xit, is a binary variable indicating treatment group which takes on a
value of 1 if t = 1 in the post-intervention period and 0 otherwise and εit is the customary error term that is
identically, independently distributed with mean zero and independent of treatment status. Using data from
both pre- and post- intervention periods, β0 can be estimated as the causal effect of the intervention and can
be shown to be equal to the average difference in the pre and post intervention outcomes. For β0 to be the
true experimental effect ideal conditions must prevail. For example, there can be no other factor that
changed over time that could have induced the observed effect other than the stimulus. An alternative, and
preferred model specification, illustrated by Meyer (1995), is to include both experimental and control
groups for which observations are available in both pre and post intervention periods. Such a model can
be specified as:
j
it
j
t
j
t
j
it XXXY 3022110 (2)
The outcome variable is now superscripted by j for group, experimental (j = 1) and control group (j = 0).
The variable 𝑋1𝑡 is a binary variable which takes on the value one in post-intervention period (t = 1) and
zero in in pre-intervention period (t = 0). The variable 𝑋2𝑗 is a binary variable that takes on the value of one
for experimental group and zero for the control group. The variable takes on the value of one if j = 1 and t
=1, 0 otherwise. The coefficient α0 is the constant term; α1 is a time effect common to both control and
experimental groups. It captures how the outcome changes over time due to unobservable factors other
than the experimental intervention. The coefficient α2 is the experimental group specific effect (average

13
permanent differences between the experimental and control group), and β0 is the effect of the intervention
after controlling for the effects of time and permanent differences between the experimental and control
groups.
The logical extension of equation (2) is to incorporate the influence of other independent (control) variables
that affect the outcome variable independently of the experimental stimulus (CLPI programs). Thus the
regression equation:
j
it
j
it
j
t
j
t
j
it ZXXXY 03022110 (3)
Where 𝑌𝑖𝑡𝑗, 𝑋1𝑡, 𝑋2
𝑗 𝑎𝑛𝑑 𝑋3𝑡
𝑗 are defined as in equation (2) and 𝑍𝑖𝑡
𝑗 a vector of independent (control) variables.
In this study, we specify and estimate equation (3) to estimate yield enhancement attributable to CLPI. The
formal model specification is described in the next section.

14
3. Methodology and Data
3.1 CLPI Program Packages
Our goals are to estimate: (1) the yield enhancement attributable to the two main training programs (Farmer
Field School (FFS), Farmer Business School (FBS)) and the input credit package (ICP) offered as part of
the CLPI program, and (2) subsequent changes in profits per hectare attributable to the CLPI programs.
The CLPI delivers its programs in four specific conceptualizes program packages (bundles of training and
services) (WCF, 2011). The four roadmap packages presented in Fig. 1 are: (1) Full CLPI package that
includes FFS, FBS, and ICP (Full). (2) FFS and FBS only package (FBP), (3) FFS only (FFSP) package
and, (4) FBS only package (FBSP). The roadmaps are designed so that the ICP can only be obtained by
farmers having both FFS and FBS. The experimental design implied by the combinations of programs
allow for identifying the individual impacts of FFS or FBS the marginal impact of FBS (FFS) given FFS
(FBS) and the marginal impact of ICP given both FFS and FBS.
3.2 Specification of the CLPI Impact Evaluation Model
To estimate the yield enhancement attributable to the various CLPI, a semi-log linear regression model was
specified in the framework of equation 3 and estimated by ordinary least squares. The outcome variable
(dependent variable) was the natural log of the cocoa yield of the ith farmer from in period t measured in
kg/ha. The natural log of yield was adopted to facilitate cross-country comparisons of program impacts.
The binary variable coefficients can readily be converted into estimates of the percentage yield increase
attributable to these variables. This is particularly convenient for estimating the impact of the CLPI program
packages since all these variables are categorical (binary). The only continuous variable is farm size and
years of formal education, and they are entered in log form so that its coefficient can be interpreted as
elasticities. The model can be written as:
j
it
j
t
j
t
j
it PRECIPPROGCLPYRLNYIELD 10210
j
it
j
it
j
it
j
it LOCDEMOINPUTS 432 (5)

15
The variables YR and CLP denote a year effect and membership in the experimental group, respectively.
The vector PROG contains variables for the four policy variables denoting the form of intervention
(FULLP, FBP, FFSP and FBSP) for which the ith farmer participated in the treatment group. The vector
PRECIP contains variables (SUPR1, SUPR2 and SUPR3) for precipitation of the season’s average
precipitation measured in millimeters for the main crop flowering, main crop maturity and light crop
maturity for the ith farmer3. The vectors INPUTS, DEMO and LOC contains variables, productions inputs,
farmer and farm demographics, and location respectively. All of the independent variables are defined in
Table 1. Four different models presented in equation five were estimated for each country.
3.3 Net Present Value
Given the estimated yield increases from the various full CLPI package (FULLP) from equation (3), a Net
Present Value (NPV) of total benefits can be calculated using the methods implemented in Mahrizal et al.
(2013)4. To comprehensively measure the costs and benefits of CLPI which likely extend beyond the
project life span, a NPV model was implemented to predict the intertemporal net benefits resulting from
human capital investments. By calculating the full extent of intertemporal benefits, the holistic economic
return on CLPI can be estimated. The Mahrizal et al. (2013) approach is used in this study to calculate the
3 Generally, there are two main harvest of cocoa within a growing season, the main crop in October-March
and the mid-crop in May-August with the whole season spanning from January to December (CRIG, 2010).
Cumulative precipitation for the main crop flowering and maturation periods was taken as the precipitation
from the preceding January through May, and preceding June through October respectively. For the light
crop, cumulative precipitation for the main crop flowering and maturation periods was taken as the
precipitation from the preceding June through October, and preceding December through March
respectively.
4 Mahrizal et al. (2013) solved for the optimum replacement rate (ORR) and initial replacement year (IRY)
of cocoa trees that maximize a 50-year NPV for a one-hectare, Ghanaian cocoa farm by employing a phased
replanting approach. Using cocoa production data collected by Sustainable Tree Crop Program (STCP) and
International Institute of Tropical Agriculture (IITA), the study found that the annual ORR and IRY are
5%–7% and 5-9 years, respectively, across the three production systems studied: (1) Low Input, Landrace
Cocoa, High Input, (2) No Shade Amazon Cocoa, and (3) High Input, Medium Shade Cocoa. The authors
estimated economic gains that exceed currently practiced replacement approaches by 5.57%–14.67% across
production systems.

16
maximum NPV for both pre- and post- CLPI intervention periods. Given the optimum replacement rate
(ORR) and initial replacement year (IRY), the annual NPV is estimated as a function of projected cocoa
prices, costs of labor and inputs, inflation rate and discount rate. The NPV per hectare is estimated as the
sum of the discounted NFV in each year using a 25-year, parabolic shaped average lifecycle yield curve of
a cocoa tree in Ghana based on research conducted by the International Institute of Tropical Agriculture
(IITA) shown in Fig. 2. Using the optimal ORR and IRY which maximize NPV, a baseline NPV was
estimated as the maximum potential profit per hectare that cocoa farmers could achieve given current
production practices without any CLPI package. It is assumed that that cocoa farmers behave rationally to
maximize their profits before the CLPI program was implemented. Because of a number of real-world
constraints—including access to credit to buy fertilizer—Ghanaian farmers are most likely do not actually
behave in this manner. To control for the farmer behavioral effect in estimating CLPI benefits, it is
necessary assume farmers behave in the same way in terms of economic goals so as not to confound that
impact of CLPI with adopting a better optimizing strategy at the same time.
The Low Input Landrace Cocoa (LILC) production system described in Afari-Sefa et al. (2010) and
Gockowski et al. (2011) was assumed as the baseline production practice: this system uses unimproved
local landrace cocoa varieties with moderate shade levels. The study assumes farmers use pesticides and
fungicides but no inorganic fertilizer in the baseline scenario. Secondly, this study assumes that once
farmers complete the full CLPI program (i.e. completes both FFS and FBS and gains access to ICP), they
can access input credit which translates to fertilizer adoption and increased production costs. Therefore the
model cost structure is adjusted so all CLPI graduates implement the High Input Medium Shade Cocoa
(HIMSC) production system described in Afari-Sefa et al. (2010). As a result, input costs increase by 60%
annually. The adjustment obtained from Afari-Sefa et al. (2010) allows for more accurate estimation of

17
profit because the large yield increases attributable to CLPI imply higher production costs5. Finally it is
assumed that the yield enhancement estimated in equation (3) attributable to the full CLPI package
(FULLP) is a constant percentage gain, above those cocoa producers who were not exposed to any of the
CLPI packages (baseline scenario) throughout the productive life of the cocoa tree as illustrated in Fig. 2.
The NFV and NPV for the 25-year productive life of the cocoa trees per hectare were estimated as follows:
tjjt
t
jtjtjjtjt rCrPgYIELDNFV 111 (4)
25
1 1tt
dj
jt
j
r
NFVNPV (5)
Where YIELDjt is the yield in kg/ha of cocoa in period t for a given hectare for country j, and depends upon
the age of trees on that hectare as shown Fig. 2. The variable g is the yield enhancement attributable to the
full package (FULLP) for country j, where g = 0 represents the baseline yield. The expressions Pjt(1+rjt)t
and Cjt(1+rjt)t are the price of cocoa and cost of cocoa production in period t in country j, compounded by
country j’s inflation rate rjt, respectively. The variable rdj is country j’s discount rate. Dividing equation 5
by 25 (average productive life a cocoa tree) gives the annual average NPV of profit per hectare for each
country. Like Tisdell and Silva (2008), this study assumes no salvage value for cocoa trees, hence we do
not account for the salvage value in the NPV. Using the yield, cost and inputs outlined in Afari-Sefa et al.
(2010) and Gockowski et al. (2011), and the optimal ORR and IRY estimation by Mahrizal et al. (2013),
the baseline NPV was estimated at g = 0.
5 Afari-Sefa et al. (2010) and Gockowski et al. (2011) estimated costs and returns are for one hectare of
unimproved cocoa planted at 3 x 3 m spacing (1,100 plants per hectare) for with no nursery cost for LILC
and HIMSC. The only difference between the cost estimates of LILC and HIMSC is the use of inorganic
fertilizer.

18
The baseline daily wage for labor was fixed at $2.22, $2.59, $3.88 and $2.00 respectively for Ghana, Côte
d’Ivoire, Nigeria and Cameroon, per the 2011 daily minimum wage retrieved from ILO (2012). Insecticide
and fungicide prices for Ghana were respectively fixed at $6.17/liter and $1.85/sachet per their respective
current market prices in 2010 terms, fertilizer price was taken as the price farmers paid for the CLPI
fertilizer credit package which is estimated at $13.52/50kg in 2010 terms (Antista, 2014), and the cost of
all other inputs and materials were taken from Afari-Sefa et al. (2010) and Gockowski et al. (2011). Given
that COCOBOD marketing board sets the price of cocoa in Ghana, the farm gate price (FGP) for Ghana
was set at 77.81% of the net Free-On-Board (FOB) price: the share of the farmers price was estimated as
the average for the 2010/13 period obtained from Government of Ghana (2011, 2012, 2013, 2014). For
Côte d’Ivoire, Nigeria and Cameroon, the FGP as a share of the FOB price was set at 49.0%, 74.1% and
73.5% respectively, per the 2000/11 period annual averages retrieved from ICCO (2010, 2012b). The FOB
price was set at the average ICCO price of $3.53/kg observed in January, 2010 (ICCO, 2014).
Unlike Ghana where were it was possible to obtain data on input prices, cost and yield curves for both the
LILC and HIMSC production system, no such data were available for Côte d’Ivoire, Nigeria and Cameroon.
Thus calibration of the Ghanaian prices and cost and yield outlines for both the LILC and HIMSC
production systems to suit the three other countries was needed. Price Level Indexes (PLI)6 obtained from
World Bank (2011) were used to calibrate the Ghanaian input prices for Côte d’Ivoire Nigeria and
Cameroon. Using PLI obtained from World Bank (2011), the PLI for Côte d’Ivoire Nigeria and Cameroon
were estimated at 104.55, 104.47 and 104.09 respectively
6 PLLs are standardized indexes expressing the price level of a given country relative to another. They are
estimated by dividing a countries’ Purchasing Power Parity by its respective dollar exchange rate. Countries
with PLIs less than 100 have price levels that are lower than that of the base country and PLIs greater than
100 have price levels that are higher than that of the base country. Generally, PLLs are preferred to exchange
rate when comparing because PPPs evolve slowly, whereas exchange rates can change quickly (World
Bank, 2014)

19
(Ghana=100). Yield outlines for the three countries were estimated by adjusted the Ghanaian yields
obtained from Afari-Sefa et al. (2010) and Gockowski et al. (2011) by multipliers estimated from country
fixed effects regressions for yield using annual country yield data retrieved from FAOSTAT (2014) for the
period 1993-2012.
The regressions were estimated as:
tjtjtjt ZXLNYIELD (8)
Where LYIELD is the natural log of country j’s cocoa yield in time t, X is vector which contains dummy
variables indicating the country (Côte d’Ivoire, Nigeria, and Cameroon with Ghana acting as the control
country). The variable Z is denotes a matrix that includes an intercept term, a trend variable, autoregressive
terms and variable that are believed to influence yield. The multipliers were then taken as the exponent of
the coefficients on the respective country’s dummy variable. The calibrated unit cost of inputs and the yield
multipliers are presented in Table 2 and the yield curved generated for each country in Fig. 2. By setting
inflation at 10.1%, 2.8%, 11.3% and 2.2% per year respectively for Ghana, Côte d’Ivoire, Nigeria and
Cameroon, per the 2010/13 average (ADB, 2014), the prices of labor and inputs are projected in the models
to rise at these rates. The discount rates were held constant at 11.65%, 3.5%, 7.1% and 3.2% per year
respectively for Ghana, Côte d’Ivoire, Nigeria and Cameroon, per the 2010/13 annual average deposit rate
(IMF-IFS,2014).
3.4 Benefit Cost Ratio
The benefit cost ratio of CLPI can be estimated as:
CLPI
j
0
j
CLPIj
CLPIC
BBBCR
(9)
20
Where (BjCLPI – Bj
0) is the difference between the baseline NPV (no training) and the post CLPI NPV (with
FULLP). Therefore the estimated NPV for country j, estimated from equation seven in $/ha. The variable
CCLPI is the total cost of CLPI per beneficiaries, which is assumed to occur at time 0 (2009/10). The total
cost of CLPI per farmer who benefited directly from the program was estimated at $151, $128, $200 and
$130, respectively in Ghana, Côte d’Ivoire, Nigeria and Cameroon.
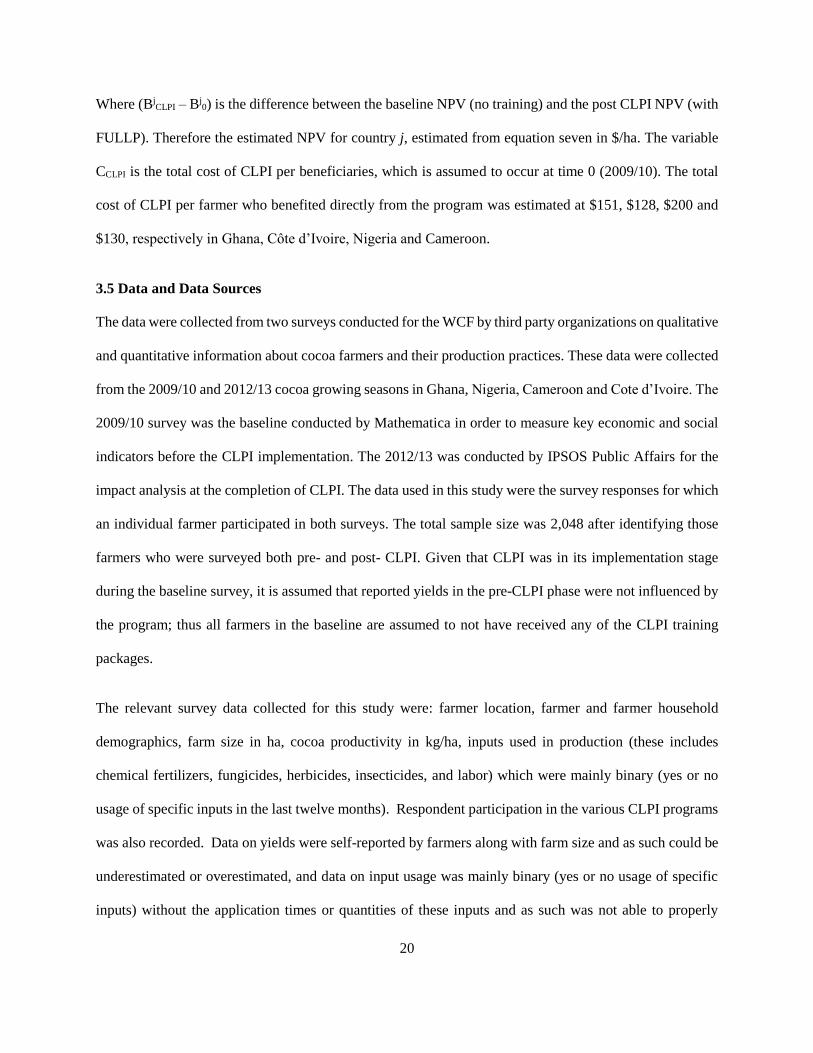
3.5 Data and Data Sources
The data were collected from two surveys conducted for the WCF by third party organizations on qualitative
and quantitative information about cocoa farmers and their production practices. These data were collected
from the 2009/10 and 2012/13 cocoa growing seasons in Ghana, Nigeria, Cameroon and Cote d’Ivoire. The
2009/10 survey was the baseline conducted by Mathematica in order to measure key economic and social
indicators before the CLPI implementation. The 2012/13 was conducted by IPSOS Public Affairs for the
impact analysis at the completion of CLPI. The data used in this study were the survey responses for which
an individual farmer participated in both surveys. The total sample size was 2,048 after identifying those
farmers who were surveyed both pre- and post- CLPI. Given that CLPI was in its implementation stage
during the baseline survey, it is assumed that reported yields in the pre-CLPI phase were not influenced by
the program; thus all farmers in the baseline are assumed to not have received any of the CLPI training
packages.
The relevant survey data collected for this study were: farmer location, farmer and farmer household
demographics, farm size in ha, cocoa productivity in kg/ha, inputs used in production (these includes
chemical fertilizers, fungicides, herbicides, insecticides, and labor) which were mainly binary (yes or no
usage of specific inputs in the last twelve months). Respondent participation in the various CLPI programs
was also recorded. Data on yields were self-reported by farmers along with farm size and as such could be
underestimated or overestimated, and data on input usage was mainly binary (yes or no usage of specific
inputs) without the application times or quantities of these inputs and as such was not able to properly

21
account for their influence on yield. Also farmers were not asked about the age and replacement rates of
cocoa trees on their farm; as such the study does not account for the influence of tree age on cocoa yield.
Daily precipitation data (mm) were collected from aWhere at the village level for both 2009/10 and 2012/13
cocoa growing seasons with data available for only Ghana and Côte d’Ivoire. Awhere provides daily
weather observations on weather variables including, but not limited to: precipitation (mm), minimum and
maximum temperatures (oC), and growing degree days with a flexible threshold that can be adjusted online.
This study only uses daily precipitation data. These data were available at a five arc-minute resolution, or
about nine kilometer square grid cells. The weather data were collected by a combination of global
meteorological on-the-ground stations and orbiting weather satellites. These data were the approximate
equivalent of having a ground station every nine kilometers. The advantage for this study of using data at
this resolution was that individual villages had unique weather data unless multiple villages were contained
within the same 92 km grid cell.

22
4. Results
4.1 Descriptive statistics for the dependent and independent variables
The descriptive statistics of the dependent and independent variables are presented in Table 3. Average
cocoa yield aggregating both growing seasons across all four counties was estimated at 383kg/ha. Average
cocoa yield was higher in the 2012/13 growing season relative to the 2009/10 season with the highest
average yields recorded in Nigeria (854.5 kg/ha), followed by Côte d’Ivoire (416.1 kg/ha), Ghana (412.6
kg/ha) and Cameroon (194.2 kg/ha). The average farm size across all countries for the two seasons was
estimated at 3.7ha: The largest farms were recorded in Cameroon at 4.1ha, followed by Côte d’Ivoire
(3.8ha), Ghana (3.7ha), and Nigeria (3.1ha). Inorganic fertilizer usage for the 2012/13 season was highest
in Ghana and Nigeria at 33.1%, and followed by Côte d’Ivoire (20.3%) and Cameroon (8.5%). Package
exposure shows that the FFS only package has the highest proportion in terms of package exposure of
30.3%, this is followed by the Full package (13%) and then FBS only package (4.4%). Table 3 also shows
that the proportion of the Full package exposure was highest in Cameroon at 29.4%, and followed by
Nigeria (28.1%), Côte d’Ivoire (7.5%) and then Ghana (6.6%). The study had a total of 40 districts in the
sample: 17 form Ghana, 14 from Nigeria, 5 from Côte d’Ivoire and 4 from Cameroon. Mean cumulative
precipitation levels in Ghana were estimated at 191.04mm, 413.18mm and 153.60mm for the main crop
flowering (SUPR1), main crop maturation (SUPR2) and light crop maturation (SUPR3) periods
respectively. Mean seasonal cumulative precipitation levels in Côte d’Ivoire were estimated at 232.28mm,
393.89mm and 151.94mm for SUPR1, SUPR2 and SUPR3, respectively.
4.2 Regression Results for CLPI Impact
Table 4 presents the regression estimates for all four countries. As expected, the coefficient of determination
was relatively low across all four models since the data are cross-sectional. Because of the cross sectional
nature of the sample, the study used White (1980) heteroscedasticity consistent estimates of the coefficient
covariance matrix estimation to obtain consistent estimates of the coefficient standard errors.

23
CLPI Impact
The coefficient of the variable CLP, which was statistically insignificant in all four countries shows that all
things being equal, there does not seem to be any detectable differences between by farmers who were
exposed to at least one CLPI package and those farmers who had no CLPI package exposure. This means
the sample seems to be random. Of the four CLPI packages, only FULLP was consistently significant
(P<0.05 or better) in all four counties, with an associated yield increase of approximately 36.3%, 37.7%,
49.2% and 35.0%, respectively in Ghana, Côte d’Ivoire, Nigeria and Cameroon. This implies that farmers
in all four countries who were exposed to FULLP have an increase yield compared to farmers who were
not exposed to any of the CLPI packages. It is not surprising that the other packages that did not include
the input credit package component of CLPI are not consistently significant given that FFS only teaches
good agricultural practices to farmers and may not necessarily increase yields without the additional use of
inputs. The focus of FFS is increased adoption of good production practices to enable farmers better manage
their cocoa farms. The immediate impact of FFS should be improved production skills to enable cocoa
farmers to better manage their farms through fertilizer use and prevention of pest and disease (Nalley,
2013). Secondly, FBS may not necessarily increase cocoa yields but rather increase the adoption of good
business practices among farmers which in turn will help shift the farmer’s perceptions from farming as a
lifestyle to farming as a business and have less of a direct effect on yield.
Precipitation
During the main crop flowering period in Ghana, precipitation (SUPR1) increased yield by 5% for every
1% increase in daily precipitation. In Ghana the weather variables (SUPR2 and SUPR3) were insignificant.
None of the weather variables (SUPR1, SUPR2 and SUPR3) were significant in Côte d’Ivoire. This general
lack of significance is surprising and suggests that more research is necessary to better identify how weather
variables should be formulated to identify the weather’s impact on yield. Nonetheless research done by
Faisal (1969) on yield of cocoa from a large-scale experiment over seven years in Ghana suggest that there

24
was a positive association between yield and rainfall during the periods mid-February to mid-April, from
July to mid-October and at the beginning and end of the year, but a negative association during other
periods.
Inputs
Farm size was consistently significant (p < 0.01) in all four countries, for every 1% increase in farm size,
production decreased by no less than 0.28%. This was expected because farmer’s labor resources are
typically finite so that yields tend to be higher on smaller farms because the farmers have more labor per
hectare (Teal et al.,2006). The fertilizer variable (FERT) was significant (P < 0.1) in all four countries with
associated yield increases of 20.9%, 22.1%, 25.9% and 18.5% in Ghana, Côte d’Ivoire, Nigeria and
Cameroon, respectively, given the application of inorganic fertilizer. The use of pesticides (PEST) was
significant (P < 0.01) in only Nigeria with associated yield improvements of 39.10%. The herbicide variable
(HERB) was significant in only Côte d’Ivoire (P<0.01) and Nigeria (P<0.1) with associated yield increase
of 25.9% and 39.1%, respectively, given the application of herbicide. The labor variable (LBR) was
significant in Ghana (P<0.05), Côte d’Ivoire (P<0.05) and Cameroon (P<0.01), with associated yield
increase of 13.9%, 11.6% and 33.6% respectively, given the usage of hired labor. The relationship is not
surprising given that the majority of the farmers in the sample have small farms which average 3.7ha, and
as indicated by Teal et al.(2006), smallholder farmers are endowed with more labor per hectare and labor
has a positive relationship with cocoa yields.
4.3 Estimated Returns to the CLPI
Table 5 presents the annual NPV estimates for the yield increase associated with exposure to the full CLPI
package (FULLP) across the four countries in Table 4. Using the procedure developed by Mahrizal et al.
(2013), the optimum replacement rate (ORR) of cocoa trees in all four countries was estimated to range
between 5%-6%. The optimal initial replacement year (IRY) ranges from year 7 to year 8 in Ghana, Côte
d’Ivoire and Cameroon and from year 4 years in Nigeria. The differences in IRY and ORR across the four

25
countries are partly due to the differences in economic variables which influence NPV. Here these variables
mainly included inflation rate and discount rates: Nigeria had the lowest IRY because its inflation rate was
higher that than its discount rate. It is more beneficial to attain steady state (a state in production when
revenues become stable over tine) much quicker. Given the solution to the ORR and IRY in each country,
the annual NPV for 25 years associated to exposure to the full CLPI package were estimated at $530, $561,
$538 and $448 respectively for Ghana, Côte d’Ivoire, Nigeria and Cameroon: these new NPVs were 33%,
26%, 39% and 24% above the baseline NPV in their respective countries.
If all 196,735 participant farmers (Ghana (69,270), Côte d’Ivoire (52,515), Nigeria (42,739) and Cameroon
(32,211)) from all four countries should experience the gain in NPV associated with CLPI, there will be a
total annual gain in NPV of approximately $24,574,966: the highest being in Ghana $9,127,517 followed
by Nigeria ($6,512,324), then Côte d’Ivoire ($6,162,289) and finally by Cameroon ($2,772,835). The
estimated increase annual NPV from the CLPI program across all four countries comes to average annual
NPV increase of $125 per beneficiary farmers: this means that for the 2 million cocoa producing
households who earn a per capita daily income from cocoa production of $1.09-$1.76 ($400-$640
annually), the $125 increase in NPV equates to a 19%-31% increase in annual income from cocoa
production.
4.4 Benefit-Cost Ratio
The benefit cost ratio was estimated as the difference between the baseline NPV (no training) and the full
CLPI package (FUULP) estimated NPV divided by the cost of the CLPI program per participant. The results
presented in Table 5 show that the estimated NPV increase resulted in estimated BCR’s for a 25 year period
of 22:1, 23:1, 19:1 and 17:1 for Ghana, Côte D’Ivoire, Nigeria and Cameroon, respectively. These ratios
imply that every dollar spent on human capital development resulted in a $22, $23, $19 and $17 increases
in NPV for participating cocoa producers in Ghana, Côte d’Ivoire, Nigeria and Cameroon, respectively.

26
It should be noted that like Norton et al. (2013), these estimates are considered to be conservative given
that (1) training cost decreases over time as training mechanisms become efficient; Norton et al. (2013)
estimated the cost of CLPI per beneficiary at $252 which is 66% higher than this study’s estimates of $151
given that more farmers have been reached since the Norton et al. (2013) study, and (3) the estimated NPV’s
are on a per hectare basis, hence while the cost of the CLPI is fixed, the benefits which may increase with
one more additional hectare will cause the BCR’s to also increase; for example if all farmers were assumed
to have 1.5 hectares of cocoa farms, the return on human capital investment will now be estimated at $33,
$34, $29 and $25 respectively Ghana, Côte d’Ivoire, Nigeria and Cameroon. But such expansions might
force other cocoa farmers out of cocoa production so that the countrywide effect would diminish. The
estimates are not conservative if the impact of larger supply causes a decrease in price. A sensitivity analysis
of the CLPI estimated BCR’s in Table 6 indicates that the minimum yield increase that farmers would have
to achieve in order to have their estimated NPV cover the full cost of the program is estimated at 18.0%,
24.4%, 37.2% and 23.4% respectively Ghana, Côte d’Ivoire, Nigeria and Cameroon. This studies results
indicate that the estimated CLPI yield enhancement appear to be robust given the magnitude of the
difference between the yield increase for break-even scenario and the CLPI for all four countries (Ghana
;18%, Côte d’Ivoire ;13%, Nigeria;12% and Cameroon;12% in Table 6).

27
5. Conclusion and Recommendations
Institutional reforms during the Structural Adjustment Programs (SAPs) in West Africa and the subsequent
liberalization of cocoa markets have resulted in decreased levels of public goods such as research and
extension. While the research and extension service gap has been partially filled by NGOs and other private
donors, those donors who remain active in funding development programs in low income countries are
starting to require higher resolution metrics useful for evaluating the effectiveness of all development
programs. Using data from 2,048 on-the-ground farm observations in Ghana, Côte D’Ivoire, Nigeria and
Cameroon, from pre and post CLPI intervention periods (2009/10 and 2012/13 growing seasons) and
applying a difference-in-difference estimation method, this study estimated yield enhancement attributable
to the CLPI, a current WCF project aimed at doubling the income of cocoa-growing households in SSA.
Using those yield enhancements, a NPV model was used to estimate the value of CLPI over the 25-year
lifecycle yield curve of a cocoa tree. The programs goal was to increase business skills, pruning techniques,
and introduce best management practices, all of which build human capital. Thus, the full benefits of the
program should persist long after the official, four-year training is over.
We assumed the gains from CLPI would last 25 years—the fruitful life of a cocoa tree—and this allowed
estimating the BCR of CLPI for four Sub-Saharan Africa countries: Ghana, Nigeria, Cameron and Cote
d’Ivoire. The results from the difference-in-difference estimation of yield enhancements attributable to
CLPI were 33%, 26%, 39% and 24% per hectare annually in Ghana, Côte d’Ivoire, Nigeria and Cameroon,
respectively. The results indicate that for every dollar spent on human capital development via the CLPI
resulted in producer gains of $22, $23, $19 and $17 in Ghana, Côte d’Ivoire, Nigeria and Cameroon,
respectively. One potential limitation of the study is the scope of the data in terms of how they were
measured. Where the data was mainly binary, a more appropriate measure will be to have it in a scalar form.
About 48.5% of the population lives on $1.25 or less per day and a majority of cocoa producers live in
small, rural, impoverished households, measuring the impact of research and extension service by

28
agricultural development programs such as the CLPI can generate information needed to illustrate the
potential of skill attainment to alleviating poverty, particularly when trying to encourage prospective donors
to participate in outreach programs.

29
References
ADB. (2014). ADB Socio-economic Database. African Development Bank Group: Statistics. Retrieved
September 01, 2014, from http://dataportal.afdb.org/
Afari-Sefa, V., Gockowski, J., Agyeman, N. F., & Dziwornu, A. K. (2010). Economic Cost-Benefit
Analysis of Certified Sustainable Cocoa Production in Ghana. African Association of Agricultural
Economists (AAAE).
Ahmed, I. I., & Lipton, M. (1997). Impact of Structural Adjustment on Sustainable Rural Livelihoods: A
Review of the Literature (p. 32). Institute of Development Studies.
Antista, J. (2014). TechnoServe Cocoa Livelihoods Annual Report (pp. 1–20).
Cabral, L. (2007). Funding agriculture: Not “how much?” but “what for?” (No. 86). Opinion, Overseas
Development Institute.
CRIG. (2010). Cocoa Manual: A Source Book For Sustainable Cocoa Production.
Duflo, E., Glennerster, R., & Kremer, M. Using Randomization in Development Economics Research: A
Toolkit, T. Schultz and John Strauss, eds., Handbook of Development Economics (2008).
Amsterdam and New York: North Holland.
Fairtrade Foundation. (2011). Fairtrade and Cocoa, Commodity Briefing.
Faisal, A. M. (1969). Effects of Rainfall on Yield of Cocoa in Ghana. Experimental Agriculture, 5(03),
209–213. doi:10.1017/S0014479700004452
FAO. (2014). FAOSTAT. Food and Agriculture Organization of the United Nations. Retrieved August 31,
2014, from http://faostat.fao.org/
FAOSTAT. (2014). Production and Trade Statistics. Food and Agriculture Organization of the United
Nations Statistics. Retrieved August 20, 2014, from http://faostat3.fao.org/faostat-
gateway/go/to/home/E
Gilbert, C. L. (2009). Cocoa Market Liberalization in Retrospect. Review of Business and Economics,
LIV(3), 294–312.
Gockowski, J., Afari-Sefa, V., Sarpong, D. B., Osei-Asare, Y. B., & Dziwornu, A. K. (2011). Increasing
Income of Ghanaian Cocoa Farmers: Is Introduction of Fine Flavour Cocoa a Viable Alternative.
Quarterly Journal of International Agriculture, 50(2), 175–200.
Gockowski, J., Asamoah, C., David, S., Gyamfi, I., & Kumi, M. A. (2010). An Evaluation of Farmer
Field School Induced Changes in Ghanaian Cocoa Production. Journal of International Agricultural
and Extension Education, 17(3), 43–56. doi:10.5191/jiaee.2010.17304
Government of Ghana. (2011). The Budget Statement and Economic Policy of the Government of Ghana
for the 2011 Financial Year. Accra,Ghana.
Government of Ghana. (2012). The Budget Statement and Economic Policy of the Government of Ghana
for the 2012 Financial Year. Accra,Ghana.
Government of Ghana. (2013). The Budget Statement and Economic Policy of the Government of Ghana
for the 2013 Financial Year. Accra,Ghana.
Government of Ghana. (2014). The Budget Statement and Economic Policy of the Government of Ghana
for the 2014 Financial Year. Accra,Ghana.

30
Gunning, J. W., & Elbers, C. (2013). Evaluation of development programs : randomized controlled trials
or regressions ?, 1–31.
Hill, R. V., & Torero, M. (2009). Innovations in insuring the poor (p. 36). Intl Food Policy Res Inst.
ICCO. (2010). The World Cocoa Economy: Past and Present. London.
ICCO. (2012a). International Cocoa Organization Annual Report Rapport Annuel 2011/2012.
ICCO. (2012b). The World Cocoa Economy: Past and Present. London.
ICCO. (2014). ICCO Monthly Averages of Daily Prices. ICCO.org. Retrieved August 20, 2014, from
http://www.icco.org/statistics/cocoa-prices/monthly-
averages.html?currency=usd&startmonth=01&startyear=2010&endmonth=12&endyear=2010&sho
w=table&option=com_statistics&view=statistics&Itemid=114&mode=custom&type=1
ICI. (2011). Cocoa Farming, an overview. Châtelaine, Switzerland.
IDH. (2011). The Cocoa Productivity and Quality Program Prospectus.
ILO. (2012). ILO Global Wage Database 2012. ILO Globsl Reports. Retrieved August 20, 2014, from
http://www.ilo.org/public/english/download/global-wage-report-2012/ilo-global-wage-database-
2012.xls
IMF-IFS. (2014). IMF International Financial Statistics. International Monetary Fund International
Financial Statistics (IFS). Retrieved August 18, 2014, from http://elibrary-
data.imf.org/ViewData.aspx?saved_id=6117
Mahrizal, Nalley, L. L., Dixon, B. L., & Popp, J. S. (2013). An optimal phased replanting approach for
cocoa trees with application to Ghana. Agricultural Economics, 45(3), 291–302.
doi:10.1111/agec.12065
Meyer, B. D. (1995). Natural and Quasi-Experiments in Economics. Journal of Business and Economic
Statistics, 13(2), 151–161.
Nalley, L. (2013). Quantifying the Environmental Impacts of Improved Cocoa Production in West Africa.
Ndiaye, M., Budiansky, E., & Houston, H. (2013). Global Development Annual Progress Report: Cocoa
Livelihoods Program (pp. 1–25). Washington, DC.
Norton, M., & Nalley, L. (2013). Cost-Benefit Analysis of Farmer Training In Ghanaian Cocoa Farming.
The University of Arkansas Undergraduate Research Journal, 15(2), 45–68.
Nyemeck, J. B., Gockowski, J., & Nkamleu, G. B. (2008). The Role of Credit Access in Improving Cocoa
Production in West African Countries. Proceedings of the 2nd AAAE Conference, Held August 20-
22, 2007 in Accra, Ghana.
Opoko, E., Dzene, R., Caria, S., Teal, F., & Zeitlin, A. (2009). Impacts of Group based Microfinance in
Agriculture: Evidence from Ghana’s Cocoa Abrabopa Association. In CSAE Conference,March
2009. Oxford,United Kingdom: University of Oxford.
Teal, F., Zeitlin, A., & Maamah, H. (2006). Ghana Cocoa Farmers Survey 2004: Report to Ghana Cocoa
Board.
Tisdell, C. A., & Silva, N. T. M. H. De. (2008). Supply-maximizing and variation-minimizing
replacement cycles of perennial crops and similar assets: Theory illustrated by coconut production.
Journal of Agricultural Economics, 37(2), 243–251. doi:10.1111/j.1477-9552.1986.tb01593.x

31
UN Comtrade. (2013). Annual Totals Table (ATT) For Imports and Exports. International Merchandise
Trade Statistics Section. Retrieved September 14, 2014, from
http://unstats.un.org/unsd/trade/imts/UNSD Annual Totals Table (ATT) 2000-2012 (as of 15 Dec
2013).xls
UNDP. (2009). Handbook on Planning, Monitoring and Evaluating For Development Results. New York.
WCF. (2009). Cocoa Livelihoods Program Summary (pp. 0–1). Washington, D.C.
WCF. (2011). World Cocoa Foundation, Cocoa Livelihoods Program :Preliminary Impact Survey
Findings. Washington, D.C.
WCF. (2012). Cocoa Livelihoods Program.
WCF. (2014a). About World Cocoa Foundation (WCF). worldcocoafoundation.org. Retrieved September
14, 2014, from http://worldcocoafoundation.org/about-wcf/
WCF. (2014b). Cocoa Market Update (2014).
Wegner, L. (2012). Cocoa Fact Sheet. Wageningen.
White, H. (1980). A Heteroskedasticity-Consistent Covariance Matrix Estimator and a Direct Test for
Heteroskedasticity. Econometrica, 48(4), 817–38.
Wilcox, M. D., & Abbott, P. C. (2006). Can Cocoa Farmer Organizations Countervail Buyer Market
Power? 2006 Annual Meeting, July 23-26, Long Beach, CA.
World Bank. (2011). International Comparison Program Database. ICP World Bank. Retrieved August
18, 2014, from http://siteresources.worldbank.org/ICPINT/Resources/270056-
1183395201801/2011-International-Comparison-Program-results.xlsx
World Bank. (2013). Africa Development Indicators. World Bank Data. Retrieved August 31, 2014, from
http://data.worldbank.org/data-catalog/africa-development-indicators
World Bank. (2014). Summary of Results and Findings of the 2011 International Comparison Program. In
Global Purchasing Power Parities and Real Expenditures. Washington, DC: World Bank.

32
Tables
Table 1:
Description of regression independent variables
Variable Meaning Form
Time Effect, Treatment Group and CLPI Variables
YR13 Takes on the value one in post-CLPI period and zero in in pre-CLPI
period Dummy
CLPI Indicator for CLP experimental Group Dummy
FULLP Indicator for participation in the full CLPI package Dummy
FBP Indicator for participation in the FFS and FBS only package Dummy
FFSP Indicator for participation in the FFS only package Dummy
FBSP Indicator for participation in the FBS only package Dummy
Precipitation in millimeters
SUPR1 Season’s average precipitation for the main crop flowering Natural Log
SUPR2 Season’s average precipitation for the main crop maturation and light
crop flowering Natural Log
SUPR3 Season’s average precipitation for the light crop maturation Natural Log
Inputs
SIZE Farm size in ha Natural Log
FERT Indicator for usage of inorganic fertilizer Dummy
PEST Indicator for usage of pesticide Dummy
HERB Indicator for usage of herbicide Dummy
LBR Indicator for usage of hired labor Dummy
HLBOR Indicator for usage of household labor Dummy
Farmer and Farm Demographics
GENDER Indicator for Male Dummy
EDU Farmer's years of formal education t Natural Log
FBO Indicator for Farmer Based Organization membership Dummy
PRUN Indicator for pruned farm in the past year Dummy
IMPRVAR Indicator for new improved varieties of cocoa planted in the past four
years Dummy
MLC Indicator for underestimated annual cocoa yield because light crop
yields were not recorded Dummy

33
Table 2
Estimated Cost of Inputs for Production and Yield Multipliers
Country
a Yield
Multiplier
b Wage
($/Day)
c Pesticide
($/l)
c Fungicide
($/50g)
c Fertilizer
($/50kg)
Ghana 1.00 2.22 6.17 1.85 13.52
Côte d’Ivoire 1.67 2.59 9.54 2.86 20.91
Nigeria 0.91 3.88 7.03 2.11 15.41
Cameroon 0.96 2.00 9.94 2.98 21.79
Note: a Ghana =1 estimated from results from country fixed effects. b Denotes data retrieved from ILO (2012) c Denotes data estimated using Price Level Indexes (PLI) obtained from World Bank (2011)

34
Table 3:
Descriptive Statistics for Regression Variables
Ghana Côte d’Ivoire Nigeria Cameroon
2009/10 2012/13 2009/10 2012/13 2009/10 2012/13 2009/10 2012/13
Sample 350 350 400 400 121 121 153 153 aYield
(kg/ha)
284.3
(187.2)
412.6
(285)
284.6
(210.5)
416.1
(306)
376.8
(232.6)
854.5
(675.6)
264.4
(124.5)
264.9
(194.2)
SIZE
(ha)
3.7
(3.0)
3.7
(3.0)
3.8
(2.9)
3.8
(2.9)
3.1
(2.7)
3.1
(2.7)
4.1
(2.7)
4.1
(2.7)
Time Effect, Treatment Group and CLPI Variables (%)
YR13 - 100 - 100 - 100 - 100
CLPI 44.3 44.3 50.8 50.8 63.6 63.6 33.3 33.3
FULLP - 6.6 - 7.5 - 28.1 - 29.4
FBP - - - - - - - -
FFSP - 33.7 - 43.3 - 13.2 - 3.9
FBSP - 4.0 - - - 22.3 - -
Precipitation (mm)
SUPR1 320.6
(64.9) -
381.9
(128.9) - - - - -
SUPR2 533.9
(92.2)
264.8
(68.1)
393.6
(136.2)
286.9
(40.8) - - - -
SUPR3 533.9
(92.2)
264.8
(68.1)
393.6
(136.2)
286.9
(40.8) - - - -
Inputs (%)
FERT 49.1 33.1 11 20.3 8.3 33.1 5.2 8.5
PEST 80.6 92.3 52.5 66.3 94.2 95 88.2 91.5
HERB 31.4 54.6 24.8 34.5 27.3 53.7 17 43.8
LBR 61.1 76.3 59.5 42.8 84.3 96.7 60.1 60.1
HLBOR 51.1 97.7 46.3 94.8 68.6 88.4 62.7 97.4
Demographics
GENDER
(%) 55.7 55.7 89.8 89.8 84.3 84.3 89.5 89.5
EDU
(Years)
6.9
(4.1)
6.9
(4.1)
4.4
(3.9)
4.4
(3.9)
7.8
(5.0)
7.8
(5.0)
7.4
(3.8)
7.4
(3.8)
FBO (%) 16.3 29.4 22.5 32.8 17.4 34.7 31.4 25.5
IMPRVAR
(%) 49.7 72 25.5 39.8 52.9 83.5 33.3 71.2
PRUN (%) 68.6 86.9 59.3 75 76 88.4 53.6 81.7
MLC (%) 8.6 2.3 - 5 - 8.3 - 39.9
No.
Districts 17 17 5 5 14 14 4 4
a Denotes estimations that excludes observations with missing light crop. b Denotes the dependent variable.
Parentheses denote standard deviation.

35
Table 4:
Regression Results
Country Ghana Côte D’ivoire Nigeria Cameroon
YR13 3.49** 0.23 0.32** -0.04
CLPI 0.04 0.02 0.04 0.05
FULLP 0.31*** 0.32** 0.40** 0.30**
FFSP -0.02 0.07 0.06 0.03
FBSP -0.19 - 0.39** -
SUPR1 0.50** -0.01 - -
SUPR2 0.61 0.05 - -
SUPR3 -0.27 0.10 - -
SIZE -0.32*** -0.28*** -0.30*** -0.30***
FERT 0.19*** 0.20*** 0.23** 0.17*
PEST -0.01 0.01 0.30*** -0.03
HERB 0.04 0.23*** 0.33* 0.06
LBR 0.13** 0.11** 0.03 0.29***
HLBOR 0.05 0.23*** 0.10 0.02
GENDER 0.13** 0.05 -0.1 0.01
EDU 0.003 -0.005 0.01 -0.07
FBO 0.10* 0.16*** 0.04 0.12*
PRUN -0.05 0.04 -0.25** -0.04
IMPRVAR -0.09 -0.08 0.29** -0.01
MLC -0.41** 0.04 -0.43** -0.41***
CONSTANT 0.13 4.35*** 4.99*** 5.7***
Regression Statistics
Sample 700 800 242 306
DF 662 775 210 285
R-Square 34.2% 20.1% 45.3% 28.0%
Akaike 0.430 0.570 0.442 0.297
Districts 17 5 14 4
Note:
Significance levels: * P<0.10, ** P<0.05, ***P<0.01

36
Table 5:
Summary of Net Present Value (NPV) and percentage change in NPV over two production cycles (25
years) for the LILC production system with estimated yield increases from CLPI.
Country
CLPI
Yield
Increase
IRY
(ORR)
Baseline
NPV
CLP I
NPVa
NPV
Change
CLP I
Cost/
Farmerb
BCR
Ghana 36.30% 8, (5.9%) $9,957 $13,251 33.10% $151 22
Côte d’Ivoire 37.70% 8, (5.9%) $11,091 $14,025 26.40% $128 23
Nigeria 49.20% 4, 5.8%) $9,651 $13,461 39.50% $200 19
Cameroon 35.00% 8, (5.9%) $9,050 $11,202 23.80% $130 17 a This includes 60% increased input costs per year, modeled after High Input Medium Shade Cocoa
(HIMSC) in Afari-Sefa et al. (2010). b Estimated beneficiaries exclude the additional 20,000 farmers trained through the matching grants.
Table 6:
Sensitivity Analysis of the CLPI Estimated Benefit Cost Ratio
Ghana Côte D’ivoire
Yield increase NPV NPV Change BCR NPV NPV Change BCR
Baselinea $9,957 0.0% 0.0 $11,091 0.0% 0.0
CLPIbd $13,251 d 33.1% 19.3 $14,025 26.4% 17.2
75% of CLPI $11,709 d 17.6% 10.2 $12,081 8.9% 5.8
Breakeven c 18.0% 24.4%
Nigeria Cameroon
Yield increase NPV NPV Change BCR NPV NPV Change BCR
Baselinea $9,651 0.0% 0.0 $9,050 0.0% 0.0
CLPIbd $13,461d 39.5% 22.3 $11,202 23.8% 12.6
75% of CLPI $9,746 d 1.0% 0.6 $9,709 7.3% 3.9
Breakevenc 37.2% 23.4%
Note: a Denotes estimate for pre CLPI scenario, modeled after Low Input Landrace Cocoa (LILC) production
system. b Denotes estimate for post CLPI scenario, modeled after High Input Medium Shade Cocoa (HIMSC)
production system. c Denotes yield increase necessary to make the BCR equal to one d Estimate includes 60% increased input costs per year due to introduction of inorganic fertilizer

37
Figures
Fig. 1
CLPI Program Packages (bundles of training and services)

38
Source: Generated from production systems presented in Afari-Sefa et al. (2010) and Gockowski et al. (2011)
Fig. 2. Cocoa yield curves over one production cycle (25 years) in Pre and Post CLPI Periods in Ghana,
Côte d’Ivoire, Nigeria and Cameroon
0
200
400
600
800
1000
0 5 10 15 20 25
Yie
ld (
Kg/H
a/Y
ear)
Year
(A) Yeild Curve for Pre - CLPI Period
Ghana Côte d’Ivoire Nigeria Cameroon
0
200
400
600
800
1000
1200
0 5 10 15 20 25
Yie
ld (
Kg/H
a/Y
ear)
Year
(B) Yeild Curve for Post - CLPI Period
Ghana Côte d’Ivoire Nigeria Cameroon
39
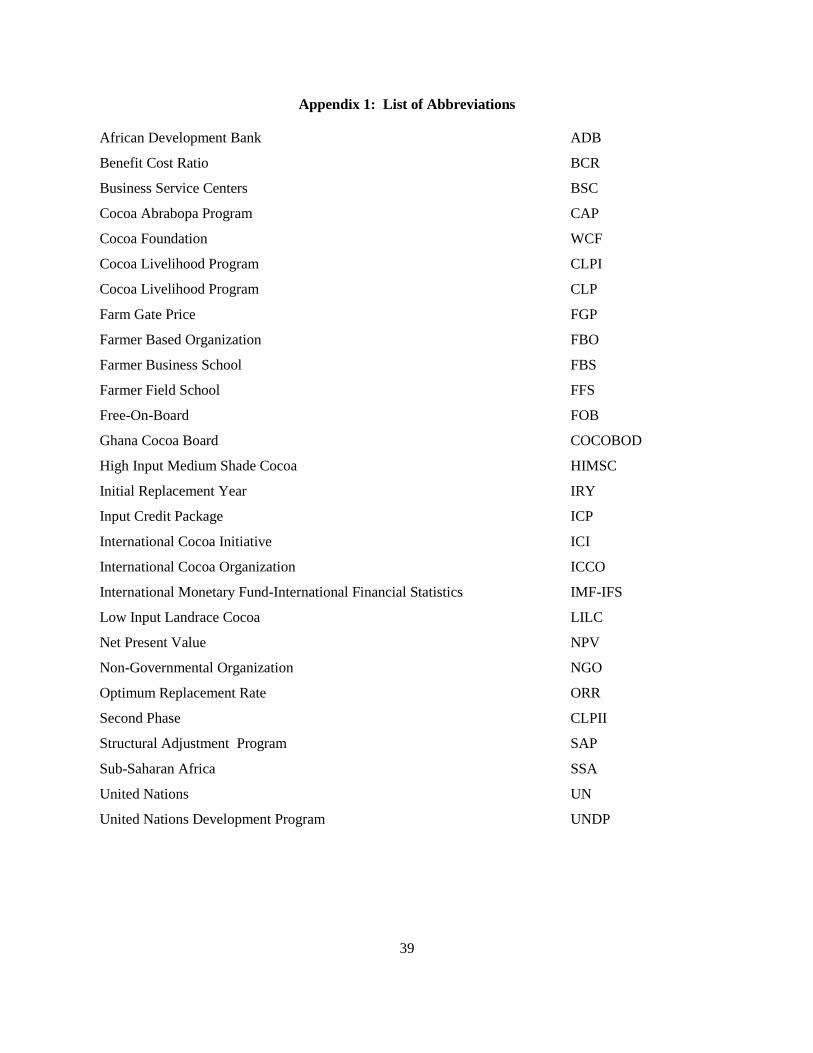
Appendix 1: List of Abbreviations
African Development Bank ADB
Benefit Cost Ratio BCR
Business Service Centers BSC
Cocoa Abrabopa Program CAP
Cocoa Foundation WCF
Cocoa Livelihood Program CLPI
Cocoa Livelihood Program CLP
Farm Gate Price FGP
Farmer Based Organization FBO
Farmer Business School FBS
Farmer Field School FFS
Free-On-Board FOB
Ghana Cocoa Board COCOBOD
High Input Medium Shade Cocoa HIMSC
Initial Replacement Year IRY
Input Credit Package ICP
International Cocoa Initiative ICI
International Cocoa Organization ICCO
International Monetary Fund-International Financial Statistics IMF-IFS
Low Input Landrace Cocoa LILC
Net Present Value NPV
Non-Governmental Organization NGO
Optimum Replacement Rate ORR
Second Phase CLPII
Structural Adjustment Program SAP
Sub-Saharan Africa SSA
United Nations UN
United Nations Development Program UNDP


![Principles and Standards for Benefit–Cost Analysis] Introduction- Professionalizing Benefit–Cost Analysis](https://static.fdocuments.in/doc/165x107/56d6beb21a28ab30169333bb/principles-and-standards-for-benefitcost-analysis-introduction-professionalizing.jpg)