Cost-Benefit Analysis for GMES...Booz & Company Date: 19th September 2011 Cost-Benefit Analysis for...
249
FINAL VERSION II Cost-Benefit Analysis for GMES European Commission: Directorate-General for Enterprise & Industry London 19 th September 2011 Disclaimer: The study is subject to a disclaimer and copyright. The study has been carried out for the European Commission and expresses the opinions of the organisations having undertaken them. The views have not been adopted or in any way approved by the European Commission and should not be relied upon as a statement of the European Commission's views. The European Commission does not guarantee the accuracy of the information given in the studies, nor does it accept responsibility for any use made thereof.
Transcript of Cost-Benefit Analysis for GMES...Booz & Company Date: 19th September 2011 Cost-Benefit Analysis for...

FINAL VERSION II
Cost-Benefit Analysis for GMES
European Commission: Directorate-General for Enterprise & Industry
London
19th September 2011
Disclaimer:
The study is subject to a disclaimer and copyright. The study has been carried out for the
European Commission and expresses the opinions of the organisations having undertaken
them. The views have not been adopted or in any way approved by the European
Commission and should not be relied upon as a statement of the European Commission's
views. The European Commission does not guarantee the accuracy of the information
given in the studies, nor does it accept responsibility for any use made thereof.

Booz & Company
Date: 19th September 2011 Cost-Benefit Analysis for GMES Final Version II
Prepared for: European Commission Directorate – Enterprise and Industry
i
Table of Contents
Executive Summary ........................................................................................................................................ 1
1. Introduction ..................................................................................................................................... 10
1.1 Background ........................................................................................................................ 10
1.2 The Role of GMES.............................................................................................................. 11
1.3 GMES Components ........................................................................................................... 11
1.4 GMES Domains .................................................................................................................. 12
1.5 Scope of the Study ............................................................................................................. 13
1.6 Approach to the Study and Structure of the Report ..................................................... 13
2. GMES Strategic Context ................................................................................................................ 17
2.1 Introduction ........................................................................................................................ 17
2.2 Strategic Context of Earth Observation at a Global Level ............................................ 17
2.3 EU Interest in Earth Observation .................................................................................... 20
2.4 Summary ............................................................................................................................. 26
3. Climate Change ............................................................................................................................... 27
3.1 Introduction ........................................................................................................................ 27
3.2 Policy Framework .............................................................................................................. 28
3.3 Role for GMES .................................................................................................................... 28
3.4 Impacts of Climate Change and the Cost of Carbon .................................................... 33
4. Environment & Security ................................................................................................................ 41
4.1 Introduction ........................................................................................................................ 41
4.2 Environmental Management ........................................................................................... 41
4.3 Resource Management ...................................................................................................... 47
4.4 Emergency Management .................................................................................................. 52
4.5 Security and Humanitarian Applications ...................................................................... 59
5. Industry Development ................................................................................................................... 64
5.1 Introduction ........................................................................................................................ 64
5.2 EU Space Strategy .............................................................................................................. 64
5.3 European Earth Observation Industry ........................................................................... 65
5.4 Current State and Future Prospects of the Earth Observation Sector ........................ 70
5.5 Wider Economic Impacts of the Space Sector ................................................................ 71
6. The Economic Value of GMES ..................................................................................................... 76
6.1 Introduction ........................................................................................................................ 76
6.2 Value of Earth Observation .............................................................................................. 76
6.3 Traditional Approaches to Benefit Estimation .............................................................. 80
6.4 Previous GMES Benefit Studies ....................................................................................... 83
6.5 Recent Developments in Estimating the Benefits of Earth Observation .................... 87
6.6 Conclusions for the GMES CBA ...................................................................................... 94
7. Approach for Quantified Cost-Benefit Assessment ................................................................. 97
7.1 Introduction ........................................................................................................................ 97

Booz & Company
Date: 19th September 2011 Cost-Benefit Analysis for GMES Final Version II
Prepared for: European Commission Directorate – Enterprise and Industry
ii
7.2 Options ................................................................................................................................ 97
7.3 GMES Services and Foreseen Operations ...................................................................... 99
7.4 Programme Costs ............................................................................................................ 103
7.5 Benefit Assumptions ....................................................................................................... 106
8. Cost-Benefit Analysis .................................................................................................................. 111
8.1 Introduction ...................................................................................................................... 111
8.2 Results ............................................................................................................................... 113
8.3 Sensitivity Tests ............................................................................................................... 128
8.4 Conclusion and Overall Perspective on Cost-Benefit Analysis Results ................... 137
9. GMES Benefit Enablers ............................................................................................................... 141
9.1 Challenges for the Future ............................................................................................... 141
9.2 Data Policy ........................................................................................................................ 141
9.3 Downstream Sector ......................................................................................................... 143
9.4 Sentinel Ownership ......................................................................................................... 144
9.5 Role of Users..................................................................................................................... 144
9.6 Sustaining Economic Benefits ........................................................................................ 145
9.7 Funding and Financing of GMES .................................................................................. 146
9.8 Governance ....................................................................................................................... 150
9.9 Conclusion ........................................................................................................................ 152
Appendix A Glossary ............................................................................................................................ 153
Appendix B GMES System Details ................................................................................................... 156
Appendix C GMES Services and Foreseen Operations.................................................................. 166
Appendix D Review of Previous CBAs and Other Market Studies ............................................. 186
Appendix E Review of CBA Literature ............................................................................................. 204
Appendix F Economic, Social and Environmental Benefits ......................................................... 219
Appendix G Assumptions for Service Readiness and Take-up .................................................... 234
Appendix H Other CBA Modelling Assumptions .......................................................................... 243

Booz & Company
Date: 19th September 2011 Cost-Benefit Analysis for GMES Final Version II
Prepared for: European Commission Directorate – Enterprise and Industry
1
EXECUTIVE SUMMARY
Introduction & Assessment Approach
Global Monitoring for Environment & Security (GMES) is a joint undertaking of the European Commission, its Member States, the European Space Agency (ESA) and the European Environment Agency (EEA). It is an Earth Observation (EO) programme that seeks to develop operational information services in the fields of environment and security. Through investments in new space infrastructure, the programme aims to create an independent European capacity in EO.
Booz & Company was commissioned by the European Commission to undertake a cost-benefit analysis of the GMES programme. The main focus of this study is the assessment of four broad funding options for GMES and its operational services. In carrying out this exercise, it is important to bear in mind that GMES represents a unique public investment programme which is designed to support a wide array of public policy objectives. To capture benefits across all of those objectives, the authors have developed a strategic evaluation framework. This framework is based on an understanding of the space and EO sectors, and the role EO infrastructure plays in supporting the implementation of government policies aimed at better managing the environment and issues related to security.
The figure below provides an overview of the process which was followed in defining and evaluating the impact of GMES at a strategic level, and how this method can be used to support the assessment of the options.
Approach to Evaluating GMES Impact & Investment Options
Strategic Context
GMES Capability
GMES Impact
GMES Strategy forOption Assessment
� Assess the strategic context for GMES� Critical developments in international and EU landscape� Identify drivers for enhanced EO capability
� GMES design definition� Addressing the technology gap and providing data continuity� Analysis of GMES service offering and operational development
� Define the strategic value of GMES� Strategic value linked to scope for step-change in capability and other
improvements
� Define the strategic focus of GMES as a basis for the assessment of options� Climate change as a top priority linked to step-change in capability� Support to EU policy and other operational needs in line with service offering
GMES Components and Services Domains
The GMES system is composed of 3 main building blocks: (i) the space component, (ii) the in situ component and (iii) the service component.
A satellite constellation for the collection of EO data from space is the primary infrastructure component of GMES. In its operational configuration, the GMES Space Component (GSC)

Booz & Company
Date: 19th September 2011 Cost-Benefit Analysis for GMES Final Version II
Prepared for: European Commission Directorate – Enterprise and Industry
2
will rely on data provided by dedicated GMES missions (the Sentinels), as well as Contributing Missions from national or commercial providers.
The main characteristics of the Sentinels are:
� Sentinel-1 will provide all-weather, day and night radar imagery for land and ocean services;
� Sentinel-2 will provide high-resolution optical imagery for land services;
� Sentinel-3 will provide high-accuracy optical, radar and altimetry data for marine and land services;
� Sentinel-4 and Sentinel-5 will provide data for atmospheric composition monitoring from geostationary orbit and polar orbit, respectively; and
� Sentinel Jason CS will provide Altimetry observations mainly for ocean services.
The in situ component is based on observation infrastructure owned and operated by a large number of stakeholders and coordinated by the European Environment Agency (EEA). The means of observation include ground-based, airborne and ship- or buoy-based sensors and instruments. The need for in situ observation activities, and associated infrastructure, stems from a range of imperatives: local, regional and national environmental management and research; EU and international collaborative agreements, research projects and initiatives, and – in some cases - regulatory frameworks.
The service component refers to the evolving networks of service providers involved in the production and delivery of GMES services. GMES service provision is organised in six domains: atmosphere monitoring; climate change monitoring; emergency management; land monitoring; marine; and security applications. These domains are described as follows:
� Atmosphere: Monitoring atmospheric chemistry and composition to contribute toward Essential Climate Variables (ECVs), measurement of European air quality, and monitoring of solar irradiance and UV (ultraviolet) radiation;
� Climate Change: Monitoring in support of adaptation and mitigation policies through the production of ECVs;
� Land Monitoring: Monitoring of land use to protect ecosystems and facilitate environmental protection and resource management;
� Emergency Management: Services enabling better responses to natural and man-made disasters. This includes supporting pre-event preparation, providing rapid mapping during crisis, supporting post-event recovery and damage assessment, and providing early warning flood alerts;
� Marine: Ocean forecasting and monitoring to contribute to ECVs, monitoring marine environments and contribute to maritime navigation by creating and calibrating three-dimensional models used in prediction and forecasting; and
� Security: Use of Earth Observation to support EU policies in the areas of EU External Action, border control, and maritime surveillance. This includes support to peace-keeping, law enforcement and crisis management operations, and to intelligence and early warning in respect of external regional crises.
GMES Value-Add
EO is seen globally as a critical source of data to enable monitoring and modelling of major issues of global importance using technology that overcomes many of the limitations of

Booz & Company
Date: 19th September 2011 Cost-Benefit Analysis for GMES Final Version II
Prepared for: European Commission Directorate – Enterprise and Industry
3
national or localised observation systems. GMES is Europe’s contribution to the Global Earth Observation System of Systems (GEOSS), a multi-lateral initiative of States and the international scientific community involved in EO and climate research. GEOSS identifies key societal benefits that are the objectives of these systems including:
� Understanding, assessing, predicting, mitigating, and adapting to climate variability and change;
� Reducing loss of life and property from natural and human-induced disasters; and
� Understanding environmental factors affecting human health and well-being.
By providing the EU contribution to GEOSS, GMES fulfils a strategic role for the EU in Earth Observation by:
� Ensuring Europe remains a leading contributor to GEOSS and is recognised as such;
� Enabling greater collaboration between members of GEOSS, enhancing EU policy goals by ensuring access to information from global contributors;
� Enhancing the credibility of the EU at international negotiations by having its own data sources in order to demonstrate its commitment to understanding the global environment; and
� Ensuring the EU has an independent source of information to guarantee the veracity of information used for EU policy purposes at global and European levels.
GMES contributes towards maintaining the strategic influence of the EU in important global policy areas. The GMES programme with a dedicated satellite capacity (the Sentinels) has been designed to augment existing satellite and in-situ data sources. In total, the Sentinels will make a significant contribution to the collection of Essential Climate Variables that provide input to climate models used to forecast future climate change scenarios. In addition, the collection of new data on atmospheric, marine and land conditions can support a wide range of policies at European and national level.
Given that addressing climate change through mitigation and adaptation strategies is a top priority of the EU, with the European Climate Change Programme (ECCP) and the EU commitment to achieving multilateral agreement on climate change within the auspices of the United Nations Framework Convention on Climate Change (UNFCCC), it is apparent that the most significant impact of GMES will be to collect observations to enhance the modelling of future climate change scenarios. Better observations will enable greater confidence in models and forecasts which will impact on strategies for mitigation of and adaptation to climate change, and support EU positions at international negotiations.
In addition to supporting the EU’s global and internal efforts to mitigate and adapt to climate change, the GMES programme will enhance the EU’s understanding of and options to respond to other key policy areas with environmental impact. The EU has a wide range of policy initiatives and strategies directly related to the environment, including the Europe 2020 Strategy and the EU Sustainable Development Strategy. In particular, GMES can assist in understanding and taking steps towards objectives in a number of areas including:
� Biodiversity (e.g. deforestation, desertification, threats to sensitive ecosystems) as expressed through the Biodiversity Action Plan;
� Promotion of improvements in air quality in Europe to improve public health through the Clean Air for Europe programme;

Booz & Company
Date: 19th September 2011 Cost-Benefit Analysis for GMES Final Version II
Prepared for: European Commission Directorate – Enterprise and Industry
4
� Prediction, response and reconstruction associated with major natural disasters (through the Space and Major Disasters Charter and the Community Civil Protection Mechanism);
� Improved targeting of humanitarian aid and assistance programmes to developing countries; and
� Better compliance with funding conditions by recipients from the Common Agricultural Policy.
Investment in GMES infrastructure also contributes to the EU’s industrial policy, by developing the EU Space sector and by facilitating the development of a downstream sector which can take advantage of new data series to sell services to end users on a commercial basis. This supports the EU’s endeavours to promote economic growth and employment, based on new technologically-led industries that have an environmental focus.
Economic Value of GMES
As GMES is a major EU effort to enhance our understanding of Earth science, the main benefit of GMES will be the value of information it provides to support policy action and resource management across the EU and further afield. The Value of Information (VOI) depends on a number of factors regarding the circumstances of decision makers, including the level of uncertainty that they face, what is at stake, the cost of using information, and the cost of the next-best information substitute. A review of academic literature supports the view that there is inherent value in information. Based on this review, there are valid reasons to suggest that the overall extent of the VOI is incremental. These include the ability of GMES to provide additional information that may assist decision making and add to analysis incrementally, rather than provide a transformational difference to a particular sector. These incremental benefits accrue over time as extended time series of observations are available, particularly for strategically important fields such as climate change. As such, GMES has the potential to deliver significant economic value through enhanced EO information.
Approach for the Quantified Cost-Benefit Assessment
The quantified cost-benefit assessment requires the identification and calculation of benefits arising from GMES. These benefits almost exclusively arise from GMES being an enabler of better policy responses to key public policy issues. In order to establish these benefits (and how GMES may reduce various costs), a literature review of the economic value of information, combined with interviews and desktop research, enabled the development of assumptions around the incremental benefit from better EO information. These assumptions have been necessary given the requirements around development of a cost-benefit analysis for what is essentially an information gathering and aggregating tool.
The cost-benefit analysis has required an understanding of the timing of when services are likely to be operational, as well as the period over which benefits are likely to materialise from the introduction of services. From that understanding, the extent to which service guarantees and investment in services impacts on the development of services (and those benefits) has had to be assumed based on interviews and desktop research. A particularly important factor has been to establish the value of the information provided to decision makers and market actors.
Four options were provided for analysis under the cost-benefit assessment:
� Option A (Baseline Option with no on-going commitment to replace infrastructure or investing significantly in services);

Booz & Company
Date: 19th September 2011 Cost-Benefit Analysis for GMES Final Version II
Prepared for: European Commission Directorate – Enterprise and Industry
5
� Option B (Baseline Option Extended, but still with no ongoing commitment to replace infrastructure over the longer term and invest significantly in services);
� Option C (Partial Continuity1, with commitment to provide Sentinel infrastructure and invest considerably in services, with limited support to ensuring continuity of data from Contributing Missions); and
� Option D (Full Continuity with commitment to provide Sentinel infrastructure and enhanced support for the continuity of data from Contributing Mission with full investment in services).
Each option contains profiles of investment in infrastructure (space, in situ), services and user take-up. The analysis is supported by a comprehensive review of GMES services to take account of the level of foreseen operations by 2014. It has provided a strong basis for setting a service baseline for 2014, and demonstrates where additional funding is required to reach operational maturity. The outcomes are specific findings for each benefit area covering operational readiness and time to full maturity. The quantification of benefits is based on an approach that attributes to GMES an incremental improvement in outcomes, e.g. measured as a change in baseline environmental damage costs. This recognises that the attainment of particular outcomes in each benefit area is a result of multiple factors, of which the contribution by GMES is only one part. The extent of GMES contribution has been taken into account in the analysis for each benefit area.
Cost-Benefit Analysis Results
The study has confirmed through qualitative and quantitative analysis that GMES has the potential to be developed into a powerful tool for the EU. GMES enables the EU to engage positively at the global level, but also to work towards achieving EU-wide policy objectives. The quantified cost-benefit analysis assesses four broad funding options.
Key results for each of the four options are presented in the table below. The table shows total benefits, total programme costs and the associated net benefits over the 2014 – 2030 time period of the assessment. Results are cumulative undiscounted and discounted at 4% per annum. All values are expressed with 2010 as the base year.
Summary of Cost-Benefit Analysis for Options A, B, C and D, € Billion, 2010 Prices
Options Option A Option B Option C Option D
Cumulative, Undiscounted
Benefits 3.0 17.0 49.6 71.0
Costs (3.0) (7.0) (14.8) (18.8)
Net Benefits (0.1) 10.0 34.7 52.3
Cumulative, Discounted
Benefits 2.1 10.7 29.4 42.0
Costs (2.1) (4.7) (9.1) (11.5)
Net Benefits (0.0) 6.0 20.4 30.5
BCR 1.0 2.3 3.2 3.7
1 Continuity meaning continued availability of EO data of the same extent and quality over the long term as will be available in the shorter term from contributing missions.

Booz & Company
Date: 19th September 2011 Cost-Benefit Analysis for GMES Final Version II
Prepared for: European Commission Directorate – Enterprise and Industry
6
The analysis has demonstrated the value of remaining committed to the GMES programme. Option A is the one with the lowest net benefits. Increasing levels of commitment to the programme, supported with increasing investments in Sentinel Missions, and hence improving service guarantees, provide increasing levels of benefits. This is demonstrated in Options B and C, although the step-change in Option C is also associated with a much higher level of benefits. However, whilst Option C includes a full investment in Sentinels, it provides limited support of continuity of data from Contributing Missions. This is addressed through Option D where there are additional investments to support greater continuity of data from Sentinel and Contributing Missions.
The figure below shows, for the case of Option D, the cumulative build-up of benefits and costs over time in discounted terms. Option D helps ensure the capture of a more complete range of potential benefits from investing in GMES, including those relating to the development of a comprehensive long-term response within the climate change domain (accounting for 40% of total benefits). The option also provides a strong basis for achieving the EU key strategic policy objectives, including securing GMES within the context of a maximum contribution to industrial policy and the wider economy.
Option D – Cost-Benefit Analysis, € Billion, 2010 Prices
Option D will provide the space and downstream sectors, including SMEs, with the highest practicable certainty of the supply of a wide range of EO data over the medium term. This is expected to provide the greatest opportunity to develop capabilities and competitiveness within the sector, including the widest range of services. This can support future industrial development and support competitiveness with non-EU competitors and firmly secure the EU EO sector in the longer term. In particular, it is important for businesses – and actors in general - to have sufficient confidence that investments are supported by a long term funding commitment on the EO side. If this is not in place, it is likely that benefit realisation could fall short of expectations, particularly in relation to realising benefits from climate change action.
However, it remains clear that Option D requires the EU to make a substantial – and sustained - funding commitment over a long time period. Option D represents a significant step-change in commitment, and would establish GMES as a key tool to inform climate change mitigation and adaptation.

Booz & Company
Date: 19th September 2011 Cost-Benefit Analysis for GMES Final Version II
Prepared for: European Commission Directorate – Enterprise and Industry
7
It is critical to note that there is considerable uncertainty around key parameters that input into the assessment. These uncertainties are inherent in assessing the impacts of the provision of one set of information for a sector into the future, when it is unclear if and to what extent that information will be relied upon to make policy decisions or influence behaviour. The approach that was taken here was to base such assumptions on the best available information from stakeholder interviews and desktop research, but it should be acknowledged that continual changes in economic, social and environmental conditions (and policy objectives) are likely to change such impacts.
Given the overall uncertainty on key parameters used in the cost-benefit analysis, further careful consideration may be advisable. It is possible to gauge the wide range of potential outcomes from the following figure, which illustrates the range from €10.3 billion to €50.8 billion from varying the assumed GMES contribution to benefit areas, with the black line in the middle of range showing the Central Case projection. The range for benefit-cost ratios is 1.9 – 5.4. This report has used assumptions around contributions based on input from interviews, desktop research, guidance from the EC and analysis, based on expected relative importance of GMES in various subject areas.2
Option D – Low, Central and High Case net Benefits with + / - 50% change in GMES Benefits for 2014 - 2030, € Billion, 2010 Prices, Cumulative, Discounted
Sensitivity analyses have been used to compare results to the Euro-GEOSS FeliX model and the Price Waterhouse Coopers study3 of socio-economic benefits of GMES. The FeliX model is shown to generate benefits that are substantially higher (up to 2.9 times more than in Option D). It illustrates a potential up-side scenario to investing in a comprehensive EO system at European level in order to augment Member States’ EO networks.4 Furthermore,
2 It is acknowledged that such assumptions are subjective, and as such assessment of benefits depends in part on the extent
to which GMES is considered to contribute to benefits in a particular sector. 3 Price Waterhouse Coopers undertook a study (‘A Socio-economic Benefits Analysis of GMES’) to identify and quantify the
benefits of GMES in 2008 for ESA. This is the most recent economic analysis of the benefits of GMES. 4 The FeliX model is a systems dynamics model (FeliX (Full of Economic-Environment Linkages and Integration dX/dt))
developed to model the interrelationships between environmental, economic and social subsystems. It provides a modelled example of how EO data can influence future development based on government policy decisions and human

Booz & Company
Date: 19th September 2011 Cost-Benefit Analysis for GMES Final Version II
Prepared for: European Commission Directorate – Enterprise and Industry
8
total benefits projected in the current study are shown to be lower by 2030 than in the PWC study. However, the PWC study assumed the majority of benefits to start from 2011. Comparing the results of this study with a re-modelled PWC benefit projection (i.e. take-up from 2014), it is actually possible to demonstrate a higher result by 2030. Overall, the comparisons with these previous studies provide key reference points which validate the findings of this study.
Finally, it should be stressed that this study represents a first attempt at placing the benefits of GMES within the context of different investment options. The study results may provide additional evidence and objectivity to the fact base required for selecting a preferred option. However, it remains clear that additional option refinement and cost-benefit assessment work is required to optimise any option.
GMES Benefit Enablers
For the full potential of GMES to be realised, some key enablers need to be addressed in the short term. Without resolution of these issues, GMES may still develop and expand its role (and benefits), but there are risks of higher costs, reduced uptake by public sector users and lower growth in the downstream sector. If these risks are not carefully managed then a substantially lower benefit profile may eventuate. These issues have been highlighted by both public and private sector stakeholders during interviews.
The key steps that should be taken to enable the realisation of the potential benefits of GMES include:
� Incorporating a more central role for users in strategic development of the GMES programme;
� Development of a strategic approach to the downstream sector to catalyse engagement and interest, and gain feedback on key priorities for that sector;
� Development of a longer term funding and financing strategy that enables procurement and contracting arrangements to go beyond the Framework Programme5 (FP) funding periods;
� Development of a long term data policy that addresses issues of intellectual property, privacy, data archiving, access policy and relationships with Contributing Missions and in-situ locations;
� Further definition of the selected option, with an ongoing process of optimising expenditure on infrastructure and services, with a dynamic view of benefits and priorities over time; and
� Determination of ownership and operational control of the Sentinels after they have been deployed.
In this context, programme governance is identified as a top priority. GMES requires strong strategic leadership, with a programme approach that is dynamic, has a professional risk management strategy and will engage with users and the downstream sector in the ongoing development and delivery of its programme. It should be focused on delivering across the
behaviour. It is important to recognise that FeliX has not been used to model specific GMES scenarios, and it is difficult to identify the extent to which GMES services are reflected in the underlying model structure and assumptions, and the likely added value of GMES above other available EO systems.
5 European Union Framework Programmes for Research and Technological Development.

Booz & Company
Date: 19th September 2011 Cost-Benefit Analysis for GMES Final Version II
Prepared for: European Commission Directorate – Enterprise and Industry
9
high impact benefit areas such as climate change, environmental policy and facilitating the development of the downstream sector.
If governance is addressed, it can also provide a strategic foundation for the EU developing GMES as a world-class, leading base for EO with a downstream sector that is growing to its potential. Given the sheer scale of investment involved, it would be in the best interests of the EU to maximise the potential return from this, and to take GMES from being partially dependent on a set of research and development projects delivering pilot and pre-operational services, to a fully-fledged operational programme providing a valuable contribution to a wide range of public policy and private purposes. It can do this with a body that is empowered, strategically focused, user oriented and dynamic.

Booz & Company
Date: 19th September 2011 Cost-Benefit Analysis for GMES Final Version II
Prepared for: European Commission Directorate – Enterprise and Industry
10
1. INTRODUCTION
1.1 BACKGROUND
Global Monitoring for Environment & Security (GMES) is a joint undertaking of the European Commission, its Member States, the European Space Agency (ESA) and the European Environment Agency (EEA). It is an Earth Observation (EO) programme which seeks to develop operational information services in the fields of environment and security. Through investments in new space infrastructure, the programme aims to create an independent European capacity in EO. By integrating satellite observations with data from in situ sources, a range of thematic information services can be developed. GMES forms the basis of the European contribution to international observation systems such as: GEOSS (Global Earth Observation System of Systems), GCOS (Global Climate Observing System) and GOOS (Global Ocean Observing System).6 Together, their purposes are to enhance our understanding of complex environmental systems and to enable the development of practical applications for EO data.
The GMES Bureau, part of the Enterprise and Industry Directorate-General, commissioned this Cost-Benefit Analysis (CBA) study to support the European Commission’s Impact Assessment accompanying the proposal for a Regulation concerning the development of the GMES programme post 2013.7
The EU and its Member States have already invested significantly in GMES infrastructure and services, either directly through their own missions (referred to as Contributing Missions), or indirectly through ESA.8
In considering the extent of future funding that the EU should provide to support GMES beyond 2013, the Terms of Reference clearly state that, “Public investment, however, is only justified if benefits clearly exceed costs. GMES can bring benefits in many areas and its exploitation involves multiple actors. A CBA needs to duly take into consideration this complexity”. This analysis is expected to ascertain whether benefits clearly exceed costs and what dependencies such benefits rely upon to be realised.
The overall context of this study is the current EU Budget Review.9 While the Budget Review began in 2006, its findings were released at a time when economic conditions had changed dramatically. As expected, the global financial crisis of 2008 and levels of public spending that followed with the aim of stimulating the economy and lessening the effects of the recession, have ensured that the current focus is on the prioritisation, added value and high quality of public expenditure.10
The Commission must present its proposals for the next multi-annual financial framework before 1 July 2011. This new financial environment poses clear challenges for the next phase
6 At an EU-level, existing coordination bodies include: EUMETNET (the European network of meteorological services) for
meteorological in situ observation systems and services; EUROGOOS (the European Association for the Global Ocean Observing System); EUROGEOGRAPHICS (the European Association of National Mapping and Cadastral Agencies); EUROGEOSURVEYS (the European Association of Geological Surveys) for cartography, geology, mapping and reference data; and EMODNET (the European Marine Observation and Data Network) for marine data and other bodies under the umbrella of the EU Integrated Maritime Policy.
7 2013 is the end of the current funding and regulation period for the programme. 8 See for example the European Space Agency’s Bulletin 142, May 2010.
http://earth.esa.int/pub/ESA_DOC/ESA_Bulletin142_GMES.pdf. 9 http://ec.europa.eu/budget/reform/index_en.htm. 10 http://www.ft.com/cms/s/0/424484a4-6b71-11e0-a53e-00144feab49a.html#axzz1NJtYpqEK.

Booz & Company
Date: 19th September 2011 Cost-Benefit Analysis for GMES Final Version II
Prepared for: European Commission Directorate – Enterprise and Industry
11
of funding for GMES and represents the overall context in which to consider options for funding and financing of GMES infrastructure and services.
1.2 THE ROLE OF GMES
The GMES programme has been established to fulfil the growing demand from European policy-makers to access accurate and timely information services to understand the effects of climate change and support mitigation and adaptation strategies, better manage the environment, and contribute to civil security.11
The primary objective of GMES is to provide information services in the fields of environment and security, in fulfilment of European strategic goals at a global level and in support of policy-makers and European, national and regional levels. GMES, as an autonomous and operational system, will constitute Europe’s contribution to the Global EO System of Systems (GEOSS)12. Further discussion of this is provided in Section 2 below.
The key investment in GMES by the European Union and its Member States has been in the development of GMES space infrastructure and pre-operational services to establish a coherent framework for the exploitation of Earth observation satellites (and in-situ observation points), and the provision of operational services at a European level.
Public investment at European level is necessary because EO markets have not been developed enough to justify large scale private investment, in particular in space infrastructure for activities which are primarily for public purposes. In addition, a large dependence on non-European assets is considered by the European Commission to not be compatible with the long-term sustainability of GMES services or EU industrial policy.
Previous investments in GMES infrastructure and the development of the pre-operational services have been supported by a series of previous cost-benefit studies and EC Impact Assessments.13 Those studies indicated the potential for GMES to deliver significant benefits across a number of European policy domains outside the space sector.14 However, those studies are now out of date, and the findings require updating to justify funding the GMES programme and its components.
1.3 GMES COMPONENTS
The GMES system is composed of 3 main building blocks: (i) the space component, (ii) the in situ component and (iii) the service component, which are introduced in the following sections. For further information on the GMES system components details please refer to Appendix B of this report.
1.3.1 GMES Space Component (GSC)
The collection of EO data from space is the primary infrastructure component of GMES. In its operational configuration, the GSC will rely on data provided by dedicated GMES missions (the Sentinels), as well as Contributing Missions from national or commercial
11 See Commission Decision creating a Bureau for Global Monitoring for Environment and Security (GMES), C(2006) 673. 12 See Global Monitoring for Environment and Security (GMES): we care for a safer planet, COM(2008) 748 final. 13 See for example COM(2009) 589 final: “Global Monitoring for Environment and Security (GMES): Challenges and Next
Steps for the Space Component”. 14 See COM (2009) 589 final and PriceWaterhouseCoopers “Socio-Economic Benefits Analysis of GMES”, October 2006.

Booz & Company
Date: 19th September 2011 Cost-Benefit Analysis for GMES Final Version II
Prepared for: European Commission Directorate – Enterprise and Industry
12
providers. A critical issue for the future of GMES is the extent to which there should be future capital expenditure on the Sentinels.
1.3.2 GMES In Situ Component
This is based on observation infrastructure owned and operated by a large number of stakeholders and coordinated by the European Environment Agency (EEA). The observation means include ground-based, airborne and ship- or buoy-based sensors and instruments. The need for in situ observation activities, and associated infrastructure, stems from a range of national, EU and international regulatory agreements.
1.3.3 Service Component
The service component refers to the evolving networks of service providers involved in the production and delivery of GMES services. Services are how end-users interact with GMES and have gradually developed over the last 10 years, through a series of concurrent and sequential R&D projects funded by ESA and the EU. The service component transforms space and in situ data into a set of information services for delivery to users.
The high-level definition of GMES services has been formalised in the EU Regulation 911/2010.15 This Regulation sets forth the expected role of GMES services according to each of its main service areas. These are described below.
1.4 GMES DOMAINS
GMES service provision is organised in terms of six domains: atmosphere monitoring; climate change monitoring; emergency management; land monitoring; marine; and security applications.16 These domains are described as follows:
� Atmosphere: Monitoring atmospheric chemistry and composition to contribute toward ECVs, measurement of European air quality, and monitoring of solar irradiance and UV radiation;
� Climate Change:17 Monitoring in support of adaptation and mitigation policies through production of ECVs;18
� Land Monitoring: Monitoring of land use to protect ecosystems and facilitate environmental protection and resource management;
� Emergency Management: Services enabling better responses to natural and man-made disasters. This includes supporting pre-event preparation, providing rapid mapping during crisis, supporting post-event recovery and damage assessment, and providing early warning flood alerts;
� Marine: Ocean forecasting and monitoring to contribute to ECVs, monitoring marine environments and contribute to maritime navigation by creating and calibrating three-dimensional models used in prediction and forecasting; and
15 Regulation (EU) No 911/2010 of the European Parliament and of the Council of 22 September 2010 on the European Earth
monitoring programme (GMES) and its initial operations (2011 to 2013). 16 See Appendix B for a more detailed analysis of GMES services. 17 See Council Conclusions on Global Monitoring for Environment and Security (GMES): "Towards a GMES programme", ST
16267/08. 18 For a full list of the 50 GCOS ECVs, see: www.wmo.int/pages/prog/gcos/index.php?name=EssentialClimateVariables.

Booz & Company
Date: 19th September 2011 Cost-Benefit Analysis for GMES Final Version II
Prepared for: European Commission Directorate – Enterprise and Industry
13
� Security: Use of Earth Observation to support EU policies in the areas of EU external action, border control, and maritime surveillance. This includes support to peace-keeping, law enforcement and crisis management operations, and to intelligence and early warning in respect of external regional crises.
1.5 SCOPE OF THE STUDY
This Cost Benefit Analysis covers the period 2014-2030, and is carried out in line with the Commission’s Impact Assessment Guidelines.
The most recent cross-cutting study considered only the socio-economic benefits (generally referred to as ‘benefits’) of EO. This study takes a more holistic view by also linking benefits the development of the services and their costs. The study builds on previous benefits studies by updating the policy and programme baseline. The cross-cutting benefit framework has been reviewed and refined, and new benefit areas have been explored. Importantly, a strategic framework has been developed for the evaluation of four broad funding options.
In specific terms, the EC’s Terms of Reference for the study outlines the following seven tasks:
� Task 1: Identify economic, social and environmental impacts of GMES;
� Task 2: Carry out a qualitative assessment of the more significant impacts;
� Task 3: Review and aggregation of existing data;
� Task 4: Production of new data;
� Task 5: Aggregation of existing and new data;
� Task 6: Analysis of financial instruments for the implementation of GMES; and
� Task 7: Presentation of CBA.
The primary methodologies for acquiring new data and information have been to undertake desk research, and interview key stakeholders. This has enabled development of a cost-benefit assessment tool to analyse the space infrastructure scenarios provided by the GMES Bureau. The process follows the three tasks underpinning the EC’s Impact Assessment Guidelines (economic, social and environmental assessment).19
1.6 APPROACH TO THE STUDY AND STRUCTURE OF THE REPORT
The main focus of this study is the assessment of four broad funding options for GMES and its operational services. In carrying out this exercise, it is important to bear in mind that GMES represents a unique public investment programme in that it is designed to support a wide array of public policy issues. Therefore, a strategic evaluation framework has been developed based on the authors’ understanding of the space and EO sectors, and the role EO infrastructure plays in supporting the implementation of government policies aimed at better managing the environment and security.
Figure 1.1 provides an overview of the process which was followed in defining and evaluating the impact of GMES at a strategic level, and how this can be used to support the assessment of the options.
19 www.ec.europa.eu/governance/impact/index_en.htm.

Booz & Company
Date: 19th September 2011 Cost-Benefit Analysis for GMES Final Version II
Prepared for: European Commission Directorate – Enterprise and Industry
14
Figure 1.1: Approach to Evaluating GMES Impact & Investment Options
Strategic Context
GMES Capability
GMES Impact
GMES Strategy forOption Assessment
� Assess the strategic context for GMES� Critical developments in international and EU landscape� Identify drivers for enhanced EO capability
� GMES design definition� Addressing the technology gap and providing data continuity� Analysis of GMES service offering and operational development
� Define the strategic value of GMES� Strategic value linked to scope for step-change in capability and other
improvements
� Define the strategic focus of GMES as a basis for the assessment of options� Climate change as a top priority linked to step-change in capability� Support to EU policy and other operational needs in line with service offering
The first step involved assessing the strategic context for GMES. This relates to the role of GMES in supporting the most critical of EU policies. This is promoted to include its commitments on the international scene, its role managing the risks of climate change, the desire for developing the European space industry, and support to environmental and security policy.
In the next step, the GMES design definition was reviewed and assessed, which involves understanding the gap in global EO capability that the various elements of the programme will address. An important input is in identifying the unique characteristics of the Sentinel programme compared to the EO capability provided by other actors in the space-enabled EO sector, many of which are expected to support GMES as Contributing Missions.
By placing the capability that GMES will provide within its strategic context, it is possible to identify where any major enhancements of capability can demonstrate a high potential value-add of GMES at the strategic level. For example, if GMES can be thought to provide a step-change in capability in a particular domain, then this should be taken forward as a primary objective for the evaluation.
It is evident from many of the communications promoting GMES and a review of the Sentinel programme and the Contributing Missions that GMES is providing significant new capability with respect to the monitoring of climate variables that are relevant for the global climate change agenda. In addition to climate change, GMES supports a range of environmental and security objectives, although the role for GMES is less about the Sentinel programme/Contributing Missions in many of these areas and instead driven by the development of the operational service programme. In this context, our analysis in the following chapters will aim to confirm and clarify these aspects of the programme.
The authors have developed an overarching study framework that follows this process and links these considerations to the construction of a strategic assessment methodology, culminating in a formal cost-benefit analysis framework.
Figure 1.2 below depicts this framework. It is designed to reflect the key tasks of the study with a logical flow of analysis which should be seen as an integrated whole, combining

Booz & Company
Date: 19th September 2011 Cost-Benefit Analysis for GMES Final Version II
Prepared for: European Commission Directorate – Enterprise and Industry
15
strategic, qualitative and quantitative analysis, concluding with key enablers and constraints that need to be addressed for GMES to reach its full potential.
Figure 1.2: Study Framework
ClimateChange
StrategicPolicy
Framework
Industry Development
QuantifiedCost-Benefit
Analysis
Enablers & Constraints
Value ofInformation
Significant Impacts Quantitative Analysis
Environment& Security
Approach
This report is structured to provide an understanding of the overall strategic policy context in which GMES has developed, before moving on to analysis of the expected benefits of the programme, followed by discussion of the key enablers and constraints considered likely to impact on the overall success of the GMES programme.
In line with this general approach, the chapters are as follows:
� Chapter 2 provides the strategic policy framework of GMES. This describes the priorities of the EU within the global EO sector, and the primary strategic policy goals that GMES will contribute to (climate change, environment and security and industrial policy);
� Chapters 3, 4 and 5 provide the significant impact analysis for three broad areas of greatest contribution by GMES to EU policy objectives as follows.
- Chapter 3 considers the qualitative impacts of GMES on climate change. Climate change is one of the primary benefit areas for GMES. This chapter outlines why GMES can potentially deliver substantial impacts for climate change policy;
- Chapter 4 considers the qualitative impacts of GMES on environment and security policy. This includes environmental protection, resource management and emergency management;
- Chapter 5 considers the qualitative impacts of GMES on industrial policy. Space and the downstream sectors are expected to be the key ways GMES can contribute to EU industrial policy;
� Chapters 6, 7 and 8 provide the quantitative impact analysis of GMES as follows:
- Chapter 6 considers the economic value of information from GMES. Key considerations being how the gathering and distribution of information can be considered as providing economic benefit;
- Chapter 7 describes the approach taken for the quantitative cost-benefit analysis;
- Chapter 8 provides the quantified results of the cost-benefit analysis;

Booz & Company
Date: 19th September 2011 Cost-Benefit Analysis for GMES Final Version II
Prepared for: European Commission Directorate – Enterprise and Industry
16
� Finally, Chapter 9 considers the key enablers and constraints to realising the benefits of GMES; and
Supporting appendices provides a more detailed discussion of a wide range of related issues.

Booz & Company
Date: 19th September 2011 Cost-Benefit Analysis for GMES Final Version II
Prepared for: European Commission Directorate – Enterprise and Industry
17
2. GMES STRATEGIC CONTEXT
2.1 INTRODUCTION
Earth observation as a sector has particular characteristics that support it being seen as a strategic “system of systems” to obtain data about the Earth with potential applications in a wide range of other sectors. The list of sectors that EO (and therefore GMES) can influence is extensive, as the services cover the major Earth systems: land, marine and atmosphere. For the benefits of GMES to be assessed in a manageable and coherent way, there needs to be focus on areas of significant impact and priority for the GMES programme.
This chapter describes how EO fits strategically into European and global objectives. This enables the contribution of GMES to EU policy objectives to be understood, and for the quantitative analysis to be framed according to the three strategic objectives of i) climate change mitigation and adaptation; ii) monitoring and management of the environment and issues of security; and iii) industry development. It is on the basis of its ability to meet these objectives that the ability of the GMES programme to deliver wide ranging strategic, economic, environmental and social benefits are to be assessed.
2.2 STRATEGIC CONTEXT OF EARTH OBSERVATION AT A GLOBAL LEVEL
2.2.1 Multilateral Co-ordination
Interest in space-enabled EO has been growing substantially in the past decade, since the First Earth Observation Summit in 2003. The establishment of the Group on Earth Observation (GEO) in 2005 (after the Third Earth Observation Summit) was a major step forward in promoting co-ordination and co-operation between all types of EO providers. The membership of GEO has grown to 86 countries, and also includes the European Commission, plus 61 Participating Organisations (e.g. EUMETSAT and ESA). One of the strategic priorities of GEO is the establishment of the Global Earth Observation System of Systems (GEOSS). GEOSS aims to connect the global providers of EO data with each other and with end users. The overarching strategic goal behind this is to enable a complete picture of the Earth to be drawn from as many credible sources as possible.
GEOSS20 lists nine priority areas for EO as follows:
� Reducing loss of life and property from natural and human-induced disasters;
� Understanding environmental factors affecting human health and well-being;
� Improving the management of energy resources;
� Understanding, assessing, predicting, mitigating, and adapting to climate variability and change;
� Improving water resource management through better understanding of the water cycle;
� Improving weather information, forecasting and warning;
� Improving the management and protection of terrestrial, coastal and marine ecosystem;
� Supporting sustainable agriculture and combating desertification; and
� Understanding, monitoring and conserving biodiversity.
20 http://www.earthobservations.org/geoss.shtml.

Booz & Company
Date: 19th September 2011 Cost-Benefit Analysis for GMES Final Version II
Prepared for: European Commission Directorate – Enterprise and Industry
18
This list corresponds to the broad policy areas of emergency management, environmental management, and resource management. EO is seen as critical to supporting policies that protect and enhance the environment, and facilitate sustainable use of natural resources.
A component of GEOSS is the Global Climate Observing System (GCOS).21 GCOS is a multilateral undertaking, driven by organisations such as the World Meteorological Organisation and United Nations Environment Programme, to monitor the climate system and provide long term observations to improve understanding of climate change. Given that climate change is considered to be “the major, overriding environmental issue of our time”22, according to the UN Secretary General, and that combating climate change is a top priority of the EU23, GCOS is of strategic global policy importance in informing the sector of highest priority in environmental policy worldwide.
Another component of GEOSS is the Global Ocean Observing System (GOOS), intended to provide a single global view of the entire oceans, which like the atmosphere, is interconnected and function as a large system. GOOS also has a primary goal to monitor, understand and predict weather and climate, as well as forecast the state of the ocean in terms of ecosystems, pollution and coastal conditions. It is sponsored by the WMO, UNEP and the Intergovernmental Oceanographic Commission (of UNESCO).
Together, these activities highlight that at the UN and wider multilateral level, EO is of strategic value and importance, across the wider perspective of environmental issues worldwide, but more recently and specifically, in assisting in understanding climate change.
EO will be used to improve understanding of the following key issues:
� Global climate conditions, in particular to monitor the effects of climate change and measurement of Essential Climate Variables (ECVs) to provide input into models that forecast climate change scenarios;
� Significant changes in land use and cover, in particular deforestation, desertification and its related impacts on sensitive habitats, biodiversity and land available for agricultural purposes;
� Effects of climate on the oceans and polar ice regions, in particular temperatures, sea levels and the extent and density of polar ice;
� Provision of post-disaster imagery and measurement to facilitate improved responses to major incidents (e.g. floods, earthquake, tsunami);
� Enabling a broader understanding of the widest range of Earth variables to assist in management of resources, preservation of habitats and prediction of the incidence and scale of disasters.
In addition to those broad themes, EO has wide potential across other policy areas. Indeed, the scope and scale of information able to be gathered by EO is such that it is difficult to measure the potential scope of how it may influence behaviour and enhance decisions made in public and private spheres.
21 http://www.wmo.int/pages/prog/gcos/index.php. 22 http://www.unep.org/climatechange/Introduction/tabid/233/Default.aspx. 23 http://ec.europa.eu/clima/policies/brief/eu/index_en.htm.

Booz & Company
Date: 19th September 2011 Cost-Benefit Analysis for GMES Final Version II
Prepared for: European Commission Directorate – Enterprise and Industry
19
2.2.2 Global Investment in Earth Observation Systems
Corresponding with the interest in using EO systems to understand the global environment and inform policy has been the substantial investment by various countries, from public and private sector interests, in EO satellite systems. Perhaps the most well-known and accessible example is seen in the widely used internet applications, Google Earth and Bing Maps Platform. These applications use EO imagery gathered from a variety of commercial sources, but only demonstrate a small part of the EO spectrum of activities.
The EO Handbook reports that there are 116 EO missions24 operating as of September 2010. Euroconsult indicates25 that the number of civil and commercial EO satellites expected to launch between 2010 and 2019 will more than double during the next decade, expanding to 280.
In the United States, multiple agencies are responsible for EO missions26. NASA has the Earth Observation System (EOS) which today has nine active missions.27 Those missions have specific objectives such as understanding changes in land cover (e.g. Landsat 7) and ocean surface topography (e.g. Jason 1). One data continuity mission is already under construction and others are planned. The United States National Environmental Satellite, Data, and Information Service is responsible for the GOES (Geostationary Operational Environmental Satellite) network which monitors climate. Other US agencies have their own EO missions for specific public policy purposes.
Other countries own EO missions or deploy them in partnership (e.g. Gravity Recovery and Climate Experiment - GRACE is a joint NASA – German Space Agency mission).
Some such EO systems include:
� CBERS (China-Brazil Earth Resources Satellite programme) is a mission of five satellites (three deployed to date) to use image and radar observations;
� IRS (Indian Remote Sensing) comprises nine Indian missions to monitor land use, post-emergency situations and coastal condition; and
� Japan Aerospace Exploration Agency has two active missions and three under development, currently undertaking optical and radar land observations as well as measurements of atmospheric carbon dioxide;
Other missions are owned by agencies in Argentina, China, Indonesia, Italy, Nigeria, Russia, South Korea, Taiwan and others. A total of 40 countries are expected to have launched missions by 2019. It is clear that governments worldwide are seeing strategic policy advantages in having EO data for their own purposes, and that collaboration through GEOSS is helping to develop an increasing understanding of the value and benefits of obtaining observations to help in environmental, natural resource and emergency policy areas.
24 http://www.eohandbook.com/eohb2010/earth_current. 25 http://eijournal.com/2011/earth-observation-emerging-markets-partnerships-set-to-fuel-global-growth-2. 26 See also the recent publication from the Office of Science and Technology Policy (September 2010), “Achieving and
Sustaining Earth Observations: A Preliminary Plan Based on A Strategic Assessment by the U.S. Group on Earth Observations”. The report details key areas for improving and integrating Earth observations, although it does not consider the cost of implementing the necessary Earth observation systems.
www.whitehouse.gow/sites/default/files/microsites/ostp/ostp-usgeo-report-eat-obs.pdf. 27 http://eospso.gsfc.nasa.gov/eos_homepage/mission_profiles/show_mission_list.php?id=20.

Booz & Company
Date: 19th September 2011 Cost-Benefit Analysis for GMES Final Version II
Prepared for: European Commission Directorate – Enterprise and Industry
20
On top of the publicly owned and funded missions, there is a growing list of commercially viable missions such as EROS, DIGITALGLOBE, GEOEYE, IKONOS, QUICKBIRD, WORLDVIEW (1 and 2). This includes European providers such as RAPIDEYE and TERRASAR-X (German) and SPOT (French). This demand for data and observations shows the benefits that private sector users are getting from EO, and the emergence of two EO sectors – one driven by public policy interests and another by commercial ones.
As such, while there may be some confidence that the private sector will continue to invest in commercially viable forms of EO, such as Very High Resolution (VHR) imagery, it is less likely that it will supply capacity on observations that do not yet have a well-developed market or latent demand. EO that has specific public purposes, such as gathering ECVs for climate change, is in this category. Whilst it is clear the private sector investment in EO infrastructure is growing, so is the global public sector investment. For example, EOS lists purposes for its missions28 that are consistent with those for GMES, indicating that the USA sees continued high value in supporting EO missions for public policy purposes, particularly climate change research.
It is clear that a growing number of countries see strategic benefits in expanding their EO capacity and systems. The critical issue for the EU is how it wishes to participate and contribute to GEOSS, and what the benefits are from doing so.
2.3 EU INTEREST IN EARTH OBSERVATION
2.3.1 EU as a Global Player
EO is seen globally as a critical source of data to enable monitoring and modelling of major issues of global importance using technology that removes many of the limits of national or localised observation systems.
Many of these new missions that are being developed are likely to supply data for EU-based users and thus contribute significantly to the EU effort29, as Contributing Missions.
However, whilst the EU can be recipient of data from global EO missions, and will undoubtedly enjoy some of the benefits of EO as a result, its role and influence on key strategic matters that are measured and identified by EO will, in part, be dependent on how it can contribute to the global understanding of major environmental issues.
Only by having a European contribution to GEOSS, GCOS and GOOS will the EU be able to guarantee that global collaboration and data sharing will continue with EU entities, and retain its current status as a key influential player in negotiations on climate change, and other related major environmental issues (e.g. deforestation, desertification, marine and atmospheric pollution).
It is possible to claim that for the EU to maintain credibility on the global stage, it must be willing to commit the necessary resources to provide its own ability to gather the information required. The provision of dedicated and sustainable EU data sources also supports the development of long term international data sharing arrangements. For
28 http://eospso.gsfc.nasa.gov/eos_homepage/for_news/index.php. 29 At an EU-level, existing coordination bodies include: EUMETNET (the European network of meteorological services) for
meteorological in situ observation systems and services; EUROGOOS (the European Association for the Global Ocean Observing System); EUROGEOGRAPHICS (the European Association of National Mapping and Cadastral Agencies); EUROGEOSURVEYS (the European Association of Geological Surveys) for cartography, geology, mapping and reference data; and EMODNET (the European Marine Observation and Data Network) for marine data and other bodies under the umbrella of the EU Integrated Maritime Policy.

Booz & Company
Date: 19th September 2011 Cost-Benefit Analysis for GMES Final Version II
Prepared for: European Commission Directorate – Enterprise and Industry
21
example, whilst it is unlikely that the United States would block the provision of environmental information from its satellites, dedicated EU capabilities such as the Sentinels will militate against possible risks associated with being perceived to be a possible “free-rider”. This argument of reciprocity is borne out in the example of the expected relationship between the U.S. Landsat programme and Sentinel 2.
An EU contribution in this field can ensure that EU strategic influence (seen at the various UNFCCC conferences) would be maintained. In addition, having an EU contribution of data and analysis from EO for climate change, emergency response, security and other multilateral issues will be seen as a matter of credibility. It can be difficult to measure quantitatively the value of credibility and influence at intergovernmental meetings that set agreements or treaties. Given that any treaty that may arise from such conferences is likely to have profound impacts on the European economy and environment, it is apparent why having such influence is of critical strategic importance to the EU. Being seen as one of the major global players, without whom agreement would be substantially devalued, has a value to the EU and means there is considerable capacity for the EU to influence outcomes that affect its interests. It is in climate change that this contribution is likely to be most significant.
2.3.2 GMES as the European Union’s Contribution to GEOSS
As GMES is the EU contribution to GEOSS and its associated systems, it is important to understand how it fits into the EU strategic policy objectives at a global level.
The development of GMES should be seen in the context of the Lisbon Treaty and the European Council agreement reached in Gothenburg in 2001 regarding a strategy for sustainable development.30 The strategic emphasis of environmental policy and in the EU playing a leading global role in environmental protection and sustainable development forms the foundation objective of the GMES programme.31
Aligned with the synergies between environmental policy and the use of EO, a strong argument can be made that investment in GMES will provide the EU with a strategic capability in the domain of EO which is justified by the strategic priority given to environmental policy in the EU.32
A key common theme expressed by most stakeholders around GMES is the importance of four key strategic factors that together provide a justification for investment in the Sentinels. These are discussed further below:
� Ensuring the credibility of GMES data and reliance on this for international policy making;
� Providing an EU contribution to data cooperation with other countries (especially the United States);
� The importance of maintaining continuous availability of EO data; and
� Providing a source of independent data used for EU purposes.
In these respects:
30 While not referenced in the Regulation, the initiation of GMES is linked to the ‘Baveno Manifesto’ in 1998. 31 This has recently been confirmed by the Council of Europe communication on 31st May “Towards a Space strategy for the
EU that benefits its citizens”, 3094th Competitiveness Council Meeting.
http://www.consilium.europa.eu/uedocs/cms_data/docs/pressdata/en/intm/122342.pdf. 32 Interview with the Joint Research Centre (JRC).

Booz & Company
Date: 19th September 2011 Cost-Benefit Analysis for GMES Final Version II
Prepared for: European Commission Directorate – Enterprise and Industry
22
� The GMES infrastructure adds redundancy and help to guarantee continuity over the medium term. This removes the risk that data from other satellites (that the Sentinels will duplicate) will be unobtainable, inadequate or too expensive, and provides greater certainty for existing and future users, which is also an enabler for growth in the downstream sector.
� The GMES programme maintains the EU’s role as a key strategic contributor to GEOSS and is influential in advancing that agenda, as well as facilitating access to data from other sources;
� Independence of the GSC enables some applications, particularly around enforcement and monitoring of behaviour at the EU and global level, to be undertaken in a more responsive and credible manner;
� Access to foreign Contributing Missions is particularly useful in some fields. By having a dedicated GSC contribution, reciprocity in sharing data is more likely to be maintained, to the mutual advantage of both parties; and
� Credibility at intergovernmental fora on environmental and natural resource issues that are reliant on EO data is significantly enhanced if a delegation has access to its own data. The profile and influence of the EU at such fora is enhanced by not being dependent on the data of others, by generating data of its own on its own terms.
In addition, the GMES programme includes investment in capabilities that will be in addition to current and forecast missions. These will provide strategically important observations to contribute to the collection of ECVs in order to model climate change, and also enable a number of enhanced services to be undertaken.
2.3.3 Value of GMES to EU Climate Change Policy
Climate change is a top priority for the EU, as can be seen in the European Climate Change Programme (ECCP), the “Roadmap for moving to a competitive low-carbon economy in 2050” and its support for multilateral binding agreements on climate change. GMES as a provider of critical new ECVs to input into climate change modelling will represent a crucial contribution to EU efforts to understand climate change at the European level and to influence negotiations at a global level. The EU has a strong strategic priority in being one of the leading negotiators and participants in multilateral discussions on environmental issues, in particular climate change which has already been noted as a top priority for the EU.
Understanding of climate change, how to mitigate its impacts and adapt to changes requires comprehensive understanding of the global climate system across ECVs. Substantial commitment has already been made into modelling climate change scenarios, but the levels of uncertainty that exist as to future scenarios remain high. Only by gathering a comprehensive set of ECVs on a regular and consistent basis over the long term, will greater clarity and certainty be reached that will enable policy consensus on appropriate interventions to be made. As no single country or mission (or group of missions) is capable of doing this alone, international collaboration through data sharing will be necessary to gain the greatest benefits of EO in this sphere.

Booz & Company
Date: 19th September 2011 Cost-Benefit Analysis for GMES Final Version II
Prepared for: European Commission Directorate – Enterprise and Industry
23
2.3.4 Value of GMES to Wider EU Policy Initiatives
Beyond climate change, the Europe 2020 strategy33 is the central basis for the EU’s overall strategy to tackle the challenges for ensuring sustainable economic growth over the next decade. It contains a range of themes that whilst focused on economic development, also have a strong social focus as the strategy at a high level supports economic growth that is “smart, sustainable and inclusive”. The key linkages between this and GMES come from sustainability and the use of technology.
Despite there being some benefits in the Innovation Union and An Industrial policy for the Globalisation Era policies, the majority of expected benefits from GMES are found in the Resource-efficient Europe policy in the Europe 2020 strategy.
In the context of what GMES can contribute, by far the most significant of these is in terms of the promotion of a Resource Efficient Europe.
Resource-Efficient Europe provides a long-term framework for action in many policy areas, supporting policy agendas for climate change, energy, transport, industry, raw materials, agriculture, fisheries, biodiversity and regional development. Medium-term measures to achieve this include:
� Early action on adaptation to climate change to minimise threats to ecosystems and human health, support economic development and help adjust infrastructures to cope with unavoidable climate change;
� Proposals to reform the Common Agricultural Policy to align it with the requirements of a resource-efficient, low-carbon economy; and
� A new EU biodiversity strategy for 2020 to halt further loss to, and restore, biodiversity and ecosystems.
The EU needs tools to monitor and measure progress on resource efficiency. Indicators are needed to cover issues such as the availability of natural resources, where they are located, how efficiently they are used, impacts on the environment and biodiversity. GMES has the potential to provide means to monitor resource usage and replenishment, allow for new ways of allocating and rationing resources, and to assist in the development of new policies to achieve the objectives of the Common Agricultural Policy. Table 2.1 below illustrates some of the benefit areas that GMES can contribute towards under Europe 2020. A key message that came out of our interviews with stakeholders is the perception that the primary function of GMES is to provide information that can support the delivery of the EU’s main policy objectives.
Table 2.1: GMES Contribution to “Europe 2020” objectives
GMES Service Area Relevance to “Europe 2020” objectives
Marine Resources Benefits to DG MARE, through development of a better understanding of the oceans.
Marine & Coastal Environment Benefits to DG MARE, DG ENV, and the EEA through improved information regarding marine and coastal environments
33 COM(2010) 2020 final: “Europe 2020 – A Strategy for Smart, Sustainable and Inclusive Growth”, March 2010 and in
general http://ec.europa.eu/europe2020/index_en.htm.

Booz & Company
Date: 19th September 2011 Cost-Benefit Analysis for GMES Final Version II
Prepared for: European Commission Directorate – Enterprise and Industry
24
GMES Service Area Relevance to “Europe 2020” objectives
Climate & Seasonal Forecasting Direct benefits to DG CLIMA, DG ENV and EEA. Indirect benefits to a wide range of EU and national bodies, through more accurate understanding of the likely impact of climate change
European Land Cover & Land Use Direct benefits to DG REGIO (through Urban Atlas service); DG ENV and EEA (Forests); and DG AGRI (improved CAP monitoring)
Spatial Planning Direct benefits to DG REGIO
Agri-Environment DG AGRI (improved CAP monitoring)
Water Monitoring Support to implementation of the Water Framework Directive; European Flood Alert System (EFAS) can help to reduce damage from flooding through early warning.
Forest Monitoring DG ENV and EEA (Forests)
Land Carbon Monitoring DG CLIMA
European Air Quality Provide support to the CAFE (Clean Air for Europe) programme
Source: Booz & Company analysis.
2.3.5 GMES as a Part of Industrial Policy
As well as being a scientific mission, GMES also has been developed as a technology catalyst to support growing business sectors such as:
� Space sector: Through the design, development, launch and management of dedicated EO satellites;
� Downstream EO service sector: By facilitating the availability of EO data for new and existing commercial operators to process into specialised services for customers in Europe and beyond. Downstream operators will continue to develop services that utilise satellite and in-situ data and be an industrial growth sector in their own right contributing to EU-wide GDP.
The main contributions to these sectors by GMES are intended to be:
� The deployment of new satellite based observation capacity and capability (the Sentinel family), which includes the design and building of satellites, launchers and ground stations;
� The compilation and processing of EO data collected from existing and future Contributing Missions, in situ data sources, and - in due course - the Sentinels, and the production and delivery of GMES services.
2.3.5.1 Communication on EU Space Policy
It is clear that through past investment in GMES, the space industry is considered ‘strategic’ by the EU and so worthy of public sector investment to maintain / develop industrial capabilities within the EU.
The Communication “Towards a Space Strategy for the European Union that Benefits its citizens”34 from the Commission to the Council in April 2011 presented options for a space policy to achieve the following objectives:
34 SEC(2011) 381 final: “Towards a Space Strategy for the European Union that Benefits its Citizens.
http://eur-lex.europa.eu/LexUriServ/LexUriServ.do?uri=SEC:2011:0381:FIN:EN:PDF.

Booz & Company
Date: 19th September 2011 Cost-Benefit Analysis for GMES Final Version II
Prepared for: European Commission Directorate – Enterprise and Industry
25
� Promote technological and scientific progress;
� Stimulate innovation and competitiveness;
� Enable EU citizens to reap the benefits of space applications; and
� Raise the EU profile on the international stage in the space sector.
GMES is considered a “flagship” project, with climate change and security being key priority areas for specific action. The communications reinforces the view that GMES has a primary contribution to climate change, by having a specific section on this topic. The communication states: “The EU would also be in a stronger position if it had reliable, independent sources of information to ensure that international commitments in the fight against climate change are being met.” It is important to note the high priority given the strategic role of GMES in providing information to inform climate change adaptation and mitigation policy. Another key emphasis is how it can contribute toward international co-operation in the space sector. This includes the sharing of EO data between countries, but also to support, in particular, applications to promote development in Africa.
2.3.5.2 Downstream Sector
Previous studies into GMES have not looked closely enough at current composition of the GMES downstream market, and how this may be expected to develop. While the Booz Allen Hamilton / Vega, and ECORYS, studies began to develop these ideas, it has become clear through the course of this study that there is insufficient understanding among stakeholders, both within the EC and in industry, as to how the downstream market would benefit from public investment in the Sentinel programme. It has proven difficult to estimate the scope of the sector given the distinct lack of knowledge among stakeholders of the sector and the time available to interview all those who can be identified in the sector.
Whilst the strategic point that the GMES programme needs to provide a long term guarantee of “data continuity” makes sense, it is not possible, with information currently available, to gauge the extent of the benefit from this provision. It may be that data continuity can be delivered through other means at lower cost, although this would require in depth study into scenarios of existing and future Contributing Missions, including a role for the EU to purchase continuity in the international marketplace. Again, such a study is outside the scope of this report, but may have merit in particular if budgetary constraints are severe.
2.3.6 GMES as a Public Good
It is important to understand that GMES and its associated services are seen as contributing greater benefit to Europe as a “free at point of use” or “public good” service, which can facilitate wider benefits due to its ease of access. The collection, compilation and supply of raw data and information from GMES systems, and provision for no charge is expected to eventually catalyse the development of what has been referred to as “downstream services”. It is envisaged that, in providing added value through the development of new and innovative data products and applications, these downstream services may be provided, but with a price.
Although, at this stage, the scale and extent of such applications have not been developed to their full potential, there are a number of examples of such approaches being used by public entities to offer opportunities for free public data to be processed and sold on. Clearly, this free provision offers the greater chance that such applications will be developed, and the expectation is that the wider economic benefits for Europe of businesses being establishing,

Booz & Company
Date: 19th September 2011 Cost-Benefit Analysis for GMES Final Version II
Prepared for: European Commission Directorate – Enterprise and Industry
26
growing and employing people offset any benefits in the medium term of charging for such data. This can be seen as part of the wider Europe 2020 objectives for growth of a “smart” and innovative knowledge based economy.
2.4 SUMMARY
Following the review above, it can be summarised that GMES supports EU policies in the following three strategic areas:
� To be the EU contribution to global efforts to monitor and understand climate change, in order to inform the EU climate change mitigation and adaptation strategies, and to maintain the EU strategic position in negotiations on international climate change policy;
� To support EU policies related to other environmental matters and security, recognising the complementary of these issues with climate change policy; and
� To support EU industrial policy in promoting the space sector and in catalysing the development of a downstream market for EO services.

Booz & Company
Date: 19th September 2011 Cost-Benefit Analysis for GMES Final Version II
Prepared for: European Commission Directorate – Enterprise and Industry
27
3. CLIMATE CHANGE
3.1 INTRODUCTION
This chapter provides the background and basis for analysis of the one area which GMES is expected to have the greatest impact, which is the ability of the EU to respond to the mitigation and adaptation challenges of climate change.
The UN Secretary General Ban Ki-Moon has said that “Climate change is the pre-eminent geopolitical and economic issue of the 21st century”.35 As an outcome of global market failure, managing the risks associated with climate is a major challenge for policy- and decision-makers.
A major review for the UK government found that, based on a 2 - 3°C warming, the cost of climate change could be equivalent to around a 0 - 3% loss in global GDP from what could have been achieved in a world without climate change, and that poor countries will suffer higher costs36. Using its integrated assessment model, the Stern Review estimated that global per capita consumption would be reduced by 5% at a minimum. By including other impacts on the environment and human health, as well as accounting for the likelihood of increased sensitivity of the climate system and the disproportionate impacts on poorer counties, the Stern Review estimated up to a 20% reduction in current per capita consumption. With the European share of global consumption currently estimated at over 10 trillion Euros37, a 20% reduction represents a staggering figure.
International negotiations on climate change issues are continuing. The ultimate objective of the United Nations Framework Convention on Climate Change (UNFCCC), and future UNFCCC agreements, is to achieve stabilisation of greenhouse gas (GHG) concentrations in the atmosphere at a level that would prevent dangerous anthropogenic interference with the climate system. The Kyoto Protocol, adopted in 1997, supplemented the UNFCCC with an enforceable agreement with quantitative targets for GHG emissions.38 A possible pathway to a global agreement that addresses climate change for the period after 2012 is detailed in the Copenhagen Accord that come out of the UN Climate Change Conference in Copenhagen in December 2009. It recognises the scientific view that the global mean temperature should not increase by more than 2°C above pre-industrial levels. To avoid this, according to the Intergovernmental Panel on Climate Change (IPCC), global emissions must peak before 2020 and then decrease by at least 50% by 2050.39
The IPCC’s periodic assessments of the state of and understanding of causes, impacts, vulnerabilities and possible adaptation and mitigation strategies, are the most comprehensive and widely agreed surveys available on these subjects. In 2007, the IPCC finalised its 4th Assessment Report.40 The EU is a major contributor to driving forward the climate science which forms the basis of IPCC reports, e.g. by the research activities funded
35 Opening remarks to the UN Climate Change Summit Plenary, 22 September 2009. 36 HM Treasury (UK): “Stern Review on the Economics of Climate Change”, 2006. 37 Eurostat. 38 EEA: “Towards a possible GMES Contribution for Climate Change – EEA information needs for environmental
assessments as a basis for European policy making”, p.14. 39 EEA: “Towards a possible GMES Contribution for Climate Change – EEA information needs for environmental
assessments as a basis for European policy making”, p.3. 40 IPCC Fourth Assessment Report (AR4): “Climate Change 2007: Synthesis Report”.
Booz & Company
Date: 19th September 2011 Cost-Benefit Analysis for GMES Final Version II
Prepared for: European Commission Directorate – Enterprise and Industry
28
under the various Framework Programmes.41 The 17th Conference of the Parties to the UNFCCC will be held in Durban, South Africa in November/December 2011, and its primary focus will be to achieve global agreement as the Kyoto Protocol commitment period ends in 2012. The EU will be a leading and influential participant in that Conference and is seeking global agreement on the next steps to address mitigation and adaptation.
3.2 POLICY FRAMEWORK
Climate change action is managed at the EU level and the Member State levels. Climate change policy at the EU is the responsibility of DG CLIMA, which was established in February 2010. The EU policy priorities on climate change include the development and implementation of mitigation and adaptation strategies, including the setting and enforcement of emissions targets at EU and global level. This contrasts with climate change adaptation policies, which are focused on developing and funding measures to reduce the impacts of unavoidable climate change. Failure to achieve globally binding agreements for reducing emissions will increase the role for adaptation in the future.
The implementation of EU climate change policy is also seen in the Second European Climate Change Programme launched in 2005. In that light, the EU also offered to increase its emissions reduction to 30% by 2020, on condition that other major emitting countries in the developed and developing world commit also “to do their fair share under a future global climate agreement”.42 The intention is for this to take effect at the start of 2013 when the Kyoto Protocol's first commitment period will have expired.
Attempts to reach multilateral agreement since the release of the Stern Review and IPCC reports have been largely unsuccessful. Despite much fanfare in the run up to the conference, the Copenhagen Conference failed to produce a successor to the Kyoto Protocol of 1997, itself arguably flawed due to the absence of commitments from the United States. In place of a more substantial agreement, the non-binding Copenhagen Accord was agreed.
A further international conference in Cancun in November 2010 was considered a relative success, in that negotiations did not collapse as they did in Copenhagen. This is largely because many of the more difficult issues were deferred to the forthcoming meeting in South Africa in November/December 2011.
The EC published a White Paper on Adaptation in April 2009. The White Paper sets out a framework to reduce the EU’s vulnerability to the impacts of climate change.43 Adaptation benefits relate to improved certainty around estimates for expenditure on adaptation for new infrastructure and retrofitting existing infrastructure. The case remains strongest in relation to flood protection from rivers and in coastal areas. These are areas where changes in climate in terms of sea level changes and extreme weather events are most likely to have severe consequences.
3.3 ROLE FOR GMES
EO plays a key role in supporting both climate change mitigation and adaptation. This section provides analysis of the role for GMES in supporting these policy issues.
41 European Research Framework Programme: Research on Climate Change (2009). 42 http://ec.europa.eu/environment/pubs/pdf/factsheets/climate_change.pdf. 43 White Paper: “Adapting to climate change: Towards a European framework for action”, COM(2009) 147 final.

Booz & Company
Date: 19th September 2011 Cost-Benefit Analysis for GMES Final Version II
Prepared for: European Commission Directorate – Enterprise and Industry
29
3.3.1 Climate Change Mitigation
The potential range of impacts of climate change is considerable. Increases of 1-2° C have potential countervailing positive impacts, such as increasing crop yield at certain latitudes. More severe increases in temperature see significantly more negative impacts than positive, with the high end of estimates risking far more serious impacts. These may be considered as “tipping point” scenarios that could mean major increases in sea levels and very high costs of mitigation and adjustment.
The key contribution that EO systems can make to climate change mitigation policy is the monitoring of long term trends in the composition of the atmosphere, trends in land and ocean temperatures and trends in polar ice, sea levels and degrees of land change (e.g. desertification) that may be linked to climate change. It may also include measurements of embedded carbon, biosphere responses (land and marine) to identified changes in temperatures, and the impacts of land and oceanic reflectivity upon temperatures.
This enables linkages between emissions, atmospheric composition and temperatures to be considered. However, most importantly this can also feed into improving the accuracy of climate models that forecast future scenarios that may be used to influence policy.
The extensive uncertainties and wide range of existing forecasts arising from current models in this field creates difficulties for policy makers (who face competing claims regarding the seriousness or otherwise of climate change) and risks of inappropriate responses. This includes both a failure to respond to mitigate risks and damage to life and property because of dependence on excessively conservative predictions, but also the costs of excessive interventions to mitigate risks that are pessimistic.44
Recognising these issues, a global network of space-enabled EO systems is being developed to monitor a wide range of land, marine and atmospheric variables which will help measure the current and likely future impacts of climate change. The key elements of this network include the development of the Global Climate Observing System (GCOS), which is intended to be a long-term, user-driven operational system capable of providing the comprehensive observations required for monitoring the climate system, assessing impacts of climate change, and supporting adaptation. This information will be filtered and analysed
44 The report “The Costs and Benefits of EU Climate Policy for 2020” (Tol, Richard S.J., Copenhagen Consensus Center, 2010)
indicates the policy costs of implementing Europe 20/20 could be €210 billion annually. Greater certainty to reduce climate change interventions may have significant economic benefits.

Booz & Company
Date: 19th September 2011 Cost-Benefit Analysis for GMES Final Version II
Prepared for: European Commission Directorate – Enterprise and Industry
30
as part of supporting the activities of the IPCC and the UNFCCC. An overview of this framework is provided in figure 3.1.
Figure 3.1: GMES: Supporting a Global EO Network
� The United Nations Framework Convention on Climate Change (UNFCCC), adopted in 1992, is the main vehicle for promoting international efforts to combat climate change
� A series of UNFCCC meetings is taking place working towards a new international climate change agreement to follow, or run in parallel to the Kyoto Protocol
� The Intergovernmental Panel on Climate Change (IPCC) is the leading international body for the assessment of climate change
� It was established by the United Nations Environment Programme (UNEP) and the World Meteorological Organization (WMO) to provide the world with a clear scientific view on the current state of knowledge in climate change and its potential environmental and socio-economic impacts (i.e. what is chaning, and at what rate)
� GCOS is intended to be a long-term, user-driven operational system capable of providing the comprehensive observations required for monitoring the climate system, assessing impacts of climate change, and supporting adaptation
� GCOS identifies what must be observed to determine change
� The Group on Earth Observations is coordinating efforts to build a Global Earth Observation System of Systems, or GEOSS� GEOSS is expected to deliver a broad range of societal benefits across a number of areas� GEOSS identifies and coordinates the landscape in terms of EO capability
� GMES represents a significant EU contribution to GEOSS, providing observations on essential climate variables and other EO requirements
� GMES is the EU(+) framework for making observations
Source: JRC Communication; Booz & Company analysis.
Through GEOSS, an array of EO systems is being organised to collect important climate data and in particular the ascribed Essential Climate Variables (ECVs – see table 3.1 below). The development of GMES represents the EU contribution to this global observation network.
Table 3.1: GCOS Essential Climate Variables
Domain GCOS Essential Climate Variables
Atmospheric
� Surface: Air temperature, Wind speed and direction, Water vapour, Pressure, Surface radiation budget
� Upper Air: Temperature, Wind speed and direction, Water vapour, Cloud properties, Earth radiation budget (including solar irradiance)
� Composition: Carbon dioxide, Methane, and other long-lived greenhouse gases, Ozone and Aerosol, supported by their precursors
Oceanic
� Surface: Sea-surface temperature, Sea-surface salinity, Sea level, Sea state, Sea ice, Surface current, Ocean colour, Carbon dioxide partial pressure, Ocean acidity, Phytoplankton
� Sub-surface: Temperature, Salinity, Current, Nutrients, Carbon dioxide partial pressure, Ocean acidity, Oxygen, Tracers
Terrestrial
� River discharge, Water use, Groundwater, Lakes, Snow cover, Glaciers and ice caps, Ice sheets, Permafrost, Albedo, Land cover (including vegetation type), Fraction of absorbed photosynthetically active radiation (FAPAR), Leaf area index (LAI), Above-ground biomass, Soil carbon, Fire disturbance, Soil moisture
Source: http://www.wmo.int/pages/prog/gcos/index.php?name=EssentialClimateVariables.

Booz & Company
Date: 19th September 2011 Cost-Benefit Analysis for GMES Final Version II
Prepared for: European Commission Directorate – Enterprise and Industry
31
For GCOS, the primary GMES contributions come from Sentinel 5 (methane), Sentinel 3 (ocean altimetry, sea ice), Sentinel 2 (global land cover) and Contributing Missions. It is expected that all will add to information about the ECVs to improve medium and long range forecasts of climate change outcomes.
As part of this international effort, the enhanced capability for the monitoring of global deforestation is also a key contribution. Deforestation is the conversion of a forest area into non-forest related use. Deforestation is a particular problem in South America, Africa, and Asia, with the main causes linked to large economic development programs involving resettlement, agriculture and infrastructure. A recent FAO report45 stated that on average 13 million hectares of forests were converted to other uses each year during the last decade. 46
Deforestation causes around 20% of the world’s net greenhouse gas emissions and has a significant impact on biodiversity through habitat loss. Therefore it is not only an environmental issue, but also one of economic consequences.47 Reducing deforestation has the potential to be a highly cost-effective way of reducing greenhouse gas (GHG) emissions.
In 2008, the EU introduced a major policy initiative linked to deforestation and identified GMES as an instrument that can play an important role in monitoring land-use changes and deforestation trends.48
Sentinel 2 will obtain images of global land cover such as forests, wetlands, savannah and other sensitive habitats. This could provide a key mitigation measure in relation to monitoring global forest cover. Regular monitoring of status of habitats by measurement of habitat extent could facilitate policy measures to reduce deforestation. The United Nations Forum on Forests (UNFF) has been established to promote improved forest management and conservation.49 In general, monitoring enables bilateral and multilateral agreements to be enforced regarding net carbon impact of national policies at global level. GMES can help to inform and enforce such agreements, which would support developing countries in protecting forest cover. It may result in more effective action in terms of identifying areas needing protection, and result in improved compliance with international agreements to maintain forest cover and reducing net emissions.
3.3.2 Climate Change Adaptation
Investment in climate change adaptation measures is likely to represent significant costs, but has the potential to yield significant benefits in terms of reducing the negative impacts of climate change50. For example, investment in coastal protection in Europe has increased since 1998 when annual expenditure was around €357 million. The average for the period 1998 – 2015 is €0.9 billion, with a peak of €1.1 billion in 2008. The projected investment in 2015 is €740.8 million. This is in line with recommended spending levels.51
45 http://www.un.org/apps/news/story.asp?NewsID=34195. 46 However, the figure was down from 16 million per annum during the 1990s. 47 http://www.defra.gov.uk/environment/natural/deforestation/. 48 COM(2008) 645: “Addressing the challenges of deforestation and forest degradation to tackle climate change and
biodiversity loss”. 49 http://www.un.org/esa/forests/about.html. 50 See for example “Economic Aspects of Adaptation to Climate Change – Costs, Benefits and Policy Instruments”, OECD,
2008. 51 “The economics of climate change adaptation in EU coastal areas”,
http://ec.europa.eu/maritimeaffairs/climate_change/report_en.pdf.

Booz & Company
Date: 19th September 2011 Cost-Benefit Analysis for GMES Final Version II
Prepared for: European Commission Directorate – Enterprise and Industry
32
Uncertainty of future climate change and its impacts is already having a major impact on much government expenditure. For example, infrastructure planners in the UK are already factoring in uncertainty around future flooding. The EU report SEC(2009) 38752 expresses the need for the EU to have more accurate forecasts of climate change in order to reduce uncertainties in oceanographic forecast. The ability to reduce uncertainty would not only improve future decision making on spending, but also most likely result in reduced overall public sector spending, along with more effective protection measures.
It has been estimated that if climate change uncertainty could be reduced by 25%, it would be possible to save €100 million per annum in costs of coastal defences, or around 10% of average EU expenditure per annum.53
As with mitigation, the benefits of climate change adaptation have the potential to be very large.54 It is expected that GMES can play a significant role in refining our adaptation approaches. This could increase should there be a failure to achieve a sufficient net global reduction in GHG emissions.
3.3.3 Overall Impact of GMES
Overall, the key role of GMES would be to provide a step-change enhancement in the monitoring of climate change relevant EO data (ECVs) to ensure consistency and continuity of data supply and enhance the quality of EU policy advice on the state and responses to climate change. This can enhance the ability of the EU to influence multilateral policies because of its direct access to its own independent sources of data and inputs into modelling. This will consolidate the EU’s leading role in brokering agreements. There is also scope for exploring whether GMES monitoring can be used to support the monitoring of international agreements on the reduction of greenhouse gas emissions. If it could be argued that GMES can contribute to this, even if only incrementally, the benefits would be very large. However, establishing the causality between GMES and the benefits from adaptation is not straightforward.55
Separately, the benefits of adaptation against a business as usual baseline provides a simplified approach for providing an order of magnitude estimate of the potential benefits of GMES within the climate change area. In the PWC study56, the total impact of addressing climate change from GMES related information was determined to be in the range of 0.1 – 0.5%. This study considers there to be a strong basis for assuming that GMES can provide incremental value to enhancing our understanding of what will be required from climate change adaptation in order to reduce the damage costs of climate change.
This is a complex area, and there are overlaps between mitigation and adaptation issues; the more successful the mitigation, the less urgent adaptation would need to be. As a simplified
52 SEC(2009) 387: “Impact assessment on the White Paper on adapting to climate change”, April 2009.
http://eur-lex.europa.eu/LexUriServ/LexUriServ.do?uri=SEC:2009:0387:FIN:EN:PDF. 53 Interview with DG MARE. See also European Commission (DG Maritime Affairs & Fisheries): “Marine Data
Infrastructure”, November 2009. 54 See for example a comprehensive selection of very recent papers on the topic in Bjørn Lomborg’s “Smart Solutions to
Climate Change: Comparing Costs and Benefits”, Copenhagen Consensus Center, 2010. 55 An issue with including benefits of climate change mitigation in the cost-benefit analysis is that if GMES supports the
forming of globally binding agreements, then these would also carry significant abatement costs. For this reason, estimates of economic benefits for climate change mitigation in the GMES CBA should theoretically include these offsetting costs to be completely robust. In any case, given the risks involved with climate change, it is arguable that it is not entirely appropriate to apply a standard CBA approach that also considers abatement costs.
56 Price Waterhouse Coopers: “A socio-economic Benefits Analysis of GMES”, 2006, p. 67 (henceforth referred to as PWC).

Booz & Company
Date: 19th September 2011 Cost-Benefit Analysis for GMES Final Version II
Prepared for: European Commission Directorate – Enterprise and Industry
33
approach, it is recommended to apply a single climate change assessment for GMES that represents the overall impacts of mitigation and adaptation.
This approach therefore requires an assessment of the baseline damage costs associated with climate change, as carried out below.
3.4 IMPACTS OF CLIMATE CHANGE AND THE COST OF CARBON
The link between the emission of GHGs and their role in altering the energy balance of the climate systems is now well established and widely accepted. According to the IPCC, CO2 is the most important anthropogenic greenhouse gas, and its atmospheric concentration has increased by around 35% since the industrialisation era such that current levels by far exceed the highest natural levels that have occurred over the last 650,000 years. The primary source of these increases is primarily attributed to fossil fuel use, with additional net CO2 emissions attributed to land use change.57
Limiting the extent of man-made climate change or its impacts on society is a global issue for governments, and a top priority of the EU and its Member States. As such, there is a clear need for policy makers to be able to demonstrate the scope of the climate change problem and to support the implementation of climate change mitigation and adaptation strategies with quantified benefit assessments. This is also critical for the GMES programme, which seeks to promote its role of supporting climate monitoring with the aim of enhancing EU mitigation and adaptation strategies.
There has been a concerted effort on a global scale in establishing a measurable link between GHG emissions, its radiative forcing58 properties and cause of global temperature increases, and the impacts of climate change on society in terms of economic, social and environmental costs. Widely used measures include the social cost of carbon, shadow price of carbon, the traded cost of carbon and the abatement cost of carbon. The development and use of carbon values in project appraisal is discussed below.
3.4.1.1 Social Cost of Carbon
According to the UK Department of Environment, Food and Rural Affairs (DEFRA), the social cost of carbon (SCC) is a measure of the full global cost today of an incremental unit of CO2 (or equivalent amount of other greenhouse gases) emitted now, and over its time in the atmosphere. As such, it is a measure of the externality caused by the emission of carbon and should equate to what society would be willing to pay now to avoid future damage caused by current emissions.59
The value of the SCC varies depending on the level of carbon concentration in the atmosphere at any given time, and hence is linked to current and future emission levels and mitigation policies. It differs from the traded price of carbon or the marginal abatement cost (MAC), with the former being related to the supply constraints in the market for traded carbon, and the latter relating to the cost of reducing emissions. Based on these concepts, an
57 IPCC: “Working Group I Report, Summary for Policy Makers”, 2007. 58 The IPCC defines radiative forcing as a measure of the influence that a factor has in altering the balance of incoming and outgoing
energy in the Earth-atmosphere system and is an index of the importance of the factor as a potential climate change mechanism. (IPCC: “Working Group I Report, Summary for Policy Makers”, 2007).
59 DEFRA Economics Group: “The Social Cost of Carbon and the Shadow Price of Carbon: What They Are, And How to Use them in Economic Appraisal in the UK”, 2007.

Booz & Company
Date: 19th September 2011 Cost-Benefit Analysis for GMES Final Version II
Prepared for: European Commission Directorate – Enterprise and Industry
34
optimal stabilisation goal would be to achieve a carbon concentration level for which the SCC was equal to the MAC.
Many studies have attempted to measure the SCC. A review of the approaches to measuring SCC and the range of uncertainties in the results is presented by Downing et al. (2005):60
� Estimates of the social cost of carbon span at least three orders of magnitude, from 0 to over 1,200 €/tC, reflecting uncertainties in climate and impacts, coverage of sectors and extremes, and choices of decision variables;
� A lower benchmark of nearly 40 €/tC is reasonable for a global decision context committed to reducing the threat of dangerous climate change and includes a modest level of aversion to extreme risks, relatively low discount rates and equity weighting; and
� An upper benchmark of the SCC for global policy contexts is more difficult to deduce from current modelling scenarios, but the risk of higher values for the social cost of carbon is significant.
The Downing study also presents an interpretation of the SCC literature using a risk matrix as depicted in figure 3.2 below. The vertical axis represents uncertainty in predicting climate change, which increases moving down the axis. Projection involves a higher degree of certainty, relating to factors such as the magnitude of temperature changes and sea-level rises. There is more uncertainty around bounded risks, which include factors such as precipitation and extreme events. There is large uncertainty around system change and unexpected events, such as collapsing ice sheets.
The horizontal axis reflects uncertainty in economic impacts, with uncertainty increasing from left to right. Market impacts include those where market prices exist and valuation can be made relatively easily. Non-market factors include non-priced socio-economic and environmental factors. Socially contingent factors relate to large-scale socio-economic responses, such as migration and conflict.
Figure 3.2: Locating the SCC literature in a risk assessment framework
Source: Downing et al.,: “Social Cost of Carbon: A Closer Look at Uncertainty”, 2005.
60 Downing et al.,: “Social Cost of Carbon: A Closer Look at Uncertainty”, 2005.

Booz & Company
Date: 19th September 2011 Cost-Benefit Analysis for GMES Final Version II
Prepared for: European Commission Directorate – Enterprise and Industry
35
Based on this analysis of existing studies, a number of important conclusions about their scope and levels of confidence are reached by Downing et al.:61
� The coverage of existing studies is almost exclusively in the upper left quadrant of our risk matrix. Most of the studies, and relatively greater confidence, is in the market-projected climate change cell. For instance, FUND is benchmarked to changes in temperature (and sea level rise), with only an indirect connection to changes in precipitation (included in the middle row);
� The range of uncertainties mentioned in the literature includes the familiar concerns. Most studies include some regional and sectoral breakdown and discounting over time. Other sources of uncertainty, such as equity weighting, cross-sectoral interactions, and a full range of future economic scenarios are mentioned in some studies;
� Few of the published studies provide sufficient detail (of either the model or results) to break down uncertainties and their relative importance. Thus, a formal meta-analysis of all of the sources of uncertainty in the prevailing literature is not possible (without getting additional information and model results from each study);
� Some uncertainties have been ignored. Regional impact assessments (such as the plethora of country studies) are not captured in the global estimates, which are based on global integrated assessment models at a coarse spatial and socio-economic scale. Valuation issues such as aggregating social preference functions, risk aversion and socially contingent factors have not been explored in the published quantitative estimates.
Recognising the limitations of existing studies, the Stern Review developed independent estimates of the SCC. Some of the key messages from this modelling exercise were that:62
� The monetary cost of climate change is now expected to be higher than many earlier studies suggested, because these studies tended not to include some of the most uncertain but potentially most damaging impacts.
� Modelling the overall impact of climate change is a formidable challenge, involving forecasting over a century or more as the effects appear with long lags and are very long-lived. The limitations in our ability to model over such a time scale demand caution in interpreting results, but projections can illustrate the risks involved – and policy here is about the economics of risk and uncertainty.
� Most formal modelling has used as a starting point of 2 - 3°C warming. In this temperature range, the cost of climate change could be equivalent to around a 0 - 3% loss in global GDP from what could have been achieved in a world without climate change. Less developed countries will suffer higher costs.
� Using an Integrated Assessment Model, and with due caution about the ability to model, it is estimated that the total cost of ‘Business as Usual’ climate change equates to an average reduction in global per-capita consumption of 5%, at a minimum, now and forever.
� The cost of ‘Business as Usual’ would increase still further, were the model to take account of three important factors:
61 Downing et al.,“Social Cost of Carbon: A Closer Look at Uncertainty”, 2005. 62 HM Treasury (UK): “Stern Review on the Economics of Climate Change”, 2006.

Booz & Company
Date: 19th September 2011 Cost-Benefit Analysis for GMES Final Version II
Prepared for: European Commission Directorate – Enterprise and Industry
36
- First, including direct impacts on the environment and human health (‘non-market’ impacts) increases the total cost of ‘Business as Usual’ climate change from 5% to 11%, although valuations here raise difficult ethical and measurement issues. Yet this does not fully include ‘socially contingent’ impacts such as social and political instability, which are very difficult to measure in monetary terms;
- Second, some recent scientific evidence indicates that the climate system may be more responsive to greenhouse gas emissions than previously thought, because of the existence of amplifying feedbacks in the climate system. Our estimates indicate that the potential scale of the climate response could increase the cost of ‘Business as Usual’ climate change from 5% to 7%, or from 11% to 14% if non-market impacts are included. In fact, these may be only modest estimates of the bigger risks – the science here is still developing and broader risks are plausible;
- Third, a disproportionate burden of climate change impacts fall on poor regions of the world. Based on existing studies, giving this burden stronger relative weight could increase the cost of ‘Business as Usual’ by more than one quarter.
� Putting these three additional factors together would increase the total cost of ‘Business as Usual’ climate change to the equivalent of around a 20% reduction in current per-capita consumption, now and forever. Distributional judgements, a concern with living standards beyond those elements reflected in GDP, and modern approaches to uncertainty all suggest that the appropriate estimate of damages may well lie in the upper part of the range 5 – 20%. Much, but not all, of that loss could be avoided through a strong mitigation policy.
The Stern Review presented estimates of the SCC for the ‘Business as Usual’ scenario and for alternative mitigation path scenarios. The Review calculated the SCC under the ‘Business as Usual’ scenario as being equivalent to around USD 85 per tonne of CO2 (year 2000 prices). For a mitigation trajectory towards 550ppm CO2e, the SCC would be around USD 30 per tonne of CO2. For a trajectory towards 450ppm CO2e, the SCC was calculated to be around USD 25 per tonne of CO2.
Under this framework, the benefits of any mitigation strategy are equal to the difference between the global damage costs under the business as usual scenario, and the total damage costs under the mitigation scenario.63
The results of the Stern Review were subject to much debate and, in some cases, criticisms across the climate change arena. A specific issue of contention is in relation to the treatment of issues relating to the ethics of social and inter-generational equity. As with many other studies that estimate higher values for the SCC, the Stern Review placed a strong emphasis of the need for current generations to place a higher value on the risks that climate change poses for future generations (i.e. via a very low discount rate on future climate damage).
3.4.1.2 Recent Developments in Carbon Valuation
While measures of the SCC are useful for quantifying the global damage caused by GHG emissions at a given level of CO2 concentration, and the potential range of impacts, its
63 The Stern Review published the following equation to illustrate how the benefits would be calculated: (SCCH x EH) – (SCCS
x ES), where SCC denotes the social cost of carbon, E the annual level of emissions, the subscript H the high ‘business as usual’ trajectory and the subscript S the stabilisation trajectory.

Booz & Company
Date: 19th September 2011 Cost-Benefit Analysis for GMES Final Version II
Prepared for: European Commission Directorate – Enterprise and Industry
37
application to the appraisal of climate change mitigation strategies that involve the setting of GHG targets is problematic. As noted in a review study by Simon Dietz (2007):64
� The quantification of SCC is highly uncertain and it is not possible to observe the probabilities of the impacts of climate change;
� The quantification of SCC involves various value judgments. A key judgment is in relation to intergenerational equity and the assumptions on discount rates that are required. For example, studies that assume very low discount rates tend to estimate a higher SCC. Another source of value judgment is in relation to social equity and the valuing of impacts that are felt by different socio-economic groups or across different regions. Again, studies that use equity values tend to estimate higher SCC; and
� The quantification of SCC generally assumes that government policies for climate change mitigation are based on a utilitarian social welfare objective, when in many cases this will not be the case, and many other considerations are relevant. The view is that the UK government (and by inference the EU) is pursuing a more aggressive climate change mitigation strategy compared to what is supported by studies of optimal emission strategies.65
Another problem is that using the SCC to set a stabilisation trajectory in one country or global region such as the EU requires assumptions about the actions of other regions. This reflects the fact that achieving most stabilisation trajectories requires concerted global action.
In recent years in the UK, there have been a series of developments with respect to the valuation of carbon for the purpose of project appraisal, as government authorities seek to overcome some of the issues with measure of the SCC.
In 2007, DEFRA published guidance on the shadow price of carbon (SPC), which included estimates of the SPC consistent with reaching a 550ppm atmospheric carbon concentration over the period 2000 to 2050. In their approach, the SPC is based on estimates of the SCC for a given stabilisation goal, but adjusted to reflect estimates of the MAC required to achieve the stabilisation goal, plus other factors that may affect UK willingness to pay for reductions in emissions. This could include factors such as political ambitions of showing leadership in addressing climate change. This approach was claimed to produce an estimate of price with a more versatile basis to reflect government policies on climate change.66
In 2009, the UK Department of Energy and Climate (DECC) released its findings of a review into the use of carbon values in project appraisal. This considered the merits of using measures of SCC in the context of the UK’s commitments to reducing emissions and participation in the European emissions trading scheme (ETS). A key question is whether, given these commitments, the SCC consistent with the relevant stabilisation pathway would actually incentivise the world along that trajectory by being consistent with the marginal abatement costs of doing so. In this context, the key problems were found to relate to the empirical challenges of estimating the global optimal solution and the SCC consistent with
64 Dietz, Simon: Review of DEFRA paper: “The Social Cost of Carbon and the Shadow Price of Carbon: what they are, and
how to use them in Economic Appraisal in the UK”. 65 The supporting study on optimal emissions strategies cited is Tol, R. S. J. and Yohe, G. W. (2006): “A Review of the Stern
Review”, World Economics 7(4), pp. 233-250. 66 DEFRA Economics Group: “The Social Cost of Carbon and the Shadow Price of Carbon: What They Are, And How to Use
them in Economic Appraisal in the UK”, 2007.

Booz & Company
Date: 19th September 2011 Cost-Benefit Analysis for GMES Final Version II
Prepared for: European Commission Directorate – Enterprise and Industry
38
it, and the issues in dividing the burden of achieving that stabilisation goal into individual country emission targets.67
To overcome these issues, DECC has promoted an alternative approach to valuing carbon for use in project appraisals, which is based on the concept of ‘target-consistent carbon valuation’ and linked to MAC rather than the SCC.
Under this approach, the value of carbon is set so that it is consistent with the level of marginal abatement costs required to reach the government’s emissions targets. The benefits of this approach are said to relate to supporting the meeting of climate change targets, and avoiding potential free-riding.
The UK government has also released additional guidance on the valuation of carbon, which shows that a mix of traded and non-traded values should be used in project appraisal that are consistent with the UK government’s emission targets (see table 3.2 below). This approach recognises the supply constraints imposed by the ETS for a portion of sectors. This guidance also provides specific carbon values to be used in project appraisals in the UK, with non-traded values increasing from €60 in 2008 to €85 in 2030, and €241 by 2050. Traded values increase from €37 in 2008 to levels consistent with non-traded values from 2030.
Table 3.2: Carbon Prices in UK Appraisal Using MAC, €/Tonne CO2 (2010 Prices)68
Year Traded Prices Non-traded Prices
Low Central High Low Central High
2008 14 37 31 30 60 91
2030 42 85 127 42 85 127
2050 121 241 362 121 241 362
Source: DECC: “Carbon Appraisal in the UK: A Revised Approach”, 2009.
There is no formal guidance available on the global level of MAC required to achieve given levels of CO2 concentration. However, it can be expected that global cost curves will vary from those for individual countries. MAC curves can also be developed for individual sectors as well as for countries and regions.
A recent study by McKinsey and Company on the global cost of abatement, estimates the MAC associated with achieving a 550ppm level of CO2 is approximately €25 per tonne of CO2. The MAC associated with a 450ppm level is estimated to be around €40 per tonne, and for 400ppm it is estimated to be around €50 per tonne of CO2.
3.4.2 Conclusions for the GMES CBA
Several key factors should be considered when selecting a measure of the cost of carbon to support the proposals for GMES. The concept of the SCC is useful in the context of GMES, as it can provide a basis for evaluating the total damage costs that can be attributed to climate change linked to GHG emissions. It is important to consider the potential impacts that climate change mitigation and adaptation strategies can deliver compared to a ‘Business as Usual’ scenario. In this way, it is possible to demonstrate the full scale of benefits that GMES can provide by supporting the pursuit and monitoring of binding international climate
67 DECC: “Carbon Valuation in UK Policy Appraisal: A Revised Approach”, 2009. 68 Note: UK values have been converted from GBP, 2009 values, to Euros, 2010 values, using 4% inflation and a 2010
exchange rate of 1.16.

Booz & Company
Date: 19th September 2011 Cost-Benefit Analysis for GMES Final Version II
Prepared for: European Commission Directorate – Enterprise and Industry
39
change mitigation targets, and in the development of targeted adaptation measures across the EU. This approach also recognises that the development of GMES is not directly linked to specific climate change measures, but is instead a tool that can be used to support their implementation. In this way, it is possible to ensure that the analysis treats the assessment of benefits for climate change aspects in a way that is consistent with the other parts of the CBA.
However, this study does recognise that there may be a number of concerns with applying the SCC approach in the context of project appraisals. These relate to perceived problems with the practical difficulties, and the level of uncertainty that measures of SCC carry. There is also a considerable body of literature, mostly developed in the UK, to support the evaluation of climate change mitigation policies, advocating the use of carbon values based on the MAC.
Based on an overall balance of these considerations, it is recommended to evaluate the benefits of GMES using SCC measures developed for the ‘Business as Usual’ scenario in the Stern Review.
3.4.3 Assessment of the Total Damage Costs of Climate Change
The total damage costs of climate change were estimated in the Stern Review. The Review found that the monetary costs of climate change will be higher than many of the earlier studies presented. Working from the assumption of an increase in temperatures of around 2-3 degrees Celsius, the cost of climate change was estimated to be around a 0-3% loss in global GDP from a “what would be achieved in a world without climate change” scenario. The Review also estimated that the cost of a ‘Business as Usual’ climate change scenario would equate to an average reduction in global per capita consumption of around 5% at a minimum. Accounting for additional non-market impacts, social equity issues and the enhanced responsiveness of the climate system, would increase the reduction in per capita consumption to 20%.69
The Stern Review presented estimates of the SCC for the ‘Business as Usual’ scenario and for alternative mitigation scenarios. The Review calculated the SCC under the ‘Business as Usual’ scenario as being equivalent to around USD 85 per tonne of CO2 (year 2000 prices). For a mitigation trajectory towards 550ppm CO2e, the SCC would be around USD 30 per tonne of CO2. For a trajectory towards 450ppm CO2e, the SCC was calculated to be USD 25 per tonne of CO2.
These values are combined with projections of global CO2 emissions to estimate a total damage cost of climate change for use in the GMES CBA. To do this, the analysis uses the marker scenarios outlined by the IPCC in its Special Report on Emissions Scenarios (SRES). These include four groups of scenarios (A1, A2, B1 and B2) that represent different storylines regarding the future world and how they will affect GHG emissions, and within each storyline a range of sub-scenarios are modelled. Overall, a series of six illustrative scenarios were included. Each scenario includes varying assumptions on GHG drivers such as economic growth, energy supply and consumption, technological change, and sustainable development.
The scenarios do not include additional climate change initiatives, such as the implementation of the UNFCCC or the emissions targets of the Kyoto Protocol. No
69 HM Treasury (UK): “Stern Review on the Economics of Climate Change”, 2006.

Booz & Company
Date: 19th September 2011 Cost-Benefit Analysis for GMES Final Version II
Prepared for: European Commission Directorate – Enterprise and Industry
40
judgment is made regarding the likelihood of each scenario coming to fruition, with each of the scenarios considered as being equally valid. These considerations merit the adoption of an average of the marker scenarios as a central estimate of future GHG emissions in a business as usual scenario.
The study has estimated the total damage cost of CO2 emissions only, excluding the other sources of CO2 equivalent emissions such as methane and CFCs. Under this assumption, the average level of global anthropogenic CO2 emissions from fossil fuels and other sources increase from around 9.7 gigatonnes in 2010, to around 13.3 gigatonnes in 2030.
Based on our assumptions regarding the SCC, which has been increased in line with inflation and applied an exchange rate to convert them to 2010 values in Euros, the total damage cost of climate change is estimated to be around €730 billion in 2010, increasing to around €1.5 trillion by 2030. These are very large figures, which supports the view that efforts to reduce these risks are worth pursuing. In this context GMES can provide significant benefits.

Booz & Company
Date: 19th September 2011 Cost-Benefit Analysis for GMES Final Version II
Prepared for: European Commission Directorate – Enterprise and Industry
41
4. ENVIRONMENT & SECURITY
4.1 INTRODUCTION
This chapter provides an analysis of the role for GMES in supporting EU environment and security policies. The purpose of this chapter is to provide an overview of the rationale for GMES in each of the relevant policy domains. It also establishes the estimates of baseline damage costs that are used as the basis for the quantified benefit assessment in subsequent chapters.
The impact areas that GMES have the potential to provide significant support are listed below:
� Environmental management: Support for efforts to protect the environment from man-made and natural degradation. This may also be considered to be conservation. The areas that have potential significant impacts from GMES are air quality, desertification and sea/marine pollution.
� Resource management: Scarce natural resources and ecosystems such as land, vegetation, oceans, waterways and the atmosphere, managed for economic purposes. The areas that have potentially significant impacts from GMES are deforestation and maritime navigation, and existing EU policies in respect of agriculture (CAP) and regional cohesion programmes.
� Emergency management: Anticipation, response, recovery and reconstruction in the event of disasters, both natural and man-made and early warning of flooding. The ability to enhance responsiveness to save lives, reduce injury and disease and mitigate property damage. The events that have potential significant impacts from GMES are geohazards (in particular earthquakes), forest fires and flooding.
� Security and Humanitarian applications: More effective and better targeted assistance to developing countries in time of crisis and longer term targeting of aid to enhance sustainable economic and social development. Benefits may arise from reduced health and welfare damage due to better targeted aid, e.g. through emergency response to natural hazards (before, during, and after the event). Regarding the services for security applications (border control, maritime surveillance and support to EU external action), benefits arise from reducing the costs of enforcement, preventing drug trafficking, piracy and cross-border crime, monitoring critical infrastructure, and supporting treaty compliance and peacekeeping and crisis management operations.
In the following sections, each of the key areas listed above is analysed in greater detail from a qualitative perspective. The analysis was used to inform the quantitative assessment of these benefit areas.
4.2 ENVIRONMENTAL MANAGEMENT
The key data gathering activities of GMES pertain to the state of the land, marine and atmospheric environments regarding usage, composition and cover. The EU has a wide range of environmental policies and legislation that are relevant to GMES. These include:
� Clean Air for Europe (CAFE)70;
70 http://ec.europa.eu/environment/archives/cafe/general/keydocs.htm.

Booz & Company
Date: 19th September 2011 Cost-Benefit Analysis for GMES Final Version II
Prepared for: European Commission Directorate – Enterprise and Industry
42
� EU Sustainable Development Strategy71;
� Biodiversity Action Plan72;
� Birds Directive and Habitats Directive73;
� Soil Thematic Strategy74;
� Sustainable Consumption and Production and Sustainable Industrial Policy Action Plan75; and
� Water Framework Directive76.
GMES will allow for the development of an integrated set of data for environmental indicators across land, marine and atmospheric environments in Europe. It is expected to improve the efficiency of the collection of this data, and to facilitate reporting on the application of EU Directives by Member States. Beyond lowering the cost, and increasing the geographic scope, of monitoring, GMES can help to inform decisions on priorities for regulatory or funding intervention to preserve biodiversity. It can also be useful to provide information to avoid interventions that may be unnecessary. The costs of regulatory, taxation and subsidy interventions for environmental protection for taxpayers, businesses and citizens can be considerable. Lowering these by allowing better information to target such measures could be a significant benefit.
Environmental management of air emissions can be greatly assisted by GMES, particularly for air quality over large areas. GMES could bring savings in monitoring, for example, atmospheric composition over regions, countries and continents. Better air quality data might increase pressure to lower emissions, and may result in interventions to improve air quality that have public health benefits over a long period.
In terms of desertification, GMES could monitor risk factors adjacent to deserts related to land use and waterways, and will provide information to policy interventions in order to stem the growth of affected land area. Water catchments, agriculture and forest cover are all affected by measures to address desertification. GMES may provide sufficient information to accelerate interventions, creating benefits from retention of larger quantities of land for other purposes.
GMES can provide a multi-spectral assessment of water quality, assessing whether the chemical composition, temperature and surface conditions (including presence of waste) indicates issues with water quality.
An overarching benefit of GMES is to improve the quality of data used to input into options and recommendations on environmental policy. This also includes increased levels of certainty to enable more optimal decisions to be made on policies. An additional and equally important element is how such information may better inform regulatory and planning decisions in specific cases, which may avoid excessive constraints on human activities to protect the environment on one hand, or create greater transparency as to the need for specific constraints otherwise. These benefits may be seen in an assessment of risk around
71 http://ec.europa.eu/sustainable/welcome/index_en.htm. 72 http://ec.europa.eu/environment/nature/biodiversity/comm2006/index_en.htm. 73 http://ec.europa.eu/environment/nature/legislation/habitatsdirective/index_en.htm. 74 http://ec.europa.eu/environment/soil/index_en.htm. 75 http://ec.europa.eu/environment/eussd/escp_en.htm. 76 Directive 2000/60/EC: “Establishing a Framework for Community Action in the Field of Water Policy”, October 2000.

Booz & Company
Date: 19th September 2011 Cost-Benefit Analysis for GMES Final Version II
Prepared for: European Commission Directorate – Enterprise and Industry
43
failures to make optimal decisions based on lack of information. This is related to the assessment of benefits from better information on climate change, as it can be seen as a measure of the benefits of lower risks attributed to policy measures, resulting in lower net costs of interventions.
4.2.1 Air Quality
Rationale
The role of the EU in supporting the management of air quality is outlined in its Directive on air quality.77 Various pollutants cause premature death and disease, although the medium term trend is downward due to technological improvements in the energy and transport sectors. A recent WHO study78 states that air pollution may lead to a shortening of life expectancy in Europe. In specific terms, it emphasises that urban air pollution reduces life expectancy of residents in more polluted areas by over a year.
The ability to forecast with greater accuracy major smog events (maybe one to two times a year in major cities) an extra day in advance would allow vulnerable residents to avoid exacerbating conditions. Incentives to change behaviour in cities may also reduce the severity of such events, although this is dependent on willingness and power to actually impose restrictions on, for example: traffic, home heating and industry. In this context, it is envisaged that the GMES Atmosphere Monitoring service, coupled with the more citizen-oriented air quality alerting service (ObsAIRve) will contribute to the reduction of bad health through air pollution associated with these events.
Another area where analysis of air quality by GMES services can provide benefits is the example of Icelandic volcanic ash clouds that have disrupted European air travel in 2010 and 2011. Satellites provide support to this analysis either by examining the density of particles in the air, or the chemical content (in this case, sulphur). In situ data can provide information as to the amount of ash projected into the sky, but it is satellites that are able to identify the exact altitude of the ash cloud; this information is critical in order to predict how the distribution of this ash will develop, and so reduce the cost of disruption to European air travel.79
Baseline Costs
The CAFE (Clean Air for Europe) programme, and supporting cost-benefit study, provides a useful reference case80 for establishing a baseline. The WHO Global Health Observatory provides a baseline in terms of DALY (Disability Adjusted Living Years), estimated at 906,888. The values from the CAFE study have been adapted to incorporate a DALY value of €55,000, and adjusted to 2010 prices. As a simplifying assumption, it is assumed that air quality improves by around 20% over a 20-year period, or around 1% per annum. The base DALY figure is therefore reduced by 1% per annum for each year from 2004 (assuming a one-to-one relation).
77 See Directive 2008/50/EC on ambient air quality and cleaner air for Europe, May 2008.
http://eur-lex.europa.eu/LexUriServ/LexUriServ.do?uri=OJ:L:2008:152:0001:0044:EN:PDF. 78 WHO: “Health and Environment in Europe: Progress Assessment”, 2010.
http://www.euro.who.int/__data/assets/pdf_file/0010/96463/E93556.pdf.
These arguments are also stressed in the SEC(2011) 342 final staff working paper, provided by the European Commission. 79 Interview with the European Centre for Medium-range Weather Forecasting (ECMWF). 80 http://ec.europa.eu/environment/archives/cafe/activities/pdf/cba_baseline_results2000_2020.pdf.

Booz & Company
Date: 19th September 2011 Cost-Benefit Analysis for GMES Final Version II
Prepared for: European Commission Directorate – Enterprise and Industry
44
The result is a total baseline cost from air pollution of around €50 billion per annum.81 GMES is assumed to have a contributing impact in reducing air pollution over time. This could be through early warning of major events and in terms of direct interventions (such as traffic restrictions).
4.2.2 Global Desertification
Rationale
Desertification is the degradation of land areas due to a complex set of factors such as climate change and human activity (population growth, conflicts and insufficient care of natural resources). In 2010, the UN launched the “Decade for Deserts and the Fight against Desertification”.82 Improved EO data is valuable in providing additional information about land cover, land use and biophysical data. Combining this type of data with socio-economic data for the concerned areas will provide a strong basis for monitoring desertification, and potentially developing mitigating actions to reduce the impact. GMES may be able to support the process of managing desertification better, with information that enables the interventions to reduce overall costs. The effect that can be directly linked to GMES will be small. The primary GMES contribution is likely to come from the development of services that can process relevant data from Contributing Missions.
Baseline Costs
Desertification affects 3.6 billion hectares of land worldwide, or 25% of the Earth's terrestrial land mass. In total, 12 million hectares of land is lost every year, with an average value per
81 This represents a very conservative baseline valuation. Firstly, by applying global and not a European value as the
European Commission would normally do in an impact assessment. Secondly, by significantly lowering the actual impact of air pollution, as for example 2005 reports by the Commission (see SEC(2005) 1133 final - http://ec.europa.eu/governance/impact/ia_carried_out/docs/ia_2005/sec_2005_1133_en.pdf) states that air pollution leads to more than 300,000 pre-mature deaths per annum in Europe. In the CAFE valuation this resulted in a baseline total health damage cost assessment, including illness, of €189Bn – €609Bn per annum n 2020.
82 The United Nations Convention to Combat Desertification (UNCCD) is the sole legally binding international agreement linking environment, development and the promotion of healthy soils.

Booz & Company
Date: 19th September 2011 Cost-Benefit Analysis for GMES Final Version II
Prepared for: European Commission Directorate – Enterprise and Industry
45
hectare calculated as €2,692. This provides an estimated baseline figure of USD 42 billion (€32 billion) lost each year in income as a result of desertification and land degradation.83
4.2.3 Sea pollution / Oil Spillage
Rationale
Marine pollution in the form of hydrocarbon contamination comes from a number of sources, including industrial discharge and urban run-off (37%), sea vessel operations (33%), oil tanker accidents (12%), natural secretions from within the ocean-bed (7%), oil exploration and production (2%), and the atmosphere (9%).84
While only comprising 14% of average total oil pollution, oil spills due to oil tanker and exploration/production accidents are of particular concern given their link to significant environmental incidents in recent history. In fact, major oil spills are considered to be a key threat to marine ecosystems, and are capable of creating impacts that last up to 100 years.85 As such, the clean-up costs associated with major oil spills can be large, as has been witnessed with the Deepwater Horizon oil spill in the Gulf of Mexico in 2010.
GMES has an operational service (“CleanSeaNet”) focused on the detection and monitoring of oil spills.86 This provides information about the location of spills and can model their past or future development using forecasting or backcasting techniques. The former allows for Member State response staff to react faster and more accurately in their containment efforts, whilst the latter, when combined with ship routing data, contributes to the identification of transgressors (in the case of deliberate, illicit spills).87 As inputs into this observation system, satellites can be extremely useful in certain contexts, but there may be other areas, e.g. analysis of coastal currents, and the sea bed – where in situ sources provide better information.88
In addition to oil spills, the methodology for modelling ocean currents was used in 2011 to predict the likely pattern of radiation flows from the Fukushima nuclear plant in Japan following the earthquake and tsunami.89 The MyOcean GMES service was able to forecast likely current patterns up to two weeks in advance, at the surface and also to a depth of 1000m. These ocean current models are dependent on data derived from both satellites and in situ sources, and it was found during stakeholder interviews that it is difficult to distinguish between relative contributions.90
83 http://www.unep.org/Documents.Multilingual/Default.asp?DocumentID=646&ArticleID=6720&l=en&t=long. 84 Earth Science Australia, http://earthsci.org/mineral/energy/gasexpl/spill.html. 85 Oceana, http://eu.oceana.org/en/eu/media-reports/features/oil-slicks. 86 See http://www.emsa.europa.eu/cleanseanet/background.html. 87 See for example two report from the European Marine Safety Agency (EMSA). “EMSA’s view on the GMES Programme of
EU and ESA in particular the Marine Core Service”, December 2007.
(http://cleanseanet.emsa.europa.eu/docs/public/NonPaper_EMSAs_view_on_GMES.pdf) and “EMSA’s view on further development of oil spill modelling”.
(http://cleanseanet.emsa.europa.eu/docs/public/NonPaper_EMSAs_view_on_Modellingl.pdf). 88 Interview with DG MARE. 89 Interview with DG MARE. 90 Interview with MyOcean.

Booz & Company
Date: 19th September 2011 Cost-Benefit Analysis for GMES Final Version II
Prepared for: European Commission Directorate – Enterprise and Industry
46
Baseline Costs
There are various estimates of the average cost of oil spills. See for example the IMO’s 2009 report on environmental risk evaluation criteria91, Kontovas et al. (2010)92, Psarros et al. (2011)93 and a 2011 newsletter from the DG Environment.94 The conclusion of the literature review is that a total cost value of €56,600 (2010 prices) per tonne has been selected for the analysis. The value includes clean-up costs as well as costs associated with socio-economic and environmental damage. It is assumed that economic costs increase in line with real GDP over the appraisal period.
Total volume of oil spill has decreased significantly in the last 20 years (see the figure 4.1 below)95, with the average volume from ships in the range of 20,000 tonne per annum (average for 1998 – 2010). These trends are believed to result from the implementation of new regulations that include the reduction of oil spills as a stated goal, and the effective management of marine safety based on an accepted set of rules that were agreed through the International Maritime Organisation (IMO).96 Given the relatively good performance in terms of oil spill avoidance in the last 10 to 15 years, it is appropriate to base future expectations on the volume of oil spilled on average data since 2000.
Figure 4.1: Global Annual Quantity of Oil Spilt
0
50,000
100,000
150,000
200,000
250,000
300,000
350,000
400,000
450,000
500,000
550,000
600,000
650,000
1998197619741972 20041996 20001970 20082002 2006 2010198219801978 1984 19941992199019881986
Tonnes
Source: http://www.itopf.com/information-services/data-and-statistics/statistics/#no.
The newsletter “Small oil spills: overlooked source of marine pollution?” from DG Environment highlights the additional damage from minor oil spills.97 A paper by Redondo
91 IMO: “Report on the Correspondence Group on Environmental Risk Evaluation Criteria, MEPC 60/17, 18th December
2009. 92 Kontovas, Christos A., Psaraftis, Harilaos N & Ventikos, Nikolaos P.: “An empirical Analysis of IOPCF oil spill cost data”,
Marine Pollution Bulletin, Volume 60, Issue 9, September 2010, Pages 1455-1466. 93 Psarros, George, Skjong, Rolf & Vanem, Erik: “Risk acceptance criterion for tanker oil spill risk reduction measures”,
Marine Pollution Bulletin, Volume 62, Issue 1, January 2011, Pages 116-127. 94 http://ec.europa.eu/environment/integration/research/newsalert/pdf/235na5.pdf. 95 http://www.itopf.com/information-services/data-and-statistics/statistics/#no. 96 Kontovas, Christos A., Psaraftis, Harilaos N & Ventikos, Nikolaos P.: “An empirical Analysis of IOPCF oil spill cost data”,
Marine Pollution Bulletin, Volume 60, Issue 9, September 2010, Pages 1455-1466. 97 http://ec.europa.eu/environment/integration/research/newsalert/pdf/147na3.pdf.

Booz & Company
Date: 19th September 2011 Cost-Benefit Analysis for GMES Final Version II
Prepared for: European Commission Directorate – Enterprise and Industry
47
and Platonow98 deals with the use of satellites and SAR images to identify oil spills. It also highlights the estimated level of undetected oil spill.
Based on the operational role of GMES in providing accurate oil spill detection and models for forecasting and backcasting oil spill dispersion, it is envisaged that oil spill clean-up and detection efforts will become more efficient. Total baseline costs that GMES can address are €1.4 billion per annum.
4.3 RESOURCE MANAGEMENT
GMES services have the potential to facilitate more efficient use of natural resources. Key policy documents that provide the European context for resource management are:
� A resource-efficient Europe – Flagship initiative under the Europe 2020 Strategy99
� EU Forestry Strategy and Forest Focus100;
� Common Agricultural Policy101;
� Common Fisheries Policy102; and
� Water Framework Directive103.
The use of land for forestry and agricultural purposes involves a significant number of variables from soil cover to vegetation. GMES can benefit the wider strategic planning of forestry and agricultural sectors in ascertaining scope for productivity improvements. It may also provide a means to monitor compliance with regulatory and subsidy arrangements (i.e. the Common Agricultural Policy) that could enhance the effectiveness of such measures, and address issues of compliance.
4.3.1 European Deforestation (Forest Fires)
Rationale
As a major natural resource, forests provide a wide array of economic and social benefits, with many studies relating economic value to a range of direct and indirect use, non-use and option values.104
Deforestation can be man-made or due to natural hazards such as forest fires. In the European context, it is considered that the main cause of significant deforestation, particularly in the southern Member States near the Mediterranean, is the spread of forest fires, and that man-made deforestation is effectively managed through existing resource policy and management frameworks at European, national, regional and local levels.
Over the last decade, on average 500,000 hectares of forest are burnt in Europe each year, with the majority being in Portugal, Spain, France, Italy and Greece.105 In recent years, the
98 Redondo, Jose M. and Platonow, Alexei K: “Self-similar distribution of oil spills in European coastal waters”, Environment
Research Letters, February 2009.
http://iopscience.iop.org/1748-9326/4/1/014008/pdf/1748-9326_4_1_014008.pdf. 99 A resource-efficient Europe – Flagship initiative under the Europe 2020 Strategy, COM(2011) 21 final. 100 http://ec.europa.eu/agriculture/fore/forestry_strategy_en.htm. 101 http://ec.europa.eu/agriculture/index_en.htm. 102 http://ec.europa.eu/fisheries/cfp/index_en.htm. 103 Directive 2000/60/EC: “Establishing a Framework for Community Action in the Field of Water Policy”, October 2000. 104 For further details see Croitoru, Lelia (2008): “Value of Mediterranean Forests, The Encyclopaedia of Earth”.,
http://www.eoearth.org/article/Value_of_Mediterranean_forests.

Booz & Company
Date: 19th September 2011 Cost-Benefit Analysis for GMES Final Version II
Prepared for: European Commission Directorate – Enterprise and Industry
48
area affected has been lower, but given the variability in the data, it would appear reasonable to use a figure covering at least a decade.
In this context, there is a potential role for GMES to support the prevention of deforestation in the EU that occurs due to forest fires. Operational GMES Emergency services can supply national or local fire-fighting response teams with data concerning the location and emergence of fires, and update this information to show their development and spread.
Baseline Costs
Research by Lelia Croitoru106 provides a range of estimates for total economic value of Mediterranean forests by country. The values for countries in the northern Mediterranean area are included in the table 4.1 below.
Table 4.1: Total Economic Value of Mediterranean Forests by Value Type (USD/ha, 2007 Prices)
Po
licy
Sec
tor
Wo
od
Fo
rest
P
rod
uct
s
No
n-W
oo
d
Fo
rest
Pro
du
cts
Gra
zin
g
Rec
reat
ion
Hu
nti
ng
Wat
ersh
ed
Pro
tect
ion
Car
bo
n
Seq
ues
trat
ion
Op
tio
n, B
equ
est,
E
xist
ence
To
tal E
stim
ated
V
alu
e
Greece 14 9 45 1 5 12 1 3 96
Albania -4 n/a 23 n/a n/a -9 n/a n/a 1
Croatia 161 4 6 14 5 13 27 77 307
Slovenia 206 33 n/a n/a n/a n/a 28 n/a 268
Italy 104 29 9 26 10 133 10 4 448
France 140 10 n/a 147 8 10 28 31 377
Spain 37 8 10 5 n/a n/a 4 51 115
Portugal 159 183 44 6 8 31 12 n/a 465
Total: North 86 20 13 41 4 23 10 32 229
Total: Mediterranean 60 15 17 27 3 18 9 22 170
Note: N/A = not available; Source: Lelia Croitoru (2008), Value of Mediterranean Forests, The Encyclopaedia of Earth, http://www.eoearth.org/article/Value_of_Mediterranean_forests.
This analysis builds on the concept of total economic value developed by David Pearce107 and suggests that, for countries in the northern Mediterranean region, forest areas provide economic benefits to the value of (US) USD 229 per ha (2007 prices). This is equivalent to €179 per ha in 2010 prices.108 Total baseline costs per annum are therefore €90 million. It is expected that other initiatives will reduce baseline costs by 1% per annum.
105 http://effis.jrc.ec.europa.eu/reports/fire-reports. 106 Lelia Croitoru (2008), “Value of Mediterranean Forests”, The Encyclopaedia of Earth,
http://www.eoearth.org/article/Value_of_Mediterranean_forests. 107 http://www.cserge.ucl.ac.uk/Value_of_Forests.pdf. 108 Based on 4% US inflation between 2007 to 2010 and an USD/EUR exchange rate of 1.33 in 2010.

Booz & Company
Date: 19th September 2011 Cost-Benefit Analysis for GMES Final Version II
Prepared for: European Commission Directorate – Enterprise and Industry
49
4.3.2 Maritime navigation
Rationale
The International Maritime Organisation (IMO) provides the treaty level intergovernmental framework for governance of maritime safety. In the EU, the European Maritime Safety Agency (EMSA) was established in 2002 to assist the EC in developing legislation on maritime safety in European waters, monitoring of compliance with that legislation, providing data on maritime safety and on pollution by ships, and assist in improving the identification and pursuit of ships making unlawful discharges. Member States also have their own national maritime safety agencies responsible for a range of issues, including navigation. The main contribution of GMES to maritime navigation arises from the increased availability of data (including forecasts) on sea ice extent and ocean currents (this also contributes to the response and remediation of oil spills).
The following two key areas have been selected for analysis in this report:
� Facilitating extended use of the Northern Sea Route; and
� Improvements to Ship Routing.
4.3.2.1 Northern Sea Route
One of the key effects on shipping would be better access to the Northern Sea Route between Europe and Asia. GMES observations are already acknowledged as assisting in identifying the availability of this route, among others.
The ICEMAR project was established to improve the availability and access to sea ice information in the Arctic region, including the Arctic Ocean and the Baltic Sea. It is expected to provide continuous and accurate real time information on the ice conditions in these regions, the location and movements of icebergs as well as forecasts. In particular, safe passage through the Northern Sea Route in the summer months would shorten the shipping route between Europe and China by around 6,000 km, leading to substantial potential savings in time, fuel and CO2 emissions.
Shipping navigation current involves a wide range of technologies from maps to radar and GNSS systems. There are navigation service providers (e.g. Thomas Gunn) which offer real time monitoring, mapping and assistance for navigation. Shipping companies also rely on detailed maritime weather forecasting services. However, whilst existing forecast systems provide climate and tidal condition, no single provider is yet capable of providing satellite based near-real time sea-ice information to ships in all Arctic waters.
Sentinel 1A and 1B can provide continuity for ENVISAT, and are expected to monitor extent of sea ice. Sentinel 3 would be capable of monitoring thickness of sea ice to enable complete coverage of the Arctic and may facilitate greater usage of the Northern Sea Route (and the Northwest Passage from North America to Asia).
Baseline Costs
The assessment of benefits for the Northern Sea Route differs from other benefit areas in that it is based on estimated benefits in a previous study as outlined below.
The ICEMON study estimated the value at €8.6 million per annum (in 2005 prices). ICEMON consisted of a number of near real time (NRT) Ice and other off-line products, including:

Booz & Company
Date: 19th September 2011 Cost-Benefit Analysis for GMES Final Version II
Prepared for: European Commission Directorate – Enterprise and Industry
50
� NRT Ice products are targeted at operational users to improve transport navigation and other off-shore operations in ice covered areas. They also support environmental monitoring in the Arctic; and
� Off-line products are aimed at improving maritime construction and operations leading to safer sea operations and to understand global change issues.
The study estimates a series of direct and indirect benefits, including:
� Cost savings for Baltic sea ship traffic;
� Cost savings for Barents sea shipping linked to off-shore design improvements;
� Cost avoidance in the Baltic and Barents seas due to reductions in the risks of oil accidents;
� Efficiency gains for environmental monitoring; and
� Efficiency gains for climate modelling and research.
Overall, it would therefore appear reasonable to include around €8 million per annum in benefit. The study claimed €300,000 per ship in saving, but offset by the unknown costs of Russian escort ships. A conservative assumption on savings of €100,000 per ship would only require an additional 80 ships per annum.
Interest in the Northern Sea Route is growing. For example, Nordic Bulk has stated that the route shortens the distance to China by about one third, “This results in a significant reduction in fuel consumption and transportation time - and it also means much lower CO2 emissions. The fuels savings alone add up to approximately USD 180,000”.109
4.3.2.2 Improvements to Ship Routing
Rationale
Another potential benefit area within navigation is the use of improved understanding of ocean currents to reduce fuel consumption. Information on wave altimetry may be an additional dimension to navigation services to forecast conditions for longer trips. This could be used to inform modelling of current forecasts.
It will contribute to more efficient ship routing, and therefore reductions in fuel consumption and consequential reductions in CO2 emissions.
Baseline Costs
An article by McCord et al.110 states that an average fuel saving of 2.5% can be achieved, but with the potential reach 11%, through the use of satellite altimetry data. The exact saving will depend on take-up, real life ability to use the technology and on the length of a given trip.
Total global ship fuel consumption is between 270 – 410 million metric tons.111 However, it is unrealistic to assume that altimetry data can address all global shipping movements. Fuel
109 http://www.marinelog.com/DOCS/NEWSMMIX/2010aug00262.html Marinelog 26/08/2010. 110 McCord, Mark R. et al.: “Ship Routing Through Altimetry-Derived Ocean Currents”, Transportation Science, Vol. 33, No.
1, February 1999. See http://transci.journal.informs.org/cgi/content/abstract/33/1/49. 111 http://www.ceoe.udel.edu/cms/jcorbett/ReconcilingShipTrends.htm.

Booz & Company
Date: 19th September 2011 Cost-Benefit Analysis for GMES Final Version II
Prepared for: European Commission Directorate – Enterprise and Industry
51
price per ton is around USD 600112 (up from USD 465 in 2010) for the most common fuel oil used in the sector. On this basis a reasonable baseline cost would therefore be €3.6 billion.113
4.3.3 EU CAP Monitoring
Rationale
Contributing Missions today provide HR and VHR imagery of land cover in Europe, which assists in detecting if CAP payment recipients are claiming funds inappropriately. Sentinel 2 is expected to contribute to this activity. This provides a direct connection between imagery and undertaking compliance checks, and has the potential to check far more farms more rapidly than currently possible. The imagery would enable detection of and deterrence of fraud.
Baseline Costs
For the purpose of the analysis it has been assumed that GMES can contribute to reducing fraud within the CAP system through improved monitoring. The total CAP budget is around €44 billion per year, and with 1% of payments fraudulent114, it would mean a baseline cost of around €400 million.115 There are several examples of fraud in relation to the EU’s CAP as reported by the European Court of Auditors, and the media in general.116 A fraud level of 1% would appear a sensible baseline position for the appraisal. The JRC is already working with EO data in this area and has demonstrated how to use the data for targeting and preventing fraud.
It is assumed that CAP payments will increase in line with GDP, but that other measures of an equivalent effect will also be put in place to reduce fraud in the future. From discussions with the JRC, it is clear that services are operational and that full impact can be expected from 2014.
4.3.4 Regional Policy
Rationale
DG Regio has provided direct examples of how EO data is being used to deliver improved policy. An example is the Urban Atlas project in which VHR mapping enables better comparison across cities and countries, and to verify information about numbers of homes, businesses and land use patterns. The key benefit in this context is that GMES can provide a common basis of information when conducting comparisons across EU borders. This was previously made difficult as a result of different national approaches to the reporting of information.
Baseline Costs
The Fifth Report on Economic, Social and Territorial Cohesion117 includes a breakdown of total expenditure over the 2007 – 2013 time period in relation to regional development and
112 http://joongangdaily.joins.com/article/view.asp?aid=2936971. 113 USD / EUR exchange rate of 1.33, a price per ton of USD 465 and a 2.5% addressable market. 114 http://ec.europa.eu/anti_fraud/cases/agri_en.html#8. 115 The report “Earth Observation and Agricultural Monitoring in the EC” states that 1.6% of claims were fraudulent.
See http://www.ucl.ac.uk/laws/environment/satellites/docs/2_AHRC_Agriculture.pdf. 116 See for example http://ec.europa.eu/anti_fraud/cases/agri_en.html#8 and http://capreform.eu/auditors-report-makes-
for-sobering-reading/. 117 http://ec.europa.eu/regional_policy/sources/docoffic/official/reports/cohesion5/index_en.cfm.

Booz & Company
Date: 19th September 2011 Cost-Benefit Analysis for GMES Final Version II
Prepared for: European Commission Directorate – Enterprise and Industry
52
social and economic cohesion. The three funds are: European Regional Development Fund (ERDF) with €198.8 billion, the European Social Fund (ESF) with €76 billion and the Cohesion Fund with 69.6 billion. Together these constitute the EU ‘Cohesion Policy’, and so can be treated together.
The breakdown across all those funds is, for example, 17.9% for the environment. In this area the Urban Atlas makes a major contribution, and could be argued to improve benefit-cost ratios by up to 5%, as it is a product that addresses particular needs. Transport infrastructure accounts for 22% of expenditure, but the benefits are less obvious. Only a marginal improvement of say 1% could be expected in this area in relation to the ability to better identify residential/commercial/industrial land use.
However, for all the other categories it is doubtful how much benefit can be derived from EO satellites. For simplicity, one could assume that there may be limited benefits in areas such as telecommunication infrastructure (0.7% of total expenditure), energy (0.5% of total expenditure and research (17.5% of total expenditure). Overall, a 1% improvement in outcome is assumed across all of these categories.
On this basis, a weighted average of 1.1%118 can be derived. The suggestion is therefore that the improved outcome is valued at €4 million per annum (1.1% of €344.2 million). However, the relevant satellite images for the Urban Atlas are VHR. Benefits are therefore driven mostly by GMES services that rely on data from Contributing Missions.
4.4 EMERGENCY MANAGEMENT
Disasters that cause loss of life, injury, disease and extensive property damage inflict significant damage upon EU residents, visitors and the economy as a whole, as well as create irreparable damage upon ecosystems, heritage and other locations of significant value.
The International Charter “Space and Major Disasters” established in 1999 by ESA and CNES, later joined by several other international signatories, promotes co-operation in the use of space facilities to assist in the event of crises and disasters. GMES Emergency Management will be a major EU contribution to this mechanism.
118 Weighted average derived from environment (17.9% x 5%), telecommunication (0.7% x 1%), transport (22% x 1%) and
energy (0.5% x 1%).

Booz & Company
Date: 19th September 2011 Cost-Benefit Analysis for GMES Final Version II
Prepared for: European Commission Directorate – Enterprise and Industry
53
Responsibility for addressing natural disasters is concentrated at the Member State level and below. Earthquake risks are concentrated around major fault lines, floods in low-lying areas and locations with river valleys and so on. Nevertheless, the EU has undertaken various initiatives to enhance responses and co-ordination among Member States in the event of major emergencies. This includes the Community Civil Protection Mechanism established in 2001, which mobilises immediate assistance among Member States and other signatory European countries.
Key ways GMES data may contribute positively to emergency responses are:
� Prediction of events or the severity of events (e.g. floods);
� Risk assessments based on land cover (e.g. vegetation and soil sealing characteristics for forest fires);
� Information about the scale and extent of an incident to inform response activities (e.g. earthquakes); and
� Information for damage assessment and review, to assist in reconstruction and development of preventive measures to avoid damage for any recurrence (e.g. landslides, subsidence).
In these cases, the benefits from GMES services could be widespread. The types of events that can benefit from this may be either natural disasters or industrial/man made incidents. It may also include cases of humanitarian crises that tend to be identified with developing countries in the context of wars or other situations of conflict or violence.
In the case of natural disasters or man-made accidents, incidents tend to occur over a relatively short period (between seconds for earthquakes and days for floods or industrial spillages) with potentially severe levels of infrastructural and property damage, as well as loss of or harm to human life. These crises may also significantly affect land, oceanic and/or atmospheric environments.
In the case of conflict-related incidents, the harm may be less likely to be immediately environmental or infrastructure related, but more likely to involve significant harm to human life due to deprivation of key essentials such as food, water, shelter and medical assistance.
Table 4.2 below explains some of the key ways that GMES services might deliver benefits in response to natural disasters or man-made accidents:
Table 4.2: Contributions of GMES to Emergency Management
Service Benefit
Event preparation Avoid death and injury. Mitigation measures to reduce spread and scale of risk.
Damage assessment Accelerate scale and prioritise response.
Response management Co-ordinate deployment of rescue and specialist teams.
Reconstruction and future planning Prioritise infrastructure, preventative measures, risk mitigation measures, ensure claims for assistance are moderated against independent observations.
Source: Booz & Company analysis.
Warning of emergencies could potentially have very high value in safeguarding lives and property, whereas rapid and effective responses to emergencies can also mitigate potential damage and enable rescue and recovery to be optimally targeted at a time when most such

Booz & Company
Date: 19th September 2011 Cost-Benefit Analysis for GMES Final Version II
Prepared for: European Commission Directorate – Enterprise and Industry
54
resources may be stretched to cope. Post-incident, GMES observations may be able to inform measures that enable future incidents to be better managed.
Using space and ground-based technology to provide reliable, easily accessed information, GMES may help Member States, relief agencies, NGOs and other actors respond to man-made crises and natural disasters such as droughts, floods, tsunamis and earthquakes.119
4.4.1 Geohazards
Rationale
Geohazards are events caused by geological conditions or processes and include landslides, earthquakes and volcanic eruptions.120
Landslides represent a major threat to human life, physical infrastructure and the natural environment. Landslide events are normally associated with soil erosion arising from heavy rainfalls. Around 70 major European landslides were recorded during the last decade, with a total of 312 fatalities. The EM-DAT database contains only a limited number of events due to the high threshold for inclusion. It is therefore difficult to establish baseline costs. However, it is an area where further research is required to provide an improved understanding.
Earthquakes and volcanic eruptions have had limited impact within the EU during the last decade. There have not been any destructive explosive volcanic eruptions in the EU, although there has been some persistent activity (e.g. Mount Etna). The major event has therefore been the 2010 volcano eruption in Iceland which had a significant impact on European air traffic. This event highlighted the need for improved understanding of critical dust concentration levels, as well as monitoring of dust levels at airliner flight altitudes. GMES pre-operational services under SAFER and MACC responded to this event and provided air traffic authorities with daily updates of the ash plume’s movements (see case study on the Icelandic Volcanic Ash).
119 ESA: “GMES Humanitarian Aid” - http://download.esa.int/docs/GMES/GMES_Humanitarian.pdf. 120 European Environment Agency: “Mapping the impacts of natural hazards and technological accidents in Europe”, 2010.
Review is based on chapters 8 – 10, pp. 74 – 103.
Booz & Company
Date: 19th September 2011 Cost-Benefit Analysis for GMES Final Version II
Prepared for: European Commission Directorate – Enterprise and Industry
55
In the EU, earthquakes have mainly been concentrated in Greece, Spain, and Italy. There are benefits from use of EO in support of emergency response activities in the aftermath of earthquakes (see case study on Chile). These are mainly derived from VHR images, and so benefit from Contributing Missions.
To support the immediate response by emergency services, it is vital for images to be processed and made available to local authorities within the first 72 hours after a crisis.121 To use an example outside the EU, in the case of the response to the Haiti earthquake in 2010, satellite data was made available within 24 hours – there were no recent maps, so the first priority was to provide initial road maps, and grading maps. Providing this information was helpful to organisation such as the UN World Food Programme (WFP) to solve logistical questions, and identify blocked roads.122 In terms of reconstruction in the longer-term, EO information can also be used as a major input into a Post Disaster Needs Assessment (PDNA) process, carried through a partnership between the UN, World Bank, and EC.123
Baseline Costs
Data from the EM-DAT database for 1998 – 2010 provides information on recorded events, number of fatalities; people affected and estimated economic losses in billion Euros. In total, 19 events have been recorded. Total economic losses over the period are around €9.2 billion (€0.7 billion per annum on average). However, average economic losses over the period are significantly biased to a few major events.
It should be stressed that some caution is needed when interpreting data from the EM-DAT database. Trends may reflect an evolution in the accuracy and comprehensiveness of the underlying data. Similarly, the EM-DAT database uses minimum ‘disaster thresholds’ which means that it only focuses on major events.
In total, €9.2 billion (on average €0.7 billion per annum) of damage was caused during the period 1998 – 2010. Total mortality is low, with an average of 36 per annum. In terms of morbidity, approximately 14,900 people are affected on average each year.
4.4.2 Forest Fires
Rationale
The provision of improved land information can be used to improve pre-, during- and after-event services in the area of forest fires (or wildfires). Forest fires are a recurrent phenomenon within the EU, an average of 70,000 fires taking place every year. They burn more than half a million hectares of the forested areas in Europe.124 Large events can last several days, such as those in Portugal (2003, 2005), Spain (2006) and Greece (2007). The major driver behind events is changes in land-use and demography. The majority of fires are caused by humans, i.e. either deliberately or by negligence. However, fire ignition and spread can be attributed to factors such as drought, high temperature, low relative humidity and the presence of wind. In fact, work by the EC Joint Research Centre has demonstrated a high correlation between indicators of fire danger and burnt areas within the European Mediterranean region.125
121 Interview with JRC Emergency Response. 122 Interview with JRC Emergency Response. 123 Interview with the World Bank. 124 European Environment Agency: “Mapping the impacts of natural hazards and technological accidents in Europe”, 2010. 125 Interview with JRC European Forest Fire Action Service.

Booz & Company
Date: 19th September 2011 Cost-Benefit Analysis for GMES Final Version II
Prepared for: European Commission Directorate – Enterprise and Industry
56
Monitoring of forest fires is improved significantly through the use of EO satellites, and the perimeters of fires are updated twice per day during a crisis.126 The EC Joint Research Centre (JRC) is understood to be working with the European Medium-range Weather Forecasting Centre (ECMWF) to predict where and when fires may occur. The European Forest Fire Information Service (EFFIS) claims to be able to make forecasts up to six days ahead of a likely crisis, and is a system which has been in place for twenty years, and so is trusted by Member States. There is a positive view concerning the potential for exporting the methodology of EFFAS outside the EU, with North Africa and the Middle East suggested as regions in which significant benefits could be realised.127 For longer-term planning, the JRC works with the European Forest Data Centre (EFDAC) to track forestry information across Europe, and provides information to international institutions.128
Forest fires have had a major political impact in Portugal, and in Greece led directly to the collapse of the government in 2008, making the ability to control these fires a clear policy priority. Another example is the Russian forest fires in 2010, in which according to one estimate, at the height of the crisis as many as 700 people may have died in Moscow each day due to poor air quality in the city.129
The European Environmental Agency (EEA) states that although a small decreasing trend in the number fires are recorded for the period since 2010, it is not possible to see a clear trend regarding the areas burnt.
Baseline Costs
At the EU level, the European Forest Fire Information System (EFFIS) was established in 1998, and has since become a comprehensive source of information on forest fires in Europe.
However, there is not a fully harmonised set of forest fire prevention policies at EU level as the competence lies primarily with Member States.130 Improved management is therefore called for. In particular, in relation to the focus on fire prevention such as monitoring key indicators to enable early warning systems and raise general alertness.
In total, 31 events have been recorded for the 1998 – 2010 period.131 Total economic losses over the period are around €7.8 billion (€0.6 billion per annum on average). However, average economic losses over the period are significantly biased due to a few major events. Impact in terms of mortality is low (15 deaths on average per annum), but number of people affected is higher (around 12,500 per annum on average).
The European Forest Fire Information System (EFFIS) is a voluntary approach, recognised by Member States, the Commission and the European Parliament as an essential tool for forest fire monitoring in Europe.132 However, to ensure consistency with similar analysis for other natural hazards, the EM-DAT database has been used instead of EFFIS.
126 Interview with JRC European Forest Fire Action Service. 127 Interview with JRC European Forest Fire Action Service. 128 Interview with JRC European Forest Fire Action Service. 129 Reported at http://www.ynetnews.com/articles/0,7340,L-3932560,00.html. 130 COM(2010) 66: “Green Paper on Forest Protection and Information in the EU: Preparing forests for climate change”. 131 Data used to support the analysis has been extracted from the EM-DAT database maintained by CRED (Centre for
Research on the Epidemiology of Disasters). The RISK-EOS study also made an early assessment of the contribution that GMES can make in relation to improved handling and modelling of floods.
132 COM(2010) 66: “On Forest Protection and Information in the EU: Preparing forests for climate change”.

Booz & Company
Date: 19th September 2011 Cost-Benefit Analysis for GMES Final Version II
Prepared for: European Commission Directorate – Enterprise and Industry
57
GMES will contribute to the development and implementation of new methods and tool for monitoring of forests in relation to fires and storms.133 The rationale for the GMES impact is that 12 hourly refreshes of forest fires allow for better forecasting of progress, better targeting of responses and that the forestry datasets allow instant access to information about sensitive areas so responses can be targeted on those.
4.4.3 Floods
Rationale
The provision of improved land information can be used to improve pre-, during- and after-event services in the area of flood risk management. Floods represent one of the most important natural hazards in Europe in terms of economic loss134, with some particularly severe cases in the United Kingdom in 2007, Germany 2002, and Italy / France in 2000.
Flood prevention policies at the EU level were detailed in the EC Flood Directive in 2007.135 The directive detailed measures for reducing risk and adverse consequences of floods. A three stage approach was adopted: a preliminary flood risk assessment (2011), followed by the development of flood hazard and risk maps (2013) and flood risk management plans (2015). Moreover, the Commission intends to reinforce the links with existing early warning systems, such as the Joint Research Centre's European Flood Alert System (EFAS), which is also considered a GMES service.
As EFAS develops further, it is expected that this may provide better lead-times in terms of reliable forecasting of where and when a major flood is likely to take place, creating benefits in terms of improved opportunities for local authorities to protect property and vulnerable people. This information is derived from a combination of in situ sources and EO satellites.
The more satellite data that becomes available, especially regarding the oceans, will enable weather forecasts to be more accurate: weather forecasting centres tend to use all available information and, in terms of a specific contribution from the Sentinels, improved data from regions in tropical latitudes would increase the accuracy of these forecasts.136 Within the EU, currently 20% of data is sourced from satellites, but it is expected that this may increase to 50% in the future. EO satellites would also be vital to modelling floods on a global scale.137
Flood forecasts tend to be able to provide notice of 5 or 6 days, but this reduces as you move further upstream. It is possible to be more proactive, but with a higher degree of uncertainty. For example, in 2010, different mechanisms worked well to support floods in Central Europe. EFAS predicted this with lead time of up to 8 days, and this triggered requests for international assistance from five countries through the EU solidarity fund.138
Robust flood mapping is therefore seen as a key part of future flood risk management. Flood hazard maps covers the extent and expected water depth, with reference to three scenarios (low probability or extreme event, medium probability and, if appropriate, high probability.
133 GMES supports across all phases, i.e. prevention (risk management), early warning (predict and monitor dangers in
relation to geography and time), crises (monitoring of fire) and post-crises (assessment of the after effects). 134 European Environment Agency, Mapping the impacts of natural hazards and technological accidents in Europe, 2010. 135 Directive 2007/60/EC of the European Parliament and of the Council of 23 October 2007 on the assessment and
management of flood risks. See also http://ec.europa.eu/environment/water/flood_risk/key_docs.htm.
http://eur-lex.europa.eu/LexUriServ/LexUriServ.do?uri=OJ:L:2007:288:0027:0034:EN:PDF (accessed 5 October 2010). 136 Interview at the JRC with the European Flood Alert System. 137 Interview at the JRC with the European Flood Alert System. 138 Interview with the Joint Research Centre.

Booz & Company
Date: 19th September 2011 Cost-Benefit Analysis for GMES Final Version II
Prepared for: European Commission Directorate – Enterprise and Industry
58
Flood risks maps relate to the potential adverse consequences of each flood scenario, with reference to impact on population, economic activity and the wider environment.
It has been assumed for the purpose of assessing the potential contribution by GMES, that baseline costs can be reduced from improved EO data and provision of dedicated services. These improvements will result in a longer warning period (e.g. a day) which provides an opportunity to improve defences, and to prepare and evacuate people in an orderly manner. These operational improvements will have an additional cost benefits from reducing the cost of intervention and potentially provide more targeted services.
However, given the implementation of the EC Flood Directive, it may be reasonable to assume that the impact would be significantly reduced over time. Member States are obliged to produce relevant maps for risk areas, and develop risk management plans. This should improve general preparedness, and therefore lead to a gradual reduction in the negative impact of floods.
There is also scope for extending the methodology of EFAS into contexts outside the EU. There has been interest in establishing a similar early warning system for floods, in Brazil, Pakistan and some African countries. Furthermore, a World Bank study that examined the likely benefits of a floods early warning system in Bangladesh claimed a cost-benefit ratio of 1:500 through, for example, reduced damage to the agriculture sector.139 Benefits are most likely to arise outside of the EU from improved observation and service provision.
Baseline Costs
Overall losses from floods have increased in the last couple of decades, with the main contributing factor most likely to be population growth and wealth in the affected areas.
During 1998 – 2010, a total of 202 events (an average of 16 per annum) have been recorded.140 Total economic losses over the period are around €62 billion (€4.8 billion per annum over average). However, average economic losses over the period are significantly biased by the two major events in Italy/France (2000) and Germany (2002). In additional, on average 72 mortalities were recorded each year, with around 143,000 people effected as a results of events.
4.4.4 Other Events
Rationale
Storms are the second costliest natural hazards in Europe, with overall losses of more than €40 billion during the last decade.141 The EEA states that storm occurrence has shown a strong variability with no discernible long-term trends. However, losses relating to storms have shown an upward trend in recent years. Socio-economic factors and increasing exposure, i.e. increases in population and economic assets in the exposed areas, are key underlying drivers. Information on the impact of storms has improved in recent years, and the Emergency Events Database (EM-DAT). There is no specific policy framework at EU level aiming at reducing the impact of storms. Storm management should focus on
139 Teisberg, Thomas, J. And Weiher, Rodney, F.: ”Benefits and Costs of Early Warning Systems for Major Natural Hazards”,
March 2009, The World Bank. 140 Data used to support the analysis has been extracted from the EM-DAT database maintained by CRED (Centre for
Research on the Epidemiology of Disasters). The RISK-EOS study also made an early assessment of the contribution that GMES can make in relation to improved handling and modelling of floods.
141 European Environment Agency, Mapping the impacts of natural hazards and technological accidents in Europe, 2010.
Review is based on chapter 3.

Booz & Company
Date: 19th September 2011 Cost-Benefit Analysis for GMES Final Version II
Prepared for: European Commission Directorate – Enterprise and Industry
59
preventive measures such as early warning systems. Actions could be seen in the context of climate change adaptation.
GMES will specifically contribute in relation to preparedness/prevention, emergency response and recovery. Similarly, GMES will also be able to play a role in better informing and managing the response in relation to droughts and extreme temperatures.
Baseline Costs
In total, a baseline for these different event types can be established. Based on the average values from the last 13 years in the EM-DAT database, it is possible to identify a baseline damage cost of €6.1 billion.
4.4.5 Major Disasters (Solidarity Fund)
Rationale
The Solidarity Fund has been established by the EU so that it can provide aid to any Member State in the event of a major natural disaster.
The assumption is that GMES will be able to improve crisis response. This will be in terms of assessing damage, enabling more efficient and better targeted support from the Solidarity Fund. GMES may also help in providing a basis for responding more quickly to crises as they develop.
Baseline Costs
The fund has an annual budget of €1 billion.142 The 2009 annual report from the Solidarity Fund provides in Annex 2 an overview of all EU solidarity Fund applications since 2002.143 From the list it has been established that the average annual funding has been €290 million (in 2010 prices) since 2002.
4.5 SECURITY AND HUMANITARIAN APPLICATIONS
In areas outside the EU, GMES will result in significant benefits in terms of more effective international humanitarian aid and more effective positions in international negotiations through access to better quality information.
Previous analysis identified three key areas in which GMES can support humanitarian aid:
� Early warning systems to support responses to crop failure and water shortages;
� Provide humanitarian operations with better access to high quality information which can improve planning, emergency response and assessment elements; and
� Increased ability to discriminate between competing claims for assistance.
A key issue is that humanitarian aid that is not being delivered by military forces does not necessarily have access to data or observations that military forces can access. As such, GMES could provide a critical source of information, particularly for Non-Governmental Organisations (NGOs) that respond to humanitarian crises independently, and often with little notification.
142 http://europa.eu/legislation_summaries/regional_policy/provisions_and_instruments/g24217_en.htm. 143 http://eur-lex.europa.eu/LexUriServ/LexUriServ.do?uri=COM:2011:0136:FIN:EN:PDF.

Booz & Company
Date: 19th September 2011 Cost-Benefit Analysis for GMES Final Version II
Prepared for: European Commission Directorate – Enterprise and Industry
60
Examples of where GMES can produce benefits related to humanitarian aid include: i) spatial planning information in the immediate aftermath of a disaster (e.g. Banda Aceh after the 2004 tsunami); ii) maps illustrating relief work as an effective tool in soliciting donor funding, and subsequently demonstrating that this money has been spent effectively; and iii) monitoring of refugee and internally-displaced people (IDP) camps (e.g. ensuring that camps provide sufficient supply of water per person in the camp).
The benefits stemming from the services for security applications can be seen in terms of the three key areas which the services address: border control, maritime surveillance and support to EU external action. For the purposes of the study, these benefits are not accounted for in economic terms, but remain important qualitative considerations.
Border monitoring services can be expected to reduce illegal immigration by improving the intelligence available to border guards. Border permeability and trafficability maps, for example, can be used to inform the strategic allocation of security resources along a border. These services can improve the effectiveness of border guards, and as a consequence, mitigate the negative economic impacts of illegal immigration.
Benefits from maritime surveillance services can be foreseen in relation to their effects on piracy, drug trafficking and illegal immigration across blue borders. As regards piracy, improved monitoring and detection methods can over time reduce the costs of counter-piracy operations by i) acting as a deterrent to pirates ii) improving the deployment of naval vessels, thereby reducing the economic toll of pirating activity. Drug trafficking activities are also targeted by improved maritime surveillance, which curtail the supply reaching European territory.
Services in support of EU external action include the provision of early warning crisis indicators, such as the identification of illegal mining and logging sites and illicit crop plantations, monitoring of critical infrastructure, support to peacekeeping and crisis management operations, and reconstruction monitoring for post-crisis situations.
Crisis indicators based on land degradation, population pressure and the exploitation of natural resources can facilitate the preparedness of EU interventions in regional conflicts, mitigating the economic and humanitarian costs of conflict.
The destruction or alteration of critical infrastructure (such as oil & gas pipelines, power stations and reservoirs) can lead to humanitarian and/or economic disruption. This infrastructure can be monitored in order to detect such changes and provide support to crisis management operations. Critical infrastructure is exposed to threats from both natural hazards (such as severe terrain conditions or hydrological criticalities) and man-made risks (such as explosions, fires or intentional damage). Benefits from critical infrastructure monitoring arise from the limitation of damages and the mitigation of the effects that such damages can bring about. For example, damage to the energy pipelines carrying natural gas from Russia to Europe can have major social, economic and political implications.
GMES services can support and facilitate peace-keeping and conflict-related crisis management operations abroad. Through rapid geospatial reporting (i.e. the provision of maps and intelligence in a short time-frame), operations teams on the ground are supplied with data on damage extent, road networks’ availability and other key infrastructure such as airports and harbours. The benefits here are comparable to those generated by the GMES Emergency Response service, namely the improved and targeted allocation of resources and the mitigation of further damage and loss to human life. Post-crisis reconstruction monitoring supports supervision of the utilisation of donor funds and the longer term goals

Booz & Company
Date: 19th September 2011 Cost-Benefit Analysis for GMES Final Version II
Prepared for: European Commission Directorate – Enterprise and Industry
61
of conflict resolution and peacekeeping. GMES geospatial information can also support pre-crisis contingency planning and preparation.
4.5.1 Security and humanitarian applications – Rest of World
Rationale
Emergency Management and services for security applications are global in scope. Key arguments supporting international applications of GMES services have already been provided in earlier sections. In addition, case studies demonstrate the impact of the services.
Baseline Costs
Data from the EM-DAT database for 1998 – 2010 provides information on recorded events, number of fatalities; people affected and estimated economic losses. For the baseline assessment all European events have been excluded as they are reported separately. In the case of the remaining events, only 5% have been included on the basis that GMES will not be able to react to everything. This would appear fairly conservative given the overall aspirations of the programme.
In total, €8.4 billion of damage per annum is therefore included in the baseline. Total annual mortality is around 6,000 and the morbidity value is 25 million per annum. The baseline covers a wide range of events, including earthquakes, floods draughts, volcanic eruptions and tsunamis etc.
4.5.2 Humanitarian Aid in Conflict Situations
Rationale
GMES Emergency Management services and (to a lesser degree) services for security applications can facilitate the provision of humanitarian aid in conflict situations. Benefits would, for example, arise in reduced health and welfare losses, better targeted aid, better monitoring of post-conflict reconstruction missions, and from monitoring for early warning signals of future conflict.
GMES services through G-MOSAIC were used to support the EU response to the 2008 crisis in Georgia, generating information that became a key input into the Post Crisis Needs Assessment (PCNA) process. This PCNA provided the justification of around €1 billion in aid granted by the EU to Georgia following the crisis.
GMES Emergency Management services can also provide valuable support in such cases. This includes the mapping of IDP and Refugee camps in remote areas (such as Darfur in Sudan), as well as monitoring the flow of humanitarian aid to affected people in Gaza.144 The case study below illustrates how GMES services, delivered through SAFER, were asked to produce reference maps to monitor movement of large numbers of people taking place at the time.
Baseline Costs
An approach for quantifying benefits would be to use WHO data.145 The database provides a global values of DALYs within the war and conflict category. It is assumed that GMES can
144 Interview at the JRC with the European Flood Alert System. 145 http://www.who.int/healthinfo/global_burden_disease/en/.

Booz & Company
Date: 19th September 2011 Cost-Benefit Analysis for GMES Final Version II
Prepared for: European Commission Directorate – Enterprise and Industry
62
impact on around 800,000 DALYs within the relevant category. The premise is that GMES accounts for the European contribution, but also that GMES will not be able to ‘react’ to everything.
4.5.3 Humanitarian Aid in Response to Natural Disasters
Rationale
It is assumed that GMES would inform planning to enable aid to be deployed in a more effective and targeted manner. GMES can improve the targeting of humanitarian aid, outside emergency contexts, by linking aid to agricultural productivity and water supplies. HR and SAR data can provide some guidance, but VHR allows for more detailed targeting of aid for specific programmes. Another area in which GMES can support more effective humanitarian aid is in monitoring large displacements of populations during a political crisis (see case study for Libya). Benefits are derived through better use of existing funds, producing marginal improvement in net outcomes. One significant advantage to policy makers in this context is the greater objectivity of EO data as opposed to information gathered on the ground, where, for example, damage estimates may be inflated due to local political factors.146
HR, VHR and SAR provide information that could facilitate interventions to improve conditions by targeting agriculture, forestry and habitat protection from erosion, pollution and desertification. The key benefit in this context is integrating GMES data into analysis for targeting and planning aid.
It is clear that improved humanitarian assistance across other regions (outside of Africa) could be supported by GMES. It would therefore be reasonable to consider the total aid budget as a potential baseline.
146 Interview at the Joint Research Centre with the European Flood Alert System.

Booz & Company
Date: 19th September 2011 Cost-Benefit Analysis for GMES Final Version II
Prepared for: European Commission Directorate – Enterprise and Industry
63
Baseline Costs
The EU has a substantial humanitarian aid programme under ECHO147. The total budget for the 2007 – 2013 financial perspective is €5.6 billion, or on average €800 million per annum. The 2009 annual report from ECHO148 provides geographical breakdown of funding decisions for 2004 to 2009. Adjusted to 2010 prices, the average annual spend is €801 million. More than half of the budget (€419 million in 2010 prices) has been dedicated to aid support for Africa.
147 http://ec.europa.eu/echo. 148 http://ec.europa.eu/echo/files/media/publications/annual_report/annex_2009_en.pdf.

Booz & Company
Date: 19th September 2011 Cost-Benefit Analysis for GMES Final Version II
Prepared for: European Commission Directorate – Enterprise and Industry
64
5. INDUSTRY DEVELOPMENT
5.1 INTRODUCTION
GMES is one of the flagship programmes of European space policy, and represents the major investment at European level in the EO sector. This can be expected to deliver significant stimulus to the continued health and growth in the industry, and has the potential to deliver value-added economic activity and employment. It also has the potential to enhance overall economic productivity through developing new technologies and sources of information that can catalyse further benefits.
This chapter provides an analysis of the European EO sector from an industrial perspective, and gives an overview of the evidence that supports the potential for GMES in contributing to industry development and economic productivity.
5.2 EU SPACE STRATEGY
Supporting the European space sector and the EO industry is a fundamental strategic objective for the EU, which was underlined in its April 2011 Communication, Towards a space strategy for the European Union that benefits its citizens.149 In this Communication, space activities are stated as being ‘vital’ to achieving the sustainable development objectives of the Europe 2020 Strategy. In serving the economic needs of its citizens, EU space policies are expected to generate knowledge and new products, and thus serve as a driver of innovation, economic growth and employment.
Surveys indicate that a significant proportion of EU citizens place value on EU space activities. Around 20% of respondents to a Eurobarometer survey consider European space activities as being very important, with an additional 43% considering them important. Regarding the development of EO services like GMES, around 58% consider the development of environmental monitoring systems as being very important.150
While the space and EO sectors are important for the EU and its citizens, its development of the space sector is highly dependent on public investment. According to Commission reports, the public budget for the civilian space sector in Europe is estimated at €5.7 billion in 2009. Of this, ESA accounted for about €3.6 billion, national programmes around €2.1 billion, while the EU’s spending amounted to €750 million. Military space budgets are around €1 billion. This is equal to nearly 60% of the European space industry’s turnover (compared to 80% in the US).151
The public funding of space programmes is closely linked to national priorities of ESA members and EU Member States with large space enabled industries. This is underscored by the workings of EU funding and contract mechanisms that ensure that Member States receive their funding share of ESA supply contracts. In this context, additional EU funding is viewed as a means of creating additional competition in the public procurement market by basing funding decisions on broader considerations of value for money, linked to EU policies for industry development. This can also provide scope for creating efficiencies in
149 COM(2011) 152 final: “Towards a Space Strategy for the European Union that Benefits its Citizens”.
http://ec.europa.eu/enterprise/policies/space/files/policy/comm_pdf_com_2011_0152_f_communication_en.pdf. 150 Eurobarometer, Space Activities of the European Union, 2009. 151 SEC(2011) 380, Impact Assessment accompanying the Communication COM(2011) 152: “Towards a Space Strategy for the
EU that Benefits its Citizens”.

Booz & Company
Date: 19th September 2011 Cost-Benefit Analysis for GMES Final Version II
Prepared for: European Commission Directorate – Enterprise and Industry
65
space related activities through better programme coordination, such as the potential for a reduction in duplication of activities between Member States. It can also provide the resources to support recurrent space expenditure, with ESA budgets primarily linked to R&D.
These, and other considerations, are used as a basis for defining a set of general objectives for the EU’s space strategy. They include the following objectives:
� To promote scientific and technical progress;
� To promote innovation and industrial competitiveness;
� To ensure citizens’ well-being derived from space-based applications; and
� To enhance the EU profile in space at world level.
These objectives set the basis for justifying additional EU involvement in funding space related activities. In this context, GMES is viewed as a flagship investment to support the upstream space industry and importantly, with the development of GMES Services, the providers of downstream EO products and services.
The next section provides a review of the European EO industry, which is the focus of this study according to the Terms of Reference. This provides a baseline for further analysis of possible GMES impacts.
5.3 EUROPEAN EARTH OBSERVATION INDUSTRY
The EO industry, while broader in nature, is similar to elements of the global space sector in that it is organised into upstream and downstream infrastructure and service provision. Its role is to carry out a wide range of functions for a diverse set of military and civil end users. These functions include weather observation and environmental monitoring (e.g. water, air quality, natural hazards, etc.), as well as a mix of functions that serve an array of security and military purposes.
The upstream market includes both space- and Earth-based infrastructure providers. For the space sector, this includes satellite manufacturers and launchers, and the ground segment operations. The capital-intensive nature of the upstream space sector means that the industry is heavily concentrated within a small number of providers. This is in contrast to the Earth-based infrastructure providers that primarily include the Member States, which develop and maintain vast arrays of EO systems that operate at local, regional and national levels. It is the latter that forms the in situ network for GMES, which is coordinated by the European Environment Agency (EEA).
The downstream market for the EO industry includes the value-adding service providers that process data from the upstream sector in order to develop and market products that use optimised information for end users. For GMES, this includes the operational public sector oriented services – land, marine, air, climate, emergency and security. It also includes additional downstream services that are expected to make direct use of data from the upstream sector or to provide enhanced products that make use of GMES products and services.
Given the infancy of the market for GMES, it is very difficult to assess the potential for these alternative and value-adding downstream services, although the expectation for them in being able to enhance the benefits of GMES is often stated in EU policy documents and communications related to GMES. This view is echoed in a report published by eoVox,

Booz & Company
Date: 19th September 2011 Cost-Benefit Analysis for GMES Final Version II
Prepared for: European Commission Directorate – Enterprise and Industry
66
which states that the main driver of the European EO value-adding industry activities in the coming years will be GMES. This study anticipates the global EO value-adding sector to generate €50 billion in sales in 2015, with the largest shares of sales attributed to markets serving applications in private citizen uses, civil engineering, tracking, fleet management, disaster management and cartography. Other smaller markets indicated by the report include agricultural uses, mining, insurance, urban, traffic management and regulations monitoring.152
The study also identifies a range of factors that will influence EO industry growth. This includes:
� Market factors, including the emergence of new products and alternatives (e.g. Google Earth type products, enhancements to GPS/GIS, etc.) and socio-economic factors;
� Technological trends associated with new satellite technologies and software advances – in these contexts, the continuity of data is seen as being critical to stimulate industry development and innovation; and
� Political and regulatory developments.
There is a potential role for the GMES programme to support growth in the value-added downstream sector, given the sector is an emergent outcome of the GMES project and its objectives. This could derive from growing demand in both the public and private sectors for EO products. However, an important consideration will be whether GMES can meet this demand compared to the alternatives that leverage the capabilities provided by technologies such as GNSS (Global Navigation Satellite Systems) and very high resolution satellite observations. As a result of these uncertainties, it is difficult to make confident predictions about future demand for GMES in this context.
5.3.1 ECORYS study on the Competitiveness of the GMES Downstream Sector (2008)
An important previous study on the state of the EO industry in Europe was completed by ECORYS in 2008 and used to support the EU Impact Assessments and Communications in 2008 (“We care for a safer planet”) and 2009 (“Challenges and next steps for the space component”).153
The main issues addressed in the report include:
� Performance of the European EO downstream sector, in terms of revenues, employment and productivity;
� Structure of the sector;
� Competitiveness of the sector in terms of production processes, imports and exports, profitability and market structure;
� Regulatory and framework conditions and the impact of these conditions on the competitiveness of the sector; and
� EO downstream services sector compared with its US equivalent.
152 eoVox, Business in EO: an overview of market development and emerging applications [eoVox is an industry activity
initiated by ESA to explore issues that affect the EO industry in Europe and Canada (www.eovox.org)]. 153 COM(2008) 748: “Global Monitoring for Environment and Security (GMES): We care for a safer planet”, November 2008 -
http://eur-lex.europa.eu/LexUriServ/LexUriServ.do?uri=COM:2008:0748:FIN:en:PDF.
COM(2009) 589: “On the progress made under the 7th European Framework Programme for Research”, April 2009 – http://eur-lex.europa.eu/LexUriServ/LexUriServ.do?uri=SEC:2009:0589:FIN:EN:PDF.

Booz & Company
Date: 19th September 2011 Cost-Benefit Analysis for GMES Final Version II
Prepared for: European Commission Directorate – Enterprise and Industry
67
5.3.1.1 Background on the European EO Sector
This study defined the EO sector as “those organisations that offer value added services based on EO data”.154
Table 5.1 below provides an overview of estimates of space-based downstream revenues as at 2005, which permits key observations about the sector, including:
� EO is the smallest of three value-adding space segments in absolute numbers, and represents only 2% of revenue in the downstream market; and
� European revenues take up around one-third of world revenues in the EO sector (as well as in the telecommunications sector), which suggests that the EU has a relatively healthy EO downstream sector.
Table 5.1: Overview of Space-based Downstream Revenues by Sub-sector (2005)
Sector Revenue: World
€ Billion, 2005
Revenue: Europe
€ Billion, 2005
Europe
%
2000-05 CAGR
Europe
Telecommunications 54.3 18.1 33% 6.5
Navigation 17.3 2.3 13% 22%
EO 1.3 0.4 31% 4%
Total 72.9 20.8 29% 11%
Source: ECORYS (2008) analysis of Euroconsult data.
Note: Data includes Canada, an associate member of ESA, which accounts for 10%.
A separate study by VEGA that is cited in the ECORYS study, suggests that once public sector expenditure on meteorology and met-ocean are removed, total revenue in the European EO sector is around €300 million in 2006 (not €400m or more reported in the Euroconsult study), and that purely commercial revenue is around €175 million in 2006.
Within the European value-adding EO Industry, the significant majority of revenue is derived from the provision of meteorological products (€211 million or 54% in 2005). “Defence and Security” is the next largest source of revenue (17%), with the other elements that are more closely related to GMES services sharing the rest (see table 5.2 below).155
Table 5.2: European Revenue in the Value-adding EO Industry by Sub-segment (2005)
Sector 2005 (€ Million) Revenue Share
Meteorology 211 54%
Defence and Security 65 17%
Oceanography 49 13%
Natural Resource Monitoring 52 13%
Land Monitoring 13 3%
154 ECORYS study on the “Competitiveness of the GMES Downstream Sector” (2008), p. 18. 155 In this context, the ECORYS study points to findings of Euroconsult that the EO industry is the only industry where the
commercial activity is larger in the upstream segment compared to the downstream segment.

Booz & Company
Date: 19th September 2011 Cost-Benefit Analysis for GMES Final Version II
Prepared for: European Commission Directorate – Enterprise and Industry
68
Sector 2005 (€ Million) Revenue Share
Total 390 100%
Source: ECORYS (2008) analysis of Euroconsult data; Booz & Company analysis; Note: Includes Canada, which accounts for around 10%.
Table 5.3 presents EO sector revenue, numbers of employees and labour productivity in 2002 and 2006, as well as the growth experienced over that period.
Table 5.3: Overview of Space-based Downstream Revenues for the EO Sub-sector (2005)
Sector Revenue: World
€b, 2005
Revenue: Europe
€b, 2005
Europe %
2000-05 CAGR
Revenue (ex public sector) €285m €306m 1.8%
Employees (ex public sector)
2,900 3,000 0.85%
Labour Productivity €98,000 €102,000 0.93%
Source: ECORYS (2008) analysis of VEGA data.
Some key observations from the above table include:
� The commercial European EO sector employed around 3,000 people in 2006;
� Labour productivity is relatively high in the EO sector, with average productivity equalling around €100,000; and
� Growth in revenue and labour productivity at the time was growing stronger than employment in the EO sector. Although this is in nominal terms only, and in fact, productivity may have been eroded by inflation over the period.
Based on the VEGA study, ECORYS reported that the main clusters of EO activity (i.e. numbers of operations) in 2006 were occurring in the UK and Germany, with France, Italy, Belgium and Spain emerging as important locations. France was reported as having the highest level of employment, reflecting the larger organisations operating there at the time. Overall, it was found that EO organisations were mostly operating out of the EU-15 countries only, (and Norway and Switzerland).
Based on analysis of VEGA data, the ECORYS study demonstrated that the European (and Canadian) EO sector is dominated by small to medium sized enterprises. Of the 151 companies recorded:
� 87 companies are small, employing between 0 and 10 employees;
� 68 companies are medium-sized, employing between 11 and 60 employees; and
� 6 companies are large, employing more than 60 employees.
On average, the sector employs 20 persons per company and generates turnover of around €2 million per company.
5.3.1.2 Comparisons with the U.S. EO Sector
A high level comparison with the US EO sector revealed that:
� The US industry is between two and three times the size of Europe’s (depending on the exact definition of the sector);

Booz & Company
Date: 19th September 2011 Cost-Benefit Analysis for GMES Final Version II
Prepared for: European Commission Directorate – Enterprise and Industry
69
� The main difference is the much larger domestic defence / security market accessible to US companies; and
� The US industry appears to be growing faster than that in Europe.
5.3.1.3 Mapping of EO Value-adding Activities to GMES Service Outputs
According to the ECORYS study, there are two possible approaches to identifying the downstream sector influenced by GMES core services:
� A vertical segmentation analysing the levels of activity in different vertical parts of the supply chain and isolating the downstream part; and
� A horizontal segmentation– identifying those thematic market segments that could be served by “Core” services.
The study used the second method due to the availability of better information to segment the market horizontally (rather than vertically) and because the core services vary considerably in their vertical scope (see figure 5.1 below).
Figure 5.1: Proportion of Industry Revenue by Horizontal Market Sectors
Source: ECORYS (2008) analysis of VEGA data.
Note 1: Note: The VEGA definition of size classes differs from the EU definition, that defines companies with 1-10 employees as micro-enterprises, with 11-50 employees as small enterprises, with 51-250 employees as medium sized enterprises, and >250 employees as large enterprises.
Note 2: Booz & Company analysis used to convert original figure for this report.
This analysis demonstrates that around 20% of industry revenue is concentrated in the ‘Cartography & Topographic Mapping’ sector, with much of this attributable to large companies. Around 15% is attributable to ‘Land Use / Land Cover and Change Mapping’ and a little over 10% in ‘Marine and Coastal Surveillance’. The middle bracket sectors are focused on land mapping services, with the lowest represented sectors relating to climate change, atmospheric monitoring and water quality monitoring. It is not clear what is driving these patterns of sectoral development, but it has interesting similarities to the development of GMES to date.

Booz & Company
Date: 19th September 2011 Cost-Benefit Analysis for GMES Final Version II
Prepared for: European Commission Directorate – Enterprise and Industry
70
After mapping the applications segment to GMES service influence, the study also estimated that the value of commercial downstream services industry impacted by the GMES Core Services is €117 million per annum based on 2006 turnover.
5.4 CURRENT STATE AND FUTURE PROSPECTS OF THE EARTH OBSERVATION SECTOR
It is difficult with available information to make an accurate assessment of the current (i.e. 2011) state of the European EO industry. While the ECORYS study provided a good market overview and mapping against GMES service areas, it is significantly out of date. The EU has not subsequently commissioned any similar studies.
Since the time of the results presented in the ECORYS study, the European EO industry has continued to be supported by ongoing investment by the EC via the GMES programme. However, it is also expected that the recent global recession brought about by the financial crisis in 2008 will have had a negative impact on the industry, potentially offsetting some of the gains in demand that may have been made in the period immediately after 2005.
Looking to the current forecast period, many studies report positive growth potential for the EO sector. According to a study by Space IGS, which was chaired by Astrium in the UK, there are expectations of very strong growth in non-institutional supply and demand, and therefore a reduction in the institutional share of total systems:156
“Globally, the public investment in EO equated to USD 6.7 billion in 2008, with GMES alone representing > 2 billion euro investment in Europe. There are expected to be 250 EO-related launches between 2009 and 2018, up from 128 during the previous decade. These are divided between the institutional systems at 36%, private satellite operators at 19% and export nation satellites at 34% with 17% being for space “emerging” nations. The Institutional market share over the same period will halve, from 77% (1997-2006) to 36%. Nevertheless, the launch of ~60 new Institutional EO satellites globally between 2007 and 2016 is seen as providing a large stable market rather than a growth market. “The trends in the EO market to 2017 are likely to be for greatest growth in data sales at 15% CAGR, the lowest growth in satellite manufacture and launch revenues (despite 250 new satellites) at 1.2% CAGR and modest growth in EO value added services at 8% CAGR. Data sales globally are expected to have jumped 33% in 2009 alone, to USD 1.2 billion (up from USD 200 million in 2000).”
A recent study by Euroconsult also reports positive growth forecasts for the global EO industry. This study found that:157
� The number of civil and commercial EO satellites expected to launch between 2010 and 2019 will more than double during the next decade, expanding to 280 from 135;
� Based on this, the satellite-manufacturing sector is expected to generate revenues of more than USD 26 billion during the next 10 years;
� In 2009, commercial EO data sales were USD 1.1 billion, and 83% of sales were from high resolution optical data. This is up from around USD 550M in 2005;
� Missions from emerging programmes are a significant driver of growth, with more than 40 nations expected to launch EO missions by 2019 (up from 26 in 2009);
� These initial EO satellite missions are to focus on producing generic data that can be used for a wide array of applications (e.g. agriculture, resources monitoring, oil and gas,
156 Space IGS: “A Space Innovation and Growth Strategy 2010 to 2030”, 2009. 157 http://eijournal.com/2011/earth-observation-emerging-markets-partnerships-set-to-fuel-global-growth-2.

Booz & Company
Date: 19th September 2011 Cost-Benefit Analysis for GMES Final Version II
Prepared for: European Commission Directorate – Enterprise and Industry
71
etc.), with the expectation that later generations will offer increasingly higher accuracy and resolution;
� Defence and Security spending is the main driver of industry value to date. This is reflected in the fact that the three large companies including DigitalGlobe; GeoEye; and SPOT Image represent 65% of global market share;
� A major challenge for policy makers relates to ensuring cooperation among the many new and competing missions in order to limit duplication.
� Despite the issues with competition, expectations are for commercial revenue sales to increase to around USD 4 billion by 2019. However, in order to achieve this level of growth (i.e. 14% CAGR) commercial data distributors must develop their customer base by moving from a home-government dependent model to one that leverages relationships with foreign governments and private enterprise.
Another study by BCC Research highlights the growth potential for the wider EO market, including weather forecasting, right of way inspections, public health, climate change studies and other applications. According to this study, the global EO industry is expected to grow by around 6% per annum to 2012, taking the value of the total global remote sensing market to around USD 10 billion. Applications for weather forecasting are estimated to account for the greatest share of demand at around 40%.158
Statements made in the study completed by the UK Department for Business, Innovation and Skills (BIS) provide another viewpoint, highlighting the competition that can be expected from other Earth-based data providers:159
“The economic prospects of commercial observation satellites (COS) are still uncertain. On the one hand, there is the perception that as many countries shift to knowledge-based economies, a rapidly growing market for satellite imagery and related information products may emerge worldwide over the next few years. On the other hand, COS face stiff competition for selling geospatial information products. They have to compete first with aerial photography, which has long dominated the market and is pursuing its own innovation path. Moreover, they have to compete with land-based surveys using global navigation satellite systems (GNSS) and geographic information systems (GIS) that both compete with and complement COS imagery.”
These comments highlight the difficulties in being able to assess the current state-of-play for the European EO industry. Based on these factors, a conservative approach would be to base the analysis on the findings of the ECORYS study, which reports employment levels as at 2005.
5.5 WIDER ECONOMIC IMPACTS OF THE SPACE SECTOR
There have been many studies that have examined the link between the activities of the space sector with a series of wider economic impacts. These wider impacts include the economic activities of industries that support the space sector through the provision of material and labour inputs, activities of the housing and retail sector linked to expenditure by the space sector, and the wider economic benefits associated with economic spillovers that are linked to the R&D aspects of the space sector.
158 http://www.bccresearch.com/report/remote-sensing-technologies-ias022a.html. 159 UK Department for Business Innovation & Skills (BIS), BIS Economics Paper No.3: “The Space Economy in the UK: An
economic analysis of the sector and the role of policy”, 2010, p. 21.

Booz & Company
Date: 19th September 2011 Cost-Benefit Analysis for GMES Final Version II
Prepared for: European Commission Directorate – Enterprise and Industry
72
5.5.1 Indirect and Induced Economic Impacts
The Federal Aviation Administration (FAA) in the US has developed a framework that includes the direct, indirect and induced impacts of investments in the space sector. The direct impacts relate to the expenditures on inputs and labour involved in producing the final goods of a particular investment or programme. The indirect impacts include purchases and labour in the industries that provide inputs to the investment enable industries, and the induced impacts include the rounds of increased household spending (housing, food, entertainment, clothing, etc.) resulting from the direct and indirect impacts.160
Using its economic input-output model for the US economy (RIMS II), the FAA was able to map the indirect and induced impacts associated with direct economic activity in commercial space transport and enabled industries. This showed that direct impacts of around USD 23 billion in 2006 created an additional USD 65 billion in indirect impacts and around USD 51 billion of induced impacts, such that the total impacts were around USD 139 billion. This is equivalent to around six times the total direct impacts. Table 5.4 shows how these impacts were estimated across each industry group, with the remote sensing group estimated to have the large ratio of total to direct impacts with a ratio of around 10:1.161
Table 5.4: Economic Activity Impacts of Commercial Space Transportation and Enabled Industries (2006, USD, 000’s)
Industry Group Direct Indirect Induced Total Ratio
Launch vehicle manufacturing 199,195 527,028 440,500 1,166,723 5.9
Satellite manufacturing 847,992 2,240,455 1,662,453 4,750,900 5.6
Ground equipment manufacturing 6,898,385 18,226,019 13,523,993 38,648,397 5.6
Satellite Services 14,530,871 41,267,679 32,579,181 88,377,731 6.1
Remote Sensing 126,804 509,190 628,429 1,264,423 10.0
Distribution Industries 637,662 2,261,410 2,154,781 5,053,854 7.9
Total Impacts 23,240,911 65,031,780 50,989,338 139,262,027 6.0
Source: FAA, The Economic Impact of Commercial Space Transportation on the US Economy, 2008.
It is important to recognise that the indirect and induced impacts estimated by the FAA represent a ‘money multiplier’ of impacts, and do not provide a way of capturing additional economic benefits that can be counted as part of a cost-benefit analysis. They merely represent the way the direct impacts associated with the space sector flow through the economy through the various economic agents that form parts of the economy that support the enabled industries and the workforce. As such, these impacts would have distributional elements, depending on the nature and locations of the affected industries and their supporting economies.
160 FAA, The Economic Impact of Commercial Space Transportation on the US Economy, 2008. 161 According to the FAA study, the remote sensing industry group includes the provision of raw satellite data and satellite
imagery services, but does not include sales by firms that digitally process imagery and combine it with additional information to create maps, databases, or other value-added products.

Booz & Company
Date: 19th September 2011 Cost-Benefit Analysis for GMES Final Version II
Prepared for: European Commission Directorate – Enterprise and Industry
73
These issues were addressed by BIS in its analysis of the economic impacts of the space sector. For example, its report stated:162
“In the case of space, both upstream and downstream companies source goods and services from companies outside the space industry thereby generating activity in the rest of the UK economy. These industries will in turn source goods and services from other suppliers, and so on. This multiplier effect is known as the “indirect effect” of the space industry. The size of the multiplier effect depends on the extent of linkages between sectors, namely how much a given sector buys from other sectors as part of its production activities.”
Oxford Economics applied a similar framework for evaluating the impacts on the economy of UK space sector. This study estimated that, in 2006-07, the direct economic activity in the UK space sector of around GBP 2.7 (~€3.1) billion was generating around GBP 1.7 (~€2.1) billion of indirect impacts and around GBP 1.1 (~€1.3) billion of induced impacts. This represents a ratio of total impacts to direct impacts of around two to one.163
The Oxford Economics Study also analysed the employment impacts, reporting that the UK space sector was directly employing around 19,000 people in 2006-07, with direct and induced economic impacts supporting a further 49,000 employees.164 This represents a ratio of around 3.6 to one. The findings of this study are supported by studies conducted in other parts of the EU. For example, a recent Danish study also found a strong connection between the awarding of ESA contracts and the capacity of the selected firms to generate significant additional economic activity and employment.165
The Oxford Economics study also provides a useful analysis of the superior labour productivity associated with the space industry. Figure 5.2 provides estimates of value-added per worker in the UK economy in 2006-07.
Figure 5.2: Value-added per Worker in the UK in 2006-07 (GBP 000’s, 2006 Prices)
Source: Oxford Economics, The Case for Space: The Impact of Space Derived Services and Data, 2009.
162 UK Department for Business Innovation & Skills (BIS), BIS Economics Paper No.3: “The Space Economy in the UK: An
economic analysis of the sector and the role of policy”, 2010, p. 38. 163 Oxford Economics, The Case for Space: The Impact of Space Derived Services and Data, 2009. 164 Oxford Economics, The Case for Space: The Impact of Space Derived Services and Data, 2009. 165 Danish Agency for Science, Technology and Innovation, Assessment of the economic impacts of Danish ESA membership,
2008.

Booz & Company
Date: 19th September 2011 Cost-Benefit Analysis for GMES Final Version II
Prepared for: European Commission Directorate – Enterprise and Industry
74
The figure above shows that the space industry employs workers that are generally more productive than the average workforce, with the downstream segment ranking second and the upstream segment ranking eighth in the list shown. Combined, the space industry would be ranked third overall.
These findings provide support for the arguments that investment in the space sector is good for developing smart and innovative growth in economic activity in line with the Europe 2020 Strategy.
Analyses of the ‘multiplier’ impacts of investment in the space sector are useful in complementing the analyses of other benefit areas that are captured in the cost-benefit study, although their use can be limited in some circumstances.166,167 The results are reported as supporting analyses to the main CBA results.
5.5.2 R&D Spillovers
The creation of spillovers has the potential to create significant wider economic productivity benefits that can be additional to the conventional cost-benefit analysis.
Spillovers are generally related to transmission of newly created knowledge and technical capability via either ‘knowledge’ or ‘market’ processes. For example, knowledge spillovers are derived from general R&D activities, where the actions of one firm will send information and signals to other firms (e.g. through general dissemination of R&D results, filing of patents, staff turnover, etc.). Market spillovers are related to the operation of market forces that work to ensure that the benefits of new products created by one firm are transmitted to other competing firms, or via unexpected economies of scope in other industries.168
A number of studies have evaluated the link between government investment in R&D and the creation of wider economic, social and environmental benefits. A recent OECD conference paper presented the findings of previous studies that reviewed estimates of private and social returns on R&D for a series of innovations. These studies show that private and social returns can vary significantly with each innovation, with social returns ranging from the negative to over 300%, with an average around 100%. And in many cases, the social return on R&D was estimated to be significantly greater than the private returns. 169,170 This is evidence of market failure and provides justification for government investment in R&D.
Oxford Economics also carried out an analysis of the potential for R&D spillovers linked to investment in the space sector. It analysed a previous DTI study that provided the results of a series of academic studies into the private and social rates of return on R&D investments. The results of this analysis show very large social benefits of R&D investment, which occur despite the protections on intellectual property rights through patents and other legal measures. In fact, all studies reviewed also found that the social benefits are significantly greater than the private benefits that accrue to the original investing firm.
166 UK Department for Business Innovation & Skills (BIS), BIS Economics Paper No.3: “The Space Economy in the UK: An
economic analysis of the sector and the role of policy”, 2010, p. 40. 167 EU Regional Policy Guide to Cost-Benefit Analysis of Investment Projects, 2008, p. 81. 168 For a useful discussion of the sources of spillovers, see UK Department for Business Innovation & Skills (BIS), BIS
Economics Paper No.3 – The Space Economy in the UK: “An economic analysis of the sector and the role of policy”, 2010, pp. 44-45.
169 A. Piric & N. Reeve, Evaluation of Public Investment in R&D – Towards a Contingency Analysis, 1997. This paper was for the OECD 1997 conference Policy Evaluation in Innovation and Technology: Towards Best Practices.
170 Bronwyn H. Hall, Jacques Mairesse, Pierre Mohnen, Measuring the Returns to R&D, 2010.

Booz & Company
Date: 19th September 2011 Cost-Benefit Analysis for GMES Final Version II
Prepared for: European Commission Directorate – Enterprise and Industry
75
Overall, the Oxford Economics study assumed that taking an average of the studies would be suitable for considering the potential spillovers created by R&D investment in the space sector. Under this assumption, every €100 million invested in R&D under the GMES programme would create €70M in additional economic benefits in the form of productive spillovers.171
Other studies of R&D spillovers in the space sector provide a different perspective the impacts inside and outside the space sector. For example, a study by Cohendet (1997) evaluated the indirect industrial impacts of ESA technology programmes. This study defined the direct impacts as those relating to the specific objectives agreed under ESA contracts, and the indirect effects as those relating to more general objectives such as the improvement in scientific knowledge, social equity, macroeconomic impacts, etc. Under this framework, indirect industrial effects (termed “spin-offs” or “fall-out effects”) included benefits in terms of technology, knowledge, corporate image or business contracts which firms derive from participation in ESA programmes. These impacts then expand beyond the contacting firms to customers and suppliers and then throughout the economy.
In estimating the indirect effects, the study finds that the ratio of the value of indirect to direct effects is in the range of 2.9 to 3.5 to one. It also estimates that the indirect effects outside the space sector are in the range of 25-50%.172
It is difficult to make direct comparisons between the findings of the Cohendet study and others like it with the studies on classic R&D spillover theory, which involve the consideration of private capital investment in R&D. A concern is that the former study is representing the future private returns for ESA contracting firms as part of the indirect spillover effects.
In any event, there is a clear case to support the role of R&D investment in creating knowledge and market spillovers. As GMES contains a significant element of R&D expenditure, it is appropriate to apply a calculation of the potential for the programme in supporting growth in economic productivity and the creation of wider economic impacts. This could be achieved by applying a multiplier approach in line with approaches that are cited in the context of other flagship space investments such as Galileo.173 In this context, the Oxford Economics study, which was applied in the context of the UK space sector, provides an appropriate benchmark for approximating the potential spillover effects associated with R&D expenditure under the GMES programme.
171 Oxford Economics, The Case for Space: The Impact of Space Derived Services and Data, 2009, adapted from DTI,
Prosperity for All. 172 P. Cohendet, Evaluating the Industrial Indirect Effects of Technology Programmes: The Case of the European Space
Agency (ESA) Programmes, 1997. This paper was for the OECD 1997 conference Policy Evaluation in Innovation and Technology: Towards Best Practices.
173 For example, see www.eubusiness.com/topics/telecoms/galileo-5.

Booz & Company
Date: 19th September 2011 Cost-Benefit Analysis for GMES Final Version II
Prepared for: European Commission Directorate – Enterprise and Industry
76
6. THE ECONOMIC VALUE OF GMES
6.1 INTRODUCTION
GMES represents a major European effort to enhance our understanding of Earth science and a range of complex environmental systems. In this context, the main benefit of GMES is in the value of the information it provides to support strategic policy action and environmental, resource and emergency management across the EU and further afield.
To support the development of a suitable CBA framework for this study, this chapter provides an overview of the concepts underpinning the value of information. It provides a critique of the use of traditional CBA techniques when valuing projects like GMES that involve large amounts of uncertainty with respect to their potential impacts. It reviews previous attempts at quantifying the benefits of GMES. It also presents recent efforts by the EU to identify the benefits of enhanced EO systems, and in particular those of GEOSS.
6.2 VALUE OF EARTH OBSERVATION
6.2.1 The Concept of the Value of Information
Evaluations of the benefits of GMES and the new levels of EO capability that it will provide policy and decision makers draw from economic concepts regarding the value of information (VOI). These concepts and their connection to EO have been subject to much study in recent decades.
Macauley (2005) provides a useful overview of the concept of VOI. Pointing to seminal studies on the subject, VOI is described as being an outcome of choice, whereby individuals may be willing to pay for information depending on their degree of uncertainty and the opportunities they face. For example, an individual may be willing to pay for additional information if the expected return exceeds the cost of obtaining the information. Under this framework, VOI is related to:174
1. The degree of uncertainty faced by decision makers;
2. What is at stake in terms of the outcome of their decisions;
3. The cost of using the information to make decisions; and
4. The cost/price of the next-best information substitute.
The larger the degree of uncertainty and what is at stake, then it follows that information can also have a large value. However, a high cost of obtaining and using the information and its substitutes tends to reduce VOI. Another important consideration in this context is the ability of individuals to act on the information they receive. If there are limited options available, then information will have less value. These factors are summarised in the figure below.
174 M. K. Macauley, The Value of Information: A Background Paper onCmeasuring the Contribution of Space-Derived Earth
Science Data to National Resource Management, Resources of the Future, 2005.
www.http://www.frr.org.

Booz & Company
Date: 19th September 2011 Cost-Benefit Analysis for GMES Final Version II
Prepared for: European Commission Directorate – Enterprise and Industry
77
Figure 6.1: Drivers of VOI
Source: Macauley (2005); Booz & Company Analysis.
6.2.2 Quantifying the Value of Information
In valuing information, it is important not to confuse its value with the value of the policies and decisions that information can support. For example, GMES does not directly provide costs and benefits of an environmental nature, rather it provides information, upon the basis of which people may choose to expend resources to deliver an outcome which affects the environment. When new policy initiatives are being founded upon particular information sources, it is easy to mistake the value of the policy initiative for the value of the information source. If one lost that information source, the policy initiative may still be valid, albeit with some loss of precision for having to find other bases for decisions, which in many cases would likely be found. The information source itself is only worth the value of the increase in precision between the two approaches.
Ascribing VOI to GMES is complex, and a range of outcomes is likely. In general, it is expected that the benefits of GMES in terms of the VOI will be incremental. However, this can yield significant benefits given the role for GMES in supporting the management of large environmental and security risks.
There have been various studies that have attempted to quantify the VOI associated with improved EO capability. For example, an article by Jerome Schnee175 reviewed the economic benefits of improved weather forecasting. The article states that increased use of satellite data may improve forecasting accuracy by 5 – 10%, which can result in a 2.8% - 5.6% reduction in the economic costs that can be addressed through more accurate modelling.176 However, one could expect the contribution to be higher in an area where there is a fairly clear link between data observation, modelling and a market based end. In the case of EO, the story is different as not only is it a public good, with primary benefits to policy makers, but also gathering data in domains where there are many other contributing factors.
175 Schnee, Jerome: “The Economic Impact of the US Space Programme” – See http://er.jsc.nasa.gov/seh/economics.html.
Although the reference is to a study from the early 1970s, the core logic of the arguments should still remain valid. 176 56% x 5% or 56% x 10%.

Booz & Company
Date: 19th September 2011 Cost-Benefit Analysis for GMES Final Version II
Prepared for: European Commission Directorate – Enterprise and Industry
78
A National Oceanic and Atmospheric Administration (NOAA) study177 shows that improved information in relation to weather events can provide a 4.6% better outcome (positive economic effect). However, this study is also focused on weather and less on the aspects of EO that are relevant to GMES such as climate change. However, one can only assume that in very complicated systems (e.g. system of systems or network systems) the incremental contribution by any single entity is low.
Alternatively, various authors find that information on the responsiveness of the climate system would be exceedingly valuable to us if it was available, enabling us to take cost-effective mitigation measures. For example, Keller et al. (2007)178 find that when uncertainty is high, and the climate system is sensitive with respect to thresholds, the value of early learning about climate sensitivity increases from around USD 10 billion to approximately USD 250-800 billion, depending on when perfect information is achieved. Ruth (2005) obtained similar results, but also found that technological innovation can play a role in the case of a restrictive emissions policy.179
These studies support the case that GMES has the potential to deliver very large benefits in the context of climate change. However, such studies do not specify the data that can be collected to achieve the level of information modelled, or what analysis that can be performed on it that would lead to the possession of such information. These studies are also focussed on a particular activity area (i.e. climate change), which provides a limited rationale for developing a general approach for evaluating the VOI for GMES as a whole.
In this context, the following quote from one of the world’s leading economists provides a benchmark for the VOI that can be expected across the various elements of an EO system like GMES:180
“All of the studies I know of the value of perfect information find its value to be on the order of one percent of the value of output. For example one study found that if you halve the standard error of precipitation and temperature, say from one percent to one-half percent, or one degree to one-half a degree, you get an improvement in the value of the output on the order of 2 percent of the value of wheat production. A study of cotton gave the same order of magnitude. I have looked at a number of studies in the area of nuclear power and energy, trying to determine the value of knowing whether nuclear power is ever going to pan out. Again, perfect information is worth on the order of one percent of the value of the output.”
In fact, the finding by Nordhaus that better or perfect information is worth in the order of 1% of the value of the output has formed the basis of a series of studies that have quantified the impacts across different sectors. For example, this ‘VOI’ approach was adopted by the NOAA in the US when estimating the economic benefits from ports installations.181 In its approach, the first step was to identify the activities that could be affected by ocean observing systems. Activity areas included a number of recreational activities (fishing and
177 NOAA: “An Investigation of the Economic and Social Value of Selected NOAA Data and Product for Geostationary
Operational Environmental Satellites (GOES)”, February 2007. 178 Keller, K., S.-R. Kim, J. Baehr, D. F. Bradford, and M. Oppenheimer: What is the economic value of information about
climate thresholds? Book chapter in: Integrated Assessment of Human Induced Climate Change, Chief Editor: Michael Schlesinger, Cambridge University Press, (2007).
179 Matthias Ruth, Economic and Social Benefits of Climate Information: “Assessing the Cost of Inaction”, Procedia Environmental Sciences 1 (2010) 387–394, World Climate Conference-3.
180 Nordhaus WD. The value of information. In: Krasnow, RP, editor, Policy aspects of climate forecasting. Proceedings, May 4. Washington, DC: Resources for the Future;1986: p.29–34.
181 NOAA: “Estimating Economic Benefits from NOAA PORTS® Installations: A Value of Information Approach”, Technical Report NOS CO-OPS 44, Silver Spring, Maryland, July 2005.

Booz & Company
Date: 19th September 2011 Cost-Benefit Analysis for GMES Final Version II
Prepared for: European Commission Directorate – Enterprise and Industry
79
boating, etc.), freight transportation, health and safety (oil spills, search and rescue, beach restoration, etc.), energy planning and development, and commercial fishing.
Data was then collected from public statistical sources that indicated approximate levels of economic activity in those areas. An assumption was then required regarding the level of social surplus benefits that can be achieved, which in most cases was assumed to be no more than 1% of total activity values. This was recognised as a conservative assumption.
Kite-Powell et al. (2008)182 also used this approach to estimate the economic benefits of regional ocean observing systems, recognising the benefits of this approach when detailed studies on users’ willingness to pay for observational information were not available.183 Hagan et al. (2010)184 provides another paper on ocean observing systems where the economic value has been assessed in line with the approach suggested by Nordhaus.
This approach was used by Zhang et al. (2010) for the evaluation of the potential economic benefits of the New South Wales Integrated Marine Observing System (NSW-IMOS) in Australia. This study highlights that this approach is widely used across the literature to overcome data limitations and the absence of detailed estimates of users’ willingness to pay for better information.185
6.2.3 Conclusions for the GMES Cost-Benefit Analysis
There have been many previous studies that have attempted to quantify the VOI provided by EO systems. Some studies show that improved weather forecasting systems can provide benefits in the order of around 3-5% of output. Other studies also show that under certain conditions, perfect information about climate change sensitivities can have very large impacts overall.
Recently, a number studies, including a study by the NOAA, have adopted a simplified approach to estimating a benefits across a number of activity areas that are connected to a particular EO system. This approach is preferred when information regarding users’ willingness to pay for better information is not known. Under this approach, the benefits of better information are recognised as being incremental, and valued as 1% of output in each activity area affected by the EO system.
Overall, it is difficult to precisely identify the extent to which the information collected by GMES will contribute to enhancing our understanding of complex environmental science, although it is reasonable to assume that a positive contribution is likely. A problem for estimating the impacts of GMES is that, as with previous studies, there is no detailed information regarding user’s willingness to pay for the information that GMES will provide. Given this constraint, it is recommended that the GMES CBA follows other recent studies by assuming that the VOI across each GMES activity area is incremental, and equal to 1% of output. This is recognised as a conservative assumption in the context of the reviewed studies. It also contrasts previous efforts at applying CBA techniques to the evaluation of GMES (see below).
182 Kite-Powell Hauke et al.: “Estimating the Economic Benefits of Regional Ocean Observing Systems”, 2008. See also Kite-
Powell et al. earlier paper from 2005 on “Estimating the Economic Benefits of Regional Ocean Observing Systems”. 183 See also Kite-Powell et al. earlier paper from 2005 on “Estimating the Economic Benefits of Regional Ocean Observing
Systems”. 184 Hagan, Patrick, Shearin, Charlotte and King, Dennis: “The Mid-Atlantic Regional Coastal Ocean Observing System
(MARCOOS): Economic Estimate of Benefit Pathways, University of Maryland, Center for Environmental Science, 2010. 185 Zhang F., Wang, X. H. and Barber, E.: “Evaluation of the Potential Economic Benefits of NSW-IMOS Using Improved
Ocean Forecasts”, 2010.

Booz & Company
Date: 19th September 2011 Cost-Benefit Analysis for GMES Final Version II
Prepared for: European Commission Directorate – Enterprise and Industry
80
6.3 TRADITIONAL APPROACHES TO BENEFIT ESTIMATION
As with this study, the traditional approach to benefit estimation is to subject GMES or its components to formal cost-benefit analyses. However, linked to the complexities in estimating VOI, there are a number of reasons why the traditional CBA approach is not entirely suitable.
This section provides a discussion of why there are problems in applying standard CBA techniques to the evaluation of EO programmes such as GMES.
6.3.1 The Use of CBA in Evaluating Public Expenditure Programmes
The EC, along with many other providers of public funding for investment, assesses the effectiveness of its proposed investments through CBA methods, as part of a broader impact assessment. The aim of CBA is to show that a project represents a good use of public money, by comparing its benefits with its costs. Costs and benefits included in such analyses may include both financial and socio-economic costs and benefits. In many areas of public investment, it is the socio-economic benefit, including environmental benefits, rather than financial benefits that provide the main justification for the project. However, in many cases socio-economic benefits are less certain and harder to quantify, so an element of judgment may remain in deciding how strong a cost-benefit case is.
There are a number of modes of usage of CBA, of which the following three are the main representatives:
� Compare alternative project options, only one of which will be selected (i.e., they may be mutually exclusive options, or have the same objective) to identify the option that makes the best use of the public money provided;
� Compare candidate projects within a project portfolio in the same general policy area, in order to select those in the portfolio that make best use of the public money provided; and
� Demonstrate that a project exceeds a target or hurdle cost benefit ratio (CBR), representing the minimum level of social return that a public funding authority expects for its investments, given the many calls on its funds.
Essentially, CBA is a tool for determining the allocation of scarce resources among competing projects of similar characteristics. CBA is generally much less well suited to comparing budget allocations across widely different policy areas, e.g. health expenditure vs. transport expenditure.
There are several practical difficulties in executing CBA. These become more severe when comparing substantially different types of benefits and different types of activities. This is why CBA is generally seen as most valid when comparing similar types of projects.
This explains the first two common uses of CBA above. The third is more similar to a “minimum standard” approach to public funding. Hurdle rates can be set at different levels in different areas of policy to represent policy preferences and experience of carrying out CBAs in those different sectors.
The practical difficulties in carrying out CBA (without referring to higher level criticisms of the CBA approach) generally lie around:
� Uncertainty over the financial costs of service delivery, (i.e. the phenomenon whereby publicly funded projects frequently exceed their anticipated budgets, or are budgeted at

Booz & Company
Date: 19th September 2011 Cost-Benefit Analysis for GMES Final Version II
Prepared for: European Commission Directorate – Enterprise and Industry
81
lower than likely levels in order to obtain approval, or are delayed is an example of “optimism bias”);186
� Uncertainly over the level of usage or uptake of the services and applications enabled by the investment;
� Knowing what users might have done otherwise, if the service had not been made available to them; and
� Valuing the socio-economic impact of service usage.
In the case of many infrastructure projects, for example in the transport sector, the main difficulties of CBA are generally seen as lying towards the upper end of this list – delivery costs and take-up of the service. The valuation of socio-economic benefits of transport usage is usually considered fairly well characterised, providing the level of usage is known. This is because there is a market for transport services that allows observations of the decisions of transport users in relation to varying prices and costs. It therefore enables economists to deduce what value people attribute to important socio-economic impacts of transport.
There are also environmental costs from transport projects, which are more complex to value. However, in general time savings are the main aim of transport projects, and the main socio-economic impact. Nonetheless, it is probably possible to say that many transport projects are able to offer reasonable confidence that their costs and demand lie within about +/- 25% of a central estimate. Such a level of uncertainty is nevertheless troublesome when many major public transport projects display cost benefits ratios (CBRs) in the vicinity of 2. The willingness of governments to proceed with public transport projects with such a modest CBR probably reflects a belief that the additional, less well-characterised benefits of such projects (environment, social cohesion, economic agglomeration) are positive.
Projects such as GMES present CBA with greater analytical difficulties than transport projects. The cost of delivering GMES services, and the demand for them, is known to a lesser degree of certainty than for transport infrastructure projects. However, the greater difficulty is that the uncertainty over the value that can be attributed to the usage of the information is much greater.
The ultimate benefits that can be derived from the application of GMES lie mainly in areas such as environment and security. These are the exact areas where benefits are most difficult to value. This is described as part of the study’s wider literature review in Appendix E.
GMES does not directly impact the sectors it gathers information about, rather it provides information which might be used to the benefit of these areas. The relationship between the information and the benefits is not direct and requires case-by-case examination. Furthermore, GMES itself only provides some of the relevant data which is required to produce the information which is of value to users. Therefore it raises questions of benefit attribution. As a result estimates of the socio-economic benefits of GMES are likely to have a rather wider range of uncertainty when comparing it to benefit estimates arising from other types of infrastructure investments, such as transport or other utilities. In those cases, there should be much clearer and well defined definitions of responsibility and service offering between the provider and the service users.
186 See for example “How Common and How Large Are Cost Overruns in Transport Infrastructure Projects?” in Flyvbjerg,
Bent, Skamris, Mette K. and Buhl, Søren L. Transport Reviews, vol. 23, no. 1, January-March 2003, pp. 71-88. Although Flyvbjerg is the most noted author in the study of optimism bias in large projects, the concept is known from the publications of earlier authors.

Booz & Company
Date: 19th September 2011 Cost-Benefit Analysis for GMES Final Version II
Prepared for: European Commission Directorate – Enterprise and Industry
82
6.3.2 Wider Literature Review
A substantial part of the benefits of GMES applications lie in areas that are more challenging to value, such as environment, security, and so forth, and these benefits are derived from information delivered by GMES. To this end, the study has reviewed academic literature in areas related to CBA as it applies to these kinds of benefits, and as it applies to data and information for environmental and wider purposes.
Further details of this review are provided in Appendix E. However, three key themes have emerged as follows.
� Valuation of environmental (and similar) benefits:
- Monetary valuation of environmental benefits and costs, and other hard-to-value socio-economic benefits and costs in CBA was previously less common, and only now becoming more common. The reason for the previous reticence in monetising such benefits is because the valuation of these benefits and costs is more difficult and less certain than benefits up to now commonly included in CBA. The easiest benefits to value are those where there is a direct cost saving, or where a market exists to value the usage of the service.
- The next stage of difficulty is when a quasi-market approach can be applied to value the usage of a service, but this possibility is only occasionally available for environmental and similar benefits. Increasing amounts of research have been done into this area, giving us a better appreciation of the methods (mainly contingent valuation methods) and their limitations. This has also given us a library of values that can be used, but they understandably tend to have a rather wider range of uncertainty of valuation than situations where markets exist. These ranges of uncertainty can have major impacts on the policies one would select when benefits and costs are predominantly environmental.
� Valuation of information, especially information for generating environmental benefits:
- A distinction exists between data and information. Typically data from more than one source must be analysed and presented to produce useful information, an activity that is costly. Information on environmental factors is typically probabilistic, and new information typically serves to refine a risk-based decision at the margin. So although confident forecasts of future disasters would be valuable information, available information is not in that form, and new refined information typically only adds small value. The only methodologies in the literature for valuing additional environmental information are similar to those used in the PWC report.
� Shortcomings of CBA for environmental (and similar) project analysis:
- CBA is a popular decision tool because it is tractable and often presents a clear ranking of alternatives. Yet to obtain this tractability and certainty, one must accept the assumption that impacts on those affected can be measured as money. This should be able to be added up and discounted, to identify the best option. It has been argued by some authors that these assumptions are often less valid in the circumstance of environmental projects.
- The impacts are multi-dimensional and the CBA methodology produces recommendations that differ materially from what people actually choose in these types of situations.

Booz & Company
Date: 19th September 2011 Cost-Benefit Analysis for GMES Final Version II
Prepared for: European Commission Directorate – Enterprise and Industry
83
- However, other decision tools such as multi-criteria analysis, which might be applied to such multi-dimensional decision situations, are less tractable, with less clear choices. CBA can be modified to some degree (losses valued more than gains, differing discount rates) to represent better some of the preference behaviours of people.
Despite its limitations, the Commission considers CBA to be a useful tool to support its funding allocations across each of its policy domains. There have been a number of previous CBAs applied to the GMES programme. These studies are reviewed in the following section.
6.4 PREVIOUS GMES BENEFIT STUDIES
There have been a number of previous studies that have attempted to identify and measure the benefit of all or part of the GMES programme. This includes the major study completed by PWC in 2006, and the separate ESA studies that were completed for the then envisaged pre-operational services in 2003-04. This section provides a brief review of the approaches used in carrying out these studies.
6.4.1 Price Waterhouse Coopers Socio-economic Benefits Study187
6.4.1.1 Study Background and Results
The PWC study from 2006 is the only major cross-cutting benefits assessment that covers all of the services envisaged for GMES.
The PWC study was conducted over a significant period, including for much of 2005 and 2006, and involved the establishment of an ‘Expert Committee that was nominated by the GMES Advisory Council to provide advice and guidance on key elements of the study. The study was conducted over two stages. The first phase included a review of published work and stakeholder consultation supported by GMES policy experts and principal stakeholders. This led to a ‘Phase 1 benefit assessment’. The second phase of work involved refining the benefit assessment using focus groups and further consultation exercises.
The benefit assessment methodology comprised both a ‘strategic’ and a ‘quantitative’ analysis of the potential benefits of GMES. The steps that were followed in developing the benefits assessment followed a traditional approach, including determining the policy context, developing a baseline and ‘with scheme’ scenario, and quantifying the impacts.
The PWC study does not provide a detailed technical analysis of the ways in which GMES can create impact. Instead of being technology driven, the analysis is linked to the way GMES can support the implementation of existing policies, the development of new policies within the EU, and where it can support the EU in establishing international agreements or to influence environmental protection and security at a global level. As such, a three-tiered benefit hierarchy was created to capture the way GMES supports EU policies.
The evaluation of GMES impact for Category 1 benefits (support to existing policies) was based on the estimates provided in a series of 12 CBA reports that were linked to GSE projects started by ESA in 2003 and 2004.
The estimation of Category 2 and 3 impacts (new policies/behaviours, international agreements) involved the estimation of a series of behavioural ‘factors’ that could be applied
187 Price Waterhouse Coopers: “A socio-economic Benefits Analysis of GMES”, 2006.

Booz & Company
Date: 19th September 2011 Cost-Benefit Analysis for GMES Final Version II
Prepared for: European Commission Directorate – Enterprise and Industry
84
to reducing baseline costs across the various policy issues. Examples of baseline costs could include the costs of climate change and pollution, or health and welfare costs in areas that are prone to humanitarian crises. For Category 3 impacts, the behavioural factors represent the contribution of GMES to future policy development and the forming of international agreements that enable policy outcomes above and beyond what is included in the baseline scenario.
The estimation of these behavioural factors to support the assessment was generally based on expert judgment, other stakeholder views that were collected during the various consultation exercises over the course of the study, and published research papers. Table 6.1 highlights that a wide range of values regarding the VOI from GMES was applied, from as low as 0.1% in the case of climate change (adaptation), to as much as 10% in some areas (e.g. illegal fishing). In a number of cases a value of 1% is applied.
Table 6.1: GMES VOI Assumptions Used in the PWC Study
Benefit Area Basis of Evaluation
Category 2
Air Quality � Stakeholder suggestion
� GMES can support a 5% reduction in fine particulate matter
Marine � Based on stakeholder views, it is assumed that GMES can reduce illegal fishing in European waters by 10%
Flooding � Stakeholder workshop
� GMES could reduce damage costs by around 1.5%
Conflict Resolution � Based on stakeholder views
� GMES can support a 1% reduction in DALYs for the Africa region
Humanitarian Aid � Applied multi-criteria analysis
� GMES impact evaluated for each disaster category. Approach is to use a 1-3 scoring system, with 1 = 0.1%. These are added together and applied to the baseline cost estimate
Seismic Applications � Stakeholder input
� 1% of each of mortality, morbidity and property costs could be saved by GMES
Forest Fires � Focus is on pre, during and after event services in the area of forest fire risk management
� Based on analysis of stakeholder views, it is assumed that GMES can improve outcomes by 1%
Other Civil Security
(Landslides, Infrastructure Stability, Industrial Risk)
� Stakeholder input
� Assumed that 0.75% of each cost driver for landslides could be reduced due to GMES. For industrial risk, a 0.25% value was modelled. Also applied a 10% improvement/reduction in damage costs associated with subsidence, which was based on the GSE CBA (2004).
Forest Ecosystems � Based on stakeholder input regarding the view that EO data has contributed 10% of the 60% reduction in burnt areas in Spain (i.e. 6% for EO benefit)
Category 3
Climate Change – Adaptation
� Stakeholder input
� GMES is assumed to provide a 0.1-0.5% benefit, with lower end of range applied to the study
Deforestation – � Stakeholders proposed that GMES could contribute to a 5-20% reduction in deforestation,

Booz & Company
Date: 19th September 2011 Cost-Benefit Analysis for GMES Final Version II
Prepared for: European Commission Directorate – Enterprise and Industry
85
Benefit Area Basis of Evaluation
Climate with the lower bound assumed for the study
Desertification � Assumed that GMES can support a 5% improvement in avoidance of desertification, based on input from stakeholders
Deforestation - Ecosystem
� Assumed that GMES could reduce deforestation by 5-10%, with the lower bound used in the study
Source: PWC (2006); Booz & Company analysis.
Taken together, excluding the factor used for the climate change adaptation assessment, the weighted average behavioural factor applied in the study is close to 3%. This is a high value in the context of recent studies that have assumed the VOI is equal to 1% of the level of output in a given activity area. However, it is comparable with the findings of some other studies that have examined the impacts of better weather forecasting.
The PWC study estimates the total socio-economic benefits of the study as being around €34.6 billion in present value terms over the period from 2012 to 2030. The results demonstrate the extent to which the impacts on climate change policies were expected to create the largest benefits for the GMES programme, with Category 3 benefits accounting for around 50% of total benefits. Category 2 benefits account for around 42% and Category 1 benefits around 8%.
6.4.1.2 Relevance for the Current CBA Study
The PWC study is useful for the current study. It provides a logical framework for considering the policy domains and issues to which GMES can influence in the coming years. This includes the way in which the study structures and develops the policy baseline, and it establishes the hierarchy of benefits that GMES can support. For example, the creation of a three-tiered benefit system seems logical, and is a useful way of setting out and evaluating the short and longer term dynamics of GMES. This sets a useful foundation for future studies. However there are a number of issues with some of the methodological aspects of the study.
The limited availability of reliable data for the quantification of benefits of EO systems like GMES is a major constraint that PWC sought to overcome by using stakeholder and expert opinions throughout the benefit framework. This was understandable given the requirements of the study. However, under this approach, there is a risk that the results can be biased depending on the stakeholders interviewed, and it is difficult to establish a clear link or mechanism between GMES and the impact area. In addition, uncertainties around estimation bias are exacerbated by the lack of transparency around by whom or on what basis the estimates were derived. 188 However, despite these issues, the level of benefits is based on VOI assumptions that are comparable with some other studies. However, the approach differs from recent studies that have assumed the VOI to be 1% of output across multiple activity areas.
These issues pose tough challenges for this study. In developing a GMES CBA, it is efficient to maintain consistency with previous studies, and in particular the PWC study. This is considered to be a reasonable approach in terms of maintaining a similar policy framework
188 A useful discussion of these issues and other problems with estimating benefits and costs of EO systems is provided in the
GEO-BENE Public Deliverable D8 (T25): Status Report Year II, pp. 8-9.

Booz & Company
Date: 19th September 2011 Cost-Benefit Analysis for GMES Final Version II
Prepared for: European Commission Directorate – Enterprise and Industry
86
and in the selection of many of the economic indicators that are used to quantify the impacts of GMES. However, beyond updating the policy and damage cost baselines (which are key tasks to improve the relevance of the analysis), the approach could be altered to apply VOI assumptions that are consistent with recent studies.
A more detailed review of the study, including the GMES VOI assumptions and results, is included in Appendix D.
6.4.2 ESA GMES CBAs
ESA commissioned a series of 12 CBA projects in 2003 and 2004 in order to quantify the benefits and costs of the precursor services as they were defined at that time. These studies also provided an initial view of the potential wider benefits that GMES could provide through better policy outcomes, and security and environmental resource management in general. In addition, the estimates from these studies of the cost/efficiency savings that GMES would provide for end users were incorporated into the PWC study as the basis for the Category 1 benefits.
A review of each of the 12 CBA studies is included in Appendix D. Some key observations from this review include:
� Benefits are typically classified into broad categories, quite often related to direct and indirect benefits, with some studies using the following broad categorisation:
- Upstream benefits – these are benefits typically enjoyed by direct users, such as government organisations and other agencies;
- Downstream benefits – these are benefits that reflect the expectation of improved outcomes in the directly affected markets;
- Wider societal and strategic benefits - these reflect other less tangible benefits such as externalities, political and other strategic benefits.
� The studies are directly linked to the services definitions that were applied at the time, and did not attempt to globalise the impacts in all cases;
� In carrying out the CBAs, the studies applied wide variations in methodologies, and many gaps in benefit estimation remained, due to the difficulties and uncertainties around many of the benefit areas that were identified. Despite these and other issues, the previous CBA studies provide a useful reference point for consideration as part of updating the benefit framework for the GMES programme as whole and in its current form;
� Much of the data used to quantify the impacts is limited in scope and geographic coverage, and has become dated;
� Each study provided an estimate of the efficiency savings that can be expected across each service line. The PWC study has attempted to aggregate this as part of its measure of Category 1 benefits. This equalled €162 million in 2012, growing to €312 million by 2030 (2005 prices), which is a small level of benefit when compared with the bigger Category 2 and 3 benefits.
Despite the limitations and other issues, the previous CBA studies provide a useful reference point for consideration as part of updating the benefit framework for the GMES programme as whole and in its current form. Importantly, these studies have provided useful background to the current study.

Booz & Company
Date: 19th September 2011 Cost-Benefit Analysis for GMES Final Version II
Prepared for: European Commission Directorate – Enterprise and Industry
87
However, as with the other recent progress in researching and modelling the potential impacts of EO systems, there are significant issues in reliably estimating benefits with any certainty. This view warrants the development of a simplified and transparent approach to benefit estimation for the purposes of the current GMES CBA.
6.5 RECENT DEVELOPMENTS IN ESTIMATING THE BENEFITS OF EARTH OBSERVATION
6.5.1 New EU Research Initiatives
Recognising some of the limitations in applying traditional approaches to benefit estimation, the Commission has supported an ambitious research agenda with the aim of developing new methodologies to support the appraisal of EO programmes and in particular GEOSS. This has included the funding of the “Global Earth Observation – Benefit Estimation: Now, Next and Emerging” (GEO-BENE) and EuroGEOSS projects under the Sixth and Seventh Framework Programmes.189
A main objective of the GEO-BENE Project was to develop methodologies and analytical tools to assess societal benefits of EO across a number of domains or defined Societal Benefit Areas (SBAs), including disasters, health, energy, climate, water, weather ecosystems, agriculture and biodiversity. The project was funded by the European Commission under the Sixth Framework Programme (FP6).190
EuroGEOSS is a follow-on project funded by the European Commission under the Seventh Framework Programme (FP7). The objective is aimed at demonstrating the added value to the scientific community and society of making existing systems and applications interoperable and usable within the GEOSS and INSPIRE frameworks.191
These projects represent a major effort to identify and quantify benefits in support of the EU’s international commitments to GEOSS and the large-scale investments that this carries using leading-edge research. McCallum et al. (2010) provides an overview of four overarching methodologies that encompass the many tools developed under these projects for the GEOSS benefits assessment. This includes the benefit chain concept, Bayesian decision theory, a real options framework, and systems dynamics modelling. Each of these methodologies has been used to demonstrate the benefits of GEOSS in one or more benefit areas.192
Of these methodologies, the benefits chain concept and the use of systems dynamics modelling are outlined below.
6.5.2 Application of the Benefit Chain Concept
The benefits chain concept provides a framework for evaluating the benefits and costs associated with a change in information. This concept is used to evaluate the extent to which the incremental benefits associated with improved information that would be provided through GEOSS outweigh the incremental costs.193
189 See GEO-BENE Deliverable D13 (T36) GEO-BENE FINAL REPORT, July 2006;
www.geo-bene.eu/files/Deliverables/GEO-BENE_D13T36_Final%20Report_no%20AnnexIII.pdf. 190 www.geo-bene.eu. 191 www.eurogeoss.eu. 192 I. McCallum et al., “Indentifying and Quantifying the Benefits of GEOSS”, Earthzine, July 2010.
www.earthzine.org/2010/07/12/identifying-and-quantifying-the-benefits-of-geoss/ 193 GEO-BENE Project, Deliverable D4 (T21), Methodology and Tools Report, 2007.

Booz & Company
Date: 19th September 2011 Cost-Benefit Analysis for GMES Final Version II
Prepared for: European Commission Directorate – Enterprise and Industry
88
A study by Fritz et al. (2008)194 identifies the minimum requirements to assess the benefit chain, acknowledging that a complete assessment of the full benefit chain for all observations and impacts is not practically achievable. It is argued that if the minimum requirements can justify GEOSS, then more elaborate assessments should only increase confidence in the results. These minimum requirements are outlined in the value chain in figure 6.2 below.
Figure 6.2: Minimum Requirements to Assess the GEOSS Benefit Chain
Source: Fritz et al. (2008); Booz & Company analysis.
Fritz et al. (2008) identified three case studies for the application of the benefit chain concept, which were derived during early stages of the GEO-BENE Project. Each of these case studies provided a picture of the value of GEOSS in delivering net benefits over the incremental costs of obtaining better EO data from various sources.
The first of these relates to the use of enhanced weather forecasts in fire management. Here the benefits related to the way better-calibrated and higher resolution satellite data, supported by in situ measurement networks, lead to a more targeted and efficient fire patrolling system. The second case study demonstrated the benefits of using finer scale data in conservation policy decision making (i.e. allocating land to conservation purposes). The third case study provided an example of using expert stakeholder consultation for assessing VOI in the context of the North Sea water quality case. A more detailed outline of these case studies is provided in table 6.2 below.
Table 6.2: Application of the GEOSS Benefit Chain Concept
Observation Effort Benefits Pathway and Estimation Benefit-Cost Result
1. Fire Control with Enhanced Weather Observations
194 Fritz, Steffen et al.: “A Conceptual Framework for Assessing the Benefits of a Global Earth Observation System of
Systems”, IEEE Systems Journal, Vol. 2, No. 3, September 2008.

Booz & Company
Date: 19th September 2011 Cost-Benefit Analysis for GMES Final Version II
Prepared for: European Commission Directorate – Enterprise and Industry
89
Observation Effort Benefits Pathway and Estimation Benefit-Cost Result
� Model for fighting fires in Portugal and Spain
� Nesterov Index is used to assess daily fire risk in combination with aircraft forest patrolling
� Incremental observation effort (i.e. the GEOSS scenario) stems from use of higher resolution satellite data
� Benefit pathway related to use of higher resolution data to optimise patrolling system
� Benefits include reductions in burnt area and lower patrolling costs
� Simulations estimate a reduction in burnt area by 21% and patrolling costs by 4%
� Costs are uncertain, but estimated to be in the order of €130,000 per year plus €2 million for one off algorithm to remove errors in the dataset
� Social benefits from 21% reduced burnt area expected to be very large
� Suggests incremental benefits are higher than costs
2. Improved Data for Conservation Planning
� Replacement of commonly available coarse global data with finer scale data as expected from GEOSS
� Used to make decisions about increases in land and water resources used for conservation
� Observation tools are required to identify priority areas in terms of distribution of biodiversity, threats and current conservation areas
� Benefit pathway relates to more accurate identification of priority conservation areas
� Coarse scale data led to 9% overestimate of priority areas
� Benefits estimation is complex – a simple approach is to apply a proxy for the opportunity cost of overestimate of conservation areas
� Calculating the costs associated with improved datasets is not straightforward, however available benchmarks were applied to derive an estimate over less than €5 million
� Cost of 9% overestimate (5 million hectares) would cost over €1.2 billion in one off costs with annual management costs of €57 million
� Under these assumptions, benefits significantly outweigh costs
3. North Sea Water Quality
� Current North Sea water quality monitoring is based on in situ measurements
� The GEOSS scenario would provide integrated remote sensing information that increases temporal and geographic availability
� Benefit pathway relates to the use of enhanced temporal and geographic coverage to predict algal bloom
� Benefit estimation relied on questionnaire sent to key decision makers, experts and stakeholders
� Answers indicated that better information makes it possible to transfer fishing nets preventively at 10% of damage costs (currently €20 million every five years)
� Bayesian Decision Theory used to calculate value of early warning system
� Using assumption of 2% probability per week of harmful algal blooms (and 10% type II error), the value of the warning system would be €74,000/week (less than the cost of the system)
� Outcomes strongly depend on accuracy of information and variance of expert/stakeholder views
� 20% type II error reduces VOI to zero
Source: Fritz et al. (2008); Booz & Company analysis
While the case studies highlight the potential value of GEOSS, they also raise an important issue for GMES. A key observation is that the cost estimates appear to relate only to the incremental cost of obtaining satellite data (where satellite data is used) and do not include an allocation of the fixed costs (i.e. infrastructure costs, etc.). This study is required to consider all cost elements when calculating the net benefits of GMES.
Another issue relates to the partial nature of the case studies, and the difficulties in identifying whether the improvements in EO capability assumed map directly onto the

Booz & Company
Date: 19th September 2011 Cost-Benefit Analysis for GMES Final Version II
Prepared for: European Commission Directorate – Enterprise and Industry
90
capability provided by GMES. As such, it is difficult to translate the results of this analysis directly into this CBA of GMES.
6.5.3 Systems Dynamics Modelling
A more complete approach to identifying and quantifying the benefits of GEOSS is provided through the application of systems dynamics models. Developing such a model and carrying out simulations of different EO scenarios was a main output from the GOE-BENE project and is being continued and refined as part of EuroGEOSS. This work included the development of a systems dynamics model, FeliX (Full of Economic-Environment Linkages and Integration dX/dt), which can be used to test the potential impacts of GEOSS.
Figure 6.3: FeliX Model Overview
Source: GEO-BENE Deliverable D10(T30) - Draft GEO-BENE Synthesis Report.
The benefit of systems dynamics modelling is that it recognises the complex interdependencies between the Earth’s various social, economic and environmental subsystems. Under this approach, a series of interrelated systems models are connect via a series of feedback loops, such that changes in one model or subsystem has consequences for other subsystems.
The FeliX model represents these relationships at a global level, with subsystems models representing various relationships for and between production and consumption variables including, land, energy, the development of technology, the economy, population and the carbon cycle, etc. A high level representation of the sub-models and interrelationships in the FeliX model is shown in the figure above. Under this approach, each of the GEOSS SBAs have been embedded into the model’s subsystems. Stocks (e.g. population, knowledge) and

Booz & Company
Date: 19th September 2011 Cost-Benefit Analysis for GMES Final Version II
Prepared for: European Commission Directorate – Enterprise and Industry
91
flows (e.g. birth and death rates, learning and forgetting, etc.) are modelled through causal relationships and crucial feedback loops to establish linkages between each of the key sectors of a global socio-economic and environmental system.195
The model represents these causal relationships and linkages at a global level and the model has been calibrated using 100 years of statistical data. This data reveals that there are relatively stable long-term relationships between the key variables that have been included in the model. The model can then forecast changes in production and consumptions under a base scenario (i.e. with no change to GEOSS capability) and a set of scenarios that assume various enhancements to GEOSS that support an improved output in the model’s subsystems.
A FeliX model simulator is publicly available on the GEO-BENE website.196 A version of the simulator was also provided to Booz & Company. The assumptions that underpin each of the scenarios that can be modelled using the simulator are provided in table 6.3. Each scenario includes a set of impact assumptions regarding the way in which GEOSS can improve the outcomes in each sector. These are impacted through the simulator to evaluate the impacts on the various stocks and flows and can report on outcomes for key variables such as gross world product (GWP), population, energy consumption, emissions, etc.
Table 6.3: GEOSS Scenarios in the FeliX Model Simulator
Scenario Explanation of GEOSS Impact
Energy
� Improved geological surveys and modelling of reservoirs, increasing oil discovery and production. Better use of GEOSS data to improve risk management and process integrity
� Improved surveys for better planning of gas production operations, also improvements to risk management and process integrity
� Enhanced planning (including locating and commissioning) of solar energy installations. GEOSS data also improves dealing with unit commitment problem of delivery of electricity to market, thus enhancing solar energy competitiveness
� Enhanced planning (including locating and commissioning) of wind energy installations, and better integration into electricity grid. GEOSS data also improves dealing with unit commitment problem of delivery of electricity to market, thus enhancing wind energy competitiveness
� Better use of GEOSS enhances locating and commissioning of biomass power plants including planning for optimised logistics.
� Better mapping of carbon capture and sequestration (CCS) sites, and better monitoring of leakages. Better long term modelling of CCS leading more efficient design of CCS processes
� Better forest management practices including pest and disease control, and measures such as fertilisation, thinning and final harvesting
� Better crop management practices including planting and scheduling harvesting, pest and disease management, plant stress management through irrigation and precision farming. This includes through better global coordination of production scheduling
Disaster � Better forest management practices including fire management � Better preparedness to support rapid response to disasters and limit mortality and morbidity
Health � Better data delivered by GEOSS and the improved use of data has the potential to improve disease prevention and response (e.g. shortening time period for provision of emergency support to heart
195 Each sector is represented using a model module that is based on widely accepted modelling structures. For example, the
economy model is based on neo-classical growth theory that separately considers capital accumulation and labour, and includes factors to capture their levels of productivity. As another example, world population is modelled as an ageing chain. Linkages between the models are provided via feedback mechanisms. For example, climate change and its impacts are represented in the economy model, etc.
196 www.geo-bene.eu/?q=node/2067.

Booz & Company
Date: 19th September 2011 Cost-Benefit Analysis for GMES Final Version II
Prepared for: European Commission Directorate – Enterprise and Industry
92
Scenario Explanation of GEOSS Impact
attack victims). The greatest potential GEOSS impact is viewed to be in heart diseases, strokes, as well as in malaria, diarrheal diseases, meningitis, etc.
Climate
� Additional impact of GEOSS relates to a decrease of forest calamities due to fire, diseases, storms, etc. on forest fertility associated with climate change only
� CO2 fertilisation leads to higher plant growth (wood forest, crops, grassland). The gross fertilisation effect is estimated to be reduced by other plant stresses, in particular droughts. GEOSS will support reduction of these stresses such that more net fertilisation can occur
� GEOSS used to support reduction in mortality to severe weather events linked to climate change
Agriculture
� Better crop management practices including planting and scheduling harvesting, pest and disease management, plant stress management through irrigation and precision farming. This includes through better global coordination of production scheduling
� Reduction in harmful effects of artificial fertilisation. Also has the potential to reduce soil degradation due to salination, erosion and soil nutrient depletion, as well as soil carbon depletion and degradation related to reduced water holding capacity. Better planning for soil protection measures.
� Supports targeted plant breeding according to biophysical indicators such as soil-climate conditions (e.g. sugar cane breeding in Brazil, where 300 sugar cane varieties were optimised). GEOSS delivers potential to support these programmes on a global scale, bringing benefits including enhanced drought resistance, better yields, etc.
Water � Better water use management planning and technological change in irrigation due to water stress
monitoring
Source: GEO-BENE Deliverable D10(T30) - Draft GEO-BENE Synthesis Report.
The extent of the impact of GEOSS has been estimated based on GEO-BENE research and consultation with subject matter experts.197 Assumptions have been derived from this work and embedded into the various subsystems models and feedback relationships.
Rydzak et al. (2010) provides an overview of efforts by the GEO-BENE Project to combine each of these scenarios into a wider impact assessment of GEOSS across each of the SBAs.198 Based on outputs from the FeliX model and simulator, the study reports the impacts of a combined GEOSS scenario on global population, death rate, income and emissions. The results of these model runs are presented in the figure 6.4 below.
197 BENE Deliverable D10(T30) - Draft GEO-BENE Synthesis Report. 198 Rydzak, F., Obersteiner, M. and Kraxner, F.: “Impact of Global Earth Observation – Systematic view across GEOSS Societal
Benefit Areas”, Internaltional Journal of Spatial Data Infrastructures Research, Vol 5, 2010.

Booz & Company
Date: 19th September 2011 Cost-Benefit Analysis for GMES Final Version II
Prepared for: European Commission Directorate – Enterprise and Industry
93
Figure 6.4: FeliX Model Impacts of All GEOSS Scenarios on Population, Income and Emissions
Source: Rydzak et al. (2010); Personal Communication from F. Rydzak 3 June 2011; Booz & Company analysis.
The results of this modelling reveal a series of interesting dynamics across the population, economy and emissions modules. For example, the results are showing are significant reduction in global population over the model period compared to the base model run. Population in the model varies with changes in the birth and death rate. As the death rate is shown to also reduce, this suggests that the birth rate must also decline significantly,
The study reports that the main reasons for the decline in the death rate include:
� Increased food availability, with GEOSS enabling better crop management through improved planting and harvesting scheduling; and
� Improved warning and mitigation of disasters, with GEOSS enabling better information to prepare and respond to major events.
The change in the birth rate is reported to relate to socio-economic factors, including the increase in the older-age population and improvements in income levels. The presentation of the results shows that average per capita incomes increase by up to around USD 450. Given the size of the global population, this represents a significant increase in GWP. For example, with world population forecast in the FeliX model to reach 7.6 Billion by around 2030, an increase in per capita GWP of this nature translates into almost USD 3.5 trillion!
The potential impact of GEOSS on emissions is another important result. Under the modelled scenarios, GEOSS enables better CCS mapping and monitoring of leakages. It also improves the modelling of long term sequestration effects such as CO2 absorption by rock, leading to a more efficient CCS process. As such, the model results show a significant reduction in global CO2 emissions over the model period, although the dynamics are such that these reductions are only temporary and all but disappear by 2050. The peak of the reduction is modelled to occur around 2030, with CO2 emissions reduced by around 1.3 Billion tonnes. And the accumulated reduction over the model period is around 23 Billion tonne of CO2.

Booz & Company
Date: 19th September 2011 Cost-Benefit Analysis for GMES Final Version II
Prepared for: European Commission Directorate – Enterprise and Industry
94
These are very large numbers in the context of climate change debate and the potential benefits that can be achieved through climate change mitigation strategies. As such, when the results are combined with published measures of the social cost or shadow price of carbon, this translates into very large economic benefits. For example, by assuming a cost of carbon of €30 per tonne, this reduction generates around €40 Billion in economic benefits in a single year!
The results of the system dynamics modelling efforts by the GEO-BENE Project demonstrate the potential benefits of enhanced EO infrastructure, and it provides support to the findings that there are a range of potential socio-economic benefits that can be attributed to GMES. However, there are some issues that limit the specific applicability of the results for the current GMES CBA. These are elaborated below:
� As noted, the extent of the impact of GEOSS has been estimated based on GEO-BENE research and consultation with subject matter experts. In many respects, this approach is not overly different from that applied in the GMES benefits study conducted by PWC.199 However, in the case of the FeliX model, the judgements about the potential impacts of enhanced EO capability and the behavioural changes that it may create are nested within a series of interrelated production and consumption models. This is an important consideration for the interpretation of results, as many of the outcomes cannot be validated against real world situations;
� When analysing the results from FeliX in the context of a GMES benefits assessment, another important consideration is that the GEOSS scenarios represent a mix of potential impacts of GEOSS that are facilitated through the various levels of EO infrastructure (i.e. space and in situ) that is provided on a global basis. It is not possible to directly map these scenarios onto the services that are envisaged for GMES. However, many of the assumptions underpinning the scenarios are closely aligned with some aspects of GMES services;
� The extent of the impacts of the full GEOSS scenario is largely driven by the assumed impacts of GEOSS in CCS. This suggests a significant change in energy policy but this has not been explicitly modelled;
� The base model run includes a very large reduction in global CO2 emissions that would likely require binding global commitments to GHG reductions to be in place. It is not clear whether the assumptions on emissions reductions and potential impacts on other sectors (e.g. economic productivity) are sustainable; and
� The model is based on high level global data and causal relationships. It is not clear whether historic relationships will sustain in an increasingly globalised world, with the potential for large changes due to climate change.
6.6 CONCLUSIONS FOR THE GMES CBA
GMES represents a major European effort to enhance our understanding of Earth science and a range of complex environmental systems. In this context, the main benefit of GMES will be the VOI it provides to support policy action and resource management across the EU and further afield.
199 PriceWaterhouseCoopers, A socio-economic Benefits Analysis of GMES, 2006.

Booz & Company
Date: 19th September 2011 Cost-Benefit Analysis for GMES Final Version II
Prepared for: European Commission Directorate – Enterprise and Industry
95
The VOI depends on a number of factors regarding the circumstances of decision makers, including the level of uncertainty that they face, what is at stake, the cost of using information, and the cost of the next-best information substitute. The larger the degree of uncertainty and what is at stake, then it follows that information can also have a large value. However, a high cost of obtaining and using the information and its substitutes tends to reduce VOI. Another important consideration in this context is the ability of individuals to act on the information they receive. If there are limited options available, then information will have less value.
The context for GMES displays a number of these countervailing characteristics. For example, with respect to climate change, the degree of uncertainty surrounding the expectation of catastrophic climate events is large, and there is a significant amount at stake for society as a whole. However, the cost of using information is also significant, and involves the coordination of multiple actors in a complex socio-political landscape.
A review of academic literature supports the view that there is inherent value in information derived from EO systems. There are valid reasons to suggest that extent of the VOI is incremental. Recently, a number studies have adopted a simplified approach to estimating benefits across a number of activity areas that are connected to a particular EO system. This approach is preferred when information regarding users’ willingness to pay for better information is not known. In fact, there is no detailed information available in this respect. It is therefore recommended that the GMES CBA follows those recent studies that have assumed that the VOI across each activity area is incremental, and equal to 1% of output. This is recognised as a conservative assumption in the context of the reviewed studies.
There are limitations in applying traditional cost-benefit frameworks for programmes like GMES where the main driver of value is information and there are many levels of action required that make the uptake of services by users uncertain. To support previous GMES funding decisions, there have been various previous GMES benefit studies that have attempted to value the impacts of GMES using traditional cost-benefit approaches. These studies have relied on expert and stakeholder judgment to derive assumptions on the VOI that GMES can provide across each policy area. For example, the recent cross-cutting study by PWC assumed a wide range of values regarding the VOI from GMES was applied, from as low as 0.1% in the case of climate change (adaptation), to as much as 10% in some areas (e.g. illegal fishing). In a number of cases a value of 1% is applied. These results provide a useful validation point for the current study, although the basis for ascribing different values to each policy area is difficult to verify.
In recognition of some of uncertainties around valuing EO systems, the Commission supported an ambitious research agenda with the aim of developing new methodologies for valuing the benefits of GEOSS. A systems dynamics approach of simulating the impacts of a comprehensive GEOSS scenario has demonstrated that the impacts of enhanced EO capability could be very large. The results of this work validate other studies that attribute very high economic value to obtaining perfect information when uncertainty about climate sensitivity is high.
This chapter highlights some important lessons for the GMES CBA framework. GMES has the potential to deliver significant economic value through enhanced EO information, but the analysis should be consistent with academic literature and ensure that the VOI attributed to GMES is incremental. Based on this, an incremental value of 1% is reasonable, although sensitivity tests using a range with higher values reflecting the very large risks with climate change is justified. Given the difficulties in ascribing different values to each policy, this

Booz & Company
Date: 19th September 2011 Cost-Benefit Analysis for GMES Final Version II
Prepared for: European Commission Directorate – Enterprise and Industry
96
value should be applied across the GMES portfolio of affected activity areas. In addition, the assessment of benefits should be linked to the definition of the services and their development through the various pre-operational funding initiatives.

Booz & Company
Date: 19th September 2011 Cost-Benefit Analysis for GMES Final Version II
Prepared for: European Commission Directorate – Enterprise and Industry
97
7. APPROACH FOR QUANTIFIED COST-BENEFIT ASSESSMENT
7.1 INTRODUCTION
This chapter outlines the approach for quantifying the four GMES investment options that are covered by the study. In line with findings of the previous chapter, the approach builds a consistent and transparent benefit assessment framework. It combines an understanding of potential benefits and the infrastructure (space and in situ) and services that support the realisation of those benefits.
Furthermore, modelling assumptions need to be developed for estimating the impact of GMES. These assumptions need to address timing (e.g. when services are operational and the build-up period before benefits fully materialise), the level of actual benefits realised (e.g. the degree to which service guarantee and level of investment in developing and promoting services impacts), the programme itself (e.g. infrastructure capability and availability), and most importantly the explicit level of impact that is being placed on the value of information provided to decision makers and market actors.
The key issues are addressed according to the following structure:
� Options;
� Services;
� Programme costs;
� Benefit assessments; and
� Modelling assumptions.
7.2 OPTIONS
The cost benefit analysis is performed for the following four options200:
� Option A – Baseline Option (no continuity for the Sentinel Missions, and no guarantee of continuity for all Contributing Missions);
� Option B – Baseline Option Extended (extended continuity for Sentinel Missions, but no guarantee of continuity for all Contributing Missions);
� Option C – Partial Continuity (full continuity of Sentinel Missions, with limited support for the continuity of data from Contributing Missions); and
� Option D – Full Continuity (full continuity for Sentinel Missions and enhanced support for the continuity of data from Contributing Missions).
Option A – Baseline Option. In this option, historic (pre-2014) investment in developing space infrastructure (by ESA Member States) is put to fruition by a comparatively small additional investment in completing development, launching and operating the already committed infrastructure. No new developments (R&D) are started on the space component. There is no long-term service availability guarantee for Sentinel Missions or Contributing Missions.
200 No baseline (or ‘Do Nothing’) option has been assessed, i.e. an option where funding of the programme would cease after
2013.

Booz & Company
Date: 19th September 2011 Cost-Benefit Analysis for GMES Final Version II
Prepared for: European Commission Directorate – Enterprise and Industry
98
Under this option, the EU would finance the provision of operational services, but would not invest in major upgrades of the services or infrastructure. As a result, services could be provided for a limited period of time and with progressively greater restrictions once the infrastructure begins to expire.
In the space component, the EU would assume responsibility for the exploitation of space infrastructure currently developed by ESA (the first two units of the first generation of Sentinels), and access to data from other space missions already existing and committed at national or European level (i.e. the "Contributing Missions"). The EU would not invest in the construction of recurrent units (i.e. replication of existing prototypes needed e.g. to improve frequency of observations), nor the design and development of the next generation of space infrastructure.
For the in situ component, the EU would contribute to co-ordination activities.
The basic scenario does not exclude limited investment in smaller research projects financed under FP7, but no major EU investment in service evolution and renewal of existing space and in situ infrastructure would take place.
Option B – Baseline Option Extended. Beyond putting past developments to fruition as in option A, recurrent duplicates of the Sentinel Missions are built, launched and operated. This scenario allows a longer exploitation period whilst minimising expenditure on infrastructure (due to lower prices of the recurrent units compared to the development of new missions). No upgrade of the space infrastructure is made (no 2nd and future generations) and no expansions are considered for meeting new observation requirements. Although services are extended, there is no long-term service availability guarantee.
Under this option, the EU would finance service provision and service upgrades on a limited scale. In the space component, the EU would not only finance the exploitation of the prototype satellites and instruments currently developed, but also of recurrent units. The EU would increase its investment in the in situ component under this option. As a result, the services provision could cover a longer period, but without guarantee of long term continuity of the full range of services.
This option corresponds to a large extent to the option 2 of the Impact Assessment accompanying the Communication ‘GMES: Challenges and Next Steps for the Space Component’.201
Option C – Partial Continuity. This is Option B extended, with upgrades and long-term availability of the full Sentinel space component guaranteed, (i.e. continuous replacement of Sentinel missions, but within a scope that remains fixed over time).
Under this option, the EU would assure that the objective of long-term availability of Sentinel data is ensured. However, there is only limited support for the continued availability of data from Contributing Missions. No upgrade of the space infrastructure is made (no 2nd and future generations) and no expansions are considered for meeting new observation requirements. The EU would continue to increase its investment in the in situ component.
Option D – Full Continuity. Option C expanded to fully guarantee data availability from Sentinel Missions and to provide enhanced support for the continuity of data from Contributing Missions. Under this option, the EU would assure that the objective of long-
201 See, in particular Section 5.3.4 of the Impact Assessment.

Booz & Company
Date: 19th September 2011 Cost-Benefit Analysis for GMES Final Version II
Prepared for: European Commission Directorate – Enterprise and Industry
99
term availability of all significant data is maintained to the full extent as possible with allocated funding. This may be realised through replacing Contributing Missions with new Sentinel Missions, or by supporting the continuation of Contributing Missions. No upgrade of the space infrastructure is made (no 2nd and future generations) and no expansions are considered for meeting new observation requirements. The EU would further increase its investment in the in situ component.
Each of the above options is regarded as being discrete. Option A is the option with lowest costs. The incremental value of additional spending can be assessed by comparing Options B, C and D to Option A. The net impact (i.e. incremental benefits less costs) represents the GMES added value of each option. The value added component is the additional benefit of the EU intervention and expenditure.
Under each option, the EU coordinates and funds through investments:
� The provision of operational GMES services;
� The provision of the dedicated space component infrastructure (satellite recurring units, etc.);
� The in situ components; and
� Data access from and potential wider support to Contributing Missions.
Table 7.1 below provides a summarised version of how to approach the incremental aspects across each option.
Table 7.1: Key Considerations
Space Component In situ Component Service Component
� Satellites R&D � Satellite procurement � Satellite Launch � Ground segment / Satellite
Operations � Data procurement from
Contributing Missions
� In situ coordination � In situ contribution � In situ data support
� Service development � Service upgrades � Service provision
Source: Booz and Company Analysis.
7.3 GMES SERVICES AND FORESEEN OPERATIONS
7.3.1 Approach
Appendix C provides a detailed analysis of GMES services and their potential operational readiness from 2014. The analysis provides an important reference point for the cost-benefit analysis. Fully operational GMES services are a requirement for wider socio-economic benefits. Having established a 2014 baseline for operational GMES services, it is possible to develop a profile of how services may develop during the following period. The analysis shows that for Marine, Land, Emergency, Atmosphere and services for security applications, operational capacities are assumed to be in place for year-on-year service continuity from 2014. The position for climate change is slightly different. Although the service has benefited (and will continue to do so in 2012) from R&D investment under FP7, it is not foreseen to be operational in 2014. Therefore, a period of additional build-up activities will be required

Booz & Company
Date: 19th September 2011 Cost-Benefit Analysis for GMES Final Version II
Prepared for: European Commission Directorate – Enterprise and Industry
100
post-2013 in order for the service to arrive at operational maturity. Key assumptions are summarised in the subsequent tables.
7.3.2 Operational Services from 2014
Table 7.2 below illustrates the progressive development of services for Emergency Management, and the projected service taxonomy from 2014. All services are operational from 2015.
Table 7.2: Emergency Management: Funding and Service Development
Service areas 2009 2010 2011 2012 2013 2014 2015 2016 +
Preparedness / Prevention SAFER SAFER SAFER GIO / FP7
2012 GIO / FP7
2012 Operations Operations Operations
Emergency Response SAFER SAFER SAFER GIO GIO GIO Operations Operations
Recovery SAFER SAFER SAFER GIO / FP7 2012
GIO / FP7 2012 Operations Operations Operations
Additional (Refugee / IDP Camps)
SAFER SAFER SAFER GIO / FP7 2012
GIO / FP7 2012 Operations Operations Operations
European Flood Alerts GIO GIO
GIO (unconfirm
ed) Operations Operations
Source: Booz and Company Analysis.
Analysis of Land services (see table 7.3 below) shows that several of these are sufficiently developed to become fully operational in 2014.202
Table 7.3: Land: Funding and Service Development
Service areas 2009 2010 2011 2012 2013 2014 2015 2016 +
Loca
l
Urban Atlas DG REGIO DG REGIO DG REGIO DG REGIO203
DG REGIO* Operations Operations Operations
Other Hotspots and Biodiversity
GIO* Operations Operations Operations
Con
tinen
tal
Pan-EU Land Cover geoland2 geoland2 geoland2 /
GIO geoland2 /
GIO GIO* Operations Operations Operations
Glo
bal Bio-
geophysical Parameters
geoland2 geoland2 geoland2 geoland2 / GIO GIO* Operations Operations Operations
Land Carbon Monitoring geoland2 geoland2 geoland2 geoland2 Operations Operations Operations Operations
Global Crop Monitoring geoland2 geoland2 geoland2 geoland2 Operations Operations Operations Operations
202 Several other services were part of the geoland2 project, but they have not been taken forward post 2012. See Appendix C
for further analysis. 203 In all funding tables which follow, an asterisk denotes that the element / funding source is unconfirmed, though expected.

Booz & Company
Date: 19th September 2011 Cost-Benefit Analysis for GMES Final Version II
Prepared for: European Commission Directorate – Enterprise and Industry
101
Service areas 2009 2010 2011 2012 2013 2014 2015 2016 +
Natural Resource Monitoring in Africa
geoland2 geoland2 geoland2 geoland2 Operations Operations Operations Operations
Forest Monitoring
geoland2 / ESA GSE
Forest Monitoring
geoland2 / ESA GSE
Forest Monitoring
geoland2 / ESA GSE
Forest Monitoring
geoland2 / ESA GSE
Forest Monitoring
Operations Operations Operations Operations
Access to Geospatial Reference Data
PrepAct PrepAct PrepAct GIO Operations Operations Operations
Source: Booz and Company Analysis.
Table 7.4 below shows that five Marine services are fully operational by 2015. They have been developed predominantly through the MyOcean project. They provide an integrated suite of ocean monitoring and forecasting products, the service produces multi-purpose information on the physical state of the ocean and on marine ecosystem characteristics.
Table 7.4: Marine: Funding and Service Development
Service areas 2009 2010 2011 2012 2013 2014 2015 2016 +
Marine Safety MyOcean MyOcean MyOcean MyOcean / MyOcean
II
MyOcean-II
MyOcean-II Operations Operations
Marine Resources MyOcean MyOcean MyOcean MyOcean / MyOcean
II
MyOcean-II
MyOcean-II Operations Operations
Marine and Coastal Environment
MyOcean MyOcean MyOcean MyOcean / MyOcean
II
MyOcean-II
MyOcean-II Operations Operations
Climate and Seasonal Forecasting
MyOcean MyOcean MyOcean MyOcean / MyOcean
II
MyOcean-II
MyOcean-II Operations Operations
Sea Ice Information and Forecasts (ICEMAR)
PrepAct PrepAct PrepAct Operations Operations Operations
Source: Booz and Company Analysis.
Atmosphere services that are assumed to be developed to fully operational services are detailed in table 7.5 below. They provide services addressing European air quality as well as services that contribute towards improved understanding of global climate.
Table 7.5: Atmosphere: Funding and Service Development
Service areas 2009 2010 2011 2012 2013 2014 2015 2016 +
European Air Quality MACC MACC MACC MACC-II MACC-II MACC-II Operations Operations
Global Atmospheric Composition
MACC MACC MACC MACC-II MACC-II MACC-II Operations Operations
Climate Forcing MACC MACC MACC MACC-II MACC-II MACC-II Operations Operations

Booz & Company
Date: 19th September 2011 Cost-Benefit Analysis for GMES Final Version II
Prepared for: European Commission Directorate – Enterprise and Industry
102
Service areas 2009 2010 2011 2012 2013 2014 2015 2016 +
UV Radiation and Solar-Energy Resources
MACC MACC MACC MACC-II MACC-II MACC-II Operations Operations
Air Quality Alerting (ObsAIRve)
PrepAct PrepAct PrepAct Operations Operations Operations
Source: Booz and Company Analysis.
Unlike the GMES services for the land, marine and atmosphere domains, there is no large FP7 project scheduled to follow up the suite of services developed for the security domain under G-MOSAIC. However, there is some indication that a number of services will be launched in the next couple of years under targeted FP7 projects. These have all been assumed to become operational by 2016 as shown in table 7.6 below.
Table 7.6: Services for Security applications: Funding and Service Development
Service areas 2009 2010 2011 2012 2013 2014 2015 2016 +
EU External Action FP 7 2012* FP 7 2012* FP 7 2012* Operations
Maritime Surveillance FP 7 2010 FP 7 2010 FP 7 2010 Operations Operations Operations
Border Surveillance FP 7 2012* FP 7 2012* FP 7 2012* Operations Operations
Source: Booz and Company Analysis.
Finally, the analysis has demonstrated climate change services are relatively immature, with no services currently expected to become operational by 2014. This is illustrated in table 7.7 below. However, it should be emphasised that there is a service coordination action under FP7 that supports coordination efforts in other GMES service domains, including climate-related projects towards enabling the monitoring of ECVs (Essential Climate Variables) from the data and parameters available in those services. In relation to climate services, it is assumed that a period of additional build-up activities will be required post-2014 in order for the service to arrive at operational maturity. It is therefore expected that climate change services will be making a significant contribution in the near term.
Table 7.7: Climate Change: Funding and Service Development
Service areas 2009 2010 2011 2012 2013 2014 2015 2016 +
Service Coordination
FP 7 2012 (Space) -
unconfirmed
FP 7 2012 (Space) -
unconfirmed
Local Climate Services
FP 7 2012 (Environm
ent)
FP 7 2012 (Environm
ent)
FP 7 2012 (Environm
ent)
Local Climate Information in the Mediterranean
FP 7 2012 (Environm
ent) - unconfirme
d
FP 7 2012 (Environm
ent) - unconfirme
d
Source: Booz and Company Analysis.

Booz & Company
Date: 19th September 2011 Cost-Benefit Analysis for GMES Final Version II
Prepared for: European Commission Directorate – Enterprise and Industry
103
The overall expectation for a future operational GMES Climate Change service is that it will coordinate the integration and synthesis of climate-relevant outputs from the other GMES services. Rather than developing and providing its own services directly, the focus of this “meta-service” will be to oversee efforts enabling the monitoring of ECVs from the data and parameters available in other services (primarily Atmosphere, Land Monitoring and Marine Environment). It is the expectation that the collection and dissemination of climate information is carried out at a level of detail to support the development of an enhanced understanding of climate change. In addition, in steering the collation of this information and associated analysis, and to promote the role of GMES, it is foreseeable that the service could produce a high-level document (in a similar vein to the IPCC’s Assessment Reports) summarising GMES contributions to climate change research, at a level of abstraction appropriate for dissemination amongst policy-making circles.
7.4 PROGRAMME COSTS
Programme costs for each option are based on information provided by the EC.204 These have not been reviewed and validated as part of the study. Costs cover the following four elements:
� Space Component, i.e. construction, launch, operations and access to Contributing Missions;
� In-situ component, i.e. coordination, contribution and support;
� Service component, i.e. each of the six GMES services; and
� Take-up of services by users, i.e. development of downstream services.
Costs provided by the EC cover the average spend per annum over the time period 2014 – 2020. Supporting cost information such as ESA’s Long Term Scenario document has been used to create a profiling of costs during the initial period to 2020, and for information about the level of spending after 2020. In situ relates to data coming from non-space infrastructure and is assumed to remain constant over time. Service costs provide the basis for establishing GMES services on a sustainable basis. Services already under development (Land, Marine, Emergency and Atmosphere) remain constant at the level suggested for 2014 – 2020 in each of the four options. However, in the case of GMES services for Climate and Security, it is assumed that spending will increase gradually over the 2014 – 2020 time period, but remain constant at the 2020 level for 2021 – 2030.
The table below summarises the reference case for the annual average 2014 – 2020 costs. However, in the assessment all costs are increased in line with real GDP growth (pricing effect). This leads to slightly higher cost values being applied in the cost-benefit analysis.
204 ‘Definition of GMES Implementation Scenarios 2014+ as Inputs for the Cost Benefit Analysis’. Supporting documentation
has also been provided by ESA/PB-EO(2010) 69, 10 May 2010, ‘Long Term Scenario of the GMES Space Component’; the ECORYS report ‘GMES in situ cost assessment’, Business Deliverable 3 (Final Version) for the European Environment Agency (EEA); and in relation to services the BOSS4GMES report ‘D444-4 – Report on GMES-wide Business Model’, 31st November 2009.

Booz & Company
Date: 19th September 2011 Cost-Benefit Analysis for GMES Final Version II
Prepared for: European Commission Directorate – Enterprise and Industry
104
Table 7.8: Average Spend per Annum 2014 – 2020, € million, 2010 Prices
Cost Components Option A Option B Option C Option D
Space component 180 370 500 600
In-situ component 10 20 30 50
Service component 65 80 100 150
Total GMES 255 470 630 800
Competitiveness and Innovation Framework Programme (CIP)205
20 20 30 50
Total EU 275 490 660 850
Source: European Commission; Booz & Company analysis.
The proposed annual spend profile for the space component is illustrated in figure 7.1 below, with all values increased to allow for real cost escalation. This explains the gradual increase year-on-year in Options C and D.
With the exception of Option A, there is a generally year-on-year increase in spending during the period to 2020. Spending reaches its peak around 2020, with annual spending slightly lower during the 2020s as the programme moves towards a steady state in Options C and D. In Option A, there is no expenditure after 2025 when the last Sentinel mission goes out of service. Option B costs are also gradually reduced during the 2020s, but the funding of one replacement cycle means that the programme does not come to an end before the early 2030s.
Figure 7.1: Cost Projections for Space Component, € Million, 2010 Prices
Source: Booz & Company analysis.
The figure below presents total costs for the programme on an annual basis. In option D, total annual costs are around €1.2 billion per annum, with option C at around €1 billion per annum. Options A and B are both significantly lower.
205 Expenditure associated with supporting service take-up is funded through CIP.

Booz & Company
Date: 19th September 2011 Cost-Benefit Analysis for GMES Final Version II
Prepared for: European Commission Directorate – Enterprise and Industry
105
The difference between Options C and D is the additional costs associated with providing additional support to enhance the continuity of data that is expected to come from the planned Contributing Missions, and a step-up in service related costs for climate change.
Figure 7.2: Cost Projections for All Components, € Million, 2010 Prices
Source: Booz & Company analysis.
A summary of total costs for each option is provided in table 7.9. It represents the costs that benefits will be compared against in the cost-benefit analysis.
Table 7.9: Costs by Period and in Total, € Million, 2010 Prices
Options 2014 - 2020 2021 - 2030 Total (undiscounted) Total (discounted)
Option A 2,054 805 2,859 2,050
Option B 3,669 3,185 6,854 4,570
Option C 4,969 9,869 14,838 9,072
Option D 6,384 12,372 18,757 11,508
Source: Booz & Company analysis.
The above table shows that total (undiscounted) costs are between €2.9 billion and €18.8 billion for the programme during 2014 – 2030 depending on the option. Cumulative discounted costs for the different options are between €2.1 billion and €11.5 billion.
The following Figure 7.3 provides a breakdown of the Option D costs. The figure illustrates how the original costs values for 2014 – 2020 and 2021 – 2030 are adjusted to take account of real price escalation (2% annum) and discounting (4% per annum).
From the figure it is possible to see the total discounted value of €11.5 billion (Option D), and the value for each of the four cost categories (space, in situ, services and take-up). These are €8.4 billion, €0.6 billion, €1.9 billion and 0.6 billion respectively.
Total undiscounted costs represent €15.7 billion for the whole period from 2014 – 2030, with €11.5 billion (space), €0.9 billion (in situ), €2.6 billion (services) and €0.9 billion (take-up). The total value is split between €6 billion for 2014 – 2020 and €9.8 billion for 2021 – 2030.

Booz & Company
Date: 19th September 2011 Cost-Benefit Analysis for GMES Final Version II
Prepared for: European Commission Directorate – Enterprise and Industry
106
Allowing for an annual real price increase in costs of 2%206, the total cost estimate for the programme is increased to €18.8 billion for the whole period from 2014 – 2030. This represents an increase of €3.1 billion (€18.8 billion less €15.7 billion).
However, in discounted terms, the €18.8 billion is worth only €11.5 billion in 2010, i.e. taking account of the time value of money. The effect of applying the 4% per annum discounting effect is therefore €7.2 billion (€18.8 billion less €11.5 billion).
Figure 7.3: Breakdown of Option D Costs, € Million, 2010 Prices
Source: Booz & Company analysis.
Under Options C and D there is a significant amount of R&D taking place. This has been identified through ESA’s Long Term Scenario document and will be used as part of the assessment of wider economic benefits arising from investments in the space sector. ESA has identified R&D as being around 35% of total space costs. In Options A and B, R&D activities are very limited as they are focused on launching and operating satellites already under construction, or simply a like-for-like replacement of these. However, across all options there are service costs that could be characterised as R&D, in particular when these are addressing development of services such as those in the climate and security areas (as neither of these exists today).
7.5 BENEFIT ASSUMPTIONS
7.5.1 General Approach
In quantifying benefits associated with GMES services, it is necessary to address the following issues:
� GMES contribution, i.e. what impact will GMES have in supporting policymakers in reducing baseline environmental and social damage costs;
206 Discounting follows the principle below, with PV = present value, cost = the cost value in year n, i = discount rate and n =
the future year.
( )
+= nn
ixCostPV
1
1
Similarly, costs are escalated over time following the principle of applying a pricing factor of (1 + i)n to the cost base in a given year, with i = to the relevant price factor (in this case 2%) and n = the relevant future year.

Booz & Company
Date: 19th September 2011 Cost-Benefit Analysis for GMES Final Version II
Prepared for: European Commission Directorate – Enterprise and Industry
107
� Contributions from different GMES data sources, i.e. Sentinels, Contributing Missions and in situ, and how the availability of data impacts benefits over time;
� Operational readiness of the applicable GMES services, i.e. from which year are services operational and able to provide benefits, and the likely take-up period before
the expected benefit impacts materialise fully, i.e. how do benefits build-up in the years following the commencement of the service.
The last point, for example, addresses the situation where a service may be operational, i.e. can be used, but Member States or other authorities have not started using the service, or in cases where a longer lead time is required before useful conclusions can be drawn. The latter could, for example, be in the case of climate modelling and the reduction in uncertainties in future forecasts.
A key part in addressing the question of operational readiness has been the analysis of the evolution of GMES services, as described above. This study builds on the work that has taken place under FP6 and FP7, and utilises the existing understanding of the service evolution to support the build-up of the benefits case.
The analysis builds on the assumption that all data and information produced by the space and in-situ components under the GMES programme will be provided on the premise of full and open access. Without data being freely available, benefits will not materialise to the degree projected. This in particular relates to the potential take-up in the downstream sector and users more widely.
7.5.2 GMES Contribution
The quantification of benefits is based on an approach that attributes to GMES an incremental improvement in outcomes linked the value of additional information that the system should provide. This improvement in outcomes is typically measured as a reduction in baseline environmental and social damage costs across each of the GMES activity areas.207
The general approach of attributing only an incremental contribution to GMES recognises that improvements in environmental and social outcomes are derived from several factors along a benefit chain, of which the contribution by GMES, in the form of enhanced information for decision makers, is only one part. It also recognises the degree of uncertainty in estimating benefits for programmes like GMES and minimises the risk of generating excessively large benefits in areas where baseline costs are very high, particularly when they are experienced on a global scale.208 The view is that this approach is most suitable for the strategic assessment of broad, programme-wide, funding options in line with the requirements of this study.
Chapter 6 has addressed the concept of the value of information in some detail. In line with the findings of that chapter, and for the purpose of the cost-benefit analysis, a factor of 1% has been assumed to represent the value of information provided by GMES in supporting enhanced policy making and actions by downstream users. This approach is considered suitable for a programme-wide cost-benefit analysis, providing a level of transparency and
207 Note: the focus of this analysis is on the benefits related to improved policy outcomes and changes in global action on
matters relating to climate change and environmental management. Expected efficiency gains in environmental monitoring and compliance will be included in the Final Report.
208 Macauley, M. K.: “The Value of Information: A Background Paper on Measuring the Contribution of Space-Derived Earth Science Data to National Resource Management”, 2005. It presents a discussion on the value of information (VOI) and a summary of attempts to measure VOI in assessment frameworks.

Booz & Company
Date: 19th September 2011 Cost-Benefit Analysis for GMES Final Version II
Prepared for: European Commission Directorate – Enterprise and Industry
108
consistency across the assessment. However, this should not be seen as a rigid rule, but more as an ‘order of magnitude’ estimation of benefits that enables a strategic assessment to be made across a range of options and benefit areas.
Recognising the approximate nature of this approach, appropriate sensitivity analyses will be used to explore the impact of varying this core assumption. It remains clear that further detailed analyses are required to validate the impact of GMES services, and it is appropriate that ex-post studies are carried out to provide further evidence of the potential impacts. For example, this could include the development of a programme inventory that serves as a comprehensive evidence base that links each of the GMES products to its users and the value it creates in each of its markets.
It is recognised that the approach of attributing a broad-based, incremental to the value of information represents a break from previous GMES cost-benefit studies, which have estimated a series of refined and independent benefit factors for each domain. It is considered that a simplified and beneficial and appropriate when applied to a strategic option assessment as defined for this cost-benefit study.
7.5.3 Contribution and Availability of GMES Data Sources
An objective for the promoters of GMES is to be able to link the contribution of each of the GMES data sources to the overall benefits case. This is reflected in the selection of options for this study, which involve variations to the Sentinel programme (the largest contributor to overall costs), support for enhancing the continuity of data from Contributing Missions, and the level of expenditure on services.
In considering this objective, it is observed that GMES is a complex and far-reaching information system with both integrated and overlapping EO infrastructures and an elaborate service requirement across a diverse and disparate user community. There are also complex relationships between GMES and other space-based EO infrastructure, where many of the other current and planned missions are expected to provide similar outputs to what is planned for the Sentinel programme. Analysis of GMES design documentation and consultation with technical experts has highlighted the role for each of these missions in providing redundancy and continuity to cross-support the objectives of each of these missions.
Based on these considerations, for the purpose of this study, the analysis has been simplified by effectively considering GMES as a ‘black box’ of data sources, whilst also developing an approach that enables variations in infrastructure and service provision to have consequences for the impacts of GMES. Under this approach, the EC regards Option D to be the central case, with the level of benefits varied on a proportionate basis in line with changes in services and availability of space infrastructure. This approach, places a high value on service development, but also on the continuity of space infrastructure. However, this approach recognises the potential for benefits over the shorter term in the low case scenarios, which has not been included in previous impact assessments.
In developing the approach, the study has also accounted for considerations relating to the continuity of the Contributing Missions. This is to accommodate the view that there is a high likelihood that the continuity of important Contributing Missions is in doubt over the longer term.209 Managing these risks and to ensure something as close to full continuity would
209 Personal Communication with the EC’s Directorate General for Enterprise and Industry, 15th June 2011.

Booz & Company
Date: 19th September 2011 Cost-Benefit Analysis for GMES Final Version II
Prepared for: European Commission Directorate – Enterprise and Industry
109
therefore require support from the GMES programme, either through new missions or through additional support to Contributing Missions. Under this approach, the benefits case in each option apart from Option D is degraded to recognise the likely data shortfall this outcome would present to the GMES programme. It is recognised that there is a potential for this risk to occur given the complex stakeholder landscape and the requirement for ongoing support from external infrastructure and data providers. It has, however, not been possible to independently verify the specific nature and severity of these risks to the continuity of data from the Contributing Missions. On the other hand, the landscape of scientific and other EO missions will be fluid over the longer term, and there is a case for the GMES programme to be able to ensure it can proactively manage these risks and support the realisation of the full benefits case.
While this approach is sufficient for this strategic exercise, it is only through detailed and comprehensive analysis would it be possible to determine the contribution from different data sources (e.g. Sentinels, Contributing Missions and in situ) and the risks to their full continuity with a high level of precision. This analysis is outside the scope of this study. As noted, this view has been confirmed through literature review210 and discussions with technical experts and stakeholders.
The strategic nature of this study also makes such detailed analysis of lower relevance when developing the basis on which to select across comparable and high level options. The study is not attempting to attribute value to individual investments, or the optimisation of a particular option.
Sentinel Missions are essential for GMES to exist as they materialise the commitment of the EC to the programme. The general view is that it is not possible at this stage to attribute benefits directly to a particular information source. Instead an approach based on viewing Sentinels as a ‘collective’ network is considered to be more suitable. It is considered that the commissioning of further analysis in this area could prove valuable.
However, from a modelling perspective it is necessary to develop some simplifying assumptions that reflect the cumulative availability of Sentinels. It would not be reasonable to assume that the availability of Sentinels can be fully traded off by data from in situ and Contributing Missions. The premise is therefore that each Sentinel has a value added benefit, but similarly that the reduction of the network by one Sentinel will have a degrading impact on overall benefits. Without these simplifying (strategic) assumptions, it would be impossible to ‘penalise’ Options A and B where there is no continuous replacement of Sentinels.
In addition, the study has accounted for the view that long-term continuity is of particular relevance for the realisation of the benefits of GMES in supporting climate change mitigation and adaptation, which can be viewed as a special case. For the EU to maintain its position as a leader in the global climate change arena with the potential to influence global action on climate change action, then the value of GMES as the EU’s major contribution to climate change observation and scientific understanding requires a genuine ongoing commitment. In this context, Option A would be viewed as a progressive withdrawal from its global commitments in this area and therefore provide the rationale to fully degrade the climate change benefits in this option. Option B would be viewed as a partial withdrawal that involves the provision of significant data and products through a large portion of the
210 See for example the two OECD Reports “Space Technologies and Climate Change” (2008) and “Space 2030 – Tackling
Society’s Challenges” (2005).

Booz & Company
Date: 19th September 2011 Cost-Benefit Analysis for GMES Final Version II
Prepared for: European Commission Directorate – Enterprise and Industry
110
appraisal time horizon. As such, it is considered appropriate to partially degrade the climate change benefits under this option. A 50% degradation of climate change benefits is considered reasonable.
7.5.4 Operational Readiness and Expected Take-up of the Applicable GMES Services
The quantitative assessment takes into consideration the operational readiness of services by 2014. This has been undertaken through a detailed analysis of services in the Land, Marine, Emergency and Atmosphere domains and services for security applications, as they are currently developing under FP7, through GIO in 2011, and through Preparatory Actions in 2008-2010. This understanding was developed though analysis of the published work programmes for FP7 and GIO, the text of the Preparatory Actions and their Invitations to Tender (ITT), as well as other ITTs and public sources of information. Ultimately, this analysis has resulted in a set of hypotheses regarding service continuity, which were validated by several coordinating stakeholders from the FP7 project communities.
Appropriate assumptions have also been developed regarding the potential future provision of Climate Change monitoring services. This is detailed in Appendix G and summarised below. In general it provides an important reference point for the analysis, but also adds a new understanding to GMES.
The general view arising from the technical analysis is one that support substantial readiness from 2014. The programme is therefore expected to see the full benefits of investment through FP6 and FP7 come to fruition.
In general, operational readiness does not translate into a full (i.e. 100%) benefit contribution. Therefore, it is necessary to consider if there exist reasons as to why benefits may materialise fully from the outset. Three general take-up rules have been applied. These are detailed in the table 7.10 below.
Table 7.10: Strategic Take-up Assumptions Applied in the Economic Assessment
Category Take-up (years) Rationale
Immediate use 0 The outputs of the operational service have an immediate use case, and benefits begin to accrue from the start year of operations.
User uptake 1 The accrual of benefits is contingent on the uptake of services by end users (institutional and individual). The build-up period is required for promotion, dissemination and user education activities.
Policy cycle 2 The benefits arise as an outcome of inter-institutional policy-making and the trickling down of such policies through international, European, regional and local authorities.
Source: Booz & Company analysis.
As demonstrated in Appendix G, the majority of services are expected to be fully operational by 2014 and fall in the category of being ready for immediate use. A gradual take-up profile is therefore only considered applicable for a minority of services, e.g. climate change, European air quality, CAP monitoring and services in relation to strengthening regional policies.
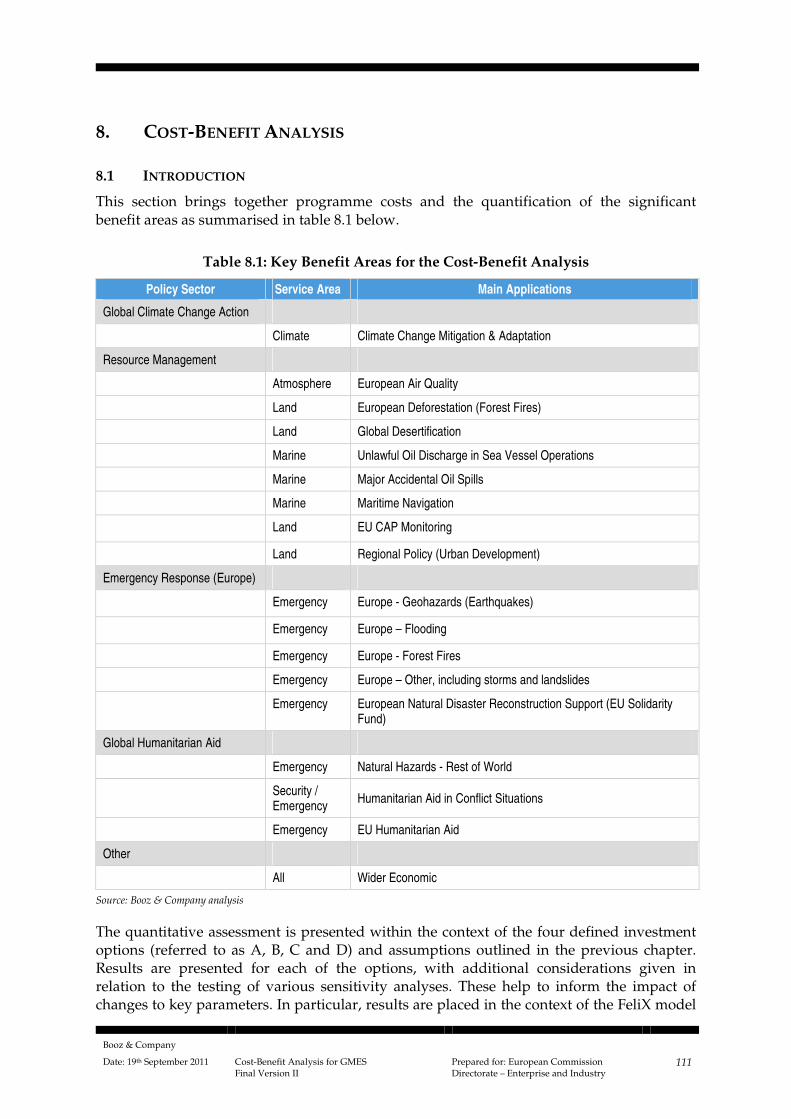
Booz & Company
Date: 19th September 2011 Cost-Benefit Analysis for GMES Final Version II
Prepared for: European Commission Directorate – Enterprise and Industry
111
8. COST-BENEFIT ANALYSIS
8.1 INTRODUCTION
This section brings together programme costs and the quantification of the significant benefit areas as summarised in table 8.1 below.
Table 8.1: Key Benefit Areas for the Cost-Benefit Analysis
Policy Sector Service Area Main Applications
Global Climate Change Action
Climate Climate Change Mitigation & Adaptation
Resource Management
Atmosphere European Air Quality
Land European Deforestation (Forest Fires)
Land Global Desertification
Marine Unlawful Oil Discharge in Sea Vessel Operations
Marine Major Accidental Oil Spills
Marine Maritime Navigation
Land EU CAP Monitoring
Land Regional Policy (Urban Development)
Emergency Response (Europe)
Emergency Europe - Geohazards (Earthquakes)
Emergency Europe – Flooding
Emergency Europe - Forest Fires
Emergency Europe – Other, including storms and landslides
Emergency European Natural Disaster Reconstruction Support (EU Solidarity Fund)
Global Humanitarian Aid
Emergency Natural Hazards - Rest of World
Security / Emergency Humanitarian Aid in Conflict Situations
Emergency EU Humanitarian Aid
Other
All Wider Economic
Source: Booz & Company analysis
The quantitative assessment is presented within the context of the four defined investment options (referred to as A, B, C and D) and assumptions outlined in the previous chapter. Results are presented for each of the options, with additional considerations given in relation to the testing of various sensitivity analyses. These help to inform the impact of changes to key parameters. In particular, results are placed in the context of the FeliX model

Booz & Company
Date: 19th September 2011 Cost-Benefit Analysis for GMES Final Version II
Prepared for: European Commission Directorate – Enterprise and Industry
112
as the latter provides a strong reference case for assessing total benefits. However, the FeliX model would not be appropriate in the context of assessing all four options. It is only applicable in relation to Options C and D where infrastructure (space and in situ) and services are expanding, and data continuity is guaranteed.
The chapter ends with a summary of results, and an overall perspective on these. For each option, the presentation focuses on showing total costs, total benefits and the implied net benefit. Total costs and benefits are used to calculate a benefit-cost ratio (BCR). The comparison builds on discounted value, with the annual discount rate being 4%. All values are expressed in 2010 prices.
However, it is important to highlight that the interpretation of results is based on an understanding of the key limitations of undertaking a cost-benefit analysis of GMES. The quantification of benefits in this case is complex, which makes traditional cost-benefit approaches more difficult to apply. In particular, this concerns the difficulty in establishing a direct causal relationship between input (information) and output (action). The benefit case also builds on the need to continue developing a downstream market (i.e. user involvement and take-up). Finally, benefit areas relate to mitigating the impacts of low probability, high risk events or events that require international political agreement.
Nevertheless, clear areas of benefit for GMES do exist. These relate to enhancing our understanding of, and providing information to assist in coping with climate change and other atmospheric phenomena, environmental management, monitoring and enforcing international agreements, emergency management and supporting EU policies in areas such as agriculture (Common Agricultural Policy).
Despite these issues, this study has made its best efforts to quantify the benefits of the programme. These benefits lie primarily in:
� Engaging policy or operational responses to EO data to deliver net benefits; and
� Using EO data to contribute to the modelling of forecast environmental conditions (e.g. climate change) which in turn is used as input into policy responses either to mitigate or to adapt to such conditions.
Yet in quantifying such benefits, it is important to stress a number of important caveats. These concern the assumptions behind any quantification, particularly in attributing proportions of benefits to the GMES programme and in defining a causative relationship between receiving information and acting upon it.
The benefit assessment builds on a range of assumptions that will only materialise if necessary actions are undertaken. However, in comparing projected benefits to the estimated costs of the scheme, it is possible to illustrate the degree to which the programme is able to show ‘value for money’.
Each option builds on varying assumptions to express an explicit like-for-like comparison. The strength of this analysis lies in the ability to demonstrate the relative impact of different programme decisions, and less in the absolute benefit value. The realisation of benefits depends critically on a number of enablers, and is bounded by some important constraints. Not all benefits can be quantified, and in the context of GMES the most important benefits are those at the geo-political level that will remain qualitative, and based on an implicit trade-off between willingness to pay and affordability. Finally, it should be noted that none of the appraised options include the up-front capital investment in Sentinels, or development of services to 2014.

Booz & Company
Date: 19th September 2011 Cost-Benefit Analysis for GMES Final Version II
Prepared for: European Commission Directorate – Enterprise and Industry
113
8.2 RESULTS
8.2.1 Option A – Baseline Option
In terms of space infrastructure, Option A is depicted in the following figure 8.1. The last Sentinel is assumed to go out of service by 2025. No further costs (or benefits) are assumed after 2025 as the GMES programme is terminated. Costs are assumed to reduce gradually during the 2020s to reflect the decreasing level of programme activity. This is also illustrated by the termination of benefits in line with the declining availability of space (Sentinel) generated EO data. It is not assumed that Contributing Missions will be available or used to fill the gaps.
Figure 8.1: Option A - Space Component
Source: ESA; European Commission; Booz & Company analysis.
Table 8.2 below presents the summarised results for Option A. Total net benefits (total benefits less total costs) are negative by €0.1 billion (undiscounted) for the period 2014 – 2030. Discounted net benefits are approximately zero, with the result that the BCR is 1.0, i.e. discounted benefits are equal to discounted costs. The consequence is that Option A is only able to generate sufficient benefits to meet its programme costs.
Table 8.2: Option A – Summary of Cost-Benefit Analysis, € Billion, 2010 Prices
Options 2014 – 2020 2021 - 2030 Total
Cumulative, Undiscounted
Benefits 2.0 0.9 3.0
Costs (2.1) (1.0) (3.0)
Net Benefits (0.0) (0.0) (0.1)
Cumulative, Discounted

Booz & Company
Date: 19th September 2011 Cost-Benefit Analysis for GMES Final Version II
Prepared for: European Commission Directorate – Enterprise and Industry
114
Options 2014 – 2020 2021 - 2030 Total
Benefits 1.5 0.6 2.1
Costs (1.6) (0.6) (2.1)
Net Benefits (0.0) (0.0) (0.0)
BCR 1.0
Source: Booz & Company analysis.
Figure 8.2 below depicts the cumulative build-up of benefits and costs over time in discounted terms. The red line shows how the net benefit profile develops over time, i.e. in the case of Option A the line is flat as costs and benefits are matching each other. Consistent with the assumptions underpinning the option, costs and benefits remain unchanged after 2025.
Figure 8.2: Option A – Cost-Benefit Analysis, € Billion, 2010 Prices
Source: Booz & Company analysis.
Option A represents a degraded service scenario as the programme is ultimately curtailed by 2025. So although the programme exists from 2013 (first Sentinel 1 in operation) to 2025, i.e. 13 years of observation, it does not provide the desired service (data) continuity. This forms a major driver behind the low projection of future benefits.
Benefits are reduced to reflect the level of degradation, i.e. slower take-up in usage. However, benefits are also lower - in comparison to other options – as investments in services and the development of the downstream market are lower. Insufficient momentum and utilisation of EO data leads to fewer applications and direct beneficial usage of data. In total, benefits have been assumed to be reduced by around 80%211 on a like-for-like basis compared to Option D, which forms the reference case.
In addition, the study has accounted for the view that long-term continuity is of particular relevance for the realisation of the benefits of GMES in supporting climate change mitigation and adaptation, which can be viewed as a special case. In the context of climate change, Option A is therefore viewed as a progressive and complete withdrawal from global
211 Derived as a proxy from the relative difference in projected discounted costs for infrastructure and service components in
Option A compared to Option D.

Booz & Company
Date: 19th September 2011 Cost-Benefit Analysis for GMES Final Version II
Prepared for: European Commission Directorate – Enterprise and Industry
115
commitments. The effect is that Option A results in a complete degradation of climate benefits. Climate change services may still be under development, but it is unlikely that they will mature into full services, let alone provide substantial inputs for decision making in this area.
Option A represents only a short-term continuation of the current GMES programme. It is therefore not able to address the overall strategic policy objectives of the programme, including providing a stimulating impact on the industry sector in general and SMEs in particular. Any positive impacts created would ultimately be of short duration and the overall uncertainty around the programme could potentially provide a basis for further reductions in projected benefits.
The overall investment programme may therefore not represent a direction that is sufficiently providing a ‘value-added’ contribution from the EU perspective, or achieving the objective of developing the desired European capabilities with the EO sector. Furthermore, the proposed option would clearly be contradictory to the EU aspiration to act as a credible partner within the wider GEOSS framework. It may therefore appear reasonable to conclude that Option A is not able to provide a sustainable solution, as launching and operating the programme for a short time period would not provide a sufficient level of benefits to justify the decision.
The overriding conclusion is that Option A falls short of addressing the key strategic and political benefits of GMES, in particular the long-term monitoring of climate change variables. Furthermore, benefits to the space sector and downstream markets would be limited. This is because no further Sentinels would be constructed, and the knowledge that the programme is time limited would be unlikely to provide a stable basis for future downstream sector development.
Based on industry multipliers, the present value of the total direct, indirect and induced impacts on industry activity is in the range of €4.4 billion to €12.8 billion, which is equivalent to around 0.04% to 0.11% of EU GDP. Direct employment in the space and EO sector is linked to the level of investment provided under the GMES programme under this option, which is reduced compared to the other options.212 Employment in the space sector is of higher than average labour productivity, and can generate indirect employment effects at a ratio of around 3.6 to one. That is, one employee in the space sector can support 2.6 additional jobs in other industries. Estimates of economic activity provided are not additional to the cost-benefit analysis results. However, the potential for R&D investments to generate economic spillovers is included in measures of other benefits in the results, which also varies in line with projected R&D spend.
The table below provides a summary assessment of Option A in the context of its ability to support the EU in achieving its strategic policy objectives.
Although valuable new information can be obtained in the context of climate change, it does not provide for a long term systematic EO programme. In general, Option A falls short across all of the stated objectives.
212 With reference to literature review and approach detailed in Chapter 5, a range of multiplier for economic activity of 2.04
to 6.00 has been used (applied to cost base).

Booz & Company
Date: 19th September 2011 Cost-Benefit Analysis for GMES Final Version II
Prepared for: European Commission Directorate – Enterprise and Industry
116
Table 8.3: Option A - Qualitative Assessment of Strategic Policy Benefits
Understanding Climate Change
Contributing to GEOSS
Industry Development
EU Space Policy Agenda
EU Environmental Policy Agenda
EU Global Policy
Leadership
1 1 1 0 1 1
Source: Booz & Company analysis.
8.2.2 Option B – Baseline Option Extended
The figure below shows that the observation programme is extended with an additional life-cycle, e.g. Sentinels 1, 2 and 3 C units are launched and operated. It means that the programme will continue in some form into the early 2030s, and hence outside of the appraisal period for this cost-benefit study. In comparison to Option A, the in situ component is also enhanced.
Figure 8.3: Option B – Space Component
Source: ESA; European Commission; Booz & Company analysis.
The long-term assumption is similar to Option A, as the programme will completely terminate at some future date (i.e. 2033 under the current specification). This means that services will be degraded over time due to the lack of guaranteed data continuity. However, in comparison to Option A, it can be assumed that this negative impact is reduced through higher investments in the funding of services (investment interpreted as an expression of commitment and explicit value generation) and the longer time horizon of the option. The knowledge that the programme has a duration of two decades should provide businesses with some confidence to develop plans for utilising new data for downstream services.
However, on balance it is most likely that the combination of lower investments in services and downstream market promotion (in comparison to Option C and Option D) will result in

Booz & Company
Date: 19th September 2011 Cost-Benefit Analysis for GMES Final Version II
Prepared for: European Commission Directorate – Enterprise and Industry
117
lower benefits on a like-for-like basis. Furthermore, the analysis also assumes that there will be a complete termination of some benefits streams when individual Sentinels come to the end of their life. It is not assumed that Contributing Missions will be available or used for substitution.
The limited time commitment also has a direct impact on reducing year-on-year costs during the 2020s, i.e. in relation to services, but also the actual operation of satellites.
Summarised results for Option B are shown in the table 8.4 below. Total net benefits are €10 billion (undiscounted) during 2014 – 2030, and €6 billion discounted. The majority of benefits arise during the 2021 – 2030 period. The BCR is calculated at 2.3, i.e. discounted benefits exceed discounted costs by a factor of 2.3.
Table 8.4: Option B – Summary of Cost-Benefit Analysis, € Billion, 2010 Prices
Options 2014 - 2020 2021 – 2030 Total
Cumulative, Undiscounted
Benefits 6.0 11.0 17.0
Costs (3.7) (3.4) (7.0)
Net Benefits 2.4 7.6 10.0
Cumulative, Discounted
Benefits 4.5 6.2 10.7
Costs (2.8) (1.9) (4.7)
Net Benefits 1.7 4.3 6.0
BCR 2.3
Source: Booz & Company analysis.
The following figure depicts the cumulative build-up of benefits and costs over time in discounted terms. Due to the time-limited dimension of the option, benefits have been degraded to take account of slower take-up in services and activities in the downstream market. In total, benefits are reduced by nearly 60%213 compared to Option D, which provides the reference case.
In addition, the analysis has accounted for the view that long-term continuity is of particular relevance for the realisation of the benefits of GMES in supporting climate change mitigation and adaptation, which can be viewed as a special case.
Compared to Option A, Option B represents only a partial withdrawal as there is some demonstrated commitment to continue funding the programme. Climate change benefits in Option B have therefore only been degraded by 50% as the option should be able to provide some key data and products through a large portion of the time period being assessed.
213 Derived as a proxy from the relative difference in projected discounted costs for infrastructure and service components in
Option B compared to Option D.

Booz & Company
Date: 19th September 2011 Cost-Benefit Analysis for GMES Final Version II
Prepared for: European Commission Directorate – Enterprise and Industry
118
Figure 8.4: Option B – Cost-Benefit Analysis, € Billion, 2010 Prices
Source: Booz & Company analysis.
Option B represents a degraded service as the programme ultimately finishes in the early 2030s, and therefore does not provide service (data) continuity. It exists from 2013 (first Sentinel 1 in operation) to 2033, providing roughly 20 years of EO. This option therefore represents a significant enhancement on the situation today in the form of additional new information, and the ability to improve resource and environmental management on both a pan-European and global basis.
In comparison to Option A, benefits are higher due to the programme’s longer time horizon and expanded level of activities (number of satellites in orbit). The option therefore provides additional momentum and utilisation of EO data leading to more applications and greater direct beneficial usage of data. The continuing commitment to fund services, including new services supporting climate change, and the downstream market would lead to additional uptake and application in comparison to Option A. As shown in the figure below, around 25% of benefits are climate related. On that basis, Option B addresses some of the key strategic objectives for the GMES programme.
Figure 8.5: Option B – Climate and Non-climate Benefits, € Billion, 2010 Prices
Source: Booz & Company analysis.

Booz & Company
Date: 19th September 2011 Cost-Benefit Analysis for GMES Final Version II
Prepared for: European Commission Directorate – Enterprise and Industry
119
Option B represents medium term continuation of the current GMES programme, but with a funding commitment that is substantially larger than Option A. In comparison to Option A, Option B is therefore stronger in cumulative net benefits and in terms of the BCR ratio.
Furthermore, Option B provides a stronger basis for supporting some of the overall strategic policy objectives of the GMES programme such as increased investments in space and service components, and providing for a greater stimulation of the downstream services sector (including SMEs) - although these impacts would be curtailed during the 2020s and coming to a complete end by 2033. Any positive impacts created would ultimately be of limited duration and the overall uncertainty around the programme could potentially provide a basis for further reduction in projected benefits. However, these negative impacts are likely to be lower than in the case of Option A.
The investment programme assumed under Option B provides for a stronger European involvement and contribution within the GEOSS framework. However, the contribution is still limited in aspiration and funding commitment. The EU would therefore fall short of its own objectives for establishing itself as a leading contributor in this field, including supporting the long term climate monitoring and modelling agenda. Option B is therefore not able to provide for a secure and fully funded programme that builds the desired European capabilities within the EO sector.
However, it remains clear that the Sentinels will provide a positive impact while they are operational. This provides an improved understanding that can help inform the environmental policy agenda, and ultimately provide the basis for policy makers to reach better decisions.
The result is that Option B will fall short of addressing all key strategic and political benefits of GMES, in particular the long-term monitoring of climate change variables.
There will be some benefits to the space sector and downstream markets, in particular in comparison to Option A. Firstly, additional Sentinels are constructed, launched and operational. Secondly, there are additional investments in developing services, in particular around climate change. The longer duration of Option B also reduces uncertainty about the programme as a whole and therefore provides a stronger basis than Option A for making business decisions in relation to developing applications that can utilise the new flow of EO data.
The following table 8.5 presents Option B in the context of its ability to support the EU in achieving its strategic policy objectives.
Table 8.5: Option B - Qualitative Assessment of Strategic Policy Benefits
Understanding Climate Change
Contributing to GEOSS
Industry Development
EU Space Policy Agenda
EU Environmental Policy Agenda
EU Global Policy
Leadership
2 2 2 1 2 2
Source: Booz & Company analysis.

Booz & Company
Date: 19th September 2011 Cost-Benefit Analysis for GMES Final Version II
Prepared for: European Commission Directorate – Enterprise and Industry
120
Option B enables the EU to work towards some its stated objectives, but it ultimately does not deliver on the space policy agenda as a long term solution is not put in place.214 Industry development is also limited due to uncertainty about the future programme, and hence the EU is not able to take full advantage of its desired role within GEOSS and the global policy sphere. Based on industry multipliers, the present value of the total direct, indirect and induced impacts on industry activity is in the range of €9.5 billion to €28 billion, which is equivalent to around 0.08% to 0.23% of EU GDP. Direct employment in the space and EO sectors is linked to the level of investment provided under the GMES programme under this option, which is reduced compared to the Options C and D, but higher than in Option A. Employment in the space sector is of higher than average labour productivity, and can generate indirect employment effects at a ratio of around 3.6 to one. That is, one employee in the space sector can support 2.6 additional jobs in other industries. Estimates of economic activity provided are not additional to the cost-benefit analysis results. However, the potential for R&D investments to generate economic spillovers is included in measures of other benefits in the results, which also varies in line with projected R&D spend.215
8.2.3 Option C - Partial Continuity
Under this option, the continuity of the Sentinel Missions is ensured. For example, for Sentinels 1, 2 and 3, the original A and B-units are replaced. Similarly, Sentinels 4, 5 and the Jason CS are also being replaced on an on-going basis. However, under this option, there is limited support provided to ensuring data continuity from the Contributing Missions and proactively managing the risks that some key Contributing Mission data may not be available in the future. In comparison to Options A and B, there is also additional investment in data collection from in-situ sources.
Linked to the lack of support for ongoing data continuity from Contributing Missions, Option C is degraded as there is uncertainty and a potential long-term risk to the programme. In total, benefits have been reduced by nearly 20%216 compared to Option D, which provides the reference case. This approach assumes that, in lieu of a detailed study, the additional funding allocation for supporting the Contributing Missions in Option D will be effective in mitigating the potential impacts in terms of degraded services and benefits.
As is widely recognised, long-term data continuity is of particular relevance for the realisation of the benefits of GMES in supporting climate change mitigation and adaptation. Climate change benefits in Option C have therefore only been degraded by 25% as the option should be able to provide most of the key data and products through a large portion of the time period being assessed.
214 As most recently stated by the Council of Europe communication on 31st May “Towards a space strategy for the EU that
benefits its citizens”, 3094th Competitiveness Council Meeting.
http://www.consilium.europa.eu/uedocs/cms_data/docs/pressdata/en/intm/122342.pdf. 215 With reference to literature review and approach detailed in Chapter 5, a range of multiplier for economic activity of 2.04
to 6.00 has been used (applied to cost base). 216 Derived as a proxy from the relative difference in projected discounted costs for infrastructure and service components in
Option C compared to Option D.

Booz & Company
Date: 19th September 2011 Cost-Benefit Analysis for GMES Final Version II
Prepared for: European Commission Directorate – Enterprise and Industry
121
Figure 8.6: Option C – Space Component
Source: ESA; European Commission; Booz & Company analysis.
Table 8.6 below presented the summarised results for Option C. Total net benefits are €34.7 billion (undiscounted) during 2014 – 2030, and €20.4 billion discounted. The BCR is calculated at 3.2. In comparison to Option A, there is a step-change in the level of programme costs and potential benefits. It is therefore important to consider both the BCR ratio and the overall impact when evaluating the merits of the option.
Table 8.6: Option C – Summary of Cost-Benefit Analysis, € Billion, 2010 Prices
Options 2014 - 2020 2021 - 2030 Total
Cumulative, Undiscounted
Benefits 13.0 36.6 49.6
Costs (5.0) (9.9) (14.8)
Net Benefits 8.0 26.7 34.7
Cumulative, Discounted
Benefits 9.5 19.9 29.4
Costs (3.7) (5.4) (9.1)
Net Benefits 5.9 14.5 20.4
BCR 3.2
Source: Booz & Company analysis.
The following figure depicts the cumulative build-up of benefits and costs over time in discounted terms. As the option is not time limited, the benefit contribution evolves over time and enables more complete capture of long term benefits that arise from earlier investments in services and downstream market development.

Booz & Company
Date: 19th September 2011 Cost-Benefit Analysis for GMES Final Version II
Prepared for: European Commission Directorate – Enterprise and Industry
122
Figure 8.7: Option C – Cost-Benefit Analysis, € Billion, 2010 Prices
Source: Booz & Company analysis.
Option C, which involves full investment in Sentinels, but does provides limited support to ensure the continuity of data from Contributing Missions, presents a degraded benefits profile, including those relating to the climate change domain. The option provides a solid basis for achieving the EU’s key strategic policy objectives, including securing GMES within the context of industrial policy and the wider economy. The option will provide the space and downstream sectors, including SMEs, with a substantial basis for developing capabilities and competitiveness within the sector.
Based on industry multipliers, the present value of the total direct, indirect and induced impacts on industry activity is in the range of €23.4 billion to €69.1 billion, which is equivalent to around 0.19% to 0.57% of EU GDP. Direct employment in the space and EO sectors is linked to the level of investment provided under the GMES programme under this option, which is higher than Option A. Employment in the space sector is of higher than average labour productivity, and can generate indirect employment effects at a ratio of around 3.6 to one. That is, one employee in the space sector can support 2.6 additional jobs in other industries. Estimates of economic activity provided are not additional to the cost-benefit analysis results. However, the potential for R&D investments to generate economic spillovers is included in measures of other benefits in the results, which also varies in line with projected R&D spend.217
A key benefit driver under Option C is the positive impact on climate change related actions. It provides the majority of benefits as demonstrated in the figure below. Approximately 35% of benefits are climate related. On that basis, Option C addresses the key strategic objectives for the GMES programme. In total, 3% of total benefits come from the assumed positive impact arising from R&D activities.
217 With reference to literature review and approach detailed in Chapter 5, a range of multiplier for economic activity of 2.04
to 6.00 has been used (applied to cost base).

Booz & Company
Date: 19th September 2011 Cost-Benefit Analysis for GMES Final Version II
Prepared for: European Commission Directorate – Enterprise and Industry
123
Figure 8.8: Option C – Climate and Non-climate Benefits, € Billion, 2010 Prices
Source: Booz & Company analysis.
As illustrated by the level of quantitative benefits related to managing risks on climate change, the EU will have an EO programme in place that can continuously provide strategic information on climate change, although there may be risks to the level of information that can be provided over the longer term.
Table 8.7 below presents Option C in the context of its ability to support the EU in achieving its strategic policy objectives.
Table 8.7: Option C - Qualitative Assessment of Strategic Policy Benefits
Understanding Climate Change
Contributing to GEOSS
Industry Development
EU Space Policy Agenda
EU Environmental Policy Agenda
EU Global Policy
Leadership
3 3 3 3 3 3
Source: Booz & Company analysis.
Option C is able to deliver across a wide range of strategic policy objectives, although on a limited basis compared to Option D given long term service continuity of Contributing Missions cannot be guaranteed.
8.2.4 Option D – Full Continuity
This option ensures the long-term continuation of the programme through the on-going replacement of Sentinel Missions, e.g. similar to Option C, and a significant contribution in relation to supporting the long-term availability of critical data from Contributing Missions. There are no other changes in the option compared to Option C.

Booz & Company
Date: 19th September 2011 Cost-Benefit Analysis for GMES Final Version II
Prepared for: European Commission Directorate – Enterprise and Industry
124
Figure 8.9: Option D – Space Component
Source: ESA; European Commission; Booz & Company analysis.
Table 8.8 presents the summarised results for Option D. Total net benefits are €52.3 billion (undiscounted) during 2014 – 2030, and €30.5 billion discounted. The BCR is calculated at 3.7.
Table 8.8: Option D – Summary of Cost-Benefit Analysis, € Billion, 2010 Prices
Options 2014 – 2020 2021 - 2030 Total
Cumulative, Undiscounted
Benefits 18.0 53.0 71.0
Costs (6.4) (12.4) (18.8)
Net Benefits 11.6 40.7 52.3
Cumulative, Discounted
Benefits 13.2 28.8 42.0
Costs (4.8) (6.7) (11.5)
Net Benefits 8.4 22.1 30.5
BCR 3.7
Source: Booz & Company analysis.
The following figure depicts the cumulative build-up of benefits and costs over time in discounted terms. As the option is not time limited, the benefit contribution evolves over time and enables the more complete capture of long term benefits that arise from earlier investments in services and downstream market development.

Booz & Company
Date: 19th September 2011 Cost-Benefit Analysis for GMES Final Version II
Prepared for: European Commission Directorate – Enterprise and Industry
125
Figure 8.10: Option D – Cost-Benefit Analysis, € Billion, 2010 Prices
Source: Booz & Company analysis.
Option D enables the capture of a full range of potential benefits from investing in GMES, including those relating to the development of a comprehensive long-term response within the climate change domain. The option also provides a strong basis for achieving the EU’s key strategic policy objectives, including securing GMES within the context of industrial policy and the wider economy. The option will provide the space and downstream sectors, including SMEs, a basis for developing capabilities and competitiveness within the sector. These advantages can support future industrial development and strong positioning in comparison with non-EU competitors and firmly secure the EU EO sector in the longer term. In particular, it is important for SMEs to have the confidence to invest that comes from the certainty that the GMES programme has a long term funding commitment and data guarantee supporting it.
Based on industry multipliers, the present value of the total direct, indirect and induced impacts on industry activity is in the range of €23.5 billion to €69.0 billion, which is equivalent to around 0.19% to 0.57% of GDP. Direct employment in the space and EO sectors is linked to the level of investment provided under the GMES programme under this option, which is higher than in the other options. Employment in the space sector is of higher than average labour productivity, and can generate indirect employment effects at a ratio of around 3.6 to one. That is, one employee in the space sector can support 2.6 additional jobs in other industries. Estimates of economic activity provided are not additional to the cost-benefit analysis results. However, the potential for R&D investments to generate economic spillovers is included in measures of other benefits in the results, which also varies in line with projected R&D spend.218
The EU’s long-term funding commitment to the GMES programme also demonstrates the position as a leading partner within the GEOSS framework. This is a factor that is not fully met within the other options.
A key benefit driver under Option D is the positive impact on climate change related actions, and provides the majority of benefits as demonstrated in the figure below. As shown in the figure below, around 40% of benefits are climate related. On that basis, Option
218 With reference to literature review and approach detailed in Chapter 5, a range of multiplier for economic activity of 2.04
to 6.00 has been used (applied to cost base).

Booz & Company
Date: 19th September 2011 Cost-Benefit Analysis for GMES Final Version II
Prepared for: European Commission Directorate – Enterprise and Industry
126
D addresses the key strategic objectives for the GMES programme. It should be noted that approximately 4% of total benefits come from the assumed positive impact arising from R&D activities.
Figure 8.11: Option D – Climate and Non-climate Benefits, € Billion, 2010 Prices
Source: Booz & Company analysis.
As illustrated by the level of climate related quantitative benefits, the EU will have an EO programme in place that can continuously provide strategic information on climate change, including supporting the EU as a leading party in the monitoring of existing treaties, and the negotiation of new international treaties related to policy issues such as desertification as discussed in previous sections of this report. In specific terms support is provided in relation to existing deforestation treaties, including the EU’s own policies in this area, and to inform on future agreements covering climate mitigation and adaptation.
It remains clear that the implementation of Option D requires the EU to make a substantial – and sustained - funding commitment over a long time period.
Option D represents a significant step change in commitment, and also provides a basis for establishing GMES as a key tool for climate change mitigation and adaptation. However, the scale of the commitment is substantial and given the overall uncertainty on key parameters further consideration is advisable. For example, costs ought to be considered further to understand if they can be optimised (or if there are any unquantified risks), and on the benefit side, the majority of benefits reflect the overall state of the programme, including issues that are raised in Chapter 6. The risks to benefits around not undertaking this option should be fully assessed and quantified.
The result is that Option D will address the key policy objectives, but also requires of the EU a substantial funding commitment.
Table 8.9 below presents Option D in the context of its ability to support the EU in achieving its strategic policy objectives.
The assessment shows that Option D achieves all the EU’s objectives. However, as stressed above, reaching these objectives also require a very substantial investment.

Booz & Company
Date: 19th September 2011 Cost-Benefit Analysis for GMES Final Version II
Prepared for: European Commission Directorate – Enterprise and Industry
127
Table 8.9: Option D - Qualitative Assessment of Strategic Policy Benefits
Understanding Climate Change
Contributing to GEOSS
Industry Development
EU Space Policy Agenda
EU Environmental Policy Agenda
EU Global Policy
Leadership
4 4 4 4 4 4
Source: Booz & Company analysis.
8.2.5 Summary
In quantitative terms, Options A, B, C and D can be compared on the basis of their net benefit contribution over the period 2014 – 2030. The figure below presents each of the four cases, with values discounted at 4% per annum. Option D generates most net benefits over the appraisal period.
Figure 8.12: Cumulative Net Benefits for Options A, B, C and D, € Billion, 2010 Prices, Discounted
Source: Booz & Company analysis.
The figure clearly illustrates the benefits achieved from the continuing commitment to the GMES programme as Options A and B only provided limited quantitative benefits. Options C and D basically capture a much larger portion of the benefits of the initial investments in infrastructure and services. However, they are also significantly more expensive during the next financial perspective from 2014 – 2020. The decision is therefore about the level of commitment that the EU is willing to place in the GMES programme. To obtain the benefits associated with, for example Option D, there is a significant step-change in the long term funding requirements for the programme. It is may therefore be necessary to view GMES in the strategic (qualitative) policy context in which it fits, as already discussed in previous chapters.
Finally, figure 8.14 below presents Options A, B, C and D in terms of their gross benefits (i.e. excluding costs). Option D generate in total €42 billion of benefits (discounted) by 2030, whereas the similar benefits are €2.1 billion, €10.7 billion and €29.4 billion for Options A, B and C respectively.

Booz & Company
Date: 19th September 2011 Cost-Benefit Analysis for GMES Final Version II
Prepared for: European Commission Directorate – Enterprise and Industry
128
Figure 8.13: Cumulative Gross Benefits for Options A, B, C and D, € Billion, 2010 Prices, Discounted
Source: Booz & Company analysis.
8.3 SENSITIVITY TESTS
The key sensitivities tests undertaken are:
� +/- 50% change in the value of information assumption for GMES contribution;
� High climate change impact case with +2% impact in the value of information assumption for GMES contribution;
� Low climate change impact case with 50% reduction in social cost of carbon;
� + / - 25% change in programme costs;
� Option C with full data continuity (guarantee) without additional investments;
� EuroGEOSS FeliX Model scenario; and
� Comparison to the PWC benefit case.
Results for each of these are presented in the following sections.
8.3.1 Change in GMES Contribution
The figure shows the result of a +/- 50% change in the 1% GMES contribution assumed in the central case. It shows limited sensitivity in Options A and B, but significant impact on the projected outcome in Options C and D.

Booz & Company
Date: 19th September 2011 Cost-Benefit Analysis for GMES Final Version II
Prepared for: European Commission Directorate – Enterprise and Industry
129
Figure 8.14: Cumulative Net Benefits with +/- 50% Change in GMES Contribution, € Billion, 2010 Prices, Discounted
Source: Booz & Company analysis.
The following table 8.10 summarises results for each of the four options. It shows net benefits (cumulative and discounted over 2014 – 2030) and the overall BCR for each sensitivity result. For example, the table shows that Option D has a BCR range of 1.9 – 5.4.
Table 8.10: Cumulative Net Benefits and BCRs with + / - 50% Change in GMES Contribution for 2014 - 2030, € Billion, 2010 Prices, Discounted
Options Net Benefit (Cumulative Discounted) BCR
Low Central High Low Central High
Option A (1.1) (0.0) 1.0 0.5 1.0 1.5
Option B 0.7 6.0 11.4 1.2 2.3 3.4
Option C 6.1 20.4 34.6 1.7 3.2 4.8
Option D 10.3 30.5 50.8 1.9 3.7 5.4
Source: Booz & Company analysis.
In terms of Option D, it is possible to gauge the wide range of potential outcomes from the following figure. It illustrates the range from €10.3 billion to €50.8 billion from varying the assumed GMES contribution, with the black line in the middle of range showing the Central Case projection.

Booz & Company
Date: 19th September 2011 Cost-Benefit Analysis for GMES Final Version II
Prepared for: European Commission Directorate – Enterprise and Industry
130
Figure 8.15: Option D – Low, Central and High Case Net Benefits with + / - 50% Change in GMES Contribution for 2014 - 2030, € Billion, 2010 Prices, Cumulative, Discounted
Source: Booz & Company analysis.
8.3.2 High Climate Change Impact – Doubling of GMES Contribution
The figure below shows the result of a doubling in the assumed GMES contribution for climate change, i.e. the contribution factor increases from 1% to 2%. Impact is limited in Option A and B, but significant in Options C and D.
Figure 8.16: Cumulative Net Benefits with +100% Change in the Climate Change GMES Contribution for 2014 - 2030, € Billion, 2010 Prices, Discounted
Source: Booz & Company analysis.
Table 8.11 summarises results for each of the four options. The change is only modelled as a High Case, with the Low and Central Cases remaining identical.
It shows net benefits (cumulative and discounted over 2014 – 2030) and the overall BCR for each sensitivity result. It shows that a doubling of the GMES contribution for climate change

Booz & Company
Date: 19th September 2011 Cost-Benefit Analysis for GMES Final Version II
Prepared for: European Commission Directorate – Enterprise and Industry
131
is worth between €2.8 billion (Option B) to €17.3 billion (Option D). In option D, the BCR has improved from 3.7 to 5.2. In Options B and C, the BCRs are now 2.9 and 4.4 respectively.
Table 8.11: Cumulative Net Benefits and BCRs with +100% Change in the Climate Change GMES Contribution for 2014 - 2030, € Billion, 2010 Prices, Discounted
Options Net Benefit (Cumulative Discounted) BCR
Low Central High Low Central High
Option A (0.0) (0.0) (0.0) 1.0 1.0 1.0
Option B 6.0 6.0 8.8 2.3 2.3 2.9
Option C 20.4 20.4 30.6 3.2 3.2 4.4
Option D 30.5 30.5 47.8 3.7 3.7 5.2
Source: Booz & Company analysis.
8.3.3 Low Climate Change Impact - 50% Reduction in Social Cost of Carbon
Social cost of carbon has been assumed to be €75 and growing by 2% per annum. The figure below shows the effect of a 50% reduction. The impact is most substantial on Options C and D. The Option C BCR has been reduced from 3.2 to 2.7 under this assumption. The BCR in option D is down to 2.9 (from 3.7). In Option D, net benefits are reduced from €30.5 billion to 21.9 billion.
Figure 8.17: Cumulative Net Benefits with 50% Reduction in Social Cost of Carbon, € Billion, 2010 Prices, Discounted
Source: Booz & Company analysis.
Table 8.12 summarises results for each of the four options. It shows net benefits (cumulative and discounted over 2014 – 2030) and the overall BCR for each sensitivity result. It shows that a 50% reduction in the social cost of carbon reduces benefits with €1.3 billion (Option B), €5.1 billion (Option C) to €8.6 billion (Option D). The 50% reduction is only modelled as a Low Case, with Central and High Cases remaining identical.

Booz & Company
Date: 19th September 2011 Cost-Benefit Analysis for GMES Final Version II
Prepared for: European Commission Directorate – Enterprise and Industry
132
Table 8.12: Cumulative net Benefits and BCRs with 50% Reduction in Social Cost of Carbon, € Billion, 2010 Prices, Discounted
Options Net Benefit (Cumulative Discounted) BCR
Low Central High Low Central High
Option A (0.0) (0.0) (0.0) 1.0 1.0 1.0
Option B 4.7 6.0 6.0 2.0 2.3 2.3
Option C 15.3 20.4 20.4 2.7 3.2 3.2
Option D 21.9 30.5 30.5 2.9 3.7 3.7
Source: Booz & Company analysis.
8.3.4 Change in Programme Costs
The figure shows the result of a +/- 25% change in programme costs. It shows limited sensitivity across all options in terms of net benefits, although the sensitivity of the BCR is greater. It illustrates the lack of sensitivity on net benefits over the period to variations in costs, if the projected benefit case is achieved.
Figure 8.18: Cumulative Net Benefits with +/- 25% Change in GMES Programme Costs, € Billion, 2010 Prices, Discounted
Source: Booz & Company analysis.
The likelihood of cost overruns could vary with the type of infrastructure ownership structure selected. For example, given the Commission has limited involvement with the ownership of large infrastructure assets to date, this ownership structure could represent a higher risk option.
While the variation in costs could represent high expected outturn, it could also represent the opportunity to deliver the GMES programme more efficiently, e.g. reduce some of the planed infrastructure spending or optimise spending across service areas, but under the assumption that benefits remain unchanged. This could be achieved through effective governance, finance and ownership arrangements.

Booz & Company
Date: 19th September 2011 Cost-Benefit Analysis for GMES Final Version II
Prepared for: European Commission Directorate – Enterprise and Industry
133
Table 8.13 summarises results for each of the four options. It shows net benefits (cumulative and discounted over 2014 – 2030) and the overall BCR for each sensitivity result.
Table 8.13: Cumulative net Benefits and BCRs with + / - 25% Change in GMES Programme Costs for 2014 - 2030, € Billion, 2010 Prices, Discounted
Options Net Benefit (Cumulative Discounted) BCR
Low Central High Low Central High
Option A (0.1) 0.4 0.9 0.9 1.2 1.6
Option B 6.6 7.7 8.9 2.1 2.7 3.5
Option C 22.2 24.2 26.3 3.0 3.7 4.9
Option D 32.9 35.4 37.9 3.3 4.1 5.4
Source: Booz & Company analysis.
The table illustrates that for Option D the outcome in terms of net benefits varies by around €5 billion between the Low and High Cases (€32.9 billion – €37.9 billion). This is also illustrated in the figure below.
Figure 8.19: Option C – Low, Central and High Case Cumulative Net Benefits with +/- 25% change in GMES Programme Costs for 2014 - 2030, € Billion, 2010 Prices, Cumulative,
Discounted
Source: Booz & Company analysis.
8.3.5 Option C with Full Data Continuity
Option C provides only full investment in Sentinels, but only limited support of overall data continuity from external data providers. It is only through Option D that enhanced continuity is achieved through additional investment in supporting the Contributing Missions. However, the overall result of the CBA is very sensitive to the cost assumptions being used under Option D, i.e. the costs incurred to mitigate the uncertainty around

Booz & Company
Date: 19th September 2011 Cost-Benefit Analysis for GMES Final Version II
Prepared for: European Commission Directorate – Enterprise and Industry
134
Contributing Missions. To illustrate this, a sensitivity analysis has been undertaken where Option C costs are used to achieve Option D benefits.219
Table 8.14: Option C (Variant) – Summary of Cost-Benefit Analysis, € Billion, 2010 Prices
Options 2014 - 2020 2021 - 2030 Total
Cumulative, Undiscounted
Benefits 17.7 52.8 70.5
Costs (5.0) (9.9) (14.8)
Net Benefits 12.7 42.9 55.6
Cumulative, Discounted
Benefits 13.0 28.7 41.7
Costs (3.7) (5.4) (9.1)
Net Benefits 9.3 23.3 32.6
BCR 4.6
Source: Booz & Company analysis.
BCR is 4.6 under this option. Total net benefits (discounted) are €32.6 billion. In comparison, Option C has total net benefits (discounted) of €20.4 billion, and Option D €30.5 billion. The respective BCR values are 3.2 (Option C) and 3.7 (Option D).
The figure below shows that the alternative Option C provides a better net benefit profile than Option D. It demonstrates the significant costs that are involved in delivering Option D to enhance data continuity. It demonstrate the value that there may be in exploring various options for reducing uncertainty of the long term availability of Contributing Missions, but at the same time consider cost implications.
Figure 8.20: Option C (Variant) – Comparison with Options C and D, € Billion, 2010 Prices
Source: Booz & Company analysis.
219 Benefits are slightly different to Option D due to different R&D related benefits under the two options.

Booz & Company
Date: 19th September 2011 Cost-Benefit Analysis for GMES Final Version II
Prepared for: European Commission Directorate – Enterprise and Industry
135
8.3.6 EuroGEOSS FeliX Emissions Scenario
GMES represents the major element of the EU’s contribution to GEOSS. As such, the EU could therefore claim a proportion of the benefits that derive from a comprehensive GEOSS architecture.
As noted in previous chapters, the GEO-BENE project has developed a global model (FeliX) that can be used to estimate the impacts of a comprehensive GEOSS scenario. Emission data associated generated by a simulation of this scenario has therefore been extracted from the FeliX model to allow the derivation of a monetary value of the model’s outputs over the forecast period 2014 – 2030. It has been assumed that the EU as a whole can claim 20% of the value of outputs (equivalent to EU27share of world GDP), with the GMES programme representing a significant proportion of these benefits along with other EO systems managed by the Member States. The valuation is based on a social cost of carbon of €75, and the assumption that the scenario parameters simulated in the relevant runs of the FeliX model are, or will be, reasonably reflected in the design and operation of GMES services. The result of the analysis is shown in the figure below.
In cumulative (discounted) terms, the projected benefits have a present value of €120 billion over the time period. It is 7 times greater than the value of climate benefits used in the cost-benefit analysis for Option D, or 2.9 times higher than total benefits of Option D. Options A, B and C are not directly comparable as they are degraded and are therefore not used in the analysis.
Figure 8.21: FeliX Model - Total Benefits from the Emission Scenario, € Billion, 2010 Prices, Cumulative, Discounted
Source: Booz & Company analysis.
The figure below provides a direct comparison between total benefits for Option D and the Felix model outputs. It is noticeable that a substantial gap arises between the FeliX model and Option D during the 2020s. It might therefore be concluded, depending on the appropriateness of the FeliX model assumptions, that benefits in Option D do not fully capture some of the long term benefits that arise from the investment programme. In particular, this may be associated with some of the network related benefits that arise from investments in EO.

Booz & Company
Date: 19th September 2011 Cost-Benefit Analysis for GMES Final Version II
Prepared for: European Commission Directorate – Enterprise and Industry
136
Figure 8.22: Total Benefits for Option D and FeliX Model, € Billion, 2010 Prices, Cumulative, Discounted
Source: Booz & Company analysis.
GMES represents the EC’s contribution to GEOSS. Benefits projected by the FeliX model may therefore be seen as a way of demonstrating the value of a comprehensive GEOSS architecture. If the benefit profile is compared to the GMES programme costs for Option D, the BCR equates to 10.5. However, this comparison is overstating the true BCR as the GMES cost base represents only a portion of the total cost base supporting GEOSS. It would therefore be reasonable to expect the ‘true’ BCR to be significantly lower. However, the strength of the FeliX comparison is that it may provide a view of the absolute ‘best case’ scenario.
8.3.7 PWC 2006 Study
The PWC 2006 study has been referenced several times during study. It represents initial attempt on demonstrating the benefit case for GMES. The following figure presents total benefits in the PWC study. In the figure, all values have been adjusted to 2010 prices and discounted to 2010 to enable a direct comparison. In total, the PWC study included €46.8 million of benefits for the time period to 2030.
Figure 8.23: PWC Study - Total Benefits, € Billion, 2010 Prices, Cumulative, Discounted
Source: Booz & Company analysis.

Booz & Company
Date: 19th September 2011 Cost-Benefit Analysis for GMES Final Version II
Prepared for: European Commission Directorate – Enterprise and Industry
137
In comparison, this study has projected from total benefits for 2014 – 2030 to be from €29.4 billion (Option C) to €42 billion (Option D). The figure below shows the comparison of PWC with Options C and D. In relation the PWC study, Option C has a benefit reduction of 38%, and Option D a reduction of 11% (all compared on cumulative discounted benefits by 2030). Options A and B are not directly comparable as they have a limited time horizon.
However, of some interest is also the comparison to the adjusted PWC benefit projection. In PWC’s report, the majority of benefits were assumed to start from 2011 on the basis that the GMES programme would be sufficiently developed. To provide a more direct comparison, the take-up in the PWC projection has been delayed by three years. It means that majority of benefits come into effect from 2014, i.e. similar to the assumptions in this study. The result is that the PWC benefit projection is significantly reduced. In fact, projected benefits are only €27.5 billion (cumulative, discounted) by 2030, and therefore lower than benefit projections in Options C and D.
Figure 8.24: Cumulative Total Benefits Options C, D, PWC, and the Delayed PWC Profile, € Billion, 2010 Prices, Discounted
Source: Booz & Company analysis.
8.4 CONCLUSION AND OVERALL PERSPECTIVE ON COST-BENEFIT ANALYSIS RESULTS
The study has followed a framework that places GMES within its important strategic policy context. As a key strategic investment for the EU, the role of GMES is considered within the wider EO system, including GEOSS.
GMES is a powerful tool for the EU in relation to strategic positioning on the global arena, including providing direct support in relation to the EU’s foreign policy agenda, particularly on environmental issues and in support of relevant international agreements. In terms of the EU’s internal policy environment, the study has reviewed the role of GMES in supporting the implementation of EU policies at the national, pan-European and global levels. Furthermore, GMES supports the development of European space and downstream service industry sectors considered to be of key strategic importance. All of these considerations should be taken into account when reaching an overall conclusion on these options.
The work undertaken to address the requirements of the study has included:
� Literature review, i.e. comprehensive review of existing socio-economic studies of the benefits of EO data, and more general studies of environmental cost-benefit analysis;

Booz & Company
Date: 19th September 2011 Cost-Benefit Analysis for GMES Final Version II
Prepared for: European Commission Directorate – Enterprise and Industry
138
� Service review, i.e. review of the existing understanding of GMES services, including their operational preparedness and capability of responding to the new opportunities that will arise with the launch of the Sentinel satellites; and
� Stakeholder interviews, i.e. combination of phone interviews and face-to-face meetings with key experts in order to confirm findings, and explore the usage and potential benefits of GMES.
As demonstrated in Chapters 3 - 5, the above activities have resulted in establishing the baseline of the existing situation in relation to GMES, and enabled the presentation of a stronger case for the conjecture of future benefits from the GMES programme. It has confirmed key benefit areas where it is feasible to quantify benefits within the context of the study.
The review has also confirmed the positive contribution that GMES may play in supporting the EU in achieving its policy objections, e.g. within the Union, but also on a global level. It remains clear that GMES provides a strong basis for addressing many of the significant challenges that decision makers face; with particular regard to climate change and the responses which may be needed to address mitigation and adaptation requirements.
It is evident that the study has not found any published examples of GMES applications where there is a supporting quantified economic benefit case. It appears that the 2006 PWC report remains, with the exception of more recent impact assessments by the EC, the only available literature providing any form of socio-economic assessment of GMES.220 This observation is also one that applies in more general terms for EO. This finding is supported by the detailed literature review, including academic studies of the benefits of EO and the interviews undertaken with stakeholders. In general, all studies demonstrate a positive impact of EO221 in the context of supporting the management of the environment and natural resources, but it remains an incomplete body of knowledge. It appears to be the case that there is a large and very substantial gap between the technical programme development, and supporting scientific research, and the demonstration of direct quantifiable societal benefits.
An interesting area of work carried out by the GEO-BENE project (now superseded by EuroGEOSS) is in developing systems dynamic models that provide a global view of the interrelationships between socio-economic and environmental systems, and the potential impacts of improved levels of environmental information. These can be used to demonstrate the potential economic value of information at a global scale, to which GMES could be assumed to contribute in part through its role within GEOSS222. However, the core model assumptions are based on historic global socio-economic and consumption trends, with expert judgment required to develop assumptions of the impact of information on global behaviour, which are nested within the model. In addition, the extent to which the more
220 Fritz, Steffen et al.: “A Conceptual Framework for Assessing the Benefits of a Global Earth Observation System of
Systems”, IEEE Systems Journal, Vol. 2, No. 3, September 2008. 221 See for example “The Economic Value of Earth Observation from Space”, ACIL Tasman, September 2010. The report
provides an assessment of the value of Earth observation from space to the Australian economy. The projected economic impact on improving Earth Observation is shown as being significant, but the study also stresses the need for a multinational approach, in particular to reduce costs.
222 The argument that a sustainable Earth observation system requires a multinational effort is supported by the report “Achieving and Sustaining Earth Observations: A Preliminary Plan Based on A Strategic Assessment by the U.S. Group on Earth Observations”, Office of Science and Technology Policy (September 2010).
www.whitehouse.gow/sites/default/files/microsites/ostp/ostp-usgeo-report-eat-obs.pdf.

Booz & Company
Date: 19th September 2011 Cost-Benefit Analysis for GMES Final Version II
Prepared for: European Commission Directorate – Enterprise and Industry
139
influential scenario assumptions reflect the aspirations of the GMES programme could be explored in greater detail.223
The challenge for interviewees – and more generally economists in the area of EO – is the difficulty in clearly building a plausible causal relationship between additional EO data and the products being developed as part of GMES with quantifiable societal benefits. This is not surprising, as it requires not only a demonstration of how additional observational data impacts decision making, but also how those decisions will lead to improved outcomes in a highly complex and fragmented user and wider stakeholder environment community.
The overwhelming majority of interviewees considered that GMES has a notable role to play in some fashion across each of its service areas. As such, the starting position for the assessment is therefore to provide an overall confirmation that there is sufficient qualitative evidence in support of the benefit case. Furthermore, the benefit case is supported by specific quantitative examples where services have been developed to address particular objectives within the policy framework, such as work by the JRC on using EO data to reduce fraud claims under the EU’s CAP, or as demonstrated by recent studies.224 It is also supported by strong empirical evidence stressing the importance of information in reducing uncertainty around the occurrence and impacts of future events.
The analysis has demonstrated the value of remaining committed to the GMES programme. Option A with no on-going commitment to replace infrastructure or investing significantly in services is the one with the lowest net benefits. Increasing levels of commitment to the programme, supported with increasing investments and service guarantees provide increasing levels of benefits. This is demonstrated in Options B, C and D although the step-change in Option C and Option D is also associated with a much higher level of benefits.
The benefits of Option D are higher than any other option assessed. This arises from the deployment of additional funds aimed at mitigating the risks to the long-term continuity of data from the Contributing Missions. If carried out, this would represent a cost-shift from the Member States and other Contributing Missions to the GMES programme. Sensitivity analysis shows that the BCR would be higher if these risks could be managed within the Contributing Missions (assuming no pass through of higher infrastructure costs to the GMES programme), highlighting the extent to which future developments in this area can materially affect value for money.
Other sensitivity analyses have been used to test the impact of varying key assumptions. In particular, the impact of changes in the assumed impact of GMES can be substantial. However, two interesting aspects of the sensitivity analysis have been in relation to the FeliX model and the previous PWC study. The FeliX model generates substantial benefits. It illustrates a robust framework for demonstrating a potential up-side scenario to investing in GMES as part of a comprehensive EO system. Furthermore, total benefits projected in this study are lower by 2030 than in the PWC study. However, assuming a three year delay in the PWC benefit profile (as majority benefits started in 2011), it can be shown that the benefit projection in this study is actually higher by 2030. It therefore provides a strong reference
223 See also discussion on the limits of economic modelling by Frank Jotzo, “Market- and Policy-Driven Adaptation” (pp. 284-
291) in Bjørn Lomborg’s “Smart Solutions to Climate Change: Comparing Costs and Benefits”, Copenhagen Consensus Center, 2010. This, in particular, concerns the economic modelling of climate change. Modelling tools may be able to give important qualitative indications at the aggregate level, but of limited use at a disaggregated level.
224 NOAA: “An Investigation of the Economic and Social Value of Selected NOAA Data and Products for Geostationary Operational Environmental Satellites (GOES).

Booz & Company
Date: 19th September 2011 Cost-Benefit Analysis for GMES Final Version II
Prepared for: European Commission Directorate – Enterprise and Industry
140
point to previous studies, and to some degree confirms the high socio-economic value placed on EO data, and GMES as a programme.
It also demonstrated in quantitative assessment that half of total benefits associated with GMES will come from climate change observation, modelling and adaptation. Obtaining systematic information about the climate, and the ability to create time series over extended periods, may prove of great use in the future in terms of monitoring existing agreements and targets, but also in shaping new agreements.
It is apparent that public sector investments in the space sector, and in the downstream service sector, may provide significant spillover effects in areas deemed important by policy makers (as well as potential for employment and innovation in technological and “green” businesses).

Booz & Company
Date: 19th September 2011 Cost-Benefit Analysis for GMES Final Version II
Prepared for: European Commission Directorate – Enterprise and Industry
141
9. GMES BENEFIT ENABLERS
9.1 CHALLENGES FOR THE FUTURE
GMES has the potential to deliver substantial benefits at a global and EU level, whilst complementing EU policy goals over the longer term. Indeed, the full extent to which it can do this is difficult to predict accurately, primarily because GMES will gather information over a long period of time that will enhance understanding of the Earth and its systems, and humanity’s interactions with, and effects on these systems.
GMES will do this by ensuring data continuity, improving data access and plugging gaps in data availability, as well as providing an integrated EU framework for the collection, distribution and usage of EO data. By contributing to GEOSS, it will help to develop understanding of major transnational issues, such as climate change. However, certain risks do exist which, if not addressed at an early stage, could result in GMES being unable to realise its full potential.
No major infrastructure or service programme can achieve its potential unless key enablers are identified and steps are taken to ensure that constraints to delivery are addressed in a timely way. This chapter outlines the key challenges and limitations of the current programme, and highlights the issues that will need to be addressed to unlock the promise that GMES presents for Europe and the global environment. These issues range from ensuring a timely and cost effective delivery of the programme, to maintaining adequate funding to sustain GMES over the longer term.
The main issues identified through this study as presenting potential limitations to the full realisation of GMES are:
� Uncertainty around long term data policy;
� Potential for a lack of awareness across, and engagement with, the downstream sector;
� Uncertainty over Sentinel ownership and maintenance;
� Lack of central user engagement and role in the strategy and management of GMES;
� Uncertainty over the sustainability of economic benefits;
� Existing funding sources and processes; and
� Overlapping and divided roles and responsibilities for governance.
9.2 DATA POLICY
9.2.1 Issue Identification
It is critical that the collection, handling, processing, distribution and storage of GMES data is carefully managed and controlled, with clarity of rights and obligations around data. Several stakeholders have indicated that the development and management of a data policy should be a priority, and that this should guarantee reliability and continuity of data flows and take into account any security restrictions (whether constant or initiated at short notice). As such, the assumption of free and open access to data underpins the benefit assessment.
Certainty around data availability (and the frequency of updates and standards for that data) helps to build confidence to enable applications and services to be developed using that data. Although references to open access data are seen in several GMES documents

Booz & Company
Date: 19th September 2011 Cost-Benefit Analysis for GMES Final Version II
Prepared for: European Commission Directorate – Enterprise and Industry
142
(including the current Regulation), there remains uncertainty among stakeholders interviewed as to whether that may remain the case.
In addition to the matter of open access, there are concerns that some data may be restricted, ad hoc, for security purposes, and that privacy concerns over EO imagery may not be respected. There may also need to be greater clarity as to the intellectual property status of raw and archived data. This is likely to influence the basis upon which GMES gathers data from third party sources and what agreements are put in place with regard to such data.
Both users and service providers see the importance of an effective data policy as critical. Such a policy may adopt a different approach for non-EU users, although there are likely to be difficulties in exercising control over access by non-EU users, especially if users in the EU are given relatively unfettered access.
9.2.2 Proposed Approach
There are many references in communications on GMES to the need for an open data policy. It is important that end users and potential downstream service providers feel that there is sufficient certainty in this area. Public policy-makers and authorities are likely to remain the primary users of GMES. However, data access should be aimed at the full set of users to ensure that GMES has the greatest possible impact.
It has been stressed during interviews that restrictions on the availability of data could have significant negative consequences on the development of downstream services and general user take-up. This could be weighed against the impact on other European Contributing Missions. However, as the downstream sector is dependent on the widest availability of data, and public sector usage will be maximised by the same, it appears that the greatest benefits are likely to come from the most open access to raw data within any constraints regarding contractually provided data.
A comprehensive data policy, covering open access and issues of intellectual property, privacy, security, data standards and interfaces and archive policy should be developed in consultation with the user community, and be treated as one of the central principles of the GMES project. It will need to be considered in the context of EU laws, and policies particularly concerning privacy and security, and also the context of Member State national laws on matters such as intellectual property and contract law. Data access policies for any data obtained through Contributing Missions and in-situ locations are likely to be more complex, at least at first. A strategy should be developed to seek to harmonise treatment of such data, and to simplify such policies to the extent compatible with retaining high standards of data access for users.
Such a policy should be publicised to enable service providers, Contributing Missions, in-situ providers and the downstream sector to understand what rights and obligations are in place concerning data.
One of the significant enablers of value in EO data is being able to make useful comparisons with similar or related data, whether current or historical. GMES is likely to be best placed to facilitate the widest possible utilisation of such observations. Therefore, concurrent with the above should be the close integration of GMES outputs with ongoing developments225 to create a decentralised data storage, sharing and management facility which enables users and service providers to access data efficiently and over long time series.
225 Specifically the Shared Environmental Information System (SEIS)

Booz & Company
Date: 19th September 2011 Cost-Benefit Analysis for GMES Final Version II
Prepared for: European Commission Directorate – Enterprise and Industry
143
Issues of security and privacy will need to be taken into account when there needs to be due protection for archived material (although this may not need to be indefinite).
9.3 DOWNSTREAM SECTOR
9.3.1 Issue Identification
A key part of realising the potential of the industrial policy goals of GMES is to facilitate the development of a commercial downstream sector of service providers and applications using data supplied through GMES. This requires a clear and comprehensive data policy as explained above, but it would also benefit from a clear strategy to engage with, co-ordinate and support the downstream sector.
At present, the downstream sector is dispersed, and whilst comprised of both large and small service providers, the majority fall into the latter category. Few of these connect to or have relationships with others, and they are not organised or co-ordinated into a “user community”. Even the European Association of Remote Sensing Companies (EARSC), with over 60 members, does not believe its membership is all encompassing and does not have a full understanding of the complete size of the sector. To take full advantage of the chance to develop and grow this SME based sector, it will be important for those participants to understand that they are considered to be valuable.
In coming years, GMES will facilitate the supply of vastly increased amounts and types of EO data and products that could enable a new generation of services to be offered for end users, based on innovative processing methodologies and integration with other datasets. There is evidence this is already starting to happen in the United States.
However, without continued strong engagement with the existing and potential sector, and a refined understanding of its needs, the EU may not catalyse interest sufficiently and there may be barriers to entry that are currently unknown. It is likely that the downstream sector will require a more commercial approach to increased engagement than that which has been applied to date.
9.3.2 Proposed Approach
In order to catalyse the downstream sector, a commercial strategy should be developed for downstream sector development that will include performance milestones and a range of initiatives to explore and develop such services. This strategy should be business oriented and include as a bare minimum the following:
� Market assessment and investment support, i.e. identification of the current sector and potential ranges of service offerings to inform a strategy to promote investment and development;
� Communications and engagement strategy, i.e. with the current downstream sector to learn lessons and understand barriers to growth and innovation;
� Marketing campaign, i.e. promote GMES as a platform for downstream services when there is clarity on data policy and other factors that are critical in assessing market interest;
� Commercial focus, i.e. establish a dedicated commercial function within the governance of GMES for relations with the downstream sector, with the primary goal of becoming the central repository for information on the services offered by the sector. This could

Booz & Company
Date: 19th September 2011 Cost-Benefit Analysis for GMES Final Version II
Prepared for: European Commission Directorate – Enterprise and Industry
144
encourage consolidation, competition and enable virtual “clustering” of experience and ideas to help encourage sector participants to be innovative.
Such a strategy should be the start of a two-track approach to the GMES user community. A public policy oriented approach with public sector users, and a new commercially oriented approach to the downstream sector. Such a strategy could help promote the notion among downstream sector participants that they are part of a “network” of GMES users, and that there may be synergies and benefits in them understanding and interacting with each other (and being organised to represent their interests in GMES management). Some steps have already been taken in promoting user communities for GMES, but more could be done.
By encouraging a more active two-way flow of information and dialogue with the downstream sector, there is likely to be more chance of that sector growing and taking advantage of the range of information available through GMES.
9.4 SENTINEL OWNERSHIP
9.4.1 Issue Identification
The Sentinels are being developed by ESA, but cannot be owned by ESA for operational purposes beyond research and development, given ESA’s mandate and the basis given for funding of the Sentinels. A solution will be needed to determine which entity should own and be responsible for the ongoing funding to maintain and operate the Sentinels once Sentinel 1 comes into operation. Key considerations will be:
� Ability and powers to develop a sustainable funding solution for the maintenance and renewal of the Sentinels;
� Incentives and capabilities to manage and optimise the utilisation of the Sentinels;
� Incentives and capabilities to specify the replacement generation of Sentinels, so as to best meet the needs of users; and
� Avoidance of any conflicts of interest that may compromise managing, using and developing the Sentinels in a cost effective and efficient way.
Different ownership options are not considered likely to affect the benefits attributed to GMES to a significant degree, as long as data availability is guaranteed. However, it is not possible to quantify the impact on overall costs at this stage.
9.4.2 Proposed Approach
A task force already exists to determine the answer to this issue, so should be encouraged to proceed with its work. The best option for the future of the Sentinels should be considered in the context of the future strategy to manage the GMES programme. This would need to be considered as part of any future analysis into options for GMES governance, with the intention being to optimise the development, maintenance and utilisation of all parts of the GMES EO infrastructure, and to balance value for money and operational performance.
9.5 ROLE OF USERS
9.5.1 Issue Identification
The GMES programme has, since its early stages, been characterised by a focus on the needs of users, with increasingly structured engagement mechanisms. GMES has a growing group of users, comprising both the downstream commercial sector (as mentioned previously) and

Booz & Company
Date: 19th September 2011 Cost-Benefit Analysis for GMES Final Version II
Prepared for: European Commission Directorate – Enterprise and Industry
145
the largely public sector users (and their clients). It is these groups that will ultimately justify the investment in the GMES programme, as they will be able to initiate policies and operational procedures to take advantage of the data made available through GMES. In the longer term it is their support and their utilisation of GMES that will drive future investment and should provide the key point of engagement as to strategies for the future of GMES.
Engagement with users in GMES has been undertaken so far through a number of initiatives, such as the now completed GNU (GMES Network of Users) FP6 project, and the newer GMES User Forum that has been established, comprised of Member State-nominated representatives. The GNU made specific recommendations for greater user representation in GMES governance, such as establishment of a user board with specific roles to contribute to strategic decision making.
As GMES usage and the user community grows, there may be advantages in increasing the visibility and input of users into the governance of the programme. There will be a significant advantage to the programme if users can help in identifying barriers to GMES take-up and opportunities for collaboration and to help to catalyse the service provider sector. Users also have high incentives to promote standards of service and performance, and to be advocates for GMES at the political level when required.
Conversely, if user participation in strategic decision making is downgraded, there may be risks of less accountability in delivering the GMES programme on time and on budget, and that the opportunities to realise the benefits from GMES are neglected.
9.5.2 Proposed Approach
Options for engaging users directly in the governance of GMES, both at the operational and strategic levels, could be developed further. This could be tied to any governance reform.
It is recommended that a clearly defined strategy be developed:
i) to involve users in helping to drive the medium and long term programme forward;
ii) to be advocates for GMES; and
iii) to find ways for them to develop a stronger interest in the programme’s success.
If any significant changes in governance are to be undertaken, then these should take into account the possible roles and responsibilities of users, and how to incorporate them into the overall governance framework more deeply than at present.
Users should be at the heart of the GMES programme, with strategies developed to engage with and respond to the various user communities by domain and sector (e.g. EU and Member States, downstream land-based services, climate change users).
9.6 SUSTAINING ECONOMIC BENEFITS
9.6.1 Issue Identification
GMES is expected to provide the EU with a positive economic impact. This impact would be eroded if future funding decisions are not optimal or if costs escalate. As such, there would be a need to ensure ongoing evaluation of any investment strategy, including specific programmes to invest in services and infrastructure. Whilst options considered in this report are useful for a high level evaluation of comparative costs and benefits, none are likely to represent an optimal approach for the GMES programme without more work undertaken on the detailed components. Without more detailed refinement of the selected option, there is a

Booz & Company
Date: 19th September 2011 Cost-Benefit Analysis for GMES Final Version II
Prepared for: European Commission Directorate – Enterprise and Industry
146
risk that expenditure would not be directed to make best use of the available funds, given the very high levels of investment that are being considered. In addition, for lower cost options there may be alternative ways of addressing gaps that have not been investigated.
9.6.2 Proposed Approach
Development of a framework (or appraisal guidance) to evaluate future investments and assess performance against expectations after implementation could provide incentives to continuously check and consider whether expenditure is correct, and to help inform decisions about whether to make any programme changes.
This ex-post impact evaluation could also be the source for a growing body of knowledge on “lessons learned” and improve the assessment and evidence base of investment in GMES services and infrastructure. Over time, this should result in a net improvement in the economic case for expenditure in GMES because a culture of maximising benefits will have been developed.
Similarly, a culture of continuous improvement and efficiency would be encouraged if an annual reporting process was developed to measure success against key performance indicators. This could be independently audited. It will also ensure that policy and technological obsolescence issues are captured at the “right time” to avoid reliance on strategies that may no longer be appropriate some years after they had been developed.
In addition, if any of the options in this report are taken forward, considerable work would need to be undertaken to refine the detail behind the option. This should be undertaken in consultation with users in particular, so that timing, sequencing and the blend of expenditure on Sentinels, Contributing Missions, in situ data and services can be optimised. Detailed work should commence on the agreed option to consider its priorities, based on this report (e.g. climate change) and how the option can meet those priorities within the agreed funding limitations.
9.7 FUNDING AND FINANCING OF GMES
9.7.1 Issue Identification
Funding of GMES to date has been accomplished through a combination of sources, notably ESA, the EC, Member States and other intergovernmental entities. However, whilst past funding has suited what has in essence been a research and development programme, it is unlikely to be the best approach for the long term maintenance and development of space and ground based infrastructure, given the importance of continuity and certainty for the development of the downstream market.
The shift toward an operational model that requires ongoing funding means that the past approach to funding may not be adequate to provide certainty both for service development, and for the maintenance and renewal of infrastructure. The greatest risk for the programme is that the mix of roles and responsibilities, and the use of multiple funding streams could mean that budgetary discipline is spread across a variety of sources and programmes, creating risks that are not able to be fully managed, and in turn creating effects well beyond those carried by the entities responsible.
In particular, having such a diversified programme creates potential inconsistencies in schedules and policies, as well as placing responsibility for the management of risks in places where they may not be best managed.

Booz & Company
Date: 19th September 2011 Cost-Benefit Analysis for GMES Final Version II
Prepared for: European Commission Directorate – Enterprise and Industry
147
EC financial rules limit the ability of the programmes to secure funding for projects with a long operational life or to support infrastructure that is predominantly or entirely dependent on public funding. Given one of the key benefits of GMES to the EO sector is to ensure continuity and certainty of service provision, it will be important to develop funding solutions that will create confidence that this can be delivered.
In addition to the continued funding of services, ideally financing options should be available for the longer term renewal of GMES infrastructure as it arises.
As GMES has been almost exclusively a public sector funded programme, there is interest in there being greater private sector and commercial contributions towards the sector over time. Whilst this is expected in the downstream sector, barriers to private sector participation should be avoided, partly to help offset public sector sources, but also to introduce innovations and incentives that may not be available from the public sector.
9.7.2 Key Principles to Guide Financing Options
GMES services are characterised by users who are dependent on high standards of data and information they can depend on in order to inform public and private sector responses to activities. This includes life critical services such as emergency management and security at times of emergency and humanitarian crises. The principles that should guide financing options for GMES should be based upon supporting the key features of the GMES service programme. These principles should include:
� Ensure high standards of data quality and accuracy: Financing solutions should incentivise maintaining high quality and accuracy of data and information collected through the GMES system, and avoid incentivising cost saving measures that degrade this. The standards of data and information are key to extracting the value from the GMES system;
� Ensure high standards of consistent and reliable service: Confidence that data and information continues to be collected and available on a consistent basis is important to ensure GMES is seen as the primary source of such information. Financing solutions should ensure that regular and reliable collection and distribution of information can be maintained and is incentivised;
� Maintain compatibility and co-operation between sentinel, national and in-situ services to optimise the collection of data: Financing solutions should incentivise the collaboration and optimal use of available sources of data from space and in-situ sources, and the collection and integration of this information for access and distribution;
� Ensure long term sustainability and renewal of space assets: Key components of the GMES system are the Sentinel mission assets that need ongoing maintenance and eventual renewal over time to ensure continuity of service. Financing options should ensure an uninterrupted renewal process that preserves service over time;
� Promote positive business and service relationships between users, suppliers of the GMES service and the delivery of the GMES space and in-situ infrastructure to support the services, so that quality and reliability are maintained;
� Promote operational efficiency without compromising output quality: Financing options should incentivise the most cost effective approaches to delivering the outputs demanded by the user community. This is to ensure that disciplines on operational and capital expenditure are maintained to optimise investment in the system as a whole;

Booz & Company
Date: 19th September 2011 Cost-Benefit Analysis for GMES Final Version II
Prepared for: European Commission Directorate – Enterprise and Industry
148
� Output driven rather than technology driven approach: The existence of the GMES programme is to deliver high standards of environmental information services for scientific and other public purposes. It should be driven by the quality, thoroughness and standards of data and information gathered, regardless of source. Financing solutions should incentivise an overall system that delivers outputs that are optimal for users, rather than be technology or source specific; and
� Flexibility to meet adjustments in demand and technology: Being scientifically driven, the GMES programme cannot be expected to anticipate all of the needs or issues for data and information in the medium to long term, nor the means best available to acquire that. Financing mechanisms should be sufficiently adaptable to meet changes in requirements both at the output level and the level of data collection and EO.
9.7.3 Funding Issues by GMES Segment
9.7.3.1 Space Component
Funding will be required to maintain the Sentinels throughout their expected lives, and to finance the development, deployment (and maintenance) of their successors. It is possible to deliver this either through funding streams for operation and grants for capital, or by using contracts with private providers for the financing, construction, deployment and operation of GMES.
In addition, funding for contributing mission data and support for missions themselves may need to be considered.
9.7.3.2 Service Component
Funding will be required to maintain services that are of a public service nature to ensure continuity (and enhancements if these are justified on a case by case basis).
9.7.3.3 In Situ Component and Integration of Data
Funding will be required to contribute towards in-situ infrastructure and services if the benefits from data obtained from such sites are substantially greater than what the owners are willing to pay for. There will also need to be funding to maintain and sustain co-ordination of data compilation and archiving.
9.7.4 Options for Financing
9.7.4.1 Use of Private Sector Financing
Innovative options for major infrastructure programmes are typically linked to the ability to access revenue from users or other third parties to leverage a combination of debt or equity interest in investing in the infrastructure concerned. This is the model seen in many public sector infrastructure projects across Europe, particularly in the transport, but also in health, justice, water and education sectors among others.
However, GMES does not have the characteristics necessary to be able to leverage significant private sector involvement because of the predominant ‘public good’ nature of the programme. With limited short-term prospect of third party revenue, the only key role for the private sector would be in harnessing EU funding to deliver the project on time and within budget using competitively tendered commercial disciplines and management.

Booz & Company
Date: 19th September 2011 Cost-Benefit Analysis for GMES Final Version II
Prepared for: European Commission Directorate – Enterprise and Industry
149
The primary option for financing and funding going forward is going to be EU funding, associated with the funding expected at the Member State level for Contributing Missions and In-Situ data collection. Whilst in theory large infrastructure projects can lend themselves towards private financing solutions, given GMES does not generate direct revenue, it is difficult to see long term contracts can be developed for period that are longer than are likely to be guaranteed by the EC.
There is scope to use output-based contracts for private sector management and development of the Sentinel network in order to manage risks and costs. However, the primary issue is ensuring that such contracts could be of sufficient longevity (and that existing governance structures are well placed to negotiate such complex, robust and high value contracts without high transaction costs) to be worthwhile.
There could be potential to spread the costs of GMES infrastructure provision and maintenance over time, and derive value from reduced costs and ensuring timely and quality delivery of data, if there can be scope to allow for contracts beyond the EU funding cycles (e.g. at least ten years), that would be:
� Output driven (based on measures such as reliability, quality and consistency); and
� Combine funding for infrastructure provision and maintenance.
To gain the benefits of such an approach, procurement would have to be undertaken in the context of:
� Long-term funding guarantees of at least 10 years, preferably longer, to give the private sector sufficient certainty of income to be willing to enter into contracts at prices that would be competitive; and
� Substantial effort to develop a procurement and contracting approach that extracts value and savings for the EC and GMES users to offset the transaction costs of taking such an approach.
9.7.4.2 Enhancing Public Sector Funding and Financing
Regardless of whether private sector initiatives are used, there is considerable merit in reforming how public sector funding flows to the programme. An output based approach, whereby all sector participants that receive public funding do so on a performance basis (with appropriate sanctions for poor performance) with specific delivery targets linked to payment would help to reduce risks of delay and improve performance. This may be enhanced if governance of GMES is reformed.
The principal objective here is to ensure the optimal blend of grants and service payments, as well as develop a long-term funding strategy to provide financial certainty for the public sector infrastructural part of the sector.
9.7.5 Proposed Approach
The key benefits of reforming the funding of GMES are likely to come when funding and financing is linked to:
� Risk management (on cost, schedule and quality of service);
� Ongoing performance management;
� User requirements; and
� Long-term capital investment requirements.

Booz & Company
Date: 19th September 2011 Cost-Benefit Analysis for GMES Final Version II
Prepared for: European Commission Directorate – Enterprise and Industry
150
The foremost priority is to allow for funding that is guaranteed on such a time scale that enables performance specified contracts to be set with infrastructure providers and service providers. However, it is not clear whether this capability is currently present in the programme. Given the risks involved, it is important to clearly identify procurement expertise in major public/private partnership contracts. Without reform, the GMES programme would have to continue to be sustained through the FP process, with a mixture of support through ESA funding for new infrastructure, funding to maintain the Sentinels in due course and funding for services. Whilst this can enable GMES to continue to develop, it may not realise the full potential of the programme, and will require a different approach to manage risks, particularly for the Sentinel programme, of delays and cost escalation. By contrast, long-term performance specified contracts for the Sentinels might be structured to incentivise suppliers to focus on minimising such risks, as long as prices were obtained that could deliver sufficient value from such contracts.
Assuming governance reform is undertaken, it would be logical for new arrangements to come into effect no earlier than 2014 to match the next Framework Programme, and to allow for a long term financial strategy to be prepared.
9.8 GOVERNANCE
9.8.1 Issue Identification
The existing governance arrangements for GMES are complex and unlikely to be ideal for the optimal long-term development and enhancement of the sector. A central point often raised by stakeholders during interviews was the need to consider governance as the programme develops, in particular with the Sentinels coming into operation. The reasons for this include:
� Complex interrelationships between actors (EC, ESA, EEA, national space agencies, national environment agencies, as well as end users) with different decision-making bodies having different approaches and schedules inhibiting co-ordination;
� Roles not clearly defined, with some overlap. This was a risk previously identified for the Galileo programme which has resulted in multiple changes in governance structures;
� Strategic decisions are split between ESA, EEA (for in-situ sites) and the EC, reducing the ability to deliver a coherent series of strategies to address key issues such as procurement, user relationships, downstream service provider incentives and performance measurement;
� Lack of commercial focus or drive to optimise value from the downstream sector;
� Risks that Contributing Missions and in-situ providers are neglected and not optimally utilised; and
� Risks that procurement and risk management in the programme are neglected because of a lack of power and sufficient capacity to take control of high risk issues.
Improved understanding of the business model for GMES services would provide a stronger basis for assessing GMES costs and benefits. A governance structure that is incentivised to manage risks, to engage with the downstream sector and users may be better placed to ensure GMES can be delivered to meet the high expectations of those who support it.

Booz & Company
Date: 19th September 2011 Cost-Benefit Analysis for GMES Final Version II
Prepared for: European Commission Directorate – Enterprise and Industry
151
9.8.2 Proposed Approach
There is an opportunity to consider governance reform to enable the GMES programme to be secured over the medium to longer term. Such reform should not be rushed, but should be undertaken to provide certainty and to empower the right entity to be able to have responsibility and accountability for performance of GMES as a whole. The opportunity to reform should be developed in advanced of the operational phase for Sentinel 1 from 2014, and thus provide stability and leadership for the sector.
Investigation of governance options should consider:
� Specification of roles and responsibilities for all actors;
� Specific strategies and documentation required of the relevant entity;
� A better defined role for users in the management and consultation of infrastructure management and funding;
� Avoidance of real and perceived conflicts of interest and provision for the highest standards of accountability and transparency in performance, with sanctions and mechanisms to address critical failings;
� Identification of property ownership, contractual and funding responsibilities;
� A structured risk management approach to programme delivery;
� Adequate long term assurance as to the financing and funding of space, ground and data management infrastructure, and ongoing support for public sector services;
� A distinct role for support of climate change policy as a priority area for GMES; and
� Core objectives to ensure cost effectiveness, economic efficiency and financial responsibility for the programme;
Governance reform should ensure complete programme management over the longer term, and enable the recruitment of skilled, talented and motivated staff that would be expected to realise the benefits of the sector as a whole, and work in collaboration with private and public sector partners at Member State, EU and global levels.
One of the key cost factors in the programme is management of risk. Inadequate risk management can result in cost inflation, particularly for capital intensive components and delays in deployment that will hinder downstream service development and the deployment of services and resulting benefits.
Finally, a wide range of specific strategies should be developed by any future governance entity to support the development of GMES. These should at least include:
� Long term data infrastructure strategy which is not technology specific, but driven by user demands;
� Service development programme;
� User and downstream service provide engagement strategy;
� Strategy for engagement with non-EU partners and Contributing Missions;
� Regulatory framework for GMES;
� Communication strategy on GMES;
� Risk management strategy for programme delivery; and
� Procurement strategy.

Booz & Company
Date: 19th September 2011 Cost-Benefit Analysis for GMES Final Version II
Prepared for: European Commission Directorate – Enterprise and Industry
152
9.9 CONCLUSION
GMES has the potential to deliver considerable net benefits for the EU across priority policy areas of climate change, environmental policy and industrial policy. However, given the sheer scale and longevity of the programme, such high levels of spending come with the risk that net benefits may not materialise as predicted. The key reasons for this are:
� Uncertainty and gaps in policies on data that could be a constraint upon the downstream sector;
� Insufficient commercial focus and lack of a strategy to respond to what is needed to catalyse the downstream sector;
� Insufficient engagement and influence with users, creating the risk of a programme that appears to be supplier and public sector driven, rather than end-user driven;
� Risks of substandard expenditure on infrastructure and services at the detailed level over the longer term as requirements, technologies and policies evolve;
� Inadequate risk management and programme management approach to the programme;
� Restrictions on funding and financing options that severely limit the scope to engage the private sector in long term performance oriented contracts; and
� Overlapping and divided roles and responsibilities for governance leading to a lack of strategic focus for the GMES programme.
Whilst this chapter includes a number of key enablers that could address these issues, by far the highest priority should be a comprehensive assessment of the governance needs and options for GMES. GMES needs strong strategic leadership, with a programme approach that is dynamic, has a first-class risk management strategy and will fully engage with users and the downstream sector in the ongoing development and delivery of its programme. It should be focused on delivering across the high impact benefit areas such as climate change and environmental policy, and facilitating the development of the downstream sector.
If governance issues are addressed, it could also provide a strategic foundation for the EU developing GMES as a world-class, leading base for EO with a downstream sector that grows to its full potential. Given the sheer scale of investment involved, it would be in the best interests of the EU to maximise the potential return from this, and to take GMES from being partially dependent on a set of research and development projects delivering pilot and pre-operational services, to a fully-fledged operational programme providing a valuable contribution to a wide range of public policy and private purposes.

Booz & Company
Date: 19th September 2011 Cost-Benefit Analysis for GMES Final Version II
Prepared for: European Commission Directorate – Enterprise and Industry
153
Appendix A Glossary
Abbreviations & Acronyms
Term Explanation
BCR Benefit-Cost Ratio
CAFÉ Clean Air for Europe
CAP Common Agricultural Policy
CBA Cost-Benefit Analysis
CCS Carbon Capture and Sequestration
DALY Disability Adjusted Living Years
DECC UK Department of Energy and Climate
DEFRA UK Department for Environment, Food and Rural Affairs
DS Downstream Service
EC European Commission
ECHO Emergency Coordination Humanitarian Aid department of the Commission
ECMWF European Centre for Medium-range Weather Forecast
ECCP European Climate Change Programme
ECV Essential Climate Variables
EEA European Environment Agency
EFAS European Flood Alert System
EFDAC European Forest Data Centre
EFFIS European Forest Fire Information Service
EM-DAT Emergency Events Database
EMSA European Maritime Safety Agency
EO Earth Observation
ETS Emissions Trading Scheme
ESA European Space Agency
ESTAT Exploratory Spatio-Temporal Analysis Toolkit
EU European Union
EUMETSAT The European Organisation for the Exploitation of Meteorological Satellites
EUROSUR European Border Surveillance System
FEDER European Regional Development Fund
FP Framework Programme for Research and Technological Development
GCM GMES Contributing Missions

Booz & Company
Date: 19th September 2011 Cost-Benefit Analysis for GMES Final Version II
Prepared for: European Commission Directorate – Enterprise and Industry
154
Term Explanation
GCOS Global Climate Observing System
GEOSS Global EO System of Systems
GHG Greenhouse Gas
GIO GMES Initial Operations
GISC GMES In situ Coordination project
GMES Global Monitoring Environment & Security
G-MOSAIC GMES services for Management of Operations, Situation Awareness and Intelligence for regional Crises
GNSS Global Navigation Satellite Systems
GNU GMES Network of Users
GOOS Global Ocean Observing System
GSC GMES Space Component
GSE GMES Service Element
HR High Resolution
HSPG High Level Space Policy Group
IMO International Maritime Organisation
IPCC Intergovernmental Panel on Climate Change
JRC Joint Research Centre
LTS ESA Long Term Scenario
LR Low Resolution
MAC Marginal Abatement Cost
MR Medium Resolution
MRD Mission Requirements Document
NARMA Natural Resources in Africa
NOAA US National Oceanic an Atmospheric Administration
OECD Organisation for Economic Co-operation and Development
PCNA Post Crisis Needs Assessment
PDNA Post Disaster Needs Assessment
PWC Price WaterhouseCoopers
QA Quality Assurance
SAFER Services and Applications For Emergency Response
SAR Synthetic Aperture Radar
SBA Societal Benefit Area

Booz & Company
Date: 19th September 2011 Cost-Benefit Analysis for GMES Final Version II
Prepared for: European Commission Directorate – Enterprise and Industry
155
Term Explanation
SCC Social Cost of Carbon
SME Small- or Medium-sized Enterprise
SPC Shadow Price of Carbon
UNCCD United Nations Convention to Combat Desertification
UNEP United Nations Environment Programme
UNFCCC United Nations Framework Convention on Climate Change
UNFF United Nations Forum on Forests
VOI Value of Information
VHR Very High Resolution
WHO World Health Organisation
WMO World Meteorological Organisation
Definitions
Term Explanation
Benefit Positive change in value directly or indirectly attributable to a solution being applied to a problem
Contributing Missions (CMs) GMES relevant space missions already existing at national or European level
Core Services Term refers to pre-2011 Earth GMES terminology and is no longer in use
Downstream Services Services not financed by the GMES programme and based on GMES services and/or other added value (EO) information (to be funded by users)
Fast Track Services Pre-operational GMES services, or GMES Pilot Services soon to be superseded by actual GMES services
GMES Initial Services GMES services agreed by the GMES advisory council, which led to the Fast Track services
GMES Service Elements Programme undertaken by ESA to develop pre-operational GMES services based on prior effort to develop core services with three European level service portfolios, Four regional level service portfolios, and information services
GMES Services A service component funded by the EC and ensuring access to information in the support of areas defined by EC GMES regulation
Impact Economic, social and environmental consequences of a policy or solution, either direct or indirect, either positive or negative
In situ Sensor – usually ground based, airborne or sea based – closely located to the observed phenomena, as opposed to remote sensing
Remote Sensing Observation of the Earth from the sky or from space

Booz & Company
Date: 19th September 2011 Cost-Benefit Analysis for GMES Final Version II
Prepared for: European Commission Directorate – Enterprise and Industry
156
Appendix B GMES System Details
B.1 INTRODUCTION
The GMES programme is composed of three main building blocks also referred to as components:
� The Space Component;
� The in situ component; and
� The GMES services.
The GMES Space Component (GSC) aims at providing EO data collected from space. In its operational configuration the GSC will rely on data provided by dedicated GMES missions, the Sentinels, as well as Contributing Missions (CMs) from national or commercial missions. The architecture of the GSC has been derived from the service requirements provided by the user communities. ESA and EUMETSAT play the major role in co-ordination, implementation and operational running of the infrastructure. The ESA Long Term Scenario226 (LTS) of the GMES Space Component defines a long term plan for the space infrastructure based on user requirements. In the current pre-operational phase it solely relies on Contributing Missions.227
The GMES in situ component is based on observation infrastructures owned and operated by a large number of stakeholders, though often Member States. The observation means include ground-based, airborne and ship- or buoy-based measurements. This infrastructure is often coordinated in the frame of European or international networks, but also operated by national, regional or local networks (e.g. for Air Quality sensors). The in situ observation activities, and associated infrastructure, derive from a range of national, EU and international regulatory requirements and agreements, or form part of research processes. These were not created specifically to meet the needs of GMES, and cover a much wider field than the GMES services. For this reason the European Environmental Agency (EEA) was appointed to co-ordinate the consolidation of in situ networks for GMES purposes. Currently this coordination is operated through the GMES In Situ Coordination project (GISC).
The in situ component is still in an early stage of its development phase, although most of the infrastructure exists and is already operational and used for other non-GMES purposes. Part of this is because the in situ data requirements from the services and the link to products have not been identified. A gap analysis is still to be finalised.
The GMES In situ Coordination project (GISC) is in charge of identifying and prioritising the gaps to be filled by 2014 between the data available through the various national and international in situ infrastructures and the needs for GMES. The GISC is financed by the EU 7th Framework Programme and will run for 3 years during the pre-operational phase (January 2010 – December 2012).
The GISC recommends investments in additional infrastructure, operations, data access and coordination. Four in situ services have been defined within the in situ component to
226 ESA/PB-EO(2010) 69, 10 May 2010, ‘Long Term Scenario of the GMES Space Component’. 227 See also “Summary Report on the Dialogues with Member States owning Space Infrastructure and with EUMETSAT”,
GMES Bureau, European Commission, GC/PB-GMES-2011/09.

Booz & Company
Date: 19th September 2011 Cost-Benefit Analysis for GMES Final Version II
Prepared for: European Commission Directorate – Enterprise and Industry
157
support the GMES services: atmosphere, marine, land and emergency. These services should be fully operational by 2014.
The GMES services component provides a collection of information services addressing six thematic areas. GMES services will collect data from multiple sources (space and in situ components), process this data and provide users with reliable and up-to-date information. They have entered into initial operations (2011-2013), with the objective to be fully operational by 2014. Six GMES service domains are foreseen to address the following thematic areas: emergency management, land, marine, atmosphere, services for security applications and climate change. Many developments are still required for all these services. Marine, Land and Atmosphere are currently the most elaborated to date, and therefore should see fewer major changes in the future.
The EC has already funded specific projects for each of the first five GMES Service themes via the 7th Framework Programme (FP7) funding scheme. These FP7 GMES service projects are typically 3 year-long projects aiming at defining and demonstrating the sustainability of the GMES services in a pre-operational phase.
The maturity of certain FP7 projects has led the GMES programme to adopt them as a foundation for GMES services. As a result, a number of GMES services are in the process of becoming well defined, for instance the Emergency Management Service, which is building on the FP7 project SAFER. The services for security applications are less mature, and therefore should see major evolutions in the near future, while the climate change service is still being defined.
It is expected that value-added services tailored to more specific public or commercial needs would be developed through public or commercial initiatives, taking advantage of new GMES services. These downstream services will combine the information provided by the GMES services with additional data. The resulting downstream products could be free of charge (if financed by Member States or local and regional administrations) or associated with a fee depending on the business model of each service provider.
The figure below illustrates the overall architecture of the GMES system, from the collection of observation data, through the processing and distribution by the various GMES components and to the delivery of services and products to the end users. It is assumed that the GMES programme beyond 2014 will keep the same architectural set up.
Several EO missions operated by national agencies, commercial entities from European Member States, EUMETSAT or other third parties either currently operating or being developed have been recognised as of particular interest to the GMES programme. These have been identified as potential GMES Contributing Missions. This list of GMES Contributing Missions is bound to evolve in the future depending on future user needs that may be identified and not yet covered by the GMES dedicated missions. ESA, as the coordinator of the overall GSC, will define a cooperation scheme together with the mission operators and the EC.
The GMES dedicated missions, namely the Sentinels, are being developed specifically for the GMES programme in order to fill the gap between European and international policies, user needs and what the Contributing Missions allow to achieve. The ESA GMES long-term scenario [RX] envisages the development of five types of Sentinel. In addition Jason-CS (and follow-on) is also expected to become part of the GMES Space Component after the next ESA ministerial conference in 2012 and would ensure continuity of the low-inclination altimetry observations from the previous Jason satellite series. Moreover a part of the overall GMES

Booz & Company
Date: 19th September 2011 Cost-Benefit Analysis for GMES Final Version II
Prepared for: European Commission Directorate – Enterprise and Industry
158
budget, as planned in the Long Term Scenario (LTS), has been reserved to prepare for investments to ensure full service continuity from significant Contributing Missions.
Figure B.9.1: Overview of the GMES System Components and Services
GSC Data Access (GSCDA)
EO Data Providers
GMES Service Projects
EUMETNET, EIONET,UNECE, EMEP, ICOS,
IAGOS, GEOMON,
NILU
EuroGOOS,EIONET,
JCOMMOPS, EURO-ARGO,
EuroSITES, NIVA,
FERRY Boxes
Euro-Geographics,
JRC, EUROSTAT,
EIONET
TBD by GISC project, based on EC SEIS and INSPIRE principles
In-Situ Component, under EEA
Airborne Seaborne Ground based
TT&C stations
FOS
Acquisition stations
PDGS
GMES sentinels Ground Segment
Sentinel satellites
TM/TC ISPs
GCM GS
GCM GS
GCM GS
GCM GSENVISAT GS
Orders, User Management, Products, Reports…
RequestsCoordination and Distribution to GMES Service Projects
GMES Reference Users
DG ECHODG RELEX
NGO’s
National civil protection authorities
EU civil protection unit
EU councilMember states
GMES FP7 Service Projects
DownstreamServices (ex)
MyOcean Geoland2 MACCSAFER LinkER G-MOSAIC
Maritime Service
Land Monitoring
Service
Emergency Response
Service
Security Service
Global Atmospheric
Service
Other Users
DistributionValue Added services
TBD
TBD
Climate
DORIS EVOSS
GMESServices
GMES ‘internal’ Space Component (GSC), under ESA
GMES ‘external’ ContributingMissions (GCM)
Input data ACQUIRED by ESA
Source: Booz and Company Analysis.
The main characteristics of the Sentinels are:
� Sentinel-1 will provide all-weather, day and night radar imagery for land and ocean services;
� Sentinel-2 will provide high-resolution optical imagery for land services;
� Sentinel-3 will provide high-accuracy optical, radar and altimetry data for marine and land services;
� Sentinel-4 and Sentinel-5 will provide data for atmospheric composition monitoring from geostationary orbit and polar orbit, respectively; and
� Sentinel Jason CS will provide Altimetry observations mainly for ocean services.
The GMES ground segment would integrate these diverse resources into a homogenous architecture of the overall GMES Space Component. Moreover the data access system combines the data from the Sentinels and Contributing Missions into a set of coherent data sets with metadata so as to obtain a coordinated and categorised data stream usable by the GMES services. Beside the satellites and the ground segment, the launch of the satellites represents another piece of the GMES Space Component and accounts for a significant portion of the infrastructure cost.

Booz & Company
Date: 19th September 2011 Cost-Benefit Analysis for GMES Final Version II
Prepared for: European Commission Directorate – Enterprise and Industry
159
B.2 GMES SERVICES
B.2.1 GMES services history
Several projects have been developed in the past in order to answer an increasing demand for global monitoring services, and in an attempt to structure these services around a European organisation. These projects have been precursors to the current GMES service projects and to some of the downstream projects. They helped to define the current and planned GMES services and drove the requirements of the GSC. The European Commission contributed to such projects through the FP5, FP6 and FP7 funding schemes.
The GMES Service Elements (GSE) were developed and funded by ESA and listed in table below. They are precursor services to the GMES services, continuing the response for new services to new users initiated by the Data User Elements (DUE).
Table B.1: Initial Projects for GMES Service Elements
GSE project name Service provided
GSE Land Land Services
GSE FM Forest Monitoring
TerraFirma Ground Hazards
RISK Flood, Fire risks
RESPOND Humanitarian Aid
GMFS Food Security
MarCoast Marine Services
POLAR VIEW Ice monitoring
MARISS Maritime Surveillance Services
PROMOTE Atmosphere Services
Source: Booz and Company Analysis.
B.2.2 GMES services objectives
The high level definition of GMES services has been formalised in the EU Regulation No 911/2010228, resulting in clear identification of six thematic areas that will be called “GMES services” in this study for ease of reference. These areas are:
� Emergency management;
� Land monitoring;
� Marine environment monitoring;
� Atmosphere monitoring;
� Services for security applications; and
� Climate change monitoring.
228 Regulation (EU) No 911/2010 of the European Parliament and of the Council of 22 September 2010 on the European Earth
monitoring programme (GMES) and its initial operations (2011 to 2013).

Booz & Company
Date: 19th September 2011 Cost-Benefit Analysis for GMES Final Version II
Prepared for: European Commission Directorate – Enterprise and Industry
160
Several studies have already attempted to introduce further structure under each of these thematic areas, such as ESA’s CBA studies published in 2003-04 and the BOSS4GMES programme.
However, the most up-to-date definitions of services have been provided by the current GMES pre-operational projects. This is used as key input source for the detailed review of GMES services in Appendix C. This provides an overview of current activities in this area, and sets out an expected position by 2014. It represents a comprehensive taxonomy of GMES services.
It should be noted that the existence of the current pre-operational services is based on the funding available via the FP7 scheme. The form that GMES services will take in the future depends on available funds, coupled with the maturity of services and their relative priority, from the EC perspective. Although, current pre-operational services are clear candidates for future funding, there is no such guarantee and the assumptions of their continuity beyond 2013 will have to be justified.
The objective of the GMES service component is to ensure access to EO information, bridge the gaps between operational standards, complete EO capabilities of Europe through Sentinel space missions and contribute to the international activities on environment monitoring and security. GMES services are necessary in order to foster the use of information sources by the private sector on a continuous basis, thus facilitating innovation, and thereby adding value, by service providers, many of which are small and medium-sized enterprises (SMEs).
Also, the purpose of the user driven GMES services is to provide EO service continuity, operate in the competitive environment and create a downstream sector. GMES should become, inter alia, a key tool to support biodiversity, ecosystem management, and climate change mitigation and adaptation.
More specific objectives and products of each of the six areas have been further defined by the GMES Regulation and current pre-operational services.
B.2.3 Emergency Management
The GMES Regulation highlights the importance of operational services in the field of emergency management and humanitarian responses in order to allow better coordination, preparation and response to recover from natural and man-made disasters - which often also have a negative impact on the environment. As climate change could lead to an increase in the number of emergencies, Emergency Management will be essential in supporting climate change adaptation measures. Therefore, the aim of the Emergency Management services is to deliver geospatial information to support emergency and humanitarian responses.
SAFER, the current pre-operational emergency service project on which Emergency Management services could be based, has already (along with GIO) developed European capacities to respond to emergency situations such as forest fires, floods, earthquakes, volcanic eruptions, landslides, and to humanitarian crisis. The project has two priorities:
� To improve the response time when the crisis occurs, notably through the provision of rapid mapping capacities; and

Booz & Company
Date: 19th September 2011 Cost-Benefit Analysis for GMES Final Version II
Prepared for: European Commission Directorate – Enterprise and Industry
161
� To extend the scope of products and services to before and after crisis operations (e.g. services related meteorological and geophysical risks).
Given examples of recent devastating tsunami impacts on people’s life and local economies, a better understanding of the correlation between tsunami and volcanic eruption, undersea earthquakes and landslides is now considered essential. Examples of Emergency Services users include: UN, EC Services, NGOs, donor governments, peace keeping organisations. The Monitoring and Information Centre (MIC) of the Directorate-General for Humanitarian Aid and Civil Protection (DG ECHO) will be responsible for the full operational deployment of the Emergency Management service.
B.2.4 Land Monitoring
According to the GMES Regulation it is important to monitor biodiversity and ecosystems and support climate change mitigation and adaptation measures and the management of a wide range of resources and policies, most of which relate to the natural environment: soil, water, agriculture, forests, energy and utilities, built-up areas, recreational facilities, infrastructure and transport. Operational land monitoring services are necessary at both European and global levels, developed in collaboration with Member States, third countries in Europe and partners outside Europe and the United Nations.
The current pre-operational service to the GMES Land monitoring service is geoland2. The main goal of this project is to support the mitigation of environmentally harmful human activities through supporting political policies such as Climate Change, Water Policy, Soil Policy, Cohesion or Common Agriculture Policy.
The IPCC reported in its recent Climate Change Assessment that ecosystem changes associated with land-use and land-cover changes are very complex. For example, conversion of natural vegetation to agricultural land drives climate change causing additional summer warming and additional winter cooling in the areas by releasing CO2 via losses of biomass and soil carbon. In contrast, forestry, and other land-use or land-management changes such as modifications of agricultural practices, can work to mitigate climate change.
B.2.5 Marine Environment Monitoring
The marine environment is affected by human usage that is becoming more intense and more intrusive. Marine pollution has a direct effect on habitat and landscapes, leading to imbalances in ecosystems and biodiversity. There can also be significant impacts on local tourism markets.
According to the GMES Regulation, marine environmental services are important for the support of an integrated European capacity for ocean forecasting and monitoring and the future provision of essential data on oceans. The collected measurements and indicators are essential for climate change monitoring, marine environment monitoring and transport policy support. The purpose of marine monitoring and forecasting services is to provide information on the physical state of ocean and marine ecosystems for the global ocean and the European regional areas. The application areas of the GMES marine services will include maritime safety, the marine environment and coastal regions, marine resources as well as seasonal meteorological forecasting and climate monitoring.
MyOcean – current preoperational GMES service applications include:

Booz & Company
Date: 19th September 2011 Cost-Benefit Analysis for GMES Final Version II
Prepared for: European Commission Directorate – Enterprise and Industry
162
� Safety (e.g. marine operations, oil spill combat, ship routing, security, search & rescue);
� Resources (sustainable management of living marine resources, eco-system approach to fish stock management);
� Environment (water quality monitoring through biogeochemical components, sea level, location definition for energy production based on currents); and
� Climate (sea ice monitoring and meteorological services).
The marine environment is a system of several natural systems such as terrestrial, freshwater, coastal and oceanic. Holistic approaches need to be taken to assess human impact from extractive industries, tourism, transportation, power generation, in order to understand the full scale of damage to the marine environment.
Current users of the pre-operational marine services include: government environment departments, marine and coastal pollution authorities, fisheries agencies, port authorities, and commercial organisations (e.g. fish farmers, oil companies).
B.2.6 Atmosphere
The GMES Regulation describes Atmosphere monitoring services as an important tool for monitoring air quality, atmospheric chemistry and composition, and solar irradiance and UV radiation. They are also an essential element for climate change monitoring and the future provision of Essential Climate Variables (ECVs). The provision of information on the state of the atmosphere is necessary on a regular basis and at regional and global levels.
MACC is the current pre-operational service project for atmosphere monitoring, which is grouped into four main themes: European Air Quality, Global Atmospheric Composition, Climate, and UV and Solar Energy. Most of MACC services are targeted to downstream service providers, who transform the global and European products into more tailored services. At the same time, however, MACC also provides services to a wide spectrum of users.
Climate change, depletion of the Ozone layer resulting in increased UV radiation at the Earth’s surface, summer smog over large cities, acid rain, poor air quality and many more factors impact on citizens’ quality of life and have a substantial economic cost. In this context the objective of the atmosphere monitoring services is to improve quality of life through reduced mortality from skin cancer, better air quality for patients with respiratory illnesses as well as to bring cost savings through reducing the number of ground ozone measurement stations.
Atmospheric service users include: WMO, ECMWF, research organisations, UV centres, environmental agencies and air quality monitoring agencies.
B.2.7 Services for Security applications
The GMES Regulation identifies security-related services as an important part of the GMES initiative, because Europe will benefit from the use of space and in situ assets in support of the implementation of services responding to the challenges in the security field, border control, maritime surveillance and support to EU external action.
G-MOSAIC (GMES services for Management of Operations, Situation Awareness and Intelligence for regional Crises) is a pre-operational service on which could be built a series

Booz & Company
Date: 19th September 2011 Cost-Benefit Analysis for GMES Final Version II
Prepared for: European Commission Directorate – Enterprise and Industry
163
of GMES services for security applications in the area of support to EU external action. G-MOSAIC identifies areas for which GMES could provide Europe with independent, reliable and timely data:
� Peacekeeping;
� Nuclear proliferation;
� Piracy;
� Illegal immigration;
� Drug trafficking; and
� Protection of vital infrastructure (e.g. pipelines).
G-MOSAIC applications cover five security domains: i) natural resources and conflicts, ii) migration and border monitoring, iii) nuclear and treaties monitoring, iv) critical assets and v) crisis management and assessment.
Potential users of the G-MOSAIC products and services, and by extension of the future service, will be European and national organisations and entities:
� the European Commission;
� European Council entities such as the EU Military Staff;
� EU Situation Centre (SITCEN);
� National Ministries of Foreign Affairs;
� Law Enforcement Organisations; and
� Intelligence Centres.
B.2.8 Climate Change
Climate change is a complex subject and requires constant monitoring to allow for the adaptation and mitigation of its effects. Climate Services should in particular contribute to the provision of ECVs, climate analyses and projections on a scale relevant to adaptation and mitigation.
It is important to note that at the moment climate change monitoring in support of adaptation and mitigation policies does not exist as a dedicated service; however in this study assumptions have been taken around the operational capabilities being built up by 2016 (see Section 7.3.2 and Appendix C7).
B.3 STATUS AND FUTURE
B.3.1 Programmatic aspects
The GMES programme has been planned over the long term and has been progressively established through precursor services supported by Contributing Missions. A build-up phase is foreseen to take place until 2013 in order to progressively develop, launch and operate the first three versions of the Sentinel missions (Sentinel 1/2/3 A). The EC will then take over from ESA the full responsibility for funding the operations of the GMES Space Component and its further development.

Booz & Company
Date: 19th September 2011 Cost-Benefit Analysis for GMES Final Version II
Prepared for: European Commission Directorate – Enterprise and Industry
164
The following funding is currently in place for the Sentinel programme:
� Sentinels 1A, 2A and 3A - Full funding of R&D, construction and launch in place;
� Sentinels 1B, 2B and 3B - Full funding of R&D, construction and launch in place;
� Sentinels 1C, 2C and 3C - No funding in place: only long lead items funded;
� Sentinel 4 (two units, instruments to be mounted on MTG satellites funded and operated by EUMETSAT) - Funding in place for delivery to EUMETSAT, with launches funded by EUMETSAT;
� Sentinel 5 precursor - Full funding of R&D, construction and launch in place;
� Sentinel 5 - Funding for initial study only (pre R&D); and
� Jason CS - Funding for initial study only (pre R&D).
Like most satellite constellation programmes, the GMES infrastructure programme offers opportunities to build options into the programmatic approach. These are driven by key considerations inherent to the economies of scale that can be achieved with multi-satellite procurements, to the play that can be achieved with staggered launches, to the possible approaches for backup and spares, to the priorities that can be associated to services, and to the level of complementarities that can be achieved between new missions and complementary national missions to achieve these services. However, these considerations are outside of the scope of the cost-benefit assessment undertaken in this study.
In general, the launch of the Sentinel missions needs to be programmed and at least partially paid for to the launching companies (e.g. Soyuz/Vega) about two years in advance. One also needs to take into account the possibility of a launch failure, which can result in a launch delay or in the complete destruction of the satellite in a worse case. Therefore insurance may be considered to cover the potential loss of a satellite. Besides, the availability of the services may also be affected by a launch delay, which would directly affect the GMES users.
The space infrastructure is composed of the Contributing Missions and of the Sentinel satellites. In this study, it is assumed that all Contributing Missions planned in the GMES Long Term Scenario will be available. Currently, the Contributing Missions provide the primary source of satellite data for the GMES services. However, without the extensive set of data enabled by the Sentinels, some GMES services may be degraded. Indeed the Sentinel missions (i.e. instrumentation and orbit) have been designed to complement the data provided by the Contributing Missions in order to satisfy the requirements of the GMES service users229.
Some service products might not be affected by the absence of a Sentinel mission while others might be impossible to produce if these require essential data from this particular Sentinel mission. In the end the performance of the services in each GMES funding scenario will directly impact the level of benefits that can be drawn from the GMES services. However, to simplify the strategic nature of the study some general principles have been applied to reflect degradation over time in options where there is not a continuation of the GMES programme.
For example, GMES services rely on various system attributes of GMES Space Component. These attributes strongly depend on the definition of the satellite mission (orbit, number of satellites, type of instrumentation). They have been identified as follows:
229 http://www.esa.int/esaEO/SEMTOMASS2G_index_0_m.html.

Booz & Company
Date: 19th September 2011 Cost-Benefit Analysis for GMES Final Version II
Prepared for: European Commission Directorate – Enterprise and Industry
165
� Performance of the observation: a measure of the spatial resolution, quality of the data to fulfil the observation requirements
� Coverage: a measure of the geographical surface covered by each instrument over a period of time (in km2/day or km2/year). This also includes the coverage inherent to the orbit flown (e.g. GEO, LEO).
� Revisit time: a measure of the time between two passes over the same area, allowing an update of the observation for that area.
� Availability: a measure of the portion or the measured data that is actually available to the user (typically for Contributing Missions) combined with the time needed from acquisition to possible use and with the potential constraints attached to the manipulation of the data (e.g. security constraints, commercial exchange).
� Reliability: a measure of the probability that satellite capacity will be available to perform the observation. This includes the potential need for redundancy (e.g. for services for security applications).
By definition, several attributes of the GMES Space Component are of critical importance to specific GMES services. For instance Emergency services require a global coverage and a quick revisit time, which implies at least two satellites with similar capabilities in order to guarantee a quick operational response.
The Sentinel satellites can also be viewed as an insurance against discontinuation of national programmes such as Spot and Landsat in the future. If enough capability can be brought by complementary missions, this can help GMES delay the launch of satellites already procured. For example, Sentinel 1 missions bring continuity of more than 20 years of C-band observations. Sentinel 1 relates to Land and Ocean wave mode observations, as well as ice and vegetation. However with the Italian (CosmoSkymed), German (TerraSar-X) complementary missions, the same data could be obtained.
The study assumes that beyond 2014 coordinating entities will be appointed by the EC to become responsible for the operational deployment of the GMES services. Contracts might then be attributed to other entities in order to carry out the actual operations of the services. Services that do not fall within the perimeter of these contracts will be considered as downstream services, which may have their own financing source (e.g. from the users, from other public funds or from the private sector). Moreover, some of the downstream services may be sustainable without the GMES services, if for instance they can also rely on other sources of data or if they can afford to develop their own service products similarly to those provided by the GMES services.

Booz & Company
Date: 19th September 2011 Cost-Benefit Analysis for GMES Final Version II
Prepared for: European Commission Directorate – Enterprise and Industry
166
Appendix C GMES Services and Foreseen Operations
C.1 INTRODUCTION
C.1.1 Purpose
The purpose of this appendix is to establish the baseline of operational services at the end of 2013. The basis for this is to assess existing information about current service availability, along with indications and guidance about potential future service provision. A number of key sources of information were consulted for this analysis:
� The service portfolios of the FP7 projects: geoland2, MACC, SAFER, MyOcean and G-MOSAIC.
� The GIO Work Programme (2011)
� The FP7 Work Programme (2011)
� The GMES GIO regulation (2011-2013)
� The text of Preparatory Actions (2008-2010) calls for tenders for:
- Geospatial reference data (2009)
- LinkER (2008)
- ICEMAR (sea ice monitoring) (2010)
- ObsAIRve (air quality alerting) (2010)
� Other ITTs and public sources of information
C.1.2 Background
The current status of GMES service operations is evolving in the period 2011-2013. Under the GMES Initial Operations, operational service elements will be gradually phased in over the course of the implementation period. The major FP7 projects for each of the service domains – emergency management, land, marine, atmosphere and services for security applications –come to an end in either 2011 or 2012. The service portfolios for each of these projects form the starting point of this analysis. They are listed in the tables at the end of this appendix under the heading “FP7 Service Portfolios”.
Follow-on projects are expected under FP7 for marine and atmosphere. They are assumed start in 2012. These are funded under a new hybrid funding scheme CP-CSA, which combines the Collaborative Project scheme and the Coordination and Support Action, and allows the development of prototype operational services.
Smaller thematic projects under FP7 are starting up in 2011. Further projects are expected in 2012 for security applications in the specific areas of maritime surveillance, support to EU external action, and border surveillance.
A number of GMES services have developed through, or been supported by, Preparatory Actions in 2009-11²:
� Geospatial reference data (2009);

Booz & Company
Date: 19th September 2011 Cost-Benefit Analysis for GMES Final Version II
Prepared for: European Commission Directorate – Enterprise and Industry
167
� LinkER (emergency management user interface, 2009230);
� ICEMAR (sea ice information and forecasts, 2011); and
� ObsAlRve (air quality alerting, 2011).
The objective of these service contracts is to deliver (or to contribute to the delivery of) operational services in a specific thematic area.
C.1.3 Methodology and Assumptions
For each service, funding vehicles or instruments under which services were developed leading up to 2010 were identified in our research. Those service components that were foreseen to continue under GIO were also identified, along with any new components that were not previously financed under FP7.
The analysis of expected GMES services in 2013 and beyond is necessarily based on three major assumptions:
� Service elements financed under the GMES Initial Operations (2011-2013) budget, or
under Preparatory Actions, will continue to be provisioned under Community funding in 2014 onwards;
� Where follow-on funding is foreseen under FP7 for projects ending in 2012, leading to projects with similar service capability (e.g. MyOcean to MyOcean2; MACC to MACC-II), this is taken as an indication of intent to develop this service towards full operations; and
� At the conclusion of the FP7 projects, sufficiently mature services will be considered candidates for operational funding in 2014 and onwards.
With these assumptions in mind, it becomes possible to provide an analysis of potential operational GMES services in 2013. If these assumptions fall, the consequent conclusions would be put in doubt.
Research and development activities towards building several GMES downstream services have been funded under the 2nd and 3rd Space calls of FP7 (i.e. in 2009 and 2010). These activities have not been accounted for in the analysis below because downstream services will not be funded under the future GMES programme.
C.1.4 Analysis
Based on the assumptions stated in the section above, it is possible to project the set of services expected in 2013 and 2014. This will form a key input to the GMES CBA study. Each of the service domains is analysed separately under the headings which follow. For each service domain, the analysis deals with the period up to 2014. The expectation of what services might become available thereafter is detailed in a separate section later in this appendix.
230 For clarity, where the start date is towards the end of the year, the following year is used, e.g. LinkER started on 16th
December 2008.

Booz & Company
Date: 19th September 2011 Cost-Benefit Analysis for GMES Final Version II
Prepared for: European Commission Directorate – Enterprise and Industry
168
C.2 EMERGENCY MANAGEMENT
There are four key areas in the emergency management service as listed below:
� Preparedness / Prevention;
� Emergency Response;
� Recovery; and
� Additional (e.g. Refugee / IDP camps).
These areas deal with both non-response and emergency response phases (based on the SAFER service portfolio). This suite of services has been developed in SAFER and supported by a Preparatory Action (linkER, 2009-2011). For the Emergency Management component, follow-up is expected through GIO funding allocated in 2011 and 2012 (although contract awards from the 2011 Work Programme are expected in 2012).
The non-response phase of the emergency management cycle (preparedness, prevention, post-response recovery and reconstruction) is expected to be served by FP7 funding in 2012 (with GIO support as a second priority).
An additional component is the European Flood Alert System (EFAS). It is a new addition to Emergency Management services, which complements the four service areas listed above, developed under SAFER. EFAS can provide flood warning notification up to 10 days in advance of a flood.
The GMES Emergency Management service assists in the local response to forest fires by providing information about their location, status and scope to ground fire-fighting teams. The emergence and development of forest fires and the associated smoke plumes can be monitored by the use of optical satellite sensors. The service provides a rapid mapping service, delivering damage assessment maps and reports to support the deployment of resources and pre-emptive actions in the high-risk zones surrounding the conflagration or in the path of its spread.
The operational GMES Emergency Management service provides a clear contribution to the targeting of relief and reconstruction spend though its damage assessment and disaster extent products, as well as ongoing monitoring after a crisis.
It is included in the GIO 2011 Work Programme and continued in 2012, complementing activities developed by DG ECHO and the JRC. The long-term objective is to move the component fully into the frame of GMES. No ITT has been released at the time of this writing (March 2011), and contracts could therefore be expected in 2012, as above.
The tables below illustrate the funding and service development, and the projected service taxonomy from 2014.
Table C.1: Emergency Management: Funding and Service Development
Service areas 2009 2010 2011 2012 2013 2014 2015 2016 +
Preparedness / Prevention SAFER SAFER SAFER GIO / FP7
2012 GIO / FP7
2012 Operations Operations Operations
Emergency Response SAFER SAFER SAFER GIO GIO GIO Operations Operations
Recovery SAFER SAFER SAFER GIO / FP7 2012
GIO / FP7 2012 Operations Operations Operations

Booz & Company
Date: 19th September 2011 Cost-Benefit Analysis for GMES Final Version II
Prepared for: European Commission Directorate – Enterprise and Industry
169
Service areas 2009 2010 2011 2012 2013 2014 2015 2016 +
Additional (Refugee / IDP Camps)
SAFER SAFER SAFER GIO / FP7 2012
GIO / FP7 2012 Operations Operations Operations
European Flood Alerts GIO GIO
GIO (unconfirm
ed) Operations Operations
Source: Booz and Company Analysis.
Since the Emergency Management sub-services have all benefited from both GIO and FP7 funding, it is considered likely that all of them will be carried forward to operations (assumptions 1 and 3, above). The table below presents the understanding of domains of application, key policy areas and typical end users.
Table C.2: Projected Service Taxonomy - Emergency Management
Service areas Domains of Application
Policy Areas Typical End Users
Preparedness / Prevention
Crisis and emergency management
Civil protection Humanitarian aid
DG ECHO (European Commission Humanitarian Aid & Civil Protection Office), Civil protection agencies, humanitarian aid agencies, external action community
Emergency Response Crisis and emergency management
Civil protection Humanitarian aid
DG ECHO (European Commission Humanitarian Aid & Civil Protection Office), Civil protection agencies, humanitarian aid agencies, external action community
Recovery Crisis and emergency management
Civil protection Humanitarian assistance
DG ECHO (European Commission Humanitarian Aid & Civil Protection Office), Civil protection agencies, humanitarian aid agencies, external action community
Additional (Refugee / IDP camps)
Crisis and emergency management
Civil protection Humanitarian assistance
DG ECHO (European Commission Humanitarian Aid & Civil Protection Office), Civil protection agencies, humanitarian aid agencies, external action community
European Flood Alerts Hydrological and flood forecasting
Meteorology, hydrology
DG ECHO (European Commission Humanitarian Aid & Civil Protection Office), National hydrological services, Civil protection agencies, humanitarian aid agencies
Source: Booz and Company Analysis.
C.3 LAND
Not all the service components developed within geoland2 have a direct successor under GIO. However, within GIO there are clear indications for continuity of the pan-EU land cover component, the local component (Urban Atlas, other hotspots and biodiversity), the global component, and an activity dealing with access to geospatial reference data. There are also less certain indications suggesting possible operational funding for some of the Core Information Services (CIS), e.g. Global crop monitoring, Land carbon monitoring, and Forest monitoring. The EEA is expected to play a key role in coordinating the operational Land service components.
The Pan-EU land cover component was developed in geoland and geoland2 (as Euroland). This component is GIO-funded in 2011 and 2012. No ITT has been issued as yet, therefore

Booz & Company
Date: 19th September 2011 Cost-Benefit Analysis for GMES Final Version II
Prepared for: European Commission Directorate – Enterprise and Industry
170
service contracts may launch in 2012. However, preparatory work is being undertaken in 2011.
The local component consists of two parts. First, following its maturity through the geoland projects, the Urban Atlas update has now been funded through an operational service contract since 2009231 through DG REGIO’s FEDER (European Regional Development Fund). Secondly, GIO funding is expected in 2013 for additional activities in the local component, for the monitoring of other hotspots on specific interest areas (biodiversity, coastal, soil, quarry, carbon monitoring), linked, for example, with NATURA2000 sites. However, because the content of this service component is still under discussion between key stakeholders (EEA, DGs ENV and ENTR, Member State experts), it will not be considered operational in 2013+ for the purposes of this analysis.
Concerning the global component, the global land monitoring component (BioPar in geoland2) is expected to receive GIO funding in 2012 and 2013. It is expected to be coordinated, implemented and managed by the JRC. Archiving and dissemination activities within this component can be foreseen to fall under the SEIS initiative; validation and quality control will involve Member States and ETC-SIA.
Access to geospatial reference data (such as an EU DEM, or digital elevation model) has been the subject of a Preparatory Action (2010-2013), and is expected to receive GIO funding for follow-up in 2013. This activity has close links with the EEA in the context of GISC (GMES In Situ Coordination).
There are some indications that other information services such as Agri-Environment (Agri-Env) and Water Monitoring components may be funded operationally from 2014. These components will not be considered operational for the purposes of this analysis.
The Land Carbon Monitoring service is tied in closely with the development of Essential Climate Variables, relating to the GMES contribution to climate change research. It could potentially be funded by cooperation arrangements with EUMETSAT’s LandSAF, with support from ECMWF and ESA. This component will therefore be considered operational from 2014 for the purposes of this analysis.
With parallel objectives to the GMES and Africa initiative, it is probable that the Natural Resource Monitoring in Africa (NARMA) initiative may subsume the activities within this service component, with coordination provided by the JRC. Negotiations on scope and terms of reference for the GMES and Africa initiative are ongoing, however it will be considered operational, for the purposes of this analysis, from 2014. The services involved in the management of global desertification fall under the Land Monitoring suite. In particular, the global component and the activities related to natural resource management in Africa (NARMA in geoland2) can contribute to the monitoring and prevention of desertification.
The Global Crop Monitoring component falls within the extended mandate of the JRC and will therefore be considered operational for the purposes of this analysis.
The Forest Monitoring component has been well-develop both within geoland2 and under the ESA- funded GMES Service Element on Forest Monitoring (GSE-FM). The latter has been in its implementation phase since 2005. It is considered an operational component of the GMES Land Monitoring service, from 2014.
231 Contract signed 15/08/2009.

Booz & Company
Date: 19th September 2011 Cost-Benefit Analysis for GMES Final Version II
Prepared for: European Commission Directorate – Enterprise and Industry
171
The Urban Atlas service has mapped 228 out of 305 planned cities over 100,000 inhabitants in very high resolution. The tables below illustrate the funding and service development, and the projected service taxonomy from 2014.
Table C.3: Land: Funding and Service Development
Service areas 2009 2010 2011 2012 2013 2014 2015 2016 +
Loca
l
Urban Atlas DG REGIO DG REGIO DG REGIO DG REGIO232*
DG REGIO* Operations Operations Operations
Other hotspots and biodiversity
GIO* Operations Operations Operations
Con
tinen
tal
Pan-EU Land Cover geoland2 geoland2 geoland2 /
GIO geoland2 / GIO GIO* Operations Operations Operations
Seasonal and Annual Change Monitoring (SATChMo)
geoland2 geoland2 geoland2 geoland2
Glo
bal Bio-
geophysical parameters
geoland2 geoland2 geoland2 geoland2 / GIO GIO* Operations Operations Operations
Spatial Planning geoland2 geoland2 geoland2 geoland2
Agri-Environment geoland2 geoland2 geoland2 geoland2
Water Monitoring geoland2 geoland2 geoland2 geoland2
Forest Monitoring geoland2 geoland2 geoland2 geoland2 Operations Operations Operations Operations
Land Carbon Monitoring geoland2 geoland2 geoland2 geoland2 Operations Operations Operations Operations
Natural Resource Monitoring in Africa
geoland2 geoland2 geoland2 geoland2 Operations Operations Operations Operations
Global Crop Monitoring geoland2 geoland2 geoland2 geoland2 Operations Operations Operations Operations
Forest Monitoring
geoland2 / ESA GSE Forest Monitoring
geoland2 / ESA GSE Forest Monitoring
geoland2 / ESA GSE Forest Monitoring
geoland2 / ESA GSE Forest Monitoring
Operations Operations Operations Operations
Access to Geospatial Reference Data
PrepAct PrepAct PrepAct GIO Operations Operations Operations
Source: Booz and Company Analysis.
232 In all funding tables which follow, an asterisk denotes that the element / funding source is unconfirmed, though expected.

Booz & Company
Date: 19th September 2011 Cost-Benefit Analysis for GMES Final Version II
Prepared for: European Commission Directorate – Enterprise and Industry
172
The table below presents the understanding of domains of application, key policy areas and typical end users. Key GIO elements are considered to continue into operations (assumption 1) along with the action on geospatial reference data (assumption 1).
Table C.4: Projected Services Taxonomy - Land
Service areas Domains of Application
Policy Areas Typical End Users
Loca
l
Urban Atlas Town / urban planning; urban sprawl / expansion monitoring, infrastructure and transport
Town / urban planning;
DG REGIO (Directorate-General for Regional Development), Eurostat (in respect of the Environmental Data Centres), Urban planning authorities
Other hot spots and biodiversity
Conservation; biodiversity Environmental management; Biodiversity
DG REGIO (Directorate-General for Regional Development), Local conservation authorities
Con
tinen
tal
Pan-EU land cover
European / regional policy-making; forestry; agriculture; biodiversity, soil and water management, climate change mitigation and adaptation
Environmental management; Forestry management; Agriculture; Energy (through hydroelectricity) Land use planning; Water management;
DG REGIO (Directorate-General for Regional Development), Eurostat (in respect of the Environmental Data Centres), Urban planning authorities
Glo
bal
Bio-geophysical parameters
Discerning land surface trends, detecting anomalies, analysing inter-annual variability and identifying high risk areas; Support to UNCCC through the provision of ECVs
Environmental and water management; climate change; agriculture; food Security
EEA (European Environment Agency), DG ENV (Directorate-General for Environment), DG AGRI (Directorate-General for Agriculture and Rural development), ETC LUSI (European Topic Center for Land Use and Spatial Information), DG DEVCO (EuropeAid Development and Cooperation), DG JRC (Joint Research Centre,), Eurostat, UN FAO (United Nations Food and Agriculture Organization), UNEP (United Nations Environment Programme), UN WFP (United Nations World Food Programme), AMESD (African Monitoring of Environment for Sustainable Development), international research institutes
Land carbon Monitoring
Mapping biospheric variables spatially and temporally; monitoring the terrestrial carbon cycle; reducing uncertainty in understanding of carbon sinks and sources by combining with top-down estimates from the Atmosphere service.
Climate change GMES Atmosphere service; scientific carbon community; DG JRC (Joint Research Centre of the European Commission).
Forest monitoring Forestry, forest management, support to national reporting obligations
Climate change Sustainable forest management Environmental protection
Regional and national policy-makers (ministries of environment); DG ENV (Directorate-General for Environment); Kyoto Protocol stakeholders

Booz & Company
Date: 19th September 2011 Cost-Benefit Analysis for GMES Final Version II
Prepared for: European Commission Directorate – Enterprise and Industry
173
Service areas Domains of Application
Policy Areas Typical End Users
Global crop monitoring
Crop and yield forecasting Agriculture, food security.
DG DEVCO (EuropeAid Development and Cooperation), DG AGRI (Directorate-General for Agriculture and Rural development), DG RELEX / EEAS (Directorate-General External Relations / European External Action Service), DG ECHO (European Community Humanitarian Aid Office), UN FAO (United Nations Food and Agriculture Organization), UN WFP (United Nations World Food Programme)
Natural resource monitoring in Africa
Seasonal and multi-annual natural resource management
Environmental protection, food security, agriculture.
AMESD (African Monitoring of Environment for Sustainable Development), international research institutes, DG DEVCO (EuropeAid Development and Cooperation), DG RELEX / EEAS (Directorate-General External Relations / European External Action Service)
Access to geospatial reference data
(Support to GMES Land services)
(Support to GMES Land services)
(Support to GMES Land services)
Source: Booz and Company Analysis.
C.4 MARINE
The GMES Marine service has been developed predominantly through the MyOcean project. Providing an integrated suite of ocean monitoring and forecasting products, the service produces multi-purpose information on the physical state of the ocean and on marine ecosystem characteristics. Four main areas of benefit are referred to in the MyOcean service portfolio:
� Marine Safety;
� Marine Resources;
� Marine and Coastal Environment; and
� Climate and Seasonal Forecasting.
This suite of services was developed in MyOcean, and is expected to continue with improvements and evolution through MyOcean2. In 2014, based on the assumptions detailed above, it is the expectation that the service will be sufficiently mature for operational funding.
The Sea Ice Information and Forecasts (ICEMAR) service, launched under the Preparatory Action 2010 and set to last from 2011 until 2013, takes inputs from the GMES marine service provided by MyOcean / MyOcean2 in support of developing ice monitoring and forecasting products in the Arctic and Baltic regions.
The GMES Marine Environment service provides operational capabilities to offer ship routing information based on ocean currents.
The operational EMSA GMES service “CleanSeaNet” responds to oil spills using near real-time satellite monitoring capabilities. The CleanSeaNet service has been developed independently by the European Maritime Security Agency (EMSA) and is now considered an operational GMES service in its own right “EMSA regards its CleanSeaNet oil spill

Booz & Company
Date: 19th September 2011 Cost-Benefit Analysis for GMES Final Version II
Prepared for: European Commission Directorate – Enterprise and Industry
174
monitoring service as one of the first examples of a fully operational GMES service consisting of both Marine-Core-Service elements and downstream service components”.233
It is closely linked to the main GMES Marine Environment service, of which CleanSeaNet is considered an ‘intermediate user’. The oil spill monitoring capacities are well-developed and operational since 2007. Oil spill modelling (forecasts and backcasts) allow for both damage mitigation (using the former to alert local authorities of approaching slick) and detection of offenders (using the latter to identify the source of the spill). The complementarities between CleanSeaNet and the GMES Marine Environment Service continue to develop, in respect of the interoperability of datasets and ocean modelling capabilities.
The following tables illustrate the funding and service development, and the projected service taxonomy from 2014.
Table C.5: Marine: Funding and Service Development
Service areas 2009 2010 2011 2012 2013 2014 2015 2016 +
Marine Safety MyOcean MyOcean MyOcean MyOcean / MyOcean
II
MyOcean-II
MyOcean-II Operations Operations
Marine Resources MyOcean MyOcean MyOcean MyOcean / MyOcean
II
MyOcean-II
MyOcean-II Operations Operations
Marine and Coastal Environment
MyOcean MyOcean MyOcean MyOcean / MyOcean
II
MyOcean-II
MyOcean-II Operations Operations
Climate and Seasonal Forecasting
MyOcean MyOcean MyOcean MyOcean / MyOcean
II
MyOcean-II
MyOcean-II Operations Operations
Oil spill monitoring (CleanSeaNet)
(Operational as from
2007) Operations Operations Operations Operations Operations Operations Operations
Sea Ice Information and Forecasts (ICEMAR)
PrepAct PrepAct PrepAct Operations Operations Operations
Source: Booz and Company Analysis.
The understanding of domains of application, key policy areas and typical end users are presented below. The Marine service is relatively mature, and each of the service areas is considered operational in our analysis (assumption 2 and 3). In addition, the sea ice element provided by ICEMAR is included in the set of operational services (assumption 1).
Table C.6: Projected Service Taxonomy - Marine
Service areas Domains of Application
Policy Areas Typical End Users
Marine Safety Marine operations Oil spill combat Ship routing Weather forecasting Search and rescue
Environmental management Maritime safety
EMSA (European Maritime Safety Agency) Regional Conventions (HELCOM, OSPAR, UNEP/MAP, Black Sea Commission) National maritime safety agencies
233 EMSA’s view on further development of oil spill monitoring, non-paper, 2008.

Booz & Company
Date: 19th September 2011 Cost-Benefit Analysis for GMES Final Version II
Prepared for: European Commission Directorate – Enterprise and Industry
175
Service areas Domains of Application
Policy Areas Typical End Users
Marine Resources Fish stock management, fisheries control
Fisheries management
ICES (International Council for the Exploitation of the Sea) and FAO (Food and Agriculture Organisation of the United Nations) National fishery agencies, DG MARE (Directorate-General for Maritime Affairs and Fisheries)
Marine and Coastal Environment
Water quality Pollution Coastal activities Aquaculture
Environmental management; Public health
EEA (The European Environment Agency) HELCOM (Helsinki Commission), OSPAR (Convention for the Protection of the Marine Environment of the North-East Atlantic by the Oslo and Paris Commissions) UNEP/MAP (United Nations Environment Programme / Mediterranean Action Plan) National environmental agencies
Climate and Seasonal Forecasting
Climate monitoring Ice Seasonal forecasting Meteorology;
Environmental management; Maritime safety; Climate change
ECMWF (European Centre for Medium-Range Weather Forecasts) National Weather Services Climate Research centres
Oil spill monitoring (CleanSeaNet)
Oil spill detection and monitoring
Environmental management Maritime safety
EMSA (European Maritime Safety Agency); National maritime safety agencies;
Sea Ice Information and Forecasts
Ship routing Maritime safety Shipping industry
Source: Booz and Company Analysis.
C.5 ATMOSPHERE
The suite of services under GMES Atmosphere consist of four sub-themes, which are:
� European Air Quality;
� Global Atmospheric Composition;
� Climate Forcing; and
� UV radiation and solar-energy resources.
These services have been developed in the MACC project (Monitoring of Atmospheric Composition and Climate), with slightly different details under each service category. They are expected to continue under MACC-II until 2014.
The air quality alerting service (ObsAIRve) was launched under the Preparatory Action 2010. This component takes input from the GMES Atmosphere service, building on these to contribute to the air quality services already available. It has a specific mandate to make these more directly relevant to European citizens and operationalise mature elements of the GMES atmosphere service suite.
The GMES Atmosphere Monitoring service, coupled with the more citizen-oriented air quality alerting service (ObsAIRve,) will contribute to the reduction of bad health through air pollution. The tables below illustrate the funding and service development, and the projected service taxonomy from 2014.

Booz & Company
Date: 19th September 2011 Cost-Benefit Analysis for GMES Final Version II
Prepared for: European Commission Directorate – Enterprise and Industry
176
Table C.7: Atmosphere: Funding and Service Development
Service areas 2009 2010 2011 2012 2013 2014 2015 2016 +
European Air Quality MACC MACC MACC MACC-II MACC-II MACC-II Operation
s Operations
Global Atmospheric Composition
MACC MACC MACC MACC-II MACC-II MACC-II Operations
Operations
Climate Forcing MACC MACC MACC MACC-II MACC-II MACC-II Operations
Operations
UV Radiation and Solar-Energy Resources
MACC MACC MACC MACC-II MACC-II MACC-II Operations
Operations
Air quality alerting (ObsAIRve) PrepAct PrepAct PrepAct Operation
s Operations
Operations
Source: Booz and Company Analysis.
The table below presents the understanding of domains of application, key policy areas and typical end users. As with the Marine service, the set of service themes under Atmosphere are carried forward by a follow-up FP7 project (assumption 2) and are considered mature and ready for operations (assumption 3). In addition, a service component on air quality alerts is included in the analysis (assumption 1).
Table C.8: Projected Services Taxonomy - Atmosphere
Service areas Domains of Application
Policy Areas Typical End Users
European Air Quality
Air quality management Environmental management; Energy; Transport
EEA (European Environment Agency), national and regional environment agencies, EMEP (European Monitoring and Evaluation Programme) stakeholders, public health authorities
Global Atmospheric Composition
Climate change research Environmental management; Climate change
European and national public health authorities
Climate Forcing Climate change research Environmental management; Climate change
European Environment Agency, IPCC (Intergovernmental Panel on Climate Change), climate research community
UV radiation and solar-energy resources
Climate change research Environmental management; Public health
European Environment Agency, IPCC (Intergovernmental Panel on Climate Change), climate research community
Air quality alerts Air quality management Environmental management; Public health
EU citizens, health and leisure sectors, public authorities
Source: Booz and Company Analysis.
C.6 SERVICES FOR SECURITY APPLICATIONS
Unlike the GMES services for the land, marine and atmosphere domains, there is no large FP7 project scheduled to follow up the suite of services developed under G-MOSAIC, which is focused on support to EU external action. Instead, the indications are that a number of small, specifically targeted FP7 projects will be launched in the 2011-2013 timeframe. No GIO funding is foreseen to be committed to GMES services for Security applications.

Booz & Company
Date: 19th September 2011 Cost-Benefit Analysis for GMES Final Version II
Prepared for: European Commission Directorate – Enterprise and Industry
177
The DOLPHIN project (and two smaller projects), scheduled to start in 2011, will develop pre-operational capabilities for Maritime Surveillance applications. They build on the precursor projects under FP6 (LIMES) and ESA GSEs (MARISS, MARISS Scaling Up).
Maritime Surveillance has close links with Border Surveillance. Following the development of a technical concept (2009) and a concept of operations (CONOPS, 2010-2011) for the application of surveillance tools in the context of EUROSUR (European Border Surveillance System), the need for verification and testing of these initial concepts has been identified. Two FP7 projects are expected (2013-2015), and are expected to contribute specifically towards supporting these objectives, for applications with high and low time criticality.
The support financing of GMES Services related to EU external action is expected under FP7 in 2013-2015, covering similar areas to those developed within G-MOSAIC. Until more information becomes available, it is difficult say with certainty how this programme will develop. One of the objectives of the programme will be to define the specifications for potential operational services post-2013.
Requirements specification for this service is in progress under a dedicated working group. The proposed content is not equivalent to the application areas of G-MOSAIC; some new areas are proposed, and it is not clear whether all the existing G-MOSAIC topics will be covered. The scope of the service is expected to include the following:
� Support to peace-keeping operations;
� Intelligence for humanitarian-aid operations;
� Border monitoring outside the EU;
� Treaty monitoring and nuclear non-proliferation;
� Assessment of security risks related to urban resilience;
� Food security;
� Water management;
� Illegal exploitation of natural resources; and
� Monitoring of illicit crops.
Due to the uncertainty surrounding the details of service scope, the analysis will proceed at the level of the three priority areas: EU external action, border surveillance and maritime surveillance. This is shown in the following table.
Table C.9: Services for Security Applications: Funding and Service Development
Service areas 2009 2010 2011 2012 2013 2014 2015 2016 +
EU E
xter
nal A
ctio
n
Natural Resources and Conflicts (NRC)
G-MOSAIC
G-MOSAIC
G-MOSAIC
Migration and Border Monitoring (MBM)
G-MOSAIC
G-MOSAIC
G-MOSAIC

Booz & Company
Date: 19th September 2011 Cost-Benefit Analysis for GMES Final Version II
Prepared for: European Commission Directorate – Enterprise and Industry
178
Service areas 2009 2010 2011 2012 2013 2014 2015 2016 +
Nuclear and Treaties Monitoring (NTM)
G-MOSAIC
G-MOSAIC
G-MOSAIC
Critical Assets (CTA)
G-MOSAIC
G-MOSAIC
G-MOSAIC
Crisis Management and Assessment (CRI)
G-MOSAIC
G-MOSAIC
G-MOSAIC
EU External action
FP 7 2012* FP 7 2012* FP 7 2012* Operations
Maritime Surveillance
FP 7 2010 FP 7 2010 FP 7 2010 Operations Operations Operations
Border Surveillance
FP 7 2012* FP 7 2012* FP 7 2012* Operations Operations
Source: Booz and Company Analysis.
Table 20 below presents the understanding of domains of application, key policy areas and typical end users.
Table C.10: Projected Service Taxonomy - Services for Security Applications
Service areas Domains of Application
Policy Areas Typical End Users
EU External Action Early warning / prediction of conflict; Nuclear non-proliferation; Intelligence and support to civil protection; Crisis and conflict management; Intelligence and decision support for border control and migration purposes
Environmental protection; Security; Illegal trade; Conflict monitoring; Refugees; Humanitarian assistance; Nuclear non-proliferation
DG RELEX / EEAS (Directorate-General External Relations / European External Action Service), FRONTEX (European Agency for the Management of Operational Cooperation at the External Borders of the Member States of the European Union), EUMS (European Union Military Staff), EU / UN Peacekeeping missions, public and civil security authorities, military (CFSP / EDSP) users, anti-terrorism agencies, International Atomic Energy Agency, Member States Ministries of Foreign Affairs (Crisis Rooms)
Border surveillance Border control (land and sea borders), drug trafficking, illegal immigration.
Customs, Border control
FRONTEX (European Agency for the Management of Operational Cooperation at the External Borders of the Member States of the European Union), EUMS (European Union Military Staff),
Maritime Surveillance Border surveillance, Traffic safety Monitoring of critical infrastructure Search And Rescue operations
European Integrated Maritime Policy Fisheries control Border Surveillance, Traffic Safety, Environmental Protection, Search and Rescue
EMSA (European Maritime Safety Agency); Maritime Analysis and Operation Centre–Narcotics (MAOC–N),
Source: Booz and Company Analysis.

Booz & Company
Date: 19th September 2011 Cost-Benefit Analysis for GMES Final Version II
Prepared for: European Commission Directorate – Enterprise and Industry
179
C.7 CLIMATE CHANGE
In comparison to the other GMES services, the Climate Change domain is relatively immature. There has been no large, collaborative R&D project leading up towards 2013, as has, for example, been the case with MACC or MyOcean. On the other hand, there have been two projects in specific areas funded under the FP7 2010 Environment theme. Several downstream projects have also been undertaken.
The ECLISE project (2011-2014) will provide demonstrations of Local Climate Services in support of adaptation policies in four sectors: coastal defence, cities, water resources and energy production. In addition, ECLISE aims to conceptually define the scope for future development of a European Climate service.
CLIMRUN (start date pending) is a project seeking to provide regional and Local Climate Information based on new methodologies and processing techniques. Case studies on specific targets (mountainous regions, coastal areas, islands) in the Greater Mediterranean area will be conducted, involving the tourism and energy sectors.
The GMES Land Monitoring service offers a number of contributions to the monitoring of deforestation, particularly in Europe but also globally to a lesser extent. Within Europe, there is a clear contribution in relation to land cover / land use mapping, in addition to the Forest Monitoring component (GSE FM successor) and the GMES Forest Downstream services developed under EUFODOS. Outside of European boundaries, the global component of the Land Monitoring service will provide biogeophysical parameters (e.g. Leaf Area Index) in near-real-time in support of the identification of forest areas. Analysis of time series data can support the efforts to ensure compliance with international agreements.
There is, in addition, a Service Coordination action expected under FP7 in 2012 (duration unknown), but this will not provide services directly. The focus will of this activity will be to coordinate efforts in the other GMES service domains and climate-related projects towards enabling the extraction of (or contribution towards) ECVs (Essential Climate Variables) from the data and parameters available in those services.
The table below illustrates the funding and service development for the Climate Change service. No service taxonomy has been projected for the period from 2014, because of the relatively underdeveloped nature of this service.
Table C.11: Climate Change : Funding and Service Development
Service areas 2009 2010 2011 2012 2013 2014 2015 2016 +
Service Coordination
FP 7 2012 (Space) -
unconfirmed
FP 7 2012 (Space) -
unconfirmed
Local Climate Services
FP 7 2012 (Environm
ent)
FP 7 2012 (Environm
ent)
FP 7 2012 (Environm
ent)
Local Climate Information in the Mediterranean
FP 7 2012 (Environm
ent) - unconfirme
d
FP 7 2012 (Environm
ent) - unconfirme
d
Source: Booz and Company Analysis.

Booz & Company
Date: 19th September 2011 Cost-Benefit Analysis for GMES Final Version II
Prepared for: European Commission Directorate – Enterprise and Industry
180
However, significant investments from 2014 in areas exploring Essential Climate Variables (ECVs), long term projections and impact analysis and monitoring tools can address this with the effect that services may start becoming available within a short time horizon.
C.8 KEY FINDINGS OF EXPECTED SITUATION AT 2013
The baseline situation to be used for the analysis of benefits will be based on the above analysis. Given the assumptions and findings above, services are foreseen to be operational in 2013 in the following four key areas: Land, Marine, Atmosphere, Emergency Management and services for security applications.
In the case of the services for security applications, a large FP7 project (G-MOSAIC) does not have a direct successor of equivalent size. Nonetheless, operational services are foreseen from 2014 based on the three priority areas identified.
The table below illustrates the service areas foreseen to become ready for operations in the period 2013-2015:
Table C.12: GMES Service Areas Operational in 2013-2015
Emergency Management
Land Marine Atmosphere Services for
Security Applications
Preparedness / Prevention
Pan-EU Land Cover Marine Safety European Air Quality EU External Action
Emergency Response Local Component Marine Resources Global Atmospheric Composition
Border Surveillance
Recovery Global Component Marine and Coastal Environment
Climate Forcing Maritime Surveillance
Additional (IDP / Refugee camps)
Land Carbon Monitoring Climate and Seasonal Forecasting
UV Radiation and Solar Energy Resources
European Food Alerts Forest Monitoring Sea Ice Information and Forecasts
Air Quality Alerts
Natural Resource Monitoring In Africa
Oil Spill Monitoring
Global Crop Monitoring
Access To Geospatial Data
Source: Booz and Company Analysis.
C.9 LOOKING BEYOND 2014
Having established, using a justifiable methodology and reasonable assumptions, a baseline for operational GMES service provision in 2013, the focus is now moved beyond this date and into the period of the next EU Multi-Annual Financial Framework (MFF).
Certain service components identified in the above section are foreseen to continue through 2014, and even 2015 in some cases. Beyond this, there is no authoritative source of information on what form the various services may take. In addressing the question of which services to consider operational post-2013, the following logic was applied.

Booz & Company
Date: 19th September 2011 Cost-Benefit Analysis for GMES Final Version II
Prepared for: European Commission Directorate – Enterprise and Industry
181
� For Marine, Land, Emergency, Atmosphere and services for security applications, operational capacities are assumed to be in place for year-on-year service continuity, based on the above analysis which sets the 2013 baseline.
� Climate change is in a rather different position. Although the service has benefited (and will continue to do so in 2012) from R&D investment under FP7, it is not foreseen to be operational in 2013. Therefore, it is assumed that a period of additional build-up activities will be required post-2013 in order for the service to arrive at operational maturity.
C.9.1 The four options
In the context of the EC scenarios document, the understanding of “upgrade” and “scope” is assumed to mean the following:
� Upgrades: modifications to processing methodologies (e.g. change detection) which result in an improved service (in terms of time/quality)
� Scope: those changes to service which result in either an extension to the types of data and products currently available, which could include an enlargement to the geographical coverage. However, this could also mean different types of product.
According to the four scenarios provided by the EC, the services will be gradually increased in scope from Option A to Option D.
C.9.2 Option A
In scenario A, services are provided operationally for a limited period of time with no major upgrades. Tier 1 service components will be considered to fall into this category.
From scenario B onwards, all six service domains are foreseen to be operational. There are some issues around how the upgrades to the services should be approached. First, the interpretation of service upgrade (scenario B) vs. the evolution of the scope of the services (scenario D). Second, the interpretation of “major” vs. “limited” upgrades. Third, the interpretation of “good quality”. Other issues include the question of which service sub-components, out of those not included in the post-2013 list, are to be included within scenarios B to D.
C.9.3 Option B
In scenario B, both services for security applications and Climate Change services will be considered, in addition to the other four services.
By 2014, however, the Climate Change service will have had only two years of development (under the service coordination action and two other projects). With relatively limited development of the service, the potential for maturity in 2014 is unclear.
One possible way to analyse the evolution of the Climate Change service would be to allow for a number of years after 2013, perhaps up to 2016, to be spent developing the service capability. This could be done through integrating existing sources of data or developing new service infrastructure. This is the assumption taken in this study, and on which the derivation of benefits relies.

Booz & Company
Date: 19th September 2011 Cost-Benefit Analysis for GMES Final Version II
Prepared for: European Commission Directorate – Enterprise and Industry
182
The services for security applications are expected to be carried out through several FP7 projects in 2011-14. There three priority areas clearly identified through the analysis of previous Work Programmes and the GMES Regulation:
� Border surveillance;
� Maritime surveillance; and
� Support to EU external action.
For border surveillance and EU external action, it is conceivable that operations could begin from 2015. For Maritime surveillance, this service could be operational in 2014, by integration with EMSA’s SafeSeaNet.
For the four other services – Land, Marine, Atmosphere, and Emergency Management – the scenarios supplied by the EC anticipate “limited scope” and potential upgrades. A potential upgrade to services is the only difference from scenario A, as regards the service aspect.
C.9.4 Option C
In Scenario C, the six thematic areas will all be operational. Upgrades will be applied and service scope will change. It is expected that the level of capability within services will also increase, e.g. additional funding services provide a stronger basis for improving products and delivering user benefits.
C.9.5 Option D
In Scenario D, full service capacity will be available across each of the six thematic areas. Service scope will be enlarged, and the option provides a full service continuity.
C.10 FP7 SERVICE PORTFOLIOS
A presentation of the understanding of service areas, their scope and typical products is presented in the following tables.
Table C.13: Marine - MyOcean/MyOcean-II
Service areas Scope Products
Marine Safety Global Ocean European Basins
TAC: baseline and standard ocean state products; daily / hourly fields MFC: sea surface temperature (SST); sea level; sea ice; wind; in situ; daily fields
Marine Resources Global Ocean European Basins
MFC: baseline and standard ocean state products; daily fields TAC: ocean colour; sea ice; wind; in situ; SST; daily fields
Marine and Coastal Environment
Global Ocean European Basins
MFC: baseline and standard ocean state products; boundary and initial ocean state conditions; re-analysis; daily / hourly fields TAC: ocean colour; in situ; sea ice; wind; sea level; SST; reprocessing; daily fields
Climate and Seasonal Forecasting
Global Ocean European Basins
MFC: baseline and standard ocean state products; surface to bottom; re-analysis; seasonal forecasting; initial conditions; daily / weekly / monthly / yearly fields TAC: sea level; ocean colour; in situ; sea ice; wind; SST; re-processed data sets; daily / weekly / monthly / yearly fields
Source: Booz and Company Analysis.

Booz & Company
Date: 19th September 2011 Cost-Benefit Analysis for GMES Final Version II
Prepared for: European Commission Directorate – Enterprise and Industry
183
Table C.14: Emergency Management - SAFER
Service areas Scope Products
Preparedness / Prevention
Global Geographic Reference – Overview and Detail Pre-Disaster Situation – Overview and Detail
Emergency Response Global Disaster Extent – Overview and Detail Damage Assessment – Overview and Detail
Recovery Global Post-Disaster Situation – Overview and Detail
Additional (Refugee / IDP camps)
Global Refugee / IDP Camp – Overview and Contextual
Source: Booz and Company Analysis.
Table C.15: Services for Security Applications - G-MOSAIC
Service areas Scope Products
EU E
xter
nal A
ctio
ns
Natural Resources and Conflicts (NRC)
Global Exploitation of natural resources (ENR) Population pressure (PP) Land degradation (LD) Illegal mining (ILM) Illegal timber logging (ILL) Illicit crops (ILC)
Migration and Border Monitoring (MBM)
Global Monitoring of activities, border crossing and related infrastructure along the border (BAM) Monitoring of long range migration routes and temporary settlements along these routes (MRS)
Nuclear and Treaties Monitoring (NTM)
Global Monitoring of nuclear decommissioning sites (MND) Continuous surveillance of nuclear facilities (SNF)
Critical Assets (CTA)
Global Critical assets monitoring (CAM) Critical assets event assessment (CAE)
Crisis Management and Assessment (CRI)
Global Contingency plan preparation (CPP) Rapid geospatial reporting (RGR) Damage assessment for post-conflict situations (DAP) Support to reconstruction missions after conflicts (SRM)
Source: Booz and Company Analysis.
Table C.16: Atmosphere - MACC/MACC-II
Service areas Scope Products
European Air Quality Europe Air Quality Analysis Air Quality Forecast Ensemble air quality forecasts Near Real Time Observations Verification Re-analyses

Booz & Company
Date: 19th September 2011 Cost-Benefit Analysis for GMES Final Version II
Prepared for: European Commission Directorate – Enterprise and Industry
184
Service areas Scope Products
Global Atmospheric Composition
Global, Europe, Arctic / Antarctic
Near Real Time analysis and forecast of reactive gases Forecast of Aerosol Optical Depth Re-analyses Support for scientific observational campaigns (Pressure-level plots forecasts and North-South Vertical Cross-Sections forecast) Monitoring: greenhouse gases; and methane flux inversions Fire Radiative Power Observed Aerosol Optical Depth and Aerosol Speciation Record Total Ozone: Re-analyses; Near Real Time; and Forecasts Ozone Hole NRT Tropospheric NO2
Climate Forcing Global Monitoring of Greenhouse Gases and of Methane flux inversions Re-analyses of Greenhouse Gases and Fluxes Monitoring of Global Aerosols / Observed Aerosol Optical Depth and Aerosol Speciation Record Re-analyses
UV Radiation and Solar-Energy Resources
Global / Europe Monitoring and Forecasting of Ultraviolet Radiation Monitoring and Forecasting of Total ozone Total Ozone: Re-analyses; Near Real Time; and Forecasts
Source: Booz and Company Analysis.
Table C.17: Land - geoland2
Service areas Scope Products
Loca
l
Urban Atlas Local Urban Atlas: automated update; and full update
Con
tinen
tal
Pan-EU Land Cover
Continental / Local
High Resolution Layer: Grassland; Wetlands; Water; Grassland Change; Wetlands Change; Water Change Automated Change of Imperviousness Layer 2006 Forest: Area; Types; Crown Cover Density; and Area Change
Seasonal and Annual Change Monitoring
Continental European AFS sampling scheme High Resolution maps: generic land cover; and agricultural land use Statistics on generic LC / LCC and on agricultural LU/LUC African AFS sampling scheme High Resolution generic land cover maps on African AFS samples Statistics: generic LC / LCC; and agricultural LU/LUC in Africa Medium Resolution: vegetation phenological trends; and LCC indicator maps; and monitoring of crop growing conditions
Glo
bal
Bio-geophysical parameters
Global Vegetation Variables: Burnt Areas + Seasonality; Surface Albedo (1)Surface Albedo (2)Water Bodies + Seasonality Soil Moisture + Freeze/thawMERIS FR biophysical products High Resolution biophysical products Climatology vegetation products Historic vegetation products Historic water products
Spatial Planning
Continental / Europe
Regional land take trend indicators Land take scenario European land take trend indicators
Agri-Environment
Global Agriculture state Agriculture trends Pressure of farm management on water resources Pressure of farm management on soil resources Agricultural land use changes as driving force for sustainability - Biodiversity Agricultural land use changes as driving force for sustainability - Landscapes

Booz & Company
Date: 19th September 2011 Cost-Benefit Analysis for GMES Final Version II
Prepared for: European Commission Directorate – Enterprise and Industry
185
Service areas Scope Products
Water Monitoring
Global Hydrological predictions Long-term water resources Nutrient loads to enclosed seas and source apportionment (CISW partner: SMHI) Nonpoint Pollution Potential Service (CISW partner: ITD and GIA) Agri-economical assessment of Nutrient Surplus (CISW partner: WUR-LEI) End User scenario tool (based on WA-03 and WA-04)
Forest Monitoring
Global Forest Area-based indicators + statistics Forest fragmentation and connectivity indicators Forest Type-based indicators
Land Carbon Monitoring
Global Analysed LAI Root-zone soil moisture Carbon flux Water flux Biomass Carbon storage
Natural Resource Monitoring in Africa (NARMA)
Africa Land surface indicators: CICOS (Central Africa); ECOWAS (W; Africa); IGAD (E Africa); SADC (Southern Africa) Land-cover change assessment at national level: forest; agricultural; and pastureland domains Seasonal synthetic bulletin (subcontinental scale) Multi-annual per-country synthesis (contribution to the “Country Environment Profiles”)
Global Crop Monitoring
Global Area estimates outside Europe Area estimate in Sub-Saharan Africa Agriculture land use change indicators in Sub-Saharan Africa Rainfall estimates and ensemble approach in crop monitoring
Source: Booz and Company Analysis.
Table C.18: Climate Change - ECLISE/CLIMRUN
Service areas Scope Products
Service Coordination n/a n/a
Local Climate Services (ECLISE)
Local n/a
Local Climate Information in the Mediterranean (CLIMRUN)
Regional, local Decadal predictions; Modeling and downscaling tools
Source: Booz and Company Analysis.

Booz & Company
Date: 19th September 2011 Cost-Benefit Analysis for GMES Final Version II
Prepared for: European Commission Directorate – Enterprise and Industry
186
Appendix D Review of Previous CBAs and Other Market Studies
D.1 ESA’S GSE PROJECT CBAS
ESA commissioned a series of 12 CBA projects in 2003 and 2004 which sought to quantify the benefits and costs of the precursor services as they were defined at that time.
This section provides a high level review of the scope and main findings of these initial studies. This is important because the cost/efficiency savings that GMES would provide for end users that were estimated in these studies were later incorporated into the PWC study as the basis for the Category 1 benefits. These studies also provided an initial view of the potential wider benefits that GMES could provide through better policy outcomes, and security and environmental resource management in general.
These reports are listed in the table below.
Table D.1 – List of previous GMES cost-benefit studies
GSE Project CBAs and Author
COASTWATCH, AETS ICEMON, ControlWare
RISK-EOS, AETS Urban Services, ControlWare
TerraFirma, AETS RESPOND, ControlWare
Northern View, ESYS PROMOTE, ControlWare
ROSES, ESYS GSE-FM, ECORYS
GMFS, ESYS SAGE, ECORYS
Source: European Commission (various).
In carrying out the CBAs, the studies applied wide variations in method, and many gaps in benefit estimation remained to the difficulties and uncertainties around many of the identified benefit areas. Despite these and other issues, the previous CBA studies provide a useful reference point for consideration as part of updating the benefit framework for the GMES programme as whole.
A summary of each of the 12 CBA projects is provided in the table below.
Table D.2: Summary of the previous GMES cost-benefit studies
CBA Study Summary
COASTWATCH
� COASTWATCH was defined as an integrated geo-information service in support of integrated coastal zone management
� The operational service components included the following:
- Coastal Indicator Service
- Coast Land Mapping Service
- Water Quality Monitoring Service
- Coastal Hydrodynamic Service � The main areas of benefit identified in the study include:
- Operational cost savings related to data gathering and analysis, in situ monitoring and cruise optimisation
- Environmental cost savings in terms of less degradation and improvements to the coastal environment
- More efficient decision tools for policy regulation and assessment, and additional benefits in policy making

Booz & Company
Date: 19th September 2011 Cost-Benefit Analysis for GMES Final Version II
Prepared for: European Commission Directorate – Enterprise and Industry
187
CBA Study Summary
- Reduced infrastructure and study costs
- Less damage associated with algal blooms and improved port operations � The study also provided monetised cost/efficiency gains for current policies and operations. � Based on this study, the efficiency benefit estimate applied in the PWC study for 2012 was €18.16m
(2005 prices).
RISK-EOS � RISK-EOS was a grouping of services aimed at providing a European service capacity supporting organisations in the management of natural hazards
� The RISK-EOS CBA took into account the following dedicated services:
- Dynamic fire risk monitoring
- Near real-time fire risk monitoring
- Burnt scars monitoring
- Flood risk analysis
- Flash flood awareness
- Assets mapping
- Rapid mapping � Benefits were estimated for:
Flood risk: preparedness and prevention, damages, flash flood casualties, flood crisis management
Fire risk: damages, intervention costs
� The study also provided monetised cost/efficiency gains for current policies and operations. � Based on this study, the efficiency benefit estimate applied in the PWC study for 2012 was €3.14m
(2005 prices).
TerraFirma � TerraFirma was defined as a pan-European ground motion hazard information service related to the monitoring of landslides, seismicity and subsidence
� The main areas of benefit identified in the study include:
- Economic benefits associated with reduced infrastructure, survey and monitoring costs, reduced property damage and lost productivity, reduced mortality and morbidity, and other environmental factors
� The study also provided monetised cost/efficiency gains for current policies and operations. � Based on this study, the efficiency benefit estimate applied in the PWC study for 2012 was €17.38m
(2005 prices).
Northern View
� The Northern View project aimed to develop operational services to serve makers and enforcers of environmental policies in sensitive Northern Environments
� The initial services definition included:
- Iceberg detection and monitoring
- Glacier and snow monitoring
- Oil discharge monitoring
- Sea Ice monitoring � The following service elements were then added to the baseline during the course of the project
- Land monitoring
- Lake ice monitoring
- River ice monitoring � The study identified and evaluated the following areas of benefit in the areas of service cost
effectiveness, direct user benefits and indirect benefits and externalities. � For service cost effectiveness, benefits included:
- For iceberg detection, more efficient use of flying hours and continued operations in bad weather for the International Ice Patrol
- More efficient data collection in relation to glacier monitoring (e.g. by hydroelectric power companies), sea ice monitoring, land mapping, lake and river ice monitoring
- For oil spill detection, clean-up operations would be more efficient

Booz & Company
Date: 19th September 2011 Cost-Benefit Analysis for GMES Final Version II
Prepared for: European Commission Directorate – Enterprise and Industry
188
CBA Study Summary
� Reported direct user benefits included:
- More efficient routeing for commercial shipping on the North Atlantic
- Better electricity yields through better management of glacial assets
- Reduced pollution
- Better information to support local fishing communities and to improve safety for transporting people and goods on ice
- Reduced property damage due to better flood risk management � The study also provided monetised cost/efficiency gains for current policies and operations. � Based on this study, the efficiency benefit estimate applied in the PWC study for 2012 was €17.31m
(2005 prices).
ROSES � ROSES (Real-Time Ocean Services for Environment and Security) was a service element dedicated to operational oceanography
� ROSES was to be initially demonstrated for two services – oil spill detection and water quality (algal bloom) monitoring at specific locations in Europe, but also includes service elements related to sea level and climate monitoring, and marine primary production assessment
� Benefits are classified as upstream user, downstream user, societal and strategic � For oil spill detection:
- Upstream user benefits include those that assist organisations in the process of detecting and monitoring oil spills by providing greater efficiency and monitoring, and increased coverage and accuracy
- Downstream benefits relate to the reduction of oil spill pollution through a deterrent effect and a coordinated European approach
- Societal benefits related to better beaches, water conditions and associated health improvements, as well as habitat improvements
� For harmful algal blooms:
- Upstream benefits for aquaculture operators as GMES allows better identification of farm sites, avoidance of algal bloom threats
- Downstream benefits relate to, over the short term, the aquaculture industry, beach-goers and fishers. Over the longer term, this could impact on policy making for land applications of fertilisers and other land management issues.
- Wider societal benefits include improved fisheries and mariculture in general, improvement in public amenities, etc.
� The study also provided monetised cost/efficiency gains for current policies and operations. � Based on this study, the efficiency benefit estimate applied in the PWC study for 2012 was €11.74m
(2005 prices).
GMFS � GMFS (Global Monitoring for Food and Security) aimed to establish an operational service for food security to serve policy makers and operational users by providing accurate and time spatial information on variables affecting food security
� GMFS contributes to improved food security through cooperation with organisations and the provision of services that provide:
- Additional variables that answer the specific needs of food security users
- More accurate data and forecast improvements
- More usable and policy-relevant information � Benefits are calculated for upstream users, downstream users and for society as a whole � For upstream users, the main benefits from GMFS in the three information supply areas of
observation, assimilation and modelling are through contributions to early warning systems and through contributions to the sustainability of agriculture over the longer term
� Benefits for downstream users include:
- Better targeting of interventions through fewer missed events and false alarms, and more efficient resource allocation
- Improved local monitoring capabilities over the longer term

Booz & Company
Date: 19th September 2011 Cost-Benefit Analysis for GMES Final Version II
Prepared for: European Commission Directorate – Enterprise and Industry
189
CBA Study Summary
- Improved agricultural performance
- International cooperation over the longer term, which could lead to sharing the costs of satellite provision
� Wider benefits for society as a whole include aspects related to achieving foreign aid goals and supporting international organisations
� The study also provided monetised cost/efficiency gains for current policies and operations. � Based on this study, the efficiency benefit estimate applied in the PWC study for 2012 was €7.06m
(2005 prices).
ICEMON � ICEMON consisted of a number of near real time (NRT) Ice and other Off-line products. Ice products:
- NRT Ice products are targeted at operational users to improve transport navigation and other off-shore operations in ice covered areas. They also support environmental monitoring in the Arctic
- Off-line products are aimed at improving maritime construction and operations leading to safer sea operations and to understand global change issues
� The study estimates a series of direct and indirect benefits. Sources of benefit include:
- Cost savings for (Baltic) sea ship traffic
- Cost savings for Barents sea shipping linked to off-shore design improvements
- Cost avoidance in the Baltic and Barents seas due to reductions in the risks of oil accidents
- Efficiency gains for environmental monitoring
- Efficiency gains for climate modelling and research � The study also provided monetised cost/efficiency gains for current policies and operations. � Based on this study, the efficiency benefit estimate applied in the PWC study for 2012 was €8.60m
(2005 prices).
Urban Services
� The GMES Urban Services (GUS) portfolio is driven by the demand for geo-spatial information for urban planning and monitoring the urban environment
� The product brand that was developed under GUS is the ‘Urban Atlas’ of land use and land use change. This has similarities to CORINE, which is applied in the broader environmental context
� The study estimates a series of direct, indirect and externality benefits due to GUS. Sources of benefit include:
- Direct benefits in the form of cost savings for city administrations
- Indirect benefits in the form of improved socio-economic impacts through better implementation of the DG REGIO Structural Funds
- Improved output/productivity in the industrial sector � The study refers to other wider benefits associated with better access to information, better
functioning cities, etc. � The study also provided monetised cost/efficiency gains for current policies and operations. � Based on this study, the efficiency benefit estimate applied in the PWC study for 2012 was €10.04m
(2005 prices).
RESPOND � RESPOND was aimed at supporting European and international humanitarian relief through the provision of appropriate and reliable geographic information
� Added value is to be achieved by providing:
- Accessibility to high quality and objective information
- Pooled capabilities and tailored data
- Timely and appropriately delivered data products
- Continuity and affordability � Benefits are identified for first, second and third order beneficiaries:
- The first order beneficiaries are aid agencies, which benefit from efficiency gains related to improved impacts, cost savings through shared common resources and intangible benefits related to awareness raising, public relations, etc.
- Humanitarian operations are classified as second order beneficiaries, which experience efficiency gains related to the improved means for logistics planning, damage cost savings (e.g. saved lives) and better management of field workers, and intangible public good benefits

Booz & Company
Date: 19th September 2011 Cost-Benefit Analysis for GMES Final Version II
Prepared for: European Commission Directorate – Enterprise and Industry
190
CBA Study Summary
- The third order beneficiaries are related to the humanitarian situation. Efficiency gains lead to saved lives, reduced damage to property and livestock, etc. There are cost savings linked to faster economic recovery after crises, and intangible benefits related to less human suffering, quality of life, etc.
� The study also provided monetised cost/efficiency gains for current policies and operations. � Based on this study, the efficiency benefit estimate applied in the PWC study for 2012 was €24.00m
(2005 prices).
PROMOTE � PROMOTE was aimed at delivering operational services and products related to ozone, surface ultra-violet (UV) radiation and air quality
� Benefits are estimated for a number of areas, including:
- Efficiency gains for ozone monitoring for WMO/GAW, and cost savings from requiring less ground monitoring stations in developing countries in the future
- Cost avoidance for society associated with improved weather forecasting
- Reduced health costs associated with non-melanoma skin cancer
- Reduced costs of mortality of skin cancer
- More efficient investment in air quality ground measurement infrastructure
- Improvements in life expectancy / chronic mortality rates associated with improvements in air quality
- Reduced health costs associated with reducing the acute numbers of morbidity due to poor air quality
� The study also provided monetised cost/efficiency gains for current policies and operations. � Based on this study, the efficiency benefit estimate applied in the PWC study for 2012 was €8.10m
(2005 prices).
GSE-FM � The GSE-FM (GSE – Forest Monitoring) was aimed at providing forest monitoring operational services and products for climate change, sustainable forest management, and for environmental issues and nature protection. Benefits are attributed to each of the key policy areas
� The main benefits in relation to forest monitoring for climate change include:
- Direct benefits associated with cost savings compared to alternative methods, reduced uncertainty due to more reliable estimates, geo-referenced information, and higher compliance rates (penalty avoidance) for international and national obligations
- Indirect benefits as better information leads to improved decision making and positive environment policy outcomes
� Benefits in the area of forest monitoring for sustainable forest management relate to the mapping and monitoring of disturbances (e.g. clear cuts, forest fires, etc.), and sub-national forest information updates. This includes:
- Direct benefits including cost savings due to more efficient field work, more efficient data collection and better data quality
- Indirect benefits including more efficient and reliable regeneration of forests leading to higher production, improved planning for forest fire fighting, improved conservation, preservation of ecosystems, and recreation benefits
� Benefits in the area of forest monitoring for environmental issues and nature protection relates to land cover and forest indicators. This includes:
- Direct benefits associated with improved data and compliance (penalty avoidance) with international and national monitoring obligations
- Indirect benefits related to improved decision making on environmental issues (air pollution, landscape planning, nature protection, etc.), and recreational benefits
� The study also provided monetised cost/efficiency gains for current policies and operations � Based on this study, the efficiency benefit estimate applied in the PWC study for 2012 was €23.90m
(2005 prices).
SAGE � The Service for the Provision of Advanced Geo-Information on Environmental Pressure and State (SAGE) was aimed at offering a comprehensive product portfolio to serve the demands from the European Water Framework Directive (WFD) and the then upcoming Thematic Strategy on Soil

Booz & Company
Date: 19th September 2011 Cost-Benefit Analysis for GMES Final Version II
Prepared for: European Commission Directorate – Enterprise and Industry
191
CBA Study Summary
Protection (or Soil Thematic Strategy – STS) � Benefits identified in the study include:
- Cost reductions through the provision of generic land cover product comparable with the CORINE database
- Reduced costs associated with monitoring water abstraction
- Reduced costs associated with water metering
- Reduced losses for famers due to better irrigation practices (particularly during dry years)
- Cost savings in providing for cadastre revisions
- Infrastructure cost savings � The study also provided monetised cost/efficiency gains for current policies and operations. � Based on this study, the efficiency benefit estimate applied in the PWC study for 2012 was €2.41m
(2005 prices)
Sources: European Commission (various), PWC (2006).
D.2 OTHER DOWNSTREAM MARKET STUDIES
One of the key aspects of the CBA is the consideration of the potential for GMES to support growth in downstream service provision and other applications in the EO sector. In this context, important previous studies include the ECORYS study from 2008, and the VEGA/BAH study from 2005.
D.2.1 ECORYS study on the Competitiveness of the GMES Downstream Sector (2008)
The context for this study is the EC Impact Assessments and Communications in 2008 (We care for a safer planet) and 2009 (Challenges and next steps for the Space component).234 The report analyses the ‘competitiveness of the existing EU GMES downstream sector and of the regulatory and other framework conditions affecting the competitiveness of this sector’.
The main issues addressed in the report include the:
� Performance of the European EO downstream sector, in terms of revenues, employment and productivity;
� Structure of the sector;
� Competitiveness of the sector in terms of production processes, imports and exports, profitability and market structure;
� Regulatory and framework conditions and the impact of these conditions on the competitiveness of the sector; and
� EO downstream services sector compared with its US equivalent.
Background on the European EO Sector
Table D.3 provides an overview of estimates of space-based downstream revenues as at 2005, which permits key observations about the sector, including:
234 COM(2008) 748 “Global Monitoring for Environment and Security (GMES): We care for a safer planet”, November 2008 -
http://eur-lex.europa.eu/LexUriServ/LexUriServ.do?uri=COM:2008:0748:FIN:en:PDF;
COM(2009) 589 “On the progress made under the 7th European Framework Programme for Research”, April 2009 – http://eur-lex.europa.eu/LexUriServ/LexUriServ.do?uri=SEC:2009:0589:FIN:EN:PDF.

Booz & Company
Date: 19th September 2011 Cost-Benefit Analysis for GMES Final Version II
Prepared for: European Commission Directorate – Enterprise and Industry
192
� EO is the smallest of the three value adding space segments in absolute numbers, and represents only 2% of revenue in the downstream market for space-based applications; and
� European revenues take up around one-third of world revenues in the EO sector (as well as in the telecommunications sector), which suggests that the EU has a relatively healthy EO sector.
Table D.3: Overview of Space-based Downstream Revenues (2005)
Sector Revenue: World
€ Billion, 2005
Revenue: Europe
€ Billion, 2005
Europe
%
2000-05 CAGR
Europe
Telecommunications 54.3 18.1 33% 6.5
Navigation 17.3 2.3 13% 22%
EO 1.3 0.4 31% 4%
Total 72.9 20.8 29% 11%
Source: ECORYS (2008) analysis of Euroconsult data.
Note: Data includes Canada, an associate member of ESA, which accounts for 10%
A separate study by VEGA, and cited in the ECORYS report, suggests that once you remove public sector expenditure on meteorology and met-ocean, total revenue in the European EO sector is around €300 million in 2006 (not €400 million or more reported in the Euroconsult study), and that purely commercial revenue is around €175 million in 2006.
Table D.4 presents EO sector revenue, numbers of employees and labour productivity in 2002 and 2006, as well as the growth experienced over that period. Some key observations include:
� The commercial European EO sector employed around 3,000 people in 2006;
� Labour productivity is relatively high in the EO sector, with average productivity equalling around €100,000; and
� Growth in revenue and labour productivity at the time was growing stronger than employment in the EO sector.
Table D.4: Overview of Space-based Downstream Revenues (2005)
Sector 2002 2006 CAGR
Revenue (ex public sector) €285m3 €306m 1.8%
Employees (ex public sector) 2,900 3,000 0.85%
Labour Productivity €98,000 €102,000 0.93%
Source: ECORYS (2008) analysis of VEGA data
Based on analysis of VEGA data, the ECORYS report demonstrates that the European (and Canadian) EO sector is dominated by small to medium sized enterprises. Of the 151 companies recorded:
� 87 companies are small, employing between 0 and 10 employees;
� 68 companies are medium-sized, employing between 11 and 60 employees; and
� 6 companies are large, employing more than 60 employees.

Booz & Company
Date: 19th September 2011 Cost-Benefit Analysis for GMES Final Version II
Prepared for: European Commission Directorate – Enterprise and Industry
193
It has been measured that, on average, the sector employs 20 persons per company and generates turnover of around €2m per company.
Potential Issues for Growth in the GMES Downstream Sector
The ECORYS report considers barriers to entry into this sector to be relatively limited. Potential areas of concern focus on the influence of public policy and the cost of data access. The report also argues that a consortium of providers may have a comparative advantage over a potential new entrant to the market. However, it also emphasises that the risks associated with this are understood to be mild because initial set-up costs for a new company are low.
Comparisons with the US EO Sector
A high level comparison with the US EO sector reveals that:
� US industry is between two and three times the size of Europe, depending on the exact definition of the sector;
� The main difference is the much larger domestic defence / security market accessible to US companies; and
� US industry appears to be growing faster than that in Europe.
Methodology for Mapping of EO Value Adding Activities to GMES Core Service Outputs
According to the study, there are two possible approaches to identifying the downstream sector influenced by GMES core services:
� A vertical segmentation analysing the levels of activity in different vertical parts of the supply chain and isolating the downstream part; and
� A horizontal segmentation– identifying those thematic market segments that could be served by Core services.
The study agreed to use the second method due to the better availability of information to segment the market horizontally rather than vertically and because the core services vary considerably in their vertical scope (see the figure below).

Booz & Company
Date: 19th September 2011 Cost-Benefit Analysis for GMES Final Version II
Prepared for: European Commission Directorate – Enterprise and Industry
194
Figure D.1: Proportion of Industry Revenue by Horizontal Market Sectors
Source: ECORYS (2008) analysis of VEGA data.
Note 1: Note: The VEGA definition of size classes differs from the EU definition, that defines companies with 1-10 employees as micro-enterprises, with 11-50 employees as small enterprises, with 51-250 employees as medium sized enterprises, and >250 employees as large enterprises.
Note 2: Booz & Company analysis used to convert original figure for this report.
The above figure demonstrates that around 20% of industry revenue is concentrated in the ‘Cartography & Topographic Mapping’ sector, with much of this attributable to large companies. Around 15% is attributable to ‘Land Use / Land Cover and Change Mapping’ and a little over 10% in ‘Marine and Coastal Surveillance’. The middle bracket sectors are focused on land mapping services, with the lowest represented sectors relating to climate change, atmospheric monitoring and water quality monitoring. It is not clear what is driving these patterns of sectoral development, however it has interesting similarities to the development of GMES to date.
After mapping the applications segment to GMES service influence, the study also found that it is estimated that the value of commercial downstream services industry impacted by the GMES Core Services is €117 million per annum based on 2006 turnover.
Based on other analyses, the study found that the main operational centres of EO activity are the UK and Germany, although France, Italy, Belgium and Spain are also taking up a relative important position. In addition, almost all European EO downstream organisations are located in the EU, plus Norway and Switzerland.
Observations for the Current GMES CBA
Some observations of the ECORYS study for the current GMES CBA include:
� While the study provides an good market overview and mapping against GMES service areas, it is significantly out of date;
� Is not known whether the downstream sector is the way it is because there has been little or no GMES in the past;
� It is unclear as to how the market will react to GMES. For example, will it move to providing enhanced downstream services, or will GMES 'crowd-out' some businesses?

Booz & Company
Date: 19th September 2011 Cost-Benefit Analysis for GMES Final Version II
Prepared for: European Commission Directorate – Enterprise and Industry
195
Despite these limitations, in the absence of any more up-to-date information becoming available, this study will form a key source of baseline data related to the size and structure of the EO sector, and for the analysis of the downstream impacts of GMES.
D.2.2 Booz Allen Hamilton and VEGA study on the State and Health of the European and Canadian EO Service Industry (2004)
As part of the study, a review has also been completed of the Booz Allen Hamilton / VEGA report in 2004 on ‘the State and Health of the European and Canadian EO Service Industry’. This investigated the state of the European and Canadian EO service industry, based on the results of an 18-month study into value-adding companies throughout the ESA countries. It sought to clarify the status of products and services on offer, working practices, market impact, and underlying health of the EO industry in 2004.
While this report provides an interesting insight into the structure of what the ECORYS study above describes as the ‘GMES downstream sector’, very little of this information is directly relevant to our study. Furthermore, as this report was published in 2004, much of this information is out of date.
D.3 PWC STUDY OF THE SOCIO-ECONOMIC BENEFITS OF GMES
D.3.1 Background and Objectives
The PWC study from 2006 is the only major cross-cutting benefits assessment that covers all of the services envisaged for GMES. The study was Commissioned and managed by the European Space Agency (ESA) in cooperation with DG Enterprise and Industry. The objectives of the study were to:
� Evaluate the impacts of GMES compared to a baseline without GMES; and
� Characterise the benefits of GMES with respect to their strategic, political and social dimensions.
D.3.2 Approach and Methodology
The PWC study was conducted over two years, including for much of 2005 and 2006, and involved the establishment of an ‘Expert Committee that was nominated by the GMES Advisory Council to provide advice and guidance on key elements of the study.
The study was conducted over two stages. The first phase included a review of published work and stakeholder consultation supported by GMES policy experts and principle stakeholders. This led to a ‘phase 1 benefit assessment’. The second phase of work involved refining the benefit assessment using focus groups and further consultation exercises.
The benefit assessment methodology comprised both a ‘strategic’ and a ‘quantitative’ analysis of the potential benefits of GMES. The strategic benefits of GMES are said to relate to its role in supporting Europe’s strategic and political priorities with respect to environmental protection and security. This is in contrast to the quantitative assessment, which focused on the macroeconomic benefits and microeconomic efficiency savings. Under this framework, the macroeconomic benefits relate to the wider societal, downstream impacts of GMES. The microeconomic impacts relate to the savings for recipients of GMES information and experience an efficiency gain in the form of reduced costs in implementing existing policy procedures.

Booz & Company
Date: 19th September 2011 Cost-Benefit Analysis for GMES Final Version II
Prepared for: European Commission Directorate – Enterprise and Industry
196
The steps that were followed in developing the benefits assessment followed a traditional approach. This includes:
� Determining the policy context;
� Developing the baseline scenario;
� Developing the ‘with scheme’ scenario; and
� Quantifying the impacts.
D.3.3 Determining the Policy Context and Baseline Scenario
In determining the policy context, the study identified the policy domains that GMES could support. This analysis is developed alongside the GMES service definition, which identifies the additional impact of GMES according to each of its thematic service areas, and classifies the expected beneficiaries (users).
The GMES policy domains were then linked to a set of wider benefit areas to enable the analysis of the potential impacts of GMES within each policy domain. This framework is shown in the figure below. It provides the basis for the quantitative assessment by identifying the areas in which GMES can create specific impacts and to support the identification of economic indicators that can be used to quantify those impacts.
In developing the baseline scenario, a key set of assumptions were developed around a series of global and European policy areas, which were derived from a range of published sources. These covered the first 10 years of the appraisal period.
At global level, key assumptions related to the setting of targets for deforestation related to climate change under international agreements. Other key assumptions related to agreements on biodiversity, desertification and wetlands, as well as Millennium Development Goals and related issues.
At the European level, a long list of assumptions was required. Assumptions were made regarding:
� The implementation of an Ambient Air Quality Directive that will achieve reductions in air pollution;
� The implementation of a Marine Strategy that will include a series of requirements to factors like marine pollution, oil spills, aquaculture and other issues;
� Reductions in subsidies under the Common Agricultural policies;
� The implementation of forest and soil thematic strategies;
� Standardisation and access to public information;
� A lack of progress over the first 10 years of the appraisal process in the areas of:
- Climate change;
- Sustainable cities;
- Habitat protection;
- Regional and Cohesion policy and their demand for geo-spatial information;
- Neighbourhood policy, while generally unchanged, there is an assumption that Turkey is to join the EU; and
- Development, Aid and the Common Foreign and Security Policy, where current aspirations are to be met through national and non-European data sources.

Booz & Company
Date: 19th September 2011 Cost-Benefit Analysis for GMES Final Version II
Prepared for: European Commission Directorate – Enterprise and Industry
197
D.3.4 Developing the ‘with Scheme’ Scenario
The PWC study does not provide a detailed technical analysis of the ways in which GMES can create impact. Instead of being technology driven, the analysis is linked to the way GMES can support the implementation of existing policies, the development of new policies within the EU, and where it can support the EU in establishing international agreements or to influence environmental protection and security at a global level.
Related to this, a range of impacts were identified over the short and longer term. This led to the categorisation of benefits as follows:
� Category 1: Benefits related to the uptake of information readily available from services that are already operational and can be used to enhance the efficiency of policy implementation;
� Category 2: Benefits that depend on policy developments at EU level, or that depend on significant changes in user behaviour (e.g. business practices); and
� Category 3: Benefits that depend on major new international policy or treaty developments, or enhancements to the enforcement of existing treaties.
The evaluation of GMES impact for Category 1 benefits was based on the estimates provided in a series of 12 CBA reports that were linked to GSE projects started by ESA in 2003 and 2004.
The estimation of Category 2 and 3 impacts involved the estimation of a series of behavioural ‘factors’ that could be applied to reducing baseline costs across the various policy issues. Examples of baseline costs could include the costs of climate change and pollution, or health and welfare costs in areas that are prone to humanitarian crises. In this context, the behavioural factors represent the contribution of GMES to future policy development and the forming of international agreements that enable policy outcomes above and beyond what is included in the baseline scenario. The estimation of these behavioural factors was generally based on expert judgment, other stakeholder views that were collected during the various consultation exercises over the course of the study, and published research papers.
D.3.5 Quantifying the Impacts
To quantify and monetise the impacts of GMES, the PWC study defines a framework that relates potential GMES impacts and economic indicators to characterise those impacts across each of the GMES policy domains. This is shown in the following table.
Table D.5: Overview of Space-based Downstream Revenues (2005)
GMES policy domain
Application of GMES services
Potential GMES Impact
Indicator to characterise GMES impact
Global environment
Climate change – reduction in uncertainty
Reduced Global damage costs imposed by climate change, through enhanced mitigation and reduced deforestation
Damage costs per tonne of CO2e Climate value of forests per Ha
Desertification Reduced loss of productive land
Economic value per Ha of productive land

Booz & Company
Date: 19th September 2011 Cost-Benefit Analysis for GMES Final Version II
Prepared for: European Commission Directorate – Enterprise and Industry
198
GMES policy domain
Application of GMES services
Potential GMES Impact
Indicator to characterise GMES impact
Development and aid
Humanitarian aid and food security
Improved health and welfare in Africa
Value of a Disability Adjusted Life Year in Africa
Security Crises response in Africa
Improved health and welfare of refugees in Africa
Value of a Disability Adjusted Life Year in Africa
Natural resources
Agriculture
Efficiencies in monitoring CAP(Common Agricultural Policy)
CAP monitoring costs
Biodiversity and ecosystem services
Reduced loss of forests
Existence value of biodiversity per Ha of forest
Fisheries Reduced illegal fishing
Value of illegal fish landings (per tonne)
European Environmental Protection
Air quality Human health benefits
Statistical value of life in Europe
Water quality
Efficiencies in delivering the WFD (Water Framework Directive)
WFD monitoring costs Nitrate removal costs
Land use Reduced soil quality degradation
Soil Thematic Strategy monitoring costs
Marine and coastal environment
Urban planning efficiencies, energy savings.
Addressed in qualitative terms only. Stakeholders did not feel able to express a quantitative role for GMES in this area, nor was an appropriate indicator specified.
Risk & Civil Protection
Floods Reduced flood impact in Europe
Economic cost of oil spill clean up
Forest fires Reduced forest fire impact in Europe
Health, welfare and property damage costs of flooding
Urban subsidence and land slides
Reduced geohazard impact in Europe
Health, welfare and property damage costs of forest fires
Industrial accidents Reduced industrial accident impact in Europe
Health, welfare and property damage costs
Sustainable Growth Competitiveness, efficiency savings
Improved cost efficiency for primary users of GMES information
Cost savings of primary users
Source: PWC (2006)
Using the framework of economic indicators, the PWC study provided an assessment of the impacts of GMES and the monetised economic benefits over the appraisal period. This was completed in nearly all areas identified for Category 2 and 3 benefits, with the only exception being land use - urban planning.
This required setting forth the rationale for the way GMES can create impact in each of the benefit areas, identifying the baseline damage costs in each area, and making an assessment of the extent to which GMES can reduce those costs. The basis of the evaluation applied to each benefit area is described in the table below.

Booz & Company
Date: 19th September 2011 Cost-Benefit Analysis for GMES Final Version II
Prepared for: European Commission Directorate – Enterprise and Industry
199
Table D.6: Approach to Evaluating Economic Benefits in the PWC Study
Benefit Area Basis of Evaluation
Category 1
Efficiency Savings � The evaluation of GMES impact for Category 1 benefits was based on the estimates provided in a series of 12 CBA reports that were linked to GSE projects started by ESA in 2003 and 2004
Category 2
Air Quality � GMES will include operational services to assimilate and model atmospheric composition and support informed decisions on the policy issues of stratospheric ozone depletion, surface UV exposure, air quality and climate change
� Baseline costs relate to Disability Adjusted Life Years (DALYs) lost in Europe due to air quality issues
� Stakeholders suggested that the role of GMES (in the medium to longer term) in improving health and welfare losses imposed through poor air quality be considered in the context of a 5% reduction in fine particulate matter – this potentially being achieved via improved control of emissions due to stricter policies formulated after using information provided by GMES
Marine � Focus on GMES providing improved ICZM (Integrated Coastal Zone Management) services and political decision making, improved oil spill detection in combination with SAR and aircraft monitoring, reduced marine pollution, improved ecosystem, HAB alert services, as well as polar environmental information services
� For oil spill detection, stakeholders estimated that GMES could improve the detection rate of illegal spills by around 10% and have a commensurate impact on overall deterrence
� This assumption is applied in the study, where a 10% effective reduction in illegal oil discharges leads to a reduction in clean-up costs and lower overall economic costs
� The fisheries element is related to the Common Fisheries Policy and the role for GMES in complementing existing services for surveillance of illegal fishing and enhancing the effectiveness of identification of illegal fishing operations
� Baseline scenario relates to the assumption that 30% of catches in important fisheries are illegal
� Based on stakeholder views, it is assumed that GMES can reduce illegal fishing in European waters by 10%
Flooding � Focus is on pre, during and after event services in the area of flood risk management � Baseline costs are based on mortality and morbidity statistics and VOSL � A workshop was held with key stakeholders to assess the extent to which GMES could
contribute to flood forecasting and ultimately, damage cost reduction. Overall, stakeholders suggested that GMES could reduce damage by around 1.5%
Conflict Resolution � Focus is on providing humanitarian assistance in the context of conflict and complex emergencies in Africa
� Baseline costs relate to the impact of conflicts on DALYs in Africa � Approach to assessing the role of GMES in alleviating complex emergencies is subjective
and qualitative � Based on stakeholder views of the relevance of GMES in this domain, coupled with the
uncertainty involved, the study has assumed a 1% reduction in DALYs for the Africa region � This is not validated with other data/evidence
Humanitarian Aid � Focus is on humanitarian aid in Africa as this element is more suitable for quantification - food security is excluded from the calculation
� Baseline costs are estimated using statistics on numbers of deaths and people affected by disasters and through applying the concept of 'statistical value of life' (SVOL), which is preferred to 'Disability Adjusted Life Year' (DALY) in this context
� GMES impact evaluated for each disaster category. Approach is to use a 1-3 scoring system, with 1 = 0.1%. These are added together and applied to the baseline cost estimate
� Scoring system and weights is not validated against other data sources or evidence

Booz & Company
Date: 19th September 2011 Cost-Benefit Analysis for GMES Final Version II
Prepared for: European Commission Directorate – Enterprise and Industry
200
Benefit Area Basis of Evaluation
Seismic Applications
� GMES geohazard products are centred on the use of radar interferometry to identify surface movements. Such movements can be indicative of slow subsidence, but can also indicate an increased likelihood of more dramatic changes such as landslides. The use of interferometry is also becoming an essential tool in understanding the dynamics of Earthquakes and volcanoes. By combining surface movement measurements from interferometry with in situ measurements and geological models, it is expected that GMES can provide a significant improvement over current monitoring practices
� The baseline costs relate to frequency of Earthquakes and volcanic activity in Europe, and their associated mortality and morbidity rates, multiplied by the annual DALY figures (1/3 of the figure is taken for morbidity), and property costs
� It is assumed, based on stakeholder input, that 1% of each of mortality, morbidity and property costs could be saved by GMES. These assumptions do not appear to be validated using other data sources
Forest Fires � Focus is on pre, during and after event services in the area of forest fire risk management � Baseline costs are based on mortality and morbidity statistics and VOSL � Based on analysis of stakeholder views, it is assumed that GMES can improve outcomes
by 1% � These improvements are assumed to relate primarily to improvements in fire-fighting
operations enabled by rapid and regular situation updates that GMES provides alongside other vital information such as weather dynamics. It is also assumed that GMES will contribute to fire risk assessments and that these will also help with longer term counter-measures
Other Civil Security
(Landslides, Infrastructure Stability, Industrial Risk)
� GMES geohazard products are centred on the use of radar interferometry to identify surface movements. Such movements can be indicative of slow subsidence, but can also indicate an increased likelihood of more dramatic changes such as landslides, which can pose significant industrial risks and create issues for the stability of urban infrastructure
� By combining surface movement measurements from interferometry with in situ measurements and geological models, it is expected that GMES can provide a significant improvement over current monitoring practices
� The baseline costs relate to frequency of landslides and industrial accidents in Europe and associated mortality and morbidity costs (using DALY values), and property costs for landslides only
� It is assumed, based on stakeholder input, that 0.75% of each cost driver for landslides could be reduced due to GMES. For industrial risk, a 0.25% value was modelled, with the lower value representing the view that the majority of industrial accidents result from problems with the plants themselves
� For public infrastructure stability monitoring, it is noted that the evaluation of benefits is difficult given a new approach is required. However, the study applied a 10% improvement/reduction in damage costs associated with subsidence, which was based on the GSE CBA (2004). This flows from better management of land use planning, development of preventative instruments and improvements in building codes
Forest Ecosystems � GMES can contribute to the preservation and management of biodiversity of ecosystems by detecting and monitoring changes on critical habitats (land, marine, Arctic)
� The critical areas of concern include the role of GMES in supporting the reduction of deforestation, management of forest resources (e.g. fire risk) and reduced levels of illegal fisheries
� With respect to fire risk management, the baseline costs are related to recreation, watershed benefits, conversation assets (option values), existence values
� Based on stakeholder input regarding the view that EO data has contributed 10% of the 60% reduction in burnt areas in Spain (i.e. 6% for EO benefit). This value is assumed for the study, and it is observed that much of the benefit would flow to southern Europe
� Category 3
Climate Change – Adaptation
� GMES will enable the EU to take a leading role in the international context and provide a framework for maintaining the long term continuous measurements needed for related

Booz & Company
Date: 19th September 2011 Cost-Benefit Analysis for GMES Final Version II
Prepared for: European Commission Directorate – Enterprise and Industry
201
Benefit Area Basis of Evaluation
climate change work � This will support the development of climate models for understanding and evaluating
projections of climate change � In setting out the baseline costs of climate change, the analysis focused on two key aspects
- the cost of damage caused by climate change that society cannot effectively adapt to, and the cost of investment in adapting to climate change
� Significant analysis was provided on the approaches to valuing the cost of damage caused by climate change, with the 'social cost of carbon' identified as the preferred measure
� Valuing the cost of adapting to climate change was seen as being particularly uncertain, and states a preference for focusing on the cost of climate change only
� However, consultation with a wide field of stakeholders and experts supported the role of GMES in the area of climate change adaptation
� Baseline costs are estimated based on a central emissions scenario at 20 Euro / tonne equity value of carbon
� GMES is assumed to provide a 0.1-0.5% benefit in this area, with the lower end of the range reported in the study. Several caveats are provided around the uncertainty around these benefits and their presentation as a Category 3 benefit
Deforestation – Climate
� GMES assumed to contribute to climate related deforestation monitoring in a number of ways, including forest monitoring products to meet the requirements of the Kyoto protocol (European focus, with wider future potential), and provide for wider coverage of the African and Boreal Eurasian forests
� Baseline costs relate to the extra carbon released into the atmosphere due to deforestation, combined with the social cost of carbon
� Stakeholders proposed that GMES could contribute to a 5-20% reduction in deforestation, with the lower bound assumed for the study
Desertification � Desertification is a global problem, effecting parts of Africa, Asia, Latin America and the Caribbean, Central and Eastern Europe (CEE), and the Northern Mediterranean. Over
� GMES could provide valuable input to identifying areas at risk of desertification. It would also provide valuable input to the monitoring and assessment tasks, through analysis of land cover and land cover change
� Baseline costs related to a proportion of dry lands that are likely to be affected by desertification (10-20%), and the associated damage costs (reduced incomes, rehabilitation costs)
� Assumed that GMES can support a 5% improvement in avoidance of desertification, based on input from stakeholders
Deforestation - Ecosystem
� GMES can contribute to the preservation and management of biodiversity of ecosystems by detecting and monitoring changes on critical habitats (land, marine, Arctic)
� The critical areas of concern include the role of GMES in supporting the reduction of deforestation, management of forest resources (e.g. fire risk) and reduced levels of illegal fisheries
� With respect to deforestation, the baseline costs are related to watershed benefits, fuel wood, recreation, non-timber forest products, genetic information, and conversation assets (option values)
� Assumed that GMES could reduce deforestation by 5-10%, with the lower bound used in the study
Source: PWC (2006); Booz & Company analysis.
The above table highlights a number of important factors, including the observations that:
� Setting out the baseline costs in each benefit areas requires a considerable amount of data from various sources, and that many of these would need to be updated as part of any new study;
� In nearly all cases, expert judgement and stakeholder views are applied to the assessment of GMES impact on each of the baseline cost areas. The behavioural values

Booz & Company
Date: 19th September 2011 Cost-Benefit Analysis for GMES Final Version II
Prepared for: European Commission Directorate – Enterprise and Industry
202
used often involve wide ranges and small magnitudes (i.e. around or less than 1%, and sometimes very close to zero);
� There are many areas where there is a high degree of uncertainty and, as such, the study has been forced to include a large number of caveats to ensure the results are not misinterpreted; and
� There are a number of areas where the study has not quantified any impacts of GMES. For example, this includes the areas of water quality, urban land use and development, agriculture, soil, algal blooms, and transport through the Polar regions.
The following table provides the point estimates of the benefits for each sub-Category for specific years within the appraisal period, as well as providing the net present value (NPV) of the benefit streams over the whole appraisal period. A separate column is included that shows the impact of including the terminal values for ongoing future benefits.
Table D.7: Estimated Economic Benefits in the PWC study: Full Scenario (€ Million, 2005 Prices)
Benefit Area 2012 2020 2025 2030 PV PV + Terminal
Category 1
Efficiency Savings 162 232 272 312 2,786 N/A
Sub-Total 162 232 272 312 2,786 N/A
Category 2
Air Quality - - 1,675 1,675 4,167 N/A
Marine 351 319 304 291 3,622 N/A
Flooding 135 227 314 435 2,584 N/A
Conflict Resolution 197 197 197 197 2,202 N/A
Humanitarian Aid 80 80 80 80 892 N/A
Seismic Applications 22 44 68 103 520 N/A
Forest Fires 9 21 39 73 278 N/A
Other Civil Security 6 18 37 75 254 N/A
Forest Ecosystems 6 6 6 6 63 N/A
Sub-Total 807 913 2,719 2,935 14,582 14,582
Category 3
Climate Change – Adaptation - - 3,309 5,631 14,010 111,779
Deforestation – Climate - - 631 1,074 2,488 6,146
Desertification - - 145 247 615 1,472
Deforestation - Ecosystem - - 65 75 185 258
Sub-Total - - 4,085 6,952 17,298 119,655
All Categories
TOTAL 969 1,145 7,076 10,199 34,666 137,024
Source: PWC (2006)
The presentation of the results demonstrates that the largest driver of benefits in the PWC study are the Category 3 benefits, which relate to the role of GMES in supporting the forming of international agreements in relation to climate change and forest protection, etc. This is in both absolute and present value terms.

Booz & Company
Date: 19th September 2011 Cost-Benefit Analysis for GMES Final Version II
Prepared for: European Commission Directorate – Enterprise and Industry
203
The figure below highlights each of the major benefit categories, with the column chart on the left indicating the extent to which these benefits are expected to materialise over the appraisal period. This shows that many of the larger Category 3 benefits are expected to develop over the longer term. The pie chart on the right demonstrates that Category 3 benefits account for half of total benefits in present value terms (despite their later development and associated discounting).
Figure D.2: Economic Benefits of GMES by Category as Estimated in the PWC study
Source: PWC (2006); Booz & Company analysis.
The following figure provides the share of benefits by sub-Category for Category 2 and 3. This shows that the major driver of the Category 3 benefits (and hence the largest driver overall), is the costs savings GMES can support in relation to adaptation. With respect to Category 2, the major drivers are the benefit areas of Air Quality, Marine, Flooding, and Conflict Resolution.
Figure D.3: Share of Economic Benefits of GMES within Category 2 and 3 as Estimated in the PWC study
Source: PWC (2006); Booz & Company analysis.

Booz & Company
Date: 19th September 2011 Cost-Benefit Analysis for GMES Final Version II
Prepared for: European Commission Directorate – Enterprise and Industry
204
Appendix E Review of CBA Literature
E.1 INTRODUCTION
A substantial part of the benefits of GMES applications lie in areas which are more challenging to value, such as environment, security, and so forth, and these benefits are derived from information delivered by GMES. To this end, the study has reviewed literature in areas related to cost-benefit analysis (CBA) as it applies to this kind of benefits, and as it applies to data and information for environmental and wider purposes.
This appendix consists of two sections. The first presents the overall summary and key findings from the literature review, while a second section provides a high level summary of each article and report reviewed.
E.2 KEY FINDINGS
Three key themes have emerged from this literature review.
Valuation of environmental (and similar) benefits
� Monetary valuation of environmental benefits and costs, and other hard-to-value socio-economic benefits and costs, in CBA was previously less common, and only now becoming more common, precisely because the valuation of these benefits and costs is more difficult and less certain than benefits up to now commonly included in cost-benefit analysis, even though the methods of valuation are becoming better known and more widely used.
� The easiest benefits to value are those where there is a direct cost saving, or where a market exists to value the usage of the service. The next stage of difficulty is when a quasi-market approach (e.g. revealed preference) can be applied to value the usage of a service, but this possibility is only occasionally available in environmental and similar benefits. The third stage is non-market methods such as contingent valuation methods. Increasing amounts of research has been done into this area, giving us a better appreciation of the methods and their limitations. This has also given us a library of values that can be used, but they tend to have a rather wider range of uncertainty of valuation than where markets exist. These ranges of uncertainty can have major impacts on the policy one would select when benefits and costs are predominantly environmental.
Valuation of information, especially information for generating environmental benefits
� A distinction exists between data and information. Typically data from more than one source must be analysed and presented to produce useful information, an activity which is costly. Information on environmental factors is typically probabilistic (e.g., the weather forecast is not certain), and new information typically serves to refine a risk-based decision at the margin. So although confident forecasts of future disasters would be valuable information, available information is not in that form, and new refined information typically only adds value in proportion to the refinement. The only methodologies in the literature for valuing additional environmental information are similar to those used in the PWC report.
Shortcomings of CBA for environmental (and similar) project analysis
� CBA is a popular decision tool because it is tractable and often presents a clear ranking of alternatives. But to obtain this tractability and certainty, one must accept assumptions

Booz & Company
Date: 19th September 2011 Cost-Benefit Analysis for GMES Final Version II
Prepared for: European Commission Directorate – Enterprise and Industry
205
that are not always realistic. CBA requires one to assume that impacts on the affected parties can be measured as money, the impacts on separate parties can be added up and discounted, and this will identify the best option. It has been argued by some authors that these assumptions are often less valid in the circumstance of environmental projects.
� The impacts are multi-dimensional and the CBA methodology produces recommendations that differ materially from what it is possible to show that well-informed people actually choose in this type of situation, undermining the assumptions of CBA. Some adjustments to CBA can handle some of these problems.
� But other decision tools such as multi-criteria analysis which might be applied to such multi-dimensional decision situations are less tractable, with less clear choices. CBA can be modified to some degree (losses valued more than gains, differing discount rates) to represent better some of the preference behaviours of people.
These three themes are elaborated further in the following sections.
E.2.1 Valuation of Environmental (and Similar) Benefits
The classic approach to CBA for many years has been that of Little and Mirrlees, devised in the 1960s, but best known from its exposition in their 1974 monograph “Project Appraisal and Planning for Developing Countries”,235 known as “The OECD Manual”. This early approach focused on tangible economic benefits, emphasised the importance of estimating the true resource cost of impacts, using shadow prices that removed the impact of taxes and other distortions, and set out clear approaches to discounting, distributional issues, and so forth. It did not have any detailed guidance or parameters for estimating less tangible socio-economic benefits.
The most easily evaluated costs and benefits, following direct cost effects, are those traded in a market, which will reveal both price and quantity. Valuations often exceed price paid, but estimations of this additional consumer surplus are often tractable. Some important socio-economic benefits are not directly traded in markets, but nevertheless it is these benefits that provide the rationale for important investments in infrastructure. But some are sufficiently close to market, that reasonably robust valuation is possible by “revealed preference”, “hedonic pricing”, and similar methods, which have become routine and well-established in certain areas of analysis. So as time proceeded, funding authorities developed more detailed and standardised methodologies for sector specific decisions in their own countries, such as the UK Department for Transport’s guidelines.236 These guidelines would include standardised methodologies, including parameter values, for socio-economic benefits where these had become well-established, such as travel time savings. In some areas, these relatively well established benefits were in fact the most important impacts, so the lack of valuations for other impacts, such as environmental, was not seen as such a large shortcoming.
In general it is more difficult to find robust methods of valuing environmental costs and benefits, because markets rarely exist, and data suitable for the quasi-market methods to be reliable often does not exist. Manuals now exist of methods of CBA for environmental methods, such as Pearce et al. (2006).237 This manual indicates that contingent valuation
235 I. Little and J. Mirrlees, Project Appraisal and Planning for Developing Countries, Heinemann Educational Books, 1974. 236 The UK Department for Transport’s appraisal and analysis guidance is known as WebTAG and is available at
http://www.dft.gov.uk/webtag/index.php. 237 Pearce, David and Atkinson, Giles and Mourato, Susana (2006) Cost-benefit analysis and the environment: recent
developments. Organisation for Economic Co-operation and Development, Paris, France.

Booz & Company
Date: 19th September 2011 Cost-Benefit Analysis for GMES Final Version II
Prepared for: European Commission Directorate – Enterprise and Industry
206
methods (willingness-to-pay, stated preference, etc.) are generally the main methods available, and describes their shortcomings.
As an indication of the difficulties of valuation, it is useful to compare willingness-to-pay (WTP) methodology with willingness-to-accept (WTA) methodology. The former seeks to survey what people are willing to pay for something, assuming they do not have it, whereas the latter surveys what compensation they would be willing to accept for deprivation of it, assuming they do have it. One would expect these measures to be similar, but in practice, in the case of typical environmental measures, the WTA measure is routinely found to exceed the WTP measure by factors of around 2 to 6.238 Measurement bias is certainly a major issue here – when you ask people their willingness to pay, they will typically understate their true valuation as if they were bargaining, they hope to get it cheaply. There are so-called choice methods for WTP surveys which attempt to conceal the price being asked by presenting subjects with choices between various alternative bundles. But these can be problematic as people find these choices difficult, and inconsistent choices are frequently observed as an indicator of this. Subjects are also capable of giving strategic replies when they become more skilled at deconstructing the bundles.
But in fact there are genuine reasons for differences between WTP and WTA. People have less understanding of things they do not have, and so will value them less than things they already have. There are transaction and learning costs in changing your ways. People may have low willingness to pay because they are budget constrained, and cannot convert the benefits they would obtain to cash in compensation. People often have a special attachment to something they have already, or worked to obtain. So it may genuinely be the case WTA measures should be larger than WTP measures, because deprivation of something costs more than the opportunity to obtain it is worth. This is an indication that simple parameters for environmental services may not apply – it is necessary to have different parameters for deprivations as opposed to gains.
These approaches also depend upon people knowing what the environment is worth to them, and in many cases they may simply be unaware of all the benefits they are obtaining from environmental systems, and the effect of changes, and so undervalue it. Environmental systems can be so complex that understanding the consequences of our actions in still remains a substantial impediment to carrying out a CBA of alternative actions.239 Environmental systems can have a global value, which are likely to be underestimated by locals who see their impact on a global system as having little direct effect on themselves.
Nevertheless, our understanding of valuation of environmental benefits has improved to the level that recommendations arose that many environmental effects could be routinely valued in standard CBAs for certain sectors.240 Albeit that the uncertainties might sometimes be greater than for other items in such CBAs, it would be reasonable when these were not the main costs and benefits. Attempts at making environmental valuations, even if subject to ranges of uncertainty, could also be useful at indicating that in some cases the less easily valued costs or benefits are in fact a major part of the total costs or benefits.241
238 David Pearce and Dominic Moran, The Economic Value of Biodiversity 1994, Earthscan Publications. 239 Atkins, J.P., et al. Management of the marine environment: Integrating ecosystem services and societal benefits with the
DPSIR framework in a systems approach. Mar. Pollut. Bull. (2011), doi:10.1016/j.marpolbul.2010.12.012. 240 K. G. Willis, G. D. Garrod and D. R. Harvey, 1998, A Review Of Cost-Benefit Analysis as Applied to the Evaluation of New
Road Proposals in the U.K., Transpn Res.-D, Vol. 3, No. 3, pp. 141-156. 241 Erica Brown Gaddis, Brian Miles, Stephanie Morse, Debby Lewis, Full-cost accounting of coastal disasters in the United
States: Implications for planning and preparedness, Ecological Economics (2007) 307-318.

Booz & Company
Date: 19th September 2011 Cost-Benefit Analysis for GMES Final Version II
Prepared for: European Commission Directorate – Enterprise and Industry
207
Difficulties are greater when environmental effects are the main consideration. A study242 of alternative policies comparing maintenance of flood defences as against allowing coastal flooding found that the costs and benefits were generally of the kind that are thought to be reasonably well valued, by the standards of these things. But the range of uncertainties, not just over valuations of different kinds of costs and benefits, but also over things such as discount rates, made material differences to the policies that were suggested from the analysis.
But in some cases, despite the complexities of valuation of benefits, cost benefit analysis can illuminate the best focus for resources. For example, high cost events with low probability of occurrence are difficult to value, and hence it is hard to determine how much resource should be devoted to mitigating the risk. The problem is greater still when the risk level is uncertain, or endogenous to the system, i.e., moves in response to mitigation measures. But in comparing a portfolio of similar risks, CBA can at least assist in focusing resources where it provides the largest benefit.243
In summary, valuation of environmental benefits and costs, and other hard-to-value benefits and costs such as security, is becoming routine for certain categories of benefit, but broad ranges of uncertainty of valuations remain, and often for good reason. Greater focus is available where the environmental costs and benefits are a relatively small contributor the to the overall CB ratio. In some cases, CBA can better focus the use of resources despite the uncertainties, where similar projects are being compared. In other cases, it may simply be alerted that the environmental costs and benefits are substantial compared to others. Where such costs and benefits are the main ones under consideration, there is likely to remain a broad range of uncertainty of valuation.
E.2.2 Valuation of Information
GMES does not directly provide costs and benefits of an environmental nature, rather it provides information, upon the basis of which people may choose to expend resources to deliver an outcome which affects the environment. When new policy initiatives are being founded upon particular information sources, it is easy to mistake the value of the policy initiative for the value of the information source. If one lost that information source, the policy initiative may still be valid, albeit with some loss of precision for having to find other bases for decisions, which in many cases would likely be found. The information source itself is only worth the value of the increase in precision between the two approaches.
The following two quotations are contrasted by Molly Macauley,244 a researcher who has written a number of papers on the valuation of social benefits from information from space systems:
“We find the value of information (VOI) is not zero, but it is not enormous, either.” (William D. Nordhaus, Sterling Professor of Economics, Yale University, writing about the value of weather and climate information, 1986).245
242 R.K. Turner, D. Burgess, D. Hadley, E. Coombes, N. Jackson, A cost–benefit appraisal of coastal managed realignment
policy, Global Environmental Change 17 (2007) 397–407. 243 Mark G. Stewart, Risk-informed decision support for assessing the costs and benefits of counter-terrorism protective
measures for infrastructure, International Journal of Critical Infrastructure Protection 3 (2010) 29-40. 244 Molly K. Macauley, The value of information: Measuring the contribution of Space-derived Earth science data to resource
management, Space Policy 22 (2006) 274–282. 245 Nordhaus WD. The value of information. In: Krasnow, RP, editor, Policy aspects of climate forecasting. Proceedings, May
4. Washington, DC: Resources for the Future;1986: p.29–34.

Booz & Company
Date: 19th September 2011 Cost-Benefit Analysis for GMES Final Version II
Prepared for: European Commission Directorate – Enterprise and Industry
208
“If we’d been able to produce a forecast last spring that California would be deluged this winter, it would have been worth whatever research investment was involved, if only because of the human misery it would have relieved.” (D. James Baker, then Administrator of the National Oceanic and Atmospheric Administration, writing shortly after heavy rains had flooded many parts of California, 1995).246
An analysis of the second quotation, apparently contradicting the first as to the small value of weather information, will lead us to an understanding of why the first quotation, from one of the world’s leading economists, is probably closer to the mark. Baker attributes a high value to information that is not actually available; the kinds of information that are actually capable of being generated are much less valuable. It is not possible even to specify what data and what analysis would enable us to have the information that Baker says would have been so valuable. Whilst some understanding exist of annual scale climatic oscillations, and their broad regional impacts, it is hardly likely to produce the precision of flood forecast Baker might find so valuable, or even imagine, given our understanding of climate science, what data might deliver it.
Baker might also have been over-optimistic in quite what the net saving would have been from having prior information on the flood. There are substantial costs in using such information. Lives certainly can be saved fairly easily by early warnings, which facilitate evacuation, but protecting property is much more costly. Our reading of Jin and Lin (2011), who analyse the benefits and costs of early warning systems for tsunamis, is that they appear to have overlooked the costs of using the data, and their simple method of estimating the economic savings from such warnings might have overlooked how much more costly it is to protect property than to implement evacuations to save lives.247
Some additional data of meteorological application, when processed through meteorological models that have been expensively developed by the most talented researchers incrementally over many decades, can produce some additional precision to weather forecasts a few days ahead. Information of this nature is still useful enough to some users, such as utilities, for example, that they will pay handsome sums of money for such detailed forecasts, though these are small sums of money in relation to their overall operating costs. Macauley leads us through a calculation showing how even when a common outcome (rain tomorrow) has an important effect on the farmer’s best harvesting strategy, when one takes into account the difference in values of the risk-weighted strategies, the amount a farmer is willing to pay for such a forecast, given realistic uncertainties, is quite small in comparison to the value of the crop.
So, like Baker, various authors248,249 find that information on the responsiveness of the climate system would be exceedingly valuable to us if it was available, enabling us to take cost-effective mitigation measures. However, such authors do not specify what kind of data that can be collected, or what analysis that can be performed on it that would lead to the possession of such information. The information that can actually be extracted from the data that can actually be collected, sometimes at considerable additional cost to the data collection, is typically rather less valuable than this.
246 Baker J. D.: “When the rains came”, The Washington Post, 25 January 1995. 247 D. Jin, J. Lin, Managing tsunamis through early warning systems: A multidisciplinary approach, Ocean & Coastal
Management 54 (2011) 189-199. 248 Matthias Ruth, Economic and Social Benefits of Climate Information: “Assessing the Cost of Inaction”, Procedia
Environmental Sciences 1 (2010) 387–394, World Climate Conference-3. 249 Keller, K., S.-R. Kim, J. Baehr, D. F. Bradford, and M. Oppenheimer: “What is the economic value of information about
climate thresholds?” Book chapter in: Integrated Assessment of Human Induced Climate Change, Chief Editor: Michael Schlesinger, Cambridge University Press, (2007).

Booz & Company
Date: 19th September 2011 Cost-Benefit Analysis for GMES Final Version II
Prepared for: European Commission Directorate – Enterprise and Industry
209
Supporting Nordhaus’ experience of the typically low values of information is a recent study250 of the value of the spatial information industry to the economy of Australia. Taking the spatial industry as a whole, i.e. a much broader set of data, services and applications being studied here, it finds productivity effects on industrial sectors typically of the order of 0.5%. 0.5% of the value of an entire industrial sector is a large amount of money, but it indicates that the impact of a specific source of information to a focused sector of the economy is capable of being fairly small. This study only includes in its main evaluation the most certain benefits of spatial information – productivity benefits. It also recognises the kinds of benefits to the public sector that can come from its use in environmental policies, for example, but, giving some case studies of possible calculation, considers the ranges of values it computes too broad to be sufficiently certain to add into the main calculation.
This is a typical reaction to this kind of benefit from information. Genovese et al. (2009)251 provides a recent overview of the literature on estimating the socio-economic benefits of spatial information. They find that there is essentially no literature which goes very far in putting reliable monetary estimates on the “non-tangible” values such information, i.e., precisely the environmental policy values and the like may be considered here. Most literature in exploring such non-tangible socio-economic benefits appears content merely to have catalogued the benefits, and make some consideration how they might possibly be valued, e.g., Macauley’s consideration of the socio-economic benefits of the data from of a specific satellite-mounted instrument.252 This paper has the rare but realistic feature that it considers detailed practical limitations that the data might have in satisfying the needs of potential users, who might therefore prefer some other data. Other studies tend to be more categorical in the benefits of the data, whereas Macauley’s approach suggests some kind of optimism bias adjustment might be appropriate if the data quality proves disappointing in practice. On the other hand, serendipitous benefits sometimes arise, so there is a possibility that foreseen uses of data can sometimes substantially undervalue it.
It is also possible to note a study253 of the value of the space sector in the UK. This is similar to the Australian study of the value of the spatial information economy, in that mostly what they were measuring was the economic activity itself and its productivity effects. They made no attempt to value what they called “catalytic” benefits from activities such as EO. They did, however, attempt to value benefits from R&D activities, but the methodology, taking an average benefit from R&D elsewhere in the economy, would seem to be questionable given the more speculative nature of R&D in the space sector than the generality of the economy.
In 2001, the Met Office (the UK’s meteorological agency) set out to value what information derived from satellites was worth to it as a contribution to a report on the value of civil space activity.254 It correctly identified that the satellite data was worth the improvement in weather forecasting that the satellite data facilitated, presumably net of any additional cost of processing the data. It correctly rejected the notion that this information is worth the cost saving in comparison to obtaining the data by other means (except to the extent that it had
250 ACIL Tasman, The Value of Spatial Information, The impact of modern spatial information technologies on the Australian
economy, Cooperative Research Centre for Spatial Information, March 2008. 251 Elisabetta Genovese, Gilles Cotteret, Stéphane Roche, Claude Caron and Robert Feick, Evaluating the socio-economic
impact of Geographic Information: A classification of the literature, International Journal of Spatial Data Infrastructures Research, 2009. Vol. 4, 218-238.
252 Molly Macauley, Ascribing Societal Benefit to Environmental Observations of Earth from Space The Multiangle Imaging Spectro Radiometer (MISR), Resources for the Future Discussion Paper 06-09 (2006).
253 Oxford Economics, The Case for Space: The Impact of Space Derived Services and Data, South East England Development Authority, July 2009.
254 The Met Office, Evaluation of Funding for UK Civil Space Activities, Chapter Five, The Met Office Report, UK Department of Trade and Industry, 2001.

Booz & Company
Date: 19th September 2011 Cost-Benefit Analysis for GMES Final Version II
Prepared for: European Commission Directorate – Enterprise and Industry
210
displaced some of its other data sources), since it would not have obtained this information prior to satellites. But it fell shy of converting this observation of quality improvement into sums of money. Rather it concluded that this quality of information has become “essential” to the needs of its customers, and therefore it should provide it. So they failed to provide a convincing monetary value for the data or the information it supports, rather asserting it was obvious they should do it and therefore it was worth at least what it cost to do.
Nevertheless, it is useful to consider with some more care what are the socio-economic benefits of satellite instruments. Macauley describes how the benefits of such satellite data has sometimes been somewhat serendipitous – missions are carried out for scientific objectives, and then various bodies find that certain datasets are useful for various policy purposes. Confining ones attention to relatively narrow areas, CBA has the potential to assist the selection of the most economically valuable missions from among plausible alternatives.
In the paper cited near the start of this section,255 Macauley sets out a clear methodology for how it is possible to practically value the cost-benefits of space information for a specific policy application. She makes clear that both the cost of the data collection, and the processing of that information into useful information must be included in the costs. Another cost that needs to be taken into account is the costs of the information user in implementing the policy that uses the data. When considering the contribution of the information to the value of the policy it is also necessary to consider the alternative policy, or alternative policy effectiveness, that would arise from having to use different information sources if the planned data source for this information were lost. The net benefit is both the change in implementation costs, and the change in socio-economic benefits, resulting from the change in policy.
In broad outline, this is the same methodology that was implemented by PWC, with two main improvements. First, PWC (a shortcoming PWC identified) mainly considered the costs of the satellite systems, not the further costs identified by Macauley, both the costs of transforming data into information, and also the costs of policy implementation, to the extent that these might vary according to the data sources available. Macauley also emphasises the importance of considering carefully the impact of the data, given uncertainties in the information which greatly reduce its value (the Baker vs. Nordhaus contrast). Also care needs to be taken to consider carefully what actually the impact would be of losing a data source; it would rarely be that the policy ceased to be implemented at all, rather that it would be implemented with less precision.
In implementing this methodology, it is important to be careful that one is measuring the improvement relative to what would exist without the project. The Met Office, or more accurately its contracted authors, fell into this trap in considering the value of the benefits that the Met Office supplies to the UK. It rather valued what the totality of weather information is worth to the UK. Of course many leading bodies choose to purchase Met Office information, because its quality is better than other providers are able to supply. But it is only the improvement in quality over what other providers could supply that is the benefit of the Met Office’s output, not the entirety of the value of weather information in the UK. The Met Office therefore likely overstated its value to the UK economy.
255 Macauley, Molly K.: “The value of information: Measuring the contribution of Space-derived Earth science data to
resource management”, Space Policy 22 (2006) 274–282 (op. cit.).

Booz & Company
Date: 19th September 2011 Cost-Benefit Analysis for GMES Final Version II
Prepared for: European Commission Directorate – Enterprise and Industry
211
E.2.3 Shortcomings of CBA for Environmental Project Analysis
Cost-benefit analysis (CBA) is at its foundations a decision tool. The review has mentioned above how good practice in CBA is to confine its direct to making decisions on how to ration the use of scarce resources between similar alternative uses competing for those resources. It is not a tool to determine the allocation of funding between competing policy areas, because its uncertainties become larger when used to compare less similar alternatives. Here the review will seek to understand in greater detail the applicability of CBA as a decision tool.
CBA acts as a decision tool essentially by carrying out the following steps for each scenario:
� Identifying all of the impacts of a scenario on each of the relevant affected parties;
� Valuing the size of those impacts for each of the affected parties in monetary terms at each point in future time;
� Aggregating the impacts at each point in time by adding them up; and
� Aggregating the impacts across time by discounting them.
The discounted value of each scenario can thus be compared. Costs and benefits might be evaluated separately, and there might instead be a preference to compare the cost-benefit ratio (CBR) for each option.
Social decision tools in broadest generality are the subject of “Social Choice Theory” in economics.256 The most general kind of decision tool takes as data only the preference ordering of the options for the affected parties, without any metric in relation to intensity of preference. A justification for using such bare information is that philosophically there can be no valid method of comparing one person’s intensity of preferences with another person’s intensity of preferences. With such bare information, it can be proven fairly simply that no consistent decision tool exists, a result known as Arrow’s Impossibility Theorem.257 This is a result of practical application – voting systems for elections use only preference orderings as data. There is a general awareness of situations handled badly by the voting system used in elections. Arrow showed that the search for an ideal voting system is futile, there are always situations handled badly by any voting system. But this analysis is too arid for decision over investments –proportionality in preferences is required to make decisions over quantities of money in a tangible manner. Nonetheless, it illustrates that proceeding from this bare system to one with more detail, one is bound to be making approximations which will not always be correct.
CBA would usually be seen as part of welfare economics, which studies policy to maximise social welfare. Practical progress in this area requires us to have a metric to represent the intensities of preferences of individuals, and to aggregate for society, whilst also taking account of distributional issues. The standard approach of welfare economics is to assume that each individual has a “utility” level attached to a given situation, which summarises his welfare in that situation. Choice under uncertainty is typically studied by the “expected utility model”. To make choices for society as a whole, one needs to be able to combine the welfare of individuals, and CBA does this by measuring welfare in a common currency, i.e. money. Experimental economists, an area pioneered by Nobel prize-winners Daniel Kahneman and Amos Tversky, frequently devise experiments show that the decisions that people make in practice are often inconsistent with these approximations.
256 The classic text is Sen, Amartya K., “Choice, Welfare and Measurement”, Oxford, Basil Blackwell, 1982. 257 Arrow, K.J., “A Difficulty in the Concept of Social Welfare”, Journal of Political Economy 58(4) (August, 1950), pp. 328–
346.

Booz & Company
Date: 19th September 2011 Cost-Benefit Analysis for GMES Final Version II
Prepared for: European Commission Directorate – Enterprise and Industry
212
Gowdy (2007)258 considers the results of experimental economics on how people actually make choices, and concludes that some of the ways in which real people deviate from the behaviours predicted by expected utility theory are relevant to CBA of environmental factors. Humans have aversion to losses, so that the same outcome is viewed differently whether it is arrived at via loss as opposed to gain. So stakeholders’ losses should be more highly valued than stakeholders’ gains, and social context is relevant to the valuation, i.e., the losses and gains of the poor should also be more highly valued. Appropriate discount rates can be shown to be different for different items in the balances.
Other criticisms259 of CBA on the basis of such fundamentals argue that in view of the difficulties of multidimensionality of effects, non-linearities of their compounding, the poor knowledge of environmental responses and their values, and distributional effects, that CBA lacks richness to make reliable decisions. But it is unclear that the alternatives suggested are much more successful, given that techniques such as multicriteria analysis cannot actually deliver a firm recommendation except to the extent that the operator decides how he prefers the multiple criteria. Ultimately, it is a question of presentation – an ordering of preference has to be linear.
But if the CBA approach has a poor reputation as a decision tool in areas of environmental impact, it is probably in part for a different reason, i.e. it is not actually a shortcoming of the CBA itself, but of its practitioners. In situations of weak governance, policies typically have unintended consequences which practitioners of CBA may not take into account.
E.3 LITERATURE REVIEW SUMMARIES
The following table provides a high level summary of each article, and report reviewed as part of our wider literature review on CBA. It also includes some other articles that were considered as part of our literature search but which are not referenced above.
Table E.1: Academic papers on Cost-Benefit Analysis of Environmental Protection
Paper Summary of Argument and Comments
Jeffrey J. Wilson, Van A. Lantz, David A. MacLean, A benefit–cost analysis of establishing protected natural areas in New Brunswick, Canada, Forest Policy and Economics 12 (2010) 94–103
Used a direct willingness-to-pay (WTP) (“how much extra tax…”) survey to estimate the value of the value of protected areas, excluding any direct economic benefits. Chose willingness-to-pay over willingness-to-accept (WTA) (i.e. how much to be compensated to be deprived of something) on the basis of cited papers saying that WTA gave counter-intuitive results. Does not mention the broader problems of WTP, or the good reasons why WTA should be higher.
Wegner, G., Pascual, U., Cost-benefit analysis in the context of ecosystem services for human well- being: A multidisciplinary critique. Global Environ. Change (2011), doi:10.1016/j.gloenvcha.2010.12.008
Argues that cost-benefit analysis is inappropriate for evaluating decisions in relation to projects affecting ecosystems. Main arguments are because (1) human values cannot be represented by an additive linear value such as money; among other things redistributive effects are not handled well by CBA; (2) environmental costs and benefits are particularly badly approximated by additive linear functions because of non-convexities and redistributive effects, and (3) poor understanding the value of eco-system services and the likely practical consequences of projects.
258 Gowdy, John M.: “Toward an Experimental Foundation for Benefit-Cost Analysis “, Ecological Economics 63 (2007), 649-
655. 259 Wegner, G. and Pascual, U.: “Cost-benefit analysis in the context of ecosystem services for human well- being: A
multidisciplinary critique”, Global Environ. Change (2011), doi:10.1016/j.gloenvcha.2010.12.008.

Booz & Company
Date: 19th September 2011 Cost-Benefit Analysis for GMES Final Version II
Prepared for: European Commission Directorate – Enterprise and Industry
213
Paper Summary of Argument and Comments
Although it refers to other methods of such as multi-criteria analysis, there is no clear demonstration of the superiority of these other methods.
R.K. Turner, D. Burgess, D. Hadley, E. Coombes, N. Jackson, A cost–benefit appraisal of coastal managed realignment policy, Global Environmental Change 17 (2007) 397–407
Considers the political economy of sea defences vs. managed retreat. Most of the relevant costs and benefits of the options in this area are amenable to monetary valuation, but there are uncertainties in cost and benefit sizes. Appropriate discount rates are also unclear, given evidence that discount rates for future losses should be lower than for future gains, and debates over profiling for longer term effects. The policy which has the best NPV turns out to be sensitive to these assumptions. The alternative policies also have very different redistributive effects on stakeholders. So any political decision needs greater care than just CBA, and compensation for losers should be considered.
Matthias Ruth, Economic and Social Benefits of Climate Information: Assessing the Cost of Inaction Procedia Environmental Sciences 1 (2010) 387–394, World Climate Conference-3
Observes that with potentially large social costs of climate change, improved climate information will be valuable to choosing the appropriate response. Takes the example of the impact of sea-level rise on Boston, Massachusetts. Makes no attempt to value information, or even distinguish different types of information.
Tom Kuhlman, Stijn Reinhard, Aris Gaaff, Estimating the costs and benefits of soil conservation in Europe, Land Use Policy 27 (2010) 22–32
This paper attempts to quantify in monetary terms the costs and benefits of soil conservation measures, in the general case. It is very complex as there are many dimensions of damage, many possible conservation measures, and many possible and interlinked benefits. CBA is difficult to implement for such a case.
Erica Brown Gaddis, Brian Miles, Stephanie Morse, Debby Lewis, Full-cost accounting of coastal disasters in the United States: Implications for planning and preparedness, Ecological Economics (2007) 307-318
Attempts to catalogue and monetise all of the socio-economic costs of a major coastal disaster (Hurricane Katrina). This adds to the usual estimates of damage which are usually insurance based. By appreciating the full cost of such incidents, it demonstrates the greater value of efforts to protect against them.
Atkins, J.P., et al. Management of the marine environment: Integrating ecosystem services and societal benefits with the DPSIR framework in a systems approach. Mar. Pollut. Bull. (2011), doi:10.1016/j.marpolbul.2010.12.012
Demonstrates the complexity of the relationship between marine policies and social benefits in the marine environment, given the complexity of the system. Even for a simple case study such as marine aggregates extraction, the economic and social costs and benefits are currently not well characterised, suggesting that CBA would at present be difficult to implement.
D. Jin, J. Lin, Managing tsunamis through early warning systems: A multidisciplinary approach, Ocean & Coastal Management 54 (2011) 189-199
Considers the costs of an international tsunami early warning system, and relates them to the size of possible costs of tsunami damage. Although there is a wide range of uncertainly, the system pays for itself many times over in most scenarios. This paper demonstrates many of the difficulties that CBA analysis of information/data. A tsunami warning system only provides data, and it is the systems set up to convert that data to information, and then act on that information, that make the difference, as the paper indicates. They focus on the cost of the data collection, but fail to consider the costs of those additional systems. Further, warning systems alone do little to avoid the infrastructural damage of tsunamis, but they may facilitate leaving fewer people in the danger area. The true value of tsunami warning therefore lies in lives saved and reduced rescue effort. The author’s estimates of damage avoided, based purely %ages of GDP damage avoided, are thus far too simple, as they do not separate the impact of lives saved vs. property damage. For a proper evaluation, there needs to be a more careful consideration of what costs tsunami warning systems do actually save.
Global Environmental Change 21 (2011) 13–24, Normalizing economic loss from natural disasters: A global analysis, Global Environmental Change 21 (2011) 13–24
Increased economic development implies greater economic losses when disaster strikes in a given location. Considers methods of quantifying the effect and compares it to global records of estimates of disaster damage.

Booz & Company
Date: 19th September 2011 Cost-Benefit Analysis for GMES Final Version II
Prepared for: European Commission Directorate – Enterprise and Industry
214
Paper Summary of Argument and Comments
K. G. Willis, G. D. Garrod and D. R. Harvey, 1998, A Review Of Cost-Benefit Analysis as Applied to the Evaluation of New Road Proposals in the U.K., Transport Research.-D, Vol. 3, No. 3, pp. 141-156
In the 1990s, the UK government had a standardised CBA/appraisal methodology, in which environmental effects were recorded but not valued. This paper argues that it is now possible plausibly to monetise a wide variety of important environmental effects, and include them in the explicitly valued part of the CBA. The effect on property values of private land-owners could be included and, depending upon existing usage, would proxy for some environmental effects of value to occupiers. For some environmental effects, an estimate of valuations can come from WTP surveys, and similar methods. Although there are shortcomings, the overall effect should provide a basis for improved analysis.
Mark G. Stewart, Risk-informed decision support for assessing the costs and benefits of counter-terrorism protective measures for infrastructure, International Journal of Critical Infrastructure Protection 3 (2010) 29-40.
Observes that CBA techniques routinely applied to low probability/high cost risks such as at nuclear power stations are not being applied in the case of Civil Security risks. Such risks are different from natural disaster risks, because terrorists make decisions on where to attack, so probabilities are not externally given. Risk aversion means that expected loss calculations may not apply. But it is still a useful technique to ensure that money expended on security measures is applied to locations with the highest expected benefit, i.e., using CBA to compare similar options can be applicable.
David Etkin, Risk transference and related trends: driving forces towards more mega-disasters, Environmental Hazards 1 (1999) 69}75
Argues that natural disasters in the developed world have become less frequent but more costly, because of the use of construction standards to handle the more common natural risks. Thus when disaster conditions exceed the common construction design standard, the effect can be catastrophic, because widespread failure occurs at this point. Does not offer a solution.
Ray A. Williamson, Henry R. Hertzfeld, Joseph Cordes, John M. Logsdon, The socioeconomic benefits of Earth science and applications research: reducing the risks and costs of natural disasters in the USA, Space Policy 18 (2002) 57–65
Makes some simple arguments about the value of information to mitigate the costs of severe weather. Observes that some organisations, e.g. utilities, find it worth paying substantial sums of money for detailed weather information. But does not make any serious attempt to describe how we might go about valuing the information.
Stéphane Hallegatte, Jean-Charles Hourcade, Patrice Dumas, Why economic dynamics matter in assessing climate change damages: Illustration on extreme events, Ecological Economics 62( 2007) 330-340
Shows that above a certain damage level, disasters tend to cause a larger impact on GDP. Provides a rationale for larger expenditure on mitigation for larger disasters, as their cost is disproportionately higher.
John M. Gowdy, Toward an Experimental Foundation for Benefit-Cost Analysis, Ecological Economics 63 (2007), 649-655
Experimental economics has been demonstrating as normal a range of behaviours that are hard to rationalise as income/utility maximisation. Some of these are capable of being implemented in ways that might improve cost-benefit analysis. For example, losses are valued more highly than gains, even when they are pure money and symmetric; different discount rates are used in different circumstances; valuation of losses and gains depends upon social context. Some of these insights can be used to modify standard assumptions in CBA to produce more robust results.
David Pearce and Dominic Moran, The Economic Value of Biodiversity 1994, Earthscan Publications
Monograph covering wide range of issues including general matters of CBA for environmental issues. Thus has an extensive treatment of WTP, etc. Bio-diversity typically has a global value, whereas the decisions on its preservation typically come from local funding, which will take note only of the local value, which may be much less. Thus there is a market failure whereby biodiversity tends to be inadequately protected. Regulatory failures, and lack of information on eco-system services, also result in under-provision of protection. Redistributive effects also compound problems – costs of regulation can be to poor people who don’t get compensation. Discusses the problems and biases of WTA and WTP contingent valuation methods in detail. Surveys WTP vs. WTA valuations of similar environmental

Booz & Company
Date: 19th September 2011 Cost-Benefit Analysis for GMES Final Version II
Prepared for: European Commission Directorate – Enterprise and Industry
215
Paper Summary of Argument and Comments
benefits, shows that the latter are typically in the range of 2.5 to 5 times greater. (We would comment this is only partly due to divergence between valuation of losses and gains, it is also to do with certainty – we know the value of something we take advantage of, we don’t know the value of something we can’t be sure we will even take advantage of, and which isn’t in our custom.) True market approaches tend not to be available in this area, but discusses the potential for using surrogate market approaches to valuation, such as hedonic pricing, and notes these tend to be difficult and only occasionally is suitable data available. Provides a useful catalogue of value parameters which have emerged from various studies.
Elisabetta Genovese, Gilles Cotteret, Stéphane Roche, Claude Caron and Robert Feick, Evaluating the socio-economic impact of Geographic Information: A classification of the literature, International Journal of Spatial Data Infrastructures Research, 2009. Vol. 4, 218-238.
Observes that raw data requires processing to be useful. To the extent that this processing adds value, not all of the value of data products can be ascribed to the raw data. Surveys the literature and finds that whilst there have been attempts to value the direct, tangible benefits of spatial information, there is no literature which gets very far with ascribing reliable values to the intangible benefits (environmental, regulatory, etc.) of spatial information.
Molly Macauley, Ascribing Societal Benefit to Environmental Observations of Earth from Space The Multiangle Imaging SpectroRadiometer (MISR), Resources for the Future Discussion paper 06-09 (2006)
Attempts to catalogue what societal benefits might exist from use of this instrument, which has not previously been put aboard a satellite. Although there are a number of likely uses, the novel type of data means that the practical uses it might be put to are somewhat speculative. The author also mentions some limitations that will affect any potential uses of the data, which warns as to potential optimism bias that might exist in other studies. There would be additional costs in processing the data and making it useful to customers. No attempt at quantification.
Molly K. Macauley The value of information: Measuring the contribution of Space-derived Earth science data to resource management, Space Policy 22 (2006) 274–282
The paper gives some illustrations as to how one might value weather information in certain cases. A distinction is made between the information one extracts from data, and the data itself, in that explicit costs are given for data processing, etc. (But the possibility that multiple data sources might contribute to the useful information is not considered.) Otherwise, the methodology emerging is essentially that of the PWC report, but taking into account the cost of data processing, etc., i.e., direct estimate of environmental benefit obtained from change in the quality of the information, taking account of any change in implementation costs of the agency.
Molly K. Macauley, Some Dimensions of the Value of Weather Information: General Principles and a Taxonomy of Empirical Approaches, Workshop on the Economic Impacts of Weather, April 2-4 1997, Boulder, Colorado, USA, http://sciencepolicy.colorado.edu/socasp/weather1/macauley.html
Considers generic methods of valuing weather information (revealed preference, concealed market, WTP, etc.), and gives some examples. Useful summary in this paragraph “The state-of-the-art in understanding the value of information reflects general agreement on how to model an individual's decision calculus and some useful implications about the value of information: when it is most valuable, least valuable, and its relationship to an individual's subjective priors and the individual's ability to take action in light of the information. Most estimates of the value of information suggest that it is not large as a percentage of final output (in agriculture, trucking, and other markets). This result seems inconsistent with some perspectives of the value of information, such as those offered in the context of natural disasters and loss of life. But in these cases, the ex ante and ex post values of information need to be distinguished; in some instances, people's prior beliefs about the low probability of the hazards figure prominently in reducing the perceived value of the information. Finally, consideration must be given to the costs of actions that were able to be taken, or not taken, in anticipation of and in response to the information. There is less state-of-the-art agreement about

Booz & Company
Date: 19th September 2011 Cost-Benefit Analysis for GMES Final Version II
Prepared for: European Commission Directorate – Enterprise and Industry
216
Paper Summary of Argument and Comments
how best to estimate empirically the value of information.”
Keller, K., S.-R. Kim, J. Baehr, D. F. Bradford, and M. Oppenheimer: What is the economic value of information about climate thresholds? Book chapter in: Integrated Assessment of Human Induced Climate Change, Chief Editor: Michael Schlesinger, Cambridge University Press, (2007). http://www.geosc.psu.edu/~kzk10/Keller_snowmass_pp_07.pdf
Computes the value of knowing early that there is a point at which the climate will start to change more rapidly beyond a certain threshold, and finds it is large, even if one only attaches certain probability to different scenarios. We would comment that this is not the value of data, it is, at best, the value of information extracted from many data sources by extensive processing. It is difficult to know what data would enable one to obtain this information to a reasonable level of confidence.
ACIL Tasman, The Value of Spatial Information, The impact of modern spatial information technologies on the Australian economy, Cooperative Research Centre for Spatial Information, March 2008
Assesses the impact of the spatial information industry on the Australian economy. The main evaluation is based on a computable general equilibrium to estimate the size of the impact on the main economy, in relation to the impact of the industry on the private sector. A number of case studies are used to estimate the productivity impact in various sectors –agriculture, mining, fisheries, construction, transport, etc. The report also includes case studies of the impact of the information on the public sector, but only securely measurable efficiency benefits are included in the main quantification. Other less easily measured impacts, such as social, environmental and security benefits are excluded from the main quantification, and some general indications with broad ranges are given.
Earth Science and Applications from Space: National Imperatives for the Next Decade and Beyond, Committee on Earth Science and Applications from Space: A Community Assessment and Strategy for the Future, National Research Council, USA (2007)
Recommends that expected social benefits of missions should be assessed carefully in advance, since many benefits achieved in this area have been serendipitous spin-offs. The assumption is that some forethought might have improved the applicability of the data to socio-economic benefits. Catalogue of high-level applications.
Pearce, David and Atkinson, Giles and Mourato, Susana (2006) Cost-benefit analysis and the environment: recent developments. Organisation for Economic Co-operation and Development, Paris, France. (Extensive extracts, including Executive Summary, available at Google Books.)
Monograph on CBA of environmental issues. Describes in detail the market, quasi-market, and non-market methods of measuring environmental costs and benefits, the difficulties, discounting issues, distributional issues, etc. Eco-systems often deliver services that are poorly characterised, vary non-linearly, and presents irreversible changes to decisions made. This argues for caution in decision-making.
I. Little and J. Mirrlees, Project Appraisal and Planning for Developing Countries, Heinemann Educational Books, 1974
This short monograph, colloquially known as “The OECD Manual” set the standard for CBA for many years. Its most important contribution was the idea of measuring costs and benefits at shadow prices that reflect true resource costs, i.e. correcting for taxes and other distortions, rather than market prices. This is particularly relevant for developing economies, because of the greater mismatch between prices and resource costs in those countries. But it does not cover standard parameters for socio-economic benefits, etc.
PA Consulting Group, Met Office: The Public Weather Service’s contribution to the UK economy, Public Weather Service Customer Group, May 2007
The value of the Met Office’s output was divided into three main sections. First, a willingness to pay survey for weather forecasts by the national population. It was claimed that this was a conservative estimate, because it was low in comparison to similar survey values in other countries. Second, government agencies were asked to assess efficiency and property savings. Third, government agencies were asked to assess lives saved from weather warnings. An example is warnings to construction sites to avoid high working in high winds. The fallacy of this methodology is to assume that the Met Office is that it implicitly assumes that the only source of weather data and weather

Booz & Company
Date: 19th September 2011 Cost-Benefit Analysis for GMES Final Version II
Prepared for: European Commission Directorate – Enterprise and Industry
217
Paper Summary of Argument and Comments
information, and therefore that the Met Office is responsible for the entire value added of weather information. Customers might have chosen the Met Office as its weather information provider (the BBC for example, has considered other suppliers). The reality is that without the Met Office there would still be weather data available, and there are other suppliers of weather information derived from various sources of data. No doubt such information is of lesser quality, given the widespread decision of important customers to use Met Office information. But the presence of alternative information indicates that Met Office is not the originator of the entire value added of all weather data and information, on the improvement on what might otherwise be obtained. Clearly the public benefit of Met Office information is at least the premium it can earn over what other weather information providers would charge. But not as much as all of the benefits customer attribute to weather information in general. The WTP survey suffers the same problem. Although it asked people to value Met Office information, other questions in the survey indicate that they were valuing weather information in total, not the added value of Met Office, a question which would in any case be beyond typical members of the general public to answer. We are unconvinced that the low value for the UK in the WTP survey in comparison to other countries is sufficient to demonstrate its conservatism. The UK has an unusually moderate climate and weather information would be expected to be less valuable than many other places. In summary, far from being conservative, this work has likely overvalued the public benefits of the Met Office.
Oxford Economics, The Case for Space: The Impact of Space Derived Services and Data, South East England Development Authority, July 2009
A report on the contribution to the economy of the space sector. Most of this the value of the space-related economy itself, which is mostly telecommunications and broadcasting. Also considered the “catalytic” benefits. One area was R&D. They measured the R&D component of the space industry, and then proposed it had the same benefit as R&D in general, as recorded in generic studies of the benefit of R&D. But these seems to be a questionable methodology as much of the R&D in the space sector is not as close-to-market as R&D in general in the economy. They also considered areas such as EO, but only made qualitative benefits.
The Met Office, Evaluation of Funding for UK Civil Space Activities, Chapter Five, The Met Office Report, UK Department of Trade and Industry, 2001
The Met Office identifies the improvement in weather forecasting that satellite data provides, and recognises that access to this data improves the quality of its output which is important to customers. It correctly rejects the notion that this information is worth the cost saving in comparison to obtaining the data by other means (except to the extent that it has displaced some of its other data sources), since it would not have obtained this information prior to satellites. But it falls shy of converting this observation of quality improvement into sums of money. Rather it concludes that this quality of information has become “essential” to its customers, and therefore it should provide it. Satellites are generally international, thus by participating in a joint program the Met Office clearly obtains access to the output at much smaller cost than going it alone. But there is now the likelihood it could obtain much of this information by withdrawing and free-riding, although the long term costs of such behaviour would be hard to assess. In summary, this report fails to provide a convincing value for the data or the information it supports.
Andrew Dlugolecki, A Changing Climate for Insurance, Association of British Insurers, 2004
UK weather-related insurance claims were in 1998-2003 were double that of the previous 5 year period. The author asserts that weather-related risk is increasing at about 2-4% per year. Other contributions to value of claims come from the increasing scope of coverage, increasing economic value of

Booz & Company
Date: 19th September 2011 Cost-Benefit Analysis for GMES Final Version II
Prepared for: European Commission Directorate – Enterprise and Industry
218
Paper Summary of Argument and Comments
assets protected, and inflation. Clearly the insurance industry would find a clear prediction of future climate trends valuable in setting premiums. But it is unclear what data would support this and how much it would be worth paying for it.
Source: Booz and Company Analysis.

Booz & Company
Date: 19th September 2011 Cost-Benefit Analysis for GMES Final Version II
Prepared for: European Commission Directorate – Enterprise and Industry
219
Appendix F Economic, Social and Environmental Benef its
F.1 INTRODUCTION
Task 1 in the Terms of Reference requires the identification of economic, social and environmental impacts of GMES. In completing this task, the study has given consideration to the framework of benefits outlined in the EC Impact Assessment Guidelines, which poses a series of questions for each impact area.260 Based on the analysis of previous studies and wider desk-based research, each of the potential economic social and environmental impacts of GMES have been identified.
F.2 FINDINGS
These findings are listed in the tables provided below. This approach does not classify the impacts according to GMES services or policy sectors.
260 SEC(2009) 92: “Impact Assessment Guidelines”, January 2009.

Booz & Company
Date: 19th September 2011 Cost-Benefit Analysis for GMES Final Version II
Prepared for: European Commission Directorate – Enterprise and Industry
220
Table F.1: Qualitative assessment of the economic impacts of GMES
Impact Key Questions GMES Impact: Qualitative Assessment
Functioning of the internal market and competition
� What impact (positive or negative) does the option have on the free movement of goods, services, capital and workers?
� Will it lead to a reduction in consumer choice, higher prices due to less competition, the creation of barriers for new suppliers and service providers, the facilitation of anti-competitive behaviour or emergence of monopolies, market segmentation, etc.?
� No impact on the free movement of goods, services, capital and workers. � No reduction in consumer choice due to internal market and competition issues. Depending on how
the downstream market develops, the public provision of EO data may help to increase consumer choice in a new market.
� A policy for the provision free and open access to GMES products and data could support a reduction in barriers to entry for downstream service provision.
� There may be a residual impact on Contributing Missions by the public provision of Sentinels that may reduce competition in the collection of EO data.
� Market competition issues associated with development of specialist, high technology firms under the GMES programme could be manageable through general competition policy and targeted use of EU financial support to SMEs (e.g. through support under future FPs, etc.)
� Funding to the space sector supplied on a competitively tendered basis will ensure competition in the sector is maintained and enhanced.
Competitiveness, trade and investment flows
� What impact does the option have on the global competitive position of EU firms? Does it impact on productivity?
� What impact does the option have on trade barriers?
� Does it provoke cross-border investment flows (including relocation of economic activity)?
� GMES could enhance the global competitive position of EU firms in the EO and space sectors � GMES also has the potential to enhance the competitiveness of EU firms in other sectors of the
economy, which could utilise EO data � Operational cost savings related to data gathering and analysis, which can enhance benefits in a
number of sectors that require GMES data (e.g. agriculture, maritime, meteorology, insurance, property development, construction, etc.)
� Reduced risks and damage costs associated with natural hazards and disasters (floods, fires, subsidence, landslides, seismic activity), which affect the whole economy
� Operational costs savings linked to availability of enhanced shipping routes to benefit EU shipping companies (insofar as benefits flow to EU shipping firms over global firms)
� Infrastructure for GMES from the EU space industry could represent considerable public sector investment in a strategic industry. An EU commitment to this sector, and on this scale, may enable future growth of this sector through providing a reliable revenue stream that companies in this sector can use as a base on which to develop other areas of business, including sale of technology, expertise and equipment outside the EU.
� Minor impact on trade barriers through the provision of independent, and more widely available, information on a wide range of factors, the most useful of which is likely to be information re land

Booz & Company
Date: 19th September 2011 Cost-Benefit Analysis for GMES Final Version II
Prepared for: European Commission Directorate – Enterprise and Industry
221
Impact Key Questions GMES Impact: Qualitative Assessment
use. This may have greater benefits when used outside the EU – where independent gathering of information can be difficult (e.g. Investment Energy company seeking information before deciding to invest / buy land in a developing country).
� Construction of Sentinels and investment to ensure that services become fully operational may encourage cross-border investment.
Operating costs and conduct of business/Small and Medium Enterprises
� Will it impose additional adjustment, compliance or transaction costs on businesses?
� How does the option affect the cost or availability of essential inputs (raw materials, machinery, labour, energy, etc.)?
� Does it affect access to finance? � Does it impact on the investment cycle? � Will it entail the withdrawal of certain products
from the market? Is the marketing of products limited or prohibited?
� Will it entail stricter regulation of the conduct of a particular business?
� Will it lead to new or the closing down of businesses?
� Are some products or businesses treated differently from others in a comparable situation?
� There could be additional adjustment, compliance and transaction costs on business associated with the adoption of new services and products. However, if data is freely provided, it is expected that operating costs will be reduced, and that businesses purchasing downstream services will realise more benefits from the services than any costs that may arise.
� New SMEs may emerge to develop a downstream services market utilising free EO data from GMES.
� The companies that could contribute to design / construction / launch of the five Sentinels (plus their future generations) could increase demand for essential inputs in the space sector and may encourage new businesses to emerge in that sector
� The presence of the publicly funded Sentinels, if data access is free and open, could mean that the Sentinels are treated differently from commercially provided EO satellites which must charge for data.
Administrative burdens on businesses
� Does it affect the nature of information obligations placed on businesses (for example, the type of data required, reporting frequency, the complexity of submission process)?
� What is the impact of these burdens on SMEs in particular?
� No impact expected on administrative burdens on businesses in terms of information obligations.
Public authorities � Does the option have budgetary consequences for public authorities at different levels of government (national, regional, local), both immediately and in the long run?
� Does it bring additional governmental
� Significant benefits are expected for public authorities at international, national, regional, local levels of government, with benefits flowing across the EU Member States in particular, along with international organisations.
� Public agencies have been identified as the main group of end users that will be supported by GMES in the provision of free data and products. These could be used in support of existing
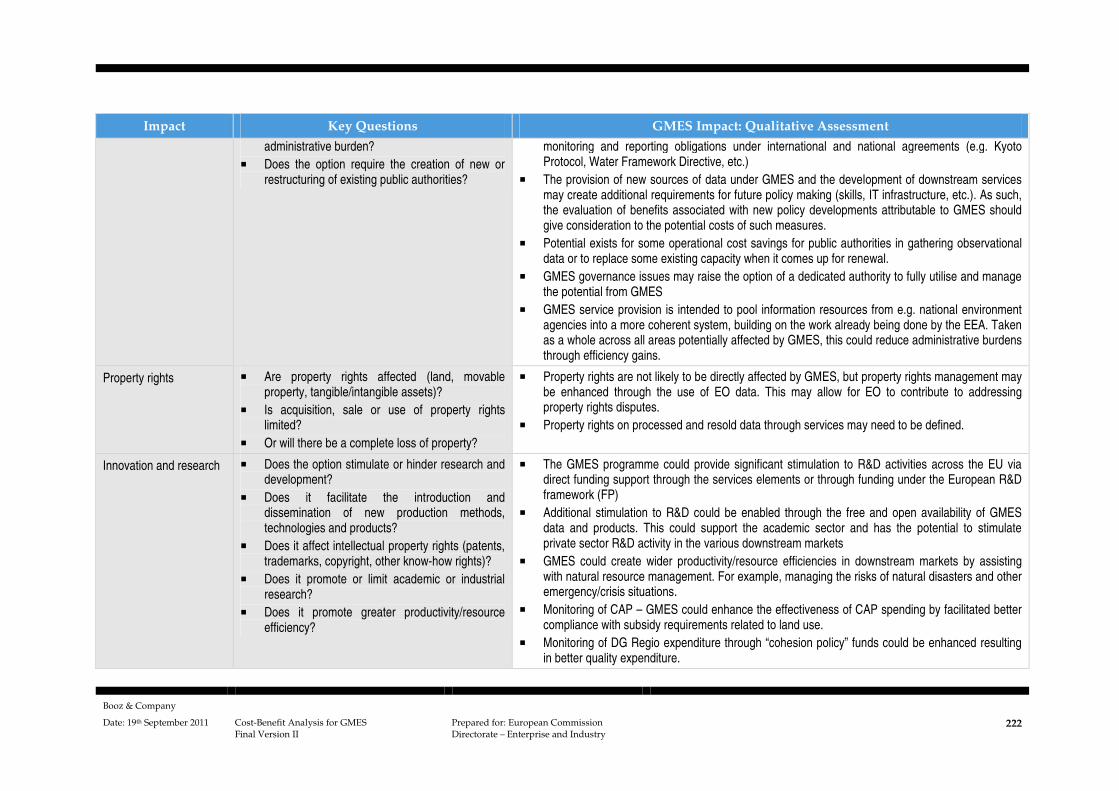
Booz & Company
Date: 19th September 2011 Cost-Benefit Analysis for GMES Final Version II
Prepared for: European Commission Directorate – Enterprise and Industry
222
Impact Key Questions GMES Impact: Qualitative Assessment
administrative burden? � Does the option require the creation of new or
restructuring of existing public authorities?
monitoring and reporting obligations under international and national agreements (e.g. Kyoto Protocol, Water Framework Directive, etc.)
� The provision of new sources of data under GMES and the development of downstream services may create additional requirements for future policy making (skills, IT infrastructure, etc.). As such, the evaluation of benefits associated with new policy developments attributable to GMES should give consideration to the potential costs of such measures.
� Potential exists for some operational cost savings for public authorities in gathering observational data or to replace some existing capacity when it comes up for renewal.
� GMES governance issues may raise the option of a dedicated authority to fully utilise and manage the potential from GMES
� GMES service provision is intended to pool information resources from e.g. national environment agencies into a more coherent system, building on the work already being done by the EEA. Taken as a whole across all areas potentially affected by GMES, this could reduce administrative burdens through efficiency gains.
Property rights � Are property rights affected (land, movable property, tangible/intangible assets)?
� Is acquisition, sale or use of property rights limited?
� Or will there be a complete loss of property?
� Property rights are not likely to be directly affected by GMES, but property rights management may be enhanced through the use of EO data. This may allow for EO to contribute to addressing property rights disputes.
� Property rights on processed and resold data through services may need to be defined.
Innovation and research � Does the option stimulate or hinder research and development?
� Does it facilitate the introduction and dissemination of new production methods, technologies and products?
� Does it affect intellectual property rights (patents, trademarks, copyright, other know-how rights)?
� Does it promote or limit academic or industrial research?
� Does it promote greater productivity/resource efficiency?
� The GMES programme could provide significant stimulation to R&D activities across the EU via direct funding support through the services elements or through funding under the European R&D framework (FP)
� Additional stimulation to R&D could be enabled through the free and open availability of GMES data and products. This could support the academic sector and has the potential to stimulate private sector R&D activity in the various downstream markets
� GMES could create wider productivity/resource efficiencies in downstream markets by assisting with natural resource management. For example, managing the risks of natural disasters and other emergency/crisis situations.
� Monitoring of CAP – GMES could enhance the effectiveness of CAP spending by facilitated better compliance with subsidy requirements related to land use.
� Monitoring of DG Regio expenditure through “cohesion policy” funds could be enhanced resulting in better quality expenditure.

Booz & Company
Date: 19th September 2011 Cost-Benefit Analysis for GMES Final Version II
Prepared for: European Commission Directorate – Enterprise and Industry
223
Impact Key Questions GMES Impact: Qualitative Assessment
Consumers and households
� Does the option affect the prices consumers pay? � Does it impact on consumers’ ability to benefit
from the internal market? � Does it have an impact on the quality and
availability of the goods/services they buy, on consumer choice and confidence? (cf. in particular non-existing and incomplete markets – see Annex 8)
� Does it affect consumer information and protection?
� Does it have significant consequences for the financial situation of individuals / households, both immediately and in the long run?
� Does it affect the economic protection of the family and of children?
� No expected impact on prices. � No expected impact on quality of goods and services. � GMES could lead to an enhancement of consumer information � GMES has no direct impact on the financial situation of individuals and households, nor does it
affect the economic protection of the family and of children � It is thought that the downstream sector may have significant potential for future growth – and thus
could impact indirectly on the quality and availability of EO goods / services.
Specific regions or sectors
� Does the option have significant effects on certain sectors?
� Will it have a specific impact on certain regions, for instance in terms of jobs created or lost?
� Is there a single Member State, region or sector which is disproportionately affected (so-called ‘outlier’ impact)?
� The key sector that will benefit from investment in GMES is the EU space sector. This industry is primarily based in France, Germany, UK, and Italy. GMES investment is likely to have an impact re job creation in these areas.
� GMES could benefit sectors that are more reliant on geo-spatial information in support of resource management and planning. For example, this includes:
- Agriculture
- Maritime (ports and shipping)
- Fishing and aquaculture
- Coastal tourism operators
- Utilities (e.g. (e.g. GMES could assist in the development of power generation from renewable sources such as solar and windpower)
- Land use planners, property developers, construction companies
- Humanitarian aid organisations � GMES service elements have a different geo-spatial focus and this can vary further with particular
products within each service element. For example: Marine and coastal services could benefit Member States with lengthy coastlines;

Booz & Company
Date: 19th September 2011 Cost-Benefit Analysis for GMES Final Version II
Prepared for: European Commission Directorate – Enterprise and Industry
224
Impact Key Questions GMES Impact: Qualitative Assessment
Fire risk management is expected to benefit areas of Southern Europe more than others; Flood risk management could benefit areas across the EU; Humanitarian aid support could benefit developing countries that are the primary recipients of EU
aid.
Third countries and international relations
� How does the option affect trade or investment flows between the EU and third countries? How does it affect EU trade policy and its international obligations, including in the WTO?
� Does the option affect specific groups (foreign and domestic businesses and consumers) and if so in what way?
� Does the option concern an area in which international standards, common regulatory approaches or international regulatory dialogues exist?
� Does it affect EU foreign policy and EU/EC development policy?
� What are the impacts on third countries with which the EU has preferential trade arrangements?
� Does it affect developing countries at different stages of development (least developed and other low-income and middle income countries) in a different manner?
� Does the option impose adjustment costs on developing countries?
� Does the option affect goods or services that are produced or consumed by developing countries?
� GMES could play a major role in areas in which international standards, common regulatory approaches and/or international regulatory dialogues exist:
- For external issues, the prime example is in relation to supporting international negotiations on climate change, where GMES could ensure that the EU is able to take a leading role and use an independent source of information.
- On internal EU issues, GMES supports a range of international standards and reporting obligations. For example, water quality, soil and air quality monitoring
� GMES has a significant relationship with EU foreign policy and EU/EC development policy by supporting key environmental and developmental policy initiatives. It also may also contribute to the External Action Service (e.g. monitoring of treaties, CFSP/ESDP, etc.)
� GMES has the potential to benefit foreign and domestic businesses and consumers in a number of ways. For example:
- The provision of support to humanitarian aid support during natural disasters and conflicts has the potential to create significant benefits for global populations. This could be in the form of reduced operational costs for aid agencies, reduced property damage and improvements in mortality and morbidity rates that result from these crises. Better crisis management could also lead to reductions in the periods of recovery following these events, which can lead to greater economic prosperity and create opportunities for all businesses and consumers of affected countries
- There is potential for services to be developed that could allow for better resource management in those countries by ensuring targeted interventions (fewer missed events and false alarms), improved agricultural performance, etc. By implication, this has the potential to better ensure the production and availability, and hence consumption, of goods and services in developing countries
� No direct impact on trade and investment flows between the EU and third countries.
Macroeconomic environment
� Does it have overall consequences of the option for economic growth and employment?
� How does the option contribute to improving the conditions for investment and the proper
� GMES could provide considerable support to growth and employment in the value adding EO sector.
� GMES investment would benefit the EU space sector, and may create employment for skilled

Booz & Company
Date: 19th September 2011 Cost-Benefit Analysis for GMES Final Version II
Prepared for: European Commission Directorate – Enterprise and Industry
225
Impact Key Questions GMES Impact: Qualitative Assessment
functioning of markets? � Does the option have direct impacts on macro-
economic stabilisation?
labour in this sector. � EU commitment to the EU space sector may improve overall conditions for investment in this
market. � Overall, across the EU economy, GMES is expected to have a negligible impact on economic
growth or employment. � There will be no long term impacts on the functioning of markets or overall conditions for
investment or macro-economic stabilisation, assuming GMES public sector investment is done in the context of sustainable fiscal policies.

Booz & Company
Date: 19th September 2011 Cost-Benefit Analysis for GMES Final Version II
Prepared for: European Commission Directorate – Enterprise and Industry
226
Table F.1: Qualitative assessment of the social impacts of GMES
Impact Key Questions GMES Impact: Qualitative Assessment
Employment and labour markets
� Does the option facilitate new job creation? � Does it lead directly or indirectly to a loss of jobs? � Does it have specific negative consequences for
particular professions, groups of workers, or self-employed persons?
� Does it affect particular age groups? � Does it affect the demand for labour? � Does it have an impact on the functioning of the
labour market? � Does it have an impact on the reconciliation between
private, family and professional life?
� GMES could facilitate new jobs based on the usage of EO data and the development of downstream services.
� GMES investment could provide stimulus to the EU space sector, and is thus likely to facilitate skilled job creation in this sector.
� No expected negative consequences for any professions or age groups. � No expected impact on the overall functioning of the labour market.
Standards and rights related to job quality
� Does the option impact on job quality? � Does the option affect the access of workers or job-
seekers to vocational or continuous training? � Will it affect workers' health, safety and dignity? � Does the option directly or indirectly affect workers'
existing rights and obligations, in particular as regards information and consultation within their undertaking and protection against dismissal?
� Does it affect the protection of young people at work? � Does it directly or indirectly affect employers' existing
rights and obligations? � Does it bring about minimum employment standards
across the EU? � Does the option facilitate or restrict restructuring,
adaptation to change and the use of technological innovations in the workplace?
� The types of employment generated by GMES services are likely to be skilled, high technology jobs. � No expected impact on access of workers to vocational or continuous training, workers’ health, safety
and dignity, workers’ existing rights and obligations or protections for young people. � No effect on employers’ existing rights and obligations or minimum employment standards across the
EU. � GMES services may facilitate adaptation to change and the use of technological innovations in
workplaces reliant on EO data.
Social inclusion and protection of
� Does the option affect access to the labour market or transitions into/out of the labour market?
� No expected effect on labour market access, equality, access to services and goods or placement services.

Booz & Company
Date: 19th September 2011 Cost-Benefit Analysis for GMES Final Version II
Prepared for: European Commission Directorate – Enterprise and Industry
227
Impact Key Questions GMES Impact: Qualitative Assessment
particular groups � Does it lead directly or indirectly to greater equality or inequality?
� Does it affect equal access to services and goods? � Does it affect access to placement services or to
services of general economic interest? � Does the option make the public better informed
about a particular issue? � Does the option affect specific groups of individuals
(for example the most vulnerable or the most at risk of poverty, children, women, elderly, the disabled, unemployed or ethnic, linguistic and religious minorities, asylum seekers), firms or other organisations (for example churches) or localities more than others?
� Does the option significantly affect third country nationals?
� Development of GMES services may help make the public better informed about environmental and resource management issues relating to land and marine use, and the atmosphere.
� Greater volumes of information made available through GMES may increase public understanding of Climate Change.
� No expected impact on any specific groups of individuals or localities. � No specific impact on third country nationals, except for the potential for humanitarian aid to be better
targeted in response to emergencies.
Gender equality, equality treatment and opportunities, non -discrimination
� Does the option affect the principle of non-discrimination, equal treatment and equal opportunities for all?
� Does the option have a different impact on women and men?
� Does the option promote equality between women and men?
� Does the option entail any different treatment of groups or individuals directly on grounds of sex, racial or ethnic origin, religion or belief, disability, age, and sexual orientation? Or could it lead to indirect discrimination?
� No expected impact on the principle of non-discrimination, equal treatment and equal opportunities. � No expected differential impact on women and men or on equality between women and men. � No expected differential treatment of groups or individuals on any grounds.
Individuals, private and family life, personal data
� Does the option impose additional administrative requirements on individuals or increase administrative complexity?
� Does the option affect the privacy, of individuals (including their home and communications)?
� No expected additional administrative requirements on individuals. � Low risk of impact on privacy of individual if VHR EO data is used to collect information about private
property use that is not concurrent with its primary goal. � No expected effect on the right to liberty of individuals, right to move freely within the EU, family life, the
rights of the child.

Booz & Company
Date: 19th September 2011 Cost-Benefit Analysis for GMES Final Version II
Prepared for: European Commission Directorate – Enterprise and Industry
228
Impact Key Questions GMES Impact: Qualitative Assessment
� Does it affect the right to liberty of individuals? � Does it affect their right to move freely within the EU? � Does it affect family life or the legal, economic or
social protection of the family? � Does it affect the rights of the child? � Does the option involve the processing of personal
data or the concerned individual’s right of access to personal data ?
� No expected impact on the processing or access to personal data about individuals.
Governance, participation, good administration, access to justice, media and ethics
� Does the option affect the involvement of stakeholders in issues of governance as provided for in the Treaty and the new governance approach?
� Are all actors and stakeholders treated on an equal footing, with due respect for their diversity? Does the option impact on cultural and linguistic diversity?
� Does it affect the autonomy of the social partners in the areas for which they are competent? Does it, for example, affect the right of collective bargaining at any level or the right to take collective action?
� Does the implementation of the proposed measures affect public institutions and administrations, for example in regard to their responsibilities?
� Will the option affect the individual’s rights and relations with the public administration?
� Does it affect the individual’s access to justice? � Does it foresee the right to an effective remedy before
a tribunal? � Does the option make the public better informed
about a particular issue? Does it affect the public’s access to information?
� Does the option affect political parties or civic organisations?
� Does the option affect the media, media pluralism and freedom of expression?
� More information made available through GMES, assuming free and open data access, could improve public involvement in governance issues.
� No expected impact on autonomy of social partners. � Public institutions may be expected to fund and finance services and infrastructure to support ongoing
development of GMES services. � No expected impact on individual rights and relations with public administration or justice. � No expected need for remedy before a tribunal, except for usual application of law through the court
system. � Political parties and civil organisations will have access to information provided. � Media will have access to information provided. � GMES raises no known ethical issues. � Development of GMES services may help make the public better informed about environmental and
resource management issues relating to land and marine use, and the atmosphere. � Greater volumes of information made available through GMES may increase public understanding of
Climate Change.

Booz & Company
Date: 19th September 2011 Cost-Benefit Analysis for GMES Final Version II
Prepared for: European Commission Directorate – Enterprise and Industry
229
Impact Key Questions GMES Impact: Qualitative Assessment
� Does the option raise (bio) ethical issues (cloning, use of human body or its parts for financial gain, genetic research/testing, use of genetic information)?
Public health and safety
� Does the option affect the health and safety of individuals/populations, including life expectancy, mortality and morbidity, through impacts on the socio-economic environment (working environment, income, education, occupation, nutrition)?
� Does the option increase or decrease the likelihood of health risks due to substances harmful to the natural environment?
� Does it affect health due to changes in the amount of noise, air, water or soil quality?
� Will it affect health due to changes energy use and/or waste disposal?
� Does the option affect lifestyle-related determinants of health such as diet, physical activity or use of tobacco, alcohol, or drugs?
� Are there specific effects on particular risk groups (determined by age, gender, disability, social group, mobility, region, etc.)?
� GMES may facilitate better response to emergency situations. � GMES may provide greater information about water quality for bathing in coastal and lake area
reducing risk of disease. � GMES providing a better understanding of Climate Change may have a wide range of indirect impacts
on the health and safety of individuals and populations by encouraging voluntary action to reduce carbon footprints.
� GMES may impact health by identifying changes in air, water or soil quality that may facilitate interventions to improve conditions.
� GMES may facilitate early warning of major smog events encouraging protective measures to reduce exposure to pollution for those vulnerable to such events.
� GMES may have impact on health due to changes in energy use and waste disposal due to identification of loss of heat due to poor insulation, and identification of waste disposal sites that could be hazardous to health.
� GMES is not expected to impact on lifestyle-related determinants of health. � GMES is not expected to have any specific effect on particular risk groups, although GMES may
promote action to address local air quality to affect those with respiratory conditions in urban areas, and benefit locations in developing countries subject to humanitarian assistance.
Crime, Terrorism and Security
� Does the option have an effect on security, crime or terrorism?
� Does the option affect the criminal’s chances of detection or his/her potential gain from the crime?
� Is the option likely to increase the number of criminal acts?
� Does it affect law enforcement capacity? � Will it have an impact on security interests? � Will it have an impact on the right to liberty and
security, right to fair trial and the right of defence? � Does it affect the rights of victims of crime and
� GMES may have a positive effect on security by facilitating monitoring of sensitive locations (e.g. mass migration, smuggling), through the GMES services for security applications (e.g. G-MOSAIC project).
� GMES is expected to improve efficacy of law enforcement related to crimes affecting use of resources or pollution.
� GMES is not expected to impact on right to liberty and security, right to fair trial and right of defence. � GMES is not expected to impact on rights of victims of crime and witnesses.

Booz & Company
Date: 19th September 2011 Cost-Benefit Analysis for GMES Final Version II
Prepared for: European Commission Directorate – Enterprise and Industry
230
Impact Key Questions GMES Impact: Qualitative Assessment
witnesses?
Access to and effects on social protection, health and educational systems
� Does the option have an impact on services in terms of quality/access for all?
� Does it have an effect on the education and mobility of workers (health, education, etc.)?
� Does the option affect the access of individuals to public/private education or vocational and continuing training?
� Does it affect the cross-border provision of services, referrals across borders and co-operation in border regions?
� Does the option affect the financing / organisation / access to social, health and care services?
� Does it affect universities and academic freedom / self-governance?
� No expected significant impact on social protection, health and education systems. � Cross border exchange of data through GMES could contribute to education in environmental and
resource management fields. � GMES could benefit universities, and the wider research community, through the provision of improved
information on the environment and security issues, while at the same time not impacting on academic freedoms.
Culture � Does the proposal have an impact on the preservation of cultural heritage?
� Does the proposal have an impact on cultural diversity?
� Does the proposal have an impact on citizens' participation in cultural manifestations, or their access to cultural resources?
� No expected impact on cultural heritage, diversity or participation in cultural manifestations.
Social impacts in third countries
� Does the option have a social impact on third countries that would be relevant for overarching EU policies, such as development policy?
� Does it affect international obligations and commitments of the EU arising from e.g. the ACP-EC Partnership Agreement or the Millennium Development Goals?
� Does it increase poverty in developing countries or have an impact on income of the poorest populations?
� GMES may have a significant social impact by facilitating more effective humanitarian responses to areas of conflict or crisis. This is achieved by better targeting of resources to areas in most need and the better targeting of projects aimed at sustainable production of food, (e.g. management of desertification, biodiversity and erosion).
� GMES in Africa project has been set up with the specific objective of making EO information available to African governments. This information may provide significant benefits in terms of improved governance, especially in areas where existing governance structures are weak and reliable monitoring of e.g. land use is often not available.

Booz & Company
Date: 19th September 2011 Cost-Benefit Analysis for GMES Final Version II
Prepared for: European Commission Directorate – Enterprise and Industry
231
Table F.3: Qualitative assessment of the environmental impacts of GMES
Impact Key Questions GMES Impact: Qualitative Assessment
The climate � Does the option affect the emission of greenhouse gases (e.g. carbon dioxide, methane etc.) into the atmosphere?
� Does the option affect the emission of ozone-depleting substances (CFCs, HCFCs)?
� Does the option affect our ability to adapt to climate change?
� One of the key impacts of the GMES Atmosphere programme could be to improve the ability to monitor the emission of greenhouse gases in the atmosphere, along with the impact of ozone-depleting substances.
� Substantial improvements could be expected in our ability to adapt to climate change through the use of more accurate data made available through GMES. This impact cuts across the core thematic areas of land, marine and atmosphere.
� GMES could also provide greater access to information in our response to natural disasters, such as floods and forest fires, the frequency of which are expected to increase as a result of climate change.
Transport and the use of energy
� Will the option increase/decrease energy and fuel needs/consumption?
� Does the option affect the energy intensity of the economy?
� Does the option affect the fuel mix (between coal, gas, nuclear, renewables etc.) used in energy production?
� Will it increase or decrease the demand for transport (passenger or freight), or influence its modal split?
� Does it increase or decrease vehicle emissions?
� GMES could improve the availability and access to sea ice information in the Arctic region, including the Arctic Ocean and the Baltic Sea. In particular, safe passage through the Arctic Ocean in the summer months could shorten the shipping line between Europe and China – by some 6000 km - leading to substantial savings in time, fuel and CO2 emissions.
� GMES will have no direct impact on the fuel mix used in energy production � GMES will have no direct impact on demand for transport or its modal split � GMES will have no anticipated effect on the level of vehicle emissions, although it may facilitate more
efficient ship routing through the Arctic, which may reduce fuel consumption and resultant emissions.
Air quality � Does the option have an effect on emissions of acidifying, eutrophying, photochemical or harmful air pollutants that might affect human health, damage crops or buildings or lead to deterioration in the environment (soil or rivers etc.)?
� GMES could facilitate early warning of major smog events that could encourage local interventions to reduce the emission of harmful air pollutants.
� GMES Atmosphere and Land policy areas could increase our ability to monitor harmful emissions by affected location, as well as to support efforts to mitigate the extent of any damage.
Biodiversity, flora, fauna and landscapes
� Does the option reduce the number of species/varieties/races in any area (i.e. reduce biological diversity) or increase the range of species (e.g. by promoting conservation)?
� Does it affect protected or endangered species or their habitats or ecologically sensitive areas?
� One objective of the GMES programme is to monitor levels of biodiversity across the globe. Better access to relevant information through the GMES programme could enhance our ability to pursue effective conservation policies at local, European, and global levels.
� GMES seeks to monitor habitats of endangered species and ecologically sensitive areas, with the expectation being that this could improve our ability to manage these areas more effectively
� No direct impact on the division of the landscape

Booz & Company
Date: 19th September 2011 Cost-Benefit Analysis for GMES Final Version II
Prepared for: European Commission Directorate – Enterprise and Industry
232
Impact Key Questions GMES Impact: Qualitative Assessment
� Does it split the landscape into smaller areas or in other ways affect migration routes, ecological corridors or buffer zones?
� Does the option affect the scenic value of protected landscape?
� No impact on the scenic value of protected landscape
Water quality and resources
� Does the option decrease or increase the quality or quantity of freshwater and groundwater?
� Does it raise or lower the quality of waters in coastal and marine areas (e.g. through discharges of sewage, nutrients, oil, heavy metals, and other pollutants)?
� Does it affect drinking water resources?
� No direct impact on the quality or quantity of freshwater and groundwater. � GMES Land Service may monitor rivers and lakes both in Europe and globally, but cannot provide
information on water quality. � No direct impact on the quality of waters in coastal and marine areas. � GMES may provide information to Emergency Management teams responding to disasters such as the
leak of oil, heavy metals or other pollutants.
Soil quality or resources
� Does the option affect the acidification, contamination or salinity of soil, and soil erosion rates?
� Does it lead to loss of available soil (e.g. through building or construction works) or increase the amount of usable soil (e.g. through land decontamination)?
� While it has no direct impact on the availability of soil, GMES may provide more accurate observation of desertification both in Southern Europe, and on a global scale.
� GMES Land Service may provide improved information regarding land use in Europe (e.g. through Urban Atlas project).
Land use � Does the option have the effect of bringing new areas of land (‘greenfields’) into use for the first time?
� Does it affect land designated as sensitive for ecological reasons? Does it lead to a change in land use (for example, the divide between rural and urban, or change in type of agriculture)?
� GMES Land Service may improve our ability to monitor land use in Europe. � The spatial planning service area could also help local, national and regional authorities to improve use
of land in their areas (e.g. Urban Atlas service). � GMES could produce significant improvements in the monitoring of ecologically sensitive areas both in
Europe and in other parts of the world. For example, the Forest Monitoring service area under GMES Land Service is able to monitor the extent of illegal logging of rainforest areas in South America, Africa and Asia.
Renewable or non-renewable resources
� Does the option affect the use of renewable resources (fish etc.) and lead to their use being faster than they can regenerate?
� Does it reduce or increase use of non-renewable resources (groundwater, minerals etc.)?
� GMES Marine contains a specific benefit area dedicated to Marine Resources, the focus of which is to ensure greater efficiency regarding monitoring of fish stocks and fisheries control. This could improve our ability to tackle areas where rates of use exceed possible regeneration, and enhance efforts to ensure that resources such as these are approached in a sustainable fashion.
� As with renewable resources, GMES could support the more efficient use of non-renewable resources through access to more reliable information.
� In terms of groundwater, analysis of river-catchment areas across Continental Europe could help to ensure that these resources are used effectively.
� More accurate information available through GMES could enable minerals to be extracted in an

Booz & Company
Date: 19th September 2011 Cost-Benefit Analysis for GMES Final Version II
Prepared for: European Commission Directorate – Enterprise and Industry
233
Impact Key Questions GMES Impact: Qualitative Assessment
efficient way, while also helping to minimise any damage to the environment.
The environmental consequences of firms and consumers
� Does the option lead to more sustainable production and consumption?
� Does the option change the relative prices of environmental friendly and unfriendly products?
� Does the option promote or restrict environmentally un/friendly goods and services through changes in the rules on capital investments, loans, insurance services etc.?
� Will it lead to businesses becoming more or less polluting through changes in the way in which they operate?
� More sustainable use of natural resources may be facilitated by EO information regarding land, fisheries and forests.
� No changes in the prices of products are expected, but GMES may have an incremental effect on supply of some resources if it identifies ways to improve productivity in natural resources sectors.
� No promotion or restrictions of products are expected. � Greater information about land, marine and atmospheric activities may incentivise businesses to
reduce pollution in localised cases.
Waste production / generation / recycling
� Does the option affect waste production (solid, urban, agricultural, industrial, mining, radioactive or toxic waste) or how waste is treated, disposed of or recycled?
� There is no impact on waste production, but there could be enhanced monitoring of how waste is disposed of in particular cases.
The likelihood or scale of environmental risks
� Does the option affect the likelihood or prevention of fire, explosions, breakdowns, accidents and accidental emissions?
� Does it affect the risk of unauthorised or unintentional dissemination of environmentally alien or genetically modified organisms?
� Prevention of Forest Fires by identification of risky locations may be assisted by the provision of EO data through GMES.
� No impact on environmentally alien or genetically modified organisms is expected, although monitoring of species growth in marine and land environments may assist detection of specific cases.
Animal welfare � Does the option have an impact on health of animals? � Does the option affect animal welfare (i.e. humane
treatment of animals)? � Does the option affect the safety of food and feed?
� There is no impact on health or welfare of animals, or safety of feed.
International environmental impacts
� Does the option have an impact on the environment in third countries that would be relevant for overarching EU policies, such as development policy?
� A significant impact on the environment in third countries could be seen as a result of interventions undertaken following collection of data regarding climate change.
� A significant impact may arise from observation of specific environmental conditions that may result in interventions to mitigate or reduce pollution or damage to agricultural sites or deforestation.
Source: Booz and Company Analysis.

Booz & Company
Date: 19th September 2011 Cost-Benefit Analysis for GMES Final Version II
Prepared for: European Commission Directorate – Enterprise and Industry
234
Appendix G Assumptions for Service Readiness and Ta ke-up
To support the modelling of benefits, specific assumptions about service (or operational) readiness and take-up profile have been developed. These build on the review of services in Appendix C and a more general view on expected capability within the EO sector. Underpinning all assumptions are the expectation that the GMES programme will progress as planned, and that all the key enablers that need to be in place are being adequately addressed.
The simplifying approach for take-up profiling is described in the table below.
Table G.1: Strategic Take-up Assumptions Applied in the Economic Assessment
Category Take-up (years) Rationale
Immediate use 0 The outputs of the operational service have an immediate use case, and benefits begin to accrue from the start year of operations
User uptake 1 The accrual of benefits is contingent on the uptake of services by end users (institutional and individuals). The build-up period is required for promotion, dissemination and user education activities.
Policy cycle 2 The benefits arise as an outcome of inter-institutional policy-making and the trickling down of such policies through international, European, regional and local authorities.
The table below elaborate on the understanding of each benefit area and provides the specific assumptions that have been made. The specific heuristic for each benefit area is indicated in brackets next to the build-up period

Booz & Company
Date: 19th September 2011 Cost-Benefit Analysis for GMES Final Version II
Prepared for: European Commission Directorate – Enterprise and Industry
235
Table G.2: Review of Key Economic Modelling Assumptions for Significant Benefit Areas
Application Area
Purpose and Function Pre-operational Services and Evolution Profile Outstanding Issues
Global Climate Change Action
Climate Change Mitigation & Adaptation (International Agreements)
� Purpose – To inform the development of international agreements that involve setting atmospheric carbon targets to reduce the severity of climate change, & to inform strategies on adapting to the impacts of climate change
� Function – Gathering data on ECVs on a consistent basis over time. Contributions to ECVs stem from the Land (terrestrial carbon monitoring), Marine (sea level) and Atmosphere (greenhouse gases, ozone) services.
� Climate change services are not operational at the time of this writing. We assume in this report that the existing activities (CLIM-RUN, ECLISE, the forthcoming service coordination action and various ongoing downstream projects) are built upon and extended, and that an operational GMES Climate service is developed, having as its remit the identification and integration of climate-related inputs from the other GMES services.
� It is estimated, based on the rate of development of the Fast Track Services (FTS) between 2005 and 2008, that the future GMES Climate service will require 2 years of research and development time. Given the future service coordination action ending in 2014, a future operational GMES Climate service is assumed to exist starting in 2016.
� Once operational, benefits from the service will begin to accrue with gradual lead-in time. This is expected because the service outputs feed into further research and development activities (climate models). In turn these models can influence policy and decision-making, but this is again a multi-criteria process involving a large number of stakeholder interactions and institutional processes.
� In supporting mitigation, the GMES Land Monitoring service offers a number of contributions to the monitoring of deforestation, particularly in Europe but also globally to a lesser extent. Within Europe, there is a clear contribution in relation to land cover / land use
� A future GMES Climate service is foreseen to provide data to scientific communities in respect of developing climate models. A key enabler for the realisation of benefits from a future GMES Climate service is therefore the development of close links between the service and the associated European scientific research communities and networks. This implies technical matters such as the interoperability of datasets as well as collaborative agreements at an inter-institutional level. The data policy for GMES must make provision for the free transmission of data as well as foreseeing the re-use of the data in simulations and models held by other institutions.
� Being dependent on the policy cycle, it is also important that the governance arrangements make provision for feeding into high-level policy circles (e.g. production of an annual report on GMES climate-related findings).

Booz & Company
Date: 19th September 2011 Cost-Benefit Analysis for GMES Final Version II
Prepared for: European Commission Directorate – Enterprise and Industry
236
Application Area
Purpose and Function Pre-operational Services and Evolution Profile Outstanding Issues
mapping, in addition to the Forest Monitoring component (GSE FM successor) and the GMES Forest Downstream services developed under EUFODOS. Outside of European boundaries, the global component of the Land Monitoring service will provide biogeophysical parameters (e.g. Leaf Area Index) in near-real-time in support of the identification of forest areas. Analysis of time series data can support the efforts to ensure compliance with international agreements.
� Service ready from: 2016 � Build-up: 6 years (policy cycle)
Resource Management
European Air Quality
� Purpose – Reducing harm caused by urban air pollution
� Function – Forecasting, and providing warning of, major smog events in major European urban centres
� The GMES Atmosphere Monitoring service, coupled with the more citizen-oriented air quality alerting service (ObsAIRve,) will contribute to the reduction of bad health through air pollution. The GMES Atmosphere Monitoring service is predicted to be fully operational by 2015, whilst obsAIRve should be available and operational by 2014. The benefits from these services are expected to accrue over a period of 3 years from the start of their operations, because of the length of the value chain and the lead-in time to adoption. Uptake by local and regional public health authorities is necessary initially; this precedes a period of user engagement and education requiring behavioural changes on the part of citizens before health benefits can be realised.
� GMES Atmosphere Monitoring service ready from 2015 � Air quality alerting service (obsAIRve) ready from 2014 � Build-up: 1 years (user uptake)
� The success of a public health campaign based on air quality is founded on service uptake and ongoing dissemination and communication activities by multiple actors at national, regional and local levels. The benefits of air quality information being made widely available are contingent upon the extent to which users respond to this information. Therefore a condition for the realisation of benefits is sustained public education about the importance of air quality. Such information should be integrated into existing channels dealing with similar health impacts from the environment, e.g. UV index forecasts.

Booz & Company
Date: 19th September 2011 Cost-Benefit Analysis for GMES Final Version II
Prepared for: European Commission Directorate – Enterprise and Industry
237
Application Area
Purpose and Function Pre-operational Services and Evolution Profile Outstanding Issues
European Deforestation (Forest Fires)
� Purpose – Reduce burnt forest area and related damage to eco-systems and local properties.
� Function – Support to combat of forest fires. Use data to have a more effective response, and proactive management of forest fires.
� The GMES Emergency Management service is operational from the base year (2014). It assists in the local response to forest fires by providing information about their location, status and scope to ground fire-fighting teams. The emergence and development of forest fires and the associated smoke plumes can be monitored by the use of optical satellite sensors. The service provides a rapid mapping service, delivering damage assessment maps and reports to support the deployment of resources and pre-emptive actions in the high-risk zones surrounding the conflagration or in the path of its spread.
� Because this service will be operational from the base year (2014), benefits are assumed to accrue immediately from then, with no uptake time, as the user communities are already well-developed through SAFER and its precursors
� Service ready from 2014 � Build-up: 0 years (immediate use)
� One of the key issues affecting the responsiveness of the service (and therefore the benefit to end-users and affected communities) is the time taken between service activation and image capture. This is associated with the data provider interface, and is partly a governance topic.
Global Desertification
� Purpose – To support the development of enhanced land management practices related to the prevention of desertification
� Function – Monitoring land use changes and desertification trends
� The services involved in the management of global desertification fall under the Land Monitoring suite. In particular, the global component and the activities related to natural resource management in Africa (NARMA in geoland2) can contribute to the monitoring and prevention of desertification,
� Service ready from 2014 � Build-up: 2 years (policy cycle)
� In order for benefits to be realised from these services, local policy-makers and land management authorities need to take advantage of the available data, and work with service providers to integrate the service outputs into their decision-making processes and land management practices. This pre-supposes strong governance links at an international level outside the EU. The basis for such collaborations are already in place in some cases (in, for example, the GMES and Africa process), but continued efforts in this vein are required by the EU.
Unlawful Oil Discharge in Sea Vessel Operations
� Purpose – Reduce the scale and frequency of oil pollution and support more effective responses
� The operational EMSA GMES service “CleanSeaNet” responds to oil spills using near real-time satellite monitoring capabilities. It is closely linked to the main
� Whilst the user communities and network of interests remains well-developed and continues to improve, the service benefits rest four-square on continued

Booz & Company
Date: 19th September 2011 Cost-Benefit Analysis for GMES Final Version II
Prepared for: European Commission Directorate – Enterprise and Industry
238
Application Area
Purpose and Function Pre-operational Services and Evolution Profile Outstanding Issues
by coast guards and local marine authorities.
� Function – Deterrent, detection and response
GMES Marine Environment service, of which CleanSeaNet is considered an ‘intermediate user’. The oil spill monitoring capacities are well-developed and operational since 2007. Oil spill modelling allows for both damage mitigation (using the former to alert local authorities of approaching slick) and detection of offenders (using the latter to identify the source of the spill). The complementarities between CleanSeaNet and the GMES Marine Environment Service continue to develop, in respect of the interoperability of datasets and ocean modelling capabilities.
� Service ready from 2014 � Build-up: 0 years (immediate use)
integration with coast guards and maritime agencies at Member State level. These links should continue to be fostered and nurtured at a governance level.
Major Accidental Oil Spills
� Purpose – Reduce the scale of oil pollution damage through more effective response
� Function – Detection and response
� The service profile of oil spill monitoring is described above (“Unlawful Oil Discharge in Sea Vessel Operations”).
� Service ready from 2014 � Build-up: 0 years (immediate use)
� (See comments for “Unlawful Oil Discharge in Sea Vessel Operations”)
Maritime Navigation – Sea Ice (Northern Sea Passage)
� Purpose – To provide operational efficiencies for international shipping.
� Function – To identify navigable sea routes that are subject to seasonal pack ice
� The GMES Marine Environment service and the ICEMAR (Baltic Sea and European Arctic) preparatory action provide operational services on sea ice monitoring and forecasting.
� Service ready from 2014 � Build-up: 0 years (immediate use)
� A key enabler for this service is the promotion of the service to commercial shipping operators, and the integration of the output into their operations planning.
Maritime Navigation – Ship Routing
� Purpose – To reduce fuel costs and support safe passage by utilising ocean currents in ship routing
� Function – To identify sea routes which capitalise on ocean currents
� The GMES Marine Environment service provides operational capabilities to offer ship routing information based on ocean currents.
� Service ready from 2014 � Build-up: 0 years (immediate use)
� See comments for “Maritime Navigation - Sea Ice (Northern Sea Passage)”.
EU CAP Monitoring � Purpose – Reduced fraud in CAP � GMES Land Monitoring services are operational from the base year; the Global Crop Monitoring component
� The update frequency of the continental component is not annual (~3-5 yearly). However this is not required

Booz & Company
Date: 19th September 2011 Cost-Benefit Analysis for GMES Final Version II
Prepared for: European Commission Directorate – Enterprise and Industry
239
Application Area
Purpose and Function Pre-operational Services and Evolution Profile Outstanding Issues
subsidies � Function – Monitoring CAP
compliance and claims
is relevant here. � It provides crop monitoring and yield forecasts as well
as country-specific Area Estimate Services based on the wall-to-wall high resolution land cover product from the continental component.
� Service ready from 2014 � Build-up: 1 years (user uptake)
for crop monitoring, yield forecasting and crop masks (it is needed for area estimate services). The benefits of support to CAP monitoring can therefore still be realised. The build-up period is required due to the seasonal nature of crop monitoring.
Regional Policy (Urban Development)
� Purpose – Better targeted investment in urban infrastructure
� Function – Production of multi-function maps using common data sets
� The local component of the GMES Land Monitoring service (Urban Atlas, as in geoland2 and as a DG REGIO FEDER service) is operational from the base year. The Urban Atlas service has mapped 228 out of 305 planned cities over 100000 inhabitants in very high resolution.
� Service ready from 2014 � Build-up: 2 years (policy cycle)
� There are three potential constraints on the uptake of benefits: update frequency, scope and the policy cycle. The update frequency of Urban Atlas is 3-5 years, and this might pose as a barrier to urban investment taking place towards the end of the cycle (since new developments within - potentially – a five-year period will not be reflected). The scope of the service is currently limited to 305 cities over 100000 inhabitants – this stands to exclude smaller cities (although the service may extend to these in future).
� Finally, the impact of benefits is contingent on urban planning and policy-making
Emergency Response (Europe)
European Geohazards (Earthquakes)
� Purpose – Reduce human suffering through enhanced preparedness and emergency response, and provide assessment of physical damage.
� Function – Provide maps to emergency response, and inputs into the PDNA process.
� The GMES Emergency Management service is operational from the base year. The service is mature and the rapid mapping, preparedness and post-disaster monitoring capabilities well-developed.
� GMES Emergency Management service ready from 2014
� Build-up: 0 years (immediate use)
� Potential for duplication with e.g. US capabilities
European Flooding � Purpose – Reduce human suffering through enhanced
� Both the GMES Emergency Management service and the European Flood Alert System (EFAS) are
� Long-term contribution to flood risk management has links to other service areas (e.g. climate change). Not

Booz & Company
Date: 19th September 2011 Cost-Benefit Analysis for GMES Final Version II
Prepared for: European Commission Directorate – Enterprise and Industry
240
Application Area
Purpose and Function Pre-operational Services and Evolution Profile Outstanding Issues
preparedness and emergency response, and provide assessment of physical damage.
� Function – Predicting flood extent, and assess damage
operational from the base year. EFAS can provide flood warning notification up to 10 days in advance of a flood.
� Service ready from 2014 � Build-up: 0 years (immediate use)
clear where the responsibility for implementing adaptation measures lies here or with the climate change service.
European Forest Fires
� Purpose – Reduce human suffering through enhanced preparedness and emergency response, and provide assessment of physical damage.
� Function – Prediction of forest fire risks to enhance risk management. Enhanced response capability during large fire events, post-event damage assessment on burnt areas
� (See comments for “European Deforestation (Forest Fires)”)
� Service ready from 2014 � Build-up: 0 years (immediate use)
� (See comments for “European Deforestation (Forest Fires)”).
Other Emergency � Purpose – Reduce human suffering through enhanced preparedness and emergency response, and provide assessment of physical damage.
� Function – Prediction of storms and other events to enhance risk management. Enhanced response capability during large events and post-event damage assessment
� The GMES Emergency Management service is operational from the base year. The service is mature and the rapid mapping, preparedness and post-disaster monitoring capabilities well-developed.
� GMES Emergency Management service ready from 2014
� Build-up: 0 years (immediate use)
� (See comments for “European Deforestation (Forest Fires)”).
European Natural Disaster Reconstruction Support (EU Solidarity Fund)
� Purpose – To better target relief / reconstruction spending from EU Solidarity Fund
� Function – Provide a consistent and objective measure of damage caused by major disasters across
� The operational GMES Emergency Management service provides a clear contribution to the targeting of relief and reconstruction spend though its damage assessment and disaster extent products, as well as ongoing monitoring after a crisis.
� Service ready from 2014
� (See comments for “European Deforestation (Forest Fires)”).

Booz & Company
Date: 19th September 2011 Cost-Benefit Analysis for GMES Final Version II
Prepared for: European Commission Directorate – Enterprise and Industry
241
Application Area
Purpose and Function Pre-operational Services and Evolution Profile Outstanding Issues
the EU � Build-up: 0 years (immediate use)
Global Humanitarian Aid
Global Natural Hazards
� Purpose – Reduce human suffering through enhanced preparedness and emergency response in the case of earthquakes (including tsunamis), floods, fires, droughts, etc., and provide assessment of physical damage
� Function – Prediction of hazard risks to enhance risk management. Enhanced response capability during large hazard events, post-event damage assessment on damaged areas
� GMES Emergency Management service is operational from the base year. The service profile for response to hazards is discussed in the benefit areas “European Geohazards (Earthquakes)”.
� Service ready from 2014 � Build-up: 0 years (immediate use)
� (See comments for “European Deforestation (Forest Fires)”).
Humanitarian Aid in Conflict Situations
� Purpose – Reduce human suffering through enhanced preparedness and emergency response in the case of conflict situations
� Function – Enhanced response capability before, during and after events, including monitoring of potential conflict issue, but also providing support during operations and post-conflict reconstruction efforts.
� GMES services for security applications are operational from the base year.
� Service ready from 2014 � Build-up: 0 years (immediate use)
� (See comments for “European Deforestation (Forest Fires)”).
Global Natural Disaster Hazard Support
� Purpose – To better target relief/reconstruction spending from international aid budgets (EU and
� For the GMES Emergency Management service, the comments listed under “European Natural Disaster Reconstruction Support (EU Solidarity Fund)” also
� (See comments for “European Deforestation (Forest Fires)”).

Booz & Company
Date: 19th September 2011 Cost-Benefit Analysis for GMES Final Version II
Prepared for: European Commission Directorate – Enterprise and Industry
242
Application Area
Purpose and Function Pre-operational Services and Evolution Profile Outstanding Issues
Member States) � Function – Provide a consistent
and objective measure of damage caused by major disasters and conflicts globally
apply here. � In the case of post-conflict situations, the GMES
Services for security Applications provide relevant services for post-crisis reconstruction monitoring and damage assessment
� GMES Emergency Management service ready from 2014
� GMES Services for security Applications ready from 2015
� Build-up: 0 years (immediate use)
Source: Booz and Company Analysis.

Booz & Company
Date: 19th September 2011 Cost-Benefit Analysis for GMES Final Version II
Prepared for: European Commission Directorate – Enterprise and Industry
243
Appendix H Other CBA Modelling Assumptions
H.1 THE EMERGENCY EVENTS DATABASE (EM-DAT)
In its report on GMES benefits261, PWC used the Emergency Events Database (EM-DAT) maintained by CRED (Centre for Research on the Epidemiology of Disasters) for baseline data (number of events, mortality, people affected (morbidity) and total damage costs) in Europe. Data was collected for the period 1980 – 2005. The average impact over the period was used as the starting point, with the trend line used for forecasting future impact, i.e. a linear projection.
The EM-DAT database shows data on mortality and morbidity in terms of DALY (Disability Adjusted Life Years). Value of statistical life (VoSL) estimates were applied to monetise the economic impact. The study also made the assumption that the morbidity effects vary between 1.5 – 4 months depending on the type of hazard. This value is used to adjust (annualise) the morbidity impact shown in the EM-DAT database.
Stakeholder consultation was used to justify assumptions, including the potential damage reduction from GMES. Values were in the range of 1 - 1.5% compared to the baseline. The study also assumed an immediate (full) benefit impact from GMES.
In broad terms, an approach building on the EM-DAT database would appear reasonable as it utilises available data sources in a transparent manner and is consistent with the previous study approach. However, the assumption that mortality, morbidity and damage costs increase based on the 25-year trend observed from the historic data appears less robust. A shorter time horizon for the historic data included in the analysis better reflects events during the last decade, but also changes made in order to improve the ability to respond to events. The time horizon of 1998 – 2010 as used in the recent EEA report262 on the impact of natural hazards is therefore used.
Damage costs are updated to 2010 prices so they are directly comparable, as this was not done in the PWC study. The EM-DAT database has damage costs shown in historic prices. They should therefore be updated to 2010 prices, and converted from USD to EUR.263
Caution is needed when interpreting data from the EM-DAT database. Trends may reflect an evolution in the accuracy and comprehensiveness of the underlying data. Similarly, the EM-DAT database uses minimum ‘disaster thresholds’ which means that it only focuses on major events. Data is therefore used to illustrate the type of impact, but cannot provide a complete picture of all events.
In summarised form, the approach applied in this study is therefore as follows:
� Obtain historic data (mortality, morbidity and damage) for 1998 – 2010 and update projection for 2014 – 2030, with a constant baseline assumed if there is not an apparent trend line; and
261 PriceWaterhouseCoopers “Socio-Economic Benefits Analysis of GMES”, October 2006. 262 JRC Interview – European Forest Fire Action Service. 263 Loss values in US Dollars in EM-DAT are converted to euro per year using the respective exchange rates at the end of the
corresponding year (EUR 1 = USD x; x: 1.18 (1998); 1.01 (1999);0.93 (2000); 0.88 (2001); 1.05 (2002); 1.26 (2003); 1.36 (2004); 1.18 (2005); 1.33 (2006); 1.47 (2007); 1.39 (2008); 1.44 (2009); 1.39 (2010);
cf. www.ecb.int/stats/exchange/eurofxref/html/eurofxref-graph-usd.en.html.

Booz & Company
Date: 19th September 2011 Cost-Benefit Analysis for GMES Final Version II
Prepared for: European Commission Directorate – Enterprise and Industry
244
� Update value of statistical life (VoSL) and the disability adjusted life year (DALY) value, i.e. new data sources and baseline to 2010 prices, with a real price escalation in line with real GPD per capita to 2030.
The assumed GMES impact can then be applied, with the effect that the potential annual benefit impact can be calculated. However, it must be stressed that this step relies on a number of enablers being in place. These are detailed as part of the benefit assessment. Without these, the likely benefits from GMES will be significantly reduced.
Finally, the assessment of natural hazards is separated between European (EU27 and other European countries) benefits and wider global benefits. The latter is assessed under the humanitarian aid category.
H.2 VALUE OF STATISTICAL LIFE AND DISABILITY ADJUSTED LIFE YEAR VALUE
Two key economic parameters are value of statistical life (VoSL) and the associated disability adjusted life year (DALY). VoSL expresses the value of reduced mortality (or human lives saved). VoSL estimates show substantial variation across counties (and also within countries). This is in particular a result of the survey based willingness to pay (WTP) approach underlying many studies264. Furthermore, reliable estimates are often not available for low and middle-income counties. In some studies VoSL country estimates have been estimated using a benefit transfer approach, i.e. scaling on the basis of GDP per capital to a VoSL estimate for a high income country such as the US.265 For study with a strong global component, it makes sense to avoid using a range of values, but instead selecting one value that acts as a global estimate. It would also generally lead to lower baseline costs and therefore benefits in relation to particular options.
An approach that can easily be applied with some consistency across all countries is one that uses a relationship between VoSL and per capita GPD (Gross Domestic Product). For example, one source suggests deriving VoSL as a multiple of per capita GDP ranging from 60 – 80, with 70 being the central case value.266 Another source, with reference to the extensive literature that has developed in this area, suggests a VoSL range from about 75 – 180 times per capita GDP, with 100 as a conservative estimate.267
264 See for example David Pearce’s paper “Valuing Risk to Life and Health” from 2000 for a discussion on the topic. The paper
was prepared for the European Commission. 265 The World Bank: “Valuing Mortality and Morbidity in the Context of Disaster Risks”, February 2009 (http://www-
wds.worldbank.org/external/default/WDSContentServer/IW3P/IB/2009/02/25/000158349_20090225142643/Rendered/PDF/WPS4832.pdf).
The World Bank has also provided a critique of VoSL in “Economic Benefit of Tuberculosis Control”, August 2007
(http://www-wds.worldbank.org/external/default/WDSContentServer/IW3P/IB/2007/08/01/000158349_20070801103922/Rendered/INDEX/wps4295.txt).
266 The Road safety Toolkit, a result of collaboration between the International Road Assessment Programme (iRAP), the Global Transport Knowledge Partnership (gTKP) and the World Bank Global Road Safety Facility. See http://toolkit.irap.org/default.asp?page=management&id=1.
267 Commission on Macroeconomics and Health: “The Effect of the AIDS Epidemic on Economic Welfare in Sub-Saharan Africa”, December 2001. See http://www.emro.who.int/cbi/PDF/AIDS_Epidemic.pdf.

Booz & Company
Date: 19th September 2011 Cost-Benefit Analysis for GMES Final Version II
Prepared for: European Commission Directorate – Enterprise and Industry
245
From the PWC study it is possible to derive multiples ranging from 65 – 170.268 In general, PWC used a value of €1.5 million (2005 prices) for mortality, and a value of €35,000 per DALY for morbidity (people affected).269
This study has therefore adapted an approach with a central case value of 100.
Global GPD in 2010 was USD 62,900 billion, with a population of 6.9 billion. On that basis GDP per capital was USD 9,117 (€6,830) in 2010 prices. The relevant VoSL is therefore €683,000.
The DALY value is assumed to be 2.5% of VoSL, i.e. €17,000. In the case of the EU27, it should be noted that both of these values are less than would normally be applied in cost-benefit assessments. For example, HEIMTSA270 used in their study of outdoor air quality a DALY value of €40,000 (2008 prices) based on stated preference research across nine European countries. This value is, however, much lower than the €52,000 (median value in 2005 prices) used in the CBA of CAFE.271 However, in the case of European air quality, the CAFE value has been applied as it relates to directly to the benefit area being assessed.
Finally, in the context of the assessment of natural hazards, morbidity figures have been annualised by assuming that each person suffers on average one month.272 This represents a simplification of the approach used by PWC in its GMES benefit study. However, the view is that this assumption avoids varying factors being used in an area where there is substantial uncertainty. In comparison to PWC, the assumption represents a constraining of the benefit case.
H.3 DISCOUNT RATE
The cost benefit analysis uses a real discount rate of 4%, as suggested in the EC’s Impact Assessment Guidelines.
H.4 GDP
All GDP values are sourced to the International Monetary Fund (IMF) World Economic Outlook Database. See the table below for annual values.
268 2005 GDP per capita in the European Union was €22,645. This is derived from USD 26,721 per capita GDP (International
Monetary Fund, World Economic Outlook Database, April 2011) and an exchange between USD and EUR of 1.18 (The European Central Bank). The VoSL value used in the appraisal was €1.5 million. This value is 66 times higher than GDP per capita.
2005 GDP per capita in Africa ranges from EUR1,519 (Sub-Saharan) to €6,150 (North Africa/Middle East) based on USD 1,792 and USD 7,257 respectively, and USD to EUR exchange rate of 1.18. The VoSL value used for Africa was €257,545. The GDP per capital multiple is therefore between 42 and 172. All GDP data from the International Monetary Fund (World Economic Outlook Database, April 2011) and exchange rates from the European Central Bank.
269 DALY is 2.33% of VoSL. 270 HEIMTSA: “D 4.1.1 Literature review of theoretical issues and empirical estimation of health end-point unit values:
outdoor air case study”, November 2008.
http://www.heimtsa.eu/LinkClick.aspx?fileticket=wvB7g6I7A3c%3d&tabid=2937&mid=6403. 271 CAFE CBA: Baseline Analysis 2000 to 2020, April 2005.
http://www.cafe-cba.org/assets/baseline_analysis_2000-2020_05-05.pdf. 272 Morbidity values from the EM-DAT database are actual people effected. However, to monetarise the impact, it is
necessary to convert actual people effected into an annualised value of morbidity. The annualise morbidity number can then be multiplied by the per person DALY (disability adjusted living year) value.

Booz & Company
Date: 19th September 2011 Cost-Benefit Analysis for GMES Final Version II
Prepared for: European Commission Directorate – Enterprise and Industry
246
Table H.1: EU Real GDP Growth, Per Annum, %
2005 2006 2007 2008 2009 2010 2011 2012 2013 2014 2015 2016 2017+
Annual 2.2% 3.5% 3.2% 0.7% -4.1% 1.8% 1.8% 2.1% 2.2% 2.2% 2.2% 2.1% 2.0%
Source: IMF (World Economic Outlook Database, April 2011); Booz & Company analysis.
Values for 2005 – 2010 are historic. IMF provides a GDP forecast for 2011 – 2016. From 2017 GDP growth is assumed to by 2% per annum.
H.5 CONSUMER PRICE INFLATION (CPI)
All inflation values are sources to the International Monetary Fund (IMF) World Economic Outlook Database. The following table provides annual values.
Table H.2: EU Consumer Price Inflation, 1998 – 2010
2005 2006 2007 2008 2009 2010 2011 2012 2013 2014 2015 2016 2017+
Annual 2.3% 2.3% 2.4% 3.7% 0.9% 2.0% 2.7% 1.9% 1.9% 1.9% 2.0% 2.0% 2.0%
Note: All values are end of year. Source: European Central Bank; Booz & Company analysis.
Values for 2005 – 2010 are historic (the applicable uplift from 2005 prices to 2010 prices is 1.12). IMF provides a CPI forecast for 2011 – 2016. From 2017 CPI is assumed to increase by 2% per annum.
H.6 EXCHANGE RATES
Exchange rate values for conversion between USD and EUR have been obtained from the European Central Bank as shown the table below. All values are end of corresponding year.
Table H.3: USD – EUR Exchange Rates, 1998 – 2010
1998 1999 2000 2001 2002 2003 2004 2005 2006 2007 2008 2009 2010
Annual 1.18 1.01 0.94 0.90 1.04 1.26 1.35 1.18 1.33 1.47 1.39 1.44 1.33
Note: All values are end of corresponding year.
Source: European Central Bank; Booz & Company analysis.


![Principles and Standards for Benefit–Cost Analysis] Introduction- Professionalizing Benefit–Cost Analysis](https://static.fdocuments.in/doc/165x107/56d6beb21a28ab30169333bb/principles-and-standards-for-benefitcost-analysis-introduction-professionalizing.jpg)