Cost and price indices
12
Engineering Costs and ProductionEconomics, 16 ( 1989 ) 233-244 Elsevier Science Publishers B.V., Amsterdam - Printed in The Netherlands 233 COST AND PRICE INDICES Norman Boyd INTRODUCTION The annual rate of inflation, measured by changes in the consumer price indices, fell in most countries from a peak in 1980 to a low in 1986 and early 1987 since when the movement was reversed. The tabulation [ 11, giving the percentage changes in C.P.I. from the previous year, shows that some countries have been more successful than others in combating inflation. Belgium, West Germany, Japan and The Netherlands appear to have inflation firmly under control. Conversely Australia, Norway and Sweden still have major problems in re- ducing their rates of inflation but none of the remaining countries can be too confident about Australia Belgium Canada Denmark France West Germany Italy Japan Netherlands Norway Sweden U.K. U.S.A. p8tJ 1986 1988 10.2 9.1 7.2 12.8 1.3 1.2 10.1 4.2 4.1 12.3 3.6 4.6 13.6 2.7 2.8 6.0 -0.2 1.2 21.2 5.8 5.1 11.8 0.4 0.5 10.2 0.1 0.7 10.9 7.1 6.8 13.7 4.3 5.8 18.0 3.4 5.0 13.5 1.9 4.1 ERECTED COSTS OF PLANTS the future. In the twelve months to July 1, 1988 the in- dices of erected costs of plants (Table 1) rose TABLE 1 Indices of erected costs of plantsa as at January lst, unless otherwise stated ( 1975 = 1 .OO) 1977 1978 1979 1980 1981 1982 1983 1984 1985 1986 1987 1987 1988 1988 July 1 July 1 Belgium 1.16 1.27 1.29 1.40 1.50 1.64 1.89 1.99 2.01 2.06 2.07 2.10 2.10 2.17 Denmark 1.06 1.16 1.27 1.38 1.54 1.64 1.99 2.14 2.19 2.32 2.41 2.59 2.63 2.75 France 1.25 1.34 1.46 1.59 1.82 2.05 2.50 2.73 2.84 2.97 3.10 3.17 3.21 3.26 W. Germany 1.07 1.11 1.14 1.21 1.29 1.38 1.53 1.52 1.56 1.60 1.60 1.61 1.62 1.66 Italy 1.43 1.67 1.92 2.27 2.67 3.15 3.89 4.38 4.7 1 5.12 5.31 5.53 5.60 5.76 Netherlands 1.14 1.22 1.18 I .24 1.31 1.42 1.54 1.54 1.57 1.59 1.63 1.61 1.65 1.65 U.K. 1.45 1.61 1.76 2.04 2.35 2.56 2.78 2.92 3.10 3.34 3.56 3.67 3.75 3.84 Australia 1.33 1.46 1.57 1.71 1.93 2.15 2.58 2.77 2.91 3.15 3.36 3.45 3.55 3.60 Canada 1.33 1.46 1.56 1.76 1.95 2.24 2.46 2.42 2.47 2.52 2.57 2.6 I 2.65 2.74 Japan 1.26 1.39 1.50 1.58 1.70 1.79 1.84 1.84 1.84 1.89 1.87 1.86 1.90 1.92 Norway 1.22 1.35 1.45 1.53 1.69 1.79 2.07 2.18 2.28 2.4 2.73 2.99 3.16 3.23 Sweden 1.16 I .24 1.37 1.49 1.67 1.81 2.05 2.26 2.37 2.57 2.77 2.89 3.00 3.12 U.S.A. 1.18 1.27 1.39 1.53 1.68 1.85 1.96 2.09 2.13 2.19 2.10 2.12 2.20 2.27 “For method used to calculate costs and indices see Eng. Costs Prod. Econ., 6 ( 1982) 272 and 7 ( 1982) I8 0167-188X/89/$03.50 0 1989 Elsevier Science Publishers B.V.
-
Upload
norman-boyd -
Category
Documents
-
view
212 -
download
0
Transcript of Cost and price indices

Engineering Costs and Production Economics, 16 ( 1989 ) 233-244 Elsevier Science Publishers B.V., Amsterdam - Printed in The Netherlands
233
COST AND PRICE INDICES
Norman Boyd
INTRODUCTION
The annual rate of inflation, measured by changes in the consumer price indices, fell in most countries from a peak in 1980 to a low in 1986 and early 1987 since when the movement was reversed. The tabulation [ 11, giving the percentage changes in C.P.I. from the previous year, shows that some countries have been more successful than others in combating inflation.
Belgium, West Germany, Japan and The Netherlands appear to have inflation firmly under control. Conversely Australia, Norway and Sweden still have major problems in re- ducing their rates of inflation but none of the remaining countries can be too confident about
Australia Belgium Canada Denmark France West Germany Italy Japan Netherlands Norway Sweden U.K. U.S.A.
p8tJ 1986 1988 10.2 9.1 7.2 12.8 1.3 1.2 10.1 4.2 4.1 12.3 3.6 4.6 13.6 2.7 2.8 6.0 -0.2 1.2
21.2 5.8 5.1 11.8 0.4 0.5 10.2 0.1 0.7 10.9 7.1 6.8 13.7 4.3 5.8 18.0 3.4 5.0 13.5 1.9 4.1
ERECTED COSTS OF PLANTS
the future. In the twelve months to July 1, 1988 the in-
dices of erected costs of plants (Table 1) rose
TABLE 1
Indices of erected costs of plantsa as at January lst, unless otherwise stated ( 1975 = 1 .OO)
1977 1978 1979 1980 1981 1982 1983 1984 1985 1986 1987 1987 1988 1988
July 1 July 1
Belgium 1.16 1.27 1.29 1.40 1.50 1.64 1.89 1.99 2.01 2.06 2.07 2.10 2.10 2.17
Denmark 1.06 1.16 1.27 1.38 1.54 1.64 1.99 2.14 2.19 2.32 2.41 2.59 2.63 2.75
France 1.25 1.34 1.46 1.59 1.82 2.05 2.50 2.73 2.84 2.97 3.10 3.17 3.21 3.26 W. Germany 1.07 1.11 1.14 1.21 1.29 1.38 1.53 1.52 1.56 1.60 1.60 1.61 1.62 1.66
Italy 1.43 1.67 1.92 2.27 2.67 3.15 3.89 4.38 4.7 1 5.12 5.31 5.53 5.60 5.76
Netherlands 1.14 1.22 1.18 I .24 1.31 1.42 1.54 1.54 1.57 1.59 1.63 1.61 1.65 1.65 U.K. 1.45 1.61 1.76 2.04 2.35 2.56 2.78 2.92 3.10 3.34 3.56 3.67 3.75 3.84
Australia 1.33 1.46 1.57 1.71 1.93 2.15 2.58 2.77 2.91 3.15 3.36 3.45 3.55 3.60 Canada 1.33 1.46 1.56 1.76 1.95 2.24 2.46 2.42 2.47 2.52 2.57 2.6 I 2.65 2.74
Japan 1.26 1.39 1.50 1.58 1.70 1.79 1.84 1.84 1.84 1.89 1.87 1.86 1.90 1.92
Norway 1.22 1.35 1.45 1.53 1.69 1.79 2.07 2.18 2.28 2.4 2.73 2.99 3.16 3.23 Sweden 1.16 I .24 1.37 1.49 1.67 1.81 2.05 2.26 2.37 2.57 2.77 2.89 3.00 3.12
U.S.A. 1.18 1.27 1.39 1.53 1.68 1.85 1.96 2.09 2.13 2.19 2.10 2.12 2.20 2.27
“For method used to calculate costs and indices see Eng. Costs Prod. Econ., 6 ( 1982) 272 and 7 ( 1982) I8
0167-188X/89/$03.50 0 1989 Elsevier Science Publishers B.V.

TA
BL
E 2
Pric
e in
dice
s fo
r: I
O
rdin
ary
Port
land
ce
men
t II
St
eel
re-i
nfor
cing
ba
r II
I St
eel
sect
ions
(h
eavy
) IV
St
eel
plat
e
1974
(Pr
ices
pe
r to
nne
) 19
75
1976
19
77
1978
19
79
1980
19
81
1982
19
83
1984
19
85
1986
19
87
1988
Fi
rst
Loc
al
half
cu
rren
cy
Bel
gium
I
B.F
r.
920
112
130
140
144
150
168
186
II
11,5
00
75
68
77
72
74
85
85
III
9,80
0 90
10
2 10
9 10
3 11
6 11
7 12
8 IV
13
,900
78
71
76
70
76
83
86
Den
mar
k I
D.K
r.
190
II
1,61
0 IV
1,
950
203
118
108
Fran
ce
I F.
Fr.
120
II
1,08
0 II
I 1,
040
IV
1,32
0
239
141
171
127
W. G
erm
any
I D
M
67
II
700
III
640
IV
740
116
117
122
129
133
167
95
87
97
88
93
117
81
76
81
88
91
104
112
131
135
148
172
205
96
99
105
108
113
136
100
113
124
141
144
157
113
113
105
106
110
121
110
110
116
118
120
131
85
80
78
77
76
84
105
109
106
101
108
106
95
93
91
85
91
96
145 83
114
108
Ital
y I
Lir
e 10
,700
II
18
1,00
0 II
I 15
3,00
0 IV
17
7,00
0
134
152
188
210
246
321
75
83
104
117
135
146
105
128
154
174
188
207
118
127
136
146
165
188
119
126
132
136
138
150
76
73
78
73
74
90
105
105
105
81
83
85
140
173
205
231
277
357
111
136
144
142
153
183
135
157
178
183
236
248
132
141
154
167
176
186
394
143
214
203
Net
herl
ands
I
Gui
lder
70
II
78
0 IV
83
0
169 91
89
U.K
. I
Poun
d 10
.5
II
96.0
II
I 90
.0
IV
96.0
405
183
248
186
237
250
252
270
272
282
288
115
117
105
115
122
121
121
173
163
160
160
153
148
148
113
129
123
127
130
129
129
214
232
229
242
240
246
253
146
149
156
158
158
160
165
147
154
152
154
160
172
174
273
293
299
315
324
346
358
168
148
167
175
204
207
215
227
214
219
220
226
221
221
182
203
203
204
216
219
219
167
177
177
183
185
187
186
104
81
86
91
96
95
99
164
132
133
133
120
107
107
127
122
122
125
122
117
118
468
515
549
584
625
639
657
155
157
178
209
186
172
188
302
304
320
338
353
336
294
270
308
311
339
350
345
305
183
187
196
202
208
210
213
107
78
78
93
99
93
95
115
119
119
120
122
123
123
443
443
443
449
462
462R
46
2 20
3 20
3 20
6 22
8 22
4 21
6 25
6 27
9 27
8 28
5 30
7 32
1 33
2 28
3 21
4 21
4 23
0 24
0 25
5 26
0 27
3
Can
ada
Japa
na
Nor
way
Swed
en
U.S
.A.
I A
.$
26.5
0 II
16
5 II
I 15
5 IB
16
0
I C
an.%
32
.00
II
205
III
194
IV
188
I Y
en
8,57
0 II
77
,750
II
I 67
,750
IB
75
,250
I N
.Kr.
II
II
I
I S
W.k
.
II
III
IV
I U
.S.%
II
II
I IV
172
1,45
0 1,
550
125
1,22
5 1,
480
1,71
5 30.4
0 21
5 23
0 23
0
119
137
154
168
180
199
229
268
300
121
143
157
166
180
206
228
254
277
123
142
156
169
184
211
236
267
272
AS
III
120
140
153
170
191
217
252
194
306
125
126
115
121
142
150
162
177
168
121
135
141
156
184
212
243
262
262
125
141
155
170
193
216
243
266
266
106
112
115
126
133
174
185
185
183
67
71
67
76
87
95
86
79
80
102
122
133
140
145
150
156
153
147
66
84
90
103
111
109
108
104
98
117
128
141
152
168
192
215
233
262
104
101
104
99
112
124
128
145
148
92
102
107
107
114
127
129
165
165
115
132
149
163
178
201
231
260
281
98
100
108
113
128
147
139
157
157
80
91
83
94
103
116
122
165
172
72
73
66
78
81
87
90
125
152
119
131
141
155
174
191
202
208
209
99
91
92
103
128
136
137
128
117
121
127
135
152
167
184
206
230
235
117
126
137
154
171
190
213
231
248
316
328
349
366
382
284
291
309
327
368
283
298
324
346
341
315
164
262
270
183 86
146 98
273
140
132
302
157
172
149
218
127
240
247
329
338
341
345
171
175
180
194
262
267
270
289
213
269
274
299
183
183
177
166
87
71
64
76
143
120
126
138
96
82
77
89
280
280
293
327
145
164
178
193
156
178
179
194
324
346
361
371
166
184
193
200
177
181
174
179
153
173
180
185
223
218
214
214
129
131
129
141
241
232
236
261
244
189
207
240
For
pric
e va
riat
ions
an
d m
ater
ial
spec
ific
atio
ns,
see
Vol
. 5,
pp.
15
9-16
1 an
d 24
7-25
4.
“Jap
anes
e st
eel
pric
es
are
“mar
ket”
pr
ices
an
d ar
e no
t di
rect
ly
com
para
ble
with
the
bas
ic
(pro
duce
r)
pric
es
give
n fo
r al
l ot
her
coun
trie
s.
See
Vol
. 5,
pp.
24
5-24
6.

TABLE 3
Indices of average hourly earnings of adult manual” workers in selected industries ( 1974= 100)
country ISICb 1974 1976 1977 197% 1979 1980 1981 Oct.
Local currency
OCI. Oct. Oct. Oct. Oct. Oct.
Belgium
France
W. Germany
Italy
Netherlands
U.K.
Australia’
Canada
U.S.A.
Denmark
Norway
Sweden
Japan
351 B.Fr. 157.25 131 147 152 165 183 198 371 171.89 122 132 137 157 172 186 382 133.94 125 137 142 156 169 189 5 130.07 132 146 150 167 180 194
351 F.Fr. 12.02 129 145 165 190 219 247 371 11.71 136 152 168 189 218 249 382 11.04 135 153 169 189 227 253 5 10.08 137 154 171 195 227 263
351 DM 11.02 115 124 127 128 137 146 371 10.05 113 120 126 133 141 149 382 9.89 114 123 129 135 146 153 5 10.00 110 117 124 134 144 152
351 Lire 371 382 5
351 37 382 5
1486 161 1542 154 1325 158 1255 158
10.60 123 10.73 120 9.47 120 9.70 123
190 232 291 351 414 183 205 255 313 385 188 210 262 321 395 187 218 279 327 406
Guilder 134 141 148 155 165 130 139 147 154 164 130 137 143 153 162 135 148 162 170 180
35112 371 382 5
Pound 1.17 140 150 174 208 247 275 1.16 147 158 184 209 247 272 1.10 140 155 177 207 240 263 1.04 143 157 175 201 247 266
351/Z/3 A.8 3.79 127 139 150 173 195 210 37 3.73 12s 144 I50 165 192 214 381/2/3 3.42 123 135 143 157 175 204 5 3.55 128 141 149 162 181 215
3.5112 Can.$ 4.74 128 140 150 161 186 209 371/2 5.43 127 141 152 166 183 214 382 5.13 126 136 147 162 176 202 5 6.77 132 148 1% 167 186 212
351 371 382 5
U.S.$ 5.56 122 133 142 5.81 120 135 149 5.09 115 126 136 6.99 113 118 127
154 164 148 136
(3rdQr) 177 177 180
191 169 197 180 178 164 158 147
(3rd Qr) (3rd Qr)
35lf2 D.Kr. 26.68 129 382/2 27.92 131 5 29.17 129
143 142 144
153 155 151
145 141 141 149
159 160 160
189 210 191 208 195 21 f
351/2 N.ICr. 22.12 137 382 23.39 140 5 26.39 I36
165 168 165
35 sw.Kr. 18.50 135 371 20.90 132 382 19.37 130 5 22.45 133
153 151 149 158
163 173 171
(4th Qr) 169 167 161 170
185 198 189
(4th Qr) 185 I79 175 190
(-Dec.)
165 162 161 183
199 211 204
(4th Qr) 203 194 194 203 (-Dec.) ( I2 months to Dec. 1974) (-Dec.1976) (-Dec.1977) (-Dec.1978) (-Dec.)
351/2 Yen 1115.8 121 132 139 154 371 1126.1 126 138 143 150 382 940.8 122 133 139 150 5 722.8 132 148 160 172
173 175 171 198
“For Japan, manual and non-manual workers, including holiday pay (see: Vol. 5, pp. 75-77). %ternational Standard Industrial Classification. ‘From 1983 onwards, indices apply to May and November. 35 Manufacture of chemicals. 35 1 Manufacture of industrial chemicals. 352 Manufacture of other chemicals.
353 Petroleum Wineries. 37 Basic metal industries. 37 1 Iron and steel basic industries.

1982 lY83 1984 1983 i9%6 1987 1988
Oct. Apr. Oct. Apr. act; Apr. Oct. Apr. Oct. Apr. Oct. Apr.
208 221 223 226 229 200 204 224 226 230 200 212 216 ii9 220 202 210 2i5 21s 220
233 232 224 223
235 235 239 239 244 233 233 236 236 229 228 228 231 231 238 226 226 231 231 229
284 300 323 334 340 353 361 368 374 376 379 385 289 304 308 327 330 346 355 360 364 368 373 376 289 306 323 337 340 356 364 372 378 385 392 396 296 317 329 340 350 359 370 379 386 392 400 406
153 157 159 162 164 166 169 171 178 180 182 186 154 161 160 161 163 171 171 173 180 183 187 193 159 162 f64 164 169 L77 178 179 187 189 193 199 156 161 k65 165 166 146 168 172 172 176 178 182
477 512 543 578 605 629 639 662 697 727 742 713 442 476 507 542 557 590 614 619 636 672 685 748 453 490 523 559 580 610 636 639 664 702 716 772 484 518 547 St)5 602 631 661 664 690 709 722 764
175 183 190 193 194 193 196 198 197 198 198 172 175 177 l&O ia0 181 183 184 185 186 186 171 172 174 176 176 178 179 180 181 182 182 190 188 187 189 189 195 195 197 199 199 200
295 313 325 335 352 363 378 3841 400 421 432 439 296 332 342 369 380 393 406 411R 411 455 466 486 286 301 306 319 328 345 358 373 379 390 403 420 289 306 309 323 328 338 349 363 374 388 393 413
246 258 270 271 285 295 297 299 310 310 315 249 265 276 276 283 298 300 317 324 329 330 244 264 275 264 274 284 285 303 313 322 327 250 260 272 295 302 313 315 321 330 335 341
228 232 240 244 253 254 260 265 273 280 282 288 240 240 252 iS6 265 272 277 276 280 287 289 297 216 219 222 224 231 230 233 234 240 243 249 251 228 207 202 207 203 211 204 211 209 219 218 222
204 208 183 169
(3rdQr) 233 232 240
206 215 220 196 218 226 186 192 195 170 172 171
(1stQr) (3rd Qr) (1st Qr) 246 258 241 250 252 261
225 228 234 222 229 230 197 200 205 174 115 177
t 3rd Qr) (IstQr) (3rd Qr) 263 269 270 259 261 264 271 282 285
233 238 207 176
ClstQr) 272 266 287
238 237 207 181
(3rd Qr) 271 267 295
243 238 210 180
(1st Qr)
247 240 214 184
(IstQr)
301 284 320
248 240 213 183 (3rdQr)
301 291 325
336 319 330
222 232 230
(4th Qr)
221 232 228
(2nd Qr)
231 224 220 219 (-June)
233 248 235
(4th Qr)
241 255 252 269 238 255
(2nd Qr) (4th Qr) 256 261 246 252 240 247 240 240 (-June) (-Dec.)
2.58 272 260
(2nd Qr) 275 269 259 249 (-June)
206 194 192 224
268 281 269 (4th Qrt
277 269 263 256 (-Dec.)
281 287 281
(2nd Qr) 213 209 210 208 -Dec. )
236 228 225 223 (-Dec.)
295 28.5 276 269 (-June)
312 329 308 345 306 337
(4th Qr) WdQr) 298 313 289 302 282 294 283 300 (-Dec. ) (-June)
350 357 368
(4th Qr) 319 306 300 312 (-Dec.)
224 201 198 240
358 366 379
(2ndQr) 335 322 315 328 (-June)
186 177 194 197 202 182 179 187 189 189 181 176 184 186 190 205 201 213 219 223
209 213 216 219 198 200 203 202 194 192 196 197 225 227 233 237
223 198 203 244
372 Non-ferrous metal basic industries. 38 1 Manufacture of fabricated metal products, excl. machinery. 382 Manufacture of machinery excl. electrical. 383 Manufacture of electrical machinery. 5 Construction.

TA
BL
E 4
Indi
ces
of a
vera
ge
hour
ly l
abou
r co
sts
of a
dult
man
uala
wor
kers
in
sel
ecte
d in
dust
ries
(
1974
= 1
00)
Cou
ntry
IS
ICb
1974
19
75
1976
19
77
1978
19
79
1980
19
81
1982
19
83
1984
19
85
1986
19
87
1988
Loc
al c
urre
ncy
Apr
. O
tt A
pr.
Bel
gium
35
1 B
.Fr.
26
7.3
120
133
149
155
169
187
205
217
230
235
243
245
249
249
255
371
287.
1 11
0 12
6 13
7 14
5 16
6 18
0 19
8 21
6 22
0 22
6 25
0 25
1 25
4 25
4 25
0 38
2 22
7.7
116
128
140
148
160
173
194
208
221
228
233
237
241
241
249
5 25
5.0
119
136
150
155
172
187
203
216
222
231
235
238
244
244
244
Den
mar
k 35
112
D.K
r.
32.2
8 11
6 13
1 14
5 16
3 18
0 19
2 21
7 24
5 26
4 28
3 29
4 29
9 33
6 33
6 37
7 ( 3
rd Q
uart
er
3821
3 33
.50
119
128
140
157
174
190
212
238
255
274
284
292
312
320
353
of e
ach
year
) 5
Fran
ce
351
371
382
5
34.4
2 11
4 12
8 14
3 15
9 17
9 19
6 21
2 24
6 26
5 28
5 30
4 32
0 35
0 35
5 36
4
F.Fr
. 20
.43
22.2
5 18
.99
17.2
4
126
143
160
188
209
242
276
321
355
384
408
423
429
127
144
162
182
205
239
270
319
347
365
393
402
411
118
138
156
172
193
232
260
301
330
348
373
387
398
115
136
154
172
195
227
265
301
338
356
378
392
404
108
120
130
133
136
145
154
162
168
174
180
189
191
109
118
126
131
139
149
157
164
171
174
182
192
195
109
116
126
133
140
152
159
166
172
177
187
196
198
104
112
120
128
139
151
157
164
170
174
177
181
186
126
166
196
240
303
365
435
509
579
645
703
742
782
130
161
192
214
264
324
402
468
537
590
651
674
722
127
162
194
220
272
333
414
482
556
617
677
706
754
125
159
190
233
283
334
420
508
574
632
693
274
751
433
442
416
422
40.5
41
2 41
1 42
0
W.
Ger
man
y 35
1
DM
18
.18
371
17.0
9 38
2 16
.32
5 15
.30
193
198
199
205
202
209
187
192
Ital
y 3.
51
Lir
e 29
27
371
3084
38
2 26
77
5 23
34
799
775
736
812
769
837
765
817
Net
herl
ands
35
1 G
uild
er
17.2
8 11
6 12
4 13
7 14
3 15
0 15
8 16
4 17
5 18
0 19
5 19
7 20
2 20
2 20
3 20
4 37
19
.53
110
122
133
141
151
156
164
175
178
183
185
188
190
192
193
382
16.3
8 11
4 12
2 13
4 14
1 14
5 15
5 16
2 17
4 17
5 17
9 18
2 18
4 18
6 18
7 18
8 5
17.2
7 11
5 12
4 13
9 15
0 16
3 17
2 18
2 19
2 19
0 19
1 19
3 20
0 20
4 20
4 20
5

U.K
.
Aus
tral
ia’
Can
ada
Japa
n (A
nnua
l av
erag
es)
Nor
way
(3
rd Q
uart
er
of e
ach
year
)
Swed
en
(4th
Qua
rter
of
eac
h ye
ar)
U.S
.A.
3511
2 Po
und
371
382
5 3511
213
A.$
37
38
1121
3 5 35
1/2
Can
.$
3711
2 38
2 5 35
1/2
Yen
37
1 38
2 5 35
1/2
N.K
r.
382
5 35
SW
.KI.
371
382
5 351
U.S
.%
371
382
5
1.60
12
9 14
3 15
3 17
8 21
4 25
4 29
2 31
3 34
7 37
6 1.
24
157
181
194
231
265
312
356
389
452
501
1.41
12
6 14
2 15
7 18
0 21
4 25
2 28
0 30
5 32
9 35
2 1.
30
129
143
155
172
200
246
278
295
325
345
4.81
11
3 12
9 14
1 15
2 17
6 19
8 21
9 25
8 27
8 28
7 4.
74
112
129
145
153
168
195
222
260
281
293
4.34
10
8 12
3 13
6 14
5 16
0 18
0 21
3 25
5 28
1 28
1 4.
51
112
129
142
152
164
184
224
262
276
313
5.93
11
3 I2
8 14
0 15
0 16
1 18
6 21
8 24
1 25
7 27
1 6.
79
118
133
150
165
182
199
237
269
286
301
6.21
11
6 12
7 13
9 14
9 16
8 18
3 21
3 23
2 24
2 25
2 7.
99
120
134
151
157
174
192
223
244
219
220
1295
11
3 12
3 13
4 14
4 15
9 17
1 18
1 19
6 20
8 21
6 13
06
121
131
144
151
159
172
187
196
207
207
1092
11
3 12
3 13
5 14
3 15
5 16
7 17
8 19
0 19
8 20
2 83
9 11
7 13
3 15
1 16
4 17
8 18
9 20
7 21
6 23
4 23
8
30.9
7 11
4 13
9 15
5 16
7 16
5 18
8 20
2 22
7 24
1 26
2 32
.75
120
142
157
171
176
201
214
237
255
277
35.1
0 11
8 13
8 15
4 16
8 17
4 19
2 20
7 23
5 24
2 26
3
26.0
9 12
6 14
6 16
1 17
4 19
2 21
7 23
7 24
9 27
8 29
4 30
.31
123
138
148
162
176
205
218
235
256
278
27.5
1 12
2 13
8 15
4 16
7 18
4 20
6 22
3 24
4 26
3 29
1 30
.76
123
141
162
175
192
219
241
251
268
284
7.51
11
2 12
5 13
6 14
5 15
7 17
2 19
8 21
2 23
0 24
6 7.
61
112
123
138
152
168
197
226
252
267
263
6.82
10
8 11
5 12
6 13
6 14
9 16
6 18
2 18
8 20
3 21
3 8.
95
108
114
122
129
140
151
166
177
188
190
409
439
468
544
558
626
391
419
437
372
404
425
319
325
337
321
344
352
306
329
340
337
349
358
283
297
305
319
322
330
258
265
270
225
230
242
225
233
235
219
224
223
209
211
212
242
251
255
278
325
348’
29
1 32
1 36
4’
280
322
360’
339
370
390*
31
2 34
1 35
8d
320
331
346d
31
4 35
0 36
6d
260
264
270
272
286
287,
22
4 22
8 23
1 20
0 20
7 20
6
480
491
641
673
451
473
431
456
337
348
357
363
350
361
364
376
307
316
333
344
275
280
240
247
241
240
221
219
213
219
259
263
370
384’
37
8 39
2”
393
410
398
420d
37
1 37
9d
366
388d
39
4 40
7*
275
274
290
290
234
234
210
211
Indi
ces
appl
y at
Oct
ober
of
eac
h ye
ar u
nles
s ot
herw
ise
stat
ed.
a an
d ?G
ee T
able
3.
‘Fir
st Q
uart
er.
dSec
ond
Qua
rter
. ‘F
rom
19
83 o
nwar
ds,
indi
ces
appl
y to
May
and
Nov
embe
r.

fri
0
TA
BL
E 5
Cur
renc
y ex
chan
ge
rate
sa r
elat
ive
to U
.S.
Dol
lar
Aus
tral
ia
Bel
gium
C
anad
a D
enm
ark
Fran
ce
W.
Ger
man
y It
aly
Japa
n N
ethe
rlan
ds
Nor
way
Sw
eden
U
.K.
A.%
B
Fr.
Can
.%
Kro
ne
F.Fr
. D
M.
Lir
a
1974
0.
694
39.5
0.
981
6.13
4.
77
2.62
63
6 19
75
0.76
0 36
.5
1.01
5.
68
4.29
2.
44
649
1976
0.
802
39.0
0.
987
6.07
4.
71
2.51
80
3 19
77
0.90
5 35
.8
1.05
5.
94
4.94
2.
34
880
1978
0.
871
31.9
1.
16
5.48
4.
53
2.03
85
7 19
79
0.88
7 28
.7
1.17
5.
16
4.21
1.
82
824
1980
0.
863
29.1
1.
17
5.60
4.
19
1.85
87
6 19
81
0.86
9 36
.4
1.19
6.
97
5.30
2.
21
1127
19
82
0.97
7 44
.5
1.24
8.
24
6.52
2.
40
1337
19
83
1.11
50
.4
1.23
9.
10
7.60
2.
54
1514
19
84
1.15
58
.3
1.30
10
.4
8.81
2.
88
1768
19
85
1.42
58
.2
I.36
i0
.4
8.8f
2.
88
1866
19
86
1.49
44
.7
1.39
8.
10
6.92
2.
18
1496
19
87
1.42
37
.4
1.32
6.
85
6.00
1.
80
1290
1988
Ja
n. 4
1.
39
33.3
1.
30
6.11
5.
38
1.59
11
72
Mar
. 31
1.
35
34.7
1.
23
0.36
5.
62
1.66
12
28
Jul.
1 1.
27
38.1
1.
22
6.90
6.
13
1.82
13
51
Oct
. 3
1.27
39
.1
1.21
7.
15
6.31
1.
86
1387
1989
Ja
n. 3
1.
15
36.9
1.
19
6.82
6.
02
1.76
12
97
Yen
G
uild
er
Kro
ne
Kr6
na
Poun
d
285
2.72
5.
56
4.47
0.
424
298
2.62
5.
18
4.11
0.
448
298
2.67
4.
98
4.38
0.
545
275
2.45
5.
30
4.38
0.
579
215
2.19
5.
25
4.56
0.
527
213
1.99
5.
01
4.26
0.
472
217
2.01
4.
96
4.24
0.
426
219
2.44
5.
66
5.04
0.
49 1
24
4 2.
65
6.41
6.
22
0.57
2 23
5 2.
85
7.31
7.
65
0.66
3 23
9 3.
24
8.24
8.
33
0.76
3 23
3 3.
25
8.46
8.
47
0.77
1 17
0 2.
45
7.36
7.
13
0.67
6 14
4 2.
03
6.77
6.
34
0.61
3
123
1.79
6.
22
5.79
0.
534
124
1.86
6.
24
5.87
0.
530
134
2.05
6.
66
6.29
0.
588
137
2.10
6.
89
6.39
0.
589
123
1.99
6.
50
6.08
0.
549
*Ann
ual
rate
s ar
e av
erag
es
of r
ates
on
the
firs
t tr
adin
g da
y in
eac
h of
the
fou
r qu
arte
rs
in t
he y
ear
and
of t
he f
irst
qua
rter
in
the
fol
low
ing
year
.

by 4.7% on average, compared with 4.9% in the preceding twelve months. However, the indi- vidual increases show a narrower spread than in the earlier period. Apart from The Nether- lands with an increase of 0.7% in the year, the other countries ranged from around 3% in Bel- gium, France, West Germany and Japan to about 8% in Norway and Sweden. Canada at 5.1% and the U.S.A. at 7.3% were each higher than usual mainly because of large increases in steel prices. The basic price of steel plate in the U.S.A. fell dramatically early in 1986 but is now back almost to the same level as before the fall.
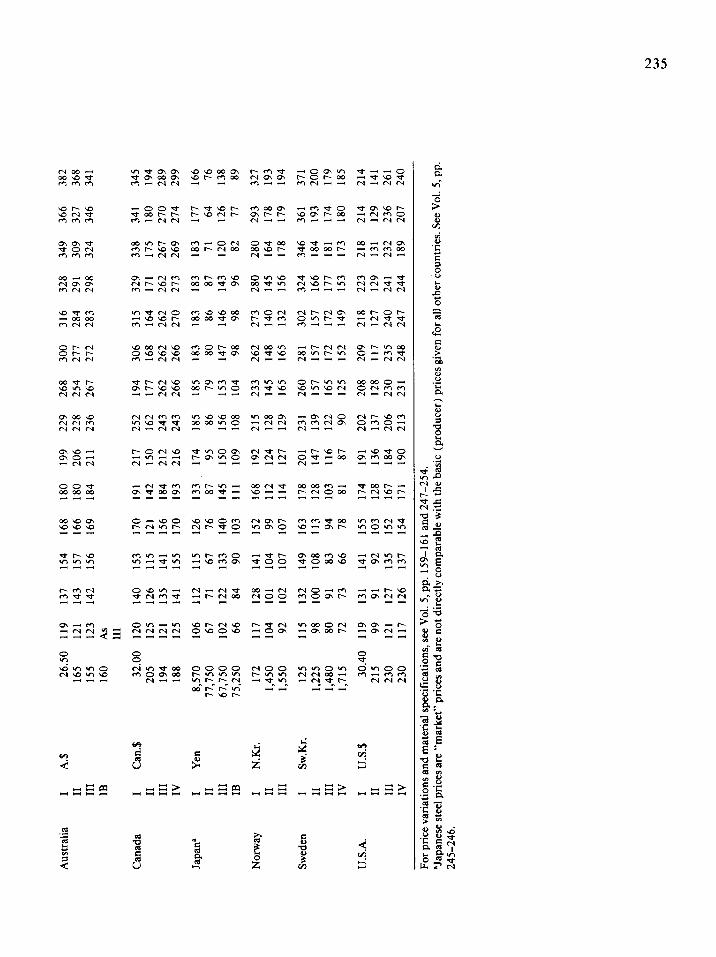
Most countries had increases in basic, i.e. producer, steel prices in the twelve months to July 1, 1988 (Table 2). In Japan ‘market’ prices of steel products also rose although there were indications that producer prices were falling. Since it imports most of its fuel and raw materials, Japan can be expected to benefit from lowered import prices arising from the current high value of its currency. This advan- tage is reflected in the reduction of Japanese cement prices, as against increases in most other countries.
Average hourly earnings (Table 3 ) show general increases in the twelve months to April, 1988. Apart from The Netherlands with in-
TABLE 6
241
creases of 0.5% for the four selected industries, the increases ranged from about 2% to 12%. Denmark, Norway and Sweden continue to show large increases with the result that their hourly labour costs, particularly in the con- struction industry, compare very unfavoura- bly with these in other countries (Table 8),
CURRENCIES
From Table 5 it will be seen that from April 1, 1987 to March 31, 1988 the U.S. dollar de- preciated against each of the twelve currencies listed. The average fall was 8.6% with most countries in the 7% to 10% range, apart from Australia, Canada and Italy with about 5-6% and Japan and the U.K. at about 15%. The U.S. dollar recovered in the second half of 1988 against the other currencies except the Austra- lian and Canadian dollars.
INTERNATIONAL COMPARISON OF ERECTED COSTS
As was to be expected in light of the contin- uing depreciation of the U.S. dollar, the costs of erecting plants in the various contries (Ta- ble 6) relative to those in the U.S.A. were all
Comparison of erected costs of plants with U.S.A. = 1 .O, as at January 1st unless otherwise stated
1976 1977 1978 1979 1980 1981 1982 1983 1984 1985 1986 1987 1987 1988 1988 July 1 July 1
Belgium 1.00 1.01 1.10 1.18 1.36 1.21 0.92 0.81 0.72 0.60 0.68 0.92 1.03 1.00 1.05
Denmark 1.01 0.98 0.98 1.10 1.13 1.05 0.80 0.76 0.72 0.62 0.71 0.98 1.15 1.12 1.23
France 0.93 0.89 0.87 0.96 1.02 1.04 0.82 0.75 0.68 0.58 0.67 0.90 0.99 0.98 1.02
W.Germany 0.98 0.99 1.02 1.12 1.20 1.13 0.88 0.85 0.76 0.64 0.73 1.01 1.12 1.09 1.18
Italy 0.88 0.81 0.82 0.91 1.01 1.01 0.78 0.79 0.74 0.65 0.72 1.00 1.11 1.07 1.14
Netherlands 1.05 1.05 1.12 1.13 1.18 1.12 0.82 0.82 0.73 0.61 0.69 0.96 1.06 1.04 1.10
U.K. 0.81 0.70 0.72 0.80 0.94 1.08 0.86 0.79 0.68 0.59 0.70 0.81R 0.90 0.92 1.03
Australia 0.89 0.94 0.85 0.87 0.84 0.90 0.89 0.86 0.80 0.76 0.67 0.68 0.78 0.77 0.79
Canada 0.95 1.05 0.98 0.87 0.90 0.90 0.92 0.92 0.86 0.81 0.76 0.80 0.85 0.84 0.89
Japan 0.55 0.59 0.65 0.82 0.79 0.77 0.73 0.60 0.62 0.58 0.65 0.94 0.96 0.99 1.11
Norway 1.16 1.28 1.25 1.29 .31 1.32 1.07 1.00 0.92 0.82 0.89 1.15 1.28 1.37 1.45
Sweden 1.18 1.24 1.13 1.19 1.26 1.29 0.99 0.90 0.76 0.70 0.79 1.03 1.14 1.16 1.26 U.S.A. 1.0 +

242
TABLE 7
Comparison of prices, with U.S.A. = 1 .O, for:
I Ordinary Portland cement
II Steel re-inforcing bar
III Steel sections (heavy)
IV Steel plate
1975 1976 1977 1978 1979 1980 1981 1982 1983 1984 1985 1986 1987 1988
1 st half 2nd half 1 st half
Belgium
Denmark
France
W. Germany
Netherlands
U.K.
Australia
Canada
Japan
Norway
Sweden
1 0.78 0.77 0.84 0.88 0.91 0.92 0.77 0.77 0.72 0.57 0.63 0.92 1.03 II 1.11 1.02 1.24 1.17 1.08 1.15 1.08 1.08 I .06 0.73 0.82 1.18 1.32 III 0.87 0.88 0.96 0.90 1.02 0.93 0.72 0.72 0.59 0.47 0.49 0.67 0.70 IV 1.10 0.87 0.94 0.86 0.94 0.90 0.66 0.66 0.63 0.50 0.54 0.95 1.03
I I .07 0.92 0.91 0.95 0.93 1.05 0.90 0.77 0.82 0.59 0.65 0.91 1 .oo II 1.26 1.18 1.32 1.16 1.05 1.15 0.93 1.03 1.05 0.85 0.88 1.19 1.32 IV 1.03 0.84 0.85 0.88 0.87 0.82 0.62 0.65 0.64 0.49 0.52 0.93 1.07
I 0.86 0.84 0.77 0.83 0.93 1.01 0.88 0.80 0.73 0.59 0.64 0.91 1.00 II 1.13 1.16 1.16 1.25 1.05 1.19 0.98 1.01 0.84 0.73 0.77 1.19 1.31 III 0.87 0.85 0.83 0.92 0.92 0.92 0.70 0.68 0.54 0.44 0.47 0.65 0.70 IV 1.29 1.09 0.89 0.87 0.88 0.87 0.65 0.69 0.62 0.52 0.54 1.00 1.05
I 0.83 0.74 0.77 0.83 0.84 0.82 0.72 0.74 0.73 0.59 0.63 0.93 1.03 II 1.14 1.13 1.17 1.20 1.06 1.08 0.90 1.10 0.88 0.73 0.79 1.17 1.31 III 0.98 0.94 0.93 0.90 0.98 0.86 0.69 0.82 0.62 0.47 0.54 0.68 0.70 IV 1.06 0.94 0.91 0.87 0.93 0.87 0.73 0.73 0.63 0.53 0.57 0.98 1.04
I 0.61 0.51 0.53 0.56 0.64 0.68 0.61 0.59 0.57 0.48 0.49 0.74 0.79 II 0.98 0.95 1.09 1.12 I .08 1.03 0.78 0.76 0.75 0.73 0.73 0.71 0.83 III 0.89 0.83 0.86 0.88 0.91 0.86 0.61 0.65 0.57 0.50 0.50 0.71 0.74 IV 1.19 0.96 0.87 0.85 0.90 0.87 0.65 0.67 0.63 0.57 0.57 1.01 1.04
I 0.88 0.83 0.88 0.92 0.92 0.90 0.79 0.76 0.72 0.61 0.64 0.97 1.08 II 1.06 1.09 1.26 1.16 1.06 1.20 0.98 1.14 0.93 0.66 0.80 1.20 1.25 IV 1.24 1.13 1.13 0.86 0.88 0.81 0.62 0.68 0.61 0.52 0.55 1.02 I .09
I 0.78 0.72 0.75 0.84 1 .oo 1.30 1.21 1.10 0.95 0.74 0.78 0.95 1.00 II 1.11 1.22 1.20 1.17 1.13 1.41 1.22 1.23 1.17 0.90 1.03 1.13 1.16 III 0.98 0.89 0.89 0.89 1.17 1.23 1.07 0.83 0.70 0.58 0.65 0.83 0.87 IV 1.05 0.85 0.81 0.86 0.91 0.96 0.74 0.68 0.59 0.49 0.54 0.86 0.88
I 1.14 1.13 1.05 1.08 1.02 1.06 1.14 1.15 1.12 1.06 0.90 0.93 1.06 II 1.23 1.50 1.45 1.42 1.23 1.35 1.47 1.56 1.64 1.41 1.21 1.20 1.41 III 0.90 0.94 0.86 0.86 0.84 0.90 0.89 0.80 0.70 0.67 0.59 0.63 0.70 IV 0.96 0.98 0.88 0.88 0.84 0.90 0.88 0.82 0.68 0.67 0.60 0.79 0.87
I 1.04 1.13 1.09 0.99 0.99 1.02 1.10 1.20 1.25 1.15 1.15 1.19 1.25 II 1.19 1.34 1.14 0.97 0.90 0.92 0.95 1.06 1.11 0.88 0.93 0.93 0.98 III 0.83 0.91 0.84 0.75 0.79 0.83 0.84 0.78 0.76 0.69 0.68 0.70 0.72 IV 0.86 0.93 0.88 0.78 0.79 0.79 0.78 0.76 0.71 0.68 0.68 0.83 0.84
I 0.84 0.81 0.84 1.06 1.02 1.19 1.18 1.03 1.05 0.96 0.98 1.52 1.58 IV 0.75 0.83 0.92 1.14 1.04 0.98 0.91 0.73 0.73 0.70 0.74 1.41 1.37
I 1.07 1.11 1.07 1.05 1.09 1.15 1.07 0.99 0.97 0.81 0.84 0.97 1.11 II 1.37 1.50 1.43 1.22 1.17 1.24 1.12 1.19 1.16 0.85 0.89 1.19 1.33 III 0.99 1.08 1.01 0.90 0.92 0.94 0.75 0.76 0.65 0.43 0.51 0.72 0.74
I 0.99 0.96 1 .oo 0.95 0.99 1.05 0.93 0.83 0.74 0.66 0.7 1 0.96 1.05 II 1.37 1.43 1.52 1.37 1.33 1.45 1.14 1.12 1.00 0.82 0.87 1.19 1.30 III 1.04 1.05 0.91 0.87 0.93 0.95 0.75 0.74 0.62 0.53 0.56 0.74 0.74 IV 1.11 0.98 0.80 0.83 0.83 0.80 0.63 0.65 0.60 0.52 0.56 1 .oo 1.05
1.10 1.15
1.37 1.30
0.72 0.68
0.98 0.92
1.10
1.39 0.99
1.14
1.35
0.95
1.13 1.16
1.37 1.34
0.71 0.67
0.98 0.92
1.09 1.03
1.34 1.23
0.69 0.61
0.98 0.85
0.83~
0.9op
0.72~
0.95p
1.14
1.32
1.03
0.86
0.90
0.60 0.78
1.21
1.29
0.98
1.22 1.14
1.28 1.47
0.92 0.77
0.84 0.86
1.08 1.17
1.39 1.50
0.71 0.66
0.81 0.74
1.28 1.40
1.03 1.08 0.74 0.77
0.79 0.84
1.64 1.72
1.29 1.26
1.20 1.36
1.43 1.45
0.78 0.78
1.13 1.19
1.39 1.35
0.76 0.74
0.99 0.96
See footnotes in Table 2.

243
TABLE 8
Comparison of hourly labour costs, with U.S.A. = 1 .O
ISIC” 1975 1976 1977 1978 1979 1980 1981 1982 1983 1984 1985 1986 1987 1988
Apr. Oct. Apr.
Belgium 351 0.97 1.01 1.10 1.29 1.36 1.28 0.97 0.74 0.67 0.55 0.62 0.79 0.87 0.84 0.96
371 0.94 1.03 I .05 1.18 1.33 1.00 0.87 0.66 0.68 0.51 0.65 0.79 0.89 0.86 0.94
382 0.91 0.99 1.04 1.19 I .28 1.18 0.91 0.76 0.68 0.58 0.65 0.83 0.93 0.90 1.02
5 0.80 0.90 0.98 1.16 1.24 1.21 0.93 0.7 1 0.64 0.56 0.62 0.78 0.89 0.86 0.95
Denmark 35112 0.73 0.77 0.75 0.90 0.97 0.89 0.63 0.56 0.52 0.44 0.50 0.64 0.78b 0.74 0.93b
(3rd Qr) 382/3 0.89 0.90 0.89 1.06 1.13 1.01 0.76 0.70 0.65 0.55 0.65 0.82 0.97b 0.95 1.16b
5 0.67 0.73 0.74 0.89 0.97 0.90 0.65 0.59 0.57 0.51 0.61 0.78 0.95b 0.92 1.04b
France 351 0.69 0.63 0.66 0.80 0.89 0.91 0.68 0.58 0.53 0.45 0.53 0.66 0.72 0.70 0.78
371 0.74 0.67 0.70 0.80 0.83 0.85 0.63 0.52 0.54 0.43 0.52 0.62 0.69 0.68 0.76
382 0.68 0.68 0.71 0.81 0.89 0.89 0.73 0.63 0.57 0.49 0.58 0.71 0.80 0.78 0.87
5 0.46 0.47 0.50 0.59 0.74 0.69 0.55 0.46 0.43 0.39 0.45 0.55 0.62 0.61 0.68
W. Germany 35 I 0.90 0.95 1.01 1.15 1.23 1.12 0.81 0.74 0.67 0.56 0.63 0.86 0.94 0.92 1.05
Italy
Netherlands
U.K.
Australia
Canada
Japan (Annual averages)
Norway
WdQr)
Sweden
(4th Qr)
371 0.83 0.88 0.89 1 .oo 1.07 0.94 0.68 0.58 0.62 0.49 0.57 0.74 0.84 0.83 0.96
382 0.92 0.99 1.05 1.21 1.30 1.21 0.90 0.84 0.77 0.65 0.75 I .02 1.13 1.12 1.28
5 0.63 0.69 0.74 0.88 1.02 0.94 0.70 0.63 0.59 0.51 0.57 0.74 0.85 0.82 0.93
351 0.64 0.6 I 0.64 0.81 0.94 0.96 0.68 0.66 0.62 0.53 0.59 0.78R 0.87 0.85 0.90
371 0.69 0.63 0.64 0.71 0.80 0.78 0.57 0.53 0.58 0.48 0.54 0.69R 0.79 0.77 0.92
382 0.67 0.65 0.69 0.78 0.90 0.92 0.71 0.71 0.68 0.59 0.66 0.87R 0.99 0.97 1.14
5 0.44 0.43 0.46 0.57 0.72 0.67 0.53 0.53 0.50 0.46 0.50 0.65 0.73 0.71 0.82
351 0.89 0.89 0.95 I .08 1.14 1.06 0.69 0.69 0.61 0.53 0.58 0.77 0.84 0.82 0.92
37 0.95 0.99 1.01 1.13 1.26 1.04 0.67 0.64 0.65 0.52 0.59 0.74 0.82 0.81 0.92
382 0.94 0.99 1.05 1.18 1.33 1.22 0.77 0.80 0.71 -.59 0.65 0.85 0.94 0.92 1.04
5 0.77 0.81 0.9 1 1.07 1.20 1.11 0.86 0.76 0.68 0.57 0.62 0.82 0.93 0.90 1.01
35112 0.50 0.41 0.42 0.51 0.64 0.75 0.58 0.53 0.48 0.40 0.47 0.51 0.59 0.60 0.72
371 0.46 0.40 0.41 0.49 0.56 0.62 0.17 0.43 0.43 0.39 0.46 0.46 0.57 0.58 0.71
382 0.49 0.43 0.46 0.54 0.65 0.75 0.58 0.57 0.50 0.42 0.51 0.55 0.63 0.64 0.79
5 0.36 0.31 0.33 0.38 0.45 0.57 0.45 0.41 0.37 0.33 0.38 0.41 0.48 0.48 0.59
3511213 0.81 0.82 0.74 0.78 0.81 0.85 0.8 1 0.71 0.69 0.62 0.56 0.50 0.56 0.55 0.60
37 0.78 0.8 1 0.73 0.73 0.70 0.70 0.67 0.61 0.59 0.59 0.52 0.47 0.54 0.54 0.58
381/2/3 0.81 0.86 0.77 0.78 0.77 0.82 0.79 0.81 0.79 0.73 0.62 0.58 0.66 0.67 0.73
5 0.66 0.71 0.65 0.69 0.67 0.72 0.72 0.68 0.68 0.64 0.60 0.53 0.62 0.61 0.67
351/2 0.77 0.83 0.75 0.69 0.72 0.73 0.72 0.72 0.72 0.67 0.63 0.64 0.68 0.67 0.74
37112 0.91 0.99 0.90 0.81 0.84 0.77 0.77 0.77 0.87 0.79 0.76 0.72 0.78 0.78 0.86
382 0.95 1.04 0.94 0.84 0.89 0.86 0.88 0.91 0.88 0.83 0.76 0.76 0.8 1 0.82 0.88
5 0.96 1.08 1.03 0.91 1.04 0.97 0.99 0.99 0.85 0.79 0.73 0.71 0.80 0.80 0.85
35112 0.58 0.57 0.62 0.80 0.82 0.79 0.72 0.59 0.66 0.62 0.70 0.99 1.00 1.03 1.22
371 0.62 0.61 0.65 0.79 0.76 0.69 0.65 0.50 0.63 0.55 0.65 0.87 0.89 0.89 1.04
382 0.56 0.57 0.63 0.78 0.79 0.74 0.72 0.60 0.66 0.62 0.70 0.96 0.98 0.99 1.20
5 0.34 0.37 0.42 0.56 0.58 0.54 0.53 0.42 0.48 0.48 0.53 0.74 0.77 0.79 0.94
35112 0.75 0.86 0.86 0.93 0.89 0.93 0.71 0.64 0.59 0.50 0.56 0.71 0.75b 0.82 0.93b
382 0.95 1.12 1.09 1.17 1.17 1.20 0.96 0.87 0.82 0.71 0.79 0.94 1.07b 1.15 1.29b
5 0.76 0.89 0.90 1 .oo 1.10 1.02 0.83 0.75 0.69 0.62 0.72 0.85 0.97b 1.09 1.22b
35 0.88 0.95 0.86 0.95 1.03 I .05 0.74 0.65 0.54 0.48 0.57 0.70 0.79’ 0.78 0.91’
371 0.98 1.05 0.88 0.96 1.01 1.00 0.69 0.59 0.49 0.49 0.57 0.69 0.78’ 0.79 0.89’
382 I .02 1.13 1.02 1.12 1.21 1.21 0.88 0.84 0.64 0.64 0.72 0.85 0.95’ 0.98 1.14c
5 0.88 0.99 0.95 1.06 1.14 1.20 0.89 0.78 0.59 0.59 0.67 0.84 0.96’ 1.00 1.13c
Indices apply at October of each year unless otherwise stated. Yntemational Standard Industrial Classifications: See footnote in Table 3. bFirst quarter. ‘Second quarter.

244
higher at July 1, 1988 than they had been for several years. The extent of the annual rise for each country depended on the extent to which its domestic cost rose compared with that in the U.S.A. For The Netherlands the rise in rel- ative costs to July 1, 1988 was about 4% al- though its currency had appreciated by about 10% relative to the U.S. dollar. However much of this was offset by the small rise of under 1% in its domestic erected cost compared with 7% in the U.S.A. All the other countries listed, ex- cept Norway and Sweden, were able to offset to some extent the effect of the depreciation of the U.S. dollar.
FUTURE OUTLOOK
For most countries the probabilities are that present inflation trends will continue for some time. Belgium, West Germany, Japan and The Netherlands are likely to continue to have rates in the range 0-3Otb per annum. At the other end of the scale Denmark, Norway and Sweden are likely to have increases of about 8% p.a. in the immediate future. Wage rates in the Scandi- navian countries are still rising at above aver- age rates and may not yet be fully absorbed in prices. Of the other countries France has had a
reducing rate of inflation for several years and could well drop to below 3%. Italy, U.K. and Canada are currently on an upward trend and the first two are likely to increase further in the next year or two to around the 56% range. Canada, like the U.S.A., has had an unexpect- edly large increase in recent months and both should show some improvement in the near future to around 4% p.a.
Because of the appreciation of the U.S. dol- lar throu~out 1988 the comparison of erected costs of plants against those in the U.S.A. at January 1, 1989 will show most countries in a more favourable light than does Table 6 at July 1, 1988. The two exceptions to this are Aus- tralia and Canada whose currencies have de- preciated slightly against the U.S. dollar. The effect of these currency changes will be to re- duce the comparative figures for the EEC countries, excluding the U.K., by about lo%, for the U.K., Norway, Sweden and Japan by up to 8% and to increase those for Australia and Canada by about 6% and 2%, respectively.
REFERENCE
OECD, Main Economic Indicators.