Cost and price indices
12
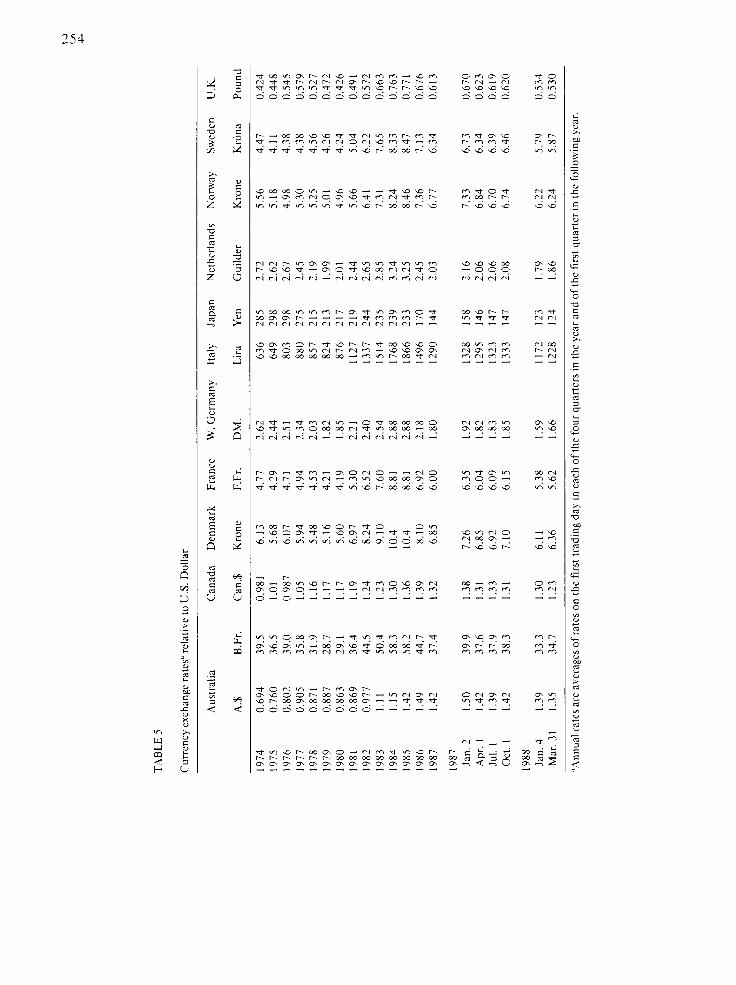
Eng~nec,rin~(‘osisarldProductlon Econornrcs, 14 (1988) 247-258 Elsevicr Science Publishers B.V.. Amsterdam - Printed in The Netherlands 247 COST AND PRICE INDICES Norman Boyd INTRODUCTION The indices of erected costs of plants as at January 1, 1988 (Table 1 ) reflect an average increase in 1987 for the thirteen countries of 5. lo/o. This compares with 3.4% in 1985 and 4.5% in 1986. In general the increases were due to increased labour costs, particularly in man- ufacture. Steel prices, which provide the bulk of the materials element in the indices, were relatively unchanged from the previous year. Between the second half of 1986 and the cor- responding period in 1987 the U.S. dollar de- preciated against the currencies of each of the other twelve countries. This has led to higher comparative erected costs of plants in all these countries relative to the U.S.A. (Table6 ). ERECTED COSTS OF PLANTS As stated above the average increase in the indices of erected costs between January 1, 1987 and January 1, 1988 is 5.1%. Following the pattern of recent years the increases for Belgium, West Germany, the Netherlands and Japan are low, in the order of l-2%. Canada has risen slightly to about 3% while France im- proved slightly to 3.5%. Italy, the U.K., Aus- tralia and the U.S.A. have approximately the average increase. For the U.S.A. the main rea- son for the increase lies in the price rise of steel plate. the price of which fell dramatically at the beginning of 1986 but recovered significantly in the second half of 1987. The Scandinavian countries, Denmark, Norway and Sweden all TABLE I Indices of erected costs of plants’ as at Januaq I St. unless otherwse stated ( I975 = I .OO) 1976 1977 1978 1979 1980 1981 1982 1983 1984 1985 1986 1987 1987 1988 July I B&gum Denmark France W. German> Italk Netherlands 1J.K. Australia Canada Japan NOWI) Sweden lJ.S.4. I .09 1.16 1.27 1.29 I .40 1.50 1.64 1.89 1.99 2.01 2.06 2.07 7.10 2.10 I .02 1.06 I.16 1.27 1.38 1.54 1.64 1.99 2.14 2.19 2.32 2.41 2.59 7.63 I.13 1.25 1.34 1.46 1.59 1.82 2.05 2.50 2.73 2.84 2.97 3.10 3.17 3.21 1.03 1.07 I.11 I.14 I.21 1.29 1.38 1.53 1.52 I.56 1.60 I.60 I.61 I.62 1.19 1.43 I .67 1.92 3.27 2.67 3.15 3.89 4.38 4.71 5.12 5.31 5.53 5.60 I .09 I.14 1.22 I.18 1.24 I.31 1.42 I.54 1.54 1.57 I.59 1.63 I.61 1.65 1.30 1.45 I.61 1.76 2.04 2.35 2.56 2.78 2.92 3. IO 3.34 3.56 3.67 3.75 I.15 1.33 I .46 I.57 I.71 1.93 2. I5 2.58 2.77 2.91 3. I5 3.36 3.45 3.55 I.20 I.33 I .46 1.56 I.76 1.95 2.24 2.46 2.42 2.47 2.52 2.57 2.61 2.65 I.1 I I.26 1.39 I.50 1.58 1.70 1.79 1.84 I.84 1.84 1.89 1.87 1.86 I .90 I.10 I.22 I.35 1.45 I.53 1.69 1.79 2.07 2.18 2.28 2.4 2.73 2.99 3. I6 1.05 I.16 1.24 1.37 I .49 1.67 I.81 2.05 2.26 2.37 2.57 2.77 2.89 3.00 I.1 I 1.18 1.27 1.39 1.53 1.68 1.85 1.96 2.09 2.13 2.19 2.10 2.12 2.20 ,‘For method used to calculate costs and indlces see Eng. Costs Prod. Econ.. 6 ( 1982 ) 272 and 7 ( 1982 ) 18 0167-188X/88/$03.50 0 1988 Elsevier Science Publishers B.V.
-
Upload
norman-boyd -
Category
Documents
-
view
212 -
download
0
Transcript of Cost and price indices

Eng~nec,rin~(‘osisarldProductlon Econornrcs, 14 (1988) 247-258 Elsevicr Science Publishers B.V.. Amsterdam - Printed in The Netherlands
247
COST AND PRICE INDICES
Norman Boyd
INTRODUCTION
The indices of erected costs of plants as at January 1, 1988 (Table 1 ) reflect an average increase in 1987 for the thirteen countries of 5. lo/o. This compares with 3.4% in 1985 and 4.5% in 1986. In general the increases were due to increased labour costs, particularly in man- ufacture. Steel prices, which provide the bulk of the materials element in the indices, were relatively unchanged from the previous year.
Between the second half of 1986 and the cor- responding period in 1987 the U.S. dollar de- preciated against the currencies of each of the other twelve countries. This has led to higher comparative erected costs of plants in all these countries relative to the U.S.A. (Table6 ).
ERECTED COSTS OF PLANTS
As stated above the average increase in the indices of erected costs between January 1, 1987 and January 1, 1988 is 5.1%. Following the pattern of recent years the increases for Belgium, West Germany, the Netherlands and Japan are low, in the order of l-2%. Canada has risen slightly to about 3% while France im- proved slightly to 3.5%. Italy, the U.K., Aus- tralia and the U.S.A. have approximately the average increase. For the U.S.A. the main rea- son for the increase lies in the price rise of steel plate. the price of which fell dramatically at the beginning of 1986 but recovered significantly in the second half of 1987. The Scandinavian
countries, Denmark, Norway and Sweden all
TABLE I
Indices of erected costs of plants’ as at Januaq I St. unless otherwse stated ( I975 = I .OO)
1976 1977 1978 1979 1980 1981 1982 1983 1984 1985 1986 1987 1987 1988
July I
B&gum Denmark
France
W. German>
Italk Netherlands
1J.K.
Australia
Canada Japan NOWI) Sweden
lJ.S.4.
I .09 1.16 1.27 1.29 I .40 1.50 1.64 1.89 1.99 2.01 2.06 2.07 7.10 2.10 I .02 1.06 I.16 1.27 1.38 1.54 1.64 1.99 2.14 2.19 2.32 2.41 2.59 7.63 I.13 1.25 1.34 1.46 1.59 1.82 2.05 2.50 2.73 2.84 2.97 3.10 3.17 3.21 1.03 1.07 I.11 I.14 I.21 1.29 1.38 1.53 1.52 I.56 1.60 I.60 I.61 I.62 1.19 1.43 I .67 1.92 3.27 2.67 3.15 3.89 4.38 4.71 5.12 5.31 5.53 5.60 I .09 I.14 1.22 I.18 1.24 I.31 1.42 I.54 1.54 1.57 I.59 1.63 I.61 1.65 1.30 1.45 I.61 1.76 2.04 2.35 2.56 2.78 2.92 3. IO 3.34 3.56 3.67 3.75 I.15 1.33 I .46 I.57 I.71 1.93 2. I5 2.58 2.77 2.91 3. I5 3.36 3.45 3.55 I.20 I.33 I .46 1.56 I.76 1.95 2.24 2.46 2.42 2.47 2.52 2.57 2.61 2.65 I.1 I I.26 1.39 I.50 1.58 1.70 1.79 1.84 I.84 1.84 1.89 1.87 1.86 I .90 I.10 I.22 I.35 1.45 I.53 1.69 1.79 2.07 2.18 2.28 2.4 2.73 2.99 3. I6 1.05 I.16 1.24 1.37 I .49 1.67 I.81 2.05 2.26 2.37 2.57 2.77 2.89 3.00 I.1 I 1.18 1.27 1.39 1.53 1.68 1.85 1.96 2.09 2.13 2.19 2.10 2.12 2.20
,‘For method used to calculate costs and indlces see Eng. Costs Prod. Econ.. 6 ( 1982 ) 272 and 7 ( 1982 ) 18
0167-188X/88/$03.50 0 1988 Elsevier Science Publishers B.V.

TA
BL
E
2
l’r~
cc
indi
ces
for:
I
Ord
inar
y Po
rtla
nd
cem
ent
II
Stee
l re
-inf
orci
ng
bar
Ill
Stee
l se
ctio
ns
(hea
vy)
IV
Stee
l pl
ate
1974
(P
rice
s pe
r to
nne)
19
75
1976
19
77
1978
19
79
1980
19
81
1982
19
83
1984
19
85
I986
19
87
Loc
al
Firs
t Se
cond
A
nnua
l cu
rren
cy
half
ha
lf
aver
age
Bel
gium
I
B.F
r.
920
I12
II
Il,S
OO
75
III
9,80
0 90
IV
13.9
00
78
Den
mar
k I
D.K
r. I9
0 11
6
II
1.61
0 95
IV
1.95
0 81
Fran
ce
I F.
Fr.
120
112
II
I .08
0 96
III
I .04
0 10
0
IV
I .32
0 11
3
W.
Ger
man
y I
DM
67
11
0
II
700
85
III
640
IO5
IV
740
95
Ital
! I
Lir
e
II
Ill
IV
10,7
00
18 1
.OO
O
I53.
000
177,
000
134 75
105
118
Net
herl
ands
I
Gui
lder
70
11
9
II
780
76
IV
830
105
U.K
. 1
Poun
d 10
.5
I40
II
96.0
Il
l
III
90.0
I3
5
IV
96.0
13
2
130
I40
144
I50
168
I86
237
250
252
270
272
280
283
68
77
72
74
85
85
II5
117
105
II5
122
121
121
102
109
103
II6
117
I28
173
163
160
160
I53
I48
I48
71
76
70
76
83
86
113
129
123
127
130
I28
129
117
122
I29
133
167
203
214
232
229
242
240
239
253
87
97
88
93
117
118
146
149
I56
158
158
158
161
76
81
88
91
104
I08
147
I54
152
154
160
172
172
I31
135
I48
172
205
239
273
293
299
315
324
334
358
99
105
108
II3
136
141
I68
148
167
175
204
206
207
113
124
141
144
157
I71
227
214
219
220
226
221
221
II3
105
I06
II0
I21
127
182
203
203
204
216
219
219
110
II6
I18
I20
131
I45
167
177
177
I83
185
187
187
80
78
77
76
84
83
104
81
86
91
96
96
94
I09
106
101
108
106
II4
164
132
133
133
120
II0
104
93
91
85
91
96
I08
127
122
122
I25
122
II7
II7
152
188
210
246
321
394
468
515
549
584
625
634
642~
83
104
117
135
146
143
155
157
I78
209
186
166
177p
128
154
174
188
207
214
302
304
320
338
353
340
331~
127
136
146
165
188
203
270
308
311
339
350
345
345~
126
132
136
138
150
169
I83
I87
196
202
208
210
210
73
78
73
74
90
91
I07
78
78
93
99
92
93
I05
I05
81
83
85
89
115
119
119
I20
I22
123
123
173
205
231
277
357
405
443
443
443
449
462
462
521
136
144
142
153
183
I83
203
203
206
228
224
212
220
157
I78
183
236
248
248
279
278
285
307
321
331
332
282
I21
I48
129
246
160
I 72
346
207
221
219
187 95
107
II7
639~
”
I72p
336~
345p
210 93
123
492
216
332
I41
154
167
176
I86
186
214
214
230
240
255
260
260
260

Aus
tral
ia
Can
ada
Japa
n”
Nor
way
Swed
en
U.S
.A.
I A
.$
26.5
0 L
19
137
154
168
180
199
229
268
300
316
328
349
361
371
II 16
5 12
1 14
3 15
7 16
6 18
0 20
6 22
8 25
4 27
7 28
4 29
1 30
9 32
6 32
7 II
I 15
5 12
3 14
2 15
6 I6
9 18
4 21
1 23
6 26
7 27
2 28
3 29
8 32
4 33
8 35
4
IS
160
As
III
I C
an.$
II
III
IV
I Y
en
II
III
IB
32.0
0 12
0
205
125
194
121
188
I25
8,57
0 10
6
77,7
50
67
67,7
50
102
75,2
50
66
I N
.Kr.
172
117
II
1,45
0 10
4
III
1,55
0 92
I Sw
.Kr.
125
115
II
1,22
5 98
11
1 1,
480
80
1v
1,71
5 72
I U
.S.$
30
.40
1 19
11
215
99
III
230
121
IV
230
117
140
153
170
191
217
252
194
306
315
329
338
340
341
126
115
121
142
150
162
177
168
164
171
175
176
183
135
141
156
184
212
243
262
262
262
262
267
266
274
141
155
170
193
216
243
266
266
270
273
269
269
219
112
115
126
133
174
185
185
183
183
183
183
180
173
71
67
76
87
95
86
79
80
86
87
71
60
67
122
133
140
145
150
156
153
147
146
143
120
116
136
84
90
103
111
109
108
104
98
98
96
82
74
80
128
141
152
168
192
215
233
262
273
280
280
290
296
101
104
99
112
124
128
145
148
140
145
164
176
179
102
107
107
114
127
129
165
165
132
156
178
177
181
132
149
163
178
201
231
260
281
302
324
346
356
366
100
108
113
128
147
139
157
157
157
166
184
189
196
91
83
94
103
116
122
165
172
172
177
181
174
174
73
66
78
81
87
90
125
152
149
I53
173
178
181
131
141
155
174
191
202
208
209
218
223
218
214
214
91
92
103
128
136
137
128
117
127
129
131
128
129
I27
135
152
167
184
206
230
235
240
241
232
233
239
126
137
154
171
190
213
231
248
247
244
189
195
218
366
327
346
341
180
270
274
177 64
126 77
293
I78
179
361
193
174
180
214
129
236
207
For
pric
e va
riat
ions
an
d m
ater
ial
spec
ific
atio
ns,
see
Vol
. 5,
pp.
15
9-16
1 an
d 24
7-25
4.
“Jap
anes
e st
eel
pric
es
are
“mar
ket”
pr
ices
an
d ar
e no
t di
rect
ly
com
para
ble
with
th
e ba
sic
(pro
duce
r)
pric
es
give
n fo
r al
l ot
her
coun
trie
s.
See Vol. 5
, pp
.
245-
246.
bp =
Pro
visi
onal
.

I’ABLE 3
Ind~ccs ofa\erage hourI! carnlngs of adult manual” worker% in selcctcd mdustries ( 1974~ 100)
Bclg1um
Frallcc
M’. (;crman~
Ital!
Nclhcrlnnds
t:.E;.
(‘anada
I1.S.A.
Denmark
Norwa)
Sacden
Japan
ISIC“’
351 371 3x2 5
351 371 382 5
s51 371 3x2 5
351 371 3x2 5
351 37 387 5
35117 371 38’ 5
-
1974 lY75 1976 1977 1978 lY7Y I’)80 OCl
LOGil 02 Oct. Oct. OCl. Oct. Ott ClNC”C)
B.Fr.
F. Fr.
DM
Gulldcr
Pound
351/z/3 ‘A.$ 37 3x1/7/3
35112 (‘aId 37112 3x2
35112 N.Kr. 3x2
3s Sw.Kr. 371 382
157.25 II8 171.89 I08 I33.YJ 114 130.07 II6
12.07 I t4 II.71 I21 I I .04 I I5 10.08 II5
I I .02 106 IO.05 I05 9.89 IOX
IO.00 I 04
1486 127 1542 I24 I325 I24 1755 135
10.60 II5 10.73 IO9 9.47 I I2 9.70 II4
1.17 I28 I.16 130 1.10 I26 I .04 128
3.79 II3 3.73 II7 3.42 108 3.55 II2
3.74 II3 5.43 II6 5.13 II5 6.71 II4
5.56 I IO 5.81 110 5.09 108 6.99 106
131 147 132 I65 183 I22 I31 I37 157 I77 I25 137 I42 I56 169 I32 146 I50 167 180
129 I45 I65 190 219 I36 152 168 I89 218 I35 I53 I69 I89 227 137 I54 I71 I95 277
I15 124 177 I18 137 I13 I20 126 133 I41 II4 I73 I79 135 146 I IO II7 I74 134 144
161 190 232 291 351 I54 I83 205 255 313 158 188 ‘IO 261 321 I58 I87 218 279 327
I73 134 I41 I48 I55 I70 130 139 147 I54 120 130 137 I43 153 I23 I35 I48 I62 170
140 I50 I74 208 247 147 I58 I84 209 247 I40 155 177 207 240 143 I57 I75 201 247
I’7 139 IjO I73 195 12x 144 I 50 I65 I92 123 I35 143 I57 I75 128 141 149 I67 IXI
128 140 I50 I61 I86 1’7 I41 I52 166 I83 I76 136 147 I62 176 I32 I48 I56 167 I86
122 133 I47 120 I35 I49 II5 I26 136 II3 II8 127
154 I69 164 180 I48 I64 136 I47
(3rd Qr) (3rd Qr)
‘6.68 115 27.92 II9 29. I7 II4
27.12 II3 23.39 II8 26.39 116
I29 I31 I29
I59 I77 18’) 160 177 191 160 I80 I95
137 140 I36
143 142 144
I53 155 151
I65 168 165
163 185 173 I98 171 I89
(4th Qr) (4th Qr)
I X.50 I71 135 I45 I53 I69 70.90 I20 I32 141 I51 167 19.37 II8 I30 I41 I49 I61 22.45 II9 133 I49 158 170
( I7 months to Dec. 1974) (-Dec.1975) (GDcc.1976) (-Dec.1977) (-Dcc.1978) (-Dee.)
351/7 yen I 115.8 I12 I21 I32 139 I54 371 1126.1 IIX 126 I38 143 I50 382 940.8 II4 122 133 139 I50 5 721.8 117 I32 I48 I 60 I72
185 179 I75 190 (-Dec. )
165 I62 I61 I83
.‘For Japan. manual and non-manual workers. Including holiday pay (see: Vol. 5, pp. 75-77). “ln~crnat~onal Standard Industrial Classification. ‘From 19X3 onward\. lndlccs apply to May and Nowmbcr. 35 Manufacture of chemicals. 35 I Manufacture of lndustrlal chcmlcals. 351 Manufacturcofotherchcmlcal~.
353 Petroleum refincnes. 37 Basic metal industries. 37 I Iron and steel basic mdustrics

251
1981 1982 1983 1984 1985 I986 1987
Oct. Oct. .Apr. Oct. Apr. OCl. Apr. Oct. Apr. Oct. 4pr. Oct.
- 198 208 221 223 226 229 233 235 235 239 239
186 200 204 224 226 230 232 233 233 236 236
189 200 212 216 219 220 224 228 228 231 231
I94 202 210 ‘I5 218 220 223 226 226 231 231
247 284
249 289
253 289
263 296
353 361 368 374 376 379
346 355 360 364 368 373
356 364 372 378 385 392
359 370 379 386 392 400
146 I53
149 I54
153 159
I51 I56
166 169 I71 I78 I80 I82
I71 I71 173 180 I83 I87
171 178 179 I87 L89 I93
166 I68 I72 I72 176 I78
414 477
385 442
395 453
406 484
I65 175
164 172
I62 171
I80 190
300 323 334 340
304 308 327 330
306 323 337 340
317 329 340 350
157 I59 162 164
161 160 I61 163
162 164 164 169
I61 I65 I65 166
512 543 578 605
476 507 542 557
490 523 559 580
518 547 585 602
I83 190 193
I75 I77 180
172 I74 176
188 I87 I89
629 659 662 697 727 742
590 614 619 636 672 685
610 636 639 664 702 716
631 661 664 690 709 722
194 193 196 I98 197 I98
180 I81 I83 I84 I85 I86
176 I78 179 I80 I81 I82
189 I95 195 197 199 I99
27s 295
272 296
263 286
266 289
363 378 384R 400 421 432
393 406 4llR 411 455 466
345 358 373 379 390 403
338 349 363 374 388 393
210 246
214 249
204 244
215 250
313 325 335 352
332 342 369 380
301 306 319 328
306 309 323 328
258 270 271
265 276 276
264 275 264
260 272 295
285 295 297 299 310 310
283 298 300 317 324 329
214 284 285 303 313 122
302 313 315 321 330 335
209
214
202 212
228
240
216
228
240
252 222
202
244
256 224
207
254 260 265 273 280 282
272 277 276 280 287 289
230 233 234 240 243 249
211 204 211 209 219 218
191
197
I78
I58
(3rdQr)
210
208 21 I
204
208
I83
169
215
218 192
I72
(3rd Qr)
246 241
252
220 226
I95 I71
(IstQr)
258
250
261
232 253
240 265 219 231
207 203
206 225
196 222
186 197
170 I74
(3rdQr) (IstQr) (3rd Qr)
233 263
232 259
240 271
222 221 255
232 232 269
230 228 255
(4th Qr) (2nd Qr) (4th Qr)
213 231 261 209 224 252
210 220 247
208 219 240 -Dec. ) (-June) (-Dec. )
I86 177 202 182 I79 I89 181 176 190 205 201 223
372 Non-ferrous metal basic industries.
38 I Manufacture of fabricated metal products, excl. machinery.
382 Manufacture of machinery excl. electrical. 383 Manufacture of electrical machinery.
228 234 233 238
229 230 238 237
200 205 207 207
I75 177 176 181
(IstQr) (3rd Qr) (IstQr) (3rd Qr)
243
238
210
180
(IstQr)
301 284
320
248 240
213
I83
(3rd Qr)
269 270 272 271
261 264 266 ‘67
282 285 287 295
301 291
325
199
211 204
(4th Qr)
203
194
194
203
(-Dec.)
233
248
235
(4th Qr)
241
252
238 (2ndQr)
258 268 272 281
260 269
(2nd Qr) (4th Qr)
281 312 287 308
281 306
329 350
345 357 337 368
(2nd Qr) (4thQr)
236
228
225
223 (-Dec.)
256
246 240
240
(-June)
275 277
269 269
259 263 249 256 (-June) (-Dec.)
313 319
302 306 294 300 300 312
(-June) (-Dec. )
173 I75 I71
I98
194
187 184 213
197
I89 I86 219
206 209
194 198 192 194 224 225
(2nd Qr) (4th Qr)
295 298
285 289
276 282 269 283
(-June) (-Dec. ) 213 216
200 203
192 196 227 233
219 224
202 201 197 198 237 240
5 Construction

T.4
BL
E
4
Indi
ces
of a
vera
ge
hour
ly
labo
ur
cosi
st
of a
dult
man
ual”
w
orke
rs
in s
elec
ted
indu
stri
es
( 197
4=
100)
Bel
gium
35
1
371
382
Den
mar
k 35
112
(3rd
Q
uart
er
3821
3
of e
ach
year
)
5
Fran
ce
351
371
382
5
W.
Ger
man
q 35
1
371
382
Ital
y 35
1
371
382
Net
herl
ands
35
1
37
382
B.F
r.
267.
3
287.
1
227.
7
255.
0
D.K
r. 32
.28
33.5
0
34.4
2
F.Fr
. 20
.43
22.2
5
18.9
9
17.2
4
D.
18.1
8
17.0
9
16.3
2
15.3
0
Lir
e 29
27
3084
2677
2334
Gui
lder
17
.28
19.5
3
16.3
8
17.2
7
120
133
149
155
169
I87
205
II0
126
137
I45
166
I80
198
II6
I28
I40
I48
160
I73
I94
119
136
150
I55
172
I87
203
II6
I31
145
163
180
I92
217
II9
I28
140
157
174
190
212
I I4
I2
8 I4
3 15
9 17
9 19
6 21
2
126
143
160
I88
209
242
276
127
144
I62
I82
205
239
270
118
I38
I56
172
193
232
260
II5
136
154
172
195
227
265
I08
120
130
133
136
145
I54
109
118
I26
I31
139
I49
157
109
II6
126
133
I40
152
159
104
II2
120
I28
I39
151
157
I26
I66
I96
240
303
365
435
130
I61
192
214
264
324
402
127
162
I94
220
272
333
414
125
159
190
233
283
334
420
116
I24
137
I43
150
I58
I64
II0
122
133
141
I51
156
I64
I14
I22
I34
I41
I45
155
162
II5
124
139
150
I63
172
182
217
216
208
216
245
238
246
321
319
301
301
I62
I64
I66
I64
509
468
482
508
175
175
174
I92
230
235
243
245
249
220
226
250
251
254
221
228
233
237
241
222
231
235
238
244
264
283
294
299
336
255
274
784
292
312
265
285
304
320
350
355
384
408
423
429
347
365
393
402
411
330
348
373
387
398
338
356
378
392
404
I68
174
I80
I89
191
I71
I74
I82
192
195
I72
177
I87
196
I98
170
I74
177
I81
I86
579
645
703
742
782
537
590
651
674
722
556
617
677
706
754
574
632
693
274
751
I80
195
197
202
202
178
I83
185
I88
190
175
179
182
I84
I86
I90
191
I93
‘00
204
249
‘54
241
‘44
336
320
355
433
416
405
411
193
199
202
187
799
736
769
765
203
I92
187
204

U.K
Aus
tral
ia’
Can
ada
Japa
n
(Ann
ual
aver
ages
)
Nor
way
35
112
(3rd
Q
uart
er
382
of e
ach
year
) 5
Swed
en
(4th
Q
uart
er
of e
ach
year
)
35
371
382
5
U.S
.A.
3511
2
371
382
5 3511
213
37
3811
213
3511
2
3711
2
382
3511
2
371
382
5 351
371
382
Poun
d
A.$
Can
.$
Yen
N.K
r.
SwK
r.
U.S
.$
1.60
1.24
1.41
1.30
4.81
4.
74
4.34
4.51
5.93
6.79
6.21
7.99
1295
1306
1092
839 30
.97
32.7
5
35.1
0
26.0
9
30.3
1 27
.51
30.7
6
7.51
7.61
6.82
8.95
129
143
153
178
214
254
292
157
181
194
231
265
312
356
126
142
157
180
214
252
280
129
143
155
172
200
246
278
113
129
141
152
176
198
219
112
129
145
153
168
195
222
108
123
136
145
160
180
213
112
129
142
152
164
184
224
113
128
140
I50
161
186
218
118
133
150
165
182
199
237
116
127
139
149
168
183
213
120
134
151
157
174
192
223
113
123
134
144
159
171
181
121
131
144
151
159
172
187
113
123
135
143
155
167
178
117
133
151
164
178
189
207
114
139
155
167
165
188
202
120
142
157
171
176
201
214
118
138
154
168
174
192
207
126
146
161
174
192
217
237
123
138
148
162
176
205
218
122
138
154
167
184
206
223
123
141
162
175
192
219
241
112
125
136
145
157
172
198
112
123
138
152
168
197
226
108
115
126
136
149
166
182
108
114
122
129
140
151
166
313
389
305
295
258
260
255
262
241
269
232
244
196
196
190
216
227
237
235
249
235
244
251
212
252
188
177
347
376
409
452
501
544
329
352
391
325
345
372
278
287
319
281
293
321
281
281
306
276
313
337
257
271
283
286
301
319
242
252
258
219
220
225
208
216
225
207
207
219
198
202
209
234
238
242
241
262
278
255
277
291
242
263
280
278
294
339
256
278
312
263
291
320
268
284
314
230
246
260
267
263
272
203
213
224
188
190
200
439
468
480
558
626
641
419
437
451
404
425
431
325
337
337
344
352
357
329
340
350
349
358
364
297
305
307
322
330
333
265
270
275
230
242
240
233
235
241
224
223
221
211
212
213
251
255
259
325
348’
37
0
321
364’
37
8
322
360’
39
3
370
390”
39
8
341
358d
37
1
331
346d
36
6
350
366”
39
4
264
270
275
286
287
290
228
231
234
207
206
210
Indi
ces
appl
y at
Oct
ober
of
eac
h ye
ar
unle
ss
othe
rwis
e st
ated
.
~’ an
d %
ee
Tab
le
3.
‘Fir
st
Qua
rter
.
“Sec
ond
Qua
rter
.
‘Fro
m
1983
on
war
ds,
indi
ces
appl
y to
May
an
d N
ovem
ber.
TA
BL
E
5
Curr
ency
exc
hang
e ra
tesa
re
lativ
e to
U.S
. D
olla
r
Aus
tral
ia
Can
ada
Den
mar
k Fr
ance
W
. G
erm
any
Ital
y Ja
pan
Net
herl
ands
N
orw
ay
Swed
en
U.K
.
A.$
B
.Fr.
C
an.$
K
rone
1974
0.
694
39.5
0.
98 1
6.13
1975
0.
760
36.5
1.
01
5.68
1976
0.
802
39.0
0.
987
6.07
1977
0.
905
35.8
1.
05
5.94
1978
0.
871
31.9
1.
16
5.48
1979
0.
887
28.7
1.
17
5.16
1980
0.
863
29.1
1.
17
5.60
1981
0.
869
36.4
1.
19
6.97
1982
0.
977
44.5
1.
24
8.24
1983
1.
1 I
50.4
1.
23
9.10
1984
I.1
5 58
.3
1.30
10
.4
1985
I .
42
58.2
1.
36
10.4
I986
1.
49
44.7
1.
39
8.10
1987
1.
42
37.4
1.
32
6.85
1987
Jan.
2
Apr
. I
Jul.
1 O
ct. I
1.50
39
.9
1.38
7.
26
6.35
1.
92
1328
15
8 2.
16
7.33
6.
73
0.67
0
I .42
37
.6
1.31
6.
85
6.04
1.
82
I295
14
6 2.
06
6.84
6.
34
0.62
3
1.39
37
.9
1.33
6.
92
6.09
1.
83
1323
14
7 2.
06
6.70
6.
39
0.61
9
I .42
38
.3
1.31
7.
10
6.15
1.
85
1333
14
7 2.
08
6.74
6.
46
0.62
0
1988
Jan.
4
Mar
. 3
1 1.
39
33.3
1.
30
6.1
I 5.
38
1.59
11
72
123
1.79
6.
22
5.79
0.
534
1.35
34
.7
1.23
6.
36
5.62
1.
66
1228
12
4 1.
86
6.24
5.
87
0.53
0
F.Fr
. D
M.
4.77
2.
62
4.29
2.
44
4.71
2.
51
4.94
2.
34
4.53
2.
03
4.21
1.
82
4.19
1.
85
5.30
2.
21
6.52
2.
40
7.60
2.
54
8.81
2.
88
8.81
2.
88
6.92
2.
18
6.00
1.
80
Lir
a Y
en
Gui
lder
K
rone
K
r6na
636
285
2.72
5.
56
4.47
0.
424
649
298
2.62
5.
18
4.1
I 0.
448
803
298
2.67
4.
98
4.38
0.
545
880
275
2.45
5.
30
4.38
0.
579
857
215
2.19
5.
25
4.56
0.
527
824
213
I .99
5.
01
4.26
0.
472
876
217
2.01
4.
96
4.24
0.
426
1127
21
9 2.
44
5.66
5.
04
0.49
I
1337
24
4 2.
65
6.41
6.
22
0.57
2
1514
23
5 2.
85
7.31
7.
65
0.66
3
1768
23
9 3.
24
8.24
8.
33
0.76
3
1866
23
3 3.
25
8.46
8.
47
0.77
1
1496
17
0 2.
45
7.36
7.
13
0.67
6
1290
14
4 2.
03
6.77
6.
34
0.61
3
Poun
d
“Ann
ual
rate
s ar
e av
erag
es
of r
ates
on
th
e fi
rst
trad
ing
day
in e
ach
of t
he
four
qu
arte
rs
in t
he
year
an
d of
the
fi
rst
quar
ter
in t
he
follo
win
g ye
ar.

255
TABLE 6
Comparison of erected costs of plants with U.S.A. = I .O, as at January 1st unless otherwise stated
1975 1976 1977 1978 1979 1980 1981 1982 1983 1984 1985 1986 1987 1987 1988 July 1
Belgium 1.07 1.00 1.01 1.10 1.18 1.36 1.21 0.92 0.81 0.72 0.60 0.68 0.92 I .03 I .oo Denmark 1.06 1.01 0.98 0.98 1.10 1.13 1.05 0.80 0.76 0.72 0.62 0.71 0.98 1.15 1.12 France 0.85 0.93 0.89 0.87 0.96 1.02 1.04 0.82 0.75 0.68 0.58 0.67 0.90 0.99 0.98 W. Germany 1.02 0.98 0.99 1.02 1.12 1.20 1.13 0.88 0.85 0.76 0.64 0.73 1.01 1.12 1.09 Italy 0.86 0.88 0.81 0.82 0.91 1.01 1.01 0.78 0.79 0.74 0.65 0.72 1 .oo 1.11 I .07 Netherlands 1.04 1.05 1.05 1.12 1.13 1.18 1.12 0.82 0.82 0.73 0.61 0.69 0.96 I .06 1.04 U.K. 0.77 0.81 0.70 0.72 0.80 0.94 1.08 0.86 0.79 0.68 0.59 0.70 0.81R 0.90 0.92 Australia 0.92 0.89 0.94 0.85 0.87 0.84 0.90 0.89 0.86 0.80 0.76 0.67 0.68 0.78 0.77 Canada 0.92 0.95 1.05 0.98 0.87 0.90 0.90 0.92 0.92 0.86 0.81 0.76 0.80 0.85 0.84 Japan 0.58 0.55 0.59 0.65 0.82 0.79 0.77 0.73 0.60 0.62 0.58 0.65 0.94 0.96 0.99 Norway 1.16 1.16 1.28 1.25 1.29 .31 1.32 1.07 1.00 0.92 0.82 0.89 1.15 1.28 1.37 Sweden 1.24 I.18 1.24 1.13 1.19 1.26 1.29 0.99 0.90 0.76 0.70 0.79 1.03 1.14 1.16 U.S.A. - I.0 *
show large increases in 1987. Each of these countries had large increases in hourly labour costs (Table 4) particularly in the construc- tion industry.
In most countries the prices of the three steel products listed in Table 2 changed only slightly in 1987, with the exception of steel plate in the U.S.A.. and which was referred to above. Some of the changes have been such as to bring prices more into line with those of competing coun- tries as is shown in Table 7. Price equalization within the European Community should be at- tained in 1992 when all trade barriers within the Common Market are due to be removed, but the attempts to rationalize the steel indus- try within the Community have not been en- tirely successful to date so the hopes for 1992 may not be fully realized. In the meantime av- erage steel prices are still lower than in the other European countries. Cement prices have gone up slightly in most countries, only Japan shows a fall.
CURRENCIES
Against the other twelve currencies listed, the U.S. dollar depreciated from October 1, 1986 to April 1, 1987, then after staging a slight re-
covery to October 1 fell significantly through the last quarter of 1987. Comparing the aver- age rates at October 1 in 1987 and 1986, the dollar fell by 7.3% against the averages of the other twelve countries. For those countries which are members of the European Monetary System the falls ranged from 8.8% for Belgium and the Netherlands to 4.5% for Italy, with West Germany at 8.5%, Denmark at 7% and France at 6.1%. Outside the E.M.S., the U.K. currency gained 10.4%, Norway 6.1% and Sweden 6.4%. The Japanese yen rose by 4.5% and the Australian and Canadian dollars by 10.7% and 6.0%, respectively.
In the first half of 1988 the U.S. dollar has recovered slightly against most of the other currencies, but the Australian and Canadian dollars rose further and the Japanese yen re- mained virtually unchanged at about 124 to the U.S. dollar.
INTERNATIONAL COMPARISON OF ERECTED COSTS
With the decline in the value of the U.S. dol- lar over the last three or four years, the cost advantages held by the other twelve countries, as reflected by the comparative indices in Ta-

256
TABLE7
(‘ompar~son ofprices. wth U.S.A.= 1.0. for:
I Ordinary Portland cement
II Steel re-inforcingbar III Steel sections (heavy) IV Steel plate
1974 1975 1976 1977 1978 1979 1980 1981 lY82 1983 I984 1985 1986 1987
1st half 2nd half
Bclgtum
Denmark
FElIlCc
W. German!
Ital,
Netherlands
U.K.
.Australia
Japan
NOWI)
I 0.77 0.78 0.77 0.84 0.88 0.9 I 0.92 0.77 0.77
II 1.35 I.11 1.02 1.24 I.17 1.08 I.15 1.08 1.08
III 1.08 0.87 0.88 0.96 0.90 1.02 0.93 0.72 0.72
IV 1.53 I.10 0.87 0.94 0.86 0.94 0.90 0.66 0.66
I 1.07 1.07 0.92 0.91 0.95 0.93 1.05 0.90 0.77
II 1.2' 1.26 I.18 1.32 I.16 1.05 I.15 0.93 1.03
IV 1.38 1.03 0.84 0.85 0.88 0.87 0.82 0.62 0.65
I 0.83 0.86 0.84 0.77 0.83 0.93 I.01 0.88 0.80
II 1.05 I.13 I.16 I.16 1.25 1.05 I.19 0.98 1.01
III 0.94 0.87 0.85 0.83 0.92 0.92 0.92 0.70 0.68
IV I.20 1.29 1.09 0.89 0.87 0.88 0.87 0.65 0.69
I 0.84 0.83 0.74 0.77 0.83 0.84 0.82 0.72 0.74
II 1.24 I.14 I.13 I.17 I.20 1.06 1.08 0.90 I.10
III 1.06 0.98 0.94 0.93 0.90 0.98 0.86 0.69 0.82
IV I.23 1.06 0.94 0.91 0.87 0.93 0.87 0.73 0.73
I 0.55 0.61 0.51 0.53 0.56 0.64 0.68 0.61 0.59
II 1.32 0.98 0.95 1.09 I.12 1.08 1.03 0.78 0.76 111 I.04 0.89 0.83 0.86 0.88 0.91 0.86 0.61 0.65
IV I.21 1.19 0.96 0.87 0.85 0.90 0.87 0.65 0.67
I 0.85 0.88 0.83 0.88 0.92 0.92 0.90 0.79 0.76
II 1.33 1.06 1.09 1.26 I.16 1.06 1.20 0.98 I.14
IV 1.33 1.24 I.13 I.13 0.86 0.88 0.81 0.62 0.68
0.72
1.06
0.59
0.63
0.82
1.05
0.64
0.73
0.84
0.54
0.62
0.73
0.88
0.62
0.63
0.57
0.75
0.57
0.63
0.72
0.93
0.61
0.57 0.63 0.92 1.03
0.73 0.82 I.18 I.32
0.47 0.49 0.67 0.70
0.50 0.54 0.95 1.03
0.59 0.65 0.91 1.00
0.85 0.88 I.19 I.32
0.49 0.52 O.Y3 1.07
0.59 0.64 0.91 1.00
0.73 0.77 1.19 I.31
0.44 0.47 0.65 0.70
0.52 0.54 1.00 I.05
0.59 0.63 0.93 1.03
0.73 0.79 I.17 I.31
0.47 0.54 0.68 0.70
0.53 0.57 0.98 1.04
0.48 0.49 0.74 0.79
0.73 0.73 0.71 0.83
0.50 0.50 0.71 0.74
0.57 0.57 I.01 1.04
0.61 0.64 0.97 1.08
0.66 0.80 1.20 1.25
0.52 0.55 1.02 1.09
I 0.70 0.78 0.72 0.75 0.84 1.00 1.30 I.21 I.10 0.95 0.74 0.78 0.95 1.00 II 1.05 I.11 I.72 1.20 I.17 I.13 1.41 1.22 1.23 1.17 0.90 1.03 I.13 1.16 III 0.92 0.98 0.89 0.89 0.89 I.17 1.23 1.07 0.83 0.70 0.58 0.65 0.83 0.87 IV 0.98 1.05 0.85 0.81 0.86 0.91 0.96 0.74 0.68 0.59 0.49 0.54 0.86 0.88
I 1.25 1.14 I.13 I.05 1.08 1.02 1.06 I.14 1.15 I.12 1.06 0.90 0.93 1.06 II I.11 1.23 I.50 1.45 1.42 I.23 1.35 1.47 1.56 1.64 1.41 I.21 1.20 I.41 III 0.97 0.90 0.94 0.86 0.86 0.84 0.90 0.89 0.80 0.70 0.67 0.59 0.63 0.70 IV 1.00 0.96 0.98 0.88 0.88 0.84 0.90 0.88 0.82 0.68 0.67 0.60 0.79 0.87
I I.11 1.04 I.13 1.09 0.99 0.99 1.02 I.10 1.20 1.25 I.15 I.15 I.19 1.25 II 0.97 I.19 1.34 1.14 0.97 0.90 0.92 0.95 1.06 I.11 0.88 0.93 0.93 0.98 III 0.86 0.83 0.91 0.84 0.75 0.79 0.83 0.84 0.78 0.76 0.69 0.68 0.70 0.72 IV 0.83 0.86 0.93 0.88 0.78 0.79 0.79 0.78 0.76 0.71 0.68 0.68 0.83 0.84
I 0.99 0.84 0.81 0.84 1.06 1.02 1.19 I.18 1.03 1.05 0.96 0.98 I.52 I.58 IV 0.77 0.75 0.83 0.92 1.14 1.04 0.98 0.91 0.73 0.73 0.70 0.74 I.41 1.37
I 1.02 1.07 I.11 1.07 1.05 1.09 1.15 1.07 0.99 0.97 0.81 0.84 0.97 I.11 II I.21 1.37 1.50 1.43 1.22 1.17 1.24 1.12 I.19 I.16 0.85 0.89 I.19 1.33 III I.21 0.99 1.08 I.01 0.90 0.92 0.94 0.75 0.76 0.65 0.43 0.51 0.72 0.74
I 0.92 0.99 0.96 1.00 0.95 0.99 1.05 0.93 0.83 0.74 0.66 0.71 0.96 1.05 II I.27 1.37 1.43 1.52 1.37 1.33 1.45 I.14 I.12 1.00 0.82 0.87 I.19 1.30 III 1.44 1.04 1.05 0.91 0.87 0.93 0.95 0.75 0.74 0.62 0.53 0.56 0.74 0.74 IV 1.67 I.11 0.98 0.80 0.83 0.83 0.80 0.63 0.65 0.60 0.52 0.56 1.00 I.05
I.10
1.37
0.72
0.98
I.10
1.39
0.99
1.13
1.37
0.71
0.98
1.09
1.34
0.69
0.98
0.83~
0.9op
0.72p
0.95p
I.14
1.32
1.03
1.22
1.28
0.92
0.84
1.08
1.39
0.71
0.81
1.28
1.03
0.74
0.79
1.64
1.29
1.20
1.43
0.78
I.13
1.39
0.76
0.99
See footnotesin Table 2

257
T.&BLE 8
Comparison ofhourly labourcosts,with U.S.A.= 1.0
ISIC’ 1974 1975 1976 1977 1978 1979 1980 1981 1982 1983 1984 1985 1986 1987
Apr. Oct.
Belgium
Denmark
(3rdQr)
FlTUlCC
W. Germany
Ital,
Netherlands
U.K.
Australia
Canada
Japan
Mnnual
avcragcs)
Norway
(3rdQr)
Sweden
(4thQr)
351 0.91 0.97 I.01 .I0 1.29 1.36 1.28 0.97 0.74 0.67 0.55 0.62 0.79 0.87 0.84
371 0.94 0.94 1.03 1.05 1.18 1.33 1.00 0.87 0.66 0.68 0.51 0.65 0.79 0.89 0.86
382 0.85 0.91 0.99 1.04 I.19 1.28 I.18 0.91 0.76 0.68 0.58 0.65 0.83 0.93 0.90
5 0.73 0.80 0.90 0.98 I.16 1.24 I.21 0.93 0.71 0.64 0.56 0.62 0.78 0.89 0.86
35112 0.70 0.73 0.77 0.75 0.90 0.97 0.89 0.63 0.56 0.52 0.44 0.50 0.64 0.7gh 0.74
38213 0.80 0.89 0.90 0.89 1.06 I.13 I.01 0.76 0.70 0.65 0.55 0.65 0.82 0.97h 0.95
5 0.63 0.67 0.73 0.74 0.89 0.97 0.90 0.65 0.59 0.57 0.51 0.61 0.78 0.95h 0.92
351 0.58 0.69 0.63 0.66 0.80 0.89 0.91 0.68 0.58 0.53 0.45 0.53 0.66 0.72 0.70
371 0.62 0.74 0.67 0.70 0.80 0.83 0.85 0.63 0.52 0.54 0.43 0.52 0.62 0.69 0.68
382 0.59 0.68 0.68 0.71 0.81 0.89 0.89 0.73 0.63 0.57 0.49 0.58 0.71 0.80 0.78
5 0.41 0.46 0.47 0.50 0.59 0.74 0.69 0.55 0.46 0.43 0.39 0.45 0.55 0.62 0.61
351 0.91 0.90 0.95 1.01 I.15 1.23 I.12 0.81 0.74 0.67 0.56 0.63 0.86 0.94 0.92
371 0.85 0.83 0.88 0.89 1.00 1.07 0.94 0.68 0.58 0.62 0.49 0.57 0.74 0.84 0.83
382 0.90 0.92 0.99 1.05 1.21 1.30 I.21 0.90 0.84 0.77 0.65 0.75 1.02 I.13 I.12
5 0.64 0.63 0.69 0.74 0.88 1.02 0.94 0.70 0.63 0.59 0.51 0.57 0.74 0.85 0.82
351 0.59 0.64 0.61 0.64 0.81 0.94 0.96 0.68 0.66 0.62 0.53 0.59 0.78R 0.87 0.85
371 0.61 0.69 0.63 0.64 0.71 0.80 0.78 0.57 0.53 0.58 0.48 0.54 0.69R 0.79 0.77
382 0.60 0.67 0.65 0.69 0.78 0.90 0.92 0.71 0.71 0.68 0.59 0.66 0.87R 0.99 0.97
5 0.40 0.44 0.43 0.46 0.57 0.72 0.67 0.53 0.53 0.50 0.46 0.50 0.65 0.73 0.71
351 0.85 0.89 0.89 0.95 I.08 I.14 1.06 0.69 0.69 0.61 0.53 0.58 0.77 0.84 0.82
37 0.95 0.95 0.99 1.01 I.13 1.26 1.04 0.67 0.64 0.65 0.52 0.59 0.74 0.82 0.81
382 0.89 0.94 0.99 1.05 I.18 1.33 I.22 0.77 0.80 0.71 -.59 0.65 0.85 0.94 0.92
5 0.72 0.77 0.81 0.91 1.07 1.20 I.11 0.86 0.76 0.68 0.57 0.62 0.82 0.93 0.90
35112 0.50 0.50 0.41 0.42 0.51 0.64 0.75 0.58 0.53 0.48 0.40 0.47 0.51 0.59 0.60
371 0.40 0.46 0.40 0.41 0.49 0.56 0.62 0.17 0.43 0.43 0.39 0.46 0.46 0.57 0.58
382 0.48 0.49 0.43 0.46 0.54 0.65 0.75 0.58 0.57 0.50 0.42 0.51 0.55 0.63 0.64
5 0.34 0.36 0.31 0.33 0.38 0.45 0.57 0.45 0.41 0.37 0.33 0.38 0.41 0.48 0.4x
3511213 0.84 0.81 0.82 0.74 0.78 0.81 0.85 0.81 0.71 0.69 0.62 0.56 0.50 0.56 0.55
37 0.82 0.78 0.81 0.73 0.73 0.70 0.70 0.67 0.61 0.59 0.59 0.52 0.47 0.54 0.54
381/2/3 0.84 0.81 0.86 0.77 0.78 0.77 0.82 0.79 0.81 0.79 0.73 0.62 0.58 0.66 0.67
5 0.66 0.66 0.71 0.65 0.69 0.67 0.72 0.72 0.68 0.68 0.64 0.60 0.53 0.62 0.61
35112 0.80 0.77 0.83 0.75 0.69 0.72 0.73 0.72 0.72 0.72 0.67 0.63 0.64 0.68 0.67
37112 0.91 0.91 0.99 0.90 0.81 0.84 0.77 0.77 0.77 0.87 0.79 0.76 0.72 0.78 0.78
382 0.92 0.95 1.04 0.94 0.84 0.89 0.86 0.88 0.91 0.88 0.83 0.76 0.76 0.81 0.82
5 0.91 0.96 1.08 1.03 0.91 1.04 0.97 0.99 0.99 0.85 0.79 0.73 0.71 0.80 0.80
35112 0.60 0.58 0.57 0.62 0.80 0.82 0.79 0.72 0.59 0.66 0.62 0.70 0.99 1.00 1.03
371 0.60 0.62 0.61 0.65 0.79 0.76 0.69 0.65 0.50 0.63 0.55 0.65 0.87 0.89 0.89
382 0.56 0.56 0.57 0.63 0.78 0.79 0.74 0.72 0.60 0.66 0.62 0.70 0.96 0.98 0.99
5 0.33 0.34 0.37 0.42 0.56 0.58 0.54 0.53 0.42 0.48 0.48 0.53 0.74 0.77 0.79
35112 0.75 0.75 0.86 0.86 0.93 0.89 0.93 0.71 0.64 0.59 0.50 0.56 0.71 0.75" 0.82
382 0.87 0.95 I.12 1.09 I.17 I.17 1.20 0.96 0.87 0.82 0.71 0.79 0.94 l.07h I.15
5 0.71 0.76 0.89 0.90 1.00 I.10 1.02 0.83 0.75 0.69 0.62 0.72 0.85 0.97" 1.09
35 0.78 0.88 0.95 0.86 0.95 1.03 1.05 0.74 0.65 0.54 0.48 0.57 0.70 0.79‘ 0.78
371 0.90 0.98 1.05 0.88 0.96 I.01 1.00 0.69 0.59 0.49 0.49 0.57 0.69 0.78' 0.79
382 0.91 1.02 I.13 1.02 I.12 1.21 I.21 0.88 0.84 0.64 0.64 0.72 0.85 0.95' 0.98
5 0.77 0.88 0.99 0.95 1.06 1.14 1.20 0.89 0.78 0.59 0.59 0.67 0.84 0.96' 1.00
Indicesapply atoctoberofeach yearunlessotherwisestated.
"Internationalstandard lndustrialClassificatlons:See footnote mTable 3
"First quarter.
'Second auartcr.

258
ble 6, have been eroded. As at July 1, 1987 only Australia and Canada had indices substan- tially below 1 .O. The position at January 1, 1988 has not changed substantially, although there is one unusual factor. Normally the U.S.A. national index (Table 1 ) reflects an in- crease well below the average of the thirteen countries, but in the second half of 1987 six of the countries had an increase lower than the U.S.A. These countries were thus able to re- gain in some of the ground lost by the appre- ciation of their currencies relative to the U.S. dollar. The average comparative index at both July 1, 1987 and January 1, 1988 for the twelve countries is 1.03.
FUTURE OUTLOOK
On the basis of their performance in recent years it is reasonable to expect Belgium, West Germany, the Netherlands, Canada, the U.S.A. and Japan to continue in the short term to have indices of erected costs increasing by up to 3% per annum. France, Italy. the U.K. and Aus-
tralia are likely to lie in the range 3% to 8%. Italy may well be at the start of a spell of in- creasing escalation, labour costs are now show- ing signs of this and rationalisation of the steel industry within the European Community may result in higher than average steel price in- creases. Denmark, Norway and Sweden are each likely to have increases of around 10% per annum.
For international comparisons the main fac- tor is, of course, the U.S. dollar. There are signs that it is beginning to regain strength relative to the other main currencies but its rate of re- covery is likely to fluctuate. However as Table 5 shows, the twelve currencies listed all appre- ciated against the U.S. dollar in the six months from October 1. 1987. Apart from Japan and the U.K. which both appreciated by about 17%. the increases ranged from 5% to 10(/o. This means that the indices which will appear for July 1. 1988 in Table 6 will all be higher than those for January 1, 1988, provided there is no substantial increase in U.S.A. costs and there is no major revaluation of any of the currencies.