T.Y.B.com. - Accountancy Paper - IV - Auditing & Cost Accounting

Cost Accounting - IV(As Per the Revised Syllabus of BAF, 2015-16, Semester VI,
University of Mumbai)
Winner of Best Commerce Author 2013-14 by Maharashtra Commerce AssociationState Level Mahatma Jyotiba Phule Excellent Teacher Award 2015-16
Dr. Nishikant JhaICWA, PGDM (MBA), M.Com., Ph.D., D.Litt. [USA],
CIMA Advocate [CIMA U.K.], BEC [Cambridge University],International Executive MBA [UBI Brussels, Belgium, Europe],
Recognised UG & PG Professor by University of Mumbai.Recognised M.Phil. & Ph.D. Guide by University of Mumbai.
Assistant Professor in Accounts & HOD, BAF, Thakur College of Science & Commerce.Visiting Faculty in JBIMS for MBA & K.P.B. Hinduja College for M.Phil. & M.Com.,
University of Mumbai.CFA & CPF (USA), CIMA (UK), Indian & International MBA, CA & CS Professional Course.
Prof. Rajiv S. MishraM.Com., MBA, M.Phil., UGC NET,
Assistant Professor at N.E.S. Ratnam College of Arts, Science & Commerce for BBI &Coordinator for M.Com., Bhandup (W), Mumbai - 400078.
Visiting Faculty at Nitin Godiwala, Chandrabhan Sharma, S.M. Shetty College,N.G. Acharya, V.K. Menon College, Sikkim Manipal University &
Vikas College for M.Com., MBA, BBI, BMS, BFM & BAF
Sunita SherifaniM.Com., M.Phil., MBA, SET
Head, Dept. of Accountancy and Associate Professor,V.E.S. College of Arts, Science and Commerce,
Chembur.
ISO 9001:2008 CERTIFIED

© AuthorsNo part of this publication may be reproduced, stored in a retrieval system, or transmitted in any form or by anymeans, electronic, mechanical, photocopying, recording and/or otherwise without the prior written permission of thepublisher.
First Edition : 2017
Published by : Mrs. Meena Pandey for Himalaya Publishing House Pvt. Ltd.,“Ramdoot”, Dr. Bhalerao Marg, Girgaon, Mumbai - 400 004.Phone: 022-23860170/23863863, Fax: 022-23877178E-mail: [email protected]; Website: www.himpub.com
Branch Offices :New Delhi : “Pooja Apartments”, 4-B, Murari Lal Street, Ansari Road, Darya Ganj,
New Delhi - 110 002. Phone: 011-23270392, 23278631; Fax: 011-23256286Nagpur : Kundanlal Chandak Industrial Estate, Ghat Road, Nagpur - 440 018.
Phone: 0712-2738731, 3296733; Telefax: 0712-2721216Bengaluru : No. 16/1 (Old 12/1), 1st Floor, Next to Hotel Highlands, Madhava Nagar,
Race Course Road, Bengaluru - 560 001.Phone: 080-22286611, 22385461, 4113 8821, 22281541
Hyderabad : No. 3-4-184, Lingampally, Besides Raghavendra Swamy Matham, Kachiguda,Hyderabad - 500 027. Phone: 040-27560041, 27550139
Chennai : New-20, Old-59, Thirumalai Pillai Road, T. Nagar, Chennai - 600 017.Mobile: 9380460419
Pune : First Floor, "Laksha" Apartment, No. 527, Mehunpura, Shaniwarpeth(Near Prabhat Theatre), Pune - 411 030. Phone: 020-24496323/24496333;Mobile: 09370579333
Lucknow : House No 731, Shekhupura Colony, Near B.D. Convent School, Aliganj,Lucknow - 226 022. Phone: 0522-4012353; Mobile: 09307501549
Ahmedabad : 114, “SHAIL”, 1st Floor, Opp. Madhu Sudan House, C.G. Road, Navrang Pura,Ahmedabad - 380 009. Phone: 079-26560126; Mobile: 09377088847
Ernakulam : 39/176 (New No: 60/251) 1st Floor, Karikkamuri Road, Ernakulam,Kochi – 682011. Phone: 0484-2378012, 2378016 Mobile: 09387122121
Bhubaneswar : 5 Station Square, Bhubaneswar - 751 001 (Odisha).Phone: 0674-2532129, Mobile: 09338746007
Kolkata : 108/4, Beliaghata Main Road, Near ID Hospital, Opp. SBI Bank,Kolkata - 700 010, Phone: 033-32449649, Mobile: 7439040301
Guwahati : House No. 15, Behind Pragjyotish College, Near Sharma Printing Press,P.O. Bharalumukh, Guwahati - 781009, (Assam).Mobile: 09883055590, 08486355289, 7439040301
DTP by : SunandaPrinted at : Rose Fine Art, Mumbai. On behalf of HPH.

PrefaceIt is a matter of great pleasure to present this new edition of the book on Cost Accounting - IV to
the students and professors of B.Com (Accounting and Finance), Semester VI, University of Mumbai.This book is written on lines of syllabus instituted by the Mumbai University. The book presents thesubject matter in a simple and convincing language.
We owe a great many thanks to a great many people who helped and supported us during thewriting of this book which includes Principals, Professors and Students of M.Com. Section.
The syllabus contains a list of the topics covered in each chapter which will avoid thecontroversies regarding the exact scope of the syllabus. The text follows the term-wise, chapter-topicpattern as prescribed in the syllabus. We have preferred to give the text of the section and rules as it isand thereafter added the comments with the intention of explaining the subject to the students in asimplified language. While making an attempt to explain in a simplified language, any mistake ofinterpretation might have crept in.
This book is an unique presentation of subject matter in an orderly manner. This is astudent-friendly book and tutor at home. We hope the teaching faculty and the student communitywill find this book of great use. We welcome constructive suggestions for improvement.
We are extremely grateful to Shri K.N. Pandey of Himalaya Publishing House Pvt. Ltd. for theirdevoted and untiring personal attention accorded by them to this publication. We gratefullyacknowledge and express our sincere thanks to the following people without whose inspiration andsupport, constructive suggestions of this book would not have been possible.
Mr. Jitendra Singh Thakur (Trustee, Thakur College) Dr. Chaitaly Chakraborty (Principal, Thakur College) Mrs. Janki Nishikant Jha
Authors

SyllabusModules at a Glance
Sr. No. Modules No. of Lectures
1 Budgeting and Budgetary Control 15
2 Absorption Costing and Marginal Costing Cost Volume and ProfitAnalysis
15
3 Managerial Decision Making 15
4 Standard Costing and Variance Analysis 15
Total 60
Module Topics
1 Budgeting and Budgetary Control
Meaning & objectives, Advantages and limitations of budgetsFunctional budgets, fixed and flexible budgetsZero based budgeting, performance budgetingSimple practical problems of preparing flexible budgets and functional budgets
2 Absorption Costing and Marginal Costing, Cost Volume and Profit Analysis
Absorption Costing and Marginal CostingMeaning of absorption costing,Introduction to marginal costingDistinction between absorption costing and marginal costingAdvantages and limitations of marginal costingCost Volume and Profit AnalysisBreak even analysis meaning and graphic presentationMargin of safetyKey factorSimple practical problems based on using the marginal costing formulae
3 Managerial Decision Making
Make or buySales mix decisions
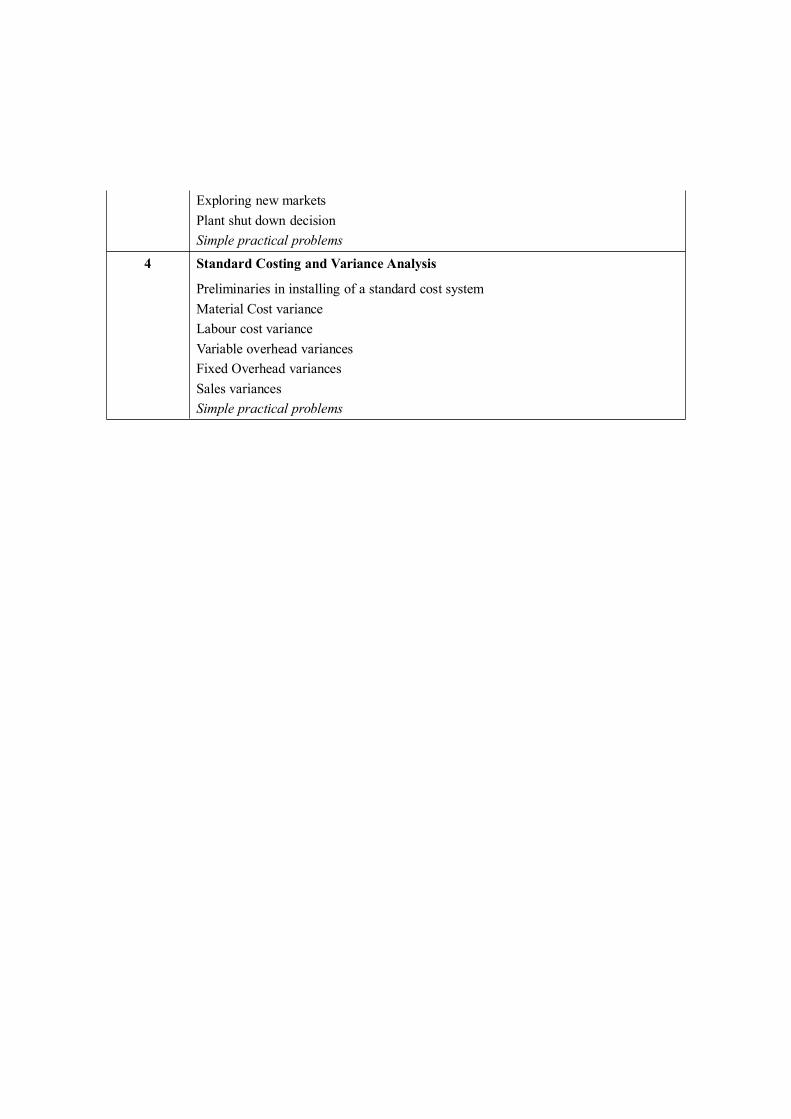
Exploring new marketsPlant shut down decisionSimple practical problems
4 Standard Costing and Variance Analysis
Preliminaries in installing of a standard cost systemMaterial Cost varianceLabour cost varianceVariable overhead variancesFixed Overhead variancesSales variancesSimple practical problems
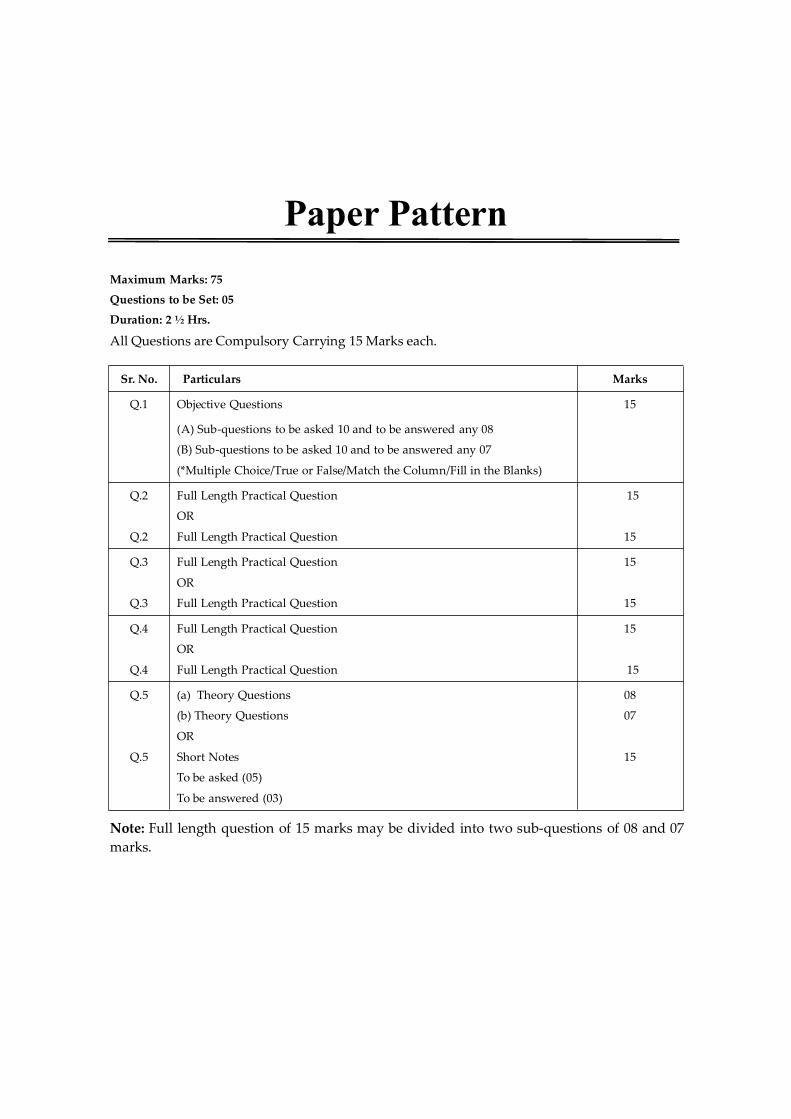
Paper PatternMaximum Marks: 75
Questions to be Set: 05
Duration: 2 ½ Hrs.
All Questions are Compulsory Carrying 15 Marks each.
Sr. No. Particulars Marks
Q.1 Objective Questions 15
(A) Sub-questions to be asked 10 and to be answered any 08
(B) Sub-questions to be asked 10 and to be answered any 07
(*Multiple Choice/True or False/Match the Column/Fill in the Blanks)
Q.2
Q.2
Full Length Practical Question
OR
Full Length Practical Question
15
15
Q.3
Q.3
Full Length Practical Question
OR
Full Length Practical Question
15
15
Q.4
Q.4
Full Length Practical Question
OR
Full Length Practical Question
15
15
Q.5
Q.5
(a) Theory Questions
(b) Theory Questions
OR
Short Notes
To be asked (05)
To be answered (03)
08
07
15
Note: Full length question of 15 marks may be divided into two sub-questions of 08 and 07marks.
Contents
1. Budgeting and Budgetary Control 1 – 53
2. Absorption Costing and Marginal CostingCost Volume and Profit Analysis 54 – 76
3. Managerial Decision Making 77 – 108
4. Standard Costing and Variance Analysis 109 – 161
University Problems and Solutions 162 – 205

Chapter
1
IntroductionBasically, management is the co-ordination of human effort, i.e., the accomplishment of goals by
utilising the efforts of other people. Management is termed efficient if it accomplishes the objectiveswith minimum effort and costs. Management planning and control has been recognised as one of themost important approaches for facilitating effective performance of the management process.
While all business endeavours have multiple objectives of profit and contribution to theeconomic and social improvement, non-business endeavours have relatively precise objectivesgenerally to be accomplished within specified cost constraints. Whether it is a business or non-business endeavour it is essential that the management and other interested parties are very wellacquainted with the objectives and goals so that proper managerial guidance could be given and theeffectiveness with which the desired activities are performed could be measured.
So, whatever be the endeavour, the management process essentially conforms to the generalpattern – planning, co-ordination and control. With the increasing competition among profit makingenterprises, the concept of profit planning and control system has gained wide acceptance whichrequires management to design its course in advance and use appropriate techniques to assure co-ordination and control of operations.
Elements of Management Planning and Control SystemManagement planning and control means the development and acceptance of objectives and
goals and moving an organisation efficiently to achieve the desired objectives and goals. It is not aseparate technique but entails an integration of all the functional and operational aspects of anenterprise.
Although management planning and control is related to accounting, it is a management systemwhich comprises of activities of planning, co-ordination and control. For long-range success thestream of managerial decisions must generate plans and actions to provide the essential inflows thatare necessary to support the planned outflows of the enterprise so that realistic profit and return oninvestment are earned. The relationship between these activities of the management can be seen in theFigure 1.1.
BUDGETING ANDBUDGETARY CONTROL

Budgeting and Budgetary Control2
Planned inflows Planned outflows
Products
Services
Social
People
Capital
Materials
(Costs) PROFIT (Revenues)
(Return on Investment)
Co-ordination
Enterprise Operations
Planning Decisions
Activating Decisions
Control Actions
Figure 1.1: Planning and Controlling Inflows and Outflows for Profit
It may be noted that planned inflows are people, capital and materials, generally cost-incurringfactors while outflows are products, services and social contributions that the enterprise generateswhich are generally revenue-generating factors. The responsibility of management is to manipulate,through the management process, i.e., planning, activating (or co-ordinating) and control thecombinations of inflows and outflows so that the long-range objectives of the enterprise generally interms of profit and return on investment are attained.
PlanningPlanning has been defined as the design of a desired future state for an entity and rests on the
belief that the future state can be attained by continuous management action. Thus, it projects theeffective ways of attaining this desired future state, and presupposes that an entity can be moresuccessful, in terms of its broad objectives, because of planned management decisions than it can ifthere were no planned intervention by the management.
The purpose of planning is to provide the managers with the guidelines for making decisions on aday-to-day basis. Planning referred here, is a decision-making process of highest order and thusrequires management time and dedication. It starts with an attempt to project the future state withoutany intervention by the management and the desired state of the entity. Then, it concludes with aplanning projection and thus, projects the ways to attain the desired future state realistically.
Planning is a continuous process since it requires constant revisions with changing conditions.
ControlControl may be defined simply as the action necessary to assure that objectives, plan, policies
and strategies are being attained. It rests upon a firm foundation of management planning and thus,believes that the objectives, plans, policies and strategies are properly planned and communicated tothose managers who are responsible for their accomplishment.
Budgeting and Budgetary Control 3
Generally, a control process encompasses the following:1. Measuring performance against predetermined objectives and standards.2. Communicating to the appropriate managers of the results.3. Calculating deviations from the set objectives and standards.4. Framing all possible alternative ways to correct the indicated variances.5. Choosing and implementating the most promising alternative.6. Appraising the corrective action and improve future planning and control cycles.
Control is effective if it is exercised at the point of action or at the time of commitment ratherthan after the completion of the action. This implies that the objectives, plans, policies and standardsare communicated to and understood by the managers who are responsible for certain actions, so thatthey would be in a position to exercise control at the point of action.
In control process, evaluation of an actual result must be based upon some standard ofperformance. Current actual results can be compared to the actual results of the prior period. In thisway, trends are revealed. However, comparison with prior period actual results may not provideeffective measurement of performance due to the following reasons – (1) conditions may havechanged (2) accounting classifications adopted may be different, and (3) performance in the priorperiod itself would have been unsatisfactory. Thus, the management has to evaluate the performanceof various managers after taking into consideration the above points.Co-ordination
Though Co-ordination is listed as a separate function of management, it should be viewed as aneffect that ensues when the managerial functions of planning and controlling are accomplished.
Co-ordination is the synchronisation of individual actions with the result that each subdivision ofan entity effectively works toward the common objectives. Co-ordination is regarded as one of thecentral tasks of management as it involves a reconciliation of differences in effort, timing, policies andaggregation of resources. Lack of co-ordination in an enterprise is observed when a department head ispermitted to expand the department on the specific needs of that department only, although suchexpansion may negatively affect other departments and alter their performances. Thus, co-ordination isrequired at all vertical levels and on a horizontal basis.
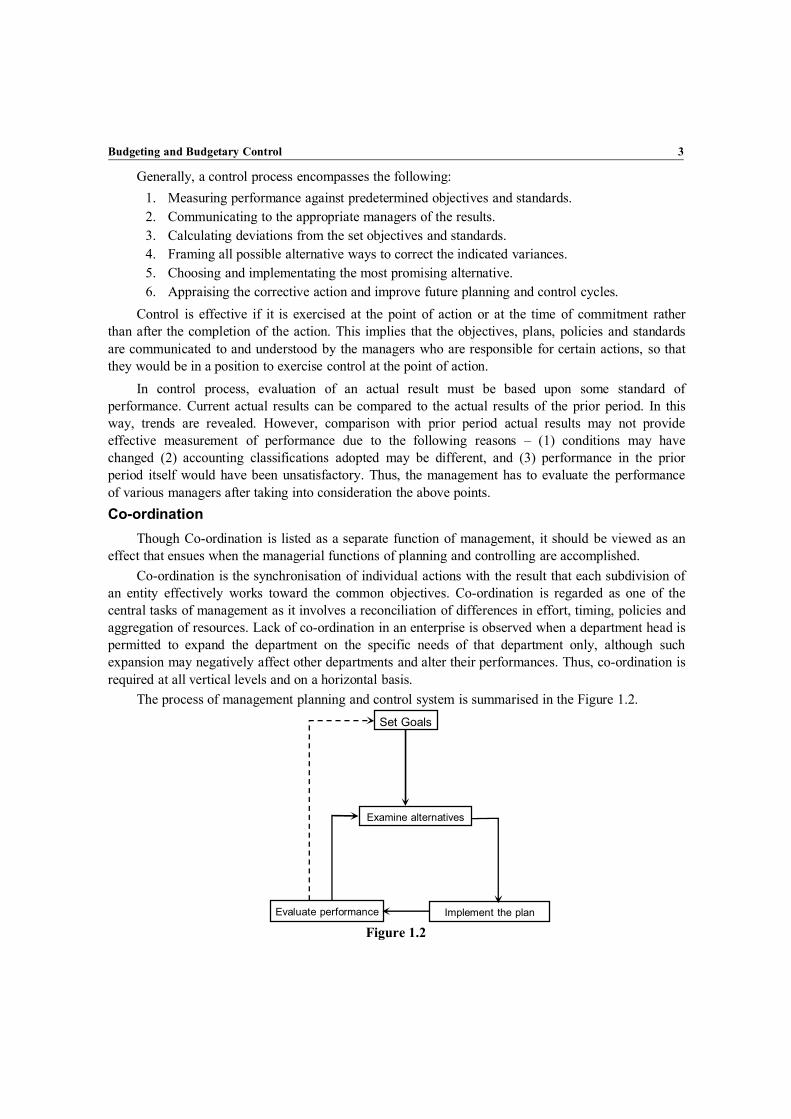
The process of management planning and control system is summarised in the Figure 1.2.Set Goals
Examine alternatives
Implement the planEvaluate performance
Figure 1.2

Budgeting and Budgetary Control4
Role of Accounting InformationAs already said, management planning and control system is related to accounting system. Let us
see how this information enters into planning and control process.Suitable goals are set based on the information provided by the accountants. Projections of future
sales, expenses, incomes [and estimation of profits are made] depending on the accountinginformation.
After setting goals while examining alternatives, information about these alternatives comes fromaccounting system and the accountant is made to combine the data and produce meaningful reports.
Though, implementation of chosen alternative is done by the managers alone without theintervention of accounting system, the accountant is required to collect and summarise data about thesuccess of the chosen plan. The evaluation of performance depends heavily on the facts that theaccountant accumulates and reports.
The flowchart in Figure 1.3 summarises the planning-control cycle and the part played by theaccountants and other information providers.
Set goals
Implementthe plan
Evaluateperformance
Accountinginformation
Examinealternatives
Otherinformation
Figure 1.3
Though, accounting system is helpful in the process of planning and control it should beemphasised that the accountant does not necessarily participate in the management, and that hisinformation may not necessarily prove that the success or failure has been achieved or suffered.
Budgeting as a Tool of Management Planning and ControlBudget is a numeric representation of the manager’s plans for a specified period of time. It is
commonly used by business firms, governmental agencies, non-profit organisations and evenhouseholds. While there is considerable variation in the scope, degree of formality and level ofsophistication applied to budgeting, most of the well managed business firms use budget which is acomprehensive and co-ordinated plan for the operations and resources of the firm.
A Budget can serve as an extremely useful tool for all managers.(i) Communication: A budget can serve as a means of communicating information within a
firm. It is especially useful to lower level managers. For example, the district salesmanagers can know from the budget the level of sales that are expected of them or theproduction manager can know through the budget how much he can spend towards labour

Budgeting and Budgetary Control 5
expenses, etc. The budget serves as a communicator over time. As everyone tends to forgetwhat they have planned without a written record, budget will remind them of their goalsand progress towards the goals.
(ii) Co-ordination: Whenever a manager is faced with managing two or more interrelatedprocesses, he encounters the need to co-ordinate operations to maximise the utilisation ofthe available resources and to minimise idleness. A manager of a small manufacturingconcern needs to co-ordinate such things as raw material purchases, working capital matter,labour union negotiations, etc. As the size of the operations increases, the number of factorsto be co-ordinated increase and the manager is likely to find himself in a precarioussituation without a concretely stated central plan. Co-ordination is essential whenresponsibility for different segments is delegated to separate individuals. The budget canserve for the above purpose of co-ordination.
(iii) Measurement of Success: Success is determined by comparing past performance against aprevious period’s performance. However, this comparison using historical records does nottake into consideration the changes that take place for example, the market for the productmay have increased, etc. Whereas, budgets provides us to compare the actual performancewith the budgeted performance which is an estimate of ‘what might have been’ taking allthe possible changes into account. Though budget is only a prior estimate of futureconditions and thus subject to manipulation, it can be used as a success criterion, if donecarefully and with additional data.
(iv) Motivation: Budgets prepared for the coming year motivates the managers to do their best.And, if a reward system is attached to the budget it further motivates the managers toachieve the levels of output.
Application of the BudgetIn the following areas, budgeting can be applied.
OutputsCareful analysis of future sales will be made. Then the manager will begin to plan production or
purchase requirements to meet the expected sales figure. With the budgets prepared he would be in aposition to utilise the available resources efficiently to meet the anticipated demand.
InputsOnce the Budget establishes a manufacturing firm’s output requirements, the manager can go
about planning for labour and materials acquisition to support the desired output levels. Budgets helpthe managers to plan in advance for future and negotiate labour and material contracts at favourablerates. Without budget he may be forced into emergency purchases at higher costs, less skilled orovertime skilled labour and sometimes he may have to face with no production situation because ofshortage of input. Budget helps managers to avoid off season layoffs and peak period bulges byspreading production more evenly through the year.
FacilitiesGood budgeting also informs the manager about the adequacy of existing facilities for his future
needs. However, this approach will require additional storage of materials and finished products andhence more space. Increased inventory costs leads to increased non-cash working capital and hence

Budgeting and Budgetary Control6
cash may be borrowed until sales can be made. Thus, budgeting facilitates the above anticipations andassists in establishing co-ordination. Production of some materials needs special equipment, the needof which can be anticipated by budgeting and can be procured at favourable terms instead of a rushrental.
AdministrationBudgeting applies equally well to administrative activities. Needs for clerks, storekeepers, book-
keepers, secretaries, office supplies, etc., can be handled in the similar fashion through foresight andplanning. Anticipation can lead to efficiency and higher profits in the office as well as in theproduction.
Cash Needs
Budgeting provides estimation of future receipts and disbursements. Careful planning facilitatesthe treasurer to minimise the chances of running out of cash and go bankrupt and also avoids situationsof excess cash which is not capable of earning income.
ControlA well-structured budget can lead to efficient control of the firm as the manager has an indication
of what should be done and can more easily spot what is being ineffectively done.
Organisation of the BudgetThe following guidelines may be followed in preparing a budget.Assigning personnel: The manager of an entity should assign his most qualified personnel to the
preparation of the budget. The organisation chart that is generally found in medium sized firms isshown in Figure 1.4.
President
Vice-presidentProduction
Vice-presidentMarketing
Vice-presidentAdministration
Vice-presidentFinance
(Controller)
Figure 1.4
The four vice-presidents have responsibility for their respective functional areas. Each willdelegate authority to his subordinates in order to get work done. Though, the Vice-president forfinance provides information required by other departments, he makes decisions concerning theoperation of his own department only.
A better course of action is to establish a budget committee with representation from each of thefinancial areas. A Budget Committee usually reports directly to top management. In large companiesthe budget committee is composed of executives in-charge of major functions of the business andincludes the sales manager, personnel manager, finance manager, the production manager, the chiefengineer, the treasurer and the chief accounts officer. One member of the budget committee is thebudget director who is in-charge of preparing a budget manual of instructions and accumulating the

Budgeting and Budgetary Control 7
proposed budget data. In large companies, the position may be full-time job; in smaller companies, thepost may be assigned to the finance manager or chief accounts officer or some other officer who actsas budget director on a part-time basis.
The principal functions of the budget committee are to: Decide the company’s general policies and objectives; Receive and review individual budget estimates concerning different departments/units/
division; Suggest changes, modifications in accordance with organisational objectives; Approve budgets which act as an authority/target for departmental action; Receive and analyse performance reports regarding the implementation of budgets; Suggest corrective action to improve efficiency and achieve budgetary goals.
Deriving Budget FiguresThere are three ways that the budget committee can derive the estimates that appear in the final
budget.In one approach, known as imposed budget or top-down approach, the budgeted quantities are
obtained from the top level managers and then communicated downward to the lower level managers.Low level managers do not participate in this type of budget, i.e., they have nothing to say about whatis expected of them.
One important advantage of this type of budgeting is that the top level managers are involved inplanning decisions and as such they have wider perspective of the firm’s operation and would be in aposition to allocate various resources among the various areas of responsibility.
Additionally, this is very cheaper because of the relatively fewer persons involved. However, thisapproach has two disadvantages. Firstly, top level managers, due to their positions, are separated fromactual production and marketing processes and their allocation of resources to various areas would bewithout specific knowledge and as such may not be proper. Secondly, as the low level managers donot participate in preparing the budget, they are not motivated to work as per the estimates.
Another approach, known as participative approach is designed to eliminate the abovedisadvantages of imposed budgeting. In participating approach, estimations of lower level managersare coordinated and communicated upward to the top level managers. As lower level managers aregiven special importance in the preparation of budget figures, they will make special efforts to meetthose goals. Participating approach rests on the belief that the low level managers who involve in day-to-day activities know very well his requirements and abilities and as such can give proper budgetedfigures.
However, this approach too has disadvantages. Firstly, the manager may inflate the importance ofhis own area of responsibility and produce unrealistic demands. Secondly, to be in a comfortableposition, each manager may provide for more inputs than required. And, from practical point of view,this approach is costlier to imposed approach.
Keeping in view the disadvantages of both the approaches, very few firms follow either a pureimposed or a pure participating approach. Thus, generally what is followed is the mixed approach,known as negotiated approach in which the possible goals set by higher level managers are

Budgeting and Budgetary Control8
communicated downward to lower level managers for their acceptance. If the lower levels are notsatisfied with the set goals they are allowed to suggest alternatives, either in terms of expectations orresources. Then, the upper management makes the necessary alternation. It is believed that thisapproach brings out the advantage of the other two, i.e., it combines a broad perspective of topmanagement with precise knowledge of line managers. It also achieves a personal commitment fromthe lower levels to reasonable goals. Of course, all these advantages are obtained at a cost of highmanagerial expenses.
Selecting the Time FrameThe time/budget period is an important factor in developing a comprehensive budgeting
programme. This is the period for which forecasts can reasonably be made and budgets can beformulated. A business enterprise generally prepares a Short-range budget and a Long-range budget.
Short-range BudgetShort-range budgets may cover periods of three, six or twelve months depending upon the nature
of the business. Most manufacturing firms use one year as the planning period. Wholesale and retailfirms usually employ a six-month budget which is related to their selling seasons. In determining theperiod of the Short-range budget, the following factors should be considered.
The budget period should be long enough to cover complete production of various products.For business of a seasonal nature, the budget period should cover at least one entire seasonal
cycle.The budget period should be long enough to allow for the financing of production well in
advance of actual needs. It should provide adequate time to arrange the funds for production and otherpurposes.
The budget period should coincide with the financial accounting period to compare actual resultswith the budget estimates and thus to facilitate better interpretation of the performance.
Long-range BudgetA Long-range budget or planning is defined as “a systematic and formalised process for
purposefully directing and controlling future operations toward a desired objective for periodsextending beyond one year.” Long-range budgets cover specific areas, such as future sales, futureproduction, long-term capital expenditures, extensive research and development programms, financialrequirements, profit/forecast. They evaluate the future implications associated with present decisionsand help management in making present decisions and select the most profitable alternative. Long-range budgeting does not eliminate risk altogether, it only reduces the risk to a level which does nothamper the production and achievement of company objectives.
There are many factors which are duly considered while preparing long-term budgets, such asmarket trends, economic factors, growth of population, consumption pattern, industrial production,national income, government economic and industrial policy. Quantitative sales can be budgeted for athree to five year period. After forecasting sales, a budgeted profit and loss account can be preparedrelating anticipated sales to corresponding cost and thus net operating profit can be forecasted.Likewise, a balance sheet for many years can be prepared to forecast cash, inventory levels, accountsreceivable, accounts payable, liabilities, etc. The forecasted profit and loss account and balance sheetfor a Long-range is a very useful tool in accomplishing the objectives of the organisation as a whole.

Budgeting and Budgetary Control 9
Limiting or Principal Budget FactorWhen budgets are made, there is invariably some factor which governs or sets a limit to the
quantity which can be made or sold. This is known as the limiting or principal budget factor. Aprincipal budget factor is “the factor the extent of whose influence must first be assessed in order toensure that the functional budgets are reasonably capable of fulfilment.” In the field of sales thelimiting factor is customer demand which is influenced by many factors, such as price and quality ofthe product, competition, the general purchasing power of the public, advertising, etc. In the field ofproduction, the principal budget factor may be plant capacity, the supply of labour of the right qualityor the availability of scarce materials. Sometimes, management itself may impose limiting factors, e.g.,management may control production to maintain a definite price level or management may not decideto purchase plant and machinery and thus to maintain the same plant capacity.
The limiting or principal budget factors must be carefully considered while preparing the budget.If not properly taken into account, budgets may not be realistic and become difficult to achieve. Co-ordination among different departments will be lacking. The principal budget factors can be eliminatedby taking suitable measures, for example, the plant capacity can be increased by purchase of additionalplant.
The Budgeting Process
Budgeting SalesEvery activity of a profit oriented firm must be directed to one overall goal – sales because if the
products cannot be sold at a profit, there would not be any economic reason for the firm to producethem. And also, sales is regarded as the primary source of cash. The capital-additions needed, theproduction level, manpower requirements and other important operational aspects depend on thevolume of sales.
Thus, the sales plan is the foundation for periodic planning in the firm, because practically allother enterprise planning is built on it. The usefulness of the entire budget depends on the reliability ofthe sales estimates. If sales estimate is too low, profits will be lost because the firm will not be able toprovide all the units, the customers demand. And, if the sales estimate is too high, the firm has to incurmore costs than it can recover by sales. Hence, a great deal of effort should be expended on thepreparation of the forecast of sales.
Much of the expertise for the preparation of sales forecast is generally found within themarketing staff of the firm. This group will gather information from many sources and marketingstudies are done to determine whether the market for the product still exists or not and if it does howlarge it will be. Various possibilities such as price changes, etc., are evaluated and various strategiesare framed. The Budget Committee will accept the best one among the various alternatives and theplanning phase begins. An important factor considered in the planning of the sales volume is price atwhich the product can be sold.
Pricing DecisionThree important factors that affect pricing decision are demand for the product, cost recovery and
profit margins.

Budgeting and Budgetary Control10
DemandBefore deciding the price of the product a firm has to check whether market already exists for
that product or whether it is a new product in the market. If it is already an existing product in themarket, it can charge a higher price for the product only when it can create products with superiorquality. Or else, it should check whether it is profitable for it to sell at the existing price or at a lowerone. If, on the other hand, the product is a new one, though it has freedom in selecting the price levelin the beginning it should build flexibility into the pricing system so that it can respond quickly to anystrategy that may be employed by others later.
Another approach is first to determine the price in order to attract the customers and then to designthe product in such a way that it can be manufactured at a cost sufficiently low to assure a profit.
Cost RecoveryLaw of economics holds that if a firm has to survive, its total sales revenue should exceed its total
costs. The firm should determine the price level, at which sales revenue exceeds the total costs, whichincludes not only the production costs but also selling and administration costs. Thus, the firm canadopt cost-plus strategy, i.e., to determine the selling price by adding profit margin to the average unitcost. This approach should be made by careful market research as it completely neglects thecompetition. It assumes that the competitors will essentially have the same cost and same profitmargin as the firm has.
Profit MarginsThe third major point to be considered in establishing prices concerns the amount of profit that
management would like to achieve in the upcoming time period. Generally, the goal of themanagement is to obtain satisfactory profits. Usually, businessmen employ two measures in gaugingthe size of the profits. They are return on sales and return on investment. Return on sales represents theportion of each sales dollar that eventually ends up as a profit and return on investment is the ratiobetween net profits and the assets used to produce those profits. Whatever is the measure employed,the firms should determine the rate of return required and establish the desired amount of profit andthen select the pricing policy.
Sales Budget
After determining the price at which the product is to be sold, it should decide the volume ofunits that it can sell. It cannot establish a high sales volume as the firm may not be able to capture themarket to sell that many units. Then, the sales budget is prepared which is the numeric representationof the marketing department plans for the coming year.
Table 1.1 presents a specimen of a sales budget.
Table 1.1: ABC Company Ltd.Sales Budget for the year ending December 31, 2001
Products Budgeted Sales Units Budgeted Sales Price TotalA 70,000 55 38,50,000B 80,000 40 32,00,000
1,50,000 70,50,000

Budgeting and Budgetary Control 11
Budgeting ProductionOnce the sales forecast is established, it is the task of the budget committee to prepare plans for
making the product available for sale. The requirements of the sales plan must be translated into thesupporting activities of the other major functions. In the case of a service company, the sales plan mustbe converted to service capability requirements; for a retail or wholesale enterprise, the sales plan mustbe translated into merchandise purchases requirements; and in the case of a manufacturing enterprise,the sales plan must be converted to production (manufacturing) requirements.
OutputsAs the sales forecast deals with the number of units to be sold, production budget deals with the
products that are to be produced/manufactured. In rare cases production output equals sales. It ishighly possible that some of the items sold comes from the inventory held or some of the unitsproducts add up to the inventory held. So, production management should not only co-ordinate withsales management but also with inventory management.
The general equation which deals with flow of goods is:Beginning inventory + Production – Sales = Ending inventory.This can also be expressed as:Production = Sales + Change in Inventory.Where change in inventory is equal toEnding Inventory – Beginning Inventory.Thus, if there is no change in inventory then cost of production will be equal to cost of goods to
be sold. But, if the management feels that the future sales will be growing it will seek to utilise asmuch production capacity as possible in case of inflation in order to produce at the lowest costpossible and to earn revenues later. In this case, as the inventories have to be increased in anticipationof being sold at higher prices, production must also be increased. On contrast, if a decline in futuredemand is expected, it is appropriate to reduce the inventory in order to avoid holding losses fromdecline in prices and thus production has to be below sales volume.
Table 1.2 exhibits a specimen of production budget.
Table 1.2: ABC Company Ltd.Production Budget for the year ended December 31, 2001
ProductsA B
Budgeted Sales (in units) 70,000 80,000Add: Desired closing finished goods inventory 20,000 30,000
90,000 1,10,000Less: Beginning finished goods inventory 40,000 20,000Budgeted production requirement 50,000 90,000
The Schedule presented above is the overall production budget for ABC Company Ltd. Thepublication of the production budget accomplishes the co-ordination of the efforts of the production

Budgeting and Budgetary Control12
and sales divisions. The latter group knows what it has to sell and the former knows what it has toproduce.
Inputs
The production budget forms the basis for direct labour budgets, material budgets andmanufacturing overheads budgets. Figure 1.5 presents graphically the flow of the planning activityfrom sales through the manufacturing executive’s plan.
Sales Plan
Finished GoodsInventory Change
ProductionPlan
Basis for
MaterialsBudgets
Direct LabourBudgets
ManufacturingOverheads Budget
±
=
Figure 1.5
Thus, after co-ordinating plans for output, the next step for the production manager is toanticipate the acquisition of direct labour, direct material and manufacturing overhead expenses.
Direct labour costs consists of wages paid to employees who are engaged directly in specificproductive output. Thus, direct labour budget represents the direct labour requirements necessary toproduce the types and quantities of outputs planned in the production budget.
In planning for direct labour, the manager needs to examine such areas: manpower needs,recruitment, training, job evaluation and specification, performance evaluation, union negotiations andwage contracts.
The manager should identify his needs for skilled labour and see whether he can provide for themfrom the existing payroll or whether he can train some of his employees. He has to determine the priceper labour hour. He must also carefully consider the requirements of union contracts before preparinga labour budget.
Table 1.3 illustrates the preparation of a direct labour budget.
Budgeting and Budgetary Control 13
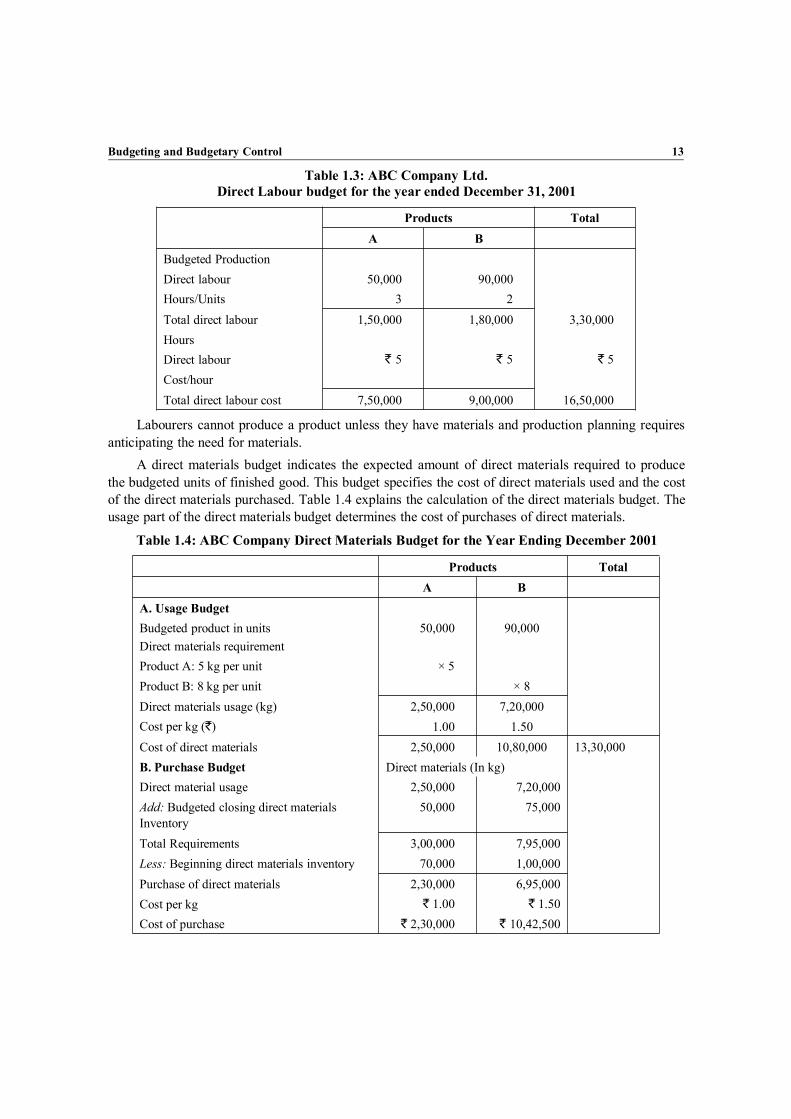
Table 1.3: ABC Company Ltd.Direct Labour budget for the year ended December 31, 2001
Products TotalA B
Budgeted ProductionDirect labour 50,000 90,000Hours/Units 3 2Total direct labour 1,50,000 1,80,000 3,30,000HoursDirect labour ` 5 ` 5 ` 5Cost/hourTotal direct labour cost 7,50,000 9,00,000 16,50,000
Labourers cannot produce a product unless they have materials and production planning requiresanticipating the need for materials.
A direct materials budget indicates the expected amount of direct materials required to producethe budgeted units of finished good. This budget specifies the cost of direct materials used and the costof the direct materials purchased. Table 1.4 explains the calculation of the direct materials budget. Theusage part of the direct materials budget determines the cost of purchases of direct materials.
Table 1.4: ABC Company Direct Materials Budget for the Year Ending December 2001
Products TotalA B
A. Usage BudgetBudgeted product in unitsDirect materials requirement
50,000 90,000
Product A: 5 kg per unit × 5Product B: 8 kg per unit × 8Direct materials usage (kg) 2,50,000 7,20,000Cost per kg (`) 1.00 1.50Cost of direct materials 2,50,000 10,80,000 13,30,000B. Purchase Budget Direct materials (In kg)Direct material usage 2,50,000 7,20,000Add: Budgeted closing direct materialsInventory
50,000 75,000
Total Requirements 3,00,000 7,95,000Less: Beginning direct materials inventory 70,000 1,00,000Purchase of direct materials 2,30,000 6,95,000Cost per kg ` 1.00 ` 1.50Cost of purchase ` 2,30,000 ` 10,42,500

Budgeting and Budgetary Control14
The direct materials budget is useful in the following ways: It helps the purchasing department to prepare a schedule to ensure delivery of materials
when needed. It helps in fixing minimum and maximum levels of inventories in the stores department. It helps the finance manager to determine the financial requirements to meet production
targets.The materials budget usually deals with direct materials only. Supplies and indirect materials are
generally included in the factory overhead budget.In addition to direct labour and materials budget, the production manager may need to plan for
other manufacturing overhead items like indirect labour, supplies, repairs, power and other factoryoverheads.
The factory overhead budget estimates the requirements and costs of the above overheads for theproduction of the budgeted units. It requires that expenses should be classified by departments sinceexpenses are incurred by various departments. In this way departmental heads should be heldaccountable for expenses incurred by their departments. Generally, the department heads preparebudgets for their respective departments for the budget period. However, they need considerable helpand advice from the budget director in order to achieve production budget.
Table 1.5 depicts the factory overhead budget wherein overhead costs have been classified intofixed and variable components.
Table 1.5: ABC CompanyFactory Overhead Budget for the Year Ending December 2001
(based on budgeted capacity of 3,30,000 direct labour hours)
Items Direct Labourhours
Rate per directlabour hour (`)
Total Cost
A. Variable factory overheadsSupplies 3,30,000 0.70 2,31,000Repairs 3,30,000 0.30 99,000Indirect Labour 3,30,000 0.70 2,31,000Others 3,30,000 0.25 82,500Total variable factory Overheads cost 6,43,500B. Fixed FactoryOverheads costSupervision 3,00,000Depreciation 3,50,000Property tax 1,50,000Others 2,06,500Total fixed factory Overheads cost 10,06,500Total factory Overheads cost 16,50,000pre-determined overhead rate
=hours000,30,3000,50,16`
= ` 5 per direct

Budgeting and Budgetary Control 15
Budgeting Closing InventoriesAn inventory budget can be prepared to find out the values of direct materials and finished goods
inventory as shown in Table 1.6
Table 1.6: ABC CompanyEnding Inventory Budget for the Year Ending December, 2001
`
Direct materials inventory 50,000Product A 50,000 kg × ` 1.00 per kg 1,12,500Product B 75,000 kg × `1.50 per kg 1,62,500Finished goods inventory 7,00,000Product A 20,000 units × ` 35.00 9,60,000Product B 30,000 units × ` 32.00 16,60,000
* Manufacturing cost per finished unit (calculated in Table.1.7)
Table 1.7
Product A Product BQuantityRequiredKgs/hrs
Unit cost`
ProductUnit Cost
`
QuantityRequiredKgs/hrs
Unit cost`
ProductUnit Cost
`
Direct material 5 1.00 ` 5.00 8 1.5 ` 12.00Direct labour 3 5.00 ` 15.00 2 5 ` 10.00Factory overheads 3 5.00 ` 15.00 2 5 ` 10.00Total manufacturing costCost per finished unit ` 35.00 ` 32.00
Budgeting Cost of Goods SoldAfter preparing direct materials, direct labour, factory overhead, and ending inventory budgets,
the cost of goods sold budget can be prepared. The cost of goods sold budget summarises all the abovebudgets as shown in Table 1.8.
Table 1.8: ABC CompanyCost of Goods Sold Budget for the Year Ending December 31, 2001
Direct materials 2,20,000Beginning inventory (70,000 × 1.00 + 1,00,000 × 1.50) 12,72,500Purchases (Table 1.4 B) 14,92,500Less: Closing inventory 1,62,500 13,30,000Cost of direct materials used (Table 1.4 A) 16,50,000Direct labour (Table 1.3) 16,50,000Factory overheads (Table 1.5) 46,30,000Total factory cost

Budgeting and Budgetary Control16
Add: beginning finished goods inventory (40,000 × 35 + 20,000 × 32) 20,40,000Total goods available for sale 66,70,000Less: finished goods inventory (Table 1.6) 16,60,000Cost of goods sold 52,10,000
Budgeting AdministrationThe administrative expense budget covers the administrative costs for non-manufacturing
business activities. Budgeting administrative expense is often difficult. Perhaps the first difficulty is inclassifying certain costs as production or administrative. For example, costs like purchasing,engineering, personnel, research and development can be administrative as well as production. Unlesssuch and other expenses are properly classified, their proper budgeting and subsequent control cannotbe exercised. The second difficulty is in determining the persons responsible for the incurrence andcontrol of these costs.
However, in order to accomplish the purpose of cost control in cost accounting, it is necessarythat each item of cost should be under the jurisdiction and control of a responsible person who isaccountable for incurring the cost. Table 1.9 presents an administrative expense budget.
Table 1.9: ABC CompanyAdministrative Expenses Budget for the year ending December 31, 2001
Items Amount (`) Amount (`)A. Variable administrative expenses:
(i) Supplies 30,000(ii) Clerical wages 65,000
Total variable administrative expenses 95,000B. Fixed Administrative Expenses:
(i) Directors’ remuneration 3,00,000(ii) Legal charges 20,000
(iii) Depreciation 2,50,000(iv) Salaries 43,000(v) Rent 60,000
(vi) Postage, telephone, etc. 32,000Total fixed administrative expenses 7,05,000Total administrative expenses 8,00,000
Budgeting Selling Expenses
Closely related to the sales budget is the selling and distribution cost budget which shows thebudgeted costs of promoting sales for the budget period. It is also known as the marketing expensebudget. A selling expense budget consists mainly of the following major items:
Sales representatives (salaries, commissions, entertaining and travelling). Sales office (office supplies, salaries, postage, telephone, rent and rates). Publicity office (salaries, office costs, press, journals, television, cinema, samples, sundries). Warehousing, packing and dispatch (salaries, packing wages, drivers wages, vehicle, costs,
sundries).

Budgeting and Budgetary Control 17
Table 1.10 exhibits an annual selling expense budget classified according to fixed and variableexpenses. The annual budget should be broken down on a monthly basis so that actual expenses can becompared with the budget monthly. Also, separate budgets for each of these expenses may be preparedespecially in the case of a large company.
Table 1.10: ABC CompanySelling Expenses Budget for the year ending December 31, 2001
Items Amount (`) Amount (`)A. Variable Selling Expenses:
(i) Sales commission 1,00,000(ii) Salary and wages 60,000
(iii) Advertising 30,000(iv) Travelling 60,000
Total variable selling expenses 2,50,000B. Fixed Selling Expenses:
(i) Warehousing 1,00,000(ii) Advertising 75,000
(iii) Marketing Managers’ salary 1,25,000(iv) Depreciation 50,000
Total fixed selling expenses 3,50,000Total selling expenses 6,00,000
Budgeting Cash
The next step in the budgeting process is to prepare cash budget. Managers must be concernedwith the amount of cash that flows in and out of the firm, as well as the amount that happens to be onhand at any particular time. If the firm has less cash than enough to keep the creditors satisfied it mayhave to face a suit filed by the creditors. On the other hand, if the firm has excess cash on hand, thefirm would earn no income on it. So, the cash manager must have neither too little nor too much.
The first step, then, in preparing cash budget is to establish the desired amount to have on hand, i.e.,which will be enough to meet any emergencies. The second step requires the manager to identify all thesources from which cash flows into the firm, like revenues from sales, borrowings, etc. He must alsoestimate the timing of the cash inflow. The third step is to identify the applications or uses of cash, suchas payment for purchases, utility bills, salaries, etc. Even here he has to estimate the timing of the flow.Finally, these predictions are brought together in the cash budget, and the results are analysed. If therewill be excess funds on hand, then plans should be made to find profitable temporary investments tooccupy them and if shortages are predicted the manager should plan for short-term loans.
Table 1.11 presents a typical cash budget.

Budgeting and Budgetary Control18
Table 1.11: ABC Company Cash Budget for the year ended
Amount (`) Amount (`)Beginning cash balance 2,00,000Add: Receipts:
Cash Sales (50% of current year’s sales) 35,25,000Receivables Collections (50% of previous year’s sales) 32,50,000Investment income 0 67,75,000
Total cash available for use 69,75,000Less: Expenditures:
Cash Purchases 12,72,500Labour and Factory Overheads 33,00,000Administrative and Selling Expenses 14,00,000
Total cash to be used 59,72,500Net cash available 10,02,500
Budgeted Financial Statements
After plans have been made for the firm’s cash, revenues, costs and asset acquisitions, it ispossible to prepare budgeted financial statements. These statements will be identical to ordinary onesexcept that they will show the expected results of the operations for the forthcoming year and expectedfinancial position as on that particular future date.
Tables 1.12 and 1.13 shows the Budgeted Income Statement of ABC Co. Ltd. and a typicalbalance sheet respectively. These statements along with cash budget represents the Master Budgetwhich is presented to the board of directors by the budget committee.
Table 1.12: ABC Company Ltd.Budgeted Income Statement for the year ended December 31, 2001
Amount (`) Amount (`)Sales (Table 1.1) 70,50,000Cost of goods sold (Table 1.8) 52,10,000Gross Margins 18,40,000Selling Expenses (Table 1.10) 6,00,000Administrative Expenses (Table 1.9) 8,00,000 14,00,000Income before taxes 4,40,000Income taxes (assuming 40%) 1,76,000Net income 2,64,000

Budgeting and Budgetary Control 19
Table 1.13: ABC Company Ltd.Budgeted Balance Sheet as on December 31, 2001
Capital and Liabilities Amount(`)
Assets Amount(`)
Equity Capital 60,00,000 Fixed Assets: 25,00,000Reserves and Surplus 7,00,000 Less: Depreciation @
26% Investments 6,50,000 18,50,000Add: Budgeted NetIncome 2,64,000 9,64,000Long-term Loans 10,00,000 Current Assets:Current liabilities: Cash 10,02,500Sundry Creditors 60,000 Sundry debtors 35,25,000Accrued Expenses: Closing Inventories
(1,62,500 + 6,60,000)18,22,500
Income-tax payable 1,76,00082,00,000 82,00,000
Revision of Budgets
As stated earlier in the chapter, successful budgets should have adequate flexibility to meetchanging business conditions. Since budgets are used for planning, operation, co-ordination andcontrol, they should be revised if changes occur in the environment. Revision of budgets may benecessary due to the following factors some of which might have been considered earlier in thedevelopment of budgets:
Errors committed in preparing the budgets which may subsequently be known. Emergence of unforeseen and unanticipated situations which may cause the budget to be
revised. Changes in internal factors, e.g., production forecast, sales forecast, capacity utilisation, etc. Changes in external factors, e.g., market trends, nature of the economy, prices of inputs and
resources, consumers’ tastes and fashions.
Fixed and Flexible BudgetingFixed Budgeting
A fixed budget is the budget which is designed to remain unchanged irrespective of the level ofactivity actually attained. It is based on a single level of activity. A fixed budget performance reportcompares data from actual operations with the single level of activity reflected in the budget. It isbased on the assumption that the company will work at some specified level of activity and that astated production will be achieved. Fixed budgets do not change when production level changes.
However, in practice, fixed budgeting is rarely used. The main reason is that actual output isoften significantly different from the budgeted control. The performance report may be misleading andwill not contain very useful information. For example, if actual production is 12,000 units in place of

Budgeting and Budgetary Control20
the budgeted 10,000 units the cost incurred cannot be compared with the budget which relates todifferent levels of activity. Since, in fixed budgeting, units are overlooked, a cost to cost comparisonwithout considering the units may give misleading results.
Flexible BudgetingA flexible budget is defined as “a budget which by recognising the difference between fixed,
semi-fixed and variable costs, is designed to change in relation to the level of activity attained.”A flexible budget is a budget that is prepared for a range, i.e., for more than one level of activity.
It is a set of alternative budgets to different expected levels of activity. Thus, a flexible budget mightbe developed that would apply to a “relevant range” of production, say 8,000 to 12,000 units. Underthis approach, if actual production slips to 9,000 units from a projected 10,000 units, the manager hasa specific tool (i.e., the flexible budget) that can be used to determine budgeted cost at 9,000 units ofoutput. The flexible budget provides a reliable basis for comparisons because it is automaticallygeared to changes in production activity.
Steps in Flexible BudgetingThe following steps (stages) are involved in developing a flexible budget: Deciding the range of activity to which the budget is to be prepared. Determining the cost behavior patterns (fixed, variable, semi-variable) for each element of
cost to be included in the budget. Selecting the activity levels (generally in terms of production) to prepare budgets at those
levels. Preparing the budget at each activity level selected by associating the activity level with
corresponding costs. The corresponding costs to be attached with each activity level aredetermined in terms of their behaviour, i.e., fixed, variable and semi-variable.
Zero-based budgeting: A budget is developed usually on the concept of incrementalism. In case ofbudgeting in organisations, past events are considered in the light of future probabilities. The influence ofpast is strong in the budget of an ongoing activity and many entries may ultimately become just lastyear’s figures plus a fixed percentage over and above that value. Since previous year’s figures areconsidered as base, any inaccuracies in those figures are carried forward year after year.
But in zero-based budgeting, this can be avoided. In case of ZBB, each manager is asked toprepare his own requirement of funds beginning from scratch, ignoring the past and he has to justifythe requirements mentioned by him. Hence, the main idea behind ZBB is to challenge the existence ofevery budgetary unit and every budget period.
IllustrationsIllustration 1: Prepare the Sales Budget from the following data:Product January FebruaryX 1200 units 1800 unitsY 3600 units 5400 unitsThe sales area A and B account for 60% and 40% sale of product X and 30% and 70% sale of
product Y respectively.

Budgeting and Budgetary Control 21
The selling price per unit of product X ` 24 and the selling price per unit of product Y ` 30 inboth the sales areas.
Solution:January Sales Budget
Product Area Units ` `X A 720 24 17,280
B 480 24 11,520Total 1,200 28,800
Y A 1,080 30 32,400B 2,520 30 75,600
Total 3,600 1,08,000
February Sales BudgetProduct Area Units ` `
X A 1,080 24 25,920B 720 24 17,280
Total 1,800 43,200Y A 1,620 30 48,600
B 3,780 30 1,13,400Total 5,400 1,62,000
Total Sales BudgetProduct Area Units ` `
X A 1,800 24 43,200B 1,200 24 28,800
Total 3,000 72,000Y A 2,700 30 81,000
B 6,300 30 1,89,000Total 9,000 2,70,000
Illustration 2: A manufacturing company is operating at 75% of its full capacity. It is proposed tooffer a price reduction of 5% to 10% depending upon volume desired. Given below are the relevant data:
Capacity 75% 85% 100%Output (units) 75,000 85,000 1,00,000Selling price unit ` 96 5% off 10% offMaterial cost per unit ` 40 10% less 15% lessWages cost per unit ` 10 ` 10 ` 10
Fixed overheads:Production ` 14,00,000Selling and distribution ` 5,00,000Variable overheads: (at full capacity)Selling and administration ` 4,40,000Production ` 14,00,000

Budgeting and Budgetary Control22
(a) Prepare a statement showing variable cost, fixed cost, total cost and profit/loss in terms of `and per unit at 75%, 85% and 100% capacity.
(b) Indicate which of the three levels is most profitable.Solution:
Capacity 75% 85% 100%Units 75,000 85,000 1,00,000
p/u Amt. p/u Amt. p/u Amt.Sales (a) 96 72,00,000 91.20 77,52,000 86.40 86,40,000Less: Variable CostMaterial 40 30,00,000 36 30,60,000 34 34,00,000Wages 10 7,50,000 10 8,50,000 10 10,00,000Variable production o/h 14 10,50,500 14 11,90,000 14 14,00,000Variable selling and admn. o/h 4.40 3,30,000 4.40 3,74,000 4.40 4,40,000Total variable cost (b) 68.4 51,30,000 64.4 54,74,000 62.40 62,40,000Contribution (a-b) 27.6 20,70,000 26.8 22,78,000 24 24,00,000Fixed overheads:Production 18.67 14,00,000 16.47 14,00,000 14,00,000Selling and Administration 6.67 5,00,000 5.88 5,00,000 14 5,00,000Profit 2.27 1,70,000 4.47 3,78,000 6 5,00,000
Recommendation: Operating at 100%, i.e., at full capacity is most profitable.Illustration 3: A Factory is currently working at 50% capacity and produces 30,000 units and
also sold each at ` 225 per unit. Prepare a Flexible Budget and estimate the profit of the companywhen it works to 75% and 90% capacity. Assume that all units produced are sold at the same sellingprice per unit as shown above.
Following information is provided to you:(i) Variable Expenses:
Materials ` 60 per unitLabours ` 40 per unitOther Expenses ` 15 per unit
(ii) Semi-variable Expenses: (at 50% capacity)Indirect Labour ` 1,50,000Indirect Materials ` 2,10,000General Administrative Expenses ` 2,70,000Repairs and Maintenance ` 1,20,000Salesmen Salaries ` 1,80,000
(iii) Fixed Expenses:Office and Management Salaries ` 5,40,000Office and Factory Rent and Taxes ` 6,00,000Sundry Administrative Expenses ` 7,20,000Depreciation on Machinery and Furniture ` 4,50,000

Budgeting and Budgetary Control 23
(iv) Semi-variable expenses remain constant up to 60% of capacity, increasing by 10% between60% and 80% capacity and by 20% between 80% and 100% capacity.
(v) Rate per unit of variable expenses remains same.Solution:
Flexible Budget
30,000 units50%
45,000 units75%
54,000 units90%
(i) Variable Expense ` ` `
Materials 18,00,000 27,00,000 32,40,000Labours 12,00,000 18,00,000 21,60,000Other Expenses 4,50,000 6,75,000 8,10,000(ii) Semi-variable ExpensesIndirect Labour 1,50,000 1,65,000 1,80,000Indirect Materials 2,10,000 2,31,000 2,52,000General Administrative Expenses 2,70,000 2,97,000 3,24,000Repairs and Maintenance 1,20,000 1,32,000 1,44,000Salesmen Salaries 1,80,000 1,98,000 2,16,000(iii) Fixed ExpensesOffice and Management Salaries 5,40,000 5,40,000 5,40,000Office and Factory Rent and Taxes 6,00,000 6,00,000 6,00,000Sundry Administrative Expenses 7,20,000 7,20,000 7,20,000Depreciation on Machinery and Furniture 4,50,000 4,50,000 4,50,000Total Cost 66,90,000 85,08,000 96,36,000
`(30,000 × 225)
`(45,000 × 225)
`54,000 × 225
Sales 67,50,000 1,01,25,000 1,21,50,000Less: total cost 66,90,000 85,08,000 96,36,000Profit 60,000 16,17,000 25,14,000
Illustration 4: The following information relates to the productive activities of Delta Ltd. For 3months ending on 31st March 2008:
Particulars
Variables Expenses: (at 50% capacity) `
– Materials 6,00,000– Labour 6,40,000– Salesmen’s Commission 95,000
13,35,000Semi-variable Expenses: (at 50% capacity)– Plant Maintenance 62,500– Indirect Labour 2,47,500

Budgeting and Budgetary Control24
– Salesmen’s salaries 72,500– Sundry 65,000
4,47,500Fixed Expense:– Management Salaries 2,10,000– Rent and Taxes 1,40,000– Depreciation of Machinery 1,75,000– Sundry Office Expenses 2,22,500
7,47,500It is further noted that semi-variable expense remain constant between 40% and 70% capacity,
increase by 10% of the above figures between 70% and 85% capacity and increased by 15% of theabove figures between 85% and 100% capacity.
Fixed expenses remain constant whatever the level of activity may be. Sales at 60% capacity are` 25,50,000, at 80% capacity are ` 34,00,000 and at 100% capacity are ` 42,50,500.
Assuming that all items produced are sold, you are required to prepare a flexible budget at 60%,80% and 100% capacity.
Solution:
In the Books of Delta Ltd.Flexible Budget for 3 months ending 31-3-2008
Capacity 60% 80% 100%
A. Fixed Expenses:Management Salaries 2,10,000 2,10,000 2,10,000
Rent and Taxes 1,40,000 1,40,000 1,40,000
Depreciation of Machinery 1,75,000 1,75,000 1,75,000
Sundry Office Expenses 2,22,500 2,22,500 2,22,500
Total (A) 7,47,500 7,47,500 7,47,500
B. Semi-variable Expenses:Plant Maintenance 62,500 68,750 71,875
Indirect Labour 2,47,500 2,72,250 2,84,625
Salesmen’s salaries 72,500 79,750 83,375
Sundry 65,000 71,500 74,750
Total (B) 4,47,500 4,92,950 5,14,625
C. Variable Expense:
Materials 7,20,000 9,60,000 12,00,000
Labour 7,68,000 10,24,000 12,80,000
Salesmen’s Commission 1,14,000 1,52,000 1,90,000

Budgeting and Budgetary Control 25
Total (C) 16,02,000 21,36,000 26,70,000
D. Total Exp. (A + B + C) 27,97,000 33,75,750 39,32,125
E. Sales 25,50,000 34,00,000 42,50,000
F. Profit/Loss 2,47,000 24,250 3,17,875
Illustration 5: The following are the estimated sales of a company for eight months ending 30-11-2008:
Months Estimated Sales (Units)April 2008 12,000May 2008 13,000June 2008 9,000July 2008 8,000August 2008 10,000September 2008 12,000October 2008 14,000November 2008 12,000
As a matter of policy, the company maintains the closing balance of finished goods and rawmaterials as follows:
Stock Items Closing balance of a monthFinished goods 50% of the estimated sales for the next monthRaw Materials Estimated consumption for the next month.Each unit of production requires 5 kg. of raw material costing ` 5 per kg.Prepare Production Budget (in units) and Raw Material Purchase Budget (in units and cost) of the
company for the half year ending 30th September, 2008.Solution:
Production Budget (in units)For the half year ending 30th Sept. 2008
Month Sales in Units Closing Bal. 50% of EstimatedSales for Next Month
Opening Bal. Production (2+ 3 + 4)
(1) (2) (3) (4) (5)April 12,000 6,500 6,000 12,500May 13,000 4,500 6,500 11,000June 9,000 4,000 4,500 8,500July 8,000 5,000 4,000 9,000August 10,000 6,000 5,000 11,000Sept. 12,000 7,000 6,000 13,000
64,000 65,000

Budgeting and Budgetary Control26
Purchase Budget (in Cost and Units)For the half year ending 30th Sept. 2008
Month Productionin Units
Consumption kg.` 2/- per Unit
ClosingBalance
OpeningBalance
Purchasein kg.
Rate`
Amount
April 12,500 25,000 22,000 25,000 22,000 5 1,10,000May 11,000 22,000 17,000 22,000 17,000 5 85,000June 8,500 17,000 18,000 17,000 18,000 5 90,000July 9,000 18,000 22,000 18,000 22,000 5 1,10,000August 11,000 22,000 26,000 22,000 26,000 5 1,30,000Sept. 13,000 26,000 26,000 26,000 26,000 5 1,30,000
65,000 1,30,000 1,30,000 6,55,000
Illustration 7: A manufacturing company submits the following figures for the first Quarter of2003.
Sales/MonthProduct in units
X Y
JanuaryFebruaryMarch
25,00020,00030,000
30,00025,00035,000
Selling price per unit product X `10 product Y ` 20Prepare a sales budget based, on the above data for the first Quarter of 2004 assuming,(a) Sales quantity increase of X by 20%, Y by 10%(b) Sales price increase of X : nil, Y : 10%Solution:NOTE: U = units, SP = selling price, A = Amount
Sales Budget
Actuals for 2003
January February March TotalU x SP= A U x SP= A U x SP= A U x SP= A
ProductX
ProductY
25,000
30,000
10
20
2,50,000
6,00,000
20,000
25,000
10
20
2,00,000
5,00,000
30,000
35,000
10
20
3,00,000
7,00,000
75,000
90,000
10
20
7,50,000
18,00,000
_ _ 8,50,000 _ _ 7,00,000 _ _ 10,00,000 _ _ 25,50,000

Budgeting and Budgetary Control 27
Budgeted for 2004
January February March TotalU x SP= A U x SP= A U x SP = A U x SP= A
ProductX
ProductY
30,000
33,000
10
22
3,00,000
7,26,000
24,000
27,500
10
22
2,40,000
6,05,000
36,000
38,500
10
22
3,60,000
8,47,000
90,000
99,000
10
22
9,00,000
21,78,000_ _ 10,26,000 _ _ 8,45,000 _ _ 12,07,000 _ _ 30,78,000
Illustration 8: (Flexible budget)Lucky Ltd. is currently operating at 75% of its capacity. In the past two years, the levels of
operation were 55% and 65% respectively. Presently the production is 75000 units. The company isplanning for 85% capacity level during 2005-2006. The cost details are as follows:
Particulars`
55% 65% 75%Direct MaterialsDirect LabourFactory overheadsSelling overheadsAdministrative overheads
11,00,0005,50,0003,10,0003,20,0001,60,000
13,00,0006,50,0003,30,0003,60,0001,60,000
15,00,0007,50,0003,50,0004,00,0001,60,000
TOTAL 24,40,000 28,00,000 31,60,000
Profit is estimated @ 20% on SalesThe following increase, in costs are excepted during the year:
(in percentage)Direct Materials 8Direct Labour 5Variable Factory Overhaeds 5Variable Selling Overheads 8Fixed Factory Overheads 10Fixed Selling Overheads 15Administrative Overheads 10Prepare Flexible budget for the current year as well as for the period 2005-2006 at 85% of
capacity.
Budgeting and Budgetary Control28
Solution:
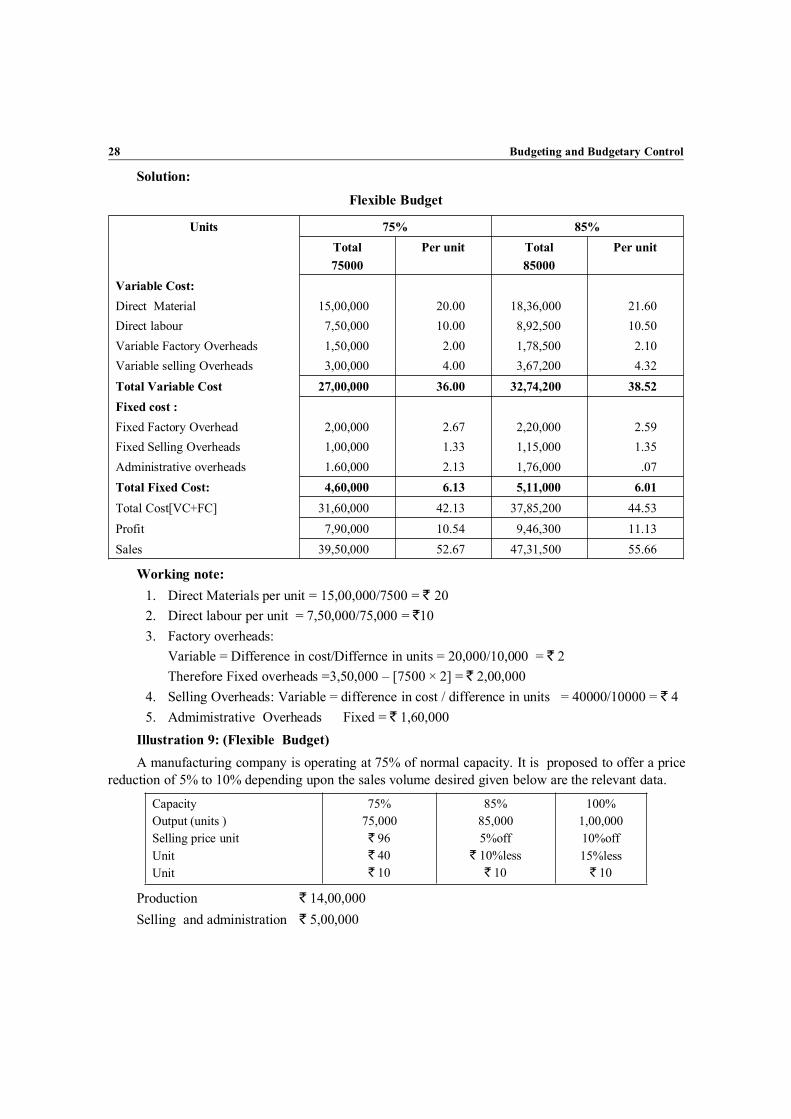
Flexible Budget
Units 75% 85%Total75000
Per unit Total85000
Per unit
Variable Cost:Direct Material 15,00,000 20.00 18,36,000 21.60Direct labour 7,50,000 10.00 8,92,500 10.50Variable Factory Overheads 1,50,000 2.00 1,78,500 2.10Variable selling Overheads 3,00,000 4.00 3,67,200 4.32Total Variable Cost 27,00,000 36.00 32,74,200 38.52Fixed cost :Fixed Factory Overhead 2,00,000 2.67 2,20,000 2.59Fixed Selling Overheads 1,00,000 1.33 1,15,000 1.35Administrative overheads 1.60,000 2.13 1,76,000 .07Total Fixed Cost: 4,60,000 6.13 5,11,000 6.01Total Cost[VC+FC] 31,60,000 42.13 37,85,200 44.53Profit 7,90,000 10.54 9,46,300 11.13Sales 39,50,000 52.67 47,31,500 55.66
Working note:1. Direct Materials per unit = 15,00,000/7500 = ` 202. Direct labour per unit = 7,50,000/75,000 = `103. Factory overheads:
Variable = Difference in cost/Differnce in units = 20,000/10,000 = ` 2Therefore Fixed overheads =3,50,000 – [7500 × 2] = ` 2,00,000
4. Selling Overheads: Variable = difference in cost / difference in units = 40000/10000 = ` 45. Admimistrative Overheads Fixed = ` 1,60,000
Illustration 9: (Flexible Budget)A manufacturing company is operating at 75% of normal capacity. It is proposed to offer a price
reduction of 5% to 10% depending upon the sales volume desired given below are the relevant data.
CapacityOutput (units )Selling price unitUnitUnit
75%75,000` 96` 40` 10
85%85,0005%off
` 10%less` 10
100%1,00,00010%off15%less
` 10
Production ` 14,00,000Selling and administration ` 5,00,000

Budgeting and Budgetary Control 29
Varible overheads:Production ` 14,00,000@ normal capacitySelling and administration ` 4,40,000@ normal unit total cost unit total cost at capacity(a) Prepare a single statement to show profit/loss at each level of output(b) Compute unit variable cost, unit fixed cost and at different levels of outputs and(c) Indicate which of the 3 levels is most profitable
Solution:
Currently capacity Normal capacityUnits 75,000 85,000 1,00,000
Capacity 75% 85% 100%`
P.U.Total
``
P.U.Total
``
P.U.Total
`
Sales(-) Material
WagesVariable Overheads:ProductionSelling and administrationTotal variable costContributionFixed overheads:ProductionSelling and administrationProfit
96.0040.0010.00
14.004.40
72,00,00030,00,000
7,50,000
10,50,0003,30,000
91.2036.0010.00
14.004.40
77,52,00030,60,000
8,50,000
11,90,0003,74,000
86.434.010.0
14.04.4
86,40,00034,00,00010,00,000
14,00,0004,40,000
68.40 51,30,000 64.40 54,74,000 62.4 62,40,00027.60
18.676.67
20,70,000
14,00,0005,00,000
26.80
16.475.88
22,78,000
14,00,0005,00,000
24.0
14.05.0
24,00,000
14,00,0005,00,000
2.27 1,70,000 4.45 3,78,000 5.0 5,00,000
Recommendation: operating at 100% i.e., Normal capacity is most profitableIllustration 10: (Purchase Budget)Solo products manufactures single product and has sales of ` 126 lacs. Profit is 20%. Materials
required are A = 3Ibs of ` 6 per Ib and B = 1.5 of ` 4 per Ib.Labour charges are : Machine shop = ` 4 per hour
Assembly shop = ` 3.20 per hourNumber of Employees : Machine shop = 600
Assembly shop = 180Details of materials, finished goods:
Finished Good MaterialA
MaterialB
Opening stockClosing stock
20,000 units25,000 units
54,000Ibs30,000Ibs
33,000 Ibs66,000 Ibs
Processing time: Machine shop = 7 hrs(per unit of output) Assembly shop = 2 and half hrs

Budgeting and Budgetary Control30
Factory works for 5 days of 8 hrs in a week in a normal 52 weeks a year.Excepted Holidays = 96 hrs }Excepted Leave = 80 hrs } in a yearExpected Absenteesim = 64 hrs}Calculate:
1. Number of units to be sold.2. Purchase budget3. Capacity utilisation of machine and assembly shops
Solution:
Cost Sheet of……
` Per unitMaterial cost:A:3 × 6 = 18B:1.5 × 4 = 6Labour cost:Machine shop : 7 hrs × 4 = 28Assembly shop : 2 ½hrs × 3.20 = 8
24
36Total costProfit = 20%(i.e. profit on sales)
6015
Sales price 75
Total sales = 126 lacsTherefore quantity of sales = sales value/ selling price per unit
= 126lacs/75= 1,68,000 units
Material Budget:Total finished goods units to be produced:
= sales + closing stock – opening stockProduction = 1,68,000 + 25000- 20,000
PRODUCTION = 1,73,000 UNITS
Materials required to produce:
A: 1,73,000 × 3 Ibs = 5,19,000IbsB: 1,73,000 × 1.5 Ibs = 2,59,500 IbsValueFor A: 4,95,000 Ibs × 6 = ` 29,70,000For B: 2,92,500 Ibs × 4 = ` 11,70,000
` 41,40,000

Budgeting and Budgetary Control 31
Capacity utilisation of machine and assembly shops:Total hours in machine shops utilised for production
=1,73,000 × 7 hrs = 12,11,000 hrs requiredTotal hours in assembly shops utilised=1,73,000 × 2 ½ hrs = 4,32,500 hrs requiredTotal hours available:Machine shop 5 days × 8 hrs × 52 weeks × 600 employees = 12,48,000 hrsAssembly shop 5 days × 8 hrs × 52 weeks × 180 employees = 3,74, 400 hrsActual hours available:Machine shop = 12, 48,000 hrs – (*240 × 600)
= 12,48,000 hrs – 1,44,000 = 11,04,000*96 +80+64 = 240
Assembly shop = 3,74,400 hrs – (240 × 180)= 3,74,400 hrs – 43,200 = 3,31,200
Caopacity utilised = HOURS REQUIRED/Actual hours available or Total hours available × 100Machine shop = 12,11,000/11,04,000 × 100
= 109.69% = 1.1times= 130.59% = 1.31 times
Illustration 11: (Manpower Budget)The direct labour requirements of three of the products manufactured in a factory, each involving
more than one labour operation, are estimated as follows;Direct labour hours per unit (in minutes)
Products
Operation Product 1 Product 2 Product 3123
18-9
42126
3024-
The factory works 8 hrs a day, 6 days a week. The budget quarter is taken as 13 weeks andduring a quarter lost hours due to leave and holiday and other causes are estimated to be 124 hrs.
The budget hourly rates for the workers manning the operation 1, 2 and 3 are ` 2.00, ` 2.50,` 3.00 respectively. The budgeted sales of the product during the quarter are:
Product 1 9,000 unitsProduct 2 15,000 unitsProduct 3 12,000 unitsThere is a carry over of 5000 units of product 2 and 4000 units of product 3 and it is proposed to
build up a stock at the end of the budget quarter as follows;

Budgeting and Budgetary Control32
Product 1 1,000 unitsProduct 2 2,000 unitsPrepare a manpower budget for the quarter showing for each operation (i) direct labour hours(ii) direct labour cost and (iii) the number of workers.Solution:Preparation of labour budgetComputation of units to be produced
Product 1 Product 2 Product 3Units to be soldAdd: closing stockLess: opening stockProduction
9,0001,000
_
15,0002,0005,000
12,000_
4,000
10,000 12,000 8,000
Time required (Mts)
Operation Total123
18_9
42126
3024-
903615
Total time required for production;Operation 1:For product 1 = 10,000 × 18 = 1,80,000 MtsFor product 2 = 12,000 × 42 = 5,04,000 MtsFor product 3 = 8,000 × 30 = 2,40,000 Mts
= 9,24,000 MtsOperation 2:For product 1 = 10,000 × – = –For product 2 = 12,000 × 12 = 1,44,000 MtsFor product 3 = 8,000 × 24 = 1,92,000
= 3,36,000 MtsOperation 3:For product 1 = 10,000 × 9 = 90,000 MtsFor product 2 = 12,000 × 6 = 72,000 Mts
= 1,62,000 MtsTotal number of hours available 6264 hoursHours lost in leave, holiday etc. 124 hours
500 hours500 hrs × 60Mts per hour = 30,000 Mts

Budgeting and Budgetary Control 33
Therefore number of labourers required for:For operation 1 = 9,24,000/30,000 = 30.8 labourers = 31 labourersFor operation 2:Time required = 3,36,000/30,000 = 11.2 labourers = 12 labourersFor operation 3:Time required 1,62,000 MtsTime available 30,000 MtsTherefore labourers required = 1,62,000/30,000 = 5.4 labourers = 6 labourersLabourer hours required:Operation 1 = 9,24,000/60 = 15,400 hrsOperation 2 = 3,36,000/60 = 5,600 hrsOperation 3 = 1,62,000/60 = 2,700 hrsLabour cost:Operation 1 = 9,24,000/60 × 2 = ` 30,800Operation 2 = 3,36,000/60 × 2.50 = ` 14,000Operation 3 = 1,62,000/60 × 3 = ` 8,100
Total = ` 52,900Illustration 12: (Flexible budget)A factory engaged in manufacturing plastic bucket is working to 40% capacity and produces
10,000 buckets per annum. The present cost break up for one bucket is as under:Materials ` 10Labour cost ` 3Overhead (60% FIXED) ` 5The selling price is ` 2 per bucket. It is decided to work the factory at 50% capacity, the selling
price falls by 3%. at 90% capacity the selling price falls by 5% accompanied by a similar fall evenpoints for the same capacity of production.
Solution:
Capacity 100% 90% 50% 40% (given)Units 25,000 22,500 12,500 10,000
Particulars ` ` ` `
Sales(–)variable costs:MaterialLabour
20
1032
5,00,000
2,50,00075,00050,000
19
9.532
4,27,500
2,13,75067,50045,000
19.4
1032
2,42,500
1,25,00037,50025,000
20
1032
2,00,000
1,00,00030,00020,000

Budgeting and Budgetary Control34
Variable Overheads
Contribution
(–)fixed costsProfitP/v ratio = C/SBEP = FC/P/VBEP(`)BEP (units)
51.2
1,25,00030,000
4.51.33
1,01,25030,000
4.42.4
55,00030,000
53
50,00030,000
3.8 95,000 3.17 71,250 2 25,000 2 20,0000.25
30,000/0.251,20,000
6,000
0.2430,000/0.24
1,26,6676,667
0.2330,000/0.23
1,32,2736,818
0.2530,000/0.25
1.20,0006,000
Illustration 13: PRONTO Company plant had operated at 60% capacity in the year 2005. Thesummarised results were;
Sales – ` 40 lakhs Material cost `12 lakhsDirect labour ` 6 lakhs Overheads ` 10 lakhsIt is excepted that market will expand to match 75% capacity, when overheads are excepted to
touch ` 12 lakhs, during 2006I. Based on above information calculate
(1) Break even points in the years 2005-2006(2) Margin of safety in 2006
Ii Further capacity utilisation (increases in sales quantity) can be achived only with 5% pricereduction.
Calculate the sales target and capacity utilisation to earn profit of ` 17 lakhs in the year 2006.Solution:
2005 2006CapacityMaterialLabourOverheads:
Variable overheadsFixed overheads
60%126
82
75%157.5
102
Sales(–)variable costsContribution(–)fixed costsProfit
4026
50.032.5
142
17.52.0
12 15.5
60% 10 10 1275% 12 VC FC VC FC15% 2 8 2 10 2
15 × 4 = 60 2 × 4 = 8 variable cost15 × 5 = 75 2 × 5 =10 variable cost

Budgeting and Budgetary Control 35
For variable overhead =differential cost/ differential capacity
2005 2006P/V RatioBEPMOSMOS%
0.355.71
34.2985.71
0.355.71
44.2988.57%
PRICE 5%SalesLess: variable costContributionLess : fixed costProfit
47.532.5
60.1741.17
15.02.0
19.002.00
13.0 17.00
P/V Ratio = C/S = 154/47.5= 0.31
Sales required = Target profit + Fixed cost/P/V Ratio= 17+ 2/0.31 = ` 60.17 lakhs
Illustration 14: Cost accountant of Norma Ltd. has prepared following flexible budget (` 100)
Capacity 70% 80%DepreciationInsuranceIndirect labourPowerRepairs and maintenanceSalariesStores consumable
113
10.51719103.5
113
122020104
If 100% capacity represents 50 tonnes.What would be the budgeted overhead cost per tone at production level of 33 tonnes?If the prime cost is ` 5,000 per tone, what is the production cost per tone at 100% capacity
utilisation?

Budgeting and Budgetary Control36
Solution:
CapacityQuantity (tonne)Variable cost:
Indirect labourStores consumable
Semi-variable cost:PowerRepairs and maintenance
Fixed cost:DepreciationInsuranceSalaries
Total cost
Overhead cost per tone i.e.1,000kgs(+)prime cost per tone
Production cost per tonne
100% 80% 70% 66%50 40 35 33
155
2622
11310
124
2020
11310
10.53.5
1719
11310
9.93.3
15.818.6
11.03.0
10.092 80 74 71.6
1,8405,000
2,000 2,114.28 2,169.70
6,840
Illstration 15: (sales, production and materials purchase budget master budget)A company manufactures product A and product B. During the year ending December, 2006, it
is excepted sell 15,000 kgs of product A and 75,000 of product B at ` 15 and ` 8 per kgs respectively.The direct material P,Q and R are mixed in the proportion of 3:5:2 in the manufactures of product A.MATERIAL Q and R are mixed in the proportion of 1:2 in the manufacture of product B. The actualand budgeted inventories for the year for the year are given below:
Opening stockKgs.
Excepted closingstock kgs
Anticipated cost perKg. `
Material PQR
Material AB
4,5003,00030,0003,0004,000
3,0006,0009,0001,5005,500
6/-5/-4/---
Prepare sales budget, production budget and material purchase budget, showing the expenditurefor the material for the year ending 31-12-2006.
Solution:Product A Product BEXCEPTED SALE 15000kgs 75,000kgs
@ ` 15 per kg @ ` 15 per kg.PQR 3/10: 5/10: 2/10 QR 1/3: 2/3 Requirement

Budgeting and Budgetary Control 37
P 13500 × 3/10 = 4,050 P – = – 4,050Q 13,500 × 5/10 = 6,750 Q 76,500 × 1/3 = 25,500 32,250R 13,500 × 2/10 = 2,700 R 76,500 × 2/3 = 51,000 53,700Production 13,500 Production 76,500Production budget = Sales + Closing Stock – Opening stockSale 15,000 75,000ADD: closing stock 1,500 5,500Less: opening stock 3,000 4,000Production 13,500 76,500Material purchase budget = requirement for production = closing stock – opening stock
P Q R TotalRequirement(+) closing stock(-) opening stockPurchase Quantity
×Cost per kgPurchase budget (`)
4,0503,0004,500
32,2506,0003,000
53,7009,000
30,000
---
2,550
` 6
35,250
` 5
32,700
` 4
-
-15,300 1,76,250 1,30,800 3,22,350
Illustration 16:Calculate the budgted overhead cost per tone at production level of 35 tonne based on following
details at 80% capacity (40 tonnes)
` 000DepricationIndirect labourInsurancePower (80% variable)Repairs and maintenance (50% fixed)SalariesStores consumable
22246
4040208
Solution:Capacity 100% 80% 70%Production (tones) 50 40 35Variable:Stores consumable 10 8 7.0Semi-variable:Power (80% variable) 40 32 28.0(20% fixed) 8 48 8 40 8.0 36.0
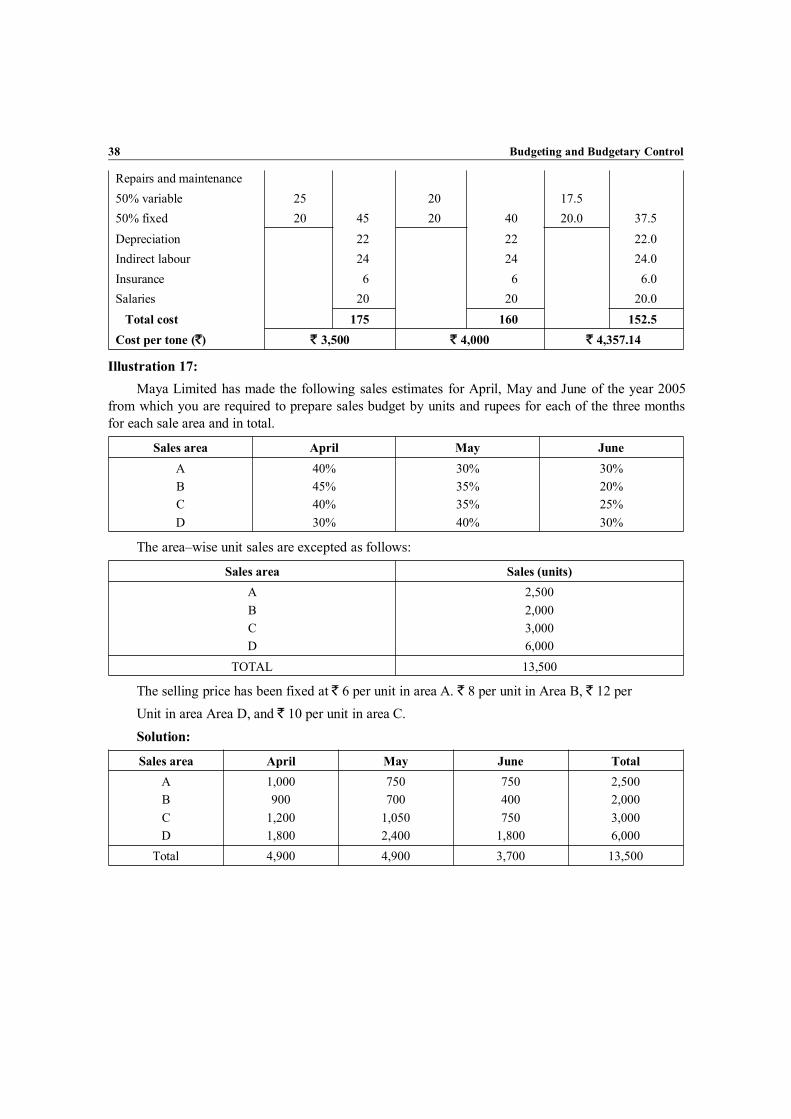
Budgeting and Budgetary Control38
Repairs and maintenance50% variable 25 20 17.550% fixed 20 45 20 40 20.0 37.5Depreciation 22 22 22.0Indirect labour 24 24 24.0Insurance 6 6 6.0Salaries 20 20 20.0
Total cost 175 160 152.5Cost per tone (`) ` 3,500 ` 4,000 ` 4,357.14
Illustration 17:Maya Limited has made the following sales estimates for April, May and June of the year 2005
from which you are required to prepare sales budget by units and rupees for each of the three monthsfor each sale area and in total.
Sales area April May JuneABCD
40%45%40%30%
30%35%35%40%
30%20%25%30%
The area–wise unit sales are excepted as follows:
Sales area Sales (units)ABCD
2,5002,0003,0006,000
TOTAL 13,500
The selling price has been fixed at ` 6 per unit in area A. ` 8 per unit in Area B, ` 12 perUnit in area Area D, and ` 10 per unit in area C.Solution:
Sales area April May June TotalABCD
1,000900
1,2001,800
750700
1,0502,400
750400750
1,800
2,5002,0003,0006,000
Total 4,900 4,900 3,700 13,500

Budgeting and Budgetary Control 39
Sales budget
Sales area April May June Total
ABCD
U × P.U.=AMT U × P.U.=AMT U × P.U.=AMT U × P.U.=AMT
1,000900
1,2001,800
68
1012
6,0007,2001200021600
75070010502400
681012
4,5005,6001050028800
750400750
1,800
681012
4,5003,2007,50021,600
2,5002,0003,0006,000
68
1012
15,0001600030,00072,000
Total 4,900 - 48800 4,900 - 49400 3,700 - 36,800 13,500 - 1,33,000
Illustration 18: (Flexible budget)Company ABC Ltd. Produces 10,000 units. The company expenses to 1 unit of the product is
listed below:Direct material - ` 7Direct labour - ` 5Other variable expenses - ` 4.5Administrative overhead - ` 6 (40%variable)
Selling overhead - ` 3 (75%variable)Production - ` 4 (20% variable)Purchase of equipment - ` 30,000Selling price - ` 120Prepare budget for 70%, 80% and 100% utilization of the capacity if the details listed above is for
90% utilisation of installed capacity.Solution:
Level activity 70% 80% 90% 100%
Units 7,778 8,889 10,000 11,111
` perunit
Total`
` perunit
Total`
` perunit
Total`
` perunit
Total`
Variable cost:Direct materialDirect labourOther variable exp.AdministrativeoverheadSelling overheadProduction overhead
(A)
75
4.5
2.42.25
0.8
54,446.0038,890.0035,001.00
18,667.2017,500.50
6,222.40
75
4.5
2.42.250.8
62,223.0044,445.0040,000.50
21,333.6020,000.25
7,111.20
75
4.5
2.42.250.8
70,00050,00045,000
24,00022,5008,000
75
4.5
2.42.250.8
77,777.0055,555.0049,999.50
26,666.4024,999.75
8,888.80
21.95 1,70,727.10 21.95 1,95,113.55 21.95 2,19,500 21.95 2,43,886.45

Budgeting and Budgetary Control40
Fixed cost:AdministrativeSelling overheadProduction overhead
(B)
Total cost (A+B)(+) profit
Selling price
4.620.964.11
36,0007,500
32,000
4.040.843.59
36,0007,500
32,000
3.60.753.2
36,0007,500
32,000
3.240.672.88
36,0007,500
32,000
9.70 75,500 8.49 75,000 7.55 75,500 6.79 75,000
31.6588.34
2,46,227.106,87,132.90
30.4489.55
2,70,613.557,96,066.46
29.590.5
2,95,0009,05,000
28.7491.25
3,19,386.4510,13993.55
120 9,33,360 120 10,66,680 120 12,00,000 120 13,33,320
Illustration 19: A manufacturer operates three sales divisions X,Y,Z which sell three brandedproducts A, B and C.The budget committee needs a sales budget for the next year from the followinginformation:
Budget sales units for current year:
Product X Y Z
ABC
80,0006,0004,000
12,00016,00024,000
12,0008,000
10,000
Actual sales units for the current year based on actual sales to the date and estimated sales for thebalance of the year are:
Product X Y Z
ABC
10,0004,0002,000
16,00020,00020,000
14,00010,0008,000
The selling prices per unit of A, B and C are ` 5, ` 10 and ` 20 respectively applicable for all thedivisions.
The discussions with divisional sales managers have product “A” is oversold and if the price isincreased by 10%, even then it finds a ready market: product is overpriced and the price of it can bereduces by 5%. By incorporating these changes, the sales will be as follows:
Product X Y Z
ABC
+30%–10%+10%
+40%+30%+20%
+20%–10%+10%
You are required to prepare the budget for the current year as well as budget for next year.

Budgeting and Budgetary Control 41
Solution:
Sales Budget for the
DivisionsBrand
Product
Budget Current Year Actual Current Year Budget Next Year
SalesArea
Unit *P.U.=Amount Unit *P.U.=Amount Unit *P.U.=Amount
X ABC
Total of X
80,0006,0004,000
51020
4,00,00060,00080,000
10,0004,0002,000
51020
50,00040,00050,000
1,04,0005,4004,400
5.51019
5,72,00054,000
8,600
5,40,000 1,30,000 7,09,600
Y ABC
Total of Y
12,00016,00024,000
51020
60,0001,60,0004,80,000
16,00020,00020,000
51020
80,0002,00,0004,00,000
16,80020,80028,800
5.51019
92,4002,08,0005,47,200
7,00,000 6,80,000 8,47,600
Z ABC
Total of Z
Total of ATotal of BTotal of C
120008000
10,000
51020
60,00080,000
2,00,000
14,00010,000
8,000
51020
70,0001,00,0001,60,000
14,4007,200
11,000
5.510.019.0
79,20072,000
2,09,000
- - 3,40,000 - - 3,30,000 - - 3,60,000
1,04,00030,00038,000
51020
5,20,0003,00,00030,0004
40,00034,00030,000
51020
2,00,0003,40,0006,00,000
1,35,20033,40044,200
5.510.019.0
7,43,0003,34,0008,39,000
Grand Total - - 15,80,000 - - 11,40,000 - - 19,17,0000
Illustration 20: ACC Ltd. manufactures two products X and Y and sells them though twodivisions: North and south for the submission of sales budget to the budget committee the followinginformation has been made:
Budgeted sales for the current year:
Product North SouthXY
4,000 units at ` 93,000 unit at ` 24
6,000 units at ` 95,000 unit at ` 24
Actual sales for the current year:
Product North SouthXY
5,000 units at ` 92,000 unit at ` 24
7,000 units at ` 94,000 unit at ` 24
Adequate market studies revel that product X is popular but under priced it is observed that if theprice of X is increased by ` 1 it will still find the read market on the other hand, Y is over price and themarket could absorbsed more if sales price of Y be reduced by ` 4 the management has agreed to do so.
For the information on this price changes and reports from salesman the following estimates havebeen prepared by divisional managers.

Budgeting and Budgetary Control42
Percentage increased in sales over current budgetProduct North South
XY
+|10%+20%
+5%+10%
Prepare a sales budget, showing budgeted sales and actual sales of the current year as well asbudget for the next year:
Sales of budgetSales division Product
Unit × P.U.=AMT Unit × P.U.=AMT Unit × P.U.=AMTNorth X
YTotal for NorthXYTotal for SouthTotal o XTotal of Y
4,0003,000
924
36,00072,000
5,0002,000
924
45,00048,000
4,4003,600
1020
44,00072,000
1,8,000 93,000 1,16,0006,0005,000
924
54,0001,20,000
7,0004,000
924
63,00096,000
6,3005,500
1020
63,0001,10,000
1,74,000 1,59,000 1,73,00010,0008,000
924
90,0001,92,000
12,0006,000
924
1,08,0001,44,000
10,7009,100
1020
1,07,0001,82,000
Grand Total 2,82,000 2,52,000 2,89,000
Illustration 21: (sales budget)A marketing company submits the following fig. to the first quarter of 2004
Month Product soap in units
JanuaryFebruaryMarch
X Y Z2,5002,0003,000
3,0002,5003,500
1,0001,0001,000
Selling price per unit was X ` 10, Y ` 20 and Z ` 40Target for the first quarter of 2005
Particulars Product
Sales Quantity IncreasesSales price increases
X Y Z20%Nil
10%10%
10%25%
Prepare the sales budget for the first quarter of 2005.Solution:
Product January February March Total
XYZ
Units SP Amount Units SP Amount Units SP Amount Units SP Amount
3,0003,3001,100
102250
30,00072,60055,000
2,4002,7501,100
102250
24,00060,50055,000
3,6003,8501,100
102250
36,00084,70055,000
9,0009,9003,300
102250
90,0002,17,0001,65,000
Total - - 1,57,600 - - 1,39,500 - - 1,75,700 - - 4,72,800

Budgeting and Budgetary Control 43
Working : product X; sales quantity increases = 20%January 2,500 + 20% = 3,000February 2,000 + 20% = 2,400March 3,000 + 20% = 3,600Product YJanuary 3000 + 10% = 3,300February 2,500 + 10% = 2750March 3,500 + 10% = 3,850PRODUCT Z : Sales quantity increases = 10%January 1,000 + 10% = 1,100February 1,000 + 10% = 1,100March 1,000 + 10% = 1,100Selling price increasesX 10 + NIL% = 10Y 20 + 10% = 22Z 40 + 25% = 50Illustration 22: (Flexible Budget)The following information at 50% capacity is given. Prepare a flexible budget and forecast the
profit or loss at 60%, 70% and capacity.
Expenses at 50% capacity (`)Fixed ExpensesSalariesRent and taxesDepreciationAdministrative expensesVariable expensesMaterialsLabourOthersSemi – variable expensesRepairsIndirect labourOthers
50,00040,00060,00070,000
2,00,0002,50,000
40,000
1,00,0001,50,000
90,000
It is estimated that fixed expenses will remain constant at all capacities. semi –variable expenseswill not change between 45% and 60% capacity, will rise by 10% between 60% and 75% capacity, afurther increase of 5% when the capacity crosses by 75%.

Budgeting and Budgetary Control44
Estimated sales:Capacity `
60% 11,00,00070% 13,00,00090% 15,00,000Solution:
Flexible budget
ParticularsCapacity levels
50% 60% 70% 90%` ` ` `
Variable expenses:MaterialLabourOthersTotal variable exp.Semivariable exp.RepairsIndirect labourOthers
Total Semi- variable exp.Fixed expensesSalariesRent and taxesDepreciationAdministration exp.
Total Fixed exp.
Total costAdd/less: profit/loss
2,00,0002,50,000
40,000
2,40,0003,00,000
48,000
2,80,0003,50,000
56,000
3,60,0004,50,000
72,0004,90,000 5,88,000 6,86,000 8,82,000
1,00,0001,50,000
90,000
1,00,0001,50,000
90,000
1,10,0001,6500099,000
1,15,0001,72,5001,03,500
3,40,000 3,40,000 3,74,000 3,91,000
50,00040,00060,00070,000
5000040,00060,00070,000
50,00040,00060,00070,000
50,00040,00060,00070,000
2,20,000 2,20,000 2,20,000 2,20,00010,50,000
N.A11,48,000
48,00012,80,000
20,000 14,93,0007,000
Sales N.A 11,00,000 13,00,000 15,00,000
Working:Semi-variable expenses:At 60% = same as at 50% capacity levelAt 70% = 10% increases to given amount at 50% capacity levelRepairs = 1,00,000 + 10% = 1,10,000Indirect labour = 1,50,000 + 10% = 1,65,000Others = 90,000 +10% = 99,000At 90% =15% {i.e. 10% +|5%) increases to given amount at 50% capacity level

Budgeting and Budgetary Control 45
Repairs = 1,00,000 +15% = 1,15,000Indirect labour = 1,50,000 + 15% = 1,72,000Others = 90,000 + 15% = 1,03,500Variable expenses:Material At 50% 2,00,000
60% ? = 2,40,00070% ? = 2,80,00090% ? = 3,60,000
Labour At 50% 2,50,00060% ? = 3,00,00070% ? = 3,50,00090% ? = 4,50,000
Others At 50% 40,00060% ? = 48,00070% ? = 56,00090% ? = 72,000
Illustration 23: (Flexible Budget)AB Ltd. has furnished the following estimation pertaining to Product “A”at 80% of its normal
capacity level for the quarter ending March 31, 2005.Sales ` 6,00,000Administrative costs :Office salaries ` 90,000General expenses 2% of SalesDepreciation ` 7,500Rates and taxes ` 8,750Selling Costs:Salaries 8% of salesTravelling exp. 2% of salesSales office expenses 1% of salesGeneral office expenses 1% of salesDistribution Costs:Wages ` 15,000Rent 1% of salesOther expenses 4% of sales

Budgeting and Budgetary Control46
Prepare the budget for the total administration, Selling and Distribution expenses at 70% & 90%capacity levels.
AB Ltd.
Flexible Budget of Product “A”
ParticularsCapacity levels
70% 80% Given 90%
` ` `
Sales (A)Less: Costs:(1) Administrative Costs:Office salariesGeneral expenses (2% of sales)DepreciationRates and TaxesTotal Administrative Costs (B)
(2) Selling costs:
Salaries (8% of sales)Travelling expenses (2% of sales)Sales office expenses (1% of Sales)General Expenses (1% of sales)Total Selling Costs (C)(3) Distribution Costs:WagesRent (1% of sales)Other expenses (4% of sales)Total Distribution Costs (D)
Total Costs (e) = [B+C+D]Profits (F) = [A-E]
5,25,000
90,00010,5007,5008,750
6,00,000
90,00012,0007,5008,750
6,75,000
90,00013,5007,5008,750
1,16,750 1,18,250 1,19,750
42,00010,5005,2505,250
48,00012,0006,0006,000
54,00013,5006,7506,750
63,000 72,000 81,000
15,0005,250
21,000
15,0006,000
24,000
15,0006,750
27,00041,250 45,000 48,750
2,21,000 2,35,250 2,49,5003,04,000 3,64,750 4,25,500
Illustration 24: (Production Budget)Fun Toys Ltd manufactures a toy monkey with moving parts and a built in voice box. Projected
Sales for 5 months are as follows:Month Projected Sales in UnitsJuly 2004 4,200August 2004 4,500September 2004 4,800October 2004 4,600November 2004 4,700Each toy requires direct material from a supplier at ` 3 for moving parts. Voice boxes are
purchased from another supplier at ` 10 per toy. Labour cost is ` 20 per toy and variable overhead cost

Budgeting and Budgetary Control 47
is ` 5 per toy. Fixed manufacturing overhead applicable to production is ` 45,000 per month. It is thepractice of the company to manufacture an output in a month which is equivalent to 1.2 times of thefollowing months sales. Prepare the production budget and the production cost budget for July 2004 toOctober 2004.
Solution:
Fun Toys Ltd.
Particulars ` Per unit ` Per unit Total for ------ units` per month
(1) Variable Cst:Direct Materials:Moving partsVoice boxesLabourVariable OverheadTotal Variable cost(2) Fixed manufacturingoverhead
3510 45
205
45,00070
1. Production BudgetProduction during the month = 1.2 times of the following months sales
UnitsJuly 1.2*August sales 4,500 unitsAugust 1.2*September sales 4,800 unitsSeptember 1.2*October sales 4,600 unitsOctober 1.2*November sales 4,700 units
5,4005,7605,5205,640
2. Production cost budget
Production output in units July5,400
August5,760
September5,520
October5,640
` ` ` `
(1) Variable Cost:Direct Materials:Moving parts (` 35 p.u.)Voice Boxes ` ( 10 p.u.)Labour (20 p.u.)Variable Overhead (` 5 p.u)Total Variable Cost (` 70 p.u.)(2) Fixed manufacturing overhead
Total Cost
1,89,00054,000
1,08,00027,000
201,60057,600
1,15,20028,800
1,93,20055,200
1,10,40027,600
1,97,40056,400
1,12,80028,200
3,78,00045,000
4,03,20045,000
3,86,40045,000
3,94,80045,000
4,23,000 4,48,200 4,31,400 4,39,800

Budgeting and Budgetary Control48
Illustration 25: (Sale Budget)Prepare an areawise and productwise sales budget for the following data:
Product Jan Feb MarchXY
500 units1,000 units
800 units1,100 units
200 units1,500 units
Salesarea
Product January February March
Unit SP amt unit SP amt unit SP amt unit amt
A XY
100300
510
5003,000
160330
510
8003,300
40450
510
2004,500
3001,080
1,50010,800
Total of area A - - 3,500 - - 4,100 - - 4,700 - 12,300
B XY
150700
510
7507,000
240770
510
1,2007,700
601050
510
30010,500
4502,520
2,25025,200
Total of area B - - 7,750 - - 8,900 - - - - 27,450
C XY
250-
510
1,250-
400-
510
2,000-
100-
510
500-
750-
3,750-
Total of area C - - 1,250 - - 2,000 - - 500 - 3,750
Total of XTotal of Y
5001,000
510
2,50010,000
800110
510
4,00011,000
200 510
1,00015,000
1,5003,600
7,50036,000
Grand Total - - 12,500 - - 15,000 - - 16,000 - 43,500
Exercise1. The Bright Ltd. manufactures two brands of pen – one sold under the name of 'bright' and
another under name of ‘hans’. The sales department of the company has three departmentsin different areas of country.The sales budget for the year ending 31st December, 2015 were:BrightDepartment I 3,00,000Department II 5,62,500Department III 1,80,000HansDepartment I 4,00,000Department II 6,00,000Department III 20,000Sales prices are ` 3 and ` 1.20 in all departments.

Budgeting and Budgetary Control 49
It is estimated that by forced sales promotion the sale of ‘Hans’ in department I willincrease by 1,75,000. It also expected that by increasing production and arranging extensiveadvertisement department III will be enabled to increase the sale of ‘Hans’ to 50,000.It is recognised that the estimated sales by department II represent an unsatisfactory target.It is agreed to increase both estimates by 20%.Prepare a sales budget for the year to 31st December, 2015.
2. The sales director of a manufacturing company reports that next year he expects to sell54,000 units of a certain product.The production manager consults the shopkeeper and casts his figure as follows:Two kinds of raw material, A and B, are required for manufacturing the product. Each unitof the product required 2 units of A and 3 units of B. The estimated opening balances at thecommencement of the next year are:Finished : 10,000 unitsA : 12,000 unitsB : 15,000 unitsThe desirable closing balance at the end of the next year are:Finished products : 14,000 unitsA. : 13,000 unitsB. : 16,000 unitsDraw up a quantitative chart showing the material purchase budget for the next year.
3. It is estimated that on 1st January, 2015 the Alpha Manufacturing Co. Ltd. will have thefollowing raw material inventory:
Type of materials Quantity Price (`) Amount (`)LMNOP
70015 tons
1500 kg.800 gallons
10,500
335
0.751.000.20
2100525
1125800
21006650
The management summarised the consumption of different types of raw material forvarious departments in the following manner:
Materials I II III IVL unitsM tonsN kgO gallonsP units
450011
–350
5600
–3
600700
6300
3000–
700–
1500
5004
1350–
800
The following inventory at 31st December, 2015 is desired:L : 800 M : 7 tonsN : 1050 kg. O : 750 gallonsP : 600

Budgeting and Budgetary Control50
Assuming that all prices will remain constant, prepare the purchase budget.4. The golden company plans to sell 1,08,000 units of a certain product line in the first fiscal
quarter 1,20,000 units in the second quarter 1,32,000 units in the third quarter and 1,56,000units in the fourth quarter and 1,38,000 units in the first quarter of the following year. Atthe beginning of the first quarter of the current year there are 18,000 units of product in thestock. At the end of each quarter, the company plans to have an inventory equal to one sixthof the sales of the sales for the next fiscal year.
5. Shangrilla Foods Products Limited has prepared the following sales budget for the first fiveYear months of 2015.Sales budget (in units)January 10,800February 15,600March 12,200April 10,400May 9,800The inventory of finished products at the end of every month is to be equal to 25 per cent ofthe sales estimate for the next month. On 1st January, 2010 there were 2,700 units ofproduct on hand. There is no work in process at the end of any month.Every unit of product requires two types of materials in the following quantities:Material A : 4 kg, Material B : 5 kgMaterial equal to one half of the next month’s production are to be in hand at the end ofevery month. This requirements was met on 1st January, 2015.Budgeted prices of the purchase of materials are:Material A : ` 3 per kg., Material B : ` 2 per kg.Prepare a material budget for the first quarter of 2015 in a logical form showing thequantities of each type of material to be purchased every month. Also prepare a purchasebudget.
6. The following are the estimated sales of a company for eight months ending 30th October2015.Months Estimated sales (units)April 2015 12,000May 2015 13,000June 2015 9,000July 2015 8,000Aug 2015 10,000Sept. 2015 12,000Oct. 2015 14,000Nov. 2015 12,000As a matter of policy the company maintain the closing balance of finished goods and rawmaterials as follows:Stock item. Closing balance of month

Budgeting and Budgetary Control 51
Finished goods 50% of the estimated sales for the next monthRaw materials estimated consumption for the next monthprepare production budget (in units) and raw material purchase budget (in units and cost) ofthe company for the half year ending 30th September 2015.
Questions for Self-practiceI. Short Question
1. What is a budget?2. Who decides the budget period?3. What is budget period?4. What is the use of a budget?5. What is budget manual?6. Give one function of budget committee?7. What is the basis of sales budget?8. Mention any two factors which decides production budget?9. What is flexible budget?
10. Why is budget controller appointed?II. Short Notes
1. Budgetary Control2. Objectives of Budgetary Control3. Budget Key Factor4. Flexible Budget5. Master Budget
Objective QuestionsI. Fill in the Blanks
1. Budget is drawn for .2. Key factor is also known as .3. requires classifications of cost as fixed, variable and semi-variable.4. Flexible budget is drawn for level of activity.5. budget is prepared for a longer period.6. is a summary of all the functional budgets.7. shows estimate of sales in future.8. Flexible budget is useful for .9. Budget defines of a concerned manager.
10. shows budgeted receipts and payments.[Ans.: 1. Future, 2. Limiting factor, 3. Flexible budget, 4. Fixed, 5. Capital, 6. Master budget,
7. Sales budget, 8. Control, 9.Responsibility, 10. Cash budget.]

Budgeting and Budgetary Control52
II. True or False1. Budget is prepared for the future period.2. The scarce factor of production is known as key factor.3. Flexible budget is drawn for one level of activity.4. Flexible budget is drawn for multiple levels of activities.5. A budget is expressed in financial terms only.6. Capital expenditure budget is prepared for a longer period.7. Master budget is a summery of all the functional budgets.8. Budget period depends on management policy.9. Production budget is expressed in quantity and cost.
10. Sales budget is prepared by production manager.[Ans.: True: (1, 2, 6, 7, 8, 9), False: (3, 4, 5, 10).]
III. Match the ColumnsGroup ‘A’ Group ‘B’
1. Budget (i) Future oriented2. Key factor (ii) Drawn for one level3. Fixed budget (iii) Drawn for multiple levels4. Flexible budget (iv) Limiting factors5. Master budget (v) Summary of all functional
budgets6. Budgetary control (vi) Estimates of sales7. Sales budget (vii) Estimate of production
(viii) Control through budgets[Ans.: 1. (i), 2. (vi), 3. (ii), 4. (iii), 5. (v), 6. (viii), 7. (vi).]
IV. Multiple Choice Questions1. One of the following is not a basic element of a budget:
(a) Defines the responsibility of each employee (b) Comprehensive plan(c) Expressed in financial terms (d) Future plan for a specified period
2. Information to prepare flexible budget includes:(a) Total fixed cost, total variable cost(b) Total fixed cost, total variable cost and capacity(c) Total fixed cost, variable cost per unit and several levels of activity.(d) None of the above
3. Flexible budget are useful for(a) Planning purpose only(b) Planning, performance evaluation & feedback control(c) Control of performance only(d) None of the above

Budgeting and Budgetary Control 53
4. A flexible budget takes into account(a) Fixed cost only (b) Variable cost only(c) Semi-variable cost only (d) Fixed, variable and semi-variable
cost5. A budget is prepared for
(a) One year (b) One month(c) 6 months (d) A specified period
6. Master budget is a summary of(a) Cash budget (b) Sales budget(c) Production budget (d) All functional budget
7. Budget period depends on(a) Type of budget (b) Management policy(c) Government policy (d) None of the above
8. Budgetary control system is costly for(a) Large organisation (b) Small organisation(c) Public sector oorganisation (d) None of the above
9. Production budget is expressed in(a) Quantity only (b) Cost only(c) Quantity and cost (d) None of the above
10. Sales budget shows(a) Estimate of future sales (b) Estimate of future production(c) Estimate of inventory (d) None of the above
[Ans.: 1. (a), 2. (c), 3. (b), 4. (d), 5. (d), 6. (d), 7. (b), 8. (b), 9. (a), 10. (a).]
____

Chapter
2
IntroductionCosting is the process of determining the cost of doing something. Costing includes the
techniques and processes of ascertaining cost. We dealt with different methods of costing, differenttechniques of costing and finally classification of costs under various heads.
Marginal Cost determines the rate of change in costs if the volume of output is increased ordecreased by one unit. Marginal costing is a technique of costing concerned with the changes in costsand profits resulting from changes in the volume of output. Marginal costing is very helpful indecision-making and it most widely used profit planning techniques. The cost-volume-profit analysisshows the relationship among unit sale price, variable cost, sales volume, sales mix and fixed cost.
Concept of Marginal CostingAccording to Institute of Cost and Management Accounting, London, Marginal costing is
defined as “the ascertainment of marginal cost and of the effect on profit of changes in volume or typeof output by differentiating between fixed costs and variable cost”. Marginal costing is a technique ofcosting concerned with the changes in costs and profits resulting from changes in the volume of output.Marginal costing is also known as ‘Variable Costing’.
Features of Marginal CostingThe technique of marginal costing is based on the distinction between product costs and period
costs. Only the variable costs are regarded as the cost of the product while the fixed cost is treated asperiod costs. The main c
Characteristics of marginal costing are:1. It is a technique of analysis and determination of costs to help management in decision
making.2. All elements of costs are classified into variable and fixed components. Even semi-variable
costs are classified into variable and fixed components.3. The variable costs are regarded as the cost of the products.4. Fixed costs are treated as period cost and are charged to profit and loss account for the
period for which they are incurred.5. The stock of finished goods and work-in-progress are valued at marginal costs only.
Variable and Absorption costing are techniques of costing wherein variable costing considersonly variable costs for the purpose of product costing, inventory valuation and for other importantmanagement decisions. In absorption costing, total costs are taken into consideration for these
ABSORPTION COSTING ANDMARGINAL COSTING, COST
VOLUME AND PROFIT ANALYSIS

Absorption Costing and Marginal Costing, Cost Volume and Profit Analysis 55
purposes. Direct material, direct labour and variable overheads constitute the only relevant costs invariable costing whereas the full/absorption costing technique recognises fixed overheads also as aproduct costs in addition to material, labour and variable overheads.
The two techniques are not mutually exclusive. Full costing is needed while preparing incomestatements for external reporting and for tax purpose, while variable costing is extensively used forinternal purpose in decision-making.
Advantages and Disadvantages of Marginal Costing Technique
Advantages1. Marginal costing is simple to understand.2. By not charging fixed overhead to cost of production, the effect of varying charges per unit
is avoided.3. It prevents the illogical carry forward in stock valuation of some proportion of current
year’s fixed overhead.4. The effects of alternative sales or production policies can be more readily available and
assessed, and decisions taken would yield the maximum return to business.5. It eliminates large balances left in overhead control accounts which indicate the difficulty of
ascertaining an accurate overhead recovery rate.6. Practical cost control is greatly facilitated. By avoiding arbitrary allocation of fixed
overhead, efforts can be concentrated on maintaining a uniform and consistent marginalcost. It is useful to various levels of management.
7. It helps in short-term profit planning by breakeven and profitability analysis, both in termsof quantity and graphs. Comparative profitability and performance between two or moreproducts and divisions can easily be assessed and brought to the notice of management fordecision making.
Disadvantages1. The separation of costs into fixed and variable is difficult and sometimes gives misleading
results.2. Normal costing systems also apply overhead under normal operating volume and this shows
that no advantage is gained by marginal costing.3. Under marginal costing, stocks and work in progress are understated. The exclusion of
fixed costs from inventories affect profit, and true and fair view of financial affairs of anorganisation may not be clearly transparent.
4. Volume variance in standard costing also discloses the effect of fluctuating output on fixedoverhead. Marginal cost data becomes unrealistic in case of highly fluctuating levels ofproduction, e.g., in case of seasonal factories.
5. Application of fixed overhead depends on estimates and not on the actuals and as such theremay be under or over absorption of the same.
6. Control affected by means of budgetary control is also accepted by many. In order to knowthe net profit, we should not be satisfied with contribution and hence, fixed overhead is also

Absorption Costing and Marginal Costing, Cost Volume and Profit Analysis56
a valuable item. A system which ignores fixed costs is less effective since a major portionof fixed cost is not taken care of under marginal costing.
7. In practice, sales price, fixed cost and variable cost per unit may vary. Thus, theassumptions underlying the theory of marginal costing sometimes becomes unrealistic. Forlong term profit planning, absorption costing is the only answer.
Illustration 1: Hydro Electric Ltd. furnishes the following information from its cost records forthe first quarter of the current year.
Normal production (units) 1,000Actual production (units) 1,100Actual overheads per quarter at normal production 4,000Other expenses per quarter 300Standard fixed overhead rate per unit 4Variable costs per unit 6Sales volume (selling price is ` 14) NIL
Prepare the income statement under absorption and variable costing.Solution:
Income Statement (Absorption Costing)
Particulars ` `
Sales Revenue NILLess: Total Cost of Manufacturing:
Variable Costs (1,100 × ` 6) ` 6,600Fixed Overheads (1 100 × ` 4) 4,400
11,000Less: Cost of Inventory at the end of the year (1,100 × ` 10) 11,000Cost of Goods Manufactured and Sold NILGross Margin (Unadjusted) NILCapacity Variance (Favourable) (Overabsorbed 100 × ` 4) 400Gross Margin (Adjusted) 400Less: Other Expenses 300Net Income before Taxes 100
Income Statement (Variable Costing)
Particulars ` `
Sales Revenue NILLess: Variable Costs (Production Costs) (1,100 × ` 6) ` 6,600Less: Cost of Inventory at the end to the year (1,100 × ` 6) 6,600Cost of Goods Manufactured and Sold NILContribution NILLess: Fixed Costs:

Absorption Costing and Marginal Costing, Cost Volume and Profit Analysis 57
Fixed Overheads 4,000Other Expenses 300 (4,300)
Net Income before Taxes (Loss) (4,300)
Inference: Under absorption costing, the net income before taxes is ` 100 while in marginalcosting, net income before taxes is (` 4300) (loss). This significant difference can be attributed to thefact that under absorption costing, the fixed manufacturing overheads are included in inventory,whereas in variable costing, inventory carries only variable costs.
Inventory ValuationUnderabsorption Costing 11,000Inventory Valuation under Variable Costing 600Difference 4,400(This difference is equal to difference between net income before taxes under absorption costing
and variable costing.)
Difference between Absorption Costing and Marginal CostingAbsorption Costing Marginal Costing
It is known as full costing. Both fixed and variableare included to ascertain the cost.
Only variable costs are included. Fixed costs arerecovered from contribution.
Different unit costs are obtained at different levels ofoutput because of fixed expenses remaining the same.
Marginal cost per unit remain same at different levelsof output because variable expenses vary in the sameproportion in which output varies.
Difference between sales and total cost (marginalcost and fixed cost) is profit.
Difference between sales and marginal cost iscontribution and difference between contribution andfixed cost is profit or loss.
A portion of fixed cost is carried forward to the nextperiod because closing stock of work-in-progress andfinished goods is valued at cost of production whichis inclusive of fixed cost.
Stock of work-in-progress and finished goods arevalued at marginal cost. Fixed cost of a particularperiod is charged to that very period and is notcarried over to the next period.
The apportionment of fixed expenses on an arbitrarybasis gives rise to overabsorption or underabsorptionof overheads
Only variable cost are charged to products hencemarginal costing does not lead to overabsorption orunderabsorption of fixed overheads.
It affects managerial decisions in the areas such aswhether to accept the export order or not., whether tobuy or manufacture, etc.
It is very helpful in taking managerial decisionsbecause it takes into consideration the additional costinvolved only assuming fixed expenses remainingconstant.
Costs are classified according to functional basis suchas production cost, office and administrative cost andselling and distribution costs.
Coss are classified according to the behaviour ofcosts – fixed costs and variable costs.
It fails to establish relationship of cost, volume andprofit
CVP relationship is an integral part of marginalcosting.

Absorption Costing and Marginal Costing, Cost Volume and Profit Analysis58
Marginal Cost: According to C.I.M.A. London, “Marginal Cost means the amount at any givenvolume of output by which aggregate costs are changed if the volume of output is increased ordecreased by one unit”. Marginal cost per unit remains unchanged irrespective of the level of activityor output. It is also known as Variable Cost. Marginal cost is the sum total of direct material cost,direct labour cost, variable direct expenses and all variable overheads. The marginal cost of producinga unit declines as output increases.
Advantages of Marginal Costing1. In order to forecast profits accurately, it is essential to ascertain the relationship between
cost and profit on one hand and volume on the other.2. Marginal Costing is helpful in setting up flexible budget which indicates cost at various
levels of activities.3. Marginal Costing assist in evaluating performance for the purpose of control.4. Marginal Costing may assist management in formulating pricing policies by projecting the
effect of different price structures on cost and profit.Cost Drivers: The activities that cause costs to be incurred are called “Cost Drivers”. A fixed
cost remains unchanged in total as the level of activity (cost drivers) varies. If activity increases ordecreases say by 20%, the total fixed costs remain the same, e.g., depreciation, property tax, rent tolandlord, etc. But fixed costs per unit will change.
A variable cost changes in total in direct proportion to a change in the level of activity or costdriver. If activity increases, say by 20%, total variable cost also increases by 20%. The total variablecost increases proportionately with activity. Variable cost is fixed per unit but varies in total.
Contribution: It is the difference between sales and variable cost. It may be defined as theexcess of selling price over variable cost per unit. It is also termed as Contribution Margin or GrossMargin.
Contribution = Sales – Variable CostContribution (per unit) = Selling Price – Variable Cost per unitContribution = Fixed Cost + Profit (– Loss)Advantages of Contribution: The concept of contribution is a valuable aid to management in
making managerial decisions. It includes:1. It helps the management in the fixation of selling prices.2. It assists in determining the break-even point.3. It helps management in the selection of a suitable product mix for profit maximisation.4. It helps in choosing from among alternative methods of production.5. It helps the management in deciding whether to purchase or manufacture, add a new
product or not, etc.Cost-Volume-Profit (CVP) Analysis: This technique summarises the effects of changes in an
organisation’s volume of activity on its costs, revenue and profit. CVP analysis can be extended tocover the effects on profit of changes in selling prices, changes in sales volume, changes in productmix, etc. It provides management with a comprehensive overview of the effects on revenue and costsof all types of short-run financial changes. Since CVP analysis explores the fundamental relationship

Absorption Costing and Marginal Costing, Cost Volume and Profit Analysis 59
between cost-volume-profit variables, it becomes easier to recognise certain level of output or acertain volume of sales that equates cost with revenue. Such level is termed as break-even point.Break-even analysis is an integral part of CVP analysis.
Break-even Chart: It is a graphic or visual presentation of the relationship between cost, volumeand profit. It indicates the point of production at which there is neither profit nor loss. It also indicatesthe estimated profit or loss at different levels of production. While constructing the chart, thefollowing assumption is normally considered.
(a) Costs are classified into fixed and variable costs.(b) Fixed costs shall remain fixed during the relevant volume range of graph.(c) Variable cost per unit will remain constant during the relevant volume range of graph.(d) Selling price per unit will remain constant.(e) Sales mix remains constant.(f) Production and sales volume are equal.(g) There exists a linear relationship between costs and revenue.(h) Linear relationship is indicated by way of straight line.Break-even Point: BEP is the volume of activity where the organisation’s revenues and
expenses are equal. At a particular amount of sales, the organisations have no profit or loss. Itnormally breaks even.
The general formula for computing the break-even sales volume in units is:
unitperinargmonContributiensesexpFixed
)unitsin(BEP
ratiosalesonContributiensesexpFixed
)Rupeedin(BEP
Limitations of Marginal CostingThere are certain limitations which can be described as follows:
1. Suitability: The techniques of marginal costing cannot be applied to all the concerns. Whena concern needs to carry large stocks by way of work-in-progress, the technique becomesredundant. In addition, the marginal costing techniques are not suitable to industriesworking on contract basis.
2. Inventory valuation difficulties: Since the work-in-progress and the closing inventoriesare valued at marginal cost basis, it will not be a sound decision from the Balance Sheetpoint of view. The main focus on the true and fair value concept gets diluted and the verypurpose of exhibiting the financial position will get defeated.
3. Segregation of costs: Though the marginal costing principles call for the differentiation ofcosts into fixed and variable, in actual practice, it becomes difficult to classify themprecisely. Many overheads which appear to be fixed and variable may not exactly align atvarious levels of production. There is no logical method to segregate semi-variableexpenses into fixed and variable.

Absorption Costing and Marginal Costing, Cost Volume and Profit Analysis60
4. Time factor: The marginal costing ignores the time factor which is very important in allmanagerial decisions. Ignoring the time value factor would naturally relate to unreliable andincomplete basis for comparing two alternative jobs.
5. Sales emphasis: Marginal costing principles are basically a sales-oriented concept. Whilethe selling function gets the prominence, other functions are not given equal weightage.This would be a major setback.
Revenue Statement
Particulars Amount ` P.U.Sales XXLess: Variable Cost (X)Contribution XXLess: Fixed Cost (X)Profit
1. Profit Volume Ratio
A. When sales and variable cost given, P/V Ratio = 100Sales
onContributi
Where, Contribution = Sales – Variable CostB. When sales and profit for two consecutive term given, P/V Ratio
= 100SalesinProfitin
2. Break-even Point
A. Break-even Point (in Unit) =er UnitPonContributi
CostFixed
B. Break-even Point (in Sales) =RatioP/V
CostFixed
3. Desired Sales =RatioP/V
ProfitDesiredCostFixed
Margin of Safety (MOS)Every enterprise tries to know how much above they are from the breakeven point. This is
technically called margin of safety. It is calculated as the difference between sales or production unitsat the selected activity and the breakeven sales or production.
Margin of safety is the difference between the total sales (actual or projected) and the breakevensales. It may be expressed in monetary terms (value) or as a number of units (volume). It can beexpressed as profit / P/V ratio. A large margin of safety indicates the soundness and financial strengthof business.
Margin of safety can be improved by lowering fixed and variable costs, increasing volume ofsales or selling price and changing product mix, so as to improve contribution and overall P/V ratio.

Absorption Costing and Marginal Costing, Cost Volume and Profit Analysis 61
Margin of safety = Sales at selected activity – Sales at BEP
=ratioP/V
activityselectedatProfit
Margin of safety is also presented in ratio or percentage as follows:
=activity selectedat Sales
100 (sales)safetyofMargin
The size of margin of safety is an extremely valuable guide to the strength of a business. If it islarge, there can be substantial falling of sales and yet a profit can be made. On the other hand, ifmargin is small, any loss of sales may be a serious matter. If margin of safety is unsatisfactory,possible steps to rectify the causes of mismanagement of commercial activities as listed below can beundertaken.
(a) Increasing the selling price – It may be possible for a company to have higher margin ofsafety in order to strengthen the financial health of the business. It should be able toinfluence price, provided the demand is elastic. Otherwise, the same quantity will not besold.
(b) Reducing fixed costs(c) Reducing variable costs(d) Substitution of existing product(s) by more profitable lines(e) Increase in the volume of output(f) Modernisation of production facilities and the introduction of the most cost effective
technology
IllustrationsIllustration 2: Following information is available.
Year Sales Profit2013 10,00,000 1,00,0002014 15,00,000 2,00,000
Calculate:(a) Profit Volume Ratio.(b) Sales required to earn profit of ` 4,00,000.(c) Profit when sales are 20,00,000.
Solution:
(a) P/V Ratio = 100alesSinChangerofitPinChange
= 10010,00,000–15,00,000
000,00,1–000,00,2
= 1005,00,000
000,00,1
= 20%

Absorption Costing and Marginal Costing, Cost Volume and Profit Analysis62
(b) Desired Sales =RatioP/V
ProfitostCFixed
Fixed Cost = Contribution – Profit Contribution = Sales × P/V Ratio Contribution = 15,00,000 × 20%
= 3,00,000Fixed Cost = 3,00,000 – 2,00,000
= 1,00,000
Desired sales =20%
000,00,4000,00,1
=20%
000,00,5
= 25,00,000
(c) Sales =Ratio P/V
rofitPCost Fixed
20,00,000 =20%
rofitP 1,00,000
20,00,000 × 20% = 1,00,000 + Profit4,00,000 = 1,00,000 + Profit Profit = 3,00,000
Illustration 3: If sales ` 20,00,000, variable cost 15,00,000 and fixed cost 2,00,000, calculate thefollowing:
(a) Profit Volume Ratio(b) Break-even Point(c) Sales required to earn profit of ` 5,00,000
Solution:
(a) P/V Ratio =Sales
onContributi × 100
=Sales
Cost Variable– Sales × 100
=20,00,000
15,00,000– 20,00,000 × 100
=20,00,0005,00,000 × 100 = 25%
(b) Break-even Point
=Ratio P/VCost Fixed

Absorption Costing and Marginal Costing, Cost Volume and Profit Analysis 63
=25%
2,00,000
= 8,00,000(c) Sales required to earn profit of ` 5,00,000
Desired Sales =Ratio P/V
rofitP Cost Fixed
Desired Sales =25%
5,00,0002,00,000
=25%
5,00,0002,00,000
= 28,00,000Illustration 4:
Year Sales Cost2013 16,00,000 15,76,8002014 20,52,000 19,22,400
From the above information, calculate: (A) P/V Ratio, (B) Fixed Ratio, (C) Break-even Point and(D) Profit/loss when sales 12,96,000.
Solution:
Year Sales Cost Print (Sales – Cost)2013 16,20,000 15,76,800 43,2002014 20,52,000 19,22,400 1,29,600
(a) P/V Ratio = Salesin Change
Profitin Change × 100
= 16,20,000– 20,52,000
43200– 1,29,600 × 100
= 4,32,000
86,400 × 100
= 20%(b) Fixed Cost = Contribution – Profit
= Sales × P/V Ratio – Profit= 16,20,000 × 20% – 43,200= 2,80,800
(c) Break-even Point = Ratio P/V
Cost Fixed
= 20%
2,80,800
= 14,04,000

Absorption Costing and Marginal Costing, Cost Volume and Profit Analysis64
(d) Desired Sales =Ratio P/V
ProfitDesired Cost Fixed
12,96,000 =20%
Profit2,80,800
12,96,000 × 20% = 2,80,800 + Profit2,59,200 – 2,80,800 = Profit/Loss Profit/Loss = (21,600) Loss = ` 21,600
Illustration 5: From the following particulars, you are required to calculate:1. Profit Volume Ratio;2. Break-even Point;3. Profit when sale is ` 2,00,000;4. Sales required to earn to earn a profit of ` 40,000;5. Margin of safety in the 2nd year.
Year Sales ` Profit `
I 2,40,000 18,000II 2,80,000 26,000
You may assume that the cost structure and selling prices remain constant in the two years.Solution:
1. 100000,40
000,8100SalesinChange
ofitPrinChange(PVR)RatioVolumeProfit = 20%
2. Break-even Point (BEP) = 000,50,1%20000,30
RatioP/VCostFixed
`
3. Profit when sale is ` 2,00,000Contribution = Sales × P/V Ratio = 2,00,000 × 20% = ` 40,000Profit = Contribution – FC = 40,000 – 30,000 = ` 10,000
4. Sales required to earn profit of ` 40,000%20
000,40000,30PVR
ofitPrDesiredFC
= ` 3,50,000
5. Margin of safety in second year = Actual sales – BE sales = ` 2,80,000 – ` 1,50,000 =` 1,30,000
6. Contribution = Sales × P/V Ratio = 2,40,000 × 20% = ` 48,0007. Fixed Cost (FC) = Contribution – Profit = 48,000 – 18,000 = 30,000
Illustration 6: KT & Co. has prepared the following budget estimates for the year 2014-2015:Sales 15,000. Selling Price ` 10, Variable cost ` 6 per unit fixed cost ` 34,000You are required to find:
1. Profit Volume Ratio.

Absorption Costing and Marginal Costing, Cost Volume and Profit Analysis 65
2. Break-even Point.3. Margin of safety.
Also create revised Profit Volume Ratio, Break-even Point and Margin of Safety, if selling priceper unit is reduced by 10%.
Solution:
Particulars Present ProjectedUnits (U)Sale Price (SP)Sale (S)Variable CostContribution (S – V)
Given 15,00010
1,50,00090,00060,000
Given 15,0009
1,35,00090,00045,000
(i) Profit Volume Ratio (PVR)
Sales100onContributi
10040000,34
= 40.00%
100000,35,1
000,45
= 33.33%(ii) Break-even Point (BEP) (`)
PVR100CostsFixed = 85,000 = 1,02,000
(iii) Margin of Safety (`)= Actual Sales– Break-even sales
= 1,50,000 – 85,000= 65,000
= 1,35,000 – 1,02,000= 33,000
(iv) Contribution Per UnitContribution ÷ Units
60,000 ÷ 15,000 = 4 45,000 ÷ 15,000 = 3
(v) Break-even Point (BEP) (Units)BEP ÷ SP
85,000 ÷ 10 = 8,500 1,02,000 ÷ 9 = 11,333
(vi) Margin of Safety (Units)Actual Sales – Break-even Sales 15,000 – 8,500 = 6,500 15,000 – 11,333 = 3,667
Illustration 7: The following data have been extracted from the books of Alfa Ltd.
Year Sales ` Profit `
20142015
5,00,0007,50,000
50,0001,00,000
You are required to calculate:(i) P/V Ratio
(ii) Fixed Cost(iii) Break-even Sales(iv) Profit on Sales of ` 4,00,000(v) Sales to earn of profit of ` 1,25,000.Solution:
1. P/V Ratio (PVR) = Salesin Change
Profitin Change

Absorption Costing and Marginal Costing, Cost Volume and Profit Analysis66
= 1005,00,000–7,50,00050,000– 1,00,000
`
`
= 1002,50,00050,000
= 20%2. Fixed Cost = Contribution – Profit
= (a) 1,00,000 – 50,000 = ` 50,000(b) 1,50,000 – 1,00,000 = ` 50,000
Contribution = Sales × P/V Ratio= 5,00,000 × 20% = ` 1,00,000 OR= 7,50,000 × 20% = ` 1,50,000
3. Break-even Sales =20
100000,50Ratio P/V
Cost Fixed = ` 2,50,000
4. Profit on Sales of ` 4,00,000Contribution = Sales × P/V Ratio = 4,00,000 × 20% = ` 80,000Profit = Contribution – Fixed Cost = 80,000 – 50,000 = ` 30,000
5. Sales to earn profit of ` 1,25,000
Required sales =RatioP/V
ProfitDesiredCostFixed
=20/100
1,25,00050,000
=20
100000,75,1
= ` 8,75,000Illustration 8: Z Ltd. produces and sells a single article at `10 each. The marginal cost of
production is ` 6 each and fixed cost is ` 400 per annum.Calculate:
1. P/V Ratio2. The break-even sales (in ` and numbers)3. The sales to earn profit of ` 500.4. Profit at sales of ` 3000.5. New break-even point if sales price is reduced by 10%.6. Margin of safety at sales of ` 1,500.7. Selling price per unit if the break-even point is reduced to 80 units.
Solution:
1. P/V Ratio = 100104100
SalesonContributi
= 40%

Absorption Costing and Marginal Costing, Cost Volume and Profit Analysis 67
2. Break-even Sales
(a) In ` =40
100400%40
400Ratio P/V
Cost Fixed = ` 1,000
(a) In Nos. =4
400UnitPeronContributi
CostFixed = 100 units
3. Sales to earn profit of ` 500 =Ratio P/V
ProfitDesired Cost Fixed
=40%
500400 =40
1001
900 = ` 2,250
4. Profit on Sale of ` 3000Profit = Contribution – Fixed Cost = 1,200 – 400 = ` 800Contribution = 40% of ` 3,000 = ` 1,200
5. New Break-even Point if sales price is reduced by 10%Old Sales Price ` 10New Sales Price 10 – 10% of 10 = 10 – 1 = ` 9New Contribution = S – VC = 9 – 6 = 3
New P/V Ratio = %33.3310093100
SalesonContributi
New BEP (`) =Ratio V/PCostFixed =
33.33%400 = ` 1,200
New BEP (Units) =3
400 er UnitPonContributi
CostFixed = 134(r/o)
6. Margin of Safety at Sales ` 1,500(Old) Margin of Safety = Actual Sales – BEP Sales
= 1,500 – 1,000 = ` 500, i.e., 50 units (500 ÷ 10)(New) Margin of Safety = 1,500 – 1,200 = ` 300, i.e., 34 units (300 ÷ 9; r/o)
7. Selling Price per unit if BEP is reduced to 80 units
Break-even Point in units =unitperonContributi
CostFixed
80 =unitperonContributi
400
Contribution per unit =80400 = ` 5
Selling Price per unit = Contribution Per Unit + Variable Cost per unit= 5 + 6 = ` 11 per unit
Illustration 9: A product is sold at ` 80 per unit. Its variable cost is ` 60 and fixed cost is` 6,00,000. Compute the following:

Absorption Costing and Marginal Costing, Cost Volume and Profit Analysis68
1. P/V Ratio2. Break-even Point3. Margin of safety at a sale of 50,000 units.4. At what sale, the producer will earn profit at 15% on sales?
Solution:`
Sale 80.00Variable Cost 60.00Contribution 20.00
1. P/V Ratio = 100Sales
onContributi = 100
8020
= 25%
2. Break-even Point =RatioV/PCost Fixed =
%25000,00,6 = ` 24,00,000
3. Margin of Safety (MOS) at a Sale of 50,000 Units
BEP Units =icePrSale)(BEP ` =
80000,00,24 = 30,000
MOS = Sale Units – BEP Units= 50,000 – 30,000 = 20,000 Units
1. Sale to earn a profit of 15% on saleSales = ` 80 per unit
Variable Cost = ` 60 per unitProfit = 15 × 80 ÷ 100 = 12 per unit
Fixed Cost = ` 6,00,000Let units sold be xSale = 80 x x; since Sales = Variable Cost + Fixed Cost + Profit
Therefore, 80X = 60X + 6,00,000 + 12X80X = 72X + 6,00,000
8X = 6,00,000X = 6,00,000 ÷ 8X = 75,000 units
Illustration 10: From the following data, compute:1. P/V Ratio2. BEP in rupees and unit.3. Number of units to be sold to earn a profit of ` 7,50,000.
Sales Price ` 20 per unitDirect Material ` 5 per unitDirect Wages ` 6 per unit

Absorption Costing and Marginal Costing, Cost Volume and Profit Analysis 69
Variable Administration Overheads ` 3 per unitFixed Factory Overheads ` 6,40,000 per yearFixed Administration Overhead ` 1,52,000 per year
Solution:Sale per Unit = ` 20
Variable Cost Per Unit = Direct Expenses + Variable Expenses = 5 + 6 + 3 = ` 14Contribution Per Unit = Sale – Variable Cost = 20 – 14 = ` 6
Fixed Cost = Factory Overhead + Administrative Overhead= 6,40,000 + 1,52,000 = ` 7,92,000
1. Profit Volume Ratio (PVR) = 100Sales
onContributi = 100
206 = 30%
2. Break-even Point (BEP) =RatioVolumeofitPr
tcosFixed =%30000,92,7 = ` 26,40,000
3. BEP (Units) =icePr SalesPointeven -Break =
20000,40,26 = ` 1,32,000
4. Number of units to be sold to earn profit of ` 7,50,000 =unitperonContributiofitPrCostFixed
=6
000,50,7000,92,7 = 1,32,000
Illustration 11: The XL Ltd. furnish the following information:Ist Period IInd Period
Sales 20,00,000 30,00,000Profit 2,00,000 4,00,000
You are required to calculate:1. P/V Ratio2. Fixed Expenses3. BEP4. Sales to earn profit ` 5,00,0005. Profit when sales are ` 15,00,000
Solution:
1. P/V Ratio = 100SalesinChange
ofitPrinChange = 100
000,00,10000,00,2
= 20%
2. Fixed Expenses = Contribution – Profit = 4,00,000 – 2,00,000 = ` 2,00,000Contribution = Sales × P/V Ratio = 20,00,000 × 20% = 4,00,000
3. Break-even Point (in `) = 100RatioV/PCostFixed
= 10020
000,00,2 = ` 10,00,000

Absorption Costing and Marginal Costing, Cost Volume and Profit Analysis70
Sales to earn profit of ` 5,00,000Desired Contribution = Fixed Cost + Required Profit
= 2,00,000 + 5,00,000 = ` 7,00,000
Required Sales = 100RatioV/P
onContributiDesired = 100
20000,00,7
= ` 35,00,000
4. Profit when sales are ` 15,00,000Desired Contribution = Sales × P/V Ratio = 15,00,000 × 20% = ` 3,00,000Desired Profit = Desired Contribution – Fixed Cost
= 3,00,000 – 2,00,000= ` 1,00,000
Illustration 12: Following particulars are available for A Ltd. and B Ltd.:
Particulars A Ltd. B Ltd.SalesP/V RatioFixed Cost
` 6,00,00025%
` 90,000
` 6,00,00020%
` 80,000
Calculate for each company:(i) Break-even Point
(ii) Margin of Safety(iii) Sales required to earn profit of ` 90,000Solution:
Particulars A Ltd. B Ltd.(a)
Break-even Point =RatioV/PCostFixed
%25000,90
= ` 3,60,000%20000,80
= ` 4,00,000
(b) Margin of Safety = Actual Sales – Break-even Sales 6,00,000 – 3,60,000= ` 2,40,000
6,00,000 – 4,00,000= ` 2,00,000
(c) Sales required to earn profit ` 90,000
=RatioV/P
ofitPrDesiredCostFixed %25
000,90000,90
= ` 7,20,000%20
000,90000,80
= ` 8,50,000
Illustration 13: M/s EAR Enterprises furnishes the following information:Year Sales (`) Profit (`)2013 6,00,000 60,0002014 8,00,000 1,00,000
From the above, calculate the following information:(i) P/V Ratio
(ii) Fixed Cost

Absorption Costing and Marginal Costing, Cost Volume and Profit Analysis 71
(iii) Break-even Cost(iv) Sales to earn profit ` 2,00,000(v) Margin of Safety of 2014.Solution:
1. P/V Ratio = 100SalesinChange
ofitPrinChange
= 100000,00,6000,00,8
000,6000,00,1
= 20%2. Fixed Cost = Contribution – Profit
= (PV/R × Sales) – Profit= (20% × 6,00,000) – 60,000 = ` 60,000= 20% × 8,00,000) – 1,00,000 = ` 60,000
3. Break-even Sales =Ratio V/PCostFixed =
%2060,000` = ` 3,00,000
4. Sales to Earn Profit ` 2,00,000 = Desired Sales =RatioV/P
onContributiDesired
Desired Contribution = Fixed Cost + Desired Profit= 60,000 + 2,00,000 = 2,60,000
Desired Sales =%20000,60,2 = ` 13,00,000
5. Margin of Safety for 2014MOS Sales = Total Sales – Break-even Sales
= 8,00,000 – 3,00,000 = ` 5,00,000
MOS Margin = 100SalesTotalSalesMOS
= 100000,00,8000,00,5
= 62.5%Illustration 14: From the following particulars, you are required to calculate:(i) Fixed Cost
(ii) Profit Volume Ratio(iii) Break-even Sales
Particulars 2012 (`) 2013 (`)Total CostSales
12,96,00014,40,000
18,72,00021,60,000

Absorption Costing and Marginal Costing, Cost Volume and Profit Analysis72
Solution:Profit (1st Period) = 14,40,000 – 12,96,000 = 1,44,000Profit (2nd Period)= 21,60,000 – 18,72,000 = 2,88,000
(a) P/V Ratio = 100SalesChange
ofitPrinChange
= 100)000,40,14000,60,21(
)000,44,1000,88,2(
= 100000,20,7000,44,1
= 20%
(b) Fixed Cost (2012) = Contribution – Profit= (P/V Ratio × Sales) – Profit= ( ` 14,40,000 × 20%) – 1,44,000= ` 2,88,000 – ` 1,44,000 = ` 1,44,000
(c) Break-even Sales =RatioPV
CostFixed =%20000,44,1 = ` 7,20,000
Illustration 15: The following is the cost structure of a product Selling price ` 100 per unit.Variable cost per unit:
Material ` 38Labour ` 14Direct Expenses ` 8
Fixed overheads for the year:Factory Overheads ` 2,80,000Office Overheads ` 2,20,000No. of Units Produced and Sold ` 40,000Calculate:1. P/V Ratio2. Break-even Point in units3. Margin of Safety Amount4. Break-even Point if fixed overheads increased by 20%.5. Revised P/V Ratio when selling price increased by 20%.Solution:
Particulars Total ` Per Unit `
(A) Sales(B) Variable Cost
– Material ……………….– Labour ……………….
40,00,000 100
15,20,0005,60,000
3814

Absorption Costing and Marginal Costing, Cost Volume and Profit Analysis 73
– Expenses ....…………….Subtotal ..………………(C) Contribution (A – B) ...……………...(D) Fixed Cost
Factory .....……………..Office ...……………...
Subtotal ...……………....(E) Profit ( C – D) .……………….
3,20,000 8
24,00,000 6016,00,000
2,80,0002,20,000
40
5,00,00011,00,000
1. P/V Ratio =Sales
onContributi =10040 = 40%
2. Break-even Point in Units =UnitperonContributi
CostFixed =40
000,00,5 = 12,500 Units
3. Margin of Safety Amount = Units = 40,000 – 12,500 = 27,500 Units= Amount = 40,00,000 – 12,50,000 = 27,50,000
4. Break-even Point is fixed overheads increased by 20%Contribution = 16,00,000New Fixed Overheads = 6,00,000Profit = 10,00,000
Break-even Point in Units =UnitperonContributi
CostFixed =40
000,00,6 = 15,000 units
Break-even Point in ` = 15,00,000
5. Selling Price increased by 20% = P/V Ratio =Sales
Cost Variable– Sales =120
60120 = 50%
Illustration 16: A company produces and sells 1,500 units of a commodity at ` 20 each. Thevariable cost of the production is ` 12 per unit and fixed cost ` 8,000 per annum.
Calculate:(i) P/V Ratio
(ii) Sales at break-even point(iii) Additional sales required to earn the same amount of profit if selling price is reduced by 10%.
Solution:
Particulars Original (1500 units) Working RevisedSales per Unit [S] 20
1230,00018,000
20 – 10% 1812Variable Cost per Unit [V]
Contribution per Unit [S – V] 8 12,0008,000
68,000Fixed Costs (FC)
Profit 4,000

Absorption Costing and Marginal Costing, Cost Volume and Profit Analysis74
Equations:
(i) Profit Volume Ratio (PVR) = 100Sales
onContributi = 100
SC = 100
000,30000,12
= 40%
(ii) Break-even Point in Units =RatioVolumeofitPr
CostFixed =%40
000,8 = ` 20,000
BEP (Units) =Price Sale
Pointeven -Break =20000,20 = 1000 units
(iii) Number of units to be sold to earn same profit of ` 4,000 =unitperonContributiofitPrtcosFixed
=6
000,4000,8
= 2,000Units sold earlier = 1,500Additional units to be sold = 2,000 – 1,500 = 500
Exercise1. You are given the following information for the next year.
Sales (10,000 units) ` 1,20,000Variable cost ` 48,000Fixed cost ` 60,000Find out the P/V ratio, Break-even point and the margin of safety.
2. ProductsParticulars X Y Z
UnitsSelling priceVariable costFixed cost
10,0004
2.512,000
15,00043
9,000
20,0004
3.57,500
Find Profit, Break-even point and Margin of safety of each product as well as that of thecompany.
3. KT & Co. has prepared the following budget estimated for the year 2005-06: sales 15,000units, sales value ` 1,50,000, fixed expenses ` 34,000 and variable per unit ` 6/-.You are required to find: (i) Profit Volume Ratio, (ii) Break-even Point and (iii) Margin ofsafety.Also calculate revised Profit Volume Ratio, Break-even Point and Margin of Safety, ifselling price per unit is reduced by 10%.

Absorption Costing and Marginal Costing, Cost Volume and Profit Analysis 75
4.Period I II
Sales (` lakhs)Profit (` lakhs)
15030
20050
Find P/V Ratio, Fixed Cost, Break-even Point; Sales to earn profit of ` 90 lakhs and Profitat sales of ` 280 lakhs.
5. From the following particulars, you are required to calculate: (i) Profit volume ratio,(ii) Break-even point, (iii) Profit when sale is ` 2,00,000, (iv) Sales required to earn profitof ` 40,000 and (v) Margin of safety in the year 2nd year.
Year Sales ` Profit `
I 2,40,000 18,000II 2,80,000 26,000
6. EXE Ltd. manufactures and sells four types of products A, B, C and D. The sales mix invalue comprises of 33
31 %, 41
32 %, 16
32 % and 8
31 % of products A, B, C and D respectively.
The total budgeted sales (100 per cent) are ` 60,000 per month.Operations costs are:Variable costs:Product A 60% of selling priceProduct B 68% of selling priceProduct C 80% of selling priceProduct D 40% of selling priceFixed cost ` 14,700 of selling priceCalculate the break-even point for the products on an overall basis. It is proposed to changethe sales mix as follows:Product A 25%Product B 40%Product C 30%Product D 5%The total sales per month at ` 60,000. If this proposal is implemented, what will be thebreak-even point?
7. Jayashree Enterprises present the following information to you relating to the half yearended 30-6-2004:Fixed Expenses : ` 45,000Sales : ` 1,45,000Profit : ` 30,000During the second half year of 2004, the company had projected a loss of ` 10,000. You arerequired to calculate:(i) The break-even point and margin of safety for the six months ended 30.6.2004.

Absorption Costing and Marginal Costing, Cost Volume and Profit Analysis76
(ii) Expected sales in the second half year assuming that P/V ratio and fixed expensesremain constant in the second half year also.
(iii) The break-even point and margin of safety for the whole of 2004.8. A customer produces and sells 100 units of A per month at ` 20. Marginal cost per unit is
` 12.00 and fixed costs are ` 300 per month. It is proposed to reduce the selling price by20%. Find the additional sales required to earn the same profit as before.
Objective QuestionsI. Fill in the Blanks
1. Elements of costs are classified into _____________ and _____________.2. Fixed Cost is treated as _____________ and charged to P& L account3. _____________ costs are treated as product cost.4. The _____________ shows the relationship among unit sale price, variable cost, sales
volume, sales mix and fixed cost.5. Fixed cost remains constant _____________.6. Those activities that results in cost are known as _____________.7. Variable cost is fixed _____________ but varies in_____________.8. Contribution is also known as contribution margin or _____________.9. Fixed cost – Loss = _____________.
[Ans.: 1. Variable cost, fixed cost, 2. Period cost, 3. Variable, 4. CVP analysis, 5. In total,6. Cost drivers, 7. Per unit, total, 8. Gross margin, 9. Contribution.]
____

Chapter
3
The marginal costing helps the management in taking many policy decisions. The vital areaswhere these concepts are applied directly are as follows:
1. Level of activity planning: Normally, the managements will consider different levels ofproduction or selling activities to decide optimum level of activity. Such periodic exerciseshall put the organisation in the right track to achieve its goal. Since the optimum level ofactivity results in the maximum contribution per unit, the planning can become a perfectexecution tool.
2. Alternative methods of production: With the help of marginal costing techniques, it ispossible to undertake decision about the alternate methods of production. All the decisionsshould be focused at the greater contribution so that profit can be maintained at a balancedlevel.
3. Make or buy decision: Depending upon the situational ambience, the management canhave a blueprint on a vital decision. Management can think of outsourcing the productionactivities or to undertake it within its purview. Based on the comparative statement of costof manufacture with the purchase price, decisions can be taken.
4. Fixation of selling price: While pricing a product, the marginal costing techniques cancome handy. While fixing a price for a product, it is prudent to take into account therecovery of marginal cost in addition to get a reasonable contribution to cover fixedoverheads. Pricing will be at ease once the marginal cost and overall profitability of theconcern are known.
5. Selection of optimum sales mix: The product mix plays an important role when a firmproduces more than one product. The main focus will on profit maximisation. With the helpof marginal costing techniques, it is possible to decide the best product mix which willresult in maximum profits to the firm.
6. New product introduction: When a firm intends to diversify its activities or to expand itsexisting markets with the help of marginal costing techniques, by fixing the time horizon torecover the fixed costs and profit, decisions can be taken for the introduction of newproducts.
7. Balancing of profits: As the economic trends gets changed on account of governmentfiscal policies and regulations, competition at the regional, national, and international levels,marginal costing techniques can aid to bring out facts with regard to maintaining a desiredlevel of profits.
8. Final balancing decisions: If the sales of the product were not encouraging to cover thefixed costs, it is quite natural that the firm may decide about its continuance. This may leadto dovetailing or completely closing down the operations. Marginal costing helps themanagement to take a sound decision.
MANAGERIAL DECISIONMAKING

Managerial Decision Making78
Decision-makingDecision-making is the process of evaluating two or more alternatives leading to a final choice
known as alternative choice decisions. Decision-making is closely associated with planning for thefuture and is directed towards a specific objective or goal. Decision model contains the followingdecision-making steps or elements:
1. Identify and define the problem.2. Identify alternative as possible solutions to the problem.3. Eliminate alternatives that are clearly not feasible.4. Collect relevant data (costs and benefits) associated with each feasible alternative.5. Identify cost and benefits as relevant or irrelevant and eliminate irrelevant costs and
benefits from consideration.6. Identify to the extent possible, non-financial advantages and disadvantages about each
feasible alternative.7. Total the relevant cost and benefits for each alternative.8. Select the alternative with the greatest overall benefits to make a decision.9. Implement or execute the decision.
10. Evaluate the results of the decision made.
Types of CostsA decision involves selecting among various choices. Non-routine types of decisions are crucial
and critical to the firm as it involves huge investments and involve much uncertainty. Short-termdecision-making is based on relevant data obtained from accounting information.
Relevant cost are costs which would change as a result of the decision.Opportunity costs are monetary benefits foregone for not pursuing the alternative course. When a
decision to follow one course of action is made, the opportunity to pursue some other course isforegone.
Sunk costs are historical cost that cannot be recovered in a given situation. These costs areirrelevant in decision-making.
Avoidable costs are costs that can be avoided in future as a result of managerial choice. It is alsoknown as discretionary costs. These costs are relevant in decision-making.
Incremental/differential costs are costs that include variable costs and additional fixed costsresulting from a particular decision. They are helpful in finding out the profitability of increasedoutput and give a better measure than the average cost.
Types of Choices DecisionsThe application of incremental/differential costs and revenues for decision-making is known as
decision situations or types of choice decisions.1. Make or buy decisions2. Addition or discontinuance of a product line or process3. Sells or process further, etc
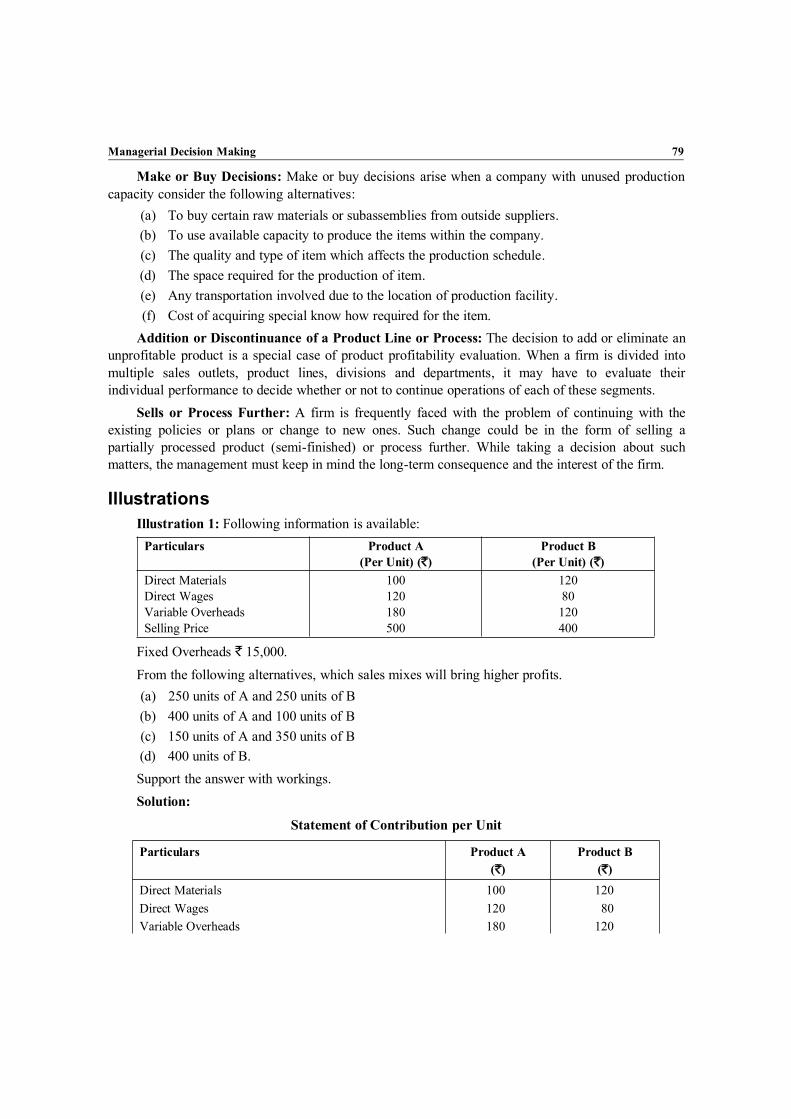
Managerial Decision Making 79
Make or Buy Decisions: Make or buy decisions arise when a company with unused productioncapacity consider the following alternatives:
(a) To buy certain raw materials or subassemblies from outside suppliers.(b) To use available capacity to produce the items within the company.(c) The quality and type of item which affects the production schedule.(d) The space required for the production of item.(e) Any transportation involved due to the location of production facility.(f) Cost of acquiring special know how required for the item.
Addition or Discontinuance of a Product Line or Process: The decision to add or eliminate anunprofitable product is a special case of product profitability evaluation. When a firm is divided intomultiple sales outlets, product lines, divisions and departments, it may have to evaluate theirindividual performance to decide whether or not to continue operations of each of these segments.
Sells or Process Further: A firm is frequently faced with the problem of continuing with theexisting policies or plans or change to new ones. Such change could be in the form of selling apartially processed product (semi-finished) or process further. While taking a decision about suchmatters, the management must keep in mind the long-term consequence and the interest of the firm.
IllustrationsIllustration 1: Following information is available:
Particulars Product A(Per Unit) (`)
Product B(Per Unit) (`)
Direct MaterialsDirect WagesVariable OverheadsSelling Price
100120180500
12080120400
Fixed Overheads ` 15,000.From the following alternatives, which sales mixes will bring higher profits.(a) 250 units of A and 250 units of B(b) 400 units of A and 100 units of B(c) 150 units of A and 350 units of B(d) 400 units of B.Support the answer with workings.Solution:
Statement of Contribution per Unit
Particulars Product A(`)
Product B(`)
Direct MaterialsDirect WagesVariable Overheads
100120180
12080
120

Managerial Decision Making80
Total Variable Cost (b)Selling Price (a)Contribution (a–b)
400500100
320400
80
Particulars Option (a)250 of A and
250 of B
Option (b)400 of A and 100
of B
Option (c)150 of A
and 350 of B
Option (d)400 of B
Units Produced and Sold (250 × 100) +(250 × 80)
(400 × 100) +(100 × 80)
(150 × 100) +(350 × 80)
(400 × 80)
Contribution 45.000 48.000 43,000 32,000Less: Fixed Cost 15,000 15,000 15,000 15,000Profit 30,000 33,000 28,000 17,000
Option (b) will result into higher profit.Illustration 2: A manufacturing company is operating at 75% of its full capacity. It is proposed
to offer a price reduction of 5% to 10% depending upon volume desired. Given below are the relevantdata:
Capacity 75 85 100Output (Units) 75,000 85,000 1,00,00Selling Price Unit ` 96 5% off 10% offMaterial Cost Per Unit ` 40 10% less 15% lessWages Cost Per Unit ` 10 ` 10 ` 10
Fixed Overheads:Production ` 14.00,000Selling and Distribution ` 5,00,000Variable Overheads (at full capacity):Selling and Administration 4,40,000Production 14,00,000
(a) Prepare a statement showing variable cost, fixed cost, total cost and profit/loss in terms of` and per unit at 75%,.85% and 100% capacity.
(b) Indicate which of the three levels is most profitable.Solutions:
Capacity 75% 85% 100%75,000 85,000 1,00,000
Amt Amt AmtSales 96 72,00,000 91.20 77,52,000 86.40 86,40,000Less: Variable Costs:
Material 40 30,00,000 36 30,60,000 34 34,00,000Wages 10 7,50,000 10 8,50,000 10 10,00,000
Variable Production Overhead 14 10,50,000 14 11,90,000 14 14,00,000Variable Selling andAdministration Overhead 4.40 3,30,000 4.40 33,74,000 4.40 4,40,000

Managerial Decision Making 81
Total Variable Cost 68.4 51,30,000 64.4 54,74,000 – 62,40,000Contribution 27.6 20,70,000 26.8 22,78,000 62.40 24,00,000Fixed Overheads:
Production 18.67 14,00,000 16.47 14,00,000 24 14,00,000Selling and Administration 6.67 5,00,000 5.88 5,00,000 14 5,00,000
Profit 2.27 1,70,000 4.47 3,78,000 5 5,00,000
Recommendation: Operating at 100. i at full capacity is most profitable.Illustration 3: ABC Ltd. manufactures staplers. All parts of the staplers are manufactured by the
company except its metal base plate which is bought from Metal Kings & Co. at a price of ` 300 perthousand plates. All sales are in units and these are expected to remain at the same level. Metal Kings &Co. have informed that they would be increasing the price of the plates to ` 400 per thousand plates.ABC Ltd. has also now received an offer for use of the unutilised plant space and capacity and isthinking to use the same for manufacture of as an alternative to buying from Metal Kings & Co. ABCLtd. has also now received an offer use of same unutilised plant space at an annual rent of 5.000. Thecost department of ABC Ltd. has the following relevant data for self-manufacture of the 1,00,000 plates:
Particulars `
Raw Materials 8,500Direct Labour 8,000Variable Overheads 10,500General (Fixed) Overheads 14,000
You are required to advise ABC Ltd. giving detailed working and reasoning as to whether itshould buy the plates or manufacture them.
Solution:
Statement Showing the cost of Making/Buying and ConsequentialEffects on Cost 1,00,000 Units
Particulars Annual Cost Cost Increase or (Saving)Make Plates Buy Plates If Plates are Produced
Raw MaterialsDirect LabourVariable OverheadsFixed OverheadsPurchase PlatesRent Receivable(Opportunity Cost)
8,5008,000
10,50014,000
––
–––
14,00040,000
(–) 5,000
8,5008,000
10,500–
(–) 40,0005,000
41,000 49,000 (–) 8,000
Cost will reduce by ` 8,000 or profit will increase by ` 8,000 if the company makes the plates.(General overhead is irrelevant and it has no effect on the decision).

Managerial Decision Making82
Illustration 4: M/s Alok Industries has given the following details. Find the most profitabilityproduct mix and prepare a statement of the product mix.
Particulars Product X Product Y Product ZUnits budgeted to be produced and sold 1,800 3,000 1,200Selling price per unit (`) 60 55 50Requirements per unit:
Direct materials 5 kg 3 kg 4 kgDirect labour 4 hrs. 3 hrs 2 hrsVariable overheads ` 7 ` 13 ` 8Fixed overheads ` 10 ` 10 ` 10Cost of direct material per kg ` 4 ` 4 ` 4Direct labour hour rate ` 2 ` 2 ` 2
Maximum possible units of sales 4,000 5,000 1,500
All the above products are produced from the same direct materials using the same type ofmachines and labour. Direct labour, which is the key factor, is limited to 18,600 hours.
Solution:
M/s Alok IndustriesCalculation of Contribution per Direct Labour Hours and Ranking
Particulars ProductsX Y Z
A. Selling Price per (`) 60 55 50Less: Variable Cost per unit (`):
Direct Materials 20 12 16Direct Labour 8 6 4Variable Overheads 7 13 8
B. Total Variable Cost per unit (`) 35 31 28Contribution (A – B) (`) 25 24 22Direct Labour Hours per unit 4 3 2Contribution per Hour (C/DLH) 6.25 8 11Ranking III II I
Statement of Profitability
Particulars Products TotalX Y Z
Units Produced and Sold 150 5,000 1,500 –Contribution per unit (`) 25 24 22 –
Total Contribution 3,7501,20,00
0 33,0001,56,75
0Less: Fixed Overheads @ ` 10 forBudgeted Units 18,000 30,000 12,000
(60,000)
96,750

Managerial Decision Making 83
Working Note:Profit
Allocation of Direct Labour Hours for Most Profitable Product MixTotal Direct Labour Hours Available 18,600Less: Utilised for 1,500 Units of Product Z (1,500*2) 3,000Balance hrs available 15,600Less: Utilised for 5,000 units of Product Y (5,000*3) 15,000Balance Utilised for 150 units of Product X (150 × 4) 600
Illustration 5: The following is the data of M Ltd relating to two type of machines:
Particulars Existing Machines`
New Machines`
Output per annum (units) 2000 4000
Capital Cost 25,000 1,00,000
Marginal Cost 15 13
Selling Price 30 30
Fixed Expenses per annum 12,000 32,000
Life 10 years 10 years
The existing machines has completed five years of services and the present resale value is ` 10,000.Advice, on the basis of ‘annual’ comparative data analysis taking into account all aspects and assuming15% p.a. as the rate of interest, whether the company should go for the new machine or not and alsohighlight subjective/qualitative factors for consideration of the management in regard thereto.
Solution:Statement of Profitability
Particulars Existing Machine2000 units
`
New Machines4000 units
`
SalesMarginal Cost p.a. 30,000 52,000Fixed Expenses p.a. 12,000 32,000
Interest on Additional Capital Required for NewMachinery (1,00,000 – 10,000) 15%
13,500
Depreciation 2,500 10,000Loss on Sale of old Machine over Ten Years (2,500/10) 250Total Cost 44,500 1,07,750Total Sales 60,000 1,20,000Profit per annum 15,500 12,250CPU 22.25 26.94Profit per unit 7.75 3.06

Managerial Decision Making84
Comments:(i) The above analysis shows that it will be better to continue with existing machine than
replacing it by a new one.(ii) Qualitative features:
(a) New machine may be of better quality and the output may be doubled to 4,000 andthere are chances to increase in the profit if we can raise the selling price of the product.
(b) Also there is a possibility of larger market share and hence we can capture the marketas the output is doubled.
If we look at short-term point of view, we should go with the existing machine but if welook from long-term perspective, it is advisable to go for the new machine.
Illustration 6: A First already in production gives to you its following detail:Annual Capacity
(Units)Unit Cost
`Unit Price
`6,000 80 1007,000 75 978,000 74 959,000 72
10,000 71
The firm is operating at 8,000 units capacity at present and cannot exceed, in any case, totally15,000 units capacity level by any means. Under the circumstances, the firm receives two alternativeadditional order, only one of which it can accept:
(a) For 2,000 units from an export market at a price of ` 70 per unit.(b) For 7,000 units from another export market at a price of ` 75 per unit and it is given that the
firm has to increase its establishment for going from 10,000 units to 15,000 units whichwould result into additional fixed cost of ` 30,000 per annum in addition to the per unit costof ` 71 at 10,000 units level which would remain the same even subsequently, i.e., at thelevel of 15,000 units.
Advise the firm as to whether any of the alternative additional export orders should be acceptedor not, and if yes, which one?
Solution:
Operating at 8,000 units
Units Cost Sales revenue Additional profit(a) 2000 1,18,000 1,40,000 22,000 (`11/unit)
(7,10,000 – 5,92,000) (2,000 * 70) (70 – 59) * 2,0008,000 5,92,000 7,60,000 1,68,00010,000 7,10,000 9,00,000 1,90,000
[7,60,000 + (2,000 * 70)](b) 15,000 (10,65,000 + 30,000) [(7,60,000 + (7,000 * 75]
10,95,000 12,85,000 1,90,000

Managerial Decision Making 85
Advice: Any of the above two alternative export orders may be accepted, as both are equallyprofitable. However, (a) is more advisable in case of double as to stability of demand as fixed cost donot rise.
Conclusion: In both the cases, additional profit will be ` 1,90,000. Hence, any of the exportorder may be accepted.
However, ‘a’ is preferable as additional fixed cost is to incurred the case of ‘b’.
(Acceptance or Rejection of Special Export Order)Illustration 7: Silver Line Ltd. market two brands (A and B) of same product line. Relevant
figures about its operations during the year 2009 were.
Particulars A BUnits Sold 80,000 60,000Selling Price per unit (`) 170 120Materials Cost per unit ` 50 40Direct Labour per unit ` 30 20Production overhead (50% Fixed) 40 40
Marketing manager proposes two alternatives plans for the year 2010.(a) Increase product A market by 40% (no growth for product B).(b) Increase product B market by 100% (no growth for product A).Company can manage either of the plans without any increase in the current level of fixed
expenses. Further, selling and distribution expenses are 5% of sales realisation.You are required to present the detailed calculations of costs and revenues of the alternate plans
and advise the management – which one to accept?Solution:
Calculation of Costs and Revenues of the Alternate Plans
Product A Per Unit B Per Unit CPUA. Selling Price 170 120B. Variable Cost:
Material 50 40Labour 30 20Variable Overheads 20 20Selling & Distribution Overheads 8.50 6
Total VC 108.50 86C. Contribution (A – B) 61.50 34
Units Sold 80,0,00 60,000Total Contribution 49,20,000 20,40,000 69,60,000Less: Fixed Cost (20 * 80,000) + (20 *60,000)
28,00,000
Profit 41,60,000

Managerial Decision Making86
Plan A: Increase Product A market by 40%Particulars A B Total (`)Units 80,000 + 40% = 1,12,000 60,000
Contribution per unit 61.50 34
Total Contribution 68,88,000 20,40,000 89,28,000Less: Fixed Cost 28,00,000Profit 61,28,000
Plan B: Increase Product B market by 100%Particulars A B Total (`)Units 80,000 60,000 + 100% = 1,20,000Contribution p.u. 61.50 34Total Contribution 49,20,000 40,80,000 90,00,000Less: Fixed Cost 28,00,000Profit 62,00,000
Conclusion: Proposal B should be accepted, i.e., increase the Product B by 100%. It increase theprofit to ` 62,00,000 as compared to the existing profit which is ` 41,60,000.
Illustration 8: X Ltd. manufactured and sold 14,000 units in the first year and 18,000 units in thesecond year respectively. The selling price per unit was ` 100 in both the years. In the first year, itsuffered a loss of ` 20,000 and in the second year earned a profit of ` 20,000/-. Variable cost is 90%of sales.
Calculate the following:(a) The amount of fixed cost.(b) The BEP in units and in sales value.(c) Profit when 26,000 units are sold.(d) The number of units to be sold to earn post-tax profit of ` 30,000. Tax rate is 40%.X Ltd. estimates that its sale will be ` Nil in the next year. The competitors has made an offer
that it would buy the products of X Ltd. At present, selling price less 10% with a condition that X Ltd.should purchase competitor’s product equal to double of the units purchased by the competitors fromX Ltd. The competitor’s product selling price is ` 90 and fetches contribution ` 25 per unit. If thecompetitor’s offer is purchased, calculate:
(a) BEP in units purchased and sold by X Ltd.(b) Number of units to be purchased and sold to earn profit of ` 40,000.Solution:
Contribution per unit = Change in Profit/Change in Sales (Quantity)= – 20,000 – 20,000/14,000 – 18,000= – 40,000/–4,000= ` 10/- unit

Managerial Decision Making 87
(a) Ascertainment of Fixed CostParticulars 1st Year 2nd Year
Sales 14,00,000 18,00,000Less: Variable Cost (90%) 12,60,000 16,20,000Contribution 1,40,000 1,80,000Less: Fixed Cost 1,60,000 1,60,000Profit (Loss) (20,000) (20,000)
(b) Break-even PointP/V Ratio = Contribution/Sales * 100
= 10/100*100= 10%
(i) BEP units = FC/Contribution per unit= 1,60,000/10= 16,000 units
(ii) BEP Sales value = FC/P/V Ratio= 1,60,000/10%= ` 16,00,000
(c) Profit when 26,000 units are soldMargin of Safety = Actual Sales – Break-even Sales
= 26,000 – 16,000= 10,000
Profit = MOS * Contribution per unit= 10,000 * 10= ` 1,00,000
(d) No. of units to be sold to earn post-tax profit of ` 30,000Tax rate is 40%
Pre-tax profit = 30,000/(100 – 40)%= `.50,000
Contribution required to earn pre-tax profit of ` 50,000= Fixed Cost + Profit Required= 1,60,000 + 50,000= 2,10,000 units
Hence, Number of units to be sold to earn post-tax profit of ` 30,000= 2,10,000/Contribution per unit= 2,10,000/10= 21,000 units
Received selling price as per competitor’s offerPresent Selling price = 100 – 10
= ` 90

Managerial Decision Making88
Revised (S – V)Contribution = 90 – 90 = Nil
Contribution on sale of competitor’s product = ` 25Let X be the number of units sold by X to competitorsNumber of competitor’s units to be purchased would be 2%Whereas fixed cost is ` 1,60,000
25*2x = 1,60,00050x = 1,60,000
X = 3,200 units(a) X Ltd. should purchase 6400 (double the units purchased by competitor’s) and sell 3200
units for BEPContribution `
3,200*0 = NilContribution = 6,400*25 = 1,60,000
Total Contribution = 1,60,000(b) Number of units to be purchased and sold to earn a profit of ` 40,000
Desired Contribution = FC + Required Profit= 1,60,000 + 40,000 = ` 2,00,000
25*2x = 2,00,00050x = 2,00,000
X = 4,000 unitsX Ltd. should purchase 8000 units from the competitors and sell 4000 units for earning aprofit of ` 40,000.
Illustration 9: A manufacturer has planned his level of operation at 50% of his plant capacity of30,000 units. His expenses are estimated as follows, if 50% of the plant capacity is utilized:
(i) Direct Materials ` 8,280/-(ii) Direct Wages ` 11,160/-
(iii) Variable and other manufacturing expenses ` 3,960/-(iv) Total Fixed Expenses irrespective of capacity utilization ` 6,000/-The expected selling price in the domestic market is ` 2/- per unit. Recently, the manufacturer
has received a trade enquiry from an Overseas Organisation interested in purchasing 6000 units at aprice of ` 1.45 per unit.
As a professional Management Accountant, what would be your suggestions regardingacceptance or rejection of the order?
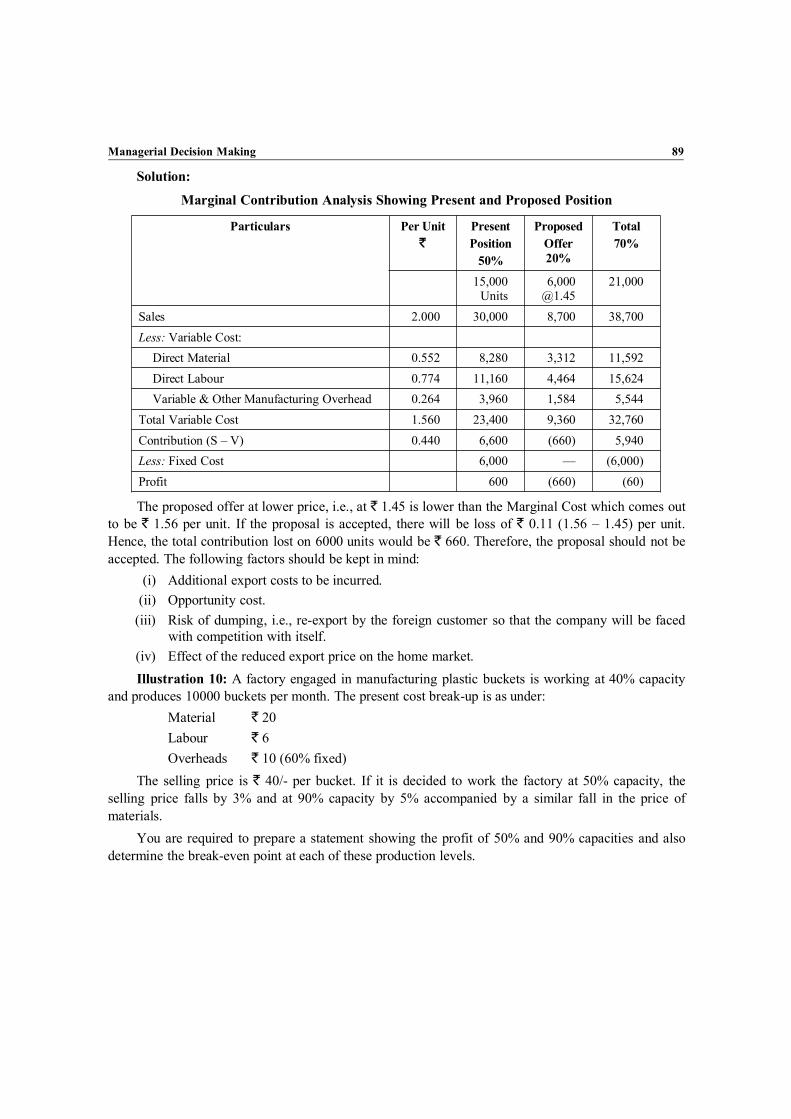
Managerial Decision Making 89
Solution:
Marginal Contribution Analysis Showing Present and Proposed Position
Particulars Per Unit`
PresentPosition
50%
ProposedOffer20%
Total70%
15,000Units
21,000
Sales 2.000 30,000 8,700 38,700Less: Variable Cost:
Direct Material 0.552 8,280 3,312 11,592Direct Labour 0.774 11,160 4,464 15,624Variable & Other Manufacturing Overhead 0.264 3,960 1,584 5,544
Total Variable Cost 1.560 23,400 9,360 32,760Contribution (S – V) 0.440 6,600 (660) 5,940Less: Fixed Cost 6,000 — (6,000)Profit 600 (660) (60)
The proposed offer at lower price, i.e., at ` 1.45 is lower than the Marginal Cost which comes outto be ` 1.56 per unit. If the proposal is accepted, there will be loss of ` 0.11 (1.56 – 1.45) per unit.Hence, the total contribution lost on 6000 units would be ` 660. Therefore, the proposal should not beaccepted. The following factors should be kept in mind:
(i) Additional export costs to be incurred.(ii) Opportunity cost.
(iii) Risk of dumping, i.e., re-export by the foreign customer so that the company will be facedwith competition with itself.
(iv) Effect of the reduced export price on the home market.Illustration 10: A factory engaged in manufacturing plastic buckets is working at 40% capacity
and produces 10000 buckets per month. The present cost break-up is as under:Material ` 20Labour ` 6Overheads ` 10 (60% fixed)
The selling price is ` 40/- per bucket. If it is decided to work the factory at 50% capacity, theselling price falls by 3% and at 90% capacity by 5% accompanied by a similar fall in the price ofmaterials.
You are required to prepare a statement showing the profit of 50% and 90% capacities and alsodetermine the break-even point at each of these production levels.

Managerial Decision Making90
Solution:
Statement Showing profit and BEP at Different Level of Capacity
Particulars Existing 50% capacity 12500 units 90% Capacity 2500 UnitsP.U. ` P.U. ` Total ` P.U. ` Total `
Sales (A) 40 38.80 4,85,000 38.00 8,55,000
Less: Variable Cost:Materials 20 19.40 2,42,500 19.00 4,27,500
Labour 6 6.00 75,000 6.00 1,35,000
Overhead (Variance) 4 4.00 50,000 4.00 90,000
(B) 30 29.40 3,67,500 29.00 6,52,000
Contribution (A – B) 10.00 9.40 1,17,500 9.00 2,02,500
Less: Fixed Cost 60,000 60,00057,500 1,42,500
At 40% Fixed Cost = 6*10,000 = ` 60,000
At 50% At 90%BEP = Fixed Cost* Selling Price/Units/
Contribution/Units= 60000 * 38.80/9.40= ` 2,47,660
Or= 6,383 buckets
BEP = Fixed Cost* Selling Price/Units/Contribution/Units
= 60000 * 38/9= ` 2,53,333
Or= 6,667 buckets
Illustration 11: Shantibai Sweet Softness has introduced a new product ‘Suyash’ consisting ofsquare sweet bars which are wrapped in aluminium foil and packed in attractive cartoons containing50 bars, which is considered as sales unit. Revenue statements for the last two quarters which areassumed to be representative of the efficiency expected in the next few quarters, reflect the followingposition assuming no closing stocks at each quarter end:
Particulars First Quarter (`) Second Quarter (`)Sales:
50,000 Cartoons @ ` 24 12,00,000 –70,000 Cartoons @ ` 24 – 16,80,000
Cost of Goods Sold 7,00,000 8,80,000Gross Margin 5,00,000 8,00,000Selling and Administration Costs 6,50,000 6,90,000Net Profit (Loss) before Taxes (1,50,000) 1,10,000Tax (Negative) (60,000) 44,000Net Profit (Loss) (90,000) 66,000
The firm’s overall marginal and average income tax rate is 40% which has been used to estimatethe tax liability arising from sweet operations:

Managerial Decision Making 91
Required:1. The break-even point in terms of quarterly cartoon sales for the sweet (Suyash) both
quantity and value wise.2. With quarterly cartoon, quantity sales and total revenue are required in each quarter to earn
an after-tax return of 20% p.a. on an investment of `30 lakhs in this product line.3. It is estimated that sales quantity will increase by 20% over the second quarter sales if the
selling price is reduced by ` 1.50 per cartoon and ` 1,50,000 advertising incurred. Shouldthe plan be implemented?
Solution:1. Break-even Point (Quantity and Value)
Calculation of Variable and Fixed Costs:
(a)Outputin ChangeCostin Change Sold Goods ofCost Variable
20,0001,80,000 `
= ` 9 per cartoon
(b) Fixed Cost of Goods SoldTotal Cost = Fixed Cost – Variable Cost7,00,000 = Fixed Cost + (50,000 × 9)Fixed Cost of Goods Sold = ` 2,50,000
(c)20,00040,000
Outputin ChangeCostin ChangeCost tion Administra and Selling Variable = ` 2 per Cartoon
(d) Fixed Cost of Selling and Administration CostTotal Cost = Fixed Cost + Variable Cost6,50,000 = Fixed Cost + (50,000 × 2)Fixed Cost of Selling and Administration Cost = ` 5,50,000Total Variable Cost = 9 + 2 = ` 11 per CartoonTotal Fixed Cost = 2,50,000 + 5,50,000 = ` 8,00,000 per Quarter
Quarterper on ContributiQuarterper Cost Fixed (Quantity) BEP
13000,00,8
)1124(000,00,8
= 61,539 cartoons
100Sales
onContributi Ratio P/V = 13/24 × 100 = 54.166%
Ratio P/VQuarterper Cost Fixed (Value) BEP
%1666.54000,00,8 = ` 14,76,923
2. Annual after Tax Return = 30,00,000 × 20/100 = ` 6,00,000Quarterly after Tax Return = 6,00,000 × 1/4 = ` 2,50,000Profit = Contribution – Fixed Cost
2,50,000 = (Sales × P/V Ratio) – 8,00,000 Sales × 54.1666% = ` 10,50,000
Sales =%1666.54
000,50,10 = ` 19,38,463

Managerial Decision Making92
Sales (quantity ) =24
463,38,19 = 80.770 Cartoons
3. Contribution in Second Quarter = 13 – 1.50 = 11.50 per CartoonRevised Fixed Cost = 8,00,000 + 1,50,000 = ` 9,50,000 per QuarterThe Sales Quantity = 70,000 – 20% Increase = 84,000 cartoonsProfit before Taxes = Contribution – Fixed Cost
= (84,000 × 11.50) – 9,50,000= 9,66,000 – 9,50,000 – ` 16,000
The profit before tax is decreasing from ` 1,10,000 to ` 16,000 and hence the plan shouldnot be implemented.
(Determination of the Product to be Product to be Pushed)
Illustration 12: The following data are expected from the annual planning budget.
Particulars Product A Product B Product C Product D(` ) (` ) (`) (`)
Sales :5,000 units @ ` 2 each 10,000 – – –10,000 units @ ` 6 each – 60,000 80,000 1,50,00020,000 units @ ` 4 each – – – –
Cost:Fixed 1,000 13,500 12,000 26,500Variable 3,000 12,000 48,000 63,000
Total 4,000 25,500 60,000 89,500Net Profit 6,000 34,500 20,000 60,500
You are required to compute break-even points for each product and the company’s break-evenpoints assuming a constant. Sales mix quantity ratio of 1:2:4, based on the data given, what productshould be pushed and why? Also compute the company’s break-even points assuming a constant salesmix as follows:
Case I: Product A 10,000 units and product B 10,000, Product C 15,000 units.Case II: Product A 5,000 units and product B 15,000, Product C 10,000 units.Solution:
Contribution to Break-even Point
Particulars Product A Product B Product C Product DSales 10,000 60,000 80,000 1,50,000Less: Variable Cost 3,000 12,000 48,000 63,000Contribution 7,000 48,000 32,000 87,000Less: Fixed Cost 1,000 13,500 12,000 26,500Profit 6,000 34,500 20,000 60,500

Managerial Decision Making 93
P/V Ratio = C/S × 1007,000
×10048,000
×10032,000
×10087,000
×10010,000 60,000 80,000 1,50,000
BEP = FC/P/V Ratio 1,000/70% 13,500/80% 12,000/40% 26,500/58%= ` 1429 = ` 16875 = ` 30,000 = ` 45,000
Company should push up product as the P/V ratio is highest.Case I (Product A 10,000, Product B 10,000 and Product C 15,000 units)
Particulars A B C TotalSales 20,000 60,000 60,000 1,40,000Less: Variable Cost 6,000 12,000 36,000 54,000Contribution 14,000 48,000 24,000 86,000
Company’s P/V Ratio = C/S × 100 =000,40,1
000,86 × 100 = 61.43%
Company’s BEP Ratio =ratio P/V
FC × 100 =%43.61
500,26 × 100 = ` 43,139
Case II (Product A 5,000, Product B 15,000 and Product C 10,000 units)
A B C TotalSales 10,000 90,000 40,000 1,40,000Less: Variable Cost 3,000 18,000 24,000 45,000Contribution 7,000 72,000 16,000 95,000
Company’s P/V Ratio = C/S × 100 =000,40,1
000,95 × 100 = 67.86%
Company’s BEP Ratio =ratio P/V
FC =%86.67
500,26 = ` 39,050
(Determination of Profitable Sales Mix)Illustration 13: Following information has been made available from the cost records of the
company manufacturing spare parts:Direct Materials Per Unit
A ` 8B ` 6
Direct WagesA 4 hours at ` 2 per hourB 6 hours at ` 2 per hourVariable Overheads 150% of wagesFixed Overheads ` 750Selling Price of A ` 30Selling Price of B ` 35

Managerial Decision Making94
The directors want to be acquainted with the desirability of adopting any one of the followingalternative sales mixes in the budget for the next period:
(a) 250 units of A and 250 units of B(b) 400 units of B only.(c) 400 units of A and 350 units of B(d) 150 units of A and 350 units of BState which of the alternative sales mixes you should recommend to the management.Solution:
Statement of Contribution ( per unit)
Particulars A BSelling Price 30 35(–)Variable Expenses:Direct Material 8 6Direct Wages 8 12Variable Overheads 12 18Contribution 2 (1)
Particulars (a) (b) (c) (d)250 units of A
and 250 units if B400 units of B
only400 units of A and
350 units of B150 units of A and
350 units of B(` ) (`) (`) (`)
Contribution of A 500 - 800 300Contribution of B -250 -400 -100 -350Total Contribution 250 (400) 700 (50)Less: Fixed Overhead 750 750 750 750Profit/Loss (500) (1,150) (50) (800)
Conclusion: Alternative (C) with 400 units of A and 100 units of B is recommended to themanagement, as the loss is minimum.
(Statement Showing Profits)
Illustration 14: Company makes and sells three products normally X, Y and Z. The unit cost andselling prices are as given below:
Particulars X (`) Y (`) Z (`)Direct Material 30.00 60.00 80.00Direct Labour 40.00 40.00 100.00Variable Overheads 30.00 150.00 70.00Selling Price 180.00 250.00 480.00
The fixed costs are ` 2,70,000

Managerial Decision Making 95
In the month of March and April, number of units sold were as under:
Month x units y units z unitsMarch 1,000 1,000 1,000April 2,000 1,300 500
You are required to prepare the statement showing the sales and profits for the month of March andApril and explain why the profits have fallen down in the month of April inspite of increased sales.
Solution:
Statement for Sale and Profit for March
Units Sold X Y Z Total1,000 (`) 1,000 (`) 1,000 (`) (`)
Sales 1,80,000 2,50,000 4,80,000 9,10,000Less: Direct Material 30,000 60,000 80,000 1,70,000Less: Direct Labour 40,000 40,000 1,00,000 1,80,000Less: Variable Overheads 30,000 1,50,000 70,000 2,50,000Contribution 80,000 Nil 2,30,000 3,10,000Less: Fixed Cost 2,70,000Profit 40,000
Units Sold X Y Z Total2,000 (`) 1,350 (`) 500 (`) (`)
Sales 3,60,000 3,25,000 2,40,000 9,25,000Less: Direct Material 60,000 78,000 40,000 1,78,000Less: Direct Labour 80,000 52,000 50,000 1,82,000Less: Variable Overheads 60,000 1,95,000 35,000 2,90,000Contribution 1,60,000 Nil 1,15,000 2,75,000Less: Fixed Cost 2,70,000Profit 5,000
Conclusion: The profits have decreased from ` 40,000 in March to ` 5,000 in April. Thecontribution is highest for Product Z (i.e. ` 230 p.u.). However, in April month sales of Product Zhave decreased by 50% and therefore, the profits have also decreased. The contribution in ` 80 p.u. forProduct X and ` Nill p.u. for Product Y.
Illustration 15: The cost sheet of product as follows:
Particulars Per unit (`)Direct Materials 10.00Direct Wages 05.00Factory Overheads:
Fixed 01.00Variable 02.00
Administrative Expenses 1.5Selling and Distribution Expenses:

Managerial Decision Making96
Fixed 00.50Variable 01.00
Cost of Sales 21.00
The selling price per unit is ` 25.00. The above cost information is for an output of 50,000 unitswhereas the capacity of firm is 60,000 units. A foreign customer is desirous of buying 10,000 units ata price of 19.00 ` per unit. The extra cost of exporting the product is ` 0.50 per unit. You are requiredto advice the manufacturer whether the order should be accepted.
Evaluation of Export Offer
Particulars 50,000 Units 60,000 UnitsAmount Per Unit Amount Per Unit
` ` ` `
Sales (50,000 * 25) 12,50,000 . 12,50,000(10,000 * 19) – 1,90,000
Total Sales (A) 12,50,000 25 14,40,000 24Variable Costs:
Direct Materials 5,00,000 10 6,00,000 10Direct Wages 2,50,000 5 3,00,000 5Cost of Export – – 5000 0.08Factory Overhead 1,00,000 2 1,20,000 2Selling and Distribution 50,000 1 60,000 1
Total Variable Cost (B) 9,00,000 18 10,85,000 18.08Contribution (C) = (A) – (B) 3,50,000 7 3,55,000 5.92Fixed Assets:
Factory Overhead 50,000 1 50,000 0.83Administration Overhead 75,000 1.5 75,000 1.25Selling and Distribution 25,000 0.5 25,000 0.42
Total Fixed Costs (D) 1,50,000 3 1,50,000 2.5Profit = (C) – (D) 2,00,000 4 2,05,000 3.42
Conclusion: If the foreign order is accepted, profits of the manufacturer increases from ` 2,00,000 to` 2,05,000 Profits increases by ` 5,000 and therefore, foreign order should be accepted by themanufacturer.
Illustration 16: A manufacturer of packing cases makes three main types of — Deluxe, Luxuryand Economy, overheads are incurred on the basis of labour hours. Wages are paid at ` 1.00 per hour.Estimates for the cases show the following:
Particulars Deluxe (`) Luxury (`) Economy (`)Materials 10 8 3Wages 6 3 2Overheads 12 6 4

Managerial Decision Making 97
28 17 9Net Profit/Loss 2 3 3Average Selling Price 26 20 12Average Sales (Units) 10,000 20,000 5,000
The manufacturer felt that he would be well advised to discontinue producing the deluxe andeconomy cases even though it would mean that some of production facilities would remain unused. Hecannot increase the sales of luxury cases. It has been ascertained that 60% of the overheads is fixed.You are required to advise the manufacturer.
Solution:
Statement of Cost and Contribution of Various Products
Particulars Deluxe (`) Luxury (`) Economy (`)Material 10 8 3Wages 6 3 2
Variable Overheads 40% 4.8 2.4 1.6
Total Variable Cost 20.8 13.4 6.6
Selling Price 26 20 12
Contribution 5.2 6.6 5.4Less: Fixed Cost (60%) 7.2 3.6 2.4
Net Profit/Loss (2) 3 3P/V Ratio = C × 100/SP 5.2 × 100/26 = 20% 6.6 × 100/20 = 33% 5.4 × 100/12 = 45%
Conclusion: The above statement clearly explains that product Deluxe is incurring loss and alsoits P/V ratio is less as compared to other two products. Hence, it is recommended that themanufacturer should discontinue the product ‘Deluxe’ and increase the production of products‘Luxury’ and ‘Economy’.(Dropping of a Product)
Illustration 17: A manufacturing company makes two products – Luxury and Deluxe. Theresults for 2009 were as under.
Particulars Luxury (`) Deluxe (`)Sales 2,00,000 1,60,000Variable cost 1,20,000 1,32,000Fixed Cost 40,000 32,000Profit/Loss 40,000 (–) 4,000
The managing director has suggested that Deluxe should be dropped as it is making loss. It isestimated that ` 8,000 will be saved in fixed overheads as his suggestion is implemented. ShouldDeluxe be dropped, if:
1. His decision has no effect on sales of luxury;2. By using the vacant factory space, sales of luxury could be increased by ` 1,00,000, the
extra production would lead to increase in the total fixed cost to ` 76,000.
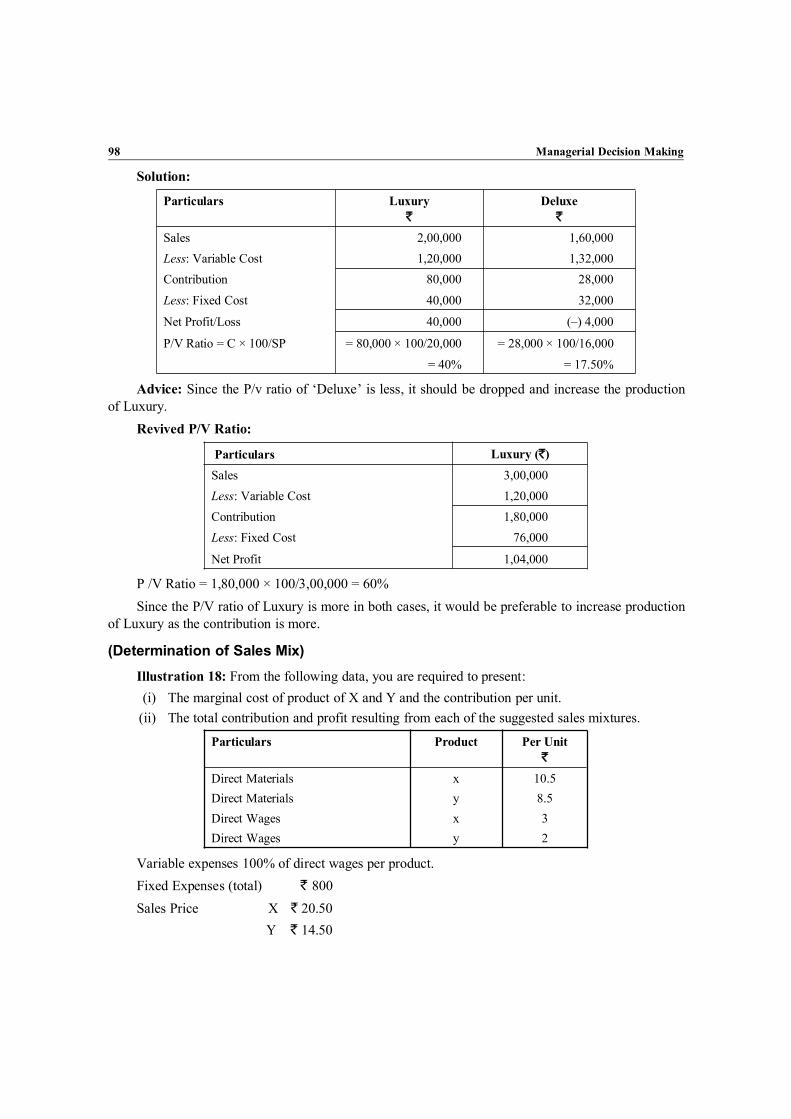
Managerial Decision Making98
Solution:
Particulars Luxury`
Deluxe`
Sales 2,00,000 1,60,000Less: Variable Cost 1,20,000 1,32,000Contribution 80,000 28,000
Less: Fixed Cost 40,000 32,000
Net Profit/Loss 40,000 (–) 4,000
P/V Ratio = C × 100/SP = 80,000 × 100/20,000 = 28,000 × 100/16,000
= 40% = 17.50%
Advice: Since the P/v ratio of ‘Deluxe’ is less, it should be dropped and increase the productionof Luxury.
Revived P/V Ratio:
Particulars Luxury (`)Sales 3,00,000Less: Variable Cost 1,20,000Contribution 1,80,000Less: Fixed Cost 76,000
Net Profit 1,04,000
P /V Ratio = 1,80,000 × 100/3,00,000 = 60%Since the P/V ratio of Luxury is more in both cases, it would be preferable to increase production
of Luxury as the contribution is more.
(Determination of Sales Mix)Illustration 18: From the following data, you are required to present:(i) The marginal cost of product of X and Y and the contribution per unit.
(ii) The total contribution and profit resulting from each of the suggested sales mixtures.
Particulars Product Per Unit`
Direct Materials x 10.5Direct Materials y 8.5Direct Wages x 3Direct Wages y 2
Variable expenses 100% of direct wages per product.Fixed Expenses (total) ` 800Sales Price X ` 20.50
Y ` 14.50

Managerial Decision Making 99
Suggested Sales Mixes
Alternatives No. ofX
ResultsY
A 100 200B 150 150
C 200 100
Solution:
Evaluation of Sales Mix
Particulars Product X`
Product Y`
Direct Materials 10.5 8.5Direct Wages 3 2Variable Expenses (100% of Direct wages) 3 2
Marginal Cost per unit 16.5 12.5Selling Price per unit 20.5 14.5Less: Marginal Cost 16.5 12.5
Contribution per unit 4 2
Sales Mix A
Particulars `
Contribution from 100 units of Product X at ` 4 400Contribution from 200 units of Product Y at ` 2 400
Total Contribution 800
Less: Fixed Expenses 800
Profit (`) Nil
Sales Mix B
Particulars `
Contribution from 150 products X at ` 4 600Contribution from 150 Products Y at ` 2 300
Total Contribution 900Less: Fixed Expenses 800
Profit 100
Sales Mix C
Particulars `
Contribution from 200 products X at ` 4 800Contribution from 100 products Y at ` 2 200

Managerial Decision Making100
Total Contribution 1,000
Less: Fixed Expenses 800
Profit 200
Advice: Mix C should be adopted because it gives maximum contribution and profit.
(Determination of Profitable Sales Mix)Illustration 19: The following information in respect of product X and Y of ABC Co. Ltd is
obtained.
Particulars Products
X Y
Sale Price 1000 640Direct Material 400 400Direct Labour Hours (@ ` 5 per hour) 20 hours 40 hoursVariable Overheads 100% of Direct
Wages100% of Direct
Wages
Fixed Overheads are ` 30,000.You are required to:(a) Calculate and present the marginal product costs and contribution per unit(b) State which of the following alternative mixes you would recommend? Why?(c) 100 units of Product X and 50 units of Product Y(d) 50 units of Product X and 100 units of Product Y(e) 150 units of Product X only(f) 150 units of Product Y only
Solution:Marginal Cost Statement
Particulars Products
X Y
Sales Price (A) 1000 640
Variable Cost:Direct Material 400 400Direct Labour at ` % per hour 100 200
Variable Overhead (100% of Wages) 100 200
Marginal Cost (B) 600 800
Marginal Contribution per Unit = (A) – (B) 400 160
Case 1: 100 Units of Product X and 50 of Product Y 40,000Contribution from 100 Units of x = 100 × 400
Cont. from 50 Units of Y = 50 × 160 8,000

Managerial Decision Making 101
Total Contribution 32,000
Less: Fixed Cost 30,000
Profit 2,000
Case 2: 50 Units of Product X and 100 of Product Y50 Units of X = 50 × 400 20,000100 Units of Y = 100 × 160 16,000Total Contribution 36,000
Less: Fixed Cost 30,000
Profit 6,000
Case 3: 150 Units of Product X only150 Units × 400 60,000Less: Fixed Cost 30,000
Profit 30,000
Case 4: 150 Units of Product Y onlyContribution = 150 Units × 160 24000
Less: Fixed Cost 30000
Loss 6000
Hence, Case 3 is the most profitable case, i.e., 150 units of Product X only is suitable.
(Acceptance or Rejection of Export Offer)Illustration 20: The Jaya Snow Company manufactures and sells direct to consumers 5000 jars
of snow per month at ` 25 per jar. The company’s normal production capacity is 10000 jars per month.An analysis of cost for 5000 jars is given below:
Particulars `
Direct Material 20,000Direct Labour 49,500Power 2,800Other Expenses 8,600Cost of Jars 12,000
Fixed Expenses 1,59,100
2,52,000
The company has received an offer for the export under a differential brand name of 60,000 jarsof snow at 5,000 jars per month at ` 15 a year. Write a short report on the advisability or otherwise ofaccepting the offer.

Managerial Decision Making102
Solution:
Marginal Contribution Analysis of the Present and Proposed Position
Particulars Per Unit PresentPositionCapacity
ProposedOffer
Capacity
Total Capacity
50% 50% 100%
Sales (Units) 5,000 5,000 10,000` ` ` ` (@ ` 15 per jar)
Sales (Value) 25 1,25,000 75,000 2,00,000Less: Direct Materials 4 20,000 20,000Direct Labour 9.9 49,500 49,500Power 0.56 2,800 2,800Other Expenses 1.72 8,600 8,600
Cost of Sales 2.4 12,000 12,000
Variable Cost 18.58 92,900 92,900 1,85,800
Marginal Contribution 6.42 32,100 (–)17,900 14,200
Fixed Cost 1,59,100
Loss 1,44,900
The proposed offer at lower price will decrease the contribution to the extent of ` 17,900. Theproposal should not be accepted since there is decrease in the total contribution. The following furtherpoints should be kept in view:
(i) The extent of additional export costs to be incurred.(ii) Consideration of opportunity cost whether the additional capacity could be utilised for
production of other more profitable products(iii) Whether there is any risk of dumping, i.e., re-export by the foreign customer so that the
company will be faced with completion with itself.(iv) Long-term effect of the reduced export price on the home market.
(Determination of Profitable Sale Mix)
Illustration 21: From the following information, you are required to:(a) Calculate and present the marginal product costs and contribution per unit(b) State which of the alternative sales mixes you would recommend to management? Why?
Particulars Per Unit (`)
Selling Price:For X 250For Y 200
Direct Materials:For X 80

Managerial Decision Making 103
For Y 60Direct Wages:
For X 60
For Y 40
Fixed overheads are 75,000 and variable overheads are 150% of direct wages. Alternative SalesMix:
1. 2500 units of Product X and 2500 units of Product Y.2. Nil units of Product X and 4000 units of Product Y.3. 4000 units of Product X and 1000 units of Product Y.
Solution:
Statement Showing Marginal Cost and Contribution per unit
Particulars Product X Product Y
` ` ` `
Selling Price 250 200Less: Marginal CostDirect Materials 80 60Direct Wages 60 40
Variable Overheads 90 230 60 160
Contribution 20 40
Statement Showing Profitability of Alternative Sales Mix
Particulars X Y Total X Y Total X Y Total
Sales Mix(units)
2,500 2,500 5,000 Nil 4,000 4,000 4,000 1,000 5,000
Contribution 50,000 1,00,000 1,50,000 1,60,000 1,60,000 80,000 40,000 1,20,000
Less: FixedOverheads
75,000 75,000 75,000
Profit 75,000 85,000 45,000
4,000 units of y should be sold as it gives higher profit.
Exercise1. A company manufactures and sells two products and presents the following cost structure
and selling:Particulars Product M Product NDirect Materials Per UnitDirect Labour Hour Per UnitDirect Labour Hour RateVariable Factory OverheadSelling Price Per Unit
` 2510 hours` 2 per hour100 of Direct Labour` 75
` 3012 hours` 2 per hour100 of Direct Labour` 90
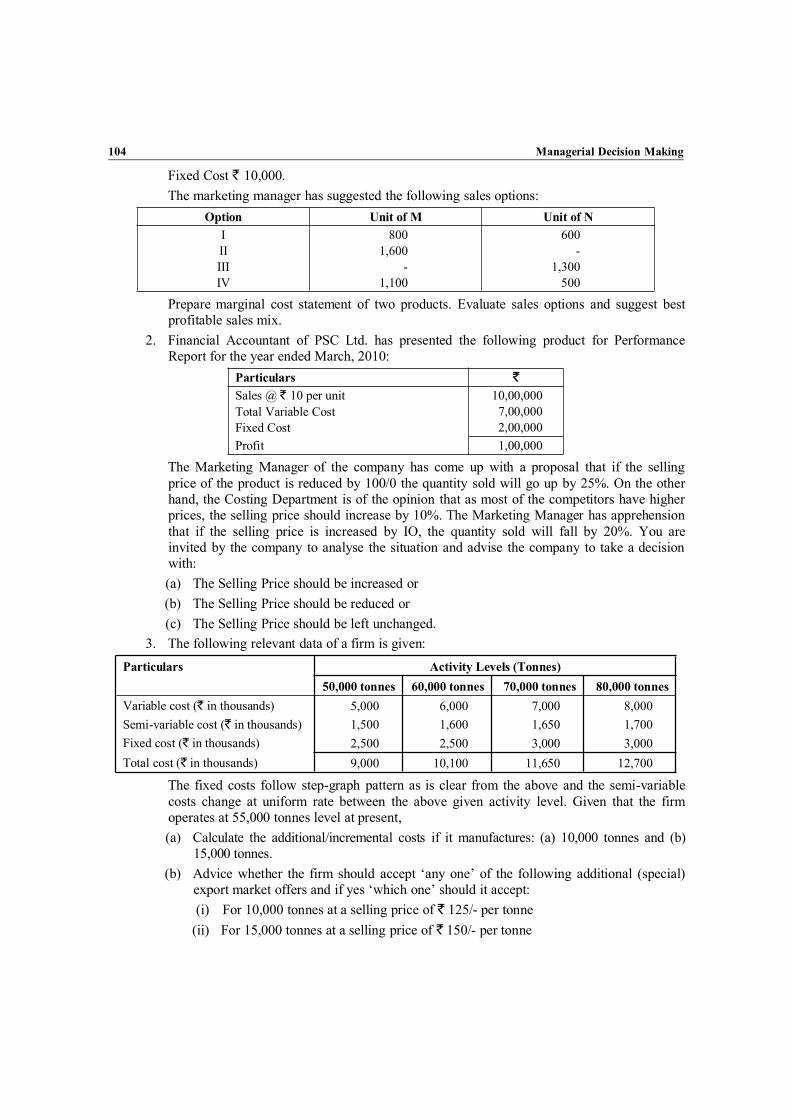
Managerial Decision Making104
Fixed Cost ` 10,000.The marketing manager has suggested the following sales options:
Option Unit of M Unit of NIIIIIIIV
8001,600
-1,100
600-
1,300500
Prepare marginal cost statement of two products. Evaluate sales options and suggest bestprofitable sales mix.
2. Financial Accountant of PSC Ltd. has presented the following product for PerformanceReport for the year ended March, 2010:
Particulars `Sales @ ` 10 per unitTotal Variable CostFixed Cost
10,00,0007,00,0002,00,000
Profit 1,00,000
The Marketing Manager of the company has come up with a proposal that if the sellingprice of the product is reduced by 100/0 the quantity sold will go up by 25%. On the otherhand, the Costing Department is of the opinion that as most of the competitors have higherprices, the selling price should increase by 10%. The Marketing Manager has apprehensionthat if the selling price is increased by IO, the quantity sold will fall by 20%. You areinvited by the company to analyse the situation and advise the company to take a decisionwith:(a) The Selling Price should be increased or(b) The Selling Price should be reduced or(c) The Selling Price should be left unchanged.
3. The following relevant data of a firm is given:Particulars Activity Levels (Tonnes)
50,000 tonnes 60,000 tonnes 70,000 tonnes 80,000 tonnesVariable cost (` in thousands) 5,000 6,000 7,000 8,000Semi-variable cost (` in thousands) 1,500 1,600 1,650 1,700Fixed cost (` in thousands) 2,500 2,500 3,000 3,000Total cost (` in thousands) 9,000 10,100 11,650 12,700
The fixed costs follow step-graph pattern as is clear from the above and the semi-variablecosts change at uniform rate between the above given activity level. Given that the firmoperates at 55,000 tonnes level at present,(a) Calculate the additional/incremental costs if it manufactures: (a) 10,000 tonnes and (b)
15,000 tonnes.(b) Advice whether the firm should accept ‘any one’ of the following additional (special)
export market offers and if yes ‘which one’ should it accept:(i) For 10,000 tonnes at a selling price of ` 125/- per tonne
(ii) For 15,000 tonnes at a selling price of ` 150/- per tonne

Managerial Decision Making 105
4. Diversity & Co. manufactures five different products Alpha, Beeta, Gama, Theeta andDelta from the same raw material which is in short supply, viz., available only to the extent5,000 kgs. The following relevant data is available to you:
Particulars Alpha Beeta Gama Theeta DeltaMaximum Sales (units) 1,500 2,500 1,600 2,000 2,200Production per unit 2,000 3,000 1,500 2,000 2,000Selling Price per unit (`) 4 3.5 1.5 1 3Marginal Cost per unit (`) 3 2 1.25 0.75 2.5Raw Material (kgs) per unit 2 8 3 5 2
You are required to:(a) Determine the most profitable production mix:(b) Given the mix derived in (a) above is being produced, determine which of the
following two alternative proposals should the enterprise accept in order to increase itsprofit:(i) Improve quality and sell at the same price to sell an additional quality of 500 units,
the quality improvement costs increasing the marginal costs by ` 0.15 per unit;(ii) Reduce the selling price by ` 0.05 per unit to sell an additional quantity of 400
units.5. Following data relates to a company which manufactures a single product:
Product Cost:Variable ` 2/- per unitFixed cost ` 80,000
Assets:Working Capital ` 1,00,000/-Fixed Cost ` 2,00,000/-
` 3,00,000/-
The desired rate on the return of the capital employed by the company is 30% and theDivisional Manager has fixed the selling price of the product at ` 2.50 per unit.(i) Calculate the number of the units which the division should produce and sell to achieve
the target return.(ii) The product is also unable as a raw material in another division of the same enterprise.
It is supposed that out of the total units manufactured as per item (i) above 60,000 unitsbe transferred to the other division. The transfer price under discussion. The transfer isinsisting that the price be fixed at ` 2.30 per unit which is the price which it can beprocured from the market. The transferee divisional manager states that if no transfer ismade and production is curtailed accordingly, there will be reduction in the workingcapital, Fixed assets and fixed costs to the extent of ` 10,000/- each. You are requiredto give your comments regarding the proposed transfer price of ` 2.30 per unit.
(iii) Suppose that it is agreed that the transfer to the other division be made at price of ` 2.30 perunits, at what price should it transfer or sell the remaining units so as to maintain thedesired return of 30%? Alternatively, how many more units it should produce assumingthat this will not make any change in the fixed cost, the asset cost or the selling price.
6. Modern Chair Manufacturing Company received an offer to sell 25000 outdoor patro chairsto Easy Lift Corporation. Modern Chair Manufacturing Company produces 400000 chairs
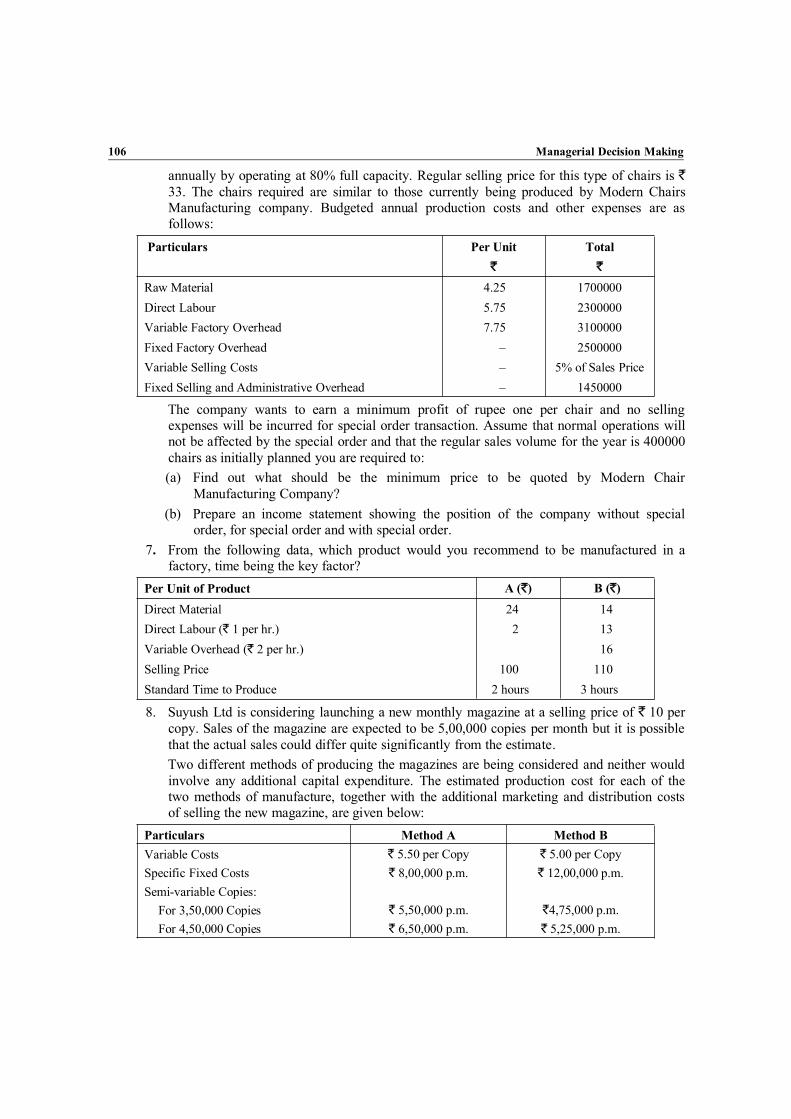
Managerial Decision Making106
annually by operating at 80% full capacity. Regular selling price for this type of chairs is `33. The chairs required are similar to those currently being produced by Modern ChairsManufacturing company. Budgeted annual production costs and other expenses are asfollows:
Particulars Per Unit Total` `
Raw Material 4.25 1700000Direct Labour 5.75 2300000Variable Factory Overhead 7.75 3100000Fixed Factory Overhead – 2500000Variable Selling Costs – 5% of Sales PriceFixed Selling and Administrative Overhead – 1450000
The company wants to earn a minimum profit of rupee one per chair and no sellingexpenses will be incurred for special order transaction. Assume that normal operations willnot be affected by the special order and that the regular sales volume for the year is 400000chairs as initially planned you are required to:(a) Find out what should be the minimum price to be quoted by Modern Chair
Manufacturing Company?(b) Prepare an income statement showing the position of the company without special
order, for special order and with special order.7. From the following data, which product would you recommend to be manufactured in a
factory, time being the key factor?Per Unit of Product A (`) B (`)Direct Material 24 14Direct Labour (` 1 per hr.) 2 13Variable Overhead (` 2 per hr.) 16Selling Price 100 110Standard Time to Produce 2 hours 3 hours
8. Suyush Ltd is considering launching a new monthly magazine at a selling price of ` 10 percopy. Sales of the magazine are expected to be 5,00,000 copies per month but it is possiblethat the actual sales could differ quite significantly from the estimate.Two different methods of producing the magazines are being considered and neither wouldinvolve any additional capital expenditure. The estimated production cost for each of thetwo methods of manufacture, together with the additional marketing and distribution costsof selling the new magazine, are given below:
Particulars Method A Method BVariable Costs ` 5.50 per Copy ` 5.00 per CopySpecific Fixed Costs ` 8,00,000 p.m. ` 12,00,000 p.m.Semi-variable Copies:
For 3,50,000 Copies ` 5,50,000 p.m. `4,75,000 p.m.For 4,50,000 Copies ` 6,50,000 p.m. ` 5,25,000 p.m.
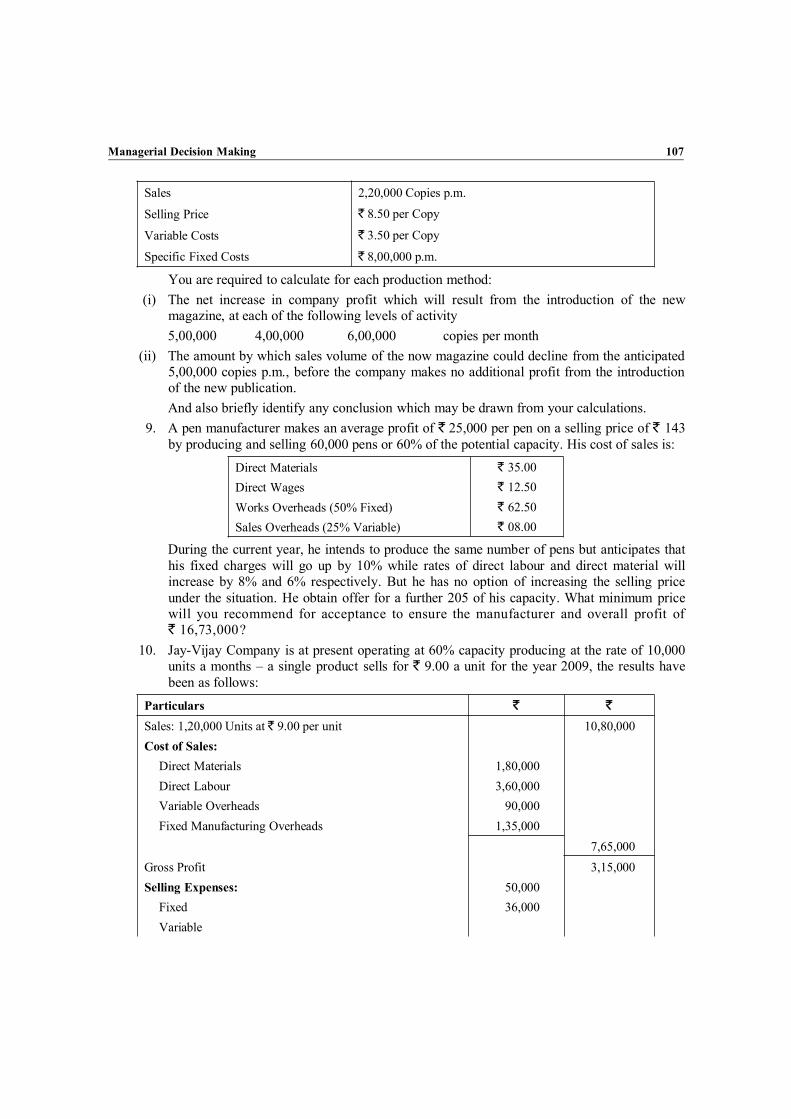
Managerial Decision Making 107
Sales 2,20,000 Copies p.m.
Selling Price ` 8.50 per Copy
Variable Costs ` 3.50 per Copy
Specific Fixed Costs ` 8,00,000 p.m.
You are required to calculate for each production method:(i) The net increase in company profit which will result from the introduction of the new
magazine, at each of the following levels of activity5,00,000 4,00,000 6,00,000 copies per month
(ii) The amount by which sales volume of the now magazine could decline from the anticipated5,00,000 copies p.m., before the company makes no additional profit from the introductionof the new publication.And also briefly identify any conclusion which may be drawn from your calculations.
9. A pen manufacturer makes an average profit of ` 25,000 per pen on a selling price of ` 143by producing and selling 60,000 pens or 60% of the potential capacity. His cost of sales is:
Direct Materials ` 35.00Direct Wages ` 12.50Works Overheads (50% Fixed) ` 62.50Sales Overheads (25% Variable) ` 08.00
During the current year, he intends to produce the same number of pens but anticipates thathis fixed charges will go up by 10% while rates of direct labour and direct material willincrease by 8% and 6% respectively. But he has no option of increasing the selling priceunder the situation. He obtain offer for a further 205 of his capacity. What minimum pricewill you recommend for acceptance to ensure the manufacturer and overall profit of` 16,73,000?
10. Jay-Vijay Company is at present operating at 60% capacity producing at the rate of 10,000units a months – a single product sells for ` 9.00 a unit for the year 2009, the results havebeen as follows:
Particulars ` `
Sales: 1,20,000 Units at ` 9.00 per unit 10,80,000Cost of Sales:
Direct Materials 1,80,000Direct Labour 3,60,000Variable Overheads 90,000Fixed Manufacturing Overheads 1,35,000
7,65,000Gross Profit 3,15,000Selling Expenses: 50,000
Fixed 36,000Variable

Managerial Decision Making108
Administrative Expenses:Fixed 22,000
1,08,000Profits 2,07,000
Although the company is operating relatively at the high net profit at a plant capacity of60%, it is a fact that the price per unit could be reduced by 20%, the value of sales wouldincrease to 1,80,000 units per year with an increase in the fixed manufacturing overheads of` 9,000 per year. If sales price could be reduced by 33%, the volume of sales could increaseto full capacity (20,00,000) units with increase in expenses at 60% levels as follows:(a) Fixed manufacturing overheads – ` 11,000(b) Fixed selling expenses – ` 2000(c) Fixed administration expenses – ` 6,000You are required to:(i) Prepare a comparative statement showing net income under the three alternative profit
volume relationships and(ii) Compute the break-even sales point in each.
Objective QuestionsI. Fill in the Blanks
1. Relevant Costs are costs which would _________as a result of the decision.2. ___________ are historical cost that cannot be recovered in a given situation.3. Opportunity costs are _________________for not pursuing the alternative course.4. ____________ is also known as discretionary cost.5. Budgets are not actual but ______.6. After setting up objectives in terms of plans, it becomes imperative to organise the factors
of production to convert into a ____________and ______________.7. _______signifies such systematic efforts which help the management to know whether
actual performance is in line with predetermined goal, policy and plans.8. Internal refinement, broad indexation of activities and concentrated details is the essential
features in _______.[Ans.: 1. Change, 2. Sunk cost, 3. Monetary benefits foregone, 4. Avoidable cost, 5. Estimates,
6. Reality and workable preposition, 7. Control 8. Planning.]
____

Chapter
4
IntroductionYou know that management accounting is managing a business through accounting information.
In this process, management accounting is facilitating managerial control. It can also be applied toyour own daily/monthly expenses, if necessary. These measures should be applied correctly so thatperformance takes place according to plans. Planning is the first tool for making the control effective.The vital aspect of managerial control is cost control. Hence, it is very important to plan and controlcosts. Standard costing is a technique which helps you to control costs and business operations. It aimsat eliminating wastes and increasing efficiency in performance through setting up standards orformulating cost plans.
Meaning of StandardWhen you want to measure something, you must take some parameter or yardstick for measuring.
We can call this as standard. What are your daily expenses? An average of `50! If you have beenspending this much for so many days, then this is your daily standard expense.
The word standard means a benchmark or yardstick. The standard cost is a predetermined costwhich determines in advance what each product or service should cost under given circumstances.
In the words of Backer and Jacobsen, “Standard cost is the amount the firm thinks a product orthe operation of the process for a period of time should cost, based upon certain assumed conditions ofefficiency, economic conditions and other factors.”
DefinitionThe CIMA, London has defined standard cost as “a predetermined cost which is calculated from
management standards of efficient operations and the relevant necessary expenditure.” They are thepredetermined costs on technical estimate of material labour and overheads for a selected period oftime and for a prescribed set of working conditions. In other words, a standard cost is a planned costfor a unit of product or service rendered.
The technique of using standard costs for the purpose of cost control is known as standardcosting. It is a system of cost accounting which is designed to find out how much should be the cost ofa product under the existing conditions. The actual cost can be ascertained only when production isundertaken. The predetermined cost is compared to the actual cost and a variance between the twoenables the management to take necessary corrective measures.
STANDARD COSTINGAND
VARIANCE ANALYSIS

Standard Costing and Variance Analysis110
AdvantagesStandard costing is a management control technique for every activity. It is not only useful for
cost control purposes but is also helpful in production planning and policy formulation. It allowsmanagement by exception. In the light of various objectives of this system, some of the advantages ofthis tool are given below:
1. Efficiency measurement: The comparison of actual costs with standard costs enables themanagement to evaluate performance of various cost centres. In the absence of standardcosting system, actual costs of different period may be compared to measure efficiency. It isnot proper to compare costs of different period because circumstance of both the periodsmay be different. Still, a decision about base period can be made with which actualperformance can be compared.
2. Finding of variance: The performance variances are determined by comparing actual costswith standard costs. Management is able to spot out the place of inefficiencies. It can fixresponsibility for deviation in performance. It is possible to take corrective measures at theearliest. A regular check on various expenditures is also ensured by standard cost system.
3. Management by exception: The targets of different individuals are fixed if theperformance is according to predetermined standards. In this case, there is nothing to worry.The attention of the management is drawn only when actual performance is less than thebudgeted performance. Management by exception means that everybody is given a target tobe achieved and management need not supervise each and everything. The responsibilitiesare fixed and everybody tries to achieve his/her targets.
4. Cost control: Every costing system aims at cost control and cost reduction. The standardsare being constantly analysed and an effort is made to improve efficiency. Whenever avariance occurs, the reasons are studied and immediate corrective measures are undertaken.The action taken in spotting weak points enables cost control system.
5. Right decisions: It enables and provides useful information to the management in takingimportant decisions. For example, the problem created by inflating, rising prices. It can alsobe used to provide incentive plans for employees, etc.
6. Eliminating inefficiencies: The setting of standards for different elements of cost requiresa detailed study of different aspects. The standards are set differently for manufacturing,administrative and selling expenses. Improved methods are used for setting these standards.The determination of manufacturing expenses will require time and motion study for labourand effective material control devices for materials. Similar studies will be needed forfinding other expenses. All these studies will make it possible to eliminate inefficiencies atdifferent steps.
Limitations of Standard Costing1. It cannot be used in those organisations where non-standard products are produced. If the
production is undertaken according to the customer specifications, then each job willinvolve different amount of expenditures.
2. The process of setting standard is a difficult task, as it requires technical skills. The timeand motion study is required to be undertaken for this purpose. These studies require a lotof time and money.

Standard Costing and Variance Analysis 111
3. There are no inset circumstances to be considered for fixing standards. The conditionsunder which standards are fixed do not remain static. With the change in circumstances, ifthe standards are not revised the same becomes impracticable.
4. The fixing of responsibility is not an easy task. The variances are to be classified intocontrollable and uncontrollable variances. Standard costing is applicable only forcontrollable variances.
For instance, if the industry changed the technology then the system will not be suitable. In thatcase, we will have to change or revise the standards. A frequent revision of standards will becomecostly.
Setting StandardsNormally, setting up standards is based on the past experience. The total standard cost includes
direct materials, direct labour and overheads. Normally, all these are fixed to some extent. Thestandards should be set up in a systematic way so that they are used as a tool for cost control.
Various elements which Influence the Setting of Standards
Setting Standards for Direct MaterialsThere are several basic principles which ought to be appreciated in setting standards for direct
materials. Generally, when you want to purchase some material what are the factors you consider. Ifmaterial is used for a product, it is known as direct material. On the other hand, if the material costcannot be assigned to the manufacturing of the product, it will be called indirect material. Therefore, itinvolves two things:
Quality of material Price of the material
When you want to purchase material, the quality and size should be determined. The standardquality to be maintained should be decided. The quantity is determined by the production department.This department makes use of historical records, and an allowance for changing conditions will also begiven for setting standards. A number of test runs may be undertaken on different days and underdifferent situations, and an average of these results should be used for setting material quantitystandards.
The second step in determining direct material cost will be a decision about the standard price.Material’s cost will be decided in consultation with the purchase department. The cost of purchasingand store keeping of materials should also be taken into consideration. The procedure for purchase ofmaterials, minimum and maximum levels for various materials, discount policy and means of transportare the other factors which have bearing on the materials cost price. It includes the following:
Cost of materials Ordering cost Carrying cost
The purpose should be to increase efficiency in procuring and storekeeping of materials. The typeof standard used – ideal standard or expected standard – also affects the choice of standard price.

Standard Costing and Variance Analysis112
Setting Direct Labour CostIf you want to engage a labour force for manufacturing a product or a service for which you need
to pay some amount, this is called wages. If the labour is engaged directly to produce the product, thisis known as direct labour. The second largest amount of cost is of labour. The benefit derived from theworkers can be assigned to a particular product or a process. If the wages paid to workers cannot bedirectly assigned to a particular product, these will be known as indirect wages. The time required forproducing a product would be ascertained and labour should be properly graded. Different grades ofworkers will be paid different rates of wages. The times spent by different grades of workers formanufacturing a product should also be studied for deciding upon direct labour cost. The setting ofstandard for direct labour will be done basically on the following:
Standard labour time for producing Labour rate per hour
Standard labour time indicates the time taken by different categories of labour force which are asunder:
Skilled labour Semi-skilled labour Unskilled labour
For setting a standard time for labour force, we normally take in to account previous experience,past performance records, test run result, work-study etc. The labour rate standard refers to theexpected wage rates to be paid for different categories of workers. Past wage rates and demand andsupply principle may not be a safe guide for determining standard labour rates. The anticipation ofexpected changes in labour rates will be an essential factor. In case there is an agreement with workersfor payment of wages in the coming period, these rates should be used. If a premium or bonus schemeis in operation, then anticipated extra payments should also be included. Where a piece rate system isused, standard cost will be fixed per piece. The object of fixed standard labour time and labour rate isto device maximum efficiency in the use of labour.
Setting Standards of OverheadsThe next important element comes under overheads. The very purpose of setting standard for
overheads is to minimise the total cost. Standard overhead rates are computed by dividing overheadexpenses by direct labour hours or units produced. The standard overhead cost is obtained bymultiplying standard overhead rate by the labour hours spent or number of units produced. Thedetermination of overhead rate involves three things:
Determination of overheads Determination of labour hours or units manufactured Calculating overheads rate by dividing A by B
The overheads are classified into fixed overheads, variable overheads and semi-variableoverheads. The fixed overheads remain the same irrespective of level of production, while variableoverheads change in the proportion of production. The expenses increase or decrease with the increaseor decrease in output. Semi-variable overheads are neither fixed nor variable. These overheadsincrease with the increase in production but the rate of increase will be less than the rate of increase in

Standard Costing and Variance Analysis 113
production. The division of overheads into fixed, variable and semi-variable categories will help indetermining overheads.
Determination of Standard CostsHow should the ideal standards for better controlling be determined?
1. Determination of Cost CentreAccording to J. Betty, “A cost centre is a department or part of a department or an item of
equipment or machinery or a person or a group of persons in respect of which costs are accumulated,and one where control can be exercised.” Cost centres are necessary for determining the costs. If thewhole factory is engaged in manufacturing a product, the factory will be a cost centre. In fact, a costcentrer describes the product while cost is accumulated. Cost centres enable the determination of costsand fixation of responsibility. A cost centre relating to a person is called personnel cost centre, and acost centre relating to products and equipment is called impersonal cost centre.
2. Current StandardsA current standard is a standard which is established for use over a short period of time and is
related to current condition. It reflects the performance that should be attained during the currentperiod. The period for current standard is normally one year. It is presumed that conditions ofproduction will remain unchanged. In case there is any change in price or manufacturing condition, thestandards are also revised. Current standard may be ideal standard and expected standard.
3. Ideal StandardThis is the standard which represents a high level of efficiency. Ideal standard is fixed on the
assumption that favourable conditions will prevail and management will be at its best. The price paidfor materials will be lowest and wastes etc., will be minimum possible. The labour time for making theproduction will be minimum and rates of wages will also be low. The overhead expenses are also setwith maximum efficiency in mind. All the conditions, both internal and external, should be favorableand only then ideal standard will be achieved.
Ideal standard is fixed on the assumption of those conditions which may rarely exist. Thisstandard is not practicable and may not be achieved. Though this standard may not be achieved, eventhen an effort is made. The deviation between targets and actual performance is ignorable. In practice,ideal standard has an adverse effect on the employees. They do not try to reach the standard becausethe standards are not considered realistic.
4. Basic Standards
A basic standard may be defined as a standard which is established for use for an indefiniteperiod which may be a long period. Basic standard is established for a long period and is not adjustedto the Present conditions. The same standard remains in force for a long period. These standards arerevised only on the changes in specification of material and technology productions. It is indeed justlike a number against which subsequent process changes can be measured. Basic standard enables themeasurement of changes in costs. For example, if the basic cost for material is ` 20 per unit and thecurrent price is ` 25 per unit, it will show an increase of 25% in the cost of materials. The changes inmanufacturing costs can be measured by taking basic standard, as a base standard cannot serve as a

Standard Costing and Variance Analysis114
tool for cost control purpose because the standard is not revised for a long time. The deviation betweenstandard cost and actual cost cannot be used as a yardstick for measuring efficiency.
5. Normal Standards
As per terminology, normal standard has been defined as a standard which, it is anticipated, canbe attained over a future period of time, preferably long enough to cover one trade cycle. This standardis based on the conditions which will cover a future period of five years, concerning one trade cycle. Ifa normal cycle of ups and downs in sales and production is 10 years, then standard will be set onaverage sales and production which will cover all the years. The standard attempts to cover variance inthe production from one time to another time. An average is taken from the periods of recession anddepression. The normal standard concept is theoretical and cannot be used for cost control purpose.Normal standard can be properly applied for absorption of overhead cost over a long period of time.
6. Organisation for Standard CostingThe success of standard costing system will depend upon the setting up of proper standards. For
the purpose of setting standards, a person or a committee should be given this job. In a big concern, astandard costing committee is formed for this purpose. The committee includes production manager,purchase manager, sales manager, personnel manager, chief engineer and cost accountant. The costaccountant acts as a co-coordinator of this committee.
7. Accounting System
Classification of accounts is necessary to meet the required purpose, i.e. function, asset orrevenue item. Codes can be used to have a speedy collection of accounts. A standard is a pre-determined measure of material, labour and overheads. It may be expressed in quality and its monetarymeasurements in standard costs.
Revision of StandardsFor effective use of this technique, sometimes we need to revise the standards which follow for
better control. Even standards are also subjected to change like the production method, environment,raw material, and technology.
Standards may need to be changed to accommodate changes in the organisation or itsenvironment. When there is a sudden change in economic circumstances, technology or productionmethods, the standard cost will no longer be accurate. Standards that are out of date will not act aseffective feed forward or feedback control tools. They will not help us to predict the inputs requirednor help us to evaluate the efficiency of a particular department. If standards are continually not beingachieved and large deviations or variances from the standard are reported, they should be carefullyreviewed. Also, changes in the physical productive capacity of the organisation or in material pricesand wage rates may indicate that standards need to be revised. In practice, changing standardsfrequently is an expensive operation and can cause confusion. For this reason, standard cost revisionsare usually made only once a year. At times of rapid price inflation, many managers have felt that thehigh level of inflation forced them to change price and wage rate standards continually. This, however,leads to reduction in value of the standard as a yardstick. At the other extreme is the adoption of basicstandard which will remain unchanged for many years. They provide a constant base for comparison,but this is hardly satisfactory when there is technological change in working procedures and conditions.

Standard Costing and Variance Analysis 115
SummaryBasically, standard costing is a management tool for control. In the process, we have taken
standards as parameters for measuring the performance. Cost analysis and cost control is essential forany activity. Cost includes material labour and overheads. Sometimes, we need to revise the standardsdue to change in uses, raw material, technology, method of production etc. For a proper organisation,it is required to implement this under a committee for the activity. It is a continued activity for theoptimum utilization of resources.
Variance AnalysisA variance is the difference between an actual result and an expected result. The process by
which the total difference between standard and actual results is analysed is known as varianceanalysis. When actual results are better than the expected results, we have a favourable variance (F). If,on the other hand, actual results are worse than expected results, we have an adverse (A).
I will use this example throughout this Exercise:Standard cost of Product A `
Materials (5 kgs × `10 per kg) 50Labour (4 hrs × `5 per hr) 20Variable o/hds (4 hrs × `2 per hr) 8Fixed o/hds (4 hrs × `6 per hr) 24
102Budgeted resultsProduction: 1,200 unitsSales: 1,000 unitsSelling price: ` 150 per unitACTUAL ResultsProduction: 1,000 unitsSales: 900 unitsMaterials: 4,850 kgs, ` 46,075Labour: 4,200 hrs, ` 21,210Variable o/hds: ` 9,450Fixed o/hds: ` 25,000Selling price: ` 140 per unit
1. Variable Cost Variances
Direct Material VariancesThe direct material total variance is the difference between what the output actually cost and
what it should have cost, in terms of material.

Standard Costing and Variance Analysis116
From the example above the material total variance is given by:1,000 units should have cost (× ` 50) 50,000But did cost 46,075Direct material total variance 3, 925 (F)It can be divided into two sub-variances
The Direct Material Price VarianceThis is the difference between what the actual quantity of material used did cost and what it
should have cost.`
4,850 kgs should have cost (× `10) 48,500But did cost 46,075Direct material price variance 2,425 (F)
The Direct Material Usage VarianceThis is the difference between how much material should have been used for the number of units
actually produced and how much material was used, valued at standard cost1,000 units should have used (× 5 kgs) 5,000 kgsBut did use 4,850 kgsVariance in kgs 150 kgs (F)Valued at standard cost per kg × `10Direct material usage variance in ` ` 1,500 (F)The direct material price variance is calculated on material purchases in the period if closing
stocks of raw materials are valued at standard cost or material used if closing stocks of rawmaterials are valued at actual cost (FIFO).
Direct Labour Total VarianceThe direct labour total variance is the difference between what the output should have cost and
what it did cost, in terms of labour.`
1,000 units should have cost (× ` 20) 20,000But did cost 21,210Direct material price variance 1,210 (A)
Direct Labour Rate VarianceThis is the difference between what the actual number of hours worked should have cost and
what it did cost.`
4,200 hrs should have cost (4,200 hrs × ` 5) 21,000But did cost 21,210Direct labour rate variance 210 (A)

Standard Costing and Variance Analysis 117
The Direct Labour Efficiency VarianceThis is the difference between how many hours should have been worked for the number of units
actually produced and how many hours were worked, valued at the standard rate per hour.`
1,000 units should have taken (x 4 hrs) 4,000 hrsBut did take 4,200 hrsVariance in hrs 200 hrsValued at standard rate per hour × ` 5Direct labour efficiency variance ` 1,000 (A)When idle time occurs the efficiency variance is based on hours actually worked (not hours
paid for) and an idle time variance (hours of idle time x standard rate per hour) is calculated.
2. Variable Production Overhead Total VariancesThe variable production overhead total variance is the difference between what the output should
have cost and what it did cost, in terms of variable production overhead.`
1,000 units should have cost (× `8) 8,000But did cost 9,450Variable production o/hd expenditure variance 1,450 (A)
The Variable Production Overhead Expenditure VarianceThis is the difference between what the variable production overhead did cost and what it should
have cost`
4,200 hrs should have cost (× ` 2) 8,400But did cost 9,450Variable production o/hd expenditure variance 1,050 (A)
The Variable Production Overhead Efficiency VarianceThis is the same as the direct labour efficiency variance in hours, valued at the variable
production overhead rate per hour.Labour efficiency variance in hours 200 hrs (A)Valued @ standard rate per hour × ` 2Variable production o/hd efficiency variance ` 400 (A)
3. Fixed Production Overhead Variances
The total fixed production variance is an attempt to explain the under or overabsorbed fixedproduction overhead.
Remember that overhead absorption rate =activity of level Budgeted
overhead production fixed Budgeted

Standard Costing and Variance Analysis118
If either the numerator or the denominator or both are incorrect then we will have under or over-absorbed production overhead.
If actual expenditure ± budgeted expenditure (numerator incorrect) » expenditure variance If actual production/hours of activity » budgeted production/hours of activity (denominator
incorrect) » volume variance. The workforce may have been working at a more or less efficient rate than standard to
produce a given output » volume efficiency variance (similar to the variable productionoverhead efficiency variance).
Regardless of the level of efficiency, the total number of hours worked could have beenmore or less than was originally budgeted (employees may have worked a lot of overtimeor there may have been a strike and so actual hours worked were less than budgeted) »volume capacity variance.
4. The Fixed Production Overhead Variances are Calculated as Follows:
Fixed production overhead varianceThis is the difference between fixed production overhead incurred and fixed production overhead
absorbed (= the under or overabsorbed fixed production overhead):`
Overhead incurred 25,000Overhead absorbed (1,000 units × `24) 24,000Overhead variance 1,000 (A)
Fixed Production Overhead Expenditure VarianceThis is the difference between the budgeted fixed production overhead expenditure and actual
fixed production overhead expenditure`
Budgeted overhead (1,200 × `24) 28,800Actual overhead 25,000Expenditure variance 3,800 (F)
Fixed Production Overhead Volume VarianceThis is the difference between actual and budgeted production volume multiplied by the standard
absorption rate per unit.`
Actual production at std. rate (1,000 × ` 24) 24,000Budgeted production at std. rate (1,200 × ` 24) 28,800
4,800 (A)

Standard Costing and Variance Analysis 119
Fixed Production Overhead Volume Efficiency VarianceThis is the difference between the number of hours that actual production should have taken, and
the number of hours actually worked (usually the labour efficiency variance), multiplied by thestandard absorption rate per hour.
Labour efficiency variance in hours 200 hrs (A)Valued @ standard rate per hour × ` 6Volume efficiency variance ` 1,200 (A)
Fixed Production Overhead Volume Capacity VarianceThis is the difference between budgeted hours of work and the actual hours worked, multiplied
by the standard absorption rate per hourBudgeted hours (1,200 x 4) 4,800 hrsActual hours 4,200 hrsVariance in hrs 600 hrs (A)x standard rate per hour × ` 6
` 3,600 (A)
KEYThe fixed overhead volume capacity variance is unlike the other variances in that an excess of actualhours over budgeted hours results in a favourable variance and not an adverse variance as it does whenconsidering labour efficiency, variable overhead efficiency and fixed overhead volume efficiency.Working more hours than budgeted produces an overabsorption of fixed overheads, which is a favourablevariance.
Sales Variances5. Selling Price Variance
The selling price variance is a measure of the effect on expected profit of a different selling priceto standard selling price. It is calculated as the difference between what the sales revenue should havebeen for the actual quantity sold, and what it was.
`
Revenue from 900 units should have been (× `150) 135,000But was (x `140) 126,000Selling price variance 9,000 (A)
Sales Volume VarianceThe sales volume variance is the difference between the actual units sold and the budgeted
quantity, valued at the standard profit per unit. In other words it measures the increase or decrease instandard profit as a result of the sales volume being higher or lower than budgeted.
Budgeted sales volume 1,000 unitsActual sales volume 900 units

Standard Costing and Variance Analysis120
Variance in units 100 units (A)x standard margin per unit (x ` (150 – 102) ) × ` 48Sales volume variance ` 4,800 (A)
KEYDon’t forget to value the sales volume variance at standard contribution marginal costing is in use.
Operating StatementThe most common presentation of the reconciliation between budgeted and actual profit is as
follows.` `
Budgeted profit before sales and admin costs XSales variances – price X
– volume X XActual sales minus standard cost of sales XCost variances ` `
(F) (A)Material price XMaterial usage etc. X X
X XSales and administration costs XActual profit XVariances in a Standard Marginal Costing System No fixed overhead volume variance Sales volume variances are valued at standard contribution margin (not standard profit
margin)
Reasons, Interdependence and Significance6. Reasons for Variances
Material Price(F) unforseen discounts received, greater care taken in purchasing, change in material standard.(A) price increase, careless purchasing, change in material standard.
Material Usage(F) material used of higher quality than standard, more effective use made of material.(A) defective material, excessive waste, theft, stricter quality control.

Standard Costing and Variance Analysis 121
Labour Rate(F) use of workers at rate of pay lower than standard.(A) wage rate increase.
Idle TimeMachine breakdown, non-availability of material, illness.
Labour Efficiency(F) output produced more quickly than expected because of work motivation, better quality of
equipment or materials.(A) lost time in excess of standard allowed, output lower than standard set because of deliberate
restriction, lack of training, substandard material used.
Overhead Expenditure(F) savings in cost incurred, more economical use of services.(A) increase in cost of services used, excessive use of services, change in type of services used
Overhead Volume(F) production greater than budgeted(A) production less than budgeted
7. Interdependence between Variances
The cause of one (adverse) variance may be wholly or partly explained by the cause of another(favourable) variance.
Material price or material usage and labour efficiency Labour rate and material usage Sales price and sales volume
8. The Significance of Variances
The decision as to whether or not a variance is so significant that it should be investigated shouldtake a number of factors into account.
The type of standard being used Interdependence between variances Controllability Materiality
9. Materials Mix and Yield VariancesThe materials usage variance can be subdivided into a materials mix variance and a materials
yield variance if the proportion of materials in a mix is changeable and controllable.The mix variance indicates the effect on costs of changing the mix of material inputs.The yield variance indicates the effect on costs of material inputs yielding more or less than
expected.Standard input to produce 1 unit of product X:
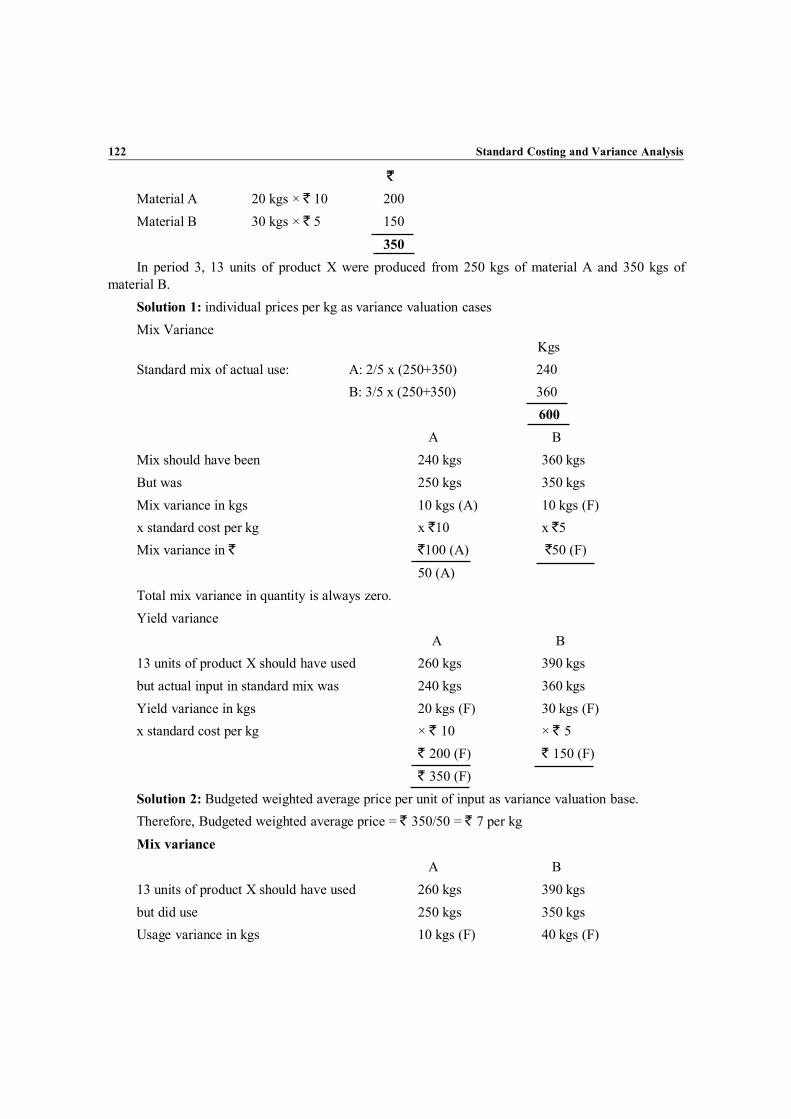
Standard Costing and Variance Analysis122
`
Material A 20 kgs × ` 10 200Material B 30 kgs × ` 5 150
350In period 3, 13 units of product X were produced from 250 kgs of material A and 350 kgs of
material B.Solution 1: individual prices per kg as variance valuation casesMix Variance
KgsStandard mix of actual use: A: 2/5 x (250+350) 240
B: 3/5 x (250+350) 360600
A BMix should have been 240 kgs 360 kgsBut was 250 kgs 350 kgsMix variance in kgs 10 kgs (A) 10 kgs (F)x standard cost per kg x `10 x `5Mix variance in ` `100 (A) `50 (F)
50 (A)Total mix variance in quantity is always zero.Yield variance
A B13 units of product X should have used 260 kgs 390 kgsbut actual input in standard mix was 240 kgs 360 kgsYield variance in kgs 20 kgs (F) 30 kgs (F)x standard cost per kg × ` 10 × ` 5
` 200 (F) ` 150 (F)` 350 (F)
Solution 2: Budgeted weighted average price per unit of input as variance valuation base.Therefore, Budgeted weighted average price = ` 350/50 = ` 7 per kgMix variance
A B13 units of product X should have used 260 kgs 390 kgsbut did use 250 kgs 350 kgsUsage variance in kgs 10 kgs (F) 40 kgs (F)

Standard Costing and Variance Analysis 123
x individual price per kg – budgetedweighted average price per kg` (10 – 7) × ` 3` (5 – 7) × (` 2)
` 30 (F) ` 80 (A)` 50 (A)
Yield varianceA B
Usage variance in kgs 10 kg (F) 40 kg (F)x budgeted weighted averagePrice per kg 0215 ` 7 × ` 7
` 70 (F) ` 280 (F)` 350 (F)
10. Sales Mix and Quantity VariancesThe sales volume variance can be subdivided into a mix variance if the proportions of products
sold are controllable.
Sales Mix VarianceThis variance indicates the effect on profit of changing the mix of actual sales from the standard
mix.It can be calculated in one of two ways.The difference between the actual total quantity sold in the standard mix and the actual quantities
sold, valued at the standard margin per unit.The difference between actual sales and budgeted sales, valued at (standard profit per unit –
budgeted weighted average profit per unit).
Sales Quantity VarianceThis variance indicates the effect on profit of selling a different total quantity from the budgeted
total quantity.It can be calculated in one of two ways. The difference between actual sales volume in the standard mix and budgeted sales valued
at the standard margin per unit. The difference between actual sales volume and budgeted sales valued at the budgeted
weighted average profit per unit.
KEYWith all variance calculations, from the most basic (such as variable cost variances) to the more complex(such as mix and yield/mix and quantity variances), it is vital that you do not simply learn formulae. Youmust understand what your calculations are supposed to show.

Standard Costing and Variance Analysis124
IllustrationsIllustration 1: ‘X’ Ltd. has budgeted the following sales for the month of August, 2012.
Product No. of units Selling Priceper Unit (`)
A 15,000 15.00B 9,000 20.00C 12,000 12.00
The Actual sales for the month of August 2012 were as follows:
Product No. of units Selling Priceper Unit (`)
A 16,500 14.00B 10,000 19.50C 12,300 11.90
You are required to calculate:(a) Sales value variance(b) Sales price variance(c) Sales volume variance(d) Sales mix variance(e) Sales quantity variance
Solution:
Budgeted Sales
Product No. of units S.P. per Unit(`)
`
A 15,000 15.00 2,25,000B 9,000 20.00 1,80,000C 12,000 12.00 1,44,000
36,000 5,49,000
Actual Sales
Product No. of units S.P. per Unit(`)
`
A 16,500 14.00 2,31,000B 10,000 19.50 1,95,000C 12,300 11.90 1,46,370
38,800 5,72,370
Revised Std. Qty. = Qty. BudgetQty.Budget TotalQty. Actual Total

Standard Costing and Variance Analysis 125
A = 000,1538,80036,000
= 13,917
B = 000,938,80036,000
= 8,350
C = 000,1238,80036,000
= 11,134
Revised sales as are follows:
Product Revised Qty. Budget Price Revised SalesA 13,917 15.00 2,08,755B 8,350 20.00 1,67,000C 11,134 12.00 1,33,608
33,401 5,09,363
Applied sales as are follows:
Product Actual Qty. Budget Price Applied SalesA 16,500 15.00 2,47,500B 10,000 20.00 2,00,000C 12,300 12.00 1,47,600
38,800 5,95,100
(a) Sales Value variance= Budget Sales – Actual Sales= 5,49,000 – 5,72,370 = ` 23,370 (F)
(b) Sales Price variance= Applied Sales – Actual Sales= 5,95,100 – 5,72,370 = ` 22,730 (A)
(c) Sales Volume variance= Budget Sales – Actual Sales= 5,49,000 – 5,95,100 = ` 46,100 (F)
(d) Sales Mix variance= Revised Sales – Actual Sales= 5,09,363 – 5,95,100 = ` 85,737 (F)
(e) Sales Quantity variance= Budgeted Sales – Revised Sales= 5,49,000 – 5,09,363 = ` 39,637 (A)
Illustration 2: Vinay Ltd. produces an article by blending three basic raw materials. It operates astandard costing system and the following standards have been set for materials.

Standard Costing and Variance Analysis126
Materials Standard Mix (%) Standard Price per kg `
A 25 8.80B 35 10.60C 40 12.90
The standard loss in processing is 20%During the month of August, 2012, Company produced 12,000 kgs. of finished output.The actual consumption of materials is as under:
Materials Quantity (kgs.) Actual Price per kg `
A 3600 8.70B 5200 10.80C 5900 13.10
You are required to calculate:(a) Material Cost variance(b) Material Price variance(c) Material Usage variance(d) Material Mix variance(e) Material Yield variance
Solution:(a) Material price variance
= Actual Qty used (Std price – Actual price)Material A = 3600 (8.80 – 8.70)
= 3600 (0.10) = ` 360 (F)Material B = 5200 (10.60 – 10.80)
= 5200 (0.20) = ` 1040 (A)Material C = 5900 (12.90 – 13.10)
= 5900 (0.20) = ` 1180 (A)(b) Material cost variance
= (Std. Price × Std. Qty) – (Actual Price × Actual Qty)Material A = (8.80 × 3000) – (8.70 × 3600)
= 26,400 – 31,320 = ` 4920 (A)Material B = (10.60 × 4200) – (10.80 × 5200)
= 44,520 – 56,160 = ` 11,640 (A)Material C = (12.90 × 4800) – (13.10 × 5900)
= 61,920 – 77,290 = ` 15,370 (A)

Standard Costing and Variance Analysis 127
Revised Std. Qty.
Material A = 1470010025
= 3675
Material B = 1470010035
= 5145
Material C = 1470010040
= 5880
(c) Material Mix variance= Std price (Revised Std. Qty. – Actual Qty.)
Material A = 8.80 (3675 – 3600)= 8.80 (75) = ` 660 (F)
Material B = 10.60 (5145 – 5200)= 10.60 (55) = ` 583 (A)
Material C = 12.90 (5880 – 5900)= 12.90 (20) = ` 258 (A)
(d) Material Usage variance= Std. Price (S.Q. for actual output – Actual qty. used)
A = 1200010025
= 3000
B = 1200010035
= 4200
C = 1200010040
= 4800
Material A = 8.80 (3000 – 3600)= 8.80 (600) = ` 5280 (A)
Material B = 10.60 (4200 – 5200)= 10.60 (1000) = ` 10,600 (A)
Material C = 12.90 (4800 – 5900)= 12.90 (1100) = ` 14,190 (A)
(e) Material Yield variance= Std. cost per unit of output (Std. yield for actual material – Actual yield)= 13.837 (11,760 – 12,000)= 13.837 (– 240) = ` 3320.88 (A)
Std. cost per unit of outputMaterial A = 3000

Standard Costing and Variance Analysis128
Material B = 4200Material C = 4800
12,000Less: Std. loss 2,400
9,600
Std. cost per unit of output =600,9
61920)44520(26400
=600,9
840,32,1 = ` 13.837
Std. Yield for Actual MaterialMaterial A = 3600Material B = 5200Material C = 5900
14,700Less: Std. loss 2,940
11,760Illustration 3: A gang of workers normally consists of 30 men, 15 women and 10 boys. They are
paid at Standard rates per hour as, Men ` 80.00 women ` 60.00 and Boy ` 40.00. In a normal workingof a week of 40 hours, the Gang is expected to produce 2000 units of output.
During the week ended 31st December, 2011, the gang consisted of 40 men, 10 women and 05boys. The actual wages paid per hour were Men ` 70.00, Women ` 65.00 and Boy ` 30.00. Actualunits produced by the gang 1600 units.
Calculate:(i) Labour Cost Variance
(ii) Labour Rate Variance(iii) Labour Efficiency Variance(iv) Labour Mix Variance(v) Labour Yield VarianceSolution:(i) Labour Cost Variance
(Std. Rate × Std. time for actual output) – (Actual Rate × Actual Time)Men = (80 × 960) – (70 × 1600)
= (76,800 – 1,12,000) = ` 35,200 (A)Women = (60 × 480) – (65 × 400)
= (28,800 – 26,000) = ` 2,800 (F)Boys = (40 × 320) – (30 × 200)

Standard Costing and Variance Analysis 129
= (12,800 – 6,000) = ` 6,800 (F)Labour Cost Variance ` 25,600 (A)
(ii) Labour Rate VarianceActual time (SR – AR)
Men = 1600 (80 – 70) = ` 16,000 (F)Women = 400 (60 – 65) = ` 2,000 (A)Boys = 200 (40 – 30) = ` 2,000 (F)
Labour Rate Variance ` 16,000 (F)(iii) Labour Efficiency Variance
= Std. price (Std. time for actual output – actual time)Men = 80 (960 – 1600)
= 80 (640) = ` 51,200 (A)Women = 60 (480 – 400)
= 60 (80) = ` 4,800 (F)Boys = 40 (320 – 200)
= 40 (120) = ` 4,800 (F)Labour Efficiency Variance ` 41,600 (A)
(iv) Labour Mix Variance= Std. Rate (Std. Time – Actual Time Worked)
Men = 80 (1200 – 1600)= 80 (400) = ` 32,000 (A)
Women = 60 (600 – 400)= 60 (200) = ` 12,000 (F)
Boys = 40 (400 – 200)= 40 (200) = ` 8,000 (F)Labour Mix Variance ` 12,000 (A)
(v) Labour Yield Variance= Std. labour cost per unit of output × (Std. Output for Actual Time – Actual
output)= 47 (2000 – 1600)= 74 (400) = ` 29,600 (F)
Working Notes:1. Actual time
Men = 40 × 40 = 1600Women = 10 × 40 = 400

Standard Costing and Variance Analysis130
Boys = 05 × 40 = 2002200 hrs.
2. Std. time for actual output
Men =20001600 × (30 × 40) = 690 hrs.
Women =20001600 × (15 × 40) = 480 hrs.
Boys =20001600 × (10 × 40) = 320 hrs.
3. Std. timeMen = (30 × 40) = 1200 hrs.Women = (15 × 40) = 600 hrs.Boys = (10 × 40) = 400 hrs.
4. Std. labour cost permit of output:Std. output given = 2000 unitsStd. Cost givenMen = 30 × 40 × 80 = 96000Women = 15 × 40 × 60 = 36000Boys = 10 × 40 × 40 = 16000
1,48,000So, labour cost permit of output
=2000
000,48,1 = ` 74/-
Std. output for actual time worked for 2200 hours of total.Std. output = 2000 unitsfor 1760 hrs. of actual time worked
= 2000 ×22001760 = 1600 units
Illustration 4: The Standard material cost for a normal mix of one tonne of Chemical X is basedon:
Chemical: X Y ZUsage (Kg.): 240 400 640Price per (Kg.) (`): 6 12 10During a month, 6.25 tonnes of X were purchased from.Chemical: X Y ZConsumption (Tonnes): 1.6 3.4 4.5Cost (`): 11,200 30,000 47,250

Standard Costing and Variance Analysis 131
Calculate the material variancesSolution:
Chemical SQ SP AQ *AP RSQ
X
Y
Z
1,500
2,500
4,000
6
12
10
1,600
2,400
4,500
1,60011,200
2,40030,000
4,50047,250
7
12.5
10.5
8,0001,500 × 8,500 = 1,593.75
8,0002,500 × 8,500 = 2,656.25
80004,000 × 8,500 = 4,250.00
Total 8,000 - 8,500 - - 8,500
Actual OutputNote: 1,000 kgs = 1 tonne
*Actual Price (AP) = Actual Cost/Actual Quantity {(/) Divide}(a) Material Cost Variance = (SQ × SP) – (AQ × AP)
X: (1,500 × 6) – 11,2009,000 – 11,200 = 2,200 AY: (2,500 × 12) – 30,00030,000 – 30,000 = ZeroZ: (4,000 × 10) – 47,25040,000 – 47,250 = 7,250 ATotal = 9,450 A(b)
(b) Material Price Variation = AQ (SP – AP)X: 1,600 (6 – 7) = 1,600 AY: 2,400 (12 – 12.5) = 1,200 AZ: 4,500 (10 – 10.5) = 2,250 ATotal = 5,050 A
(c) Material Usage Variance = SP (SQ – AQ)X: 6 (1,500 – 1,600) = 600 AY: 12 (2,500 – 2,400) = 1,200 FZ: 10 (4,000 – 4,500) = 5,000 ATotal = 4,400 A
(d) Material Mix Variance = SP (RSQ – AQ)X: 6 (1,500 – 1,593.75) = 562.50 AY: 12 (2,500 – 2,656.25) = 3,075.00 AZ: 10 (4,250 – 4,500) = 2,500.00 ATotal = 537.50 F

Standard Costing and Variance Analysis132
(e) Material yield Variance = SP (SQ – RSQ)X: 6 (1,500 – 1,593.75) = 562.50 AY: 12 (2,500 – 2,656.25) = 1,875.00 AZ: 10 (4,000 – 4,250) = 2,500.00 ATotal = 4,937.50 A
Illustration 5: The Devansh Ltd. manufactures a particular product, the standard direct labourcost of which is ` 120 and which is arrived as follows:
Grade of Workers Hours per unit ofOutput
Rate per hour (`) Amount (`)
X 30 2 60Y 20 3 60
Total 50 120
In a particular period, 100 units of the product were produced, the actual cost of which was asfollows:
Grade of Workers Hours Rate (`) Amount (`)X 3,200 1.50 4,800Y 1,900 4.00 7,600
Total 5,100 12,400
You are required to calculate the:(1) Total Labour cost variance(2) Labour rate variance(3) Labour mix variance and(4) Labour efficiency varianceSolution: Standard Input for Actual Output
Grade of Workers SH SR AH AR RSH
X 3,000 2 3,200 1.55,0003,000 × 5,100 = 3,060
Y 2,000 3 1,900 45,0002,000 × 5,100 = 2,040
Total 5,000 - 5,100 - 5,100
Grade of Workers Per Unit For 100 Units
AB
3020
3,0002,000
Total 50 5,000

Standard Costing and Variance Analysis 133
Labour Cost variance = (SH × SR) – (AH × AR)A: (3,000 × 2 ) – 4,800
6,000 – 4,800 = 1,200 FB: (2,000 × 3) – 7,600
6,000 – 7,600 = 1,600 ATotal = 400 A
Labour Rate Variance = AH (SR – AR)A: 3,200 (2 – 1.5) = 1,600 FB: 1,900 (3 – 4) = 1,900 A
Total = 300 ALabour Efficiency variance = SR (SH – AH)A: 2 (3,000 – 3,200) = 1,600 FB: 3 (2,000 – 1,900) = 1,900 A
Total = 100 ALabour Mix variance = SR (RSH – AH)A: 2 (3,060 – 3,200) = 280 AB: 3 (2,040 – 1,900) = 420
Total = 140 FIllustration 6: Calculate the overhead variance from the following data:
Budget ActualNumber of Working days 20 22Man hours per Day 8,000 8,400Output per man hours in units 1.0 0.9Fixed overhead cost (`) 1,60,000 1,68,000
(1) Fixed overhead cost Variance= (SR per hour x Actual Output) – Actual Fixed overhead
= 000,68,19.0400,822[1000,820
1,60,000
= (1 × 1, 66,320) – 1, 68,000= 1,66,000 – 1,68,000= 1,680 A
(2) Fixed overhead expenditure Variance= standard Recovery rate= (Standard Recovery rate x Budgeted output) – Actual Fixed Overhead
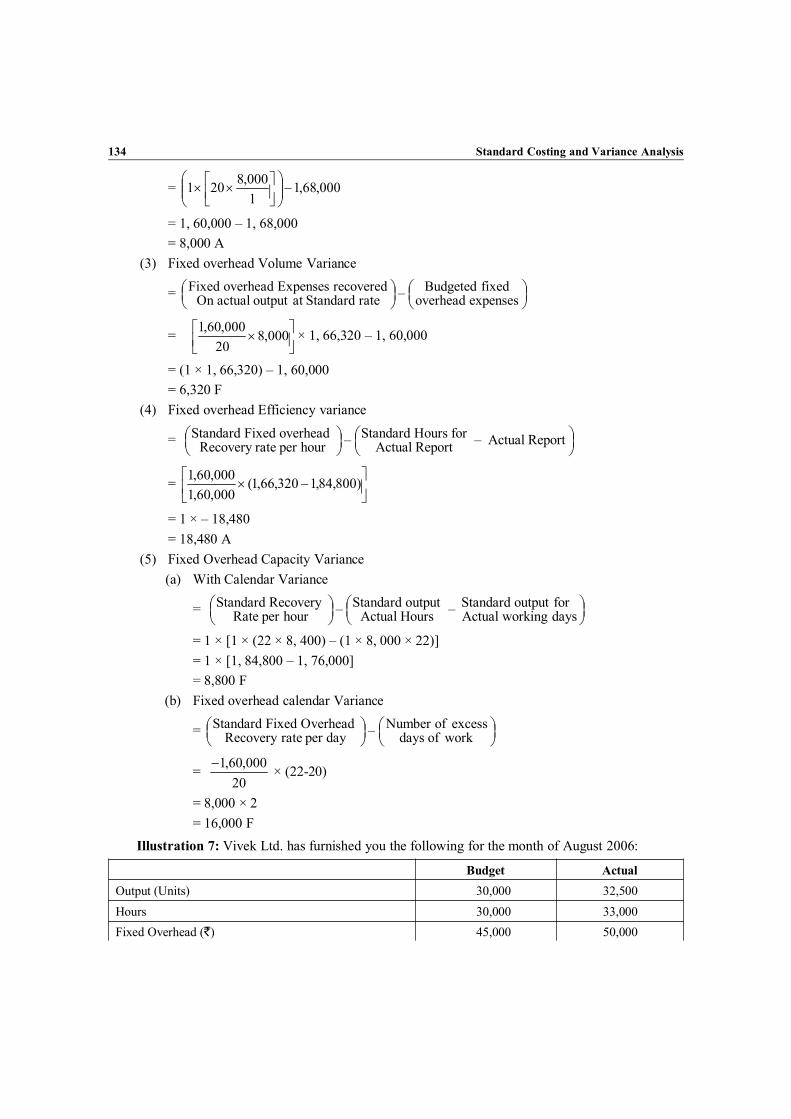
Standard Costing and Variance Analysis134
= 000,68,11000,8201
= 1, 60,000 – 1, 68,000= 8,000 A
(3) Fixed overhead Volume Variance
=
expensesoverheadfixedBudgeted–rateStandardatoutputactualOn
recoveredExpensesoverheadFixed
=
000,8
20000,60,1 × 1, 66,320 – 1, 60,000
= (1 × 1, 66,320) – 1, 60,000= 6,320 F
(4) Fixed overhead Efficiency variance
=
ReportActual–ReportActual
forHoursStandard–hourperrateRecovery overheadFixedStandard
=
)800,84,1320,66,1(
000,60,1000,60,1
= 1 × – 18,480= 18,480 A
(5) Fixed Overhead Capacity Variance(a) With Calendar Variance
=
daysorkingwActualforoutputStandard–oursHActual
utputoStandard–hourperRateRecovery Standard
= 1 × [1 × (22 × 8, 400) – (1 × 8, 000 × 22)]= 1 × [1, 84,800 – 1, 76,000]= 8,800 F
(b) Fixed overhead calendar Variance
=
workofdaysexcessofNumber–dayperrateRecovery
OverheadixedFStandard
=20
000,60,1 × (22-20)
= 8,000 × 2= 16,000 F
Illustration 7: Vivek Ltd. has furnished you the following for the month of August 2006:
Budget ActualOutput (Units) 30,000 32,500Hours 30,000 33,000Fixed Overhead (`) 45,000 50,000

Standard Costing and Variance Analysis 135
Variable Overhead (`) 60,000 68,000Working Days 25 26
Calculate the VarianceSolution:(1) Variable Overhead Variance
=
ExpensesOverhead
VariableActual–unitsoutputsActual
unitperCostVariableStandard
=
500,32
000,30000,60 – 68,000
= 65,000 – 68,000= 3,000 A
(2) Variable Overhead Expenditure variance
=
IncurredexpensesOverhead
VariableActual–orkedwoursH
ActualhourPerExpensesOverheadVariableStandard
=
000,33
000,30000,60 – 68,000
= 66,000 – 68,000= 2,000 A
(3) Variable Overhead Efficiency Variance
= hourperExpensesOverheadvariableStandard
HoursActual–timeunitper
shour'StandardOutputActual
= [(32,500 × 1) – 33,000] × 2= [32,500 – 33,000] x 2= – 500 x 2= 1,000 A
(4) Fixed Overhead Cost Variance
=
IncurredOverheadFixedActual
outputActualForOverheadfixedStandard
=
500,32
000,30000,45 – 50,000
= 48,750 – 50,000= 1,250 A
(5) Fixed overhead Expenditure Variance= Budgeted fixed overhead – Actual Fixed overhead= 45,000 – 50,000= 5,000 A
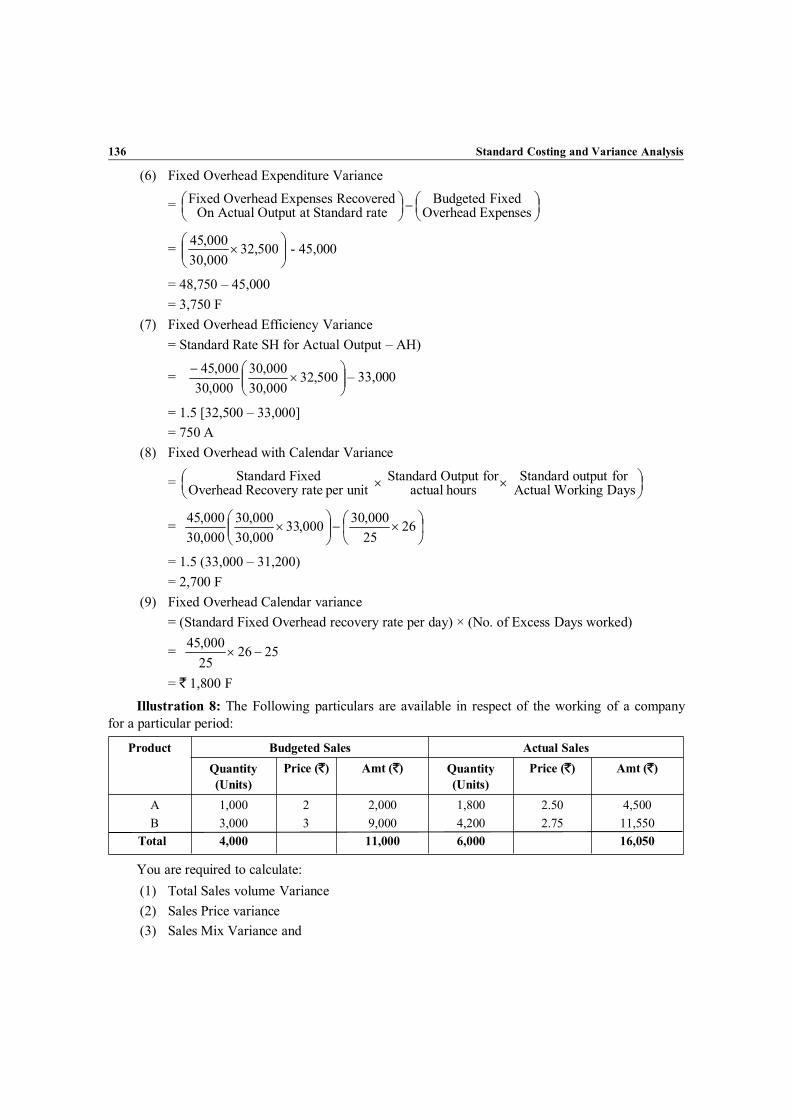
Standard Costing and Variance Analysis136
(6) Fixed Overhead Expenditure Variance
=
ExpensesOverheadFixedBudgeted
rateStandardatOutputActualOnRecoveredExpensesOverheadFixed
=
500,32
000,30000,45 - 45,000
= 48,750 – 45,000= 3,750 F
(7) Fixed Overhead Efficiency Variance= Standard Rate SH for Actual Output – AH)
=
500,32000,30000,30
000,30000,45 – 33,000
= 1.5 [32,500 – 33,000]= 750 A
(8) Fixed Overhead with Calendar Variance
=
DaysWorkingActual
foroutputStandardhoursactual
forOutputStandardunitperrateRecoveryOverhead
FixedStandard
=
26
25000,30000,33
000,30000,30
000,30000,45
= 1.5 (33,000 – 31,200)= 2,700 F
(9) Fixed Overhead Calendar variance= (Standard Fixed Overhead recovery rate per day) × (No. of Excess Days worked)
= 252625000,45
= ` 1,800 FIllustration 8: The Following particulars are available in respect of the working of a company
for a particular period:
Product Budgeted Sales Actual SalesQuantity(Units)
Price (`) Amt (`) Quantity(Units)
Price (`) Amt (`)
AB
Total
1,0003,0004,000
23
2,0009,00011,000
1,8004,2006,000
2.502.75
4,50011,55016,050
You are required to calculate:(1) Total Sales volume Variance(2) Sales Price variance(3) Sales Mix Variance and

Standard Costing and Variance Analysis 137
(4) Sales Quantity VarianceSolution:(1) Sales price Variance = ASQ ( ASP – BSP)
A: 1,800 (2.5 – 2) = 900 FB: 4,200 (2.75 – 3) = 1,050 ATotal = 150 A
(2) Sales Volume Variance = BSP (ASQ – BSQ)A: 2 (1,800 – 1,000) = 1,600 FB: 3 (4,200 – 3,000) = 3,600 FTotal = 5,200 F
(3) Sales Quantity Variance = BSP (RSSQ – BSQ)
A:
000,1000,6
000,4000,1 = 1,000 F
B:
000,3000,6
000,4000,3 = 4,500 F
Total = 5,500 F(4) Sales Mix Variance = BSP (ASQ – RSSQ)
A:
000,6
000,4000,1800,21 = 600 F
B:
000,6
000,4000,3200,34 = 900 A
Total = 300 AIllustration 9: Compute the Missing Data indicated by question marks from the following:
Particulars Product R Product SSales Quantity (Std.) ? 400Actual (Units) 500 ?Price/Unit Std. 12 15Price/Unit – Actual 15 20Sales price Variance ? ?Sales Volume Variance 1200 F ?Sales Value Variance ? ?
Sales Mix Variance for both the products together is ` 450 (F)

Standard Costing and Variance Analysis138
Solution:
Product StandardQuality
Standardprice
ActualQuantity
Actual Price RSQ
RS
400400
1215
500800
1520 800
400× 1300 = 650
800400
× 1300 = 650
800 1300 1300
(1) Sales Revenue variance ASR – BSRR: (500 × 15) – (400 × 12)7500 – 4800 = 2,700 FS: (800 × 20) – (400 × 15)16,000 – 6,000 = 10,000 F
= 12,700 F(2) Sales Price Variance = ASQ (ASP – SSP)
R: 500 (15 – 12) = 1,500 FS: 800 (20 – 15) = 4,000 F
= 5,500 F(3) Sales Volume Variance = SSP (ASQ – SSQ)
R: 12 (500 – 400) = 1,200 FS: 15 (800 – 400) = 6,000 F
= 7,200 F(4) Sales Mix Variance = SSP (ASQ – RSQ)
R: 12 (500 – 650) = 1,800 AS: 15 (800 – 650) = 2,250 F
450 F(5) Sales Quantity Variance = (RSSQ – SSQ) SSP
R: (650 – 400) 12 = 3,000 FS: (650 – 400) 15 = 3,750 F
= 6,750 F(6) R: 12 [500 – (250 + 0.5x)] =
S: 15 [x – (250 + 0.5X) =[12 (500 – 250 – 0.5x)] + [15 (x – 250 – 0.5x)] = 450[12 (250 – 0.5x)] + [15(0.5x – 250)] = 450[3,000 – 6x] + [7.5x – 3,750] = 4503,000 – 3,750 – 6x + 7.5x = 450–750 + 1.5x = 4501.5 x = 450 + 750X = 800
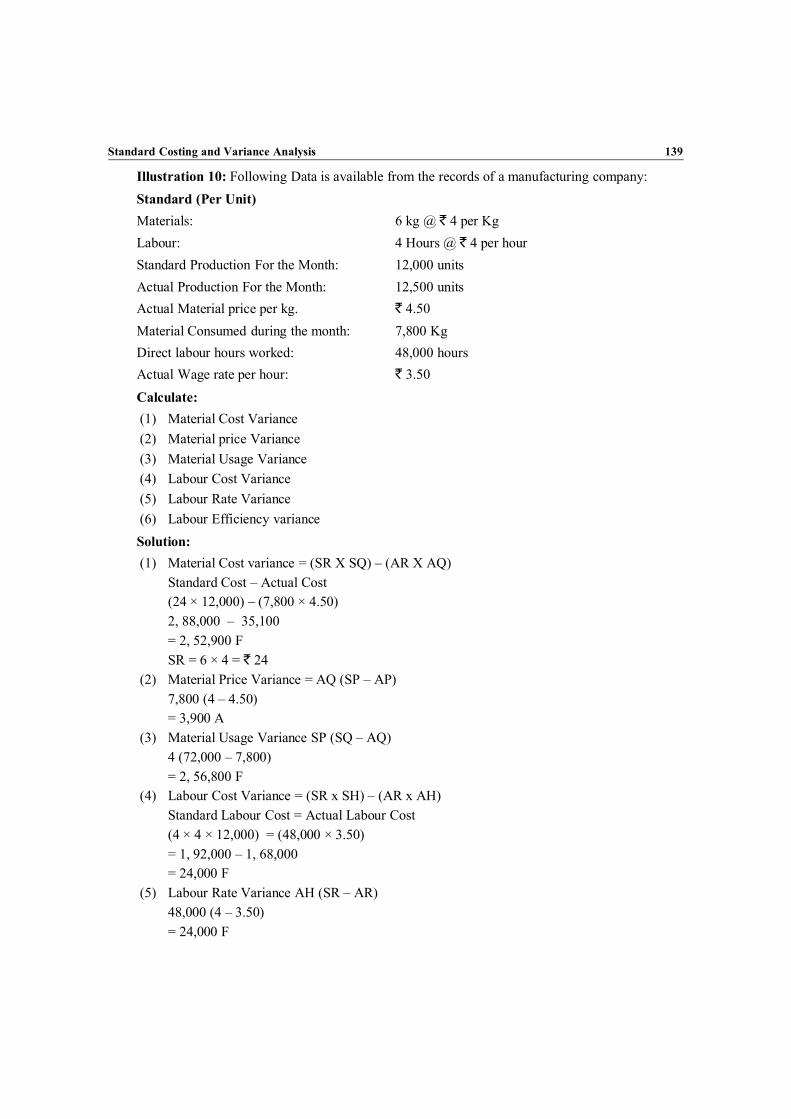
Standard Costing and Variance Analysis 139
Illustration 10: Following Data is available from the records of a manufacturing company:Standard (Per Unit)Materials: 6 kg @ ` 4 per KgLabour: 4 Hours @ ` 4 per hourStandard Production For the Month: 12,000 unitsActual Production For the Month: 12,500 unitsActual Material price per kg. ` 4.50Material Consumed during the month: 7,800 KgDirect labour hours worked: 48,000 hoursActual Wage rate per hour: ` 3.50Calculate:(1) Material Cost Variance(2) Material price Variance(3) Material Usage Variance(4) Labour Cost Variance(5) Labour Rate Variance(6) Labour Efficiency varianceSolution:(1) Material Cost variance = (SR X SQ) – (AR X AQ)
Standard Cost – Actual Cost(24 × 12,000) – (7,800 × 4.50)2, 88,000 – 35,100= 2, 52,900 FSR = 6 × 4 = ` 24
(2) Material Price Variance = AQ (SP – AP)7,800 (4 – 4.50)= 3,900 A
(3) Material Usage Variance SP (SQ – AQ)4 (72,000 – 7,800)= 2, 56,800 F
(4) Labour Cost Variance = (SR x SH) – (AR x AH)Standard Labour Cost = Actual Labour Cost(4 × 4 × 12,000) = (48,000 × 3.50)= 1, 92,000 – 1, 68,000= 24,000 F
(5) Labour Rate Variance AH (SR – AR)48,000 (4 – 3.50)= 24,000 F

Standard Costing and Variance Analysis140
(6) Labour Efficiency Variance = SR (SH – AH)4 ([4 × 12,000] – 48,000)4 (48,000 – 48,000)= Zero
Illustration 11: ABC Ltd. has furnished the following information:
Particulars Budget ActualOutput (units) 15,000 16,000No. of Working Days 25 28Fixed Overheads (`) 30,000 30,500Variable Overheads (`) 45,000 47,000
Calculate:(1) Fixed Overheads cost variance(2) Fixed Overhead expenditure Variance(3) Fixed Overhead Cost Variance(4) Variable Overhead expenditure VarianceSolution:(1) Total Overhead Cost Variance = (Actual units x SR) – Actual Overhead Cost
000,47500,30000,15
000,45000,30000,16
(16,000 × 5) – 77,500= 80,000 – 77,500= 2,500 F
(2) Variable Overhead Expenditure Variance = [(AQ × SR) – Actual Fixed Overheads]
000,47
000,15000,45000,16
[(16,000 × 3) – 47,000]48,000 – 47,000= 1,000 F
(3) Fixed Overhead Cost Variance = [(AQ × SR) – Actual Fixed overheads]
500,30
000,15000,30000,16
[(16,000 × 2) – 30,500]= 32,000 – 30,500= 1,500 F
(4) Fixed overhead Volume Variance = (AQ X SR) – Budgeted Fixed Overheads(16,000 × 2) – 30,000

Standard Costing and Variance Analysis 141
= 32,000 – 30,500= 1,500 F
(5) Fixed overhead Expenditure Variance = Budgeted Fixed Overheads – Actual Fixed O/h30,000 – 30,500= 500 A
(6) Variable Overhead Cost Variance = (Actual Output X Variable Overhead rate p.u.)-Actual Variable Overhead Cost(16,000 × 3) – 47,00048,000 – 47,0001,000 F
Illustration 12: The Following details relating to a product are made available to you:Standard Cost per unit:Materials: 50 Kg @ ` 40 per kg.Labour: 400 hours @ Re. 1 per hour.Actual Cost: (For an output of 10 units)Material: 590 Kg @ ` 42 per kgLabour: 3,960 hours @ ` 1.10 per unitsCalculate the Following Variances:(1) Material Cost Variance(2) Material Usage Variance(3) Material Price Variance(4) Labour Cost Variance(5) Labour Efficiency Variance(6) Labour rate VarianceSolution:(1) Material Cost Variance = (SR ×SQ) – (AR × AQ)
Standard Cost – Actual Cost(40 × 50 X 10) – (42 × 590)20,000 – 24,780= 4,780 A
(2) Material Usage Variance = SR (SQ – AQ)40 (50 × 10 – 590)40 (500 – 590)= 3,600 A
(3) Material Price Variance = AQ (SR – AR)590 (40 – 42)= 1,180 A
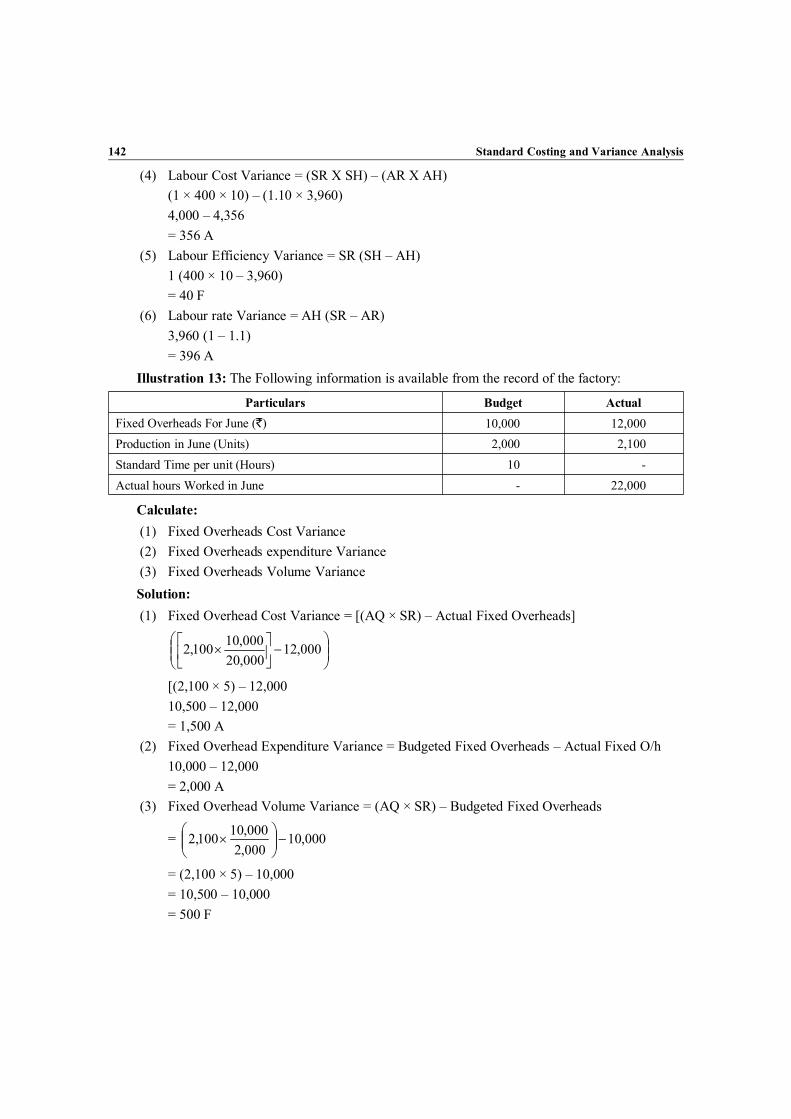
Standard Costing and Variance Analysis142
(4) Labour Cost Variance = (SR X SH) – (AR X AH)(1 × 400 × 10) – (1.10 × 3,960)4,000 – 4,356= 356 A
(5) Labour Efficiency Variance = SR (SH – AH)1 (400 × 10 – 3,960)= 40 F
(6) Labour rate Variance = AH (SR – AR)3,960 (1 – 1.1)= 396 A
Illustration 13: The Following information is available from the record of the factory:
Particulars Budget ActualFixed Overheads For June (`) 10,000 12,000Production in June (Units) 2,000 2,100Standard Time per unit (Hours) 10 -Actual hours Worked in June - 22,000
Calculate:(1) Fixed Overheads Cost Variance(2) Fixed Overheads expenditure Variance(3) Fixed Overheads Volume VarianceSolution:(1) Fixed Overhead Cost Variance = [(AQ × SR) – Actual Fixed Overheads]
000,12
000,20000,10100,2
[(2,100 × 5) – 12,00010,500 – 12,000= 1,500 A
(2) Fixed Overhead Expenditure Variance = Budgeted Fixed Overheads – Actual Fixed O/h10,000 – 12,000= 2,000 A
(3) Fixed Overhead Volume Variance = (AQ × SR) – Budgeted Fixed Overheads
= 000,10000,2000,10100,2
= (2,100 × 5) – 10,000= 10,500 – 10,000= 500 F

Standard Costing and Variance Analysis 143
Illustration 14: Calculate Variable Overheads(1) Cost Variance(2) Expenditure Variance(3) Efficiency VarianceFrom the following information:
Particulars Budget ` Actual `
Variable Overheads (`) 10,000 8,910Hours 10,000 9,900Output 5,000 4,500
Solution:(1) Variable Overhead Cost Variance = (Actual Output × Variable Overhead rate p.u.)
– Actual Variable Overhead Cost
910,8000,5000,10500,4
(4,500 × 2) – 8,9109,000 – 8,910= 90 F
(2) Variable Overhead Expenditure Variance = [(AQ X SR ) – Actual Variable Cost][(4,500 × 2) – 8,910]9000 – 8,910= 90 F
(3) Variable Overheads Efficiency Variance = SR (Actual Production – Standard Production)2(4,500 – 5,000)2 × 500= 1,000 A
Illustration 15: The Following Standards have been set to manufacture a product.
Particulars ` `
Direct materials:4 units of X @ ` 4 per unit 166 units of Y @ ` 3 per unit 18
Standard Material Cost 34Direct Labour:3 Hours @ ` 2 per unit 6Standard Cost per Unit 40
The Company manufactured and sold 6,000 units of the product during the year, details of directmaterial and labour cost being:

Standard Costing and Variance Analysis144
` `
Direct materials25,000 units of X @ ` 4.20 per unit 1,05,0006 units of Y @ ` 3 per unit 97,200 2,02,000Direct labour:17,000 hours per @ 2.20 per hour 37,400
Total ` 2,39,000
Calculate the Following Variances:(1) Material Cost Variance(2) Material usage Variance(3) Material Price Variance(4) Labour Cost Variance(5) Labour Efficiency Variance(6) Labour Rate VarianceSolution:Basic calculations:(1) Material:
Material S Q SP SC AQ AP AC RSQX 24,000
496,000 25,000 4.2 1,05,000
60,00024,000
x 61,000 = 24,000
Y36,000
3 1,08,000 36,000 2.7 97,20060,00036,000 x 61,200 = 36,600
Total 60,000 - 2,04,000 61,200 - 2,02,000 61,000
Actual Output 6,000 unitsX 4 × 6,000 = 24,000 unitsY 6 × 6,000 = 36,000 units
60,000 units(2) Labour:
SH SR SC AH AR AC18,000 2 36,000 17,000 2.2 37,400
(1) Material Cost Variance = Standard Cost – Actual Cost= SC – AC
X = 96,000 – 1, 05, 00 = 9,000 AY = 1, 08,000 – 97,200 = 10,800 F
= 1,800 F(2) Material Usage Variance = SR (SO – AQ)
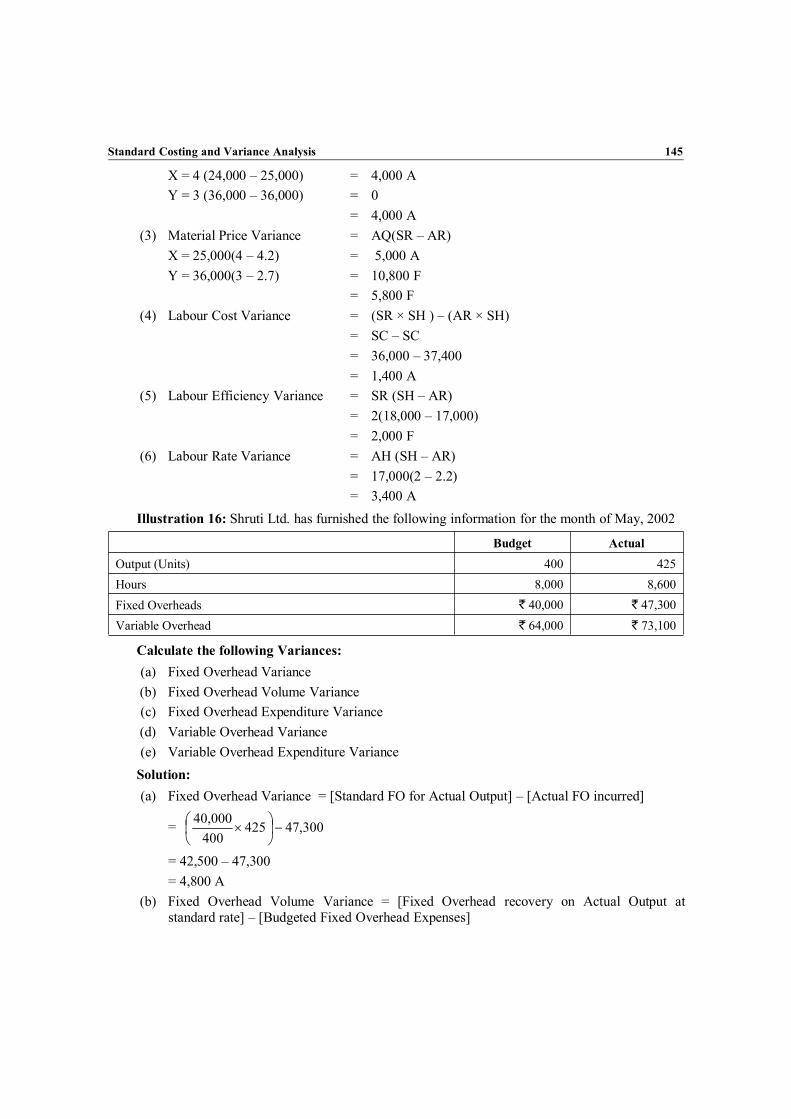
Standard Costing and Variance Analysis 145
X = 4 (24,000 – 25,000) = 4,000 AY = 3 (36,000 – 36,000) = 0
= 4,000 A(3) Material Price Variance = AQ(SR – AR)
X = 25,000(4 – 4.2) = 5,000 AY = 36,000(3 – 2.7) = 10,800 F
= 5,800 F(4) Labour Cost Variance = (SR × SH ) – (AR × SH)
= SC – SC= 36,000 – 37,400= 1,400 A
(5) Labour Efficiency Variance = SR (SH – AR)= 2(18,000 – 17,000)= 2,000 F
(6) Labour Rate Variance = AH (SH – AR)= 17,000(2 – 2.2)= 3,400 A
Illustration 16: Shruti Ltd. has furnished the following information for the month of May, 2002
Budget ActualOutput (Units) 400 425Hours 8,000 8,600Fixed Overheads ` 40,000 ` 47,300Variable Overhead ` 64,000 ` 73,100
Calculate the following Variances:(a) Fixed Overhead Variance(b) Fixed Overhead Volume Variance(c) Fixed Overhead Expenditure Variance(d) Variable Overhead Variance(e) Variable Overhead Expenditure Variance
Solution:(a) Fixed Overhead Variance = [Standard FO for Actual Output] – [Actual FO incurred]
= 300,47425400
000,40
= 42,500 – 47,300= 4,800 A
(b) Fixed Overhead Volume Variance = [Fixed Overhead recovery on Actual Output atstandard rate] – [Budgeted Fixed Overhead Expenses]

Standard Costing and Variance Analysis146
= 000,40425400
000,40
= 42,500 – 40,000= 2,500 F
(c) Fixed Overhead Expenditure Variance = Budgeted FO – Actual FO= 40,000 – 47,300= 7,300 A
(d) Variable Overhead Variance = (Standard Variable CPU x Actual Output units) – ActualVariable Overhead Expenses
= 100,73425400
000,64
= 68,000 – 73,100= 5,100 A
(e) Variable Overhead Expenditure Variance = [Standard Variable overhead expense per hourx Actual Hours worked] – Actual Variable OH expenses incurred.
= 100,73600,8000,8000,64
= 68,800 – 73,100= 4,300 A
Illustration 17: The Fixed Production overhead of producing one unit of an item was ` 35. Fixedproduction overheads were absorbed on the expected annual output of 13,200 units.
The actual production of one month was 1,000 unitsThe Actual fixed overhead for that month were ` 39,000Calculate:(1) Fixed Overhead Cost Variance(2) Fixed Overhead Volume Variance(3) Fixed Overhead Expenditure VarianceSolution:(1) Fixed Overhead Cost Variance = (SH X SR ) – Actual Overheads
= (12,000 × 35) – 4,68,000= 4,20,000 – 4,68,000= 48,000 A
(2) Fixed Overhead Volume Variance = Standard FO – Budgeted FO= 4,20,000 – (35 × 13,200)= 4,20,000 – 4,62,000= 42,000 A
(3) Fixed Overhead Expenditure Variance = (BQ X SR) – Actual FO

Standard Costing and Variance Analysis 147
= (13,200 × 35) – (39,000 × 12)= 4,62,000 – 4,68,000= 6,000 A
Illustration 18: The Following data is given
Particulars Budgeted ActualProduction in units 400 360Man-hours to produce above 8,000 7,000Variable Overheads (`) 10,000 9,150
The Standard time to produce one unit of the product is 20 hours.Calculate:(1) Variable Overhead efficiency variance(2) Variable overhead expenditure variance(3) Variable overhead cost varianceSolution:Workings:(a) Standard Hours (SH) for Actual Output = 20 × 360
= 7,200 hours
(b) Standard Rate (SR) =HoursBudgeted
OverheadsBudgeted
=hours8,000
10,000`
= ` 1.25 per hour
(c) Actual Rate (AR) =ourshctualA
OverheadsctualA
=hours7,000
015,9`
= ` 1.307 per hour(1) Variable Overheads Variance (VOV) = (SH X SR) – (AH X AR)
= (7,200 × 1.25) – 9,150= 9,000 – 9,150= 150 A
(2) Variable Overheads Efficiency Variance (VEFV) = (SH – AH) x SR= (7,200 – 7,000) × 7,000= 250 F
(3) Variable Overheads Expenditure Variance (VEXV) = (SR – AR) x AH\= (1.25 – 1.307) × 7,000= 400 A

Standard Costing and Variance Analysis148
Illustration 19: The Standard Cost of the product ‘SLR’ reveals:Standard materials:
`
2 kg of A @ ` 2 per kg 4001 kg of B @ ` 6 per kg 600Direct Labour (3 hours @ ` 6 per hour) 18.00
Actual Data:
`
Direct Materials19,000 kg of A @ 2.20 per kg 41,80010,000 kg of B @ 5.60 per kg 56,000Direct labour:(28,500 hours @ ` 6.40 per hour) 1,82,400
Actual Production was 9,000 units.Calculate:(1) Material Price Variance(2) Material usage Variance(3) Material Cost Variance(4) Labour rate Variance(5) Labour Efficiency Variance.Solution:(a) MaterialStandard Quantity for Actual output
Kgs.A 2kg × 9,000 = 18,000B 1kg × 9,000 = 9,000
= 27,000
Material SR SQ SP AR AQ AP RSQA 2 18,000 36,000 2.2 19,000 41,800 19,333B 6 9,000 54,000 5.6 10,000 56,000 9,667
Total - 27,000 90,000 - 29,000 97,800 29,000
(1) Material Cost variance = (SR X SQ) – (AR X AQ)A = 36,000 – 41,000 = 5,800 AB= 54,000 – 56,000 = 2,000 A
= 7,800 A(2) Material Price Variance = AQ (SR – AR)

Standard Costing and Variance Analysis 149
A = 19,000 (2-2.2) = 3,800 AB = 10,000 (6-5.6) = 4,000 F
= 200 F(3) Material Usage Variance = SR (SR – AR)
A = 2(18,000 – 19,000) = 2,000 AB = 6(9,000 – 10,000) = 6,000 A
= 8,000 A(4) Labour Rate Variance = AH (SR – AR)
= 28,500 (6-6.4)= 11,400 A
(5) Labour Efficiency Variance = SR (SH – AH)= 6(27,000 – 28,500)= 9,000 A
(b) Labour:
SH SR SC AH AR AC27,000 6 1,62,000 28,500 6.4 1,82,400
Illustration 20: In Order to produce 20 kgs. Of finished goods, raw materials of 50 kgs arerequired at ` 2.10 per unit. During an accounting period 20 units are manufactured by employing 57kgs of raw materials at the rate of ` 1.80.
Calculate material variancesSolution:(1) Material Cost Variance = (SR X SQ) – (AR X AQ)
= (2.10 × 50) – (1.80 × 57)= 105 – 102.6= 2.4 F
(2) Material Price Variance = AQ (SR – AR)= 57(2.10 – 1.80)= 17.1 F
(3) Material Usage Variance = SR(SQ – AQ)= 2.10(50 – 57)= 14.7 A
Illustration 21: Following data pertains to Mahi Ltd.
Materials StandardQuantity
Standard Rate(`)
ActualQuantity
Actual Rate (`)
X 40 50 50 45Y 60 40 60 55
Calculate Material Variances

Standard Costing and Variance Analysis150
Solution:
Materials SQ SR AQ AR RSQX 40 50 50 45
11011040
= 44
Q 60 40 60 55110
11060
= 66
Total 100 - 110 - 110
(1) Material Cost Variance = (SR X SQ) – (AR X AQ)P = (50 × 40) – (45 × 50)
= 2,000 – 2250 = 250 AQ = (40 × 60) – (55 × 60)
= 2400 – 3300 = 900 A= 1150 A
(2) Material Price Variance = AQ (SR – AR)P = 50(50 -45) = 250 FQ = 60(40 – 55) = 900 F
= 650 F(3) Material Usage Variance = SR(SQ – AQ)
P = 50(40 – 50) = 500 AQ = 40(60 – 60) = 0
= 500 A(4) Material Mix Variance = SR (RSQ – AQ)
P = 50(44 – 50) = 300 AQ = 40(66 – 60) = 240 F = 60 F
(5) Material Yield Variance = SR (SQ – RSQ)P = 50(40 – 44) = 200 AQ = 40 (60 – 66) = 240 A
= 440 AIllustration 22: Following data is given for 10 units of finished goods “A” 50 units at ` 2 per
unit, “B” 80 units at ` 4 per unit and “Z” 70 units at ` 3 per units. During the particular accountingperiod 65 units of finished Goods are manufactured and actual data is:
A 350 units at ` 1.95;B 500 units at ` 3.95;C 450 units at ` 3.35;Calculate Material Variances.

Standard Costing and Variance Analysis 151
Solution:
Material Standard (65 units) Actual ( 65 units) RSQSQ SR AQ AR
ABC
Total
325520455
1300
243-
3505004501300
1.953.953.35
13001300325
= 325
13001300520
= 520
13001300455
= 455
1300
(1) Material Cost Variance = (SR x SQ) – (AR X AQ)A = (2 × 325) – (1.95 × 350)
= 650 – 682.5 = 32.5 AB = (4 × 520) – (3.95 × 500)
= 2080 – 1975 = 105 FC = (3 × 455) – (3.35 × 450)
= 1365 – 1507.5 = 142.5A= 70 A
(2) Material Price Variance = AQ(SR – AR)A = 350 (2 – 1.95) = 17.5 FB = 500(4 – 3.95) = 25 FC = 450(3 – 3.35) = 157.5 A
= 115 A(3) Material usage Variance = SR(SQ – AQ)
A = 2(325 – 350) = 50 AB = 4(520 – 500) = 80 FC = 3(455 – 450) = 15 F
= 45F(4) Material Mix variance = SR(RSQ –AQ)
A = 2(325 – 350) = 50 AB = 4(520 – 500) = 80 FC = 3(455 – 450) = 15 F
= 45F(5) Material Yield Variance = SR(SQ – RSQ)
A = 2(325 – 325) = 0B = 4(520 – 520) = 0C = 3(455 – 433) = 0
= Zero
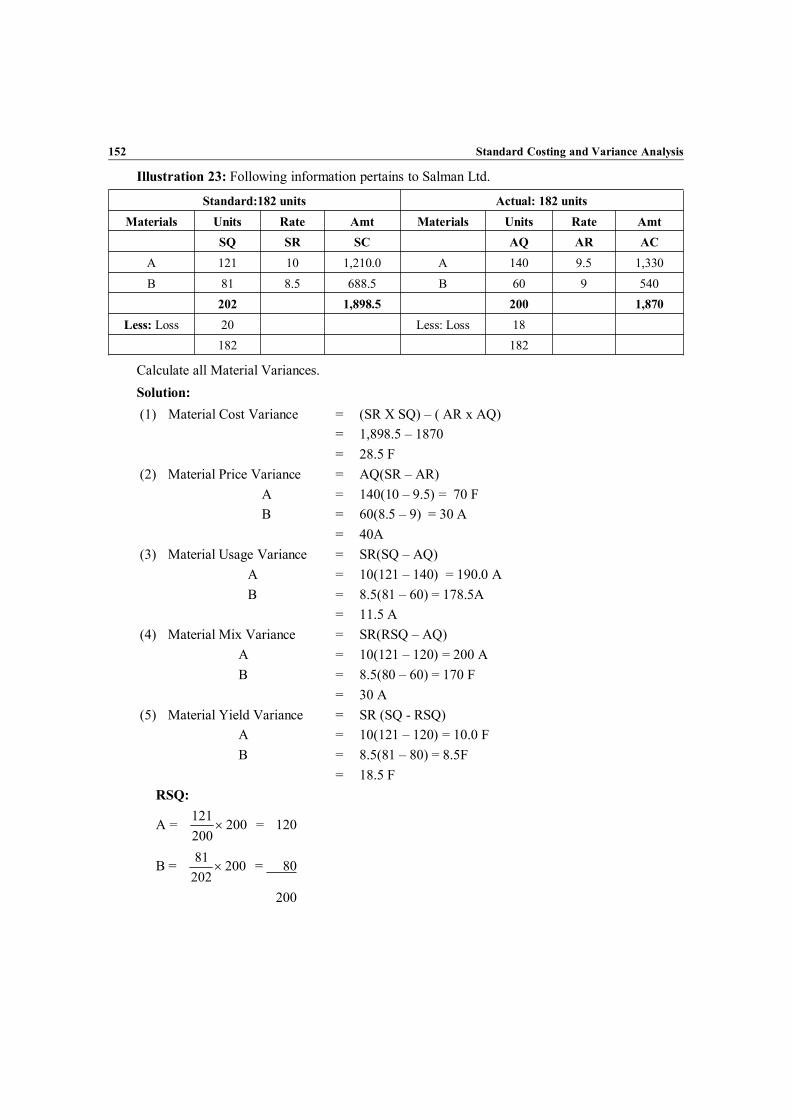
Standard Costing and Variance Analysis152
Illustration 23: Following information pertains to Salman Ltd.
Standard:182 units Actual: 182 unitsMaterials Units Rate Amt Materials Units Rate Amt
SQ SR SC AQ AR ACA 121 10 1,210.0 A 140 9.5 1,330B 81 8.5 688.5 B 60 9 540
202 1,898.5 200 1,870Less: Loss 20 Less: Loss 18
182 182
Calculate all Material Variances.Solution:(1) Material Cost Variance = (SR X SQ) – ( AR x AQ)
= 1,898.5 – 1870= 28.5 F
(2) Material Price Variance = AQ(SR – AR)A = 140(10 – 9.5) = 70 FB = 60(8.5 – 9) = 30 A
= 40A(3) Material Usage Variance = SR(SQ – AQ)
A = 10(121 – 140) = 190.0 AB = 8.5(81 – 60) = 178.5A
= 11.5 A(4) Material Mix Variance = SR(RSQ – AQ)
A = 10(121 – 120) = 200 AB = 8.5(80 – 60) = 170 F
= 30 A(5) Material Yield Variance = SR (SQ - RSQ)
A = 10(121 – 120) = 10.0 FB = 8.5(81 – 80) = 8.5F
= 18.5 FRSQ:
A = 200200121
= 120
B = 20020281
= 80
200

Standard Costing and Variance Analysis 153
Illustration 24: Following data is available of Devansh:Budgeted Sales:X 500 units @ ` 5 per unitY 700 units @ ` 8 per unitActual Sales:X 635 @ ` 5.4 per unitY 865 @ ` 8.2 per unitCalculate all Sales Variances:
Solution:
Products SQ SR SC AQ AR AC RSQX 500 5 2,500 635 5.4 3,429
15001200500
= 625
Y 700 8 5,600 865 8.2 7,0931500
1200700
= 875
Total 1,200 - 8,100 1,500 - 10,522 1,500
(1) Sales Value Variances = (AR X AQ) – (SR X SQ)= 10,522 – 8,100 = 2,422 A
(2) Sales Price Variance = AQ(ASP – BSP)X = 635 (5.4 – 5) = 254 AY = 865(8.2 – 8) = 173 A
= 427 A(3) Sales Volume Variance = BSP(AQ – BQ)
X = 5(635 – 500) = 675 AY = 8(865 – 700) = 1320 A
= 1995A(4) Sales Mix Variance = BSP(AQ – RSQ)
X = 5(635 – 625) = 50 AY = 8(865 – 875) = 80 F
= 30 F(5) Sales Quantity Variance = BSP(RSQ – BQ )
X = 5(625 – 500) = 625 AY = 8(875 – 700) = 1400 A
= 2025 A

Standard Costing and Variance Analysis154
Exercise1. S.V Ltd. manufactures a single product, the standard mix which is:
Material X 60 % at ` 20 per kgMaterial Y 40% at ` 10 per kgNormal Loss in production is 30% of input. Due to shortage of Material X the standard mixwas changed.Actual results for March 2006 were;Material X 105 kg. At ` 20 per kgMaterial Y 95 kg. At 9 per kgInput 200 kgLoss 35 kgOutput 165 kgCalculate:(a) Material Price Variance(b) Material Usage Variance(c) Material Mix Variance(d) Material Yield Variance
[Ans.: (a) Material Price Variance: A Nil; B 95 F; Total 95 F(b) Material Usage Variance: A 375 F; B125A; Total 250 F(c) Material Mix Variance: A 300 F; B 150 A; Total 150 F(d) Material Yield Variance: Total 100 F]
2. The Standard Cost of certain chemical mixture is:35%Material X at ` 25 per kg65% Material Y at ` 36 per kgA Standard loss at 5% is expected in production.During a period there is used:125 Kg of material X at ` 27 per kg275 Kg of material Y at ` 34 per kgThe actual output was 365 kg.Calculate:(a) Material Cost Variance(b) Material Price Variance(c) Material Mix Variance(d) Material Yield Variance
[Ans.: (a) Material Cost Variance: 373 A(b) Material Price Variance: X 250 A; Y 350 F; Total 300 F(c) Material Mix Variance: X 375 F; Y 540 A; Total 165 A(d) Material Yield Variance: 508 A]

Standard Costing and Variance Analysis 155
3. From the following data prepare a unit cost statement showing the prime cost of products Aand B together with analysis of variances:
Product A Product BMaterial: Standard 600 kg @ ` 5.00 90 Kg ` 3.00
Actual 580 Kg @ ` 5.50 100 Kg @ ` 2.80Labour: Standard 80 Hrs. @ ` 2.00 16 Hrs. @ ` 2.80
Actual 92 Hrs. @ ` 1.75 14 Hrs. @ ` 2.00
[Ans.: 1. Standard Prime Cost: A 3,160; B 314.802. Actual Prime Cost: A 3,351; B 316.403. Prime Cost Variance: A 191 A; b 20 F4. Material Price Variance: A 290 F; B 20 A5.Material Usage Variance: A 100 F; B 30 A6. Material Cost Variance: A 190 A; B 10 A7. Labour rate Variance: A 23 F; B 2.8 F8. Labour Efficiency Variance: A 24 A; B 5.6 F9. Labour Cost Variance: A 24 A; B 8.4 F]
4. The following information is gathered from the labour records of SRK Co.1. Payroll allocations for direct labour ` 20,0002. Time card analysis shows that 8,000 hours were worked on production lines.3. Production reports for the period shows that 4,000 units have been completed each
having standard labour time of 11/2 hours and standard labour rate ` 2 per hour.Calculate:(a) Labour Rate Variance(b) Labour Efficiency Variance(c) Labour Cost Variance
5. The Standard material cost for 200 units of output is:Materials Kg Rate per Kg
A 50 12B 100 9C 100 10
The Actual cost for 8,000 units is as follows:Materials Kg Total Cost
A 2100 28,350B 3750 30,750C 4150 46,480
Calculate Material Cost Variance, Material Price Variance and Material Usage Variance.6. The standard output of production ‘EXE’ is 25 units per hour in manufacturing department
of a company employing 100 workers. The hourly wage rate per labour hour is ` 6.

Standard Costing and Variance Analysis156
In a 42- hour week, the department produced 1,040 units ‘EXE’ despite 5% of the time paidwere lost due to an abnormal reason. The hourly wage rate actually paid were ` 6.60, ` 6and 5.70 respectively to 10, 30 and 60 of the workers.Compute Relevant Variances.
[Ans.: 1. Labour Cost Variance 432 F2. Labour Rate Variance
84 A; Nil; 756 F; Total 672 F3. Labour Efficiency Variance 1,020 F4. Labour Idle Time Variance 1,260 A]
7. The following information was obtained from the records of a manufacturing unit usingstandard costing system:
Standard ActualProduction 4,00 units 3,800 unitsWorking Days 20 21Fixed Overhead (`) 40,000 39,000Variable Overhead (`) 12,000 12,000
You are required to calculate the following overhead variances:(a) Variable Overhead Variance.(b) Fixed Overhead Variance.
1. Expenditure Variance2. Volume Variance3. Efficiency Variance4. Calendar Variance
(c) Also prepare a reconciliation statement for the standard fixed expenses worked out atstandard fixed overhead rate and the actual fixed overhead.
[Ans.: 1. Variable Overhead Cost Variance 600 A2. Fixed Overhead Variance 1,000 A3. Fixed Overhead Expenditure Variance 1,000 A4. Fixed Overhead Volume Variance 2,000 A5. Fixed Overhead Efficiency Variance 4,000 A6. Fixed Overhead Calendar Variance 2,000 F]
8. From the following information about sales, calculate:(a) Total Sales Variance(b) Sales Price Variance(c) Sales Volume Variance(d) Sales Mix Variance(e) Sales Quantity Variance.

Standard Costing and Variance Analysis 157
Product Product No. Standard ratein ` per unit
` Productnos.
Actual rate in` per unit
`
A 5,000 5 25,000 6,000 6 36,000B 4,000 6 24,000 5,000 5 25,000C 3,000 7 21,000 4,000 8 32,000
12,000 70,000 15,000 93,000
[Ans.: 1. Total Sales Variance 23,000 F2. Sales Price Variance: A 6,000 F; B 5,000 A; C 4,000 F; Total 5,000F3. Sales Volume Variance: A 5,000 F; B 6,000 F; C 7,000 F; Total 18,000 F4. Sales Mix Variance 500 F5. Sales Quantity Variance 17,500 F]
9. From the following information of Kautsa Corporation, compute:(a) Price Variance(b) Usage Variance and(c) Mix Variances
QuantityKgs.
Unit Price Total QuantityKgs.
Unit Price Total
Material A 20 4 80 10 6 60Material B 40 6 240 20 12 240Material C 40 12 480 30 10 300
100 800 60 600
10. From the following particulars in respect of a product ‘P’ in which raw materials ‘A’ and‘B’ are used, you are required to calculate:1. Material Cost Variance2. Material Price Variance3. Material Mix Variance4. Material Yield Variance
11. The Standard material cost for a normal mix of one ton of a chemical X is based on thefollowing:
Chemical Usage in Kg. Price Per kg. (`)A 240 6B 400 12C 640 10
During a month 6.25 tons of Chemical X were produced from the following:Chemicals Usage in tons Cost (`)
A 1.6 11,200B 2.4 30,000C 4.5 47,250
Analyse all Variances.

Standard Costing and Variance Analysis158
12. The Standard cost of a certain chemical mixture is:40% material X at ` 200 per ton60% material Y at ` 300 per tonA Standard loss of 103 is expected in production.During a period there is used90% tons of Material X at the cost of ` 180 per ton110 tons Material Y at the cost of ` 340 per ton.The weight produced is 182 tons of good production.Calculate and present:(a) Material Price Variance(b) Material Usage Variance(c) Material Mix Variance(d) Material Yield Variance.
14. The Devansh Badani Co. Ltd. manufactures a single product, the standard mixMaterial A 60% @ ` 20 per kg., material B 40% @ ` 10 per kg. Normal loss in productionis 20% of input. Due to shortage of material A the standard mix was changed.Actuals are:
Material A 210 Kg @ ` 20 4,200Material B 190 kg @ ` 9 1,710Input 400 Kg 5,910Loss 60 Kg -Output 340 Kg 5,910
Calculate material price, mixture yields and usage variances.15. From the following data, calculate:
1. Material Cost Variance2. Material Price Variance3. Material Usage Variance
Name of Material Standard ActualKg. Rate (`) Kg. Rate (`)
X 8,000 1.05 7500 1.25Y 3,000 2.15 3300 2.30Z 2,000 3.30 2400 3.50
16. Using the following information for Department X,Calculate all possible labour variances.Actual Wages rate per hour (`) 3.5Standard hours for production 8,640Standard rate per Hour (`) 3Actual hours worked 8,200

Standard Costing and Variance Analysis 159
17. From the following particulars in respect of a product ‘X’ in which raw materials ‘A’ and‘B’ are used. Calculate:1. Material Cost Variance2. Material Price Variance3. Material Mix Variance4. Material Yield Variance
Materials (Input) Standard ActualTons Rate (`) Tons Rate (`)
A 120 10.00 140 9.50B 80 7.50 60 9.00
200 200Loss 20 18
Objective QuestionsI. Fill in the Blanks
1. The difference between total actual cost incurred and total standard cost applied is referredto as ________________.
2. The difference between what was paid for inputs and what should have been paid for inputsis referred to as a ________________.
3. The difference between standard quantity allowed and quantity used for a unit of output isknown as an ________________.
4. The difference between actual variable overhead and budgeted variable overhead basedupon actual hours is referred to as the ________________.
5. The difference between actual and budgeted fixed factory overhead is referred to as a________________.
6. When multiple materials are used, the effect of substituting a non-standard mix of materialsduring the production process is referred to as a ________________ variance.
7. When multiple labour categories are used, the financial effect of using a different mix ofworkers in a production process is referred to as a ________________ variance.
[Ans.: 1. Total Variance, 2. Price Variance, 3. Efficiency Variance, 4. Variable OverheadSpending Variance, 5. Fixed Overhead Spending Variance, 6. Material Mix, 7. Labor Mix
II. True or False1. Specifications for materials are compiled on a bill of materials.2. An operations flow document shows all processes necessary to manufacture one unit of a
product.3. A standard cost card is prepared before developing manufacturing standards for direct
materials, direct labour, and factory overhead.4. The total variance can provide useful information about the source of cost differences.5. The formula for price/rate variance is (AP - SP) x SQ

Standard Costing and Variance Analysis160
6. The price variance reflects the difference between the quantity of inputs used and thestandard quantity allowed for the output of a period.
7. The usage variance reflects the difference between the price paid for inputs and the standardprice for those inputs.
8. The formula for usage variance is (AQ - SQ) * SP9. The point of purchase model calculates the materials price variance using the quantity of
materials purchased.10. The difference between the actual wages paid to employees and the standard wages for all
hours worked is the labor rate variance.11. The difference between the standard hours worked for a specific level of production and the
actual hours worked is the labor rate variance.12. A flexible budget is an effective tool for budgeting factory overhead.
[Ans.: 1. True, 2 .True, 3. False, 4. False, 5. False, 6. False, 7. False, 8. True, 9. True,10. True, 11. False, 12. True]
III. Multiple Choice. Write the Letter Only for your Best Answer.1. A primary purpose of using a standard cost system is
(a) to make things easier for managers in the production facility.(b) to provide a distinct measure of cost control.(c) to minimize the cost per unit of production.(d) b and c are correct.
2. The standard cost card contains quantities and costs for(a) direct material only(b) direct labor only.(c) direct material and direct labor only(d) direct material, direct labor, and overhead.
3. Which of the following statements regarding standard cost systems is true?(a) Favorable variances are not necessarily good variances.(b) Managers will investigate all variances from standard(c) The production supervisor is generally responsible for material price variances.(d) Standard costs cannot be used for planning purposes since costs normally change in the
future.4. In a standard cost system, Work in Process Inventory is ordinarily debited with
(a) actual costs of material and labor and a predetermined overhead cost for overhead(b) standard costs based on the level of input activity (such as direct labor hours worked).(c) standard costs based on production output.(d) actual costs of material, labor, and overhead.
5. A standard cost system may be used in(a) job order costing, but not process costing(b) process costing, but not job order costing.

Standard Costing and Variance Analysis 161
(c) either job order costing or process costing.(d) neither job order costing nor process costing.
6. Standard costs may be used for(a) product costing.(b) planning.(c) Controlling.(d) all of the above.
7. A purpose of standard costing is to(a) replace budgets and budgeting(b) simplify costing procedures.(c) eliminate the need for actual costing for external reporting purposes.(d) eliminate the need to account for year-end under-applied or over-applied
manufacturing overhead.8. Standard costs
(a) are estimates of costs attainable only under the most ideal conditions.(b) are difficult to use with a process costing system(c) can, if properly used, help motivate employees.(d) require that significant unfavourable variances be investigated, but do not require that
significant favorable variances be investigated.9. A bill of material does not include
(a) quantity of component inputs.(b) price of component inputs(c) quality of component inputs.(d) type of product output.
10. An operations flow document(a) tracks the cost and quantity of material through an operation.(b) tracks the network of control points from receipt of a customer's order through the
delivery of the finished product.(c) specifies tasks to make a unit and the times allowed for each task.(d) charts the shortest path by which to arrange machines for completing products.
11. A total variance is best defined as the difference between total(a) actual cost and total cost applied for the standard output of the period.(b) standard cost and total cost applied to production.(c) actual cost and total standard cost of the actual input of the period.(d) actual cost and total cost applied for the actual output of the period.
[Ans.: 1. (b), 2. (d), 3. (a), 4. (c), 5. (c), 6. (d), 7. (b), 8. (c), 9. (b), 10. (c), 11. (d)]
____

UNIVERSITY PROBLEMS ANDSOLUTIONS
Q.1. Following relevant data of a firm is givenActivity Levels (tons)
Particulars 50,000 tons 60,000 tons 70,000 tons 80,000 tonsVariable Cost (` in thousands) 5,000 6,000 7,000 8,000Semi-variable cost (` in thousands) 1,500 1,600 1,650 1,700Fixed cost (` in thousands) 2,500 2,500 2,500 3,000Total Cost (` in thousands) 9,000 10,100 10,100 12,700
The fixed costs follow step-grap pattern as is clear from the above and the semi-variablecosts change at uniform rate between the above given activity levels. Given that the firmoperates at 55,000 tons level at present.(A) Calculate the additional/incremental costs if it manufactures additional (a) 10,000 tons
(b) 15,000 tons and(B) Advise whether the firm should accept ‘any one’ of the following additional (special)
export market offers and if Yes, ‘which one’ should it accept:(i) for 10,000 tons at a selling price of ` 125/- per ton.
(ii) for 15,000 tons at a selling price of ` 150/- per ton.Solution:
Pressure level = 55,000 tons(I) Calculation of Additional / Incremental Cost
Particulars 10,000 tons(` in ’000)
15,000 tons(` in ’000)
Variable Cost 1,000 1,500Semi-variable cost 75* 100Fixed cost – 500Additional/Incremental cost (A) 1,075 2,1002. Incremental Revenue: (` in 000) (` in 000)
(B) (i) 1,250 2,250 (ii)Incremental profit (B– A) 175 150
Advice: Since the firm is getting an incremental profit of ` 175 (000) and ` 150 (000) inadditional activity of 10,000 tons and 15,000 tons respectively. Hence, lower level offershould be accepted.
Q.2. A manufacturing company uses the following standard mix of their compound in one batch of100 kgs. of its production time:50 kgs of material X at the standard price of ` 2.

University Problems and Solutions 163
30 kgs of material Y at the standard price of ` 3.20 kgs of material Z at the standard price of ` 4.The Actual mix for a batch of 120 kgs was as follows:60 kgs of material X at the price of ` 3.40 kgs of material Y at the price of ` 2.5.10 kgs of material Z at the price of ` 3.Calculate the different materials variances.
Solution:Manufacturing Co.
ProductsStandard Actual
Kg. Rate Amount Kg. Rate AmountX 50 2 100 60 3 180Y 30 3 90 40 2.5 100Z 20 4 80 10 3 30
100 270 110 310Loss – – 10 –
100 270 120 310(1) Material Cost Variance = Std. Coat – Actual Cost
= 270 – 310= 40 (A)
(2) Material Price Variance (MPV)= Actual Quantity (SP – AP)X: 60 (2-3) = 60 (A)Y: 40 (3-2.5) = 20 (F)Z: 10 (4-3) = 10 (F)
30 (A)(3) Material Usage Variance:
SP (SQ – AQ)X: 2 (50 – 60) = 20 (A)Y: 40 (30 – 40) = 30 (A)Z: 10 (20 – 10) = 40 (F)
10 (A)MCV = MPV + MUV
= 30(A) + 10 (A)= 40 (A)
Revised Standard Quantity
X =10050 × 110 = 55
Y =10030 × 110 = 33
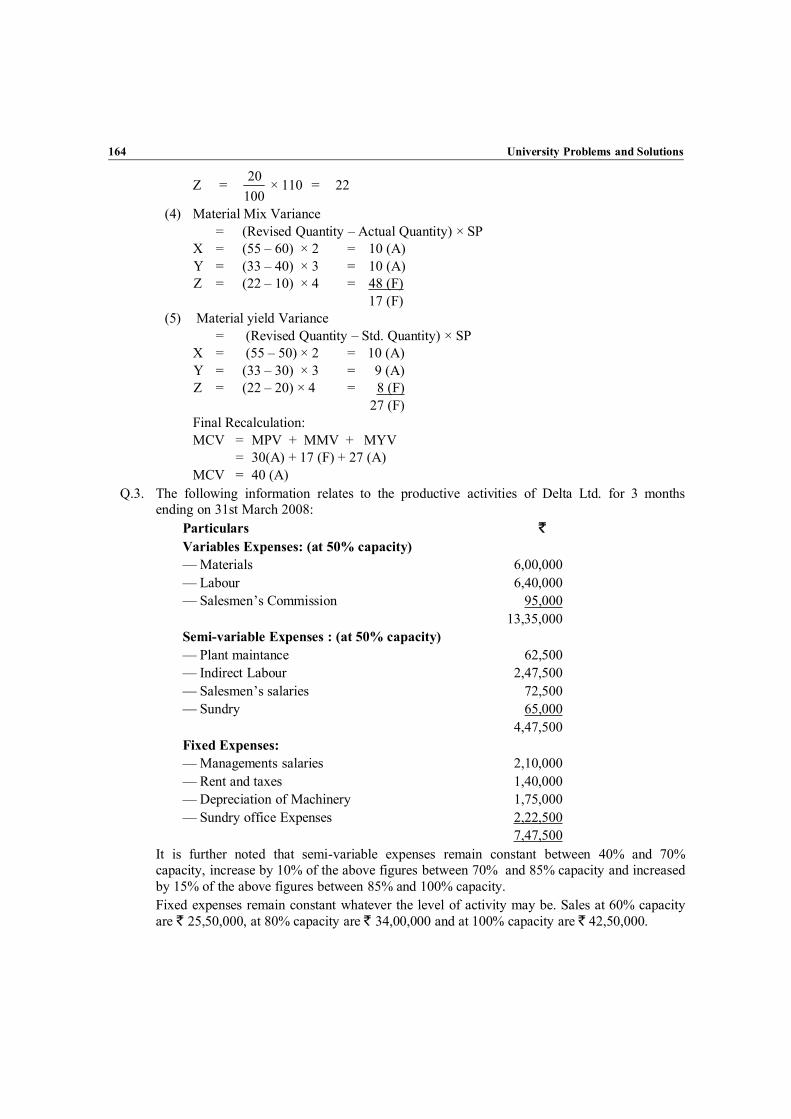
University Problems and Solutions164
Z =10020 × 110 = 22
(4) Material Mix Variance= (Revised Quantity – Actual Quantity) × SP
X = (55 – 60) × 2 = 10 (A)Y = (33 – 40) × 3 = 10 (A)Z = (22 – 10) × 4 = 48 (F)
17 (F)(5) Material yield Variance
= (Revised Quantity – Std. Quantity) × SPX = (55 – 50) × 2 = 10 (A)Y = (33 – 30) × 3 = 9 (A)Z = (22 – 20) × 4 = 8 (F)
27 (F)Final Recalculation:MCV = MPV + MMV + MYV
= 30(A) + 17 (F) + 27 (A)MCV = 40 (A)
Q.3. The following information relates to the productive activities of Delta Ltd. for 3 monthsending on 31st March 2008:
Particulars `Variables Expenses: (at 50% capacity)— Materials 6,00,000— Labour 6,40,000— Salesmen’s Commission 95,000
13,35,000Semi-variable Expenses : (at 50% capacity)— Plant maintance 62,500— Indirect Labour 2,47,500— Salesmen’s salaries 72,500— Sundry 65,000
4,47,500Fixed Expenses:— Managements salaries 2,10,000— Rent and taxes 1,40,000— Depreciation of Machinery 1,75,000— Sundry office Expenses 2,22,500
7,47,500It is further noted that semi-variable expenses remain constant between 40% and 70%capacity, increase by 10% of the above figures between 70% and 85% capacity and increasedby 15% of the above figures between 85% and 100% capacity.Fixed expenses remain constant whatever the level of activity may be. Sales at 60% capacityare ` 25,50,000, at 80% capacity are ` 34,00,000 and at 100% capacity are ` 42,50,000.

University Problems and Solutions 165
Assuming that all items produced are sold, you are required to prepare a flexible budget at60%, 80% and 100% capacity.
Solution:In the Books of Delta Ltd.
Flexible Budget for 3 months ending 31.03.2008
Capacity 60% 80% 100%A. Fixed Expenses:
Management Salaries 2,10,000 2,10,000 2,10,000Rent and Taxes 1,40,000 1,40,000 1,40,000Depreciation on Machinery 1,75,000 1,75,000 1,75,000Sundry office Exp. 2,22,500 2,22,500 2,22,500Total (A) 7,47,500 7,47,500 7,47,500
B. Semi-variable Expenses:Plant Maintenance 62,500 68,750 71,875Indirect Labour 2,47,500 2,72,250 2,84,625Salesmen Salaries 72,500 79,750 83,375Sundry 65,000 71,500 74,750Total (B) 4,47,500 4,92,950 5,14,625
C. Variable Expenses:Materials 7,20,000 9,60,000 12,00,000Labour 7,68,000 10,24,000 12,80,000Salesman Commission 1,14,000 1,52,000 1,90,000Total (C) 16,020,00 21,36,000 26,70,000
D. Total Exp. (A+B+C) 27,97,000 33,75,750 39,32,125E. Sales 25,50,000 34,00,000 42,50,000F. Profit/Loss (2,47,000) 24,250 3,17,875Q.4. (b) You are given the following information for the next year:
Particulars `
Sales (10,000 units) 1,20,000Variables Cost (10,000 units) 48,000Fixed Cost 60,000
1. Find out the P.V. ratio and Break-even point.2. Evaluate the effect of following on P.V. ratio and Break-even point.
(a) 10% decrease in variable cost(b) 10% decrease in Fixed cost(c) 10% increase in physical sales volume(d) 5% increase in selling price.

University Problems and Solutions166
Solution:Calculation of PV ratio and BEPContribution = Sales – Variable Cost
72 = 1,20,000 – 48,000Case PV Ratio B.E.P.
RatioV/PFC
(1)Existing
000,20,1000,72
× 1 W = 60%%60000,60
= 1,00,000
(2) (a) 10% decrease in variable cost contribution= 1,20,000 – [48,000 – 10%]= 76,800
000,20,1800,76
× 100 = 64%
60,00064%= 93,750
(b) 10% decrease inchangeNo
CostFixed= 60%
FC = 60,000 – 6,000= 54,000
%60000,54
= 90,000
(c) 10% increase in sale volumeNew sale = 1,20,000 × 10% of 1,20,000
= 1,32,000C = 1,32,000 – 48,000 = 84,000
000,32,1000,84
× 100 = 63.63%
%63.63000,60
= 94,295
(d) 5% increase in selling price
SP/unit =000,10000,20,1
= 12
5% increase 0.60Revised S. P. 12.60Contribution = 12.60 – 4.80
= 7.80
W160.1280.7
= 61.90%
%90.61000,60
= 96,930
Q.5. Write short notes on (any four):-(a) Inter-link of Budgetary control and variance analysis;(b) Uitility of Standard Costing;(c) Different types of budgets useful for a typical business enterprise;(d) Implications of the angle of incidence;(e) Special features of Operating costing;(f) Imporantance of marginal costing in decision making function.
University Problems and Solutions 167
Solution:(a) Inter-link of Budgetary Control and Variance Analysis
The word 'budget' is derived from the french term "Budget" which denotes a leatherpouch in which funds are appropriated for meeting anticipated expenses. A budget isquantitative expression of plan of action. It is a plan of the target to be achieved withina specified period. It is final and approved forecast. When the forecasts are approvedby the management as a tentative plan for the future they become budget.Budgetary Control is a mean of control in which the actual state of affairs is comparedwith that planned for so that appropriate action may be taken of with regard to anydeviations before it is too late.According to the Institute of Cost & Management Accountants England "BudgetaryControl is the establishment of budget relating to the responsibilities of the executivesto the requirements of a policy and the continuous comparison of actual with thebudgeted results either to secured by individual action, the objective of the policy or toprovide the basis for its revision."Thus Budgetary Control Involves: (a) Establishment of budget, (b) ContinuousComparisons of the actual with the budgeted performance to fix responsibility ofpersons for failure to achieve the targets, and (c) Revision of the budgets in the light ofchanged circumstances.There are two steps in the process of budgetary control — Preparation of budget andimplementation of the budget programme. Each sectional manager prepare budget forhis section and submit the same to the sectional managers who prepares a consolidatedbudget for the department. The different budgets from different departments areconsolidated and into the master budget by a budget committee under the chairmanshipof an executive powerful enough to ensure prompt action and co-operation.Preliminaries Required for Adoption of a System of Budgetary Control:1. Budget Centres: Budget Centre is a section of an organisation of a undertaking for
the purpose of budgetary control. Budget centres or departments should beestablished for each of which budget will be set with the help of the head of thedepartment concerned.
2. Accounting Records: A prerequisite to the establishment of budgetary controlsystem is that accounting system should be able to record and analyse accountinginformation.
3. Organisation Chart: Organisation Chart defines the functions and responsibilitiesof each members of the management and ensure that each one knows his position inthe organisation and his relationship to other members.
4. Budget Committee: A budget Committee Consists of several members of the topmanagement group. This committee will set the general guideline that theorganisation is to follow and co-ordinate the separate budgets prepared by variousorganisational units.
5. Budget Manual: Budget manual is a document which sets out the responsibilitiesof the persons engaged in the organisation. It is usually in printed from and formindex is provided so that information can be quickly located.
6. Fixation of Budget Period: Budget period is the period for which the budget isprepared and employed. There is no right period for every budget. It may vary

University Problems and Solutions168
between short term and long term. Long term budgeting may be considerablyaffected by the unforeseen conditions.
7. Key Factors: Key factor is the factor the extent of whose influence must beassessed in order to ensure that functional budgets are reasonably capable offulfilment Key factor is also known as "limiting" on "governing" or "principalbudget" factors. Sale is the most often the key factor in an industry. .
Variance Analysis: There is no uniformity of opinion as to the proper disposition ofvariances. Some cost accountants argue that variances of all types should be transferredto Costing Profit and Loss A/c. A second group of cost accountants are of opinion thatthe variances at the end of the year should be properly distributed over closing stockand cost of sales, so that both these times are shown at actual cost in financialstatements. Although these two methods are easy to apply and may be used forpractical purposes, the variances are not disposed of in accordance with the bestaccounting practice. According to the strict principles of cost accounting each varianceshould be carefully analysed so that causes of the same be ascertained. Then eachvariance should be disposed of in accordance with the underlying reasons for itsexistence. All variances which are the result of controllable operation should betransferred to Costing Profit and Loss A/c. On the .other hand, these variances whichare the result of uncontrollable conditions like changes in material prices, wage ratechanges, etc. should be apportioned to inventories and cost of goods sold on someequitable basis.
(b) Utility of Standard CostingStandard costing is defined as the preparation and use of standard costs, their,comparison with actual costs and the measurement and analysis of variances to theircauses and points of incidence. Standard cost a predetermined cost is calculated fromthe management's standard of efficient operation and the relevant necessaryexpenditure. Standard costing play an important role in cost control and cost reduction.1. As a Measuring Yardstick of Performance: Standard costing system establishes
yardsticks against which the efficiency or inefficiency of actual performance aremeasured. Standard may be set in respect of the prices and quantity of materials,labour time and wage rates, production etc. These standards are used to measure theperformance e.g. standards quantity of material specified for a particular job can betaken as a basis (standard) to control the actual usage of material. By calculatingvariance analysis the management can study the reason for deviation.
2. As a Basis of Inventory Valuation: Under standard costing valuation of inventorybecome simple. The valuation of inventory is made at standard costs and anydifference between the actual costs and standards may be transferred to varianceaccount. Thus, standard costing enables to maintain uniform pricing of raw material,work in progress and finished goods.
3. As an Aid in Preparing Earning Budget: Estimation of standard cost for eachand every element of cost helps the management in estimating the earning too.Under the system of standard costing the output is valued at costs and the estimatedearnings are also based on standard selling price of output is valued at costs and theestimated earnings to be realised during a given period can be calculated on thebasis of difference between the standard costs and standard selling price. This isuseful in preparation of earning subject.

University Problems and Solutions 169
4. As a Guide in Fixing Selling Price: Standard costing is very useful to themanagement in formulation of pricing policy for the products. The normalprocedure is to add a certain margin of profit to the standard costs of the product.However, depending upon the marketing conditions this margin may vary fromtime to time. Normally the market price is influenced by the forces of demand andsupply. Pricing policies may be formulated in advance before production starts.This helps in prompt decision making.
(c) Different Types of Budgets Useful for a Typical Business EnterpriseA functional budget is one which relates to any of the function or activities of anorganisation. The function determine the scope of activities of various departments.Each department has to prepare its own budget. Functional budget is "a Budget ofincome or expenditure appropriate to, or the responsibility of a particular function(CIMA). All the functional budgets are summarised into what is known as "masterbudget. These functional budgets are thus subsidiary budgets of the "master budget".There are several types of functional budgets depending upon the structure oforganisation and need of control in each case. However, generally the following typesof budgets are prepared:(i) Sales Budget: This budget is prepared by sales manager. Preparation of sales
budget is the most difficult job since it is very difficult to estimate future demandsof a product. This is probably the most important budget as all other budgetsdepend on the sales budget.
(ii) Production Budget: The budget is prepared by production manager. It shows thequantity of products to be manufactured.
(iii) Production Cost Budget: This budget is also known as manufacturing budget. It isthe quantity of goods to be manufactured expressed in terms of cost.This budget consists of three subsidiary budgets:(a) Materials budget(b) Labour cost budget(c) Manufacturing overhead budgets.
(iv) Purchase Budget: This budget lays down the quantity of materials to be purchasedfrom month to month to ensure smooth production.
(v) Cash Budget: This represents the cash receipt and cash payments and estimatedcash balance for each month of the period for which budget is prepared. Cashbudget is a device for controlling and coordinating the financial side of a business.
(vi) Capital Expenditure Budget: It shows the planned outlay on fixed assets to beacquired during the budget period. Every care must be taken before preparing thisbudget.
(vii) Selling and Distribution Cost Budget: This budget is a forecast of selling anddistribution expenses for the company's products during the budget period. Thisbudget is closely connected with sales budget as selling and distribution expenseswill be in proportion to sales.
(viii) Research and Development Cost Budget: Research cost means the cost ofsearching for a new or improved products, new applications of materials, or new orimproved method.

University Problems and Solutions170
Development cost is the cost of the process which begins with the implementationof the decision to produce a new or improved product or to employ a new orimproved method.
(d) Implications of the Angle of IncidenceIt is formed by the intersection of sales line and total cost line at the Break Even Point.It shows the rate at which the organisation is earning profit once the BEP is reached.This angle provides useful in formation about the rate at which profits are being made.The large the angle the higher the rate of profit and vice-versa. The angle of incidencecan be studied in conjunction with margin of safety. A large angle of incidencetogether with a high margin of safety indicates an extremely favourable situation. Thiscan be shown by plotting a Break-Even Chart.
(f) Importance of Marginal Costing in Decision Making FunctionIn marginal costing, it is presumed that variable costs are related to output and Fixedcosts are related to the period. Fixed costs are charged off to the P&L A/c.Marginal costing necessitates the analysis of costs into fixed and variable. These typesof costs behave differently with changes in the volume of output. The variable costvaries directly in proportion to change in the volume of output, which means thatvariable cost per unit remains constant regardless of the levels of output. Fixed costs,on the other hand, remain fixed at the same level regardless of changes in the volumeof output, and vary per under inversely with the change in total with time rather thanwith the level of output. For this reason fixed costs are also known as time or periodcosts because they accrue with the passage of time irrespective of the volume of output.Fixed cost is also called by other names like standby cost, constant cost, capacity cost,etc. Variable costs are also known as product costs as these are related to volume ofoutput. Variable cost is also termed as direct cost, marginal cost, activity cost, volumecost, or out-of pocket cost. Semi-variable cost is one which is partly fixed and partlyvariable. The fixed part of this cost is segregated and merged into the variable cost.Marginal costing is basically concerned with the determination of product cost whichconsists of the total costs less the fixed costs i.e. direct materials, direct labour, direct

University Problems and Solutions 171
expenses and variable overhead. Thus, marginal cost is the variable cost (which formspart of product cost) and does not include fixed cost. Fixed costs are not included in thecost of production because the former bear relation to certain period of time and alsovary per unit of production.The technique of marginal costing is a valuable aid to management for decision makingin many key areas such as the following:
(a) The price at which a product should be sold.(b) Determination of volume of output.(c) Utilisation of surplus capacity.(d) Submission of tenders and quotations.(e) Acceptance of special order e.g. export order.(f) Make or buy a component.(g) Economic feasibility of major (capital) projects.(h) Replacement of a machinery.(i) Determining optimum product or sales mix.(u) Operate the plant or shut it down, etc.(k) Suspension or permanent closing down of a business.
Q.6. The following particulars are taken from the records of the company engaged inmanufacturing two products, A and B, from a certain material:
Particulars Product A (per unit) Product B (per unit)Sales 2,500 5,000Material cost (` 50 per kg) 500 1,250Direct labour (30 per hour) 750 1,500Variable overheads 250 500
Total fixed overheads: ` 10,00,000(a) Comment on the profitability of each product when:
(i) Total sales in value is limited.(ii) Raw materials is in short supply.
(iii) Production capacity (labour) is the limiting factor.(b) When total availability of raw materials is 20,000 kg and maximum sales potential of
each product is 1,000 units, find the product mix to yield maximum profits.Solution:
Statement of Evaluation product A & B
ParticularsProduct A Product B
` ` ` `Sales 2,500 5,000(-) Variable Costs:Materials Cost 500 1,250Direct labour 750 1,500Variable overhead 250 1,500 500 3,250Contribution/unit 1,000 1,750

University Problems and Solutions172
Product A Product B1.
P/V ratio =SC × 100 =
500,2000,1 × 100
= 40%
=000,5750,1 × 100
= 35%2. Material (Kg)/Unit
=50
500
= 10 kg
=50250,1
= 25 kg3. Contribution/kg of material
=10000,1
= ` 100
=25750,1
= ` 704. Labour Hrs./Unit
=30
750
= 25 hrs.
=30500,1
= 50 Hrs.5. Contribution/Labour Hr.
=25000,1
= ` 40
=50750,1
= ` 35(a) (i) Comment of the profitability of each product when total sales value is limited:
Product A has a higher P/V ratio than Product B, hence product A is moreprofitable.
(ii) Comment on profitability of each product when raw material is in short supply:-Product A has a higher contribution per kg raw materials than product B. Henceproduct A is more profitable.
(iii) Comment on the profitability of each product when production capacity (labour) isthe limiting factor:Product A has a higher contribution per labour Hours than Product B. Henceproduct A is more profitable.
(b) When raw materials and sales quantity both are limiting factors:Statement of product Mix to yield maximum profits
(Availability of Raw Materials is limited to 20000 kg)
Products Product A Product BUnits to be made 1000 400Raw material consumption 10,000 10,000
(1,000 units × 10 kg) (400 units × 25 kg)Contribution per Unit ` 1000 ` 1,750Total Contribution ` 10,00,000 ` 7,00,000Total contribution (A + B) ` 17,00,000(–) fixed Cost ` 10,00,000Profit 7,00,000

University Problems and Solutions 173
Q.7. In a factory the standard mix consists of 60 kgs of X and 40 kgs of Y. The standard loss ofproduction is 30%. The standard price of X is ` 5 per kg. and of Y ` 10 per kg.The actual mixture and yield were as follows;X :- 80 kgs at ` 4.50 per kg. Y :- 70 kgs at ` 8 per kg. Actual yield :- 115 kgs.Calculate:
(a) Material Cost Variance(b) Material Price Variance(c) Material Revised Usage Variance(d) Material Mix Variance, and(e) Material Yield Variance.
Solution:Materials Standard Actual Std. Cost of Actual Mix
Kg Rate Total Kg Rate Total Kg Rate TotalX 90 5 450 80 4.50 360 80 5 400Y 60 10 600 70 8.00 560 70 10 700
150 1050 150 920 1100Loss 45 35 –Output 105 115 920 1100
Std. Rate of Std. Mix =150
1050 = ` 7 kg
Std. Rate of Actual Mix =150
1100 = 7.33
Std. Cost of Std. Mix in terms of Actual yield =150
1050 × 115 = 1150
Computation of Variances:(a) Material Cost Variance
= Actual Cost of Actual Mix – Std. Cost of Std. Mix in terms if actual mix= 920 – 1150 = 230 (F)
(b) Materials price variance = AQ (SR – AR)X = 80 (5 – 4.50) = 40 (F)Y = 70 (10 – 8.00) = 140 (F)
180 (F)(c) Material revised Usage Variance
= Actual Quantity 5 Std. Rate of Actual Mix = 1100(-) Std. Cost of Std. Mix in terms of Actual yield = 1150
50 (F)(d) Material Mix Variance =
Actual Quantity × Std. Rate of Actual Mix = 1100(–) Actual Quantity × Std. Rate of Std. Mix = 1050
50 (A)

University Problems and Solutions174
(e) Material Yield Variance =Actual Quantity × Std. Rate of Std. Mix = 1050
(–) Std. Cost of Std. Mix in terms of Actual yield = 1150100 (F)
Reconciliation:MCV = MPV + MMV + MYV
= 180 (F) +50 (A) + 100 (F)= 230 (F)
Q.8. V.N. Ltd. operates on a standard cost system to produce an article mixing two raw materialsand following are the standards:-40% of Material A at ` 4 per kg., 60% of Material B at ` 3 per kg.A standard loss of 15% is expected in production.The following actual cost data is given for March, 2010 (Production: 1700 kg of finishedproduct):-
Stock on 1.3.2010 Stock on 31.3.2010 Purchase for March, 2010Kgs. `
Materials A 35 Kgs. (no. Variance) 5 kgs. 800 3,400Materials B 40 Kgs. (no. Variance) 50 kgs. 1,200 3,000
Calculate the following variances in respect of the purchase during the month that areconsumed :-
(a) Material Price Variance(b) Material Mix Variance(c) Material Yield Variance(d) Material Cost Variance(e) Material Usage Variance.
Solution:
Types of MaterialsStandard Actual
Qty Rate Amount Qty Rate AmountA 800 4 3,200 354 4.00 140.00
795 4.25 3,378.75B 1200 3 3,600 40 3.00 120.00
1150 2.50 2,875.00Total 2000 6,800 2020 6,513.75Less Std. Loss 15% 300 320
1700 6,800 1700 6,513.75

University Problems and Solutions 175
(a) Materials Price Variances (MPV):Material A: Since the actual price and standard price of 35 kg of Raw materials are thesame, there will be no price variance in respect of this quantity. Price variance will bein respect of only 795 Kg as shown below:AQ (SR - AR)795 (4 - 4.25) = 198.75 (A)Material B: Similarly, in respect of Material B, Price variance will be in respect of1150 Kg only as shown below:1150 (3 – 2.5) = 575 (F) .Total MPY = 198.75 (A) + 575 (F) = 376.25 (F)
(b) Material Usage Variance (MUV) = SR (SQ – 40)A = 4 (800 - 830) = 120 (A)B = 3 (1200 - I 190) = 30 (F)
90 (A)(c) Material Yield Variance
= Std. Cost per Unit (Std. Output for Actual Mix – Actual output)
= 4
1700–2020
20001700
= 4 × (1717 – 17000)= 4 × 17 = 68 (A)
(d) Material Mix (MMV)= Std. Rate (Revise std. Qty. – Actual Quantity)Revise Std. Qty.
A =20002020 × 800 = 808
B =20002020 × 1200 = 1212
A = 4 × (808 – 839) = 88 (A)B = (1212 – 1190) × 3 = 66 (F)
22 (A)(e) Material Cost Variance (MCV)
= Std. Cost for Actual output – Actual cost= 6800 – 6513.75= 286.25 (F)Verification:MCV = MUV + MPV
= 90(A) + 376.25 (F) = 286.25 (F)MUV = MMV + MYV
= 22(A) + 68(A) = 90A

University Problems and Solutions176
Working Notes:1. The Std. Loss being 15% it means to produce 1700 Kg. of article, std. Quantity of
material required is
85100 × 1700 Kg. = 20000 Kg.
A = 40% of 2000 = 800B = 60% of 2000 = 1200
2. Std. Cost per unit =output.Std
Cost.StdTotal =17006800 = ` 4/unit
Q.9. The following are the estimated sales of a company for eight months ending 30. 11.2008Months Estimated Sales (Units)April 2008 12,000May 2008 13,000June 2008 9,000July 2008 8,000August 2008 10,000September 2008 12,000October 2008 14,000November 2008 12,000
As a matter of policy, the company maintains the closing balance of finished goods and rawmaterials as follows :-Stock Items Closing balance of a monthFinished goods 50% of the estimated sales for the next monthRaw Materials Estimated consumption for the next month.Each unit of production requires 2 kg. of raw material costing ` 5 per kg.Prepare Production Budget (in units) and Raw Material Purchase Budget (in units and cost) ofthe company for the half year ending 30th September, 2008.
Production Budget (in Units)For the half year ending 30th Sept 2008
Month Sales in Units Closing Bal. 50% ofestimated sales for next
month
Opening bal. Production (2 + 3 – 4)
April 12,000 6,500 6,000 12,500May 13,000 4,500 6,500 11,000June 9,000 4,000 4,500 8,500July 8,000 5,000 4,000 9,000Aug. 10,000 6,000 5,000 11,000Sept. 12,000 7,000 6,000 13,000
64,000 65,000

University Problems and Solutions 177
Purchase Budget (in Cost and Units)For the half year ending 30th Sept. 2008
Month Productionin Units
ConsumptionKg. ` 2/- per
unit
ClosingBalance
OpeningBalance
Purchase inKg.
Rate Amount
April 12,500 25,000 22,000 25,000 22,000 5 1,10,000May 11,000 22,000 17,000 22,000 17,000 5 85,000June 8,500 17,000 18,000 17,000 18,000 5 90,000July 9,000 18,000 22,000 18,000 22,000 5 1,10,000Aug 11,000 22,000 26,000 22,000 26,000 5 1,30,000Sept. 13,000 26,000 26,000 26,000 26,000 5 1,30,000
65,000 1,30,000 1,30,000 6,55,000
Q.10. X Ltd. furnishes you the following particulars:-Product X requires 20 hours per unitStandard rate per hour is ` 2Units produced: 4,000Hours taken 76,000 (including 200 hours for power failure) at ` 2.10 per hour.Calculate :-
(i) Direct Labour Cost Variances(ii) Direct Labour Rate Variances
(iii) Direct Labour Efficiency Variances(iv) Direct Labour Idle Time Variances
Solution:(i) Labour Cost Variance (LCV) = (SCL – ACL)
= (4,000 × 2 × 20 – 76,000 × 2.10)= 1,60,000 – 1,59,000 = 400 (F)
(ii) Labour Rate Variance = Actual Hours (SR – AR)= 76000 (2 – 2.10) = 7600 (A)
(iii) Labour Efficiency Variance = SR (SH – AH)= 2 (80,000 – 75,800)= 8400 (F)
(iv) Labour Idle Time Variance = Idle time × Std. Rate= 200 × 2 = 400 (F)
Verification:LCV = LRV + LEV + LITV400 (F = 7600 (A) + 84000 (F) + 400 (A)
Q.11. From the following data of a concern, find out the Fixed Costs, P/V ratio and Break-evenSales :-
Sales (`) Profit (`)First half-year 14,433 385Second half-year 18,203 1,139

University Problems and Solutions178
Also calculate:(i) Profit or Loss at sales of ` 12,000.
(ii) Sales required to earn a profit of ` 2,000.(iii) Margin of safety at sales of ` 24,000.
Solution:Particulars First half Second half DifferenceSale (`) 14,433 18,203 3,770Profit (`) 385 1,139 754Total Cost 14,048 17,064 3,016
(i) P/V Ratio =SalesinChangeprofitinChange × 100
=770,3
754 × 100 = 20%
(ii) Fixed Cost = Sales – VC – Profit2,502 = 14,433 – 11,546 – 385
(iii) BES =RatioV/P
FC
=%20
502,2 = 12,510
Further Calculation:(i) Profit or loss at sales of ` 12,000
Sales =RatioV/PPF
12,000 =%20
P502,2
2,400 = 2,502 – Por profit/Loss = 2,400 – 2,502
Loss = (102)(ii) Sale required to earn a profit of ` 2,000
Sales =RatioV/PPF
=%20
000,2502,2
=%20
502,4 = ` 22,510
(iii) MoS at a sale of ` 24,000MoS = Actual Sales – BE Sales
= 24,000 – 12,510= 11,490

University Problems and Solutions 179
Or
=000,24490,11 × 100
= 47,875% of sale.Q.12. A company manufacturing a particular product the standard direct materials cost of which is
` 10 per unit. The following information is obtained from the costing records:-(a) Standard Mix:
Material Quantity(Units)
Rate(`)
Amount(`)
A 70 10 700B 30 5 150
100 850Loss: (15%) 15 —
85 850
(b) Actual results for June, 2008:Material Quantity
(Units)Rate(`)
Amount(`)
A 400 11 4,400B 200 6 1,200
600 5,600Loss: (10%) 60 —
540 5,600Compute:(i) Total Material Cost Variance;
(ii) Material Price Variance;(iii) Material Mix Variance;(iv) Material Yield Variance;(v) Material Usage Variance;
Solution:Calculation of Variances :
(i) Total Material Cost Variance :Std. Cost for Actual output – Actual cost= 540 × 10 – 5,600 = 200 (A)
(ii) Material Price Variance :AQ (SR – AR)A = 400 (10 – 11) = 400 (A)B = 200 (5 – 0) = 200 (A)
600 (A)(iii) Material Mix Variance (MMV) :
SR (Revised Std. Quantity - Actual Quantity)

University Problems and Solutions180
A: 10 (420 – 400) = 200 (F)B: 5 (180 – 200) = 100 (A)
Total 100 (F)(iv) Material Yield Variance (MYV):
Std. Cost per unit (Std. output for Actual mix – Actual output)10 (510 – 540) = 300 (F)
(v) Material Usage Variance :SR (SQ – AQ)
A = 10
400–
17560,7 = 447 (F)
B = 5
200–
17240,3 = 147 (A)
Total = 400 (F)Verification:MCV = MPV + MUV
= 600 (A) + 400 (F) = 200 (A)MUV = MMV + MYV
= 100 (F) + 300 (F) = 400 (F)Working Notes:
1. Std. quantity for Actual Output
= outputActualOutput.Std
Quantity.Std
Material A:8570 × 540 =
17560,7 Units
B:8530 × 540 =
17240,3 Units
2. Revised Std. Quantity
= MixActualOutput.Std
Quantity.Std
Material A:10070 × 600 = 420 Units
B:10030 × 600 = 180 Units
3. Std. Output for Actual Mix
= MixActualMix.Std
Output.Std
=10085 × 600 = 510 Units

University Problems and Solutions 181
Q.13. Write short note of the following:Difference between ‘Fixed’ and ‘Flexible’ budget
Solution:Difference between ‘Fixed’ and ‘Flexible’ budget: A budget may be flexible or fixeddepending upon its capacity to change according to change in the level of activity. The maindifferences between Flexible Budget and Fixed Budget are as follows:
Fixed Budget Flexible’ Budget1. Definition: It is a Budget desired to remain
unchanged irrespective of the level of activityactually attained.
It is a Budget, which by recognising the differencebetween fixed, semi-variable and variable costs isdesigned to change in relation to level of activityattained.
2. Rigidity: It does not change with actual volumeof activity achieved. Thus it is known as aRigid or Inflexible budget.
It can be re-casted on the basis of activity level to beachieved. Thus it is not rigid.
3. Level of Activity: It operates on one level ofactivity and under one set of conditions. Itassumed that there will be no change in theprevailing conditions, which is unrealistic.
In consists of various budgets for different levels ofactivity.
4. Effects of Variance Analysis: VarianceAnalysis does not give useful information as allcosts (fixed variable and semi-variable) arerelated to only one level of activity.
Variance Analysis provides useful information aseach cost is analysed according to its behaviour.
5. Use of Decision Making: If the budgeted andactual activity levels differ significantly, thenaspects like cost ascertainment and pricefixation do not give a correct picture
It facilitates the ascertainment of cost, fixation ofselling price and submission of quotations.
6. Performance Evaluation: Comparison of actualperformance with budgeted targets will bemeaningless, especially when there is adifference between two activity levels.
It provides a meaningful basis of comparison of theactual performance with the budgeted targets.
Q.14. From the following particulars, you are required to calculate:(i) PN ratio
(ii) B.E.P. for sales(iii) Margin of safety(iv) Profit when sales are ` 2,00,000/-(v) Sales required to earn net profit of ` 40,000/-
Year Sales (`) Profit (`) UnitsI 2,40,000 18,000 24,000II 2,80,000 26,000 28,000

University Problems and Solutions182
Solution:Year
IYear
IDifference
Sales 2,40,000 2,80,000 40,000
Profit 18,000 26,000 8,000
(i) P/L ratio =periodtheduringsalesinchangeyears2duringprofitinChange × 100
=000,40
000,8 × 100 = 20%
(ii) B.G.P. (Sales) =ratioL/P
Cost.F
Fixed cost = Contribution – profit= 2,40,000 × 20% – 18,000= 48,000 – 18,000 = 30,000
B.G.P. =%20000,30 = ` 1,50,000
B.G.P. (Unit) =10
000,50,1 = 15,000 Units
(iii) Margin of Safety : A – BES1st year : 24000 – 15,000 = 9,000 units2nd year : 28,000 – 15,000 = 13,000 units
(iv) Profits = ? When sales = 2,00,000
Sales =ratioV/PPF
Sales =%20
P000,30
Or P = 40,000 – 30,000 = ` 10,000(v) Sales = ? When Profit = 40,000
Required Contribution = F + P= 30,000 + 40,000 = 70,000
Sales =%20
000,70 = ` 3,50,000
Q.15. The standard cost of certain chemical mixture is as follows:Material Cost per tonne (`)I (40%) 20 A standard loss of 10% is
expected in production.II (60%) 30

University Problems and Solutions 183
For a period, the actual consumption data was as follows:Material Cost per tonne (`)
I (180 tonnes) 18 The actual weight produced was364 tonnesII (220 tonnes) 34
Calculate all the Material variances.Solution:
Calculation of Material Variances
Basic Calculations:`
M1: Actual cost of Material used:A 180 tonnes × 18 =B 200 tonnes × 34 = 10,720
M2: Standard cost of Material used:A 180 × 2 = 3,600B 220 × 30 = 6,600 10,200
M3: Std. Cost material, if cost had been used in std. Proportions:
Material A =mixActual5.StdofWeight
inWeight.kginAmaterialof.Qty.Std × SR of A
=10040 × 400 kg × 20 = 3,200 .................(i)
Std. Quality of Material B in
Manual B =10060 × 400 kg × 30 = 7,200 .................(ii)
M3 = (i) + (ii)= 3,200 + 7,200= ` 10,400
Std. Cost of outputLet us find out the Std. Cost, when input is 100kg.
Std. Mix SR SC40 kg 20 80060 kg 30 1,800
100 kg 2,600Less 15% 10 kg –
90 kg 2,600
Std. Cost of Actual output of 364 kg =90600,2 × 364
= 10,516

University Problems and Solutions184
Computation of Variances:(a) Material price variance = M1 – M2
= 1,072 – 10,200 = 520 (A)(b) Material usage variance = M2 – M4
= 10,200 – 10,516 = 316 (A)(c) Material mix variance = M2 – M3
= 10,200 – 10,400 = 200 (F)(d) Material yield variance = M3 – M4
= 10,400 –10,516 = 116 (F)(e) Material cost variance = M1 – M4
= 10,720 – 10,516 = 204 (A)OR
MCV = MPV + MWV= 520 (A) + 316 (F)= 204 (A)
ORMPV + MUV + MYU
= 520 (A) + 200 (F) + 116 (F)= 204 (A)
Q.16. The standard material cost to produce one ton (1,000 kgs.) ofchemical "X" is :-300 kg of material A @ ` 10 per kg.400 kg of material B @ ` 5 per kg.500 kg of material C @ ` 6 per kg.During the month of December 2010, 100 tons of mixture "X" were produced from the usageof :-
35 tons of materials A at a cost of ` 9,000 per ton42 tons of material B at a cost of ` 6,000 per ton53 tons of material C at a cost of ` 7,000 per tonYou are required to calculate:-
(a) Material Cost Variance(b) Material Price Variance(c) Material Usage Variance(d) Material Mix Variance

University Problems and Solutions 185
Solution:Chemical 'X'
Standard ActualMaterial Qty. Rate Amt Material Qty. Rate Amt
(Kg.) (`) (`) (Kg.) (`) (`)
A 30,000 10 3,00,000 A 35,000 9 3,15,000
B 40,000 5 2,00,000 B 42,000 6 2,52,000C 50,000 6 3,00,000 C 53,000 7 3,71,000Total 1,20,000 - 8,00,000 Total 1,30,000 9,38,000
(A) Material Cost Variance= Standard cost for actual output – actual cost= 8,00,000 – 9,38,000 = ` 1,38,000 (A)
(B) Material Price Variance= Actual Quantity (standard rate - actual rate)Material A = 35,000 (10-9) = ` 35,000 (F)Material B = 42,000 (5-6) = ` 42,000 (A)Material C = 53,000 (6-7) = ` 53,000 (A)
Total = ` 60,000 (A)(C) Material Usage Variance: (standard quantity for actual)
Material = (30,000 - 35,000) × 10 = 50,000Material = (40,000 - 42,000) × 5 = 10,000Material = (50,000 - 53,000) × 6 = 18,000
Total = 78,000(D) Material Mix Variance:
(Revised standard quantity - actual quantity) × standard rateMaterial = (32,000 – 35,000) × 10 = ` 25,000 (A)Material = (1,30,000/3 - 42,00d) × 5 = ` 6,667 (F)Material = (16,250/3-53,000) × 6 = ` 7,000 (F)
Total = ` 11,333 (A)Working Note:
Revised Std. Qty. =mixofweightactualTotal
.Qty.StdmixofweightactualTotal
Material (A) Material (B) Material (C)32,500 kg. 4,333 kg. 54,167 kg.
(1,30,000/1,20,000× 30,000) (1,30,000/1,20,000× 40,000) (1,30,000/1,20,000× 50,000)
Q.17. From the following information, you are asked to compute(i) Break-even point in value and volume
(ii) PN ratio(iii) Margin of safety, both in absolute and percentage terms

University Problems and Solutions186
`Sales value 20,00,000Material cost 4,00,000Labour cost 5,00,000Variable manufacturing expenses 1,00,000Variable selling & distribution expenses 2,00,000Repairs and maintenance (Fixed). 90,000Depreciation, rates and taxes 30,000
General and administrative expenses:Salary `Factory supervisor 12,000Office manager 18,000Other office employees 60,000
90,000Salesmen’s Commission 5% of sales(not included in selling and distribution expenses)Selling price per unit 100/-Fixed selling Distribution Overheads 1,90,000
Solution:Total No. of units sold = ` 20,00,000 / ` 1000 = 20,000 UnitsSelling Price per unit = ` 100Variable Cost `Material Cost 4,00,000Labour Cost 5,00,000Mfg. Cost 1,00,000Selling and Discounts Cost 2,00,000
12,00,000Variable Cost per unit = ` 12,00,000/2,000 unit = ` 60 p.m.Also, salesman’s commission per unit = ` 5Total receivable cost per unit = 60 + 5 = ` 65/-Selling price per unit – Variable cost per unitContribution per unit = 100 – 65 = 35
(i) Break-even pointUnits Contribution
1 35 BEP is terms of sale value = 14,000 units? 49,000 = units × 100 = 14,00,000
(ii) P/V ratio = contribution/Sales × 100 = 35/100 ×100 = 35%(iii) Margin of safety = Actual Sales – BEP Sales
= 20,000 units – 14,000 units= 6,000 units
6,000 × 100 = ` 6,00,000
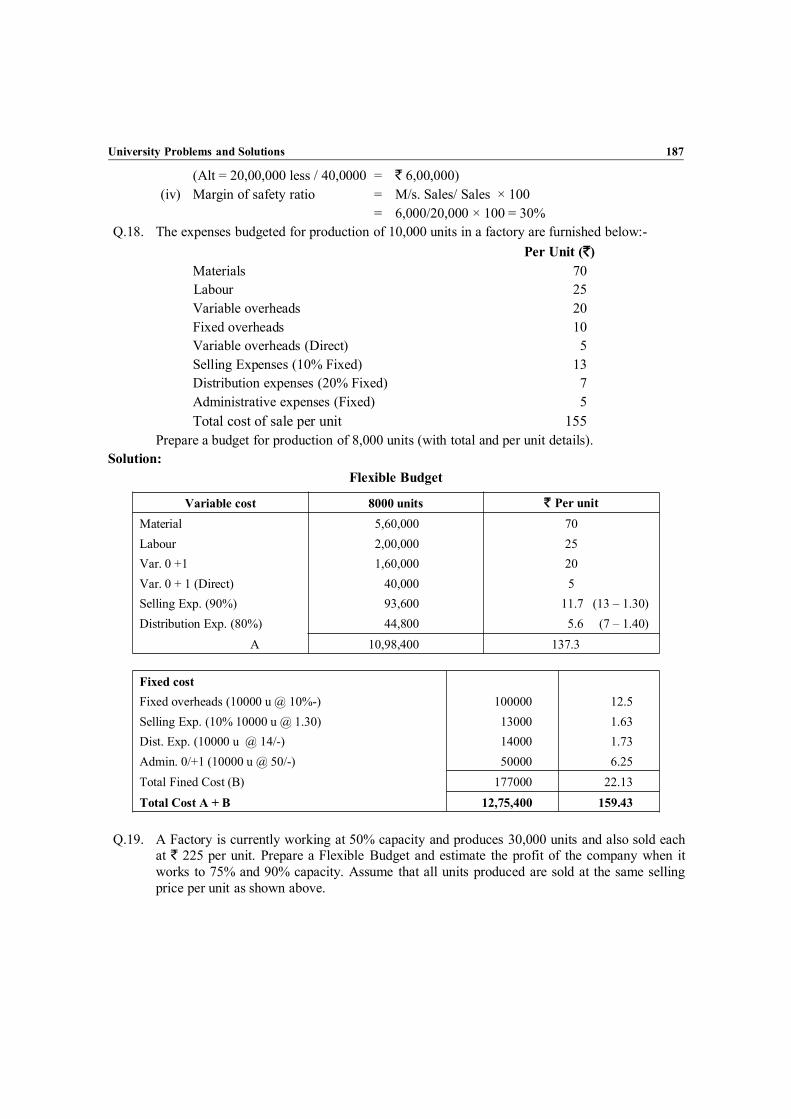
University Problems and Solutions 187
(Alt = 20,00,000 less / 40,0000 = ` 6,00,000)(iv) Margin of safety ratio = M/s. Sales/ Sales × 100
= 6,000/20,000 × 100 = 30%Q.18. The expenses budgeted for production of 10,000 units in a factory are furnished below:-
Per Unit (`)Materials 70Labour 25Variable overheads 20Fixed overheads 10Variable overheads (Direct) 5Selling Expenses (10% Fixed) 13Distribution expenses (20% Fixed) 7Administrative expenses (Fixed) 5Total cost of sale per unit 155
Prepare a budget for production of 8,000 units (with total and per unit details).Solution:
Flexible Budget
Variable cost 8000 units ` Per unitMaterial 5,60,000 70Labour 2,00,000 25Var. 0 +1 1,60,000 20Var. 0 + 1 (Direct) 40,000 5Selling Exp. (90%) 93,600 11.7 (13 – 1.30)Distribution Exp. (80%) 44,800 5.6 (7 – 1.40)
A 10,98,400 137.3
Fixed costFixed overheads (10000 u @ 10%-) 100000 12.5Selling Exp. (10% 10000 u @ 1.30) 13000 1.63Dist. Exp. (10000 u @ 14/-) 14000 1.73Admin. 0/+1 (10000 u @ 50/-) 50000 6.25Total Fined Cost (B) 177000 22.13Total Cost A + B 12,75,400 159.43
Q.19. A Factory is currently working at 50% capacity and produces 30,000 units and also sold eachat ` 225 per unit. Prepare a Flexible Budget and estimate the profit of the company when itworks to 75% and 90% capacity. Assume that all units produced are sold at the same sellingprice per unit as shown above.

University Problems and Solutions188
Following information is provided to you:-(i) Variable Expenses:
Materials ` 60 per unitLabours ` 40 per unitOther Expenses ` 15 per unit
(ii) Semi-variable Expenses: (at 50% capacity)Indirect Labour ` 1,50,000Indirect Materials ` 2,10,000General Administrative Expenses ` 2,70,000Repairs and Maintenance ` 1,20,000Salesmen Salaries ` 1,80,000
(iii) Fixed Expenses:Office and Management Salaries ` 5,40,000Office and Factory Rent and Taxes ` 6,00,000Sundry Administrative Expenses ` 7,20,000Depreciation on Machinery and Furniture ` 4,50,000
(iv) Semi-variable expenses remain constant up to 60% of capacity, increasing by 10%between 60% and 80% capacity and by 20% between 80% and 100% capacity.
(v) Rate per unit of variable expenses remains same.Solution:
Flexible Budget
30,000 units 45,000 units 54,000 units50% 75% 90%
(i) Variable Expenses ` ` `
Materials 18,00,000 27,00,000 32,40,000Labours 12,00,000 18,00,000 21,60,000Other Expenses 4,50,000 6,75,000 8,10,000
(ii) Semi-variable ExpensesIndirect labour 1,50,000 1,65,000 1,80,000Indirect materials 2,10,000 2,31,000 2,52,000General administrative expo 2,70,000 2,97,000 3,24,000Repairs and Maintenance 1,20,000 1,32,000 1,44,000Salesman salaries 1,80,000 1,98,000 2,16,000
(iii) Fixed ExpensesOffice and Management salaries 5,40,000 5,40,000 5,40,000Office and Factory rent and taxes 6,00,000 6,00,000 6,00,000Sundry Administrative expenses 7,20,000 7,20,000 7,20,000Dep. on machinery and furniture 4,50,000 4,50,000 4,50,000
Total Cost 66,90,000 85,08,000 96,36,000

University Problems and Solutions 189
`(30,000 × 225)
`45,000 × 225
`54000x225
Sales 67,50,000 1,01,25,000 1,21,50,000Less total cost 66,90,000 85,08,000 96,36,000
Profit : 60,000 16,17,000 25,14,000
Q.20. A gang of workers normally consists of 30 men, 15 women and 10 boys. They are paid atstandard rates per hour as, Man ` 80.00 woman ` 60.00 and Boy ` 40. In a normal working ofa week of 40 hours. The gang is expected to produce 2000 units of output.During the week ended 31st December, 2011, the gang consisted of 40 men, 10 women and05 boys. The actual wages paid per hour were Man ` 70.00, woman ` 65.00 and Boy ` 30.00.Actual units produced by the gang 1600 units.Calculate:-
(i) Labour Cost Variance(ii) Labour Rate Variance
(iii) Labour Efficiency variance(iv) Labour Mix Variance(v) Labour Yield Variance
Solution:(i) Labour Cost Variance
(Std. Rate × Std. time for actual output) – (Actual Rate × Actual time)Men = (80 × 960) – (70 × 1600)
= (76800 – 1,12,000) = ` 35,200 (A)Women = (60 × 480) – (65 × 400)
= (28,800 – 26,000) = ` 2,800 (F)Boys = (40 × 320) – (30 × 200)
= (12,800 – 6000) = ` 6,800 (F)Labour Cost Variance = ` 25,600 (A)
(ii) Labour Rate Variance: Actual time (SR – AR)Men = 1600 (80 – 70) = ` 16,000 (F)Women = 400 (60 – 65) = ` 2,000 (A)Boys = 200 (40 – 30) = ` 2,000 (F)
Labour Rate Variance = ` 16,000 (F)(iii) Labour Efficiency Variance:
= Std. price (Std. time for actual output - actual time)Men = 80 {960 – 1600)
= 80(640) = ` 51,200 (A)Women = 60 (480 – 400)
= 60 (80) = ` 4,800 (F)Boys = 40 (320 – 200)
= 40 (120) = ` 4,800 (F)Labour Efficiency Variance = ` 41,600 (A)

University Problems and Solutions190
(iv) Labour Mix Variance:= Std. Rate (Std. Time – Actual time worked)= 80 (1200 – 1600)= 80(400) = ` 32,000 (A)
Women = 60 (600 – 400)= 60 (200) = ` 12,000 (F)
Boys = 40 (400 – 200)= 40( 200) = ` 8,000 (F)Labour Mix Variance = ` 12,000 (A)
(v) Labour Yield Variance:= Std. Labour cost per unit of output × (Std. Output for Actual time –
Actual output)= 4 (2000 – 1600)= 74 (400) = ` 29,600 (F)
Working Notes:1. Actual time:
Men = 40 × 40 = 1600Women = 10 × 40 = 400Boys = 05 × 40 = 200
2200 hrs2. Std. Time for actual output:
Men =20001600 × (30 × 40) = 960 hrs.
Women =20001600 × (15 × 40) = 480 hrs.
Boy =20001600 × (10 × 40) = 320 hrs.
3. Std. Time:"
Men = 30 × 40 = 1200 hrs.Women = 15 × 40 = 600 hrs.Boys = 10 × 40 = 400 hrs.
4. Std. Labour cost permit of output:Std. Output given = 2000 unitsStd. Cost given
Men = 30 × 40 × 80 = 96000Women = 15 × 40 × 60 = 36000Boys = 10 × 40 × 40 = 16000
1,48,000

University Problems and Solutions 191
So, labour cost permit of output
=2000
000,48,1 = ` 74/-
Std. Output for actual time worked for 2200 hours of total.Std. Output = 2000 unitsfor 1760 hrs. of actual time worked
= 2000 ×200,2760,1 = 1600 units
Q.21. A company manufactures a single product with a capacity of 2,50,000 units per annum. Thesummarised profitability statement for the year ended 31st March, 2012 is as under:
Particulars ` `
Sales (1,50,000 units @ 20 ` Per unit) 30,00,000Cost of sales:
Direct MaterialsDirect Labour
6,00,0004,50,000
Production Overheads: Variable 1,50,000Fixed 4,00,000
Administrative Overheads Fixed 3,00,000Selling and Distribution Overheads Variable 3,00,000
Fixed 2,00,000 24,00,000Profit 6,00,000
(a) You are required to calculate:(i) P/N Ratio
(ii) Break Even Sales(b) You are also required to evaluate the following options :-
(i) What will the amount of sales required to earn target profit of 20% on sales, in thepacking is improved at an additional cost of ` 2 per unit?
(ii) If an expenditure of ` 4,00,000 is made on advertising, the sales would increasefrom the present level of 1,50,000 units to 2,00,000 units at a selling price of ` 21per unit. Will that expenditure be justified?
(iii) If selling price is reduced by ` 2 per unit, there will be 100% capacity utilisation.Will the reduction in selling price be justified?
Solution:Sales 30,00,000Less: Variable cost
Direct materials 6,00,000Direct labour 4,50,000Variable cost 4,50,000 15,00,000Contributions 15,00,000

University Problems and Solutions192
(a) (i) P/V Ratio
=Sales
onContributi × 100
=000,00,30000,00,15 × 100
= 50%(ii) Break Even Sales
=RatioV/P
tcosFixed
Fixed cost = 4,00,000 + 3,00,000 + 2,00,000= 9,00,000
=%50000,00,9
= 18,000(b) (i) Contribution = Fixed cost + Derived profit
Additional cost = 1,50,000 × 2 = 3,00,000Fixed cost = 9,00,000 + 3,00,000 = 12,00,000Contribution = 12,00,000 + 6,00,000 = 18,00,000
No. of units =10
000,00,18
= 1,80,000 units(ii) Sales (2,00,000 × 21) = 42,00,000
Less: variable cost (15,00,000 + 4,00,000) = 19,00,000Contribution = 23,00,000
P/V ratio =000,00,42000,00,25 × 100
= 54.76%B. E. P. sales
=RatioV/P
tcosFixed
=%76.54
000,00,9
= ` 16435.35Expenditure is justified because P/V Ratio is more as compared to former sales.(iii) Selling price is reduced by ` 2/-
New S.P. = 20 – 2 ` 18/-Sales (1,50,000 × 18) = 27,00,000Less: Variable cost = 15,00,000Contribution = 12,00,000

University Problems and Solutions 193
P/V ratio =Sales
onContributi × 100
=000,00,27000,00,12 × 100
= 44.44%
B.E.P. (sale) =RatioV/P
tcosFixed
=%44.44
000,00,9
= 20252/-Note: Although P/V Ratio is reduced, B.E.P. (sale) has increased and hence it isjustified.

April 2015
Total Marks : 75N.B. : (1) All questions are compulsory with internal choice.
(2) All questions carry equal marks.(3) Working notes should form part of your answers.
1. (a) State whether the statements are True or False (Rewrite the sentence) (Any 8) 81. Marginal cost is a fixed cost.2. Key factor is a limiting factor.3. A Budget need not be realistic.4. Zero base budgetting is based on past Budget.5. Flexible Budget is most practical.6. Profit is equal to contribution.7. Decision making involves choice of alternatives.8. Standard costing is a technique of controlling cost.9. Idle Time variance is always favourable.
10. Profit = fixed cost – Contribution.(b) Multiple choice questions rewrite the sentence (Any 7) 7
1. The budget which is dynamic(a) Fixed Budget (b) Sales Budget(c) Flexible Budget (d) Cash Budget
2. Production Budget should be prepared in(a) Value only (b) Quantity only(c) Quantity and Value both (d) None of the above
3. Contribution =(a) Sales – Variable cost (b) Fixed cost + Profit(c) Sales × Profit Volume ratio (d) All of the above
4. Variable cost(a) Changes per unit (b) Remain fixed(c) None of the above (d) Changes with the change in output
5. The object of budgetory control is(a) Planning (b) Organising(c) Forecasting (d) None of the above
6. Labour time variances =(a) (Standard rate – Actual rate) × Standard quantity(b) (Standard rate – Actual rate) × Actual quantity(c) (Standard hours – Actual hours) × Standard rate(d) (Standard hours – Actual hours) × Actual rate

University Problems and Solutions 195
7. A Summary of all functional Budget is called(a) Fixed Budget (b) Flexible Budget(c) Master Budget (d) Overheads Budget
8. BEP is(a) Fixed cost/Profit Volume ratio (b) Actual sales + Break eversales(c) Margin of sales-Actual sales (d) All of the above
9. When preparing a production budget, the quantity to be produced equals to(a) Sales Quantity + Opening stock + Closing stock(b) Sales Quantity – Opening stock + Closing stock(c) Sales Quantity – Opening stock – Closing stock(d) Sales Quantity + Opening stock – Closing stock
10. The cost of product as determined under standard cost system is(a) Fixed cost (b) Direct cost(c) Historical cost (d) Pre determined cost
2. (a) A firm sells 25,000 units at a selling price of ` 5 per unit. Its Fixed cost is ` 40,000 andvariable expenses ` 50,000. Find out the Break-Even point for the firm. Also, find out BEPwhen; 15(a) The selling price is increased by 30%(b) The fixed cost is increased by 15%(c) The fixed cost is decreased by 25%(d) The selling price is decreased by 20%
OR2. A, B & C are three similar plants under same management who want them to be merged for
better operation. The details are as under: 15Plant A B C
Capacity Operated 100% 70% 60%Turnover (in lakhs) 300 280 180Variable cost (in lakhs) 200 210 90Fixed cost (in lakhs) 70 50 62
You are required to find out:(a) The capacity of merged plant for break even.(b) The profit at 85% capacity of the merged plant.(c) The turnover from the merged plant to give a profit of ` 38 lakhs.
3. A Factory produces 20,000 units. The budgeted expenses are given below: 15Particulars ` Per Unit
Direct Materials Cost 75Direct Labour Cost 20Direct Expenses 25

University Problems and Solutions196
Variable Production Overheads 15Fixed Production Overheads (` 400,000) 20Administrative Expenses (Fixed) 10Selling Expenses (20% Fixed) 15Distribution Expenses (40% fixed) 20Total Cost of sales per unit 200
Prepare a flexible budget for production of (a) 15,000 units (b) 10,000 units.3. A factory is currently working at 50% capacity and producers 10,000 units. Prepare a
Flexible Budget and estimate the Profits of the Company when it works at 60% and 80%capacity and advise the Company. At 60% working Raw Material Cost increases by 5% andselling price falls by 2%. At 80% Raw Materials cost increases by 6% and selling price fallsby 4% At 50% capacity working the product costs ` 180 per unit and is sold at ` 200 perunit. 15The Unit cost of ` 180 is made up as follows:Material ` 100Labour ` 30Factory overheads ` 30 (40% fixed)Administrative overheads ` 20 (50% fixed)
4. Gemini chemicals industries provide the following information from their records. Formaking 10 kgs of GEMCO standard material requirements is 15
Material Quantity (kg) Rate per kg `
A 8 6B 4 4
During April 2015, 1,000 kg of GEMCO were produced. The actual consumption ofmaterial is as under:
Material Quantity (kg) Rate per kg `
A 750 7B 500 5
Calculate all material variances.OR
4. The budgetd and the actual sale for a period in respect of three products are given below: 15
Budgeted Figures
Product Quantity Price ` Value `
A 1,000 5 5,000B 750 10 7,500C 500 15 7,500
2,250 20,000

University Problems and Solutions 197
Actural
Product Quantity Price ` Value `
A 1,200 6 7,200B 700 9 6,300C 600 14 8,400
2,500 21,900
Calculate all sales variances.5. (a) What is Budget? Explain advantages and limitations of budgets? 8
(b) What are the limitations of marginal costing. 7OR
5. Write short note (Any 3) 15(1) Absortion Costing V/s Marginal Costing.(2) Fixed and Flexible Budget.(3) Standard Costing.(4) Break even Analysis.(5) Decision Making in Marginal Costing.

University Problems and Solutions198
April 2016Total Marks : 75
N.B. : (1) All questions are compulsory.(2) Figures to the right indicate full marks.(3) Working note should be part of answer.(4) Use of simple calculator is permitted.
1. (A) Select correct option and re-write the sentence. (Any 8) 8(i) ABC Lts. manufactures a single product which it sells for ` 50 per unit. Fixed costs are
` 80,000 per annum. The contribution to sales ratio is 50%. ABC Ltd’s breakeven pointin units is:(a) 3,500 (b) 3,000(c) 3,200 (d) 3,400
(ii) A company plans to produce and sell 5,000 units of product C each month, at theselling price of ` 20 per unit. The unit cost comprised of ` 8 variable cost and ` 6 fixedcost. Calculate the margin of safety as a percentage of planned sales:(a) 60% (b) 50%(c) 65% (d) 75%
(iii) A budget that gives a summary of all the functional budgets is known as:(a) Capital Budget (b) Flexible Budget(c) Master Budget (d) Discretionary Budget
(iv) The fixed variable cost classification has a special significance in the preparation of:(a) Capital Budget (b) Flexible Budget(c) Master Budget (d) Cash Budget
(v) When preparing a production budget, the quantity to be produced equals:(a) Sales quantity + opening stock + closing stock(b) Sales quantity – opening stock + closing stock(c) Sales quantity – opening stock – closing stock(d) Sales quantity + opening stock – closing stock
(vi) A job requires 12,000 actual labour hours for completion and it is anticipated that therewill be 20% idle time. If the wage rate is ` 10 per hour, what is the idle cost for the job?(a) ` 19,200 (b) ` 24,000(c) ` 28,800 (d) ` 30,000
(vii) Of the four costs shown below which would not be included in the cash budget?(a) Depreciation of the fixed asset(b) Office salaries(c) Commision paid to the agents(d) Capital cost of a new computer
(viii) PG Ltd. makes a single product and is preparing its material usage budget for next year.Each units of product requires 2 kgs of material, and 5,000 units of product are to be

University Problems and Solutions 199
produced next year. Opening stock of material is budgeted to be 800 kgs. and PG Ltd.budget to increase material stock at the end of next year by 20%. The material usagebudget for next year is:(a) 8,000 kg. (b) 9,840 kg.(c) 10,000 kg. (d) 10,160 kg.
(ix) If a company uses only one type of material, then following variance cannot be found(a) Material cost variance (b) Material price variance(d) Material usage variance (c) Material yield variance
(x) Telephone charges is(a) variable cost (b) fixed cost(c) semi variable cost (d) none of the above
(B) State whether following statements are true or false (any 7) 7(i) Equal emphasis should be laid on favourable and unfavourable variances.
(ii) Material yield variance is the difference between the standard yield specified and theactual yield obtained.
(iii) Analysis of variances is done in order to determined the reasons for increase ordecrease in profit.
(iv) A system of budgetary control can not be used in an organization when standardcosting is being used.
(v) Budgets are always prepared for past.(vi) Forecast and budget are one and the same.
(vii) The relationship between contribution and turnover is represented in the form of profitvolume ratio.
(viii) At break-even point, fixed cost plus profit is equal to total sales.(ix) Margin of safety = Break – even sales + Fixed cost.(x) A high margin of safety usually indicates high fixed overheads.
2. The following information is obtained from a company for January: 15Sales ` 20,000Variable Costs ` 10,000Fixed Costs ` 6000
1) Find P/V Ratio, Break-even point and Margin of Safety at this level.2) Also find effect of the following individually on BEP sales
a) 20% decrease in fixed costb) 10% increase in fixed costc) 10% decrease in variable costd) 10% increase in selling pricec) 10% increase in variable cost and selling price both
OR2. M/s. Alok Industries has given the following details, find the most profitable product Mix
and prepare a statement of profitability of the product mix.
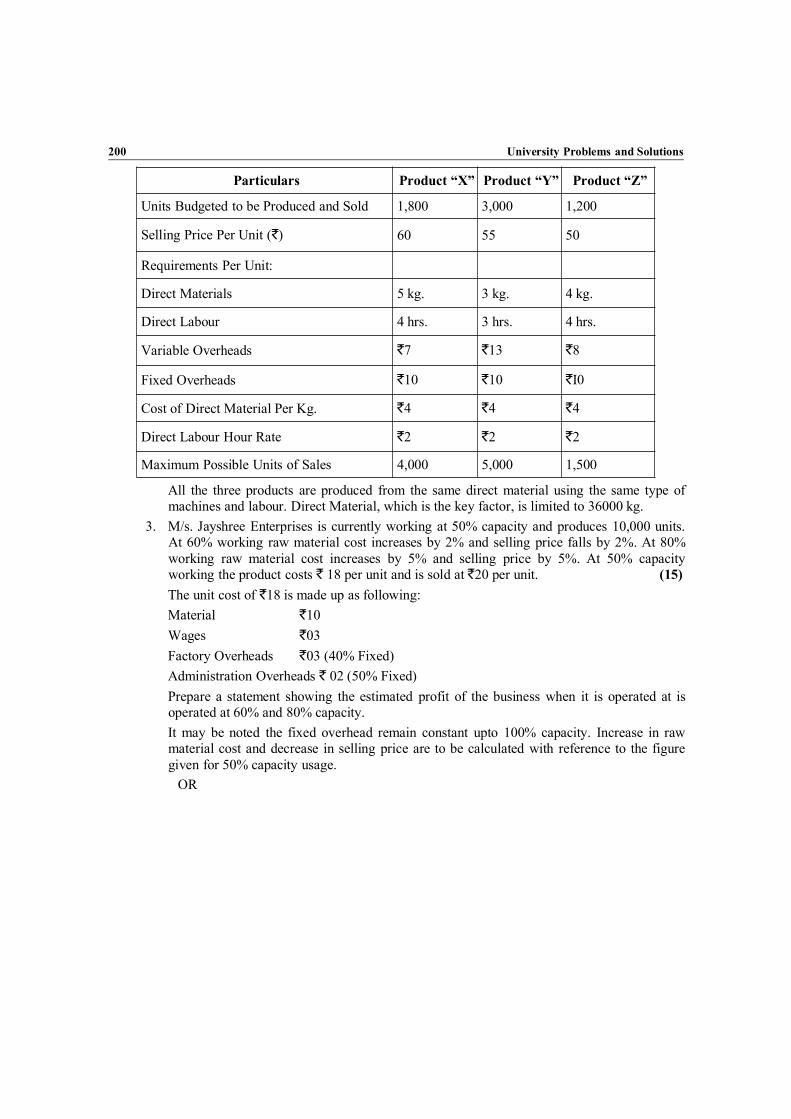
University Problems and Solutions200
Particulars Product “X” Product “Y” Product “Z”
Units Budgeted to be Produced and Sold 1,800 3,000 1,200
Selling Price Per Unit (`) 60 55 50
Requirements Per Unit:
Direct Materials 5 kg. 3 kg. 4 kg.
Direct Labour 4 hrs. 3 hrs. 4 hrs.
Variable Overheads `7 `13 `8
Fixed Overheads `10 `10 `I0
Cost of Direct Material Per Kg. `4 `4 `4
Direct Labour Hour Rate `2 `2 `2
Maximum Possible Units of Sales 4,000 5,000 1,500
All the three products are produced from the same direct material using the same type ofmachines and labour. Direct Material, which is the key factor, is limited to 36000 kg.
3. M/s. Jayshree Enterprises is currently working at 50% capacity and produces 10,000 units.At 60% working raw material cost increases by 2% and selling price falls by 2%. At 80%working raw material cost increases by 5% and selling price by 5%. At 50% capacityworking the product costs ` 18 per unit and is sold at `20 per unit. (15)The unit cost of `18 is made up as following:Material `10Wages `03Factory Overheads `03 (40% Fixed)Administration Overheads ` 02 (50% Fixed)Prepare a statement showing the estimated profit of the business when it is operated at isoperated at 60% and 80% capacity.It may be noted the fixed overhead remain constant upto 100% capacity. Increase in rawmaterial cost and decrease in selling price are to be calculated with reference to the figuregiven for 50% capacity usage.
OR

University Problems and Solutions 201
3. ABC Foods Products Limited has prepared the following sales Budget for the first fivemonths of 2016 (15)
Sales Budget (in Units)
January 10,800
February 15,600
March 12,200
April 10,400
May 9,800
The inventory of finished products at the end of every month is to be equal to 25% of thesales estimate for the next month. On 1st January 2016, there were 2,700 units of product inhand. There is no work-in-process at the end of any month.Every unit of product requires two types of materials in the following quantities:Material A: 4 Kg. Material B : 5 Kg.Material equal to one-half of the next month’s production are to be in hand at the end ofevery month. This requirement was met on 1st January 2016 Budgeted prices for thepurchase of materials areMaterial A: `3 per kg., Material B: `2 per Kg.Prepare Materials consumption Budget and purchase budget (qty & value) for first quarterof 2016 showing the quantities of each type of material to be purchased every month.
4. The budgeted and the actual sale for a period in respect of three products are given below:(15)
Budgeted Figures
Product Quantity Price ` Value `
A 1,000 5 5,000
B 750 10 7,500
C 500 15 7,500
2,250 20,000
Actual
Product Quantity Price ` Value `
A 1,200 6 7,200
B 700 9 6,300
C 600 14 8,400
2,500 21,900

University Problems and Solutions202
Calculate all sales variances.OR
4. Calculate all labour variance from the following data. (15)
Particulars Standard Hours Standard hourlyrate
Actual hours Actual Hourlyrate
Skilled Labour 2880 20 1760 25
Semi-skilled 1920 10 2640 5
Labour Total 4800 4400
Output 108 Kg 90 Kg
5. (a) What is marginal costing? Explain Break-even chart in detail. (8)(b) What is standard costing? Explain Material variances in detail. (7)
OR5. Write Short Notes (Any 03) (15)
1. P/V Ratio2. fixed overheads variances3. Master Budget4. Advantages of Budgetary control5. Limiting factor
SolutionQ.1 A) 1) 3200 units 2) 50% 3) Master Budget 4) Flexible Budget 5) Sales quantity - Opening
stock + closing stock 6) ` 24000 7) Depreciation of the fixed assets 8)10160 kg 9) MaterialYield Variance 10) Semi Variable cost
B) False: 2,5,6,8,9,10 True: 1,3,4,7Q. 2) Marks in the Brackets
20% Dec. inFC
10% inc. inFC
10% Dec.VC
10% Inc. inSP
10% inc. inVC & SP
Sales 20000 20000 22000 22000VariableCost
10000 9000 10000 11000
Contribution 10000 11000 12000 11000FC 6000 6000 6000Profit 4000 5000 5000P/v Ratio =C/S * 100
50% 50% 50% 55% 54.55% 50%
BEP in ` =FC/p/v ratio
12000 9600 13200 10909 11000 12000
MOS =AS – BEP
8000

University Problems and Solutions 203
Q.2) Direct Material is Key FactorX = 25/5 kg = 5 Rank IIY = 24/3 kg = 8 Rank IZ = 18/4 kg = 4.5 Rank III
Statement of Product MixX 4000 units * 5 20000
5000 units * 3 15000250 Units * 4 1000
36000Contribution X (4000 * 25) 1,00,000
Y (5000 * 24) 1,20,000Z (250 * 18) 4,500
2,24,500Fixed Cost 60,000Profit 1,64,500
50% 60% 80%1000 units 12000 units 16000 units
Sales 20 200000 19.60 235200 21 336000– COGSMaterial 10 100000 10.20 122400 10.50 168000Wages 3 30000 3 36000 3 48000Factory OHS
Fixed 1.20 12000 1 12000 0.75 12000Variable 1.80 18000 1.80 21600 1.80 28800
Administration OHSFixed 1 10000 0.83 10000 0.625 10000Variable 1 10000 1 12000 1 16000
Profit 2 20000 1.77 21200 3.325 53200
(Alternate For 80 % if students have taken decrease in selling price by 5 percent give marksprofit will be ` 21200)

University Problems and Solutions204
3.
Production budget in units.
Particulars January February MarchSales 10800 15600 12200Add-closing stock 3900 3050 2600Less-Opening stock 2700 3900 3050Production units 12000 14750 11750
Material January(12000 units)
February(14750 units)
March(11750 units)
A (4 kg per unit) 48000 59000 47000B (5 kg per unit) 60000 73750 58750
Purchase Budget For material A (in `)
Particulars January February MarchConsumption quantity 48000 59000 47000Add-closing stock 29500 23500 20500Less-opening stock 24000 29500 23500Purchase quantity 53500 53000 44000Price per kg ` 3 ` 3 ` 3Purchase amount (`) 160500 159000 132000
Purchase Budget For material A (in `)
Particulars January February MarchConsumption quantity 60000 73750 58750Add-closing stock 36875 29375 25625Less-opening stock 30000 36875 29375Purchase quantity 66875 66250 55000Price per kg ` 2 ` 2 ` 2Purchase amount (`) 133750 132500(0.5) 110000
4. Sales VarianceA = (1200*6) – (1000*5) = 2200 (F)B = (700*9) – (750*10) = 1200 (A)C = (600*14) – (500*15) = 900 (F)
1900(F)Sales Price Variance = (AP – SP)*AQA = (6 – 5)*1200 = 1200(F)B = (9 – 10)*700 = 700 (A)

University Problems and Solutions 205
C = (14 – 15)*600 = 600 (A)100 (A)
Sales Volume Variance = (AQ – SQ) * SPA = (1200 – 1000)*5 = 1000(F)B = (700 – 750)*10 = 500 (A)C = (600 – 500) * 15 = 1500 (F)
2000 (F)Sales Mix Variance = (AQ – RSQ)*SPA = (1200 – 1111)*5 = 445(F)B = (700 – 833)*10 = 1330 (A)C = (600 – 556)*15 = 660 (F)
225 (A)Sales Sub volume Variance = (RSQ – SQ)*SPA = (1111 – 1000)*5 = 555 (F)B = (833 – 750)*10 = 830 (F)C = (556 – 500)*15 = 840 (F)
2225 (F)4. Labour Variance
Skilled = 2400 * 20) – (1760*25) = 4000(F)Semi Skilled = (1600*10) – (2640*5) = 2800 (F)
6800 (F)LRV = (SR – AR)*AH = 8800(A)Skilled = (20 – 25)*1760 = 13200(F)
4400(F)LTV = (SH – AH)*SRSkilled = (2400 – 1760)*20 = 12800(F)Semi Skilled = (1600 – 2640)*10 = 10400(A)
2400 (F)LYV = (SH –RH)*SRSkilled = (2400 – 2640)*20 = 4800 (A)Semi Skilled = (1600 – 1760)*10 = 1600 (A)
6400 (A)
____