
COST 355 – Namur 1-3 Dec 2004 Energy consumption associated with the production and distribution...
22
COST 355 – Namur 1-3 Dec 2004 Energy consumption associated with the production and distribution of jeans in the UK Stephen Anderson University of Westminster
-
Upload
barbara-dalton -
Category
Documents
-
view
216 -
download
2
Transcript of COST 355 – Namur 1-3 Dec 2004 Energy consumption associated with the production and distribution...

COST 355 – Namur 1-3 Dec 2004
Energy consumption associated
with the production and
distribution of jeans in the UK
Stephen Anderson
University of Westminster

COST 355 – Namur 1-3 Dec 2004
Objectives of the project
• Energy study of jeans supply chain• French and UK comparison• Energy consumed in producing and
supplying jeans• CO2 emitted in producing and supplying
jeans• INRETS and Westminster each carrying
out data collection and energy calculation with common approach

COST 355 – Namur 1-3 Dec 2004
Jean supply chain
• Cotton farming• Spinning and dyeing• Fabric manufacture• Garment manufacture• Import of goods• Regional distribution• Retail outlet
The production and distribution of jeans can be broken down into seven main operations:

COST 355 – Namur 1-3 Dec 2004
TransportCotton Planting GinningCrop care Harvesting Spinning yarn
Transport Dyeing TransportFinishing Transport Weaving fabric
Transport Transport Entry portFinishingTransportSewing garment
Transport Storage TransportTransport Distribution centre
Retail outlet Final consumerTransport
Processes & transport in the production & distribution of jeans
Cotton CultivationSpinning and dyeing
Fabric manufacture
Garment manufacture Import of goods

COST 355 – Namur 1-3 Dec 2004
Garment manufacturing
TransportPattern cutting Sewing Transport
WashingTransport Special finishing Transport
Final finishingProcesses are not necessarily carried out locally – transport might be required and could be long distance
Processes are not necessarily carried out locally – transport might be required and could be long distance
COST 355 – Namur 1-3 Dec 2004
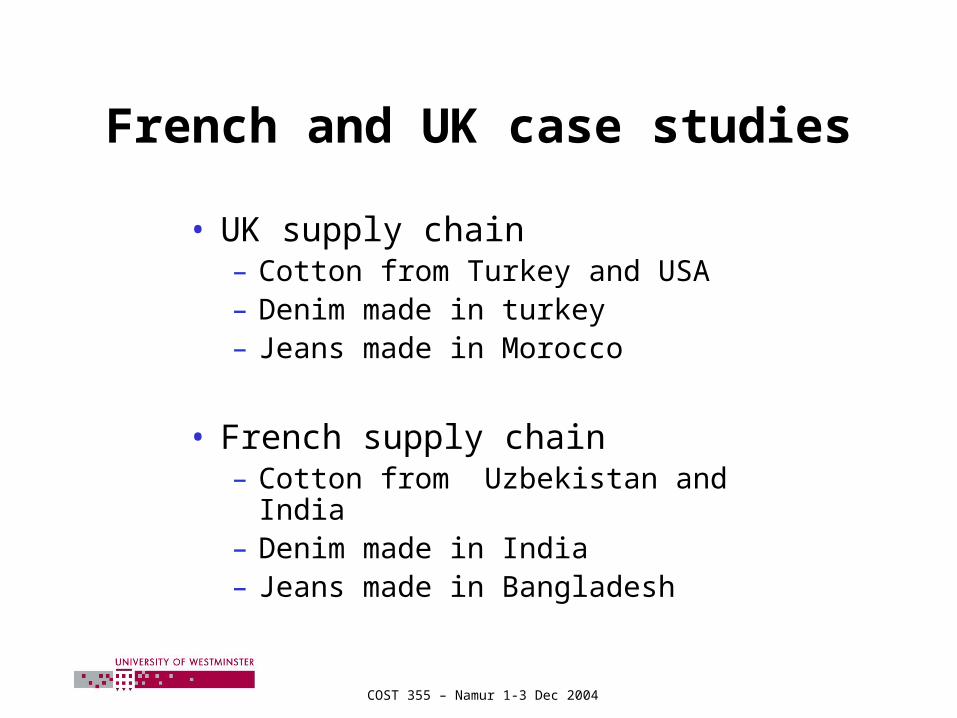
French and UK case studies
• UK supply chain– Cotton from Turkey and USA– Denim made in turkey– Jeans made in Morocco
• French supply chain– Cotton from Uzbekistan and India– Denim made in India– Jeans made in Bangladesh

COST 355 – Namur 1-3 Dec 2004
Distribution of jeans – French case (1)
Port Le Havre-France
Entrepôt sous douane (ICD)-
Mise en container Chennai-Inde
Port Chittagong-Bangladesh
Port Singapore
Champs de coton
Chennai-Inde
Filature/TissageAhmedabad-Inde
Confection/lavageDhaka-Bangladesh

COST 355 – Namur 1-3 Dec 2004
Distribution of jeans – French case (2)
Champs de coton Samarkand-Uzbekistan
Filature/ Tissage Nagpure-Inde
Confection/ lavage Dhaka-Bangladesh
Entrepôt sous douane (ICD)-
Mise en container Dhaka-Bangladesh
Port Chittagong-Bangladesh
Port Singapore
Port Abbas-Iran
Port Bombay-Inde
Port Le Havre-France

COST 355 – Namur 1-3 Dec 2004
Distribution of jeans – UK cases
Transport 1Cotton Planting GinningCrop care Harvesting
Spinning yarnDyeingFinishing Transport A Weaving fabric
Transport 2 Transport 3FinishingMaking garment Storage
Final consumerTransport
Cotton Cultivation – USA and Turkey
Spinning, Dyeing and Fabric manufacture - Turkey
Garment manufacture - Morocco UK Import of goods
Transport 4Transport 5 NDCRetail outlet Transport 6 RDCs
Transport activity in supply chain
Transport 1 – Road & Sea
Transport 2 – Road & Sea
Transport 3 – Road, Sea or Rail
Transport 4 – Road
Transport 5 – Road
Transport 6 – Road
UK Distribution

COST 355 – Namur 1-3 Dec 2004
Distribution of jeans – French case (1)
Données primaires « J EAN TYPE I »
Mode de transport Distance milles
Champs de coton Chennai-Inde
Camion 1000
Filature/ Tissage Ahmedabad-Inde
Camion 1600
Confection/ lavage Dhaka-Bangladesh
Camion 15
Entrepôt sous douane (I CD)-Mise en container Dhaka-Bangladesh
train 300
Port Chittagong-Bangladesh
Bateau 2000
Port Singapore
Bateau 6000
Port Le Havre-France
Total 10915

COST 355 – Namur 1-3 Dec 2004
Distribution of jeans – French case (2)
Données primaires « J EAN TYPE I I »
Mode de transport
Distance en milles
Champs de coton Samarkand-Uzbekistan
Train 1000
Port Abbas-I ran
Bateau 2500
Port Bombay-Inde
Train 700
Filature/ Tissage Nagpure-Inde
Camion 2000
Confection/ lavage Dhaka-Bangladesh
Camion 5
Entrepôt sous douane (I CD)-Mise en container
Dhaka-Bangladesh
Train 300
Port Chittagong-Bangladesh
Bateau 2000
Port Singapore
Bateau 6000
Port Le Havre-France
Total 14505

COST 355 – Namur 1-3 Dec 2004
From To Distance (km) Vehicle (s) Cotton plantation (USA) Spinning mill 10,745 Lorry & ship Cotton plantation (Turkey) Spinning, dyeing & weaving 400 Lorry Spinning, dyeing & weaving Garment make up 4,150 Lorry & ship Garment make up UK warehouse (1) 2,435 Lorry & sea ferry UK warehouse (1) UK warehouse (2) 320 Lorry UK warehouse (2) UK warehouse (3) (Average) 200 Lorry UK warehouse (3) Retail outlets (Average) 100 Lorry
Distribution of jeans – UK cases
Total distance using US cotton = 17,950 km
Total distance using Turkish cotton = 7,605 km

COST 355 – Namur 1-3 Dec 2004
Grammes of oil equivalent per pair of jeans (cotton from USA)
Finished product
stockholding and retailing
17%
Transport (commercial
and consumer)8%
Cotton fibre production
19%
Product manufacture
56%

COST 355 – Namur 1-3 Dec 2004
CO2 per pair of jeans (cotton from USA)
Product manufacture
60%
Finished product
stockholding and retailing
18%
Transport (commercial
and consumer)5%
Cotton fibre production
17%

COST 355 – Namur 1-3 Dec 2004
Grammes of oil equivalent per pair of jeans (cotton from Turkey)
Product manufacture
56%
Cotton fibre production
20%
Transport (commercial
and consumer)7%
Finished product
stockholding and retailing
17%

COST 355 – Namur 1-3 Dec 2004
CO2 per pair of jeans (cotton from Turkey)
Product manufacture
61%
Finished product
stockholding and retailing
18%
Transport (commercial
and consumer)5%
Cotton fibre production
16%

COST 355 – Namur 1-3 Dec 2004
Transport energy from field to shop
0
50
100
150
200
250
US cotton Turkish cottonGra
mm
es
of
oil
eq
uiv
ale
nt/
pa
ir
jea
ns
Transport from retailer stockholding to retail outlet
Transport from product manufacture to retailer regional distribution centre
Transport from plantation to product manufacture point

COST 355 – Namur 1-3 Dec 2004
Transport energy from field to home
0
100
200
300
400
500
US cotton Turkish cotton
Gra
mm
es
of
oil
e
qu
iva
len
t/p
air
je
an
s
Transport from retail outlet to home
Transport from retailer stockholding to retail outlet
Transport from product manufacture to retailer regional distribution centre
Transport from plantation to product manufacture point

COST 355 – Namur 1-3 Dec 2004
Transport from shop to home
0
50
100
150
200
250
300
1.4 kg 9 kg
Weight of total shopping taken home
Gra
mm
es o
f o
il e
qu
ival
ent

COST 355 – Namur 1-3 Dec 2004
Issues related to non-transport data
• Energy data for:– Cotton production– Fabric production– Garment make-up
• Other items used (zips, buttons, etc.)• Type of energy used in each activity• Generation and use of electricity in
different countries (for CO2)

COST 355 – Namur 1-3 Dec 2004
Issues related to transport data
• Movement of product upstream of garment makeup more difficult to obtain (i.e. cotton fibre transport, denim transport)
• Empty running and average lading factor• Vehicle energy use - not practical to obtain
from companies • Final consumer transport – average distance
travelled, quantity purchased (kgs), empty running
COST 355 – Namur 1-3 Dec 2004
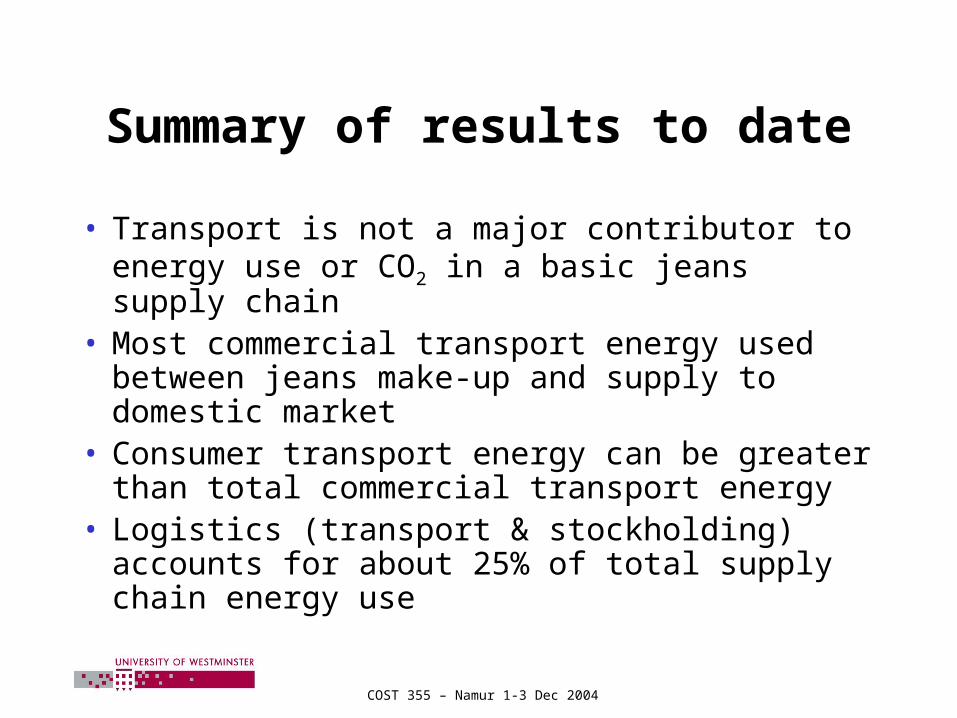
Summary of results to date
• Transport is not a major contributor to energy use or CO2 in a basic jeans supply chain
• Most commercial transport energy used between jeans make-up and supply to domestic market
• Consumer transport energy can be greater than total commercial transport energy
• Logistics (transport & stockholding) accounts for about 25% of total supply chain energy use