COSC 3461: Module 7 Graphical Display. 2 Issues for Graphical Representation How should the...
63
COSC 3461: Module 7 Graphical Display
-
Upload
myron-leonard -
Category
Documents
-
view
214 -
download
0
Transcript of COSC 3461: Module 7 Graphical Display. 2 Issues for Graphical Representation How should the...

COSC 3461: Module 7
Graphical Display

2
Issues for Graphical Representation
• How should the graphical images be represented (formally, internally)?
• How should imaged be presented (externally)?

3
Frame Buffer Architecture
Display
Display Controller
Frame buffer memory
Application processes
turn contents of frame buffer into visible image
set pixel values

4
Issues for Graphical Representation
• Consider the hardware for graphics: – Cathode Ray Tube (CRT)– Liquid Crystal Display (LCD)– Thin Film Transistor (TFT)
– Pen plotter, laser printer

5
The Raster
• The raster is the viewable area of the display
• Size of a display– typically given by the diagonal dimension of the
raster – usually specified in inches (e.g., 19”, 17”, 15”,
…)
15”

6
Pixels
• Image composed of a discrete number of “points”• Each point has a image depth • Image depth is the number of bits used to
represent each pixel– How many colours (or shades of grey) can be
represented?– It is a function of image depth:
• 1 bit: can distinguish between black or white• 8 bits (1 byte): can distinguish among 28 = 256 shades or
grey or 256 colours• 24-bit (3 bytes): can distinguish among 224 = 16.8 million
colours

7
Resolution
• Resolution is the number of pixels on a display
• Given as: n by m– n is the number of pixels across the display– m is the number of pixels down the display
• Typical resolutions range from…– 640x480, 1024x768, 1280x1024
• Total number of pixels is n m– 640 480 = 307,200 pixels– 1,600 1,200 = 1,920,000 pixels

8
Aspect Ratio
• Aspect ratio:– the ratio of the width to height of a display
screen– w:h
• For a 640×480 display:– the aspect ratio is 4:3 (640:480)
• Related:– Landscape
• The width is greater than the height
– Portrait• The height is greater than the width

9
Video RAM
• Why does video RAM matter?• Frame buffer architecture:
Display
Display Controller
Frame buffer memory
Application processes
turn contents of frame buffer into visible image
set pixel values
10
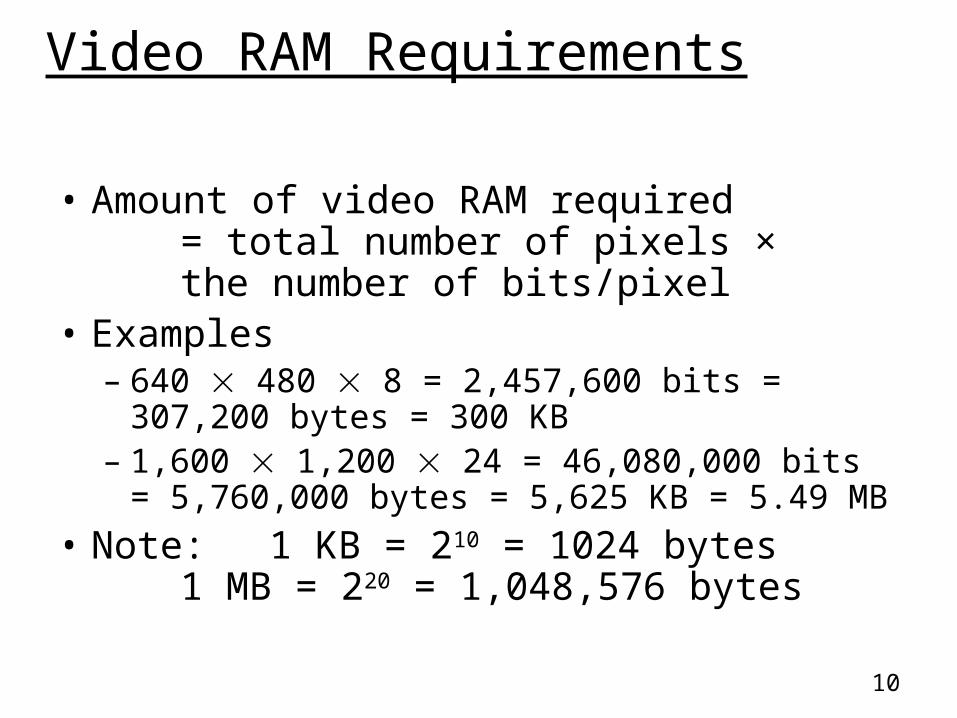
Video RAM Requirements
• Amount of video RAM required = total number of pixels ×
the number of bits/pixel• Examples
– 640 480 8 = 2,457,600 bits = 307,200 bytes = 300 KB
– 1,600 1,200 24 = 46,080,000 bits = 5,760,000 bytes = 5,625 KB = 5.49 MB
• Note: 1 KB = 210 = 1024 bytes1 MB = 220 = 1,048,576 bytes

11
Resolution
Bits per pixel8 bit 16 bit 24 bit
640 x 480 300 (Kb) 600 900
800 x 600 468.75 937.5 1406.25
1024 x 768 768 1536 2304
1152 x 1024
1152 2304 3456
1280 x 1024
1280 2560 3840
1600 x 1200
1875 3750 5625
See previous slide for calculations
Video RAMAmount needed is a function of resolution and image depth

12
Quality of Images
• Refresh Rate – number of times an image is displayed in 1 second.– 75 Hz recommended minimum (considered
“flicker-free”)
• Convergence – the capacity of red, green, or blue electron beams
in cathode ray tube (CRT) displays to strike the same point on a screen
– misalignment of electron beams causes colour purity error
– an issue for CRT, but not for LCD displays
• Dot Pitch

13
LCD, TFT
• Liquid Crystal Display (LCD)– passive- and active-matrix variants– active-matrix LCDs depends on Thin
Film Transistors (TFT)• TFT display means the LCD is “active
matrix”• all TFT displays are LCD displays
– some LCDs exist that are not TFT• they are “dual scan” screens• older laptops, no longer being
manufacturedhttp://electronics.howstuffworks.com/lcd.htm

14
Dot Pitch
• Dot pitch is a measure of the diagonal distance between pixels on a display screen– pixels might be phosphor dots or liquid
crystals

15
Dot Pitch Illustrated
Pixel
Dot Pitch (mm)
Typical values range from 0.15 mm to 0.30 mm

16
Dot Pitch Calculation
• What is the dot pitch of 15” display with a resolution of 640 by 480?
640
480
Z
Notes:1. Z = (6402 + 4802)1/2 = 8002. 1 mm = 0.039 inch
Dot pitch = 15 / 800
= 0.01875 inches
= 0.01875 / 0.039 mm
= 0.481 mm

17
Models for the Display of 2D Images
• Stroke Model– images composed of strokes; each
stroke has a colour and a thickness– inadequate for realistic or complex
images
• Region Model– strokes define closed regions, which
are then filled
• Pixel Model

18
A Pixel Image
pixel

19
A Pixel Image

20
A Pixel Image

21
A Pixel Image

22
A Pixel Image

23
pixel
A Pixel Image

24
Coordinate Systems
• Device coordinates• Physical coordinates

25
Device Coordinates
• Typically given in dots or pixelsx horizontally (to the right or left)y vertically (up or down)
• Possible origins– Center– Bottom left– Upper left
• Window coordinates vs. component coordinates

26
Component
Java’s Coordinate System
(0,0)
x
y (width – 1, height - 1)

27
Example
DemoMouseEvents.java
(x, y)coordinate of pointer incomponent

28
Device Coordinates
• What happens when the resolution of the display devices changes?

29
Physical Coordinates
• Sometimes need to specify display coordinates in physical units – points, inches, feet, cm,
meters
• The applications must perform conversions– for display, for printing

30
Colour

31
Vision Basics

32

33
Vision Basics
• photoreceptors are situated on the retina– two types: rods and cones
• several layers of cells cover the photoreceptors– when light enters eye, it passes through
these layers of cells before it hits the photoreceptors
– foveal and peripheral vision - correspond to different parts of the retina

34
Areas of the Retina• fovea
– in center of retina, specialized for acute detailed vision
• top layer of cells are almost absent• tight packing of receptors (cones, no rods)
• periphery of retina– proportion of rods to cones increase
toward edge of retina

35
Colour
• Hue is what we normally think of as colour – e.g., red vs. orange vs. yellow vs. green
etc.– three types of cones: short-, medium-,
and long-wavelengthRed – perceived by long-wavelength cones Green – perceived by medium-wavelength conesBlue – perceived by short-wavelength cones

36
Colour
• Intensity – also called luminance or brightness
• how much light/dark
– rods are more sensitive to light than cones
• are not specialized to particular wavelengths, instead attuned to a broad spectrum of light

37
Colour
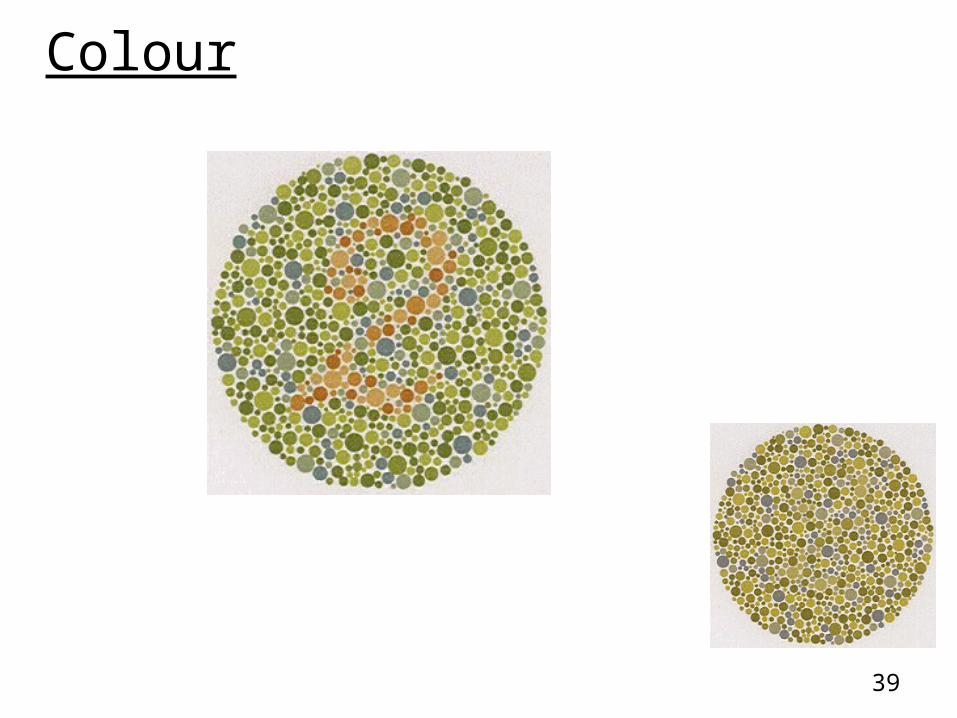
• Dyschromatopsia– A condition in which the ability to
perceive colours is not fully normal• 5-8% of males, 0.5% of women• red-green colour blindness most prevalent

38
Colour
39
Colour

40
Colour

41
Colour
• Ratio of cones to rods in human retina is 1:10– what does this mean for relative
sensitivity to variations in hue vs. intensity?
42
Colour
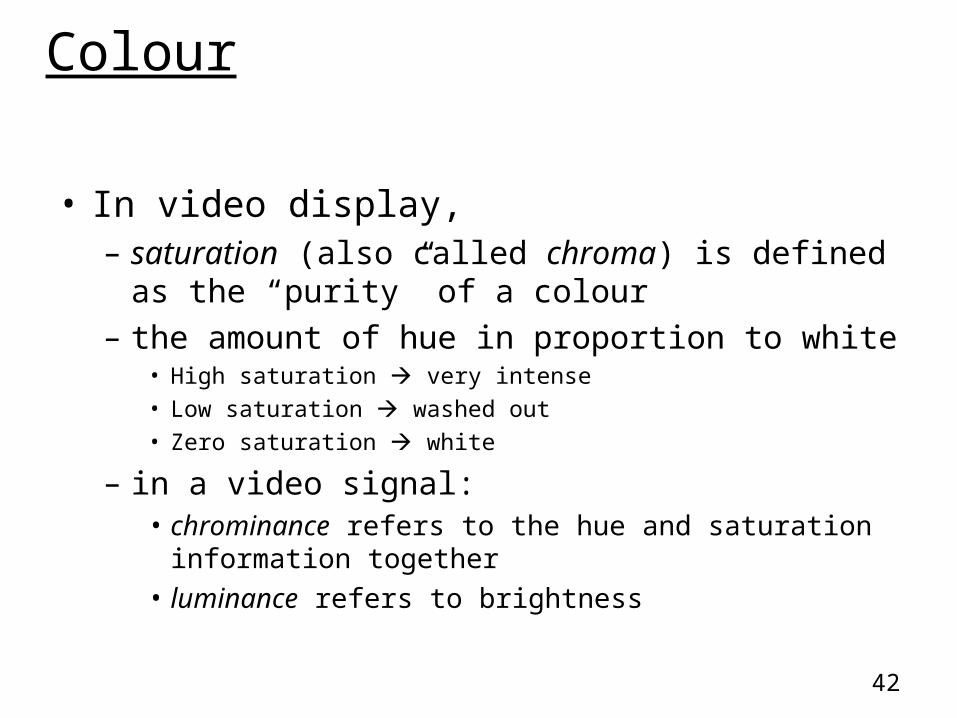
• In video display, – saturation (also called chroma) is defined
as the “purity” of a colour – the amount of hue in proportion to white
• High saturation very intense• Low saturation washed out• Zero saturation white
– in a video signal:• chrominance refers to the hue and saturation
information together • luminance refers to brightness

43
Colour
• Models for colour– additive model:
• Red-Green-Blue (RGB)• Cyan-Magenta-Yellow (CMY)• any colour is obtained by the addition/subtraction
of basic components in specific proportions
– tri-stimulus model:• a non-linear transformation of RGB colour space• Hue-Saturation-Intensity (HSI)• Hue-Saturation-Value (HSV)• Hue-Saturation-Brightness (HSB)

44
Colour
• Red-Green-Blue (RGB) model– additive model– each of RED, GREEN, and BLUE individually
specified
• Cyan-Magenta-Yellow (CMY) model– subtractive model– magenta plus yellow produces red– magenta plus cyan makes blue– cyan plus yellow generates green – the combination of cyan, magenta and yellow
form black

45
RGB Model (2)
Color Red Green BlueRed 255 0 0Green 0 255 0Blue 0 0 255Yellow 255 255 0Cyan 0 255 255Magenta 255 0 255White 255 255 255Black 0 0 0

46
RGB Model
black
blue red
green
cyancyan yellowyellow
white
magenta

47
Colour
Hue-Saturation-Value (HSV) model– Each of hue, saturation, and brightness
individually specified– artists sometimes prefer HSV model
over alternative models (RGB, CMY) • similarities to the way humans perceive
colour

48
Colour Choosers
• Use a colour chooser to control colour– also called colour picker
• Colour selected three ways:– From a pre-defined palette – By manipulating HSB values – By manipulating RGB values

49
Pre-definedpalette
For a demo, seeDemoMenu2.java
Java’s JColorChooser (1)

50
HSB
Java’s JColorChooser (2)
For a demo, seeDemoMenu2.java

51
RGB
Java’s JColorChooser (3)
For a demo, seeDemoMenu2.java

52
Microsoft Office

54
Paint Shop Pro

55
Text
• One of most common elements in interfaces
• Text has three primary attributes:– Font family
• e.g., Courier, Verdana, Palatino
– Style (e.g., bold, italic, bold-italic)– Size and Spacing (e.g., 10 point, 24
point, etc)

56
Illustration of Serifs
AB abAB ab
Times roman
Bookman oldstyle
serifs
A serif is a short line extending from and at an angle to the upper and lower strokes of a letter
57
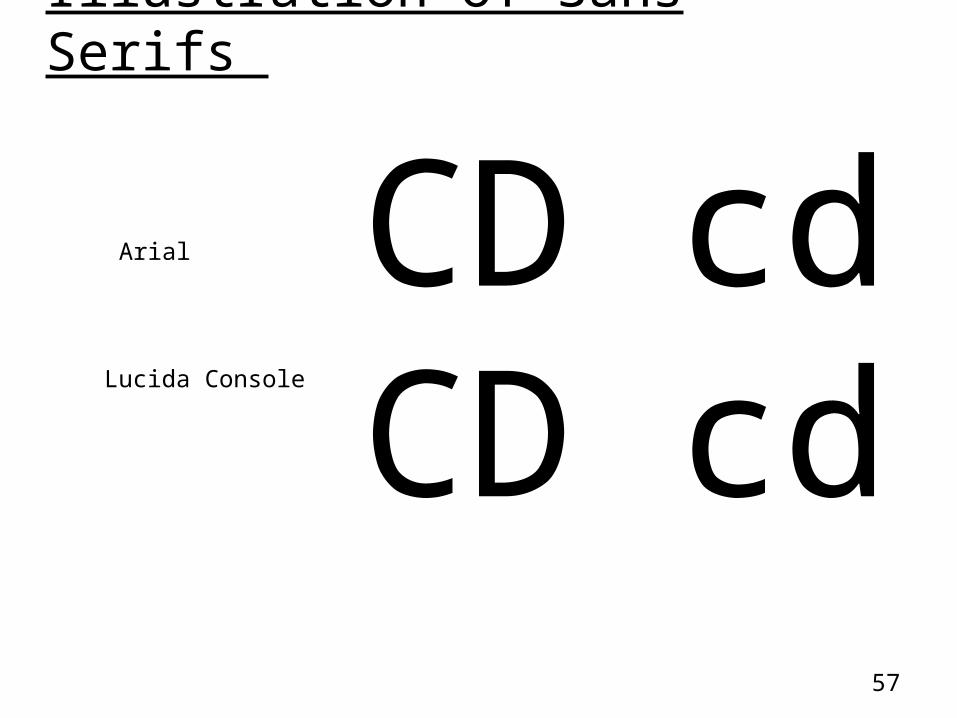
Illustration of Sans Serifs
CD cdCD cd
Arial
Lucida Console

58
Three Basic Types of Font Families
• Types with serifs:– e.g., Times Roman– Serif fonts facilitate human perception,
distinguishing among letters • Sans serif types:
– e.g., Arial– Without serifs
• Monospaced or fixed-pitch types:– e.g., Courier– Each character occupies the same amount of
horizontal space (cf. variable pitch)

59
Monospaced Illustrated
IM imIM im
Courier new
Lucida Console

60
Font Styles for Times New Roman
• Plain
• Italic
• Bold
• Italic + bold
Hello Java World
Hello Java World
Hello Java World
Hello Java World

61
Font Size
• Font size is measured in points– 72 points per inch, 1 point = 1 / 72 inch– The smallest typographical unit of
measurement
Hello Java World48 point font size

62
Font Spacing

63
Readability of Text
Consider:1. THE SMALL BOY RAN THROUGH THE
HOUSE2. The small boy ran through the house3. The small BOY ran through the house
Which takes longer to read? Which one has an important word?

64
Readability of Text
Consider:1. The small boy ran through the
house.2. The small boy ran through the house.
Which one is easier to read on paper? Which one is produced better on-
screen?