
CorticospinalBeta-RangeCoherenceIsHighlyDependenton thePre ...
9
Behavioral/Systems/Cognitive Corticospinal Beta-Range Coherence Is Highly Dependent on the Pre-stationary Motor State Wolfgang Omlor, Luis Patino, Ignacio Mendez-Balbuena, Ju ¨rgen Schulte-Mo ¨nting, and Rumyana Kristeva Neurological Clinic, University of Freiburg, D-79106 Freiburg, Germany During steady muscle contractions, the human sensorimotor cortex generates oscillations in the beta-frequency range (15–30 Hz) that are coherent with the activity of contralateral spinal motoneurons. This corticospinal coherence is thought to favor stationary motor states, but its mode of operation remains elusive. We hypothesized that corticospinal beta-range coherence depends on the sensorimotor processing state before a steady force task and may thus increase after sensorimotor tuning to dynamic force generation. To test this hypothesis we instructed 16 human subjects to compensate static force after rest as well as after compensating predictable or unpredict- able dynamic force with their right index finger. We calculated EEG-EMG coherence, cortical motor spectral power, and the motor performance during the force conditions. Corticospinal beta-coherence during stationary force was excessively elevated if the steady- state contraction was preceded by predictable dynamic force instead of rest, and was highest after unpredictable dynamic force. The beta-power decreased from rest to predictable dynamic force, and was lowest during unpredictable dynamic force. The increase in corticospinal beta-coherence showed a significant negative correlation with the preceding change in beta-power. The tuning to dynamic force did not entail an inferior motor performance during static force. The results imply a correlation between corticospinal beta-range coherence and the computational load of the preceding isometric motor engagement. We suggest beta-range coherence provides a functional corticospinal gateway for steady force-related processing that can override cortical states tuned to dynamic force. The mod- ulation of corticospinal beta-range coherence might thus ensure comparable precision of static force in various motor contexts. Introduction Synchronized oscillatory activity in the beta-frequency band (15–30 Hz) can be observed over the sensorimotor cortex of pri- mates and humans (Donoghue et al., 1992, 1998; Murthy and Fetz, 1992, 1996b; Sanes and Donoghue, 1993; Baker et al., 1999). Such beta-range oscillations are known to spread via the pyrami- dal tract to contralateral neurons in the spinal cord, giving rise to constant phase relations between cortical and electromyographic oscillations as assessed by the coherence function (Conway et al., 1995; Murthy and Fetz, 1996a; Baker et al., 1997; Salenius et al., 1997; Brown et al., 1998; Feige et al., 2000; Gross et al., 2000; Tecchio et al., 2008). Both in primates and in humans, this cor- ticospinal beta-range coherence is most prominent during steady-state contractions while being abolished during the pre- ceding phasic movements (Baker et al., 1997; Kilner et al., 1999, 2000, 2004; Feige et al., 2000; Baker, 2007; Engel and Fries, 2010). During a steady-state contraction, corticospinal beta-range co- herence correlates with the performance of stationary force ap- plication and has been suggested as a mechanism for effective corticospinal interaction (Baker et al., 1999; Kristeva et al., 2007). Before the steady-state contraction, coherent corticospinal beta- range oscillations correlate with the digit displacement in a precision grip task, thereby reflecting the recalibration of the sensorimotor system following phasic movements (Kilner et al., 2000; Riddle and Baker, 2006). Despite the dependence of beta-range coher- ence on features of the preceding ramp phase, it remains unknown to what extent the motor state several seconds before the ramp phase af- fects corticospinal beta-range coherence. It has been suggested recently that memory traces associated with the preceding motor experience can be formed in M1 for the precise scaling of the current grip force (Chouinard et al., 2005; Nowak et al., 2005; Berner et al., 2007; Loh et al., 2010). In this regard, we hypothesized that corticospinal beta-range coherence is modulated by the sensorimotor memory, more precisely by the level of sensorimotor processing that occurred several seconds before the steady force task. Therefore we predicted a distinct increase of beta-range coherence after the motor system is tuned to the processing of nonstationary sensorimotor information, that is, after switching over from a long-lasting dynamic force to a stationary force. Corticospinal beta-range coherence is thought to promote sensorimotor processing related to the maintenance of steady-state contractions (Baker, 2007; Bressler, 2009; Tsu- jimoto et al., 2009) and may therefore be the appropriate candi- date for overriding sensorimotor processing states tuned to dynamic force. To test our hypothesis, we compared three isometric static conditions with regard to EEG-EMG coherence, cortical spectral power, and motor performance: The first static contraction Received Aug. 9, 2010; revised Feb. 21, 2011; accepted April 16, 2011. Author contributions: W.O. designed research; W.O., L.P., and I.M.-B. performed research; J.S.-M. analyzed data; W.O. and R.K. wrote the paper. This work was supported by Deutsche Forschungsgemeinschaft grants (Kr 1392/7-5 and Kr 1392/11-1). We thank M. C. Hepp-Reymond for the stimulating discussions, and F. Huethe for the technical help. Correspondence should be addressed to Dr. Rumyana Kristeva, Neurological Clinic, University of Freiburg, Breisacherstrasse 64, D-79106 Freiburg, Germany. E-mail: [email protected]. DOI:10.1523/JNEUROSCI.4153-10.2011 Copyright © 2011 the authors 0270-6474/11/318037-09$15.00/0 The Journal of Neuroscience, June 1, 2011 • 31(22):8037– 8045 • 8037
Transcript of CorticospinalBeta-RangeCoherenceIsHighlyDependenton thePre ...
Behavioral/Systems/Cognitive
Corticospinal Beta-Range Coherence Is Highly Dependent onthe Pre-stationary Motor State
Wolfgang Omlor, Luis Patino, Ignacio Mendez-Balbuena, Jurgen Schulte-Monting, and Rumyana KristevaNeurological Clinic, University of Freiburg, D-79106 Freiburg, Germany
During steady muscle contractions, the human sensorimotor cortex generates oscillations in the beta-frequency range (15–30 Hz) thatare coherent with the activity of contralateral spinal motoneurons. This corticospinal coherence is thought to favor stationary motorstates, but its mode of operation remains elusive. We hypothesized that corticospinal beta-range coherence depends on the sensorimotorprocessing state before a steady force task and may thus increase after sensorimotor tuning to dynamic force generation. To test thishypothesis we instructed 16 human subjects to compensate static force after rest as well as after compensating predictable or unpredict-able dynamic force with their right index finger. We calculated EEG-EMG coherence, cortical motor spectral power, and the motorperformance during the force conditions. Corticospinal beta-coherence during stationary force was excessively elevated if the steady-state contraction was preceded by predictable dynamic force instead of rest, and was highest after unpredictable dynamic force. Thebeta-power decreased from rest to predictable dynamic force, and was lowest during unpredictable dynamic force. The increase incorticospinal beta-coherence showed a significant negative correlation with the preceding change in beta-power. The tuning to dynamicforce did not entail an inferior motor performance during static force. The results imply a correlation between corticospinal beta-rangecoherence and the computational load of the preceding isometric motor engagement. We suggest beta-range coherence provides afunctional corticospinal gateway for steady force-related processing that can override cortical states tuned to dynamic force. The mod-ulation of corticospinal beta-range coherence might thus ensure comparable precision of static force in various motor contexts.
IntroductionSynchronized oscillatory activity in the beta-frequency band(15–30 Hz) can be observed over the sensorimotor cortex of pri-mates and humans (Donoghue et al., 1992, 1998; Murthy andFetz, 1992, 1996b; Sanes and Donoghue, 1993; Baker et al., 1999).Such beta-range oscillations are known to spread via the pyrami-dal tract to contralateral neurons in the spinal cord, giving rise toconstant phase relations between cortical and electromyographicoscillations as assessed by the coherence function (Conway et al.,1995; Murthy and Fetz, 1996a; Baker et al., 1997; Salenius et al.,1997; Brown et al., 1998; Feige et al., 2000; Gross et al., 2000;Tecchio et al., 2008). Both in primates and in humans, this cor-ticospinal beta-range coherence is most prominent duringsteady-state contractions while being abolished during the pre-ceding phasic movements (Baker et al., 1997; Kilner et al., 1999,2000, 2004; Feige et al., 2000; Baker, 2007; Engel and Fries, 2010).During a steady-state contraction, corticospinal beta-range co-herence correlates with the performance of stationary force ap-plication and has been suggested as a mechanism for effective
corticospinal interaction (Baker et al., 1999; Kristeva et al., 2007).Before the steady-state contraction, coherent corticospinal beta-range oscillations correlate with the digit displacement in a precisiongrip task, thereby reflecting the recalibration of the sensorimotorsystem following phasic movements (Kilner et al., 2000; Riddleand Baker, 2006). Despite the dependence of beta-range coher-ence on features of the preceding ramp phase, it remains unknown towhat extent the motor state several seconds before the ramp phase af-fects corticospinal beta-range coherence.
It has been suggested recently that memory traces associatedwith the preceding motor experience can be formed in M1 for theprecise scaling of the current grip force (Chouinard et al., 2005;Nowak et al., 2005; Berner et al., 2007; Loh et al., 2010). In thisregard, we hypothesized that corticospinal beta-range coherenceis modulated by the sensorimotor memory, more precisely by thelevel of sensorimotor processing that occurred several secondsbefore the steady force task. Therefore we predicted a distinctincrease of beta-range coherence after the motor system is tunedto the processing of nonstationary sensorimotor information,that is, after switching over from a long-lasting dynamic force toa stationary force. Corticospinal beta-range coherence is thoughtto promote sensorimotor processing related to the maintenanceof steady-state contractions (Baker, 2007; Bressler, 2009; Tsu-jimoto et al., 2009) and may therefore be the appropriate candi-date for overriding sensorimotor processing states tuned todynamic force.
To test our hypothesis, we compared three isometric staticconditions with regard to EEG-EMG coherence, cortical spectralpower, and motor performance: The first static contraction
Received Aug. 9, 2010; revised Feb. 21, 2011; accepted April 16, 2011.Author contributions: W.O. designed research; W.O., L.P., and I.M.-B. performed research; J.S.-M. analyzed data;
W.O. and R.K. wrote the paper.This work was supported by Deutsche Forschungsgemeinschaft grants (Kr 1392/7-5 and Kr 1392/11-1). We
thank M. C. Hepp-Reymond for the stimulating discussions, and F. Huethe for the technical help.Correspondence should be addressed to Dr. Rumyana Kristeva, Neurological Clinic, University of Freiburg,
Breisacherstrasse 64, D-79106 Freiburg, Germany. E-mail: [email protected]:10.1523/JNEUROSCI.4153-10.2011
Copyright © 2011 the authors 0270-6474/11/318037-09$15.00/0
The Journal of Neuroscience, June 1, 2011 • 31(22):8037– 8045 • 8037
started from rest, the second was performed after a periodicallymodulated dynamic force, and the third had to be performedafter an unpredictable dynamic force. Thus, from condition 1 to3, the complexity of the motor engagement before the stationarycontraction was increasing along the condition periods rest, pre-dictable dynamic force, and unpredictable dynamic force.
Materials and MethodsSubjectsThe study consisted of two separate experimental series: eight subjects(mean age, 31.9 � 13.7 years, 4 men) participated in experiment 1 andanother eight (mean age, 29.3 � 13.4 years, 2 men) participated in ex-periment 2. At the time of the experiments, all subjects were healthy anddid not have any history of neurological disease. All subjects were right-handed as assessed by the Edinburgh Handedness Inventory (Oldfield,1971). They gave written consent before the experiment in accordancewith the Declaration of Helsinki, and all procedures were approved bythe local ethics committee. Every subject experienced similar experi-ments before.
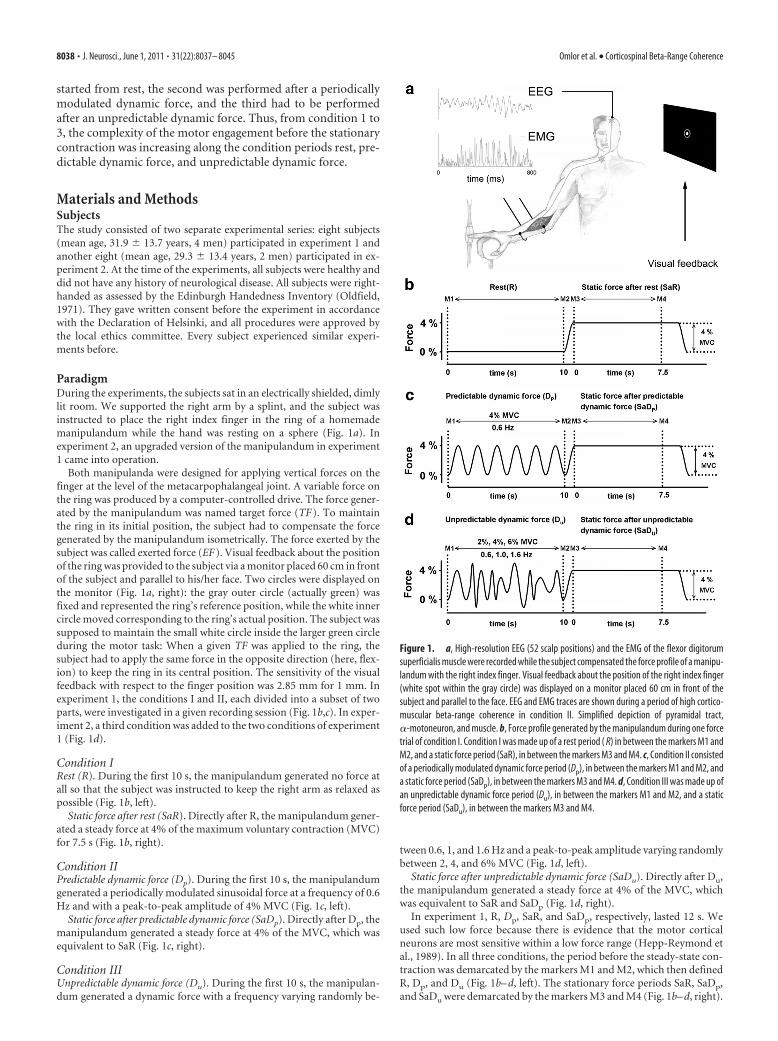
ParadigmDuring the experiments, the subjects sat in an electrically shielded, dimlylit room. We supported the right arm by a splint, and the subject wasinstructed to place the right index finger in the ring of a homemademanipulandum while the hand was resting on a sphere (Fig. 1a). Inexperiment 2, an upgraded version of the manipulandum in experiment1 came into operation.
Both manipulanda were designed for applying vertical forces on thefinger at the level of the metacarpophalangeal joint. A variable force onthe ring was produced by a computer-controlled drive. The force gener-ated by the manipulandum was named target force (TF ). To maintainthe ring in its initial position, the subject had to compensate the forcegenerated by the manipulandum isometrically. The force exerted by thesubject was called exerted force (EF ). Visual feedback about the positionof the ring was provided to the subject via a monitor placed 60 cm in frontof the subject and parallel to his/her face. Two circles were displayed onthe monitor (Fig. 1a, right): the gray outer circle (actually green) wasfixed and represented the ring’s reference position, while the white innercircle moved corresponding to the ring’s actual position. The subject wassupposed to maintain the small white circle inside the larger green circleduring the motor task: When a given TF was applied to the ring, thesubject had to apply the same force in the opposite direction (here, flex-ion) to keep the ring in its central position. The sensitivity of the visualfeedback with respect to the finger position was 2.85 mm for 1 mm. Inexperiment 1, the conditions I and II, each divided into a subset of twoparts, were investigated in a given recording session (Fig. 1b,c). In exper-iment 2, a third condition was added to the two conditions of experiment1 (Fig. 1d).
Condition IRest (R). During the first 10 s, the manipulandum generated no force atall so that the subject was instructed to keep the right arm as relaxed aspossible (Fig. 1b, left).
Static force after rest (SaR). Directly after R, the manipulandum gener-ated a steady force at 4% of the maximum voluntary contraction (MVC)for 7.5 s (Fig. 1b, right).
Condition IIPredictable dynamic force (Dp). During the first 10 s, the manipulandumgenerated a periodically modulated sinusoidal force at a frequency of 0.6Hz and with a peak-to-peak amplitude of 4% MVC (Fig. 1c, left).
Static force after predictable dynamic force (SaDp). Directly after Dp, themanipulandum generated a steady force at 4% of the MVC, which wasequivalent to SaR (Fig. 1c, right).
Condition IIIUnpredictable dynamic force (Du). During the first 10 s, the manipulan-dum generated a dynamic force with a frequency varying randomly be-
tween 0.6, 1, and 1.6 Hz and a peak-to-peak amplitude varying randomlybetween 2, 4, and 6% MVC (Fig. 1d, left).
Static force after unpredictable dynamic force (SaDu). Directly after Du,the manipulandum generated a steady force at 4% of the MVC, whichwas equivalent to SaR and SaDp (Fig. 1d, right).
In experiment 1, R, Dp, SaR, and SaDp, respectively, lasted 12 s. Weused such low force because there is evidence that the motor corticalneurons are most sensitive within a low force range (Hepp-Reymond etal., 1989). In all three conditions, the period before the steady-state con-traction was demarcated by the markers M1 and M2, which then definedR, Dp, and Du (Fig. 1b– d, left). The stationary force periods SaR, SaDp,and SaDu were demarcated by the markers M3 and M4 (Fig. 1b– d, right).
Figure 1. a, High-resolution EEG (52 scalp positions) and the EMG of the flexor digitorumsuperficialis muscle were recorded while the subject compensated the force profile of a manipu-landum with the right index finger. Visual feedback about the position of the right index finger(white spot within the gray circle) was displayed on a monitor placed 60 cm in front of thesubject and parallel to the face. EEG and EMG traces are shown during a period of high cortico-muscular beta-range coherence in condition II. Simplified depiction of pyramidal tract,�-motoneuron, and muscle. b, Force profile generated by the manipulandum during one forcetrial of condition I. Condition I was made up of a rest period ( R) in between the markers M1 andM2, and a static force period (SaR), in between the markers M3 and M4. c, Condition II consistedof a periodically modulated dynamic force period (Dp), in between the markers M1 and M2, anda static force period (SaDp), in between the markers M3 and M4. d, Condition III was made up ofan unpredictable dynamic force period (Du), in between the markers M1 and M2, and a staticforce period (SaDu), in between the markers M3 and M4.
8038 • J. Neurosci., June 1, 2011 • 31(22):8037– 8045 Omlor et al. • Corticospinal Beta-Range Coherence
To ensure a smooth start of the static force part, a rising sine function wasused that was identical to the rising sine parts during Dp. In experiment 1,the motor task included a series of 35 trials of condition 1 and 2, respec-tively, and the application of each condition was randomized within the70 trials. In experiment 2, the motor task included a series of 35 trials ofcondition 1, 2, and 3, respectively, and the application of each conditionwas randomized within the 105 trials. In experiment 1 and 2, rest inter-vals of 10 –15 s were included between the trials. The subjects were in-structed to fix their gaze on the visual feedback and to avoid any othermovements during the task.
RecordingsElectrical potentials (bandpass 0 –200 Hz, sampling rate 1000 Hz) wererecorded from 52 scalp positions according to the international 10--20system (SynAmp 2, NeuroScan) referenced to Cz with ground at FzA.Electrode impedances were �5 k� during the experimental session. Werecorded the electrooculogram (EOG) (same bandpass and samplingrate as for EEG) to exclude trials contaminated with eye movements fromfurther analysis. Electromyographic (EMG) activity (bandpass 5–200 Hz,sampling rate 1000 Hz) was recorded from the pars indicis of the rightflexor digitorum superficialis muscle. The TF, the EF, and the position ofthe index finger (POS) were recorded in parallel with the electrophysio-logical data (the same bandpass and sampling rate as for EEG). EEG,EOG, and EMG were saved and then analyzed off-line.
Data analysisThe continuous data in between the markers M1 and M2, as well as inbetween the markers M3 and M4, were further divided into successivesegments of 512 ms length, allowing for a frequency resolution of 1.96Hz. The EEG signal was then transformed into the reference-free currentsource density distribution (CSD) to reduce volume conduction effects(Nunez et al., 1997). The CSD algorithm was estimated by means of thespherical spline interpolation method (Perrin et al., 1989), which wasimplemented in the commercial software BrainVision 1.05. Artifact re-jection was visually performed off-line by inspecting segment by seg-ment. Segments contaminated with eye movements were excluded. Inevery subject, �300 artifact-free segments could be kept in every condi-tion period, and we regularly selected the first 300 artifact-free segmentsfor further analysis. Because full-wave rectification provides the tempo-ral pattern of grouped firing motor units (Halliday et al., 1995), the EMGsignal was rectified. The discrete 512 point Fourier transform was calcu-lated for each segment for the whole 1–500 Hz frequency range. Calcu-lation of the EEG spectral power (sP) for a given channel (c) was furthercalculated according to the following formula:
sPc� f � �1
n�i�1
n
Ci� f �Ci�� f �, (1)
where Ci represents the Fourier-transformed channel c for a given seg-ment number (i � 1 . . . n) and * indicates the complex conjugate.
Coherence (Coh) values were calculated between the EEG channelsand the rectified EMG to investigate the synchronization between thetwo signals. Coh values were calculated on the basis of the followingequations:
Cohcl,c2� f � ��Sc1,c2� f ��2
�sPc1� f �� � �sPc2� f ��, (2)
where
Sc1,c2� f � �1
n�i�1
n
c1i� f �c2i�� f �. (3)
Thus, S(c1,c2)( f ) is the cross-spectrum for the EEG signal in channel c1and the rectified EMG signal in channel c2 at a given frequency, f, andsPc1( f ) and sPc2( f ) are the respective power spectra for c1 and c2 at thesame frequency. For the frequency f, the coherence value, Coh(c1,c2)( f ),thus corresponds to the squared magnitude of a complex correlationcoefficient. Coh(c1, c2)( f ) is then a real number between 0 and 1. Coher-
ence is considered to be significant if the resulting value lies above theconfidence level (CL) (Rosenberg et al., 1989).
CL��� � 1 � �1 � ��1
n�1, (4)
where n is the number of segments and � is the desired level of confi-dence. We considered coherence to be significant above the 95% confi-dence limit. The highest coherence peaks were observed over the leftmotor cortex contralateral to the active right index finger (EEG channelsFC3, C1, and C3). For the grand average, we have always chosen thechannel with the highest coherence (FC3, C1, or C3).
Quantification of coherence and spectral power for thestatistical analysis (experiment 1 and 2)To test for any statistical difference on coherence and cortical spectralpower between R, Dp, and Du, as well as between SaR, SaDp, and SaDu, wemeasured the area under the coherence curve and above the significancelevel, ACoh, and under the spectral power curve, APow (in the channelwith the highest significant coherence area in the beta- or gamma-range),in between two frequency windows: 15–30 Hz for the beta and 30 – 45 Hzfor the gamma-range.
Statistical procedures in experiment 1Statistical analysis of spectral power and coherence. Individual values forthe area under the coherence curve and above significance level were firsttransformed logarithmically to yield symmetric distributions accordingto the formula,
ACoh � log�0.0001 � ACoh� � 4. (5)
To evaluate the difference in magnitude of beta-range coherence betweenSaR and SaDp, we subtracted the significant beta-range coherence area ofSaR from the significant beta-range coherence area of SaDp:
diffACoh � ACoh(SaDp) � ACoh(SaR). (6)
These steps prepared the data for the use of an ANOVA. To statisticallyverify the hypothesis that the corticospinal beta-range coherence de-pends on the engagement of the sensorimotor system before a steadycontraction task, our analysis of coherence and spectral power consistedof a three-way ANOVA with repeated measures on three factors. The firstfactor, called condition, had two levels, which are the two different con-ditions tested (level 1, condition 1—rest and static force after rest; level 2,condition 2—predictable dynamic force and static force after predictabledynamic force). The second factor, called motor state, related to theengagement of the sensorimotor system and had two levels (level 1, pre-stationary motor state; and level 2, stationary motor state). The thirdfactor was the frequency band, with two levels (level 1, beta; level 2,gamma). We tested the null hypothesis that the distributions of Coh andsP values tested in our ANOVA design are the same across all differentmotor contraction types. Since the ANOVA indicated a significant dif-ference in some effects, among them, their interaction, we performed the(nonparametric) paired Wilcoxon test as a post hoc test on the resultingvalues ACoh for corticospinal coherence, and APow for cortical spectralpower. The null hypothesis was that the difference between the matchedsamples of coherence and power spectra from both static condition partscomes from a distribution which is symmetric around zero.
Calculation and statistical analysis of the performance. To eliminateoffsets accumulated during the recording, the TF and the EF were filteredoff-line (bandpass filter of 0.5–30 Hz). To avoid power supply artifacts,we selected the high 30 Hz cutoff, which was large enough to record thechanges of the force applied to the ring. The error E between the TF andthe EF was calculated to evaluate the performance of the subjects:
E � TF � EF. (7)
Since the force generated by the manipulandum was the reference thesubject had to adapt to, the mean squared error (MSEi) of the subject
Omlor et al. • Corticospinal Beta-Range Coherence J. Neurosci., June 1, 2011 • 31(22):8037– 8045 • 8039
force (EF ) around its reference (TF ) was calculated using the followingformula,
MSEi � �k�1
s �Ek,i�2
s, (8)
where, again, i � 1 . . . n is the segment number, k � 1 . . . s is the sam-pled point in the actual segment i, and s � 512 is the number of sampledpoints in each segment. A measure of the cumulative MSE was obtainedby adding up individual segment values, as follows:
MSE � �i�1
n
MSEi. (9)
To account for the intersubject variability and to render the distributionsymmetric, the error values were first logarithmically transformed:
MSE � log�100,000 � MSE� � 5. (10)
To evaluate the difference in magnitude of the force error between SaRand SaDp, we subtracted the MSE of SaR from the MSE of SaDp:
diffMSE � MSE�SaDp� � MSE�SaR�. (11)
We then performed the nonparametric paired Wilcoxon test of the nullhypothesis that the difference between the matched samples of the forceerror from both static condition parts comes from a distribution which issymmetric around zero.
Statistical procedures in experiment 2Statistical analysis of the spectral power and coherence. Individual valuesfor the coherent area under the curve and above significance level werefirst transformed logarithmically to yield symmetric distributions ac-cording to the formula,
ACoh � log�0.001 � ACoh� � 3. (12)
In a similar way, individual values for the power area under the curvewere transformed logarithmically to yield symmetric distributions ac-cording to the formula,
APow � log�1 � APow�. (13)
To evaluate the difference in magnitude of beta-range coherence betweenSaR and SaDp, between SaR and SaDu as well as between SaDp and SaDu,we subtracted the significant beta-range coherence area of SaR from thesignificant beta-range coherence area of SaDp and SaDu, respectively, aswell as the significant beta-range coherence area of SaDp from SaDu. Anequivalent subtraction was performed for the beta-range spectral power.Afterward, the nonparametric Friedman test was applied to comparevalues ACoh for coherence and APow for spectral power, measured in allthree conditions for each single subject, with the null hypothesis that thedistributions of the values tested are the same across all three conditions.The Friedman test with the global null hypothesis was calculated first toavoid an �-adjustment in the simultaneous paired hypotheses. When theFriedman test indicated that not all of the three conditions were statisti-cally equivalent, we performed a second nonparametric test (paired Wil-coxon test) on the resulting values ACoh for coherence and APow forspectral power. The null hypothesis was that the difference between thematched samples of coherence and power spectra arises from a distribu-tion that is symmetric around zero. We applied the post hoc test on thefollowing pairs: R and Dp, R and Du, Dp and Du, SaR and SaDp, SaR andSaDu, and SaDp and SaDu.
Statistical analysis of the performanceIn the upgraded manipulandum that has been used in experiment 2, theperformance had to be quantified using the position channel.
The position channel (POS) was filtered off-line. To avoid power sup-ply artifacts, we selected the high 70 Hz cutoff and the 50 Hz notch filter,which were high enough to record changes of the index finger position.The mean position error, Ep, of the index finger position compared with
the central position within the green circle was calculated to evaluate theperformance of the subjects, as follows:
Ep �1
s � n �i�1
n ��k�1
s
Ek,i�, (14)
where k � 1 . . . s is the sampled point in the actual segment i, i � 1 . . . nis the segment number, and s � 512 is the number of sampled points ineach segment.
To account for the intersubject variability and to render the distribu-tion symmetric, the error values were first logarithmically transformed:
Ep � log�15 � Ep� � log�15�. (15)
To evaluate the difference in magnitude of the position error betweenSaR, SaDp and SaDu, we subtracted the Ep of SaR from the Ep of SaDp
and SaDu, respectively. Afterward, the nonparametric Friedman test wasapplied to compare values Ep for the position error, measured in all threeconditions for each single subject with the null hypothesis that the dis-tributions of the values tested are the same across all three conditions.When the Friedman test indicated that not all of the three conditionswere statistically equivalent, we performed a second nonparametric test(paired Wilcoxon test) on the resulting values Ep. To evaluate the dif-ference in magnitude of the position error between Dp and Du, we sub-tracted the Ep of Dp from the Ep of Du, respectively. Afterward, thenonparametric sign test was performed with the null hypothesis thatthere is no difference in medians between the distribution of the valuestested in both conditions.
Statistical analysis of correlations (experiment 1 and 2)Whenever the Wilcoxon test indicated a significant change in coherenceor spectral power between equal time periods of the conditions I, II, orIII, we calculated the Spearman correlation coefficient between the re-spective changes in the significant coherence areas and/or spectral powerareas. The significance of correlations was calculated two-tailed.
ResultsExperiment 1Corticospinal coherenceWith regard to corticospinal coherence, the ANOVA indicatedsignificant differences on the motor state (F � 26.87, p � 0.0013),the condition (F � 31.24, p � 0.0008), and their interactioncombined with the Frequency band factor (motor state condi-tion frequency band, F � 125.48, p � 0.0001). We thus com-pared R to Dp and SaR to SaDp.
All eight subjects generated systematically increased cortico-spinal gamma-range coherence when Dp was compared with R.Across subjects, the maximum coherence amplitudes during Dp
varied between 0.017 and 0.052. The increase in corticospinalgamma-range coherence from R to Dp was statistically significant( p � 0.0078, Wilcoxon paired test, n � 8).
Figure 2 illustrates the superimposition of the coherence spec-tra during SaR (dotted line) and SaDp (solid line) for three rep-resentative subjects and combined across all eight subjects.During SaR, extensive broad-band beta-range coherence wasgenerated in six of the eight subjects, occasionally with minorextensions in the high-� (e.g., subject 1) or low gamma-range(e.g., subject 6) as illustrated in Figure 2.
Subjects 7 and 8 showed low, but still maximal coherence inthe beta-range (Fig. 2; see Fig. 4). Across subjects, the maximumcoherence amplitudes during SaR varied between 0.013 and 0.13.When Dp was applied before the static force (SaDp) instead ofresting, all subjects featured a tremendous increase of corticospi-nal beta-range coherence (Fig. 2; see Fig. 4): depending on thesubject, the significant beta-range coherence area during SaR wasmultiplied by factors ranging from 1.8 to 16 (mean, 7.76). Across
8040 • J. Neurosci., June 1, 2011 • 31(22):8037– 8045 Omlor et al. • Corticospinal Beta-Range Coherence
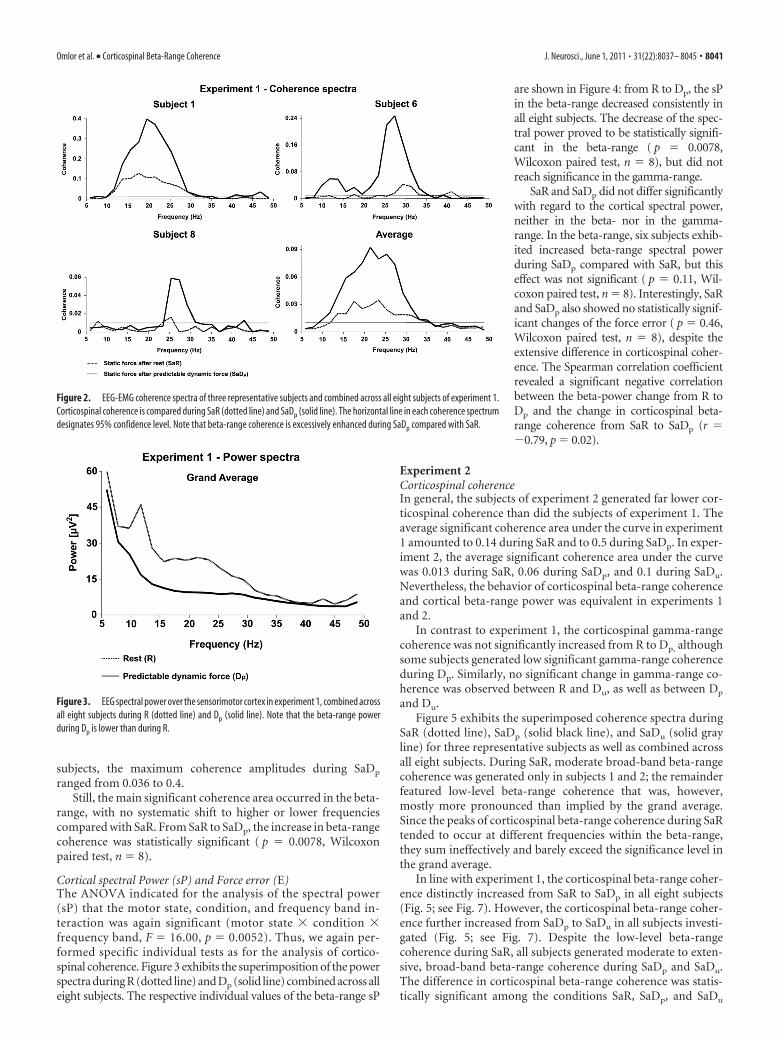
subjects, the maximum coherence amplitudes during SaDp
ranged from 0.036 to 0.4.Still, the main significant coherence area occurred in the beta-
range, with no systematic shift to higher or lower frequenciescompared with SaR. From SaR to SaDp, the increase in beta-rangecoherence was statistically significant ( p � 0.0078, Wilcoxonpaired test, n � 8).
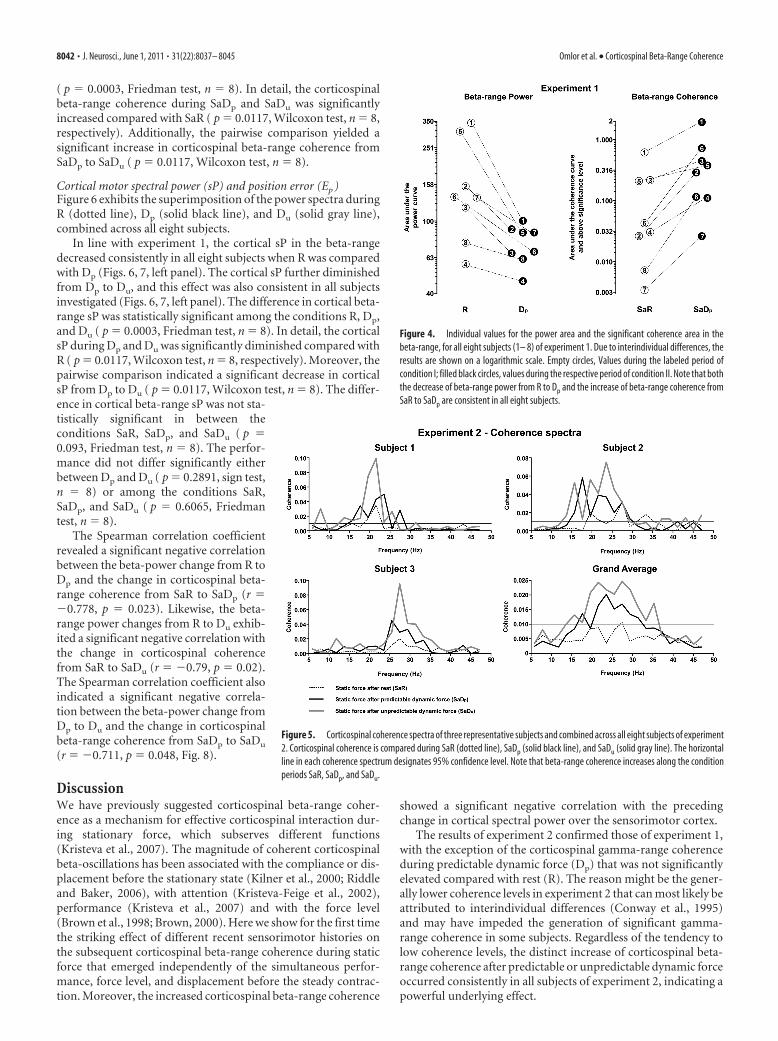
Cortical spectral Power (sP) and Force error (E)The ANOVA indicated for the analysis of the spectral power(sP) that the motor state, condition, and frequency band in-teraction was again significant (motor state condition frequency band, F � 16.00, p � 0.0052). Thus, we again per-formed specific individual tests as for the analysis of cortico-spinal coherence. Figure 3 exhibits the superimposition of the powerspectra during R (dotted line) and Dp (solid line) combined across alleight subjects. The respective individual values of the beta-range sP
are shown in Figure 4: from R to Dp, the sPin the beta-range decreased consistently inall eight subjects. The decrease of the spec-tral power proved to be statistically signifi-cant in the beta-range ( p � 0.0078,Wilcoxon paired test, n � 8), but did notreach significance in the gamma-range.
SaR and SaDp did not differ significantlywith regard to the cortical spectral power,neither in the beta- nor in the gamma-range. In the beta-range, six subjects exhib-ited increased beta-range spectral powerduring SaDp compared with SaR, but thiseffect was not significant ( p � 0.11, Wil-coxon paired test, n � 8). Interestingly, SaRand SaDp also showed no statistically signif-icant changes of the force error ( p � 0.46,Wilcoxon paired test, n � 8), despite theextensive difference in corticospinal coher-ence. The Spearman correlation coefficientrevealed a significant negative correlationbetween the beta-power change from R toDp and the change in corticospinal beta-range coherence from SaR to SaDp (r ��0.79, p � 0.02).
Experiment 2Corticospinal coherenceIn general, the subjects of experiment 2 generated far lower cor-ticospinal coherence than did the subjects of experiment 1. Theaverage significant coherence area under the curve in experiment1 amounted to 0.14 during SaR and to 0.5 during SaDp. In exper-iment 2, the average significant coherence area under the curvewas 0.013 during SaR, 0.06 during SaDp, and 0.1 during SaDu.Nevertheless, the behavior of corticospinal beta-range coherenceand cortical beta-range power was equivalent in experiments 1and 2.
In contrast to experiment 1, the corticospinal gamma-rangecoherence was not significantly increased from R to Dp, althoughsome subjects generated low significant gamma-range coherenceduring Dp. Similarly, no significant change in gamma-range co-herence was observed between R and Du, as well as between Dp
and Du.Figure 5 exhibits the superimposed coherence spectra during
SaR (dotted line), SaDp (solid black line), and SaDu (solid grayline) for three representative subjects as well as combined acrossall eight subjects. During SaR, moderate broad-band beta-rangecoherence was generated only in subjects 1 and 2; the remainderfeatured low-level beta-range coherence that was, however,mostly more pronounced than implied by the grand average.Since the peaks of corticospinal beta-range coherence during SaRtended to occur at different frequencies within the beta-range,they sum ineffectively and barely exceed the significance level inthe grand average.
In line with experiment 1, the corticospinal beta-range coher-ence distinctly increased from SaR to SaDp in all eight subjects(Fig. 5; see Fig. 7). However, the corticospinal beta-range coher-ence further increased from SaDp to SaDu in all subjects investi-gated (Fig. 5; see Fig. 7). Despite the low-level beta-rangecoherence during SaR, all subjects generated moderate to exten-sive, broad-band beta-range coherence during SaDp and SaDu.The difference in corticospinal beta-range coherence was statis-tically significant among the conditions SaR, SaDp, and SaDu
Figure 2. EEG-EMG coherence spectra of three representative subjects and combined across all eight subjects of experiment 1.Corticospinal coherence is compared during SaR (dotted line) and SaDp (solid line). The horizontal line in each coherence spectrumdesignates 95% confidence level. Note that beta-range coherence is excessively enhanced during SaDp compared with SaR.
Figure 3. EEG spectral power over the sensorimotor cortex in experiment 1, combined acrossall eight subjects during R (dotted line) and Dp (solid line). Note that the beta-range powerduring Dp is lower than during R.
Omlor et al. • Corticospinal Beta-Range Coherence J. Neurosci., June 1, 2011 • 31(22):8037– 8045 • 8041
( p � 0.0003, Friedman test, n � 8). In detail, the corticospinalbeta-range coherence during SaDp and SaDu was significantlyincreased compared with SaR ( p � 0.0117, Wilcoxon test, n � 8,respectively). Additionally, the pairwise comparison yielded asignificant increase in corticospinal beta-range coherence fromSaDp to SaDu ( p � 0.0117, Wilcoxon test, n � 8).
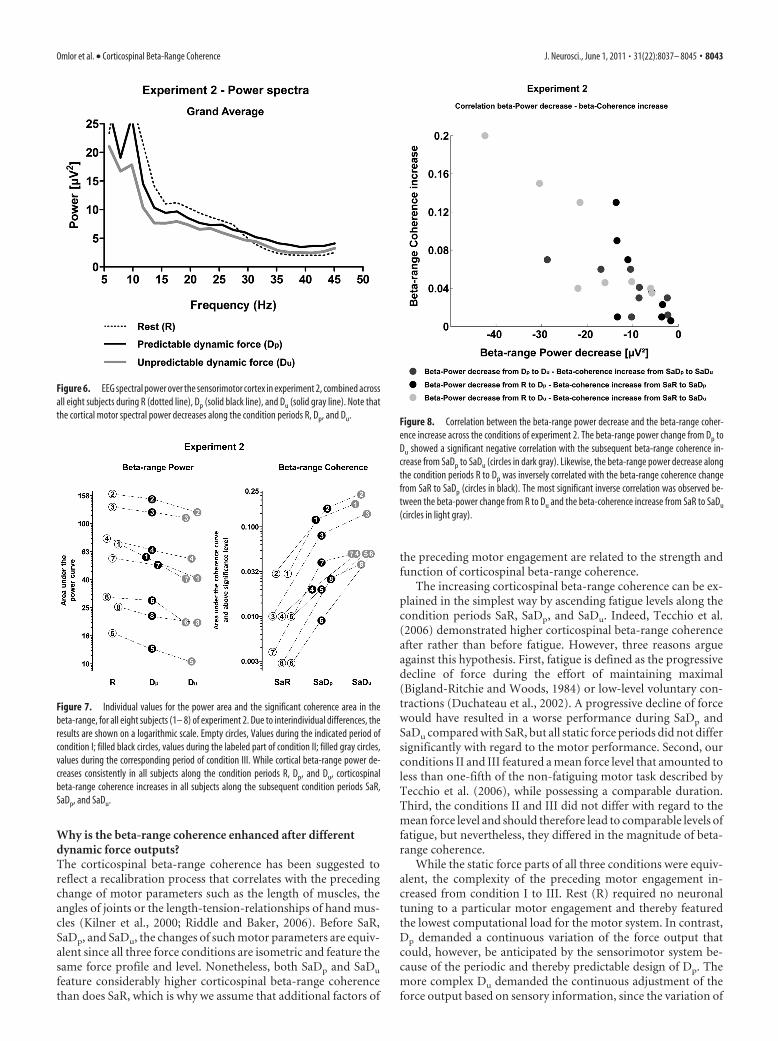
Cortical motor spectral power (sP) and position error (Ep )Figure 6 exhibits the superimposition of the power spectra duringR (dotted line), Dp (solid black line), and Du (solid gray line),combined across all eight subjects.
In line with experiment 1, the cortical sP in the beta-rangedecreased consistently in all eight subjects when R was comparedwith Dp (Figs. 6, 7, left panel). The cortical sP further diminishedfrom Dp to Du, and this effect was also consistent in all subjectsinvestigated (Figs. 6, 7, left panel). The difference in cortical beta-range sP was statistically significant among the conditions R, Dp,and Du ( p � 0.0003, Friedman test, n � 8). In detail, the corticalsP during Dp and Du was significantly diminished compared withR ( p � 0.0117, Wilcoxon test, n � 8, respectively). Moreover, thepairwise comparison indicated a significant decrease in corticalsP from Dp to Du ( p � 0.0117, Wilcoxon test, n � 8). The differ-ence in cortical beta-range sP was not sta-tistically significant in between theconditions SaR, SaDp, and SaDu ( p �0.093, Friedman test, n � 8). The perfor-mance did not differ significantly eitherbetween Dp and Du ( p � 0.2891, sign test,n � 8) or among the conditions SaR,SaDp, and SaDu ( p � 0.6065, Friedmantest, n � 8).
The Spearman correlation coefficientrevealed a significant negative correlationbetween the beta-power change from R toDp and the change in corticospinal beta-range coherence from SaR to SaDp (r ��0.778, p � 0.023). Likewise, the beta-range power changes from R to Du exhib-ited a significant negative correlation withthe change in corticospinal coherencefrom SaR to SaDu (r � �0.79, p � 0.02).The Spearman correlation coefficient alsoindicated a significant negative correla-tion between the beta-power change fromDp to Du and the change in corticospinalbeta-range coherence from SaDp to SaDu
(r � �0.711, p � 0.048, Fig. 8).
DiscussionWe have previously suggested corticospinal beta-range coher-ence as a mechanism for effective corticospinal interaction dur-ing stationary force, which subserves different functions(Kristeva et al., 2007). The magnitude of coherent corticospinalbeta-oscillations has been associated with the compliance or dis-placement before the stationary state (Kilner et al., 2000; Riddleand Baker, 2006), with attention (Kristeva-Feige et al., 2002),performance (Kristeva et al., 2007) and with the force level(Brown et al., 1998; Brown, 2000). Here we show for the first timethe striking effect of different recent sensorimotor histories onthe subsequent corticospinal beta-range coherence during staticforce that emerged independently of the simultaneous perfor-mance, force level, and displacement before the steady contrac-tion. Moreover, the increased corticospinal beta-range coherence
showed a significant negative correlation with the precedingchange in cortical spectral power over the sensorimotor cortex.
The results of experiment 2 confirmed those of experiment 1,with the exception of the corticospinal gamma-range coherenceduring predictable dynamic force (Dp) that was not significantlyelevated compared with rest (R). The reason might be the gener-ally lower coherence levels in experiment 2 that can most likely beattributed to interindividual differences (Conway et al., 1995)and may have impeded the generation of significant gamma-range coherence in some subjects. Regardless of the tendency tolow coherence levels, the distinct increase of corticospinal beta-range coherence after predictable or unpredictable dynamic forceoccurred consistently in all subjects of experiment 2, indicating apowerful underlying effect.
Figure 4. Individual values for the power area and the significant coherence area in thebeta-range, for all eight subjects (1– 8) of experiment 1. Due to interindividual differences, theresults are shown on a logarithmic scale. Empty circles, Values during the labeled period ofcondition I; filled black circles, values during the respective period of condition II. Note that boththe decrease of beta-range power from R to Dp and the increase of beta-range coherence fromSaR to SaDp are consistent in all eight subjects.
Figure 5. Corticospinal coherence spectra of three representative subjects and combined across all eight subjects of experiment2. Corticospinal coherence is compared during SaR (dotted line), SaDp (solid black line), and SaDu (solid gray line). The horizontalline in each coherence spectrum designates 95% confidence level. Note that beta-range coherence increases along the conditionperiods SaR, SaDp, and SaDu.
8042 • J. Neurosci., June 1, 2011 • 31(22):8037– 8045 Omlor et al. • Corticospinal Beta-Range Coherence
Why is the beta-range coherence enhanced after differentdynamic force outputs?The corticospinal beta-range coherence has been suggested toreflect a recalibration process that correlates with the precedingchange of motor parameters such as the length of muscles, theangles of joints or the length-tension-relationships of hand mus-cles (Kilner et al., 2000; Riddle and Baker, 2006). Before SaR,SaDp, and SaDu, the changes of such motor parameters are equiv-alent since all three force conditions are isometric and feature thesame force profile and level. Nonetheless, both SaDp and SaDu
feature considerably higher corticospinal beta-range coherencethan does SaR, which is why we assume that additional factors of
the preceding motor engagement are related to the strength andfunction of corticospinal beta-range coherence.
The increasing corticospinal beta-range coherence can be ex-plained in the simplest way by ascending fatigue levels along thecondition periods SaR, SaDp, and SaDu. Indeed, Tecchio et al.(2006) demonstrated higher corticospinal beta-range coherenceafter rather than before fatigue. However, three reasons argueagainst this hypothesis. First, fatigue is defined as the progressivedecline of force during the effort of maintaining maximal(Bigland-Ritchie and Woods, 1984) or low-level voluntary con-tractions (Duchateau et al., 2002). A progressive decline of forcewould have resulted in a worse performance during SaDp andSaDu compared with SaR, but all static force periods did not differsignificantly with regard to the motor performance. Second, ourconditions II and III featured a mean force level that amounted toless than one-fifth of the non-fatiguing motor task described byTecchio et al. (2006), while possessing a comparable duration.Third, the conditions II and III did not differ with regard to themean force level and should therefore lead to comparable levels offatigue, but nevertheless, they differed in the magnitude of beta-range coherence.
While the static force parts of all three conditions were equiv-alent, the complexity of the preceding motor engagement in-creased from condition I to III. Rest (R) required no neuronaltuning to a particular motor engagement and thereby featuredthe lowest computational load for the motor system. In contrast,Dp demanded a continuous variation of the force output thatcould, however, be anticipated by the sensorimotor system be-cause of the periodic and thereby predictable design of Dp. Themore complex Du demanded the continuous adjustment of theforce output based on sensory information, since the variation of
Figure 6. EEG spectral power over the sensorimotor cortex in experiment 2, combined acrossall eight subjects during R (dotted line), Dp (solid black line), and Du (solid gray line). Note thatthe cortical motor spectral power decreases along the condition periods R, Dp, and Du.
Figure 7. Individual values for the power area and the significant coherence area in thebeta-range, for all eight subjects (1– 8) of experiment 2. Due to interindividual differences, theresults are shown on a logarithmic scale. Empty circles, Values during the indicated period ofcondition I; filled black circles, values during the labeled part of condition II; filled gray circles,values during the corresponding period of condition III. While cortical beta-range power de-creases consistently in all subjects along the condition periods R, Dp, and Du, corticospinalbeta-range coherence increases in all subjects along the subsequent condition periods SaR,SaDp, and SaDu.
Figure 8. Correlation between the beta-range power decrease and the beta-range coher-ence increase across the conditions of experiment 2. The beta-range power change from Dp toDu showed a significant negative correlation with the subsequent beta-range coherence in-crease from SaDp to SaDu (circles in dark gray). Likewise, the beta-range power decrease alongthe condition periods R to Dp was inversely correlated with the beta-range coherence changefrom SaR to SaDp (circles in black). The most significant inverse correlation was observed be-tween the beta-power change from R to Du and the beta-coherence increase from SaR to SaDu
(circles in light gray).
Omlor et al. • Corticospinal Beta-Range Coherence J. Neurosci., June 1, 2011 • 31(22):8037– 8045 • 8043
frequency and amplitudes impeded the anticipation of the forcecycles. Accordingly, the cortical beta-range power decreasedalong the condition periods R, Dp, and Du. Beta-oscillations inthe sensorimotor cortex have been suggested to desynchronizeduring preparation, execution, and imagination of a motor act(Pfurtscheller, 1981; Stancak and Pfurtscheller, 1996; Neuper etal., 2006), particularly when the motor task requires high atten-tion resources (Chen et al., 2003). Additionally, recent functionalMRI studies correlated sensorimotor beta-range desynchroniza-tion with increased neuronal activity (Ritter et al., 2009; Yuan etal., 2010). It is therefore conceivable to assume that the neuronalactivity in the sensorimotor cortex increased along the conditionperiods R, Dp, and Du, which is likely to reflect the ascendingattention and computation demands. Corticospinal beta-rangecoherence was strikingly enhanced when the stationary force hadto be performed after predictable dynamic force instead of rest-ing, and was even higher after unpredictable dynamic force. Thechange in beta-range power along R, Dp, and Du and the increasein the subsequent beta-range coherence along SaR, SaDp, andSaDu showed a significant negative correlation. The inverse cor-relation indicates that the corticospinal beta-range coherence isrelated to the preceding neuronal processing state at a corticallevel and to the computational load of the preceding motor en-gagement. The more cortical neurons have to be entrained andtuned to dynamic force-related processing, the more beta-rangecoherence is generated after switching over to steady force out-put. What might be the functional meaning behind this relation-ship? In addition to providing effective corticospinal interaction(Baker et al., 1999; Kristeva et al., 2007), recent evidence estab-lished the view that corticospinal beta-range oscillations promotethe maintenance of static force while compromising the process-ing of new dynamic motor acts (Gilbertson et al., 2005; Androu-lidakis et al., 2006; Pogosyan et al., 2009). Further, several authorsdemonstrated by applying Granger causality and the directedtransfer function that the dominant information flow carried bybeta-oscillations during tonic motor output is transmitted fromthe somatosensory to the motor cortex and then to the subse-quent spinal motoneurons (Brovelli et al., 2004; Zhang et al.,2008; Tsujimoto et al., 2009). Altogether, there is converging ev-idence that beta-range coherence promotes the corticospinal in-tegration of somatosensory information relevant for themaintenance of stationary force (Baker, 2007; Bressler, 2009). Inthe context of neuronal tuning to dynamic force at a cortical level,corticospinal beta-range coherence is thus the ideal candidate forthe efficient extraction and transmission of steady force-relatedsensorimotor information into downstream targets. When largecortical neuron ensembles are entrained and tuned to dynamicforce-related processing, the switching over to a stationary con-traction is probably crucially dependent on increased corticospi-nal integration of steady force-related information—and therebyon the augmentation of corticospinal beta-range coherence. Ac-cording to the feedback of the subjects, the level of difficultyincreased along the condition parts SaR, SaDp, and SaDu, obvi-ously as a consequence of the different recent motor history.Nonetheless, they performed all three motor tasks with equiva-lent precision. Despite the sensorimotor tuning to dynamic forceas reflected by the decrease in beta-range power, a stationaryforce can be applied with the same level of precision as from theresting state. We presume that this upregulation of corticospinalbeta-range coherence along the condition parts SaR, SaDp, andSaDu functions to ensure a constant precision level of stationaryforce, even though the sensorimotor system is tuned to dynamicforce-related processing.
According to the model of rhythmic input gain modulation,neuronal ensembles are susceptible to input sent from other cellsonly during a narrow phase window of their oscillation cycle(Fries, 2009; van Elswijk et al., 2010). The phase modulation ofcorticospinal beta-range coherence may entail a suboptimal in-put gain for nonstationary force-related processing while pro-moting the corticospinal integration of information relevant forstatic force application. We suggest that corticospinal beta-rangecoherence provides a functional corticospinal gateway for steadyforce-related processing that is able to override cortical statestuned to dynamic force. The modulation of corticospinal beta-range coherence might then ensure a constant precision level ofstatic force regardless of the recent motor history.
In this study we demonstrate a high dependency of corticospi-nal beta-range coherence on the computational load of the pre-ceding motor engagement. This relationship between beta-rangecoherence and the preceding sensorimotor processing impliesthat corticospinal beta-range oscillations are generated in depen-dence on memory traces that refer to the recent sensorimotorhistory before a steady-state contraction. Such memory traces areknown to be formed in M1 in association with the precedingmotor experience (Chouinard et al., 2005; Nowak et al., 2005;Berner et al., 2007; Loh et al., 2010). The sensorimotor systemseems to “know” whether the motor engagement before staticforce was a predictable dynamic force, an unpredictable dynamicforce, or rest, and the corticospinal beta-range coherence is ad-justed correspondingly. If and to what extent corticospinal beta-range coherence affects those memory traces in M1 might be aninteresting question for future research.
ReferencesAndroulidakis AG, Doyle LM, Gilbertson TP, Brown P (2006) Corrective
movements in response to displacements in visual feedback are moreeffective during periods of 13–35 Hz oscillatory synchrony in the humancorticospinal system. Eur J Neurosci 24:3299 –3304.
Baker SN (2007) Oscillatory interactions between sensorimotor cortex andthe periphery. Curr Opin Neurobiol 17:649 – 655.
Baker SN, Olivier E, Lemon RN (1997) Coherent oscillations in monkeymotor cortex and hand muscle EMG show task-dependent modulation.J Physiol 501:225–241.
Baker SN, Kilner JM, Pinches EM, Lemon RN (1999) The role of synchronyand oscillations in the motor output. Exp Brain Res 128:109 –117.
Berner J, Schonfeldt-Lecuona C, Nowak DA (2007) Sensorimotor memoryfor fingertip forces during object lifting: the role of the primary motorcortex. Neuropsychologia 45:1931–1938.
Bigland-Ritchie B, Woods JJ (1984) Changes in muscle contractile proper-ties and neural control during human muscular fatigue. Muscle Nerve7:691– 699.
Bressler SL (2009) The sensory component of tonic motor control. ClinNeurophysiol 120:1035–1036.
Brovelli A, Ding M, Ledberg A, Chen Y, Nakamura R, Bressler SL (2004)Beta oscillations in a large-scale sensorimotor cortical network: direc-tional influences revealed by Granger causality. Proc Natl Acad Sci U S A101:9849 –9854.
Brown P (2000) Cortical drives to human muscle: the Piper and relatedrhythms. Prog Neurobiol 60:97–108.
Brown P, Salenius S, Rothwell JC, Hari R (1998) Cortical correlate of thePiper rhythm in humans. J Neurophysiol 80:2911–2917.
Chen Y, Ding M, Kelso JA (2003) Task-related power and coherencechanges in neuromagnetic activity during visuomotor coordination. ExpBrain Res 148:105–116.
Chouinard PA, Leonard G, Paus T (2005) Role of the primary motor anddorsal premotor cortices in the anticipation of forces during object lifting.J Neurosci 25:2277–2284.
Conway BA, Halliday DM, Farmer SF, Shahani U, Maas P, Weir AI, Rosen-berg JR (1995) Synchronization between motor cortex and spinal mo-toneuronal pool during the performance of a maintained motor task inman. J Physiol 489:917–924.
8044 • J. Neurosci., June 1, 2011 • 31(22):8037– 8045 Omlor et al. • Corticospinal Beta-Range Coherence
Donoghue JP, Leibovic S, Sanes JN (1992) Organization of the forelimb areain squirrel monkey motor cortex: representation of digit, wrist, and elbowmuscles. Exp Brain Res 89:1–19.
Donoghue JP, Sanes JN, Hatsopoulos NG, Gaal G (1998) Neural dischargeand local field potential oscillations in primate motor cortex during vol-untary movements. J Neurophysiol 79:159 –173.
Duchateau J, Balestra C, Carpentier A, Hainaut K (2002) Reflex regulationduring sustained and intermittent submaximal contractions in humans.J Physiol 541:959 –967.
Engel AK, Fries P (2010) Beta-band oscillations—signalling the status quo?Curr Opin Neurobiol 20:156 –165.
Feige B, Aertsen A, Kristeva-Feige R (2000) Dynamic synchronization be-tween multiple cortical motor areas and muscle activity in phasic volun-tary movements. J Neurophysiol 84:2622–2629.
Fries P (2009) Neuronal gamma-band synchronization as a fundamentalprocess in cortical computation. Annu Rev Neurosci 32:209 –224.
Gilbertson T, Lalo E, Doyle L, Di Lazzaro V, Cioni B, Brown P (2005) Ex-isting motor state is favored at the expense of new movement during13–35 Hz oscillatory synchrony in the human corticospinal system.J Neurosci 25:7771–7779.
Gross J, Tass PA, Salenius S, Hari R, Freund HJ, Schnitzler A (2000)Cortico-muscular synchronization during isometric muscle contractionin humans as revealed by magnetoencephalography. J Physiol 527:623– 631.
Halliday DM, Rosenberg JR, Amjad AM, Breeze P, Conway BA, Farmer SF(1995) A framework for the analysis of mixed time series/point processdata—theory and application to the study of physiological tremor, singlemotor unit discharges and electromyograms. Prog Biophys Mol Biol64:237–278.
Hepp-Reymond MC, Wannier TM, Maier MA, Rufener EA (1989) Senso-rimotor cortical control of isometric force in the monkey. Prog Brain Res80:451– 463.
Kilner JM, Baker SN, Salenius S, Jousmaki V, Hari R, Lemon RN (1999)Task-dependent modulation of 15–30 Hz coherence between rectifiedEMGs from human hand and forearm muscles. J Physiol 516:559 –570.
Kilner JM, Baker SN, Salenius S, Hari R, Lemon RN (2000) Human corticalmuscle coherence is directly related to specific motor parameters. J Neu-rosci 20:8838 – 8845.
Kilner JM, Fisher RJ, Lemon RN (2004) Coupling of oscillatory activity be-tween muscles is strikingly reduced in a deafferented subject comparedwith normal controls. J Neurophysiol 92:790 –796.
Kristeva R, Patino L, Omlor W (2007) Beta-range cortical motor spectralpower and corticomuscular coherence as a mechanism for effective cor-ticospinal interaction during steady-state motor output. Neuroimage36:785–792.
Kristeva-Feige R, Fritsch C, Timmer J, Lucking CH (2002) Effects of atten-tion and precision of exerted force on beta range EEG-EMG synchroni-zation during a maintained motor contraction task. Clin Neurophysiol113:124 –131.
Loh MN, Kirsch L, Rothwell JC, Lemon RN, Davare M (2010) Informationabout the weight of grasped objects from vision and internal modelsinteracts within the primary motor cortex. J Neurosci 30:6984 – 6990.
Murthy VN, Fetz EE (1992) Coherent 25- to 35-Hz oscillations in the sen-sorimotor cortex of awake behaving monkeys. Proc Natl Acad Sci U S A89:5670 –5674.
Murthy VN, Fetz EE (1996a) Oscillatory activity in sensorimotor cortex ofawake monkeys: synchronization of local field potentials and relation tobehavior. J Neurophysiol 76:3949 –3967.
Murthy VN, Fetz EE (1996b) Synchronization of neurons during local fieldpotential oscillations in sensorimotor cortex of awake monkeys. J Neuro-physiol 76:3968 –3982.
Neuper C, Wortz M, Pfurtscheller G (2006) ERD/ERS patterns reflectingsensorimotor activation and deactivation. Prog Brain Res 159:211–222.
Nowak DA, Voss M, Huang YZ, Wolpert DM, Rothwell JC (2005) High-frequency repetitive transcranial magnetic stimulation over the hand areaof the primary motor cortex disturbs predictive grip force scaling. EurJ Neurosci 22:2392–2396.
Nunez PL, Srinivasan R, Westdorp AF, Wijesinghe RS, Tucker DM, Silber-stein RB, Cadusch PJ (1997) EEG coherency. I: Statistics, reference elec-trode, volume conduction, Laplacians, cortical imaging, andinterpretation at multiple scales. Electroencephalogr Clin Neurophysiol103:499 –515.
Oldfield RC (1971) The assessment and analysis of handedness: the Edin-burgh inventory. Neuropsychologia 9:97–113.
Perrin F, Pernier J, Bertrand O, Echallier JF (1989) Spherical splines forscalp potential and current density mapping. Electroencephalogr ClinNeurophysiol 72:184 –187.
Pfurtscheller G (1981) Central beta rhythm during sensorimotor activitiesin man. Electroencephalogr Clin Neurophysiol 51:253–264.
Pogosyan A, Gaynor LD, Eusebio A, Brown P (2009) Boosting cortical ac-tivity at beta-band frequencies slows movement in humans. Curr Biol19:1637–1641.
Riddle CN, Baker SN (2006) Digit displacement, not object compliance,underlies task dependent modulations in human corticomuscular coher-ence. Neuroimage 33:618 – 627.
Ritter P, Moosmann M, Villringer A (2009) Rolandic alpha and beta EEGrhythms’ strengths are inversely related to fMRI-BOLD signal in primarysomatosensory and motor cortex. Hum Brain Mapp 30:1168 –1187.
Rosenberg JR, Amjad AM, Breeze P, Brillinger DR, Halliday DM (1989) TheFourier approach to the identification of functional coupling betweenneuronal spike trains. Prog Biophys Mol Biol 53:1–31.
Salenius S, Portin K, Kajola M, Salmelin R, Hari R (1997) Cortical control ofhuman motoneuron firing during isometric contraction. J Neurophysiol77:3401–3405.
Sanes JN, Donoghue JP (1993) Oscillations in local field potentials of theprimate motor cortex during voluntary movement. Proc Natl Acad SciU S A 90:4470 – 4474.
Stancak A Jr, Pfurtscheller G (1996) Event-related desynchronisation ofcentral beta-rhythms during brisk and slow self-paced finger movementsof dominant and nondominant hand. Brain Res Cogn Brain Res4:171–183.
Tecchio F, Porcaro C, Zappasodi F, Pesenti A, Ercolani M, Rossini PM(2006) Cortical short-term fatigue effects assessed via rhythmic brain-muscle coherence. Exp Brain Res 174:144 –151.
Tecchio F, Melgari JM, Zappasodi F, Porcaro C, Milazzo D, Cassetta E,Rossini PM (2008) Sensorimotor integration in focal task-specific handdystonia: a magnetoencephalographic assessment. Neuroscience 154:563–571.
Tsujimoto T, Mima T, Shimazu H, Isomura Y (2009) Directional organiza-tion of sensorimotor oscillatory activity related to the electromyogram inthe monkey. Clin Neurophysiol 120:1168 –1173.
van Elswijk G, Maij F, Schoffelen JM, Overeem S, Stegeman DF, Fries P(2010) Corticospinal beta-band synchronization entails rhythmic gainmodulation. J Neurosci 30:4481– 4488.
Yuan H, Liu T, Szarkowski R, Rios C, Ashe J, He B (2010) Negative covari-ation between task-related responses in alpha/beta-band activity andBOLD in human sensorimotor cortex: an EEG and fMRI study of motorimagery and movements. Neuroimage 49:2596 –2606.
Zhang Y, Chen Y, Bressler SL, Ding M (2008) Response preparation andinhibition: the role of the cortical sensorimotor beta rhythm. Neurosci-ence 156:238 –246.
Omlor et al. • Corticospinal Beta-Range Coherence J. Neurosci., June 1, 2011 • 31(22):8037– 8045 • 8045

![e-tender Document for SUPPLY, INSTLALATION AND ... · thepre-bid meeting to this office via email id:erolm@bis.gov.inby 11-12-2020, 17:00 h] Bid Submission Start Date & Time 21-12-2020](https://static.fdocuments.in/doc/165x107/6120361cf973fc22520fbe6a/e-tender-document-for-supply-instlalation-and-thepre-bid-meeting-to-this-office.jpg)


