Cortical Preparatory Activity: Representation of Movement ...
14
Neuron Viewpoint Cortical Preparatory Activity: Representation of Movement or First Cog in a Dynamical Machine? Mark M. Churchland, 1, * John P. Cunningham, 1,3 Matthew T. Kaufman, 2 Stephen I. Ryu, 1,4 and Krishna V. Shenoy 1,2,5 1 Department of Electrical Engineering 2 Neurosciences Program Stanford University, Stanford, CA 94305, USA 3 Department of Engineering, University of Cambridge, Cambridge CB2 1PZ, UK 4 Department of Neurosurgery, Palo Alto Medical Foundation, Palo Alto, CA 94301, USA 5 Department of Bioengineering, Stanford University, Stanford, CA 94705, USA *Correspondence: [email protected] DOI 10.1016/j.neuron.2010.09.015 SUMMARY The motor cortices are active during both movement and movement preparation. A common assumption is that preparatory activity constitutes a subthreshold form of movement activity: a neuron active during rightward movements becomes modestly active during preparation of a rightward movement. We asked whether this pattern of activity is, in fact, observed. We found that it was not: at the level of a single neuron, preparatory tuning was weakly corre- lated with movement-period tuning. Yet, somewhat paradoxically, preparatory tuning could be captured by a preferred direction in an abstract ‘‘space’’ that described the population-level pattern of movement activity. In fact, this relationship accounted for prepa- ratory responses better than did traditional tuning models. These results are expected if preparatory activity provides the initial state of a dynamical system whose evolution produces movement activity. Our results thus suggest that preparatory activity may not represent specific factors, and may instead play a more mechanistic role. INTRODUCTION Voluntary movements are prepared before they are generated (Ghez et al., 1991; Rosenbaum, 1980). Similarly, changes in neural activity occur well before movement onset in both motor and pre- motor cortex (Tanji and Evarts, 1976; Weinrich et al., 1984). Such ‘‘preparatory’’ activity likely plays a key role in movement genera- tion: preparatory activity is predictive of reaction time and move- ment variability (Bastian et al., 2003; Churchland et al., 2006a; Churchland and Shenoy, 2007a; Churchland et al., 2006c; Riehle and Requin, 1993), and its disruption delays movement onset (Churchland and Shenoy, 2007a). An understanding of prepara- tory activity is also central to the study of the cognitive processes preceding movement. For example, an understanding of the preparatory activity preceding saccades has made approachable the cognitive processes that determine where and when to move the eyes (Schall and Thompson, 1999; Shadlen and Newsome, 2001). Yet it is still unclear how preparatory activity in motor and premotor cortex contributes to movement generation. A common assumption is that preparatory activity constitutes a subthreshold version of movement activity. If a neuron will become active during rightward movement, it may be beneficial for that neuron to be weakly active during preparation of right- ward movement. Assuming a threshold for producing move- ment, preparatory activity could advance the system closer to that threshold. This subthreshold view of preparatory activity dates to early studies (Tanji and Evarts, 1976), accords with our understanding of the saccadic system (e.g., Hanes and Schall, 1996), and is assumed by most models of reach genera- tion (Bastian et al., 1998; Cisek, 2006a; Erlhagen and Scho ¨ ner, 2002). A related hypothesis holds that preparatory and move- ment activities are tuned for different but concordant factors (e.g., rightward target locations and rightward hand velocity). An alternative proposal is that preparatory activity functions as the initial state of a dynamical system and may not explicitly represent movement parameters (Churchland et al., 2006b; Churchland et al., 2006c; Cisek, 2006b; Fetz, 1992). Under this hypothesis, preparatory and movement activity are closely related (via those dynamics), but that relationship need not be transparent at the level of the individual cell. Neural responses consistent with the subthreshold view are often observed, especially in population averages (Bastian et al., 1998; Bastian et al., 2003; Cisek, 2006a; Erlhagen et al., 1999; Georgopoulos et al., 1989; Requin et al., 1988; Riehle and Requin, 1989). Yet other reports argue that, for individual neurons, tuning can differ during the two epochs (Crammond and Kalaska, 2000; Kaufman et al., 2010; Turner, 1991; Wise et al., 1986) and is in general inconstant with time (Churchland and Shenoy, 2007b; Fu et al., 1995; Hatsopoulos et al., 2007; Rickert et al., 2009). If preparatory activity constitutes a subthreshold precursor of movement activity, the two should share similar tuning. Yet under the dynamical systems view there is little reason why ‘‘tuning’’ should be similar for the initial and subsequent states of the system. Muddying the waters further, preparatory activity appears tuned for a dizzying variety of factors, including reach direction and distance (Messier and Kalaska, 2000; Riehle and Requin, 1989), reach speed (Churchland et al., 2006b), visual location of the target (Shen and Alexander, 1997), target location Neuron 68, 387–400, November 4, 2010 ª2010 Elsevier Inc. 387
Transcript of Cortical Preparatory Activity: Representation of Movement ...

Neuron
Viewpoint
Cortical Preparatory Activity: Representationof Movement or First Cog in a Dynamical Machine?Mark M. Churchland,1,* John P. Cunningham,1,3 Matthew T. Kaufman,2 Stephen I. Ryu,1,4 and Krishna V. Shenoy1,2,51Department of Electrical Engineering2Neurosciences Program
Stanford University, Stanford, CA 94305, USA3Department of Engineering, University of Cambridge, Cambridge CB2 1PZ, UK4Department of Neurosurgery, Palo Alto Medical Foundation, Palo Alto, CA 94301, USA5Department of Bioengineering, Stanford University, Stanford, CA 94705, USA
*Correspondence: [email protected] 10.1016/j.neuron.2010.09.015
SUMMARY
The motor cortices are active during both movementand movement preparation. A common assumptionis that preparatory activity constitutes a subthresholdform of movement activity: a neuron active duringrightward movements becomes modestly activeduring preparation of a rightward movement. Weasked whether this pattern of activity is, in fact,observed. We found that it was not: at the level ofa single neuron,preparatory tuningwasweakly corre-lated with movement-period tuning. Yet, somewhatparadoxically, preparatory tuning could be capturedby a preferred direction in an abstract ‘‘space’’ thatdescribed the population-level pattern of movementactivity. In fact, this relationship accounted for prepa-ratory responses better than did traditional tuningmodels. These results are expected if preparatoryactivity provides the initial state of a dynamicalsystem whose evolution produces movementactivity. Our results thus suggest that preparatoryactivity may not represent specific factors, and mayinstead play a more mechanistic role.
INTRODUCTION
Voluntary movements are prepared before they are generated
(Ghezet al., 1991;Rosenbaum,1980). Similarly, changes in neural
activity occur well beforemovement onset in bothmotor and pre-
motor cortex (Tanji and Evarts, 1976; Weinrich et al., 1984). Such
‘‘preparatory’’ activity likely plays a key role in movement genera-
tion: preparatory activity is predictive of reaction time and move-
ment variability (Bastian et al., 2003; Churchland et al., 2006a;
Churchland and Shenoy, 2007a; Churchland et al., 2006c; Riehle
and Requin, 1993), and its disruption delays movement onset
(Churchland and Shenoy, 2007a). An understanding of prepara-
tory activity is also central to the study of the cognitive processes
preceding movement. For example, an understanding of the
preparatory activity preceding saccades hasmade approachable
the cognitive processes that determine where and when to move
the eyes (Schall and Thompson, 1999; Shadlen and Newsome,
2001). Yet it is still unclear how preparatory activity in motor and
premotor cortex contributes to movement generation.
A common assumption is that preparatory activity constitutes
a subthreshold version of movement activity. If a neuron will
become active during rightward movement, it may be beneficial
for that neuron to be weakly active during preparation of right-
ward movement. Assuming a threshold for producing move-
ment, preparatory activity could advance the system closer to
that threshold. This subthreshold view of preparatory activity
dates to early studies (Tanji and Evarts, 1976), accords with
our understanding of the saccadic system (e.g., Hanes and
Schall, 1996), and is assumed by most models of reach genera-
tion (Bastian et al., 1998; Cisek, 2006a; Erlhagen and Schoner,
2002). A related hypothesis holds that preparatory and move-
ment activities are tuned for different but concordant factors
(e.g., rightward target locations and rightward hand velocity).
An alternative proposal is that preparatory activity functions as
the initial state of a dynamical system and may not explicitly
represent movement parameters (Churchland et al., 2006b;
Churchland et al., 2006c; Cisek, 2006b; Fetz, 1992). Under this
hypothesis, preparatory and movement activity are closely
related (via those dynamics), but that relationship need not be
transparent at the level of the individual cell.
Neural responses consistent with the subthreshold view are
often observed, especially in population averages (Bastian
et al., 1998; Bastian et al., 2003; Cisek, 2006a; Erlhagen et al.,
1999; Georgopoulos et al., 1989; Requin et al., 1988; Riehle
and Requin, 1989). Yet other reports argue that, for individual
neurons, tuning can differ during the two epochs (Crammond
and Kalaska, 2000; Kaufman et al., 2010; Turner, 1991; Wise
et al., 1986) and is in general inconstant with time (Churchland
and Shenoy, 2007b; Fu et al., 1995; Hatsopoulos et al., 2007;
Rickert et al., 2009).
If preparatory activity constitutes a subthreshold precursor of
movement activity, the two should share similar tuning. Yet
under the dynamical systems view there is little reason why
‘‘tuning’’ should be similar for the initial and subsequent states
of the system. Muddying the waters further, preparatory activity
appears tuned for a dizzying variety of factors, including reach
direction and distance (Messier and Kalaska, 2000; Riehle and
Requin, 1989), reach speed (Churchland et al., 2006b), visual
location of the target (Shen and Alexander, 1997), target location
Neuron 68, 387–400, November 4, 2010 ª2010 Elsevier Inc. 387

A B
200 ms
0
12
cm
0
100
cm/s
horizontal target position
horizontal hand position
hand velocity
EMG
central spot
T G M
150 ms0
100
Velo
city
(cm
/s)
4 cm
C Dfast
slow
Figure 1. Illustration of Behavior
(A) Reaches were from a central spot to a target. An
example trajectory is shown.
(B) Task timeline. Upon appearing (T), the target jittered
slightly. Cessation of jitter provided the go cue (G). M indi-
cates movement onset.
(C) Behavior: speed task. Velocity in the target direction for
the seven directions, two distances and two instructed
speeds is shown.
(D) Behavior: maze task. For this example condition, the
reach had to curve over a virtual barrier. In other condi-
tions, reaches avoided different arrangements of barriers
or were straight with no barriers. Reaches lasted �200
to �600 ms (depending on distance/curvature).
Neuron
Cortical Preparatory Activity
relative to the eye and hand (Batista et al., 2007; Pesaran et al.,
2006), and reach curvature (Hocherman and Wise, 1991). It is
unclear which—if any—of those factors is primary. We are thus
left with two open and fundamental questions: what is prepara-
tory activity tuned for, and how does it relate to movement
activity?
We addressed these questions using four data sets employing
delayed-reach tasks. We found that the tuning of individual
neurons was typically dissimilar during the preparatory and
movement epochs. This finding is inconsistent with a
subthreshold role for preparatory activity. Nevertheless, prepa-
ratory tuning could be captured by a preferred direction in
a ‘‘space’’ describing the population-level movement-period
responses. Remarkably, preferred directions in this unconven-
tional space accounted for preparatory tuning better than did
preferred directions in more traditional spaces (e.g., reach
endpoint or velocity). This result has a simple mechanistic inter-
pretation: it is expected under the hypothesis that preparatory
activity acts as the initial state of a dynamical system.
RESULTS
Behavior and RecordingsThree monkeys performed variants of a delayed-reach task. In
the ‘‘speed task’’ (monkeys A and B), target color instructed
reach speed (28 conditions, Figure 1C). In the ‘‘maze task’’
(monkey J), reacheswere either straight or curved to avoid virtual
barriers (Figure 1D). In the present study, this complex cognitive-
motor task simply provides a way to evokemany different reach-
ing movements (27 and 108 conditions for ‘‘monkey J’’ and
‘‘monkey J-array’’ data sets).
Neural recordings employed single electrodes (monkeys A,
B, and J data sets, 310 total single-unit isolations) and a pair
388 Neuron 68, 387–400, November 4, 2010 ª2010 Elsevier Inc.
of implanted 96-electrode arrays (J-array data
set, 146 single- and multiunit isolations).
Recordings were made from the caudal portion
of dorsal premotor cortex (PMd) and from
surface and sulcal primary motor cortex (M1).
High trial counts (mean trials/neuron = 311,
492, 388, and 2166 for monkeys A, B, J, and
J-array) allowed us to resolve perimovement
responses that were often complex and multi-
phasic (Churchland and Shenoy, 2007b; see also example
PSTHs below).
Neural Responses during Preparation and MovementFigure 2A illustrates an idealized response pattern consistent
with preparatory activity serving as a subthreshold form ofmove-
ment activity. Preparatory activity shows a preference for one
condition (red, perhaps the preferred direction) over another
(green, perhaps the opposite direction). This preference is main-
tained as the plateau of preparatory activity gives rise to a burst
of perimovement activity (defined as activity immediately before,
during, and just after the movement).
Figure 2B plots the response of a neuron that approximates
the schematic in Figure 2A. Data are for one distance/instructed
speed. Traces (one per condition) are colored based on the level
of preparatory activity in order to allow visual comparison with
the subsequent pattern of perimovement activity. This neuron
‘‘prefers’’ reaches ending up and leftward. This preference is
shared between preparatory and perimovement epochs. This
agreement is not perfect (two green traces surpass the black
trace), but the overall correlation is quite high (r = 0.72; see
section on correlations below for details).
Figures 2C–2E plot responses of three additional neurons
recorded using the speed task. Despite clear preparatory tuning,
preferences are not maintained between the preparatory and
perimovement epochs (color ordering differs between epochs).
Furthermore, perimovement activity was often complex and
multiphasic (Churchland and Shenoy, 2007b; Sergio et al.,
2005). These neurons show negative correlations between
preparatory and perimovement tuning.
Figure 3 plots responses of six neurons recorded using the
maze task. Panels (A)–(D) plot single-electrode recordings
(27 conditions). Panels (E) and (F) plot array-based recordings

cell A14
−400 TARGET 300 −100 GO −200 MOVE 400
0
96
spik
es /
seco
nd
cell B16
−400 TARGET 300 −100 GO −200 MOVE 400
0
65
cell B12
−400 TARGET 300 −100 GO −200 MOVE 400
0
95
spik
es /
seco
nd
cell B42
−400 TARGET 300 −100 GO −200 MOVE 400
0
40
B C
D E
preferred
threshold
non-preferred
TARGET MOVE
preparatoryactivity
peri-movementactivity
GO
A
r = 0.72 r = -0.62
r = -0.61 r = -0.32
Figure 2. An Idealized Schematic of Neural Activity
and Responses of Example Neurons
(A) Traces are colored red (preferred) and green (nonpre-
ferred). In this conception, preparatory activity is present
during the delay period, rises to a threshold following the
go cue, and produces a burst of perimovement activity.
(B) Firing rate versus time for an example neuron whose
responses resemble the schematic in (A). Responses are
shown for all seven reach directions for the fast instructed
speed and shorter distance. Traces are shaded from red to
green based on the firing rate 50 ms before the go cue.
Data were averaged separately, locked to target onset,
the go cue, and movement onset. To aid viewing, we
have interpolated data across the gaps between these
three epochs. See Figure S4 for a description of the
smoothing used to produce these PSTHs. Inset plots
mean hand trajectory using the same color coding.
(C–E) Similar plots for three more example neurons. Data
have been down selected to a single distance and in-
structed speed (far/fast for these panels). These three
neurons were selected to illustrate the fact that prepara-
tory and perimovement tunings were typically different,
even in the simplest paradigm: straight reaches at one
distance/instructed speed.
Neuron
Cortical Preparatory Activity
(108 conditions). Some neurons maintained similar tuning
between preparatory and perimovement epochs (panel A), but
most did not. Also, althoughmost neurons showed a rough direc-
tional preference during the preparatory period (insets), it was not
uncommonfora few (panelB)orevenmany (panelsEandF)condi-
tions to evoke activity not easily explained by a pure directional
preference.
Perimovement response complexity is not due to noise, but is
instead a real feature of most neural responses (Churchland and
Shenoy, 2007b). Still, in Figure 3, response complexity is partly
a result of the variety of reach paths. Given this, it is worth stress-
ing two things. First, any model regarding how preparatory
activity leads to perimovement activity should work for curved
as well as straight reaches. Second, both perimovement
response complexity and the failure of preparatory tuning to
predict perimovement tuning are quite apparent even for simple
center-out reaches (Figure 2).
Correlations between Preparatoryand Perimovement TuningSimilar levels of preparatory activity can lead to opposing
patterns of perimovement activity (e.g., middlemost traces in
Neuron 68, 387
Figure 2D and traces near the top of
Figure 3C). Thus, it is not simply that tuning pref-
erences can reverse; tuning is often weakly
correlated between the two epochs (population
analysis in Figures 4A–4D). To compute
correlations, we took the average firing rate
during the preparatory and perimovement
epochs for each condition (Experimental Proce-
dures). A neuron’s tuning in one epoch is then
described by a vector of firing rates, with one
entry per condition. We intentionally chose to
not fit a specific tuning model and instead
simply computed the correlation between epochs. This correla-
tion will be high if a neuron’s preference remains similar. Across
the four data sets, the mean correlation was positive (p = 0.01,
p = 0.01, p = 0.12, p = 0.03), but only very modestly so
(mean r = 0.21, 0.19, 0.06, and 0.13). Nonparametric correlations
were similarly modest (mean Spearman’s r = 0.20, 0.20,
0.06, and 0.11). Thus, preparatory and perimovement tuning
agree weakly on average, and individual neurons span a wide
spectrum.
The example neurons with correlations closest to the popula-
tion mean are shown in Figures 3A, 3C, and 3E. These neurons
illustrate a further point: preparatory and perimovement tuning
often agreed when the latter was assessed �150 ms before
movement onset, but not when assessed close to movement
onset. To examine this time course, wemeasured perimovement
activity at individual time points. The correlation with preparatory
activity began to decline �200 ms prior to movement onset and
reached values near zero by movement onset (Figure 4E).
The above results agree with some prior observations at the
single-neuron level (Churchland and Shenoy, 2007b; Crammond
and Kalaska, 2000; Kaufman et al., 2010; Wise et al., 1986) but
appear to disagree with findings made at the population level
–400, November 4, 2010 ª2010 Elsevier Inc. 389

−400 TARGET 400 −200 GO −200 MOVE 600
0
85
cell J16
spik
es /
seco
nd
−400 TARGET 400 −200 GO −200 MOVE 600
0
80
cell J36
−400 TARGET 400 −200 GO −200 MOVE 600
0
70
cell J101
−400 TARGET 400 −200 GO −200 MOVE 600
0
75
cell J114
−400 TARGET 400 −200 GO −200 MOVE 600
cell JA185
−400 TARGET 400 −200 GO −200 MOVE 600
cell JA125
spik
es /
seco
ndsp
ikes
/ se
cond
0
60
0
25
B
DC
FE
A
r = 0.23 r = -0.71
r = 0.14 r = -0.55
r = 0.04 r = -0.20
Figure 3. Responses of Six Example Neurons, Similar Format to Figure 2
(A–F) Responses are shown for all conditions, including straight and curved reaches. Different conditions, involving different maze configurations, sometimes
evoked similar reach trajectories (although not necessarily with similar velocity profiles). The same 108 conditions were used for the J and J-array data sets.
For the former, a given neuron was recorded using one of four 27-condition subsets. The insets in (A)–(D) thus show different reach patterns, corresponding
to different subsets. In addition to temporal filtering, additional denoising was accomplished via the method in Figure S4. This method removes uncorrelated
noise and thus cannot eliminate noise in the firing rate that is accidentally similar across conditions (e.g., during the delay period in F).
Neuron
Cortical Preparatory Activity
(Bastian et al., 1998; Bastian et al., 2003; Cisek, 2006a; Georgo-
poulos et al., 1989). This discrepancy can be resolved by noting
that preparatory and perimovement tuning are weakly but posi-
tively correlated on average, especially early in the perimove-
ment epoch (Figure 4). In population averages (see Figure S1
available online), the lack of correlation averages out and the
means are dominated by the weak agreement between prepara-
tory and perimovement tuning. However, such effects grow
dramatically smaller with time. By movement onset, even popu-
lation averages show little relationship with preparatory tuning
(Figure S1).
Our results argue against a common assumption: that prepa-
ratory activity constitutes a subthreshold version of perimove-
ment activity. The cartoon in Figure 2A bears little resemblance
390 Neuron 68, 387–400, November 4, 2010 ª2010 Elsevier Inc.
to the responses of most neurons. Even more disconcertingly,
different neurons showmarkedly different relationships between
preparatory and perimovement activity, with a broad range of
correlations centered near zero. It has been suggested that
neurons with concordant preparatory and perimovement tuning
might prime the desired movement, whereas neurons with
opposing tuning might suppress movement until execution
(Wise et al., 1986). Yet there is little evidence in Figure 4 (except
perhaps weakly in panel B) for one population of concordant
tuning (r z 1) and another of opposing tuning (r z �1). Instead,
most neurons have weakly correlated tuning.
There are at least four possible explanations for the
above findings. First, perhaps preparatory activity is a largely
idiosyncratic phenomenon with no lawful relationship with

monkey A
-1 0 1correlation
0
4
coun
t
-1 0 1correlation
0
3
-1 0 1correlation
0
12
coun
t
-1 0 1correlation
0
4
monkey B
monkey J monkeyJ array
monkey Amonkey Bmonkey J
monkey J array
-400 -200 0 200 400time w.r.t. move onset
0
1
mea
n co
rrel
atio
n
B
DC
E
A
Figure 4. Correlation between Preparatory and PerimovementTuning
(A–D) Distribution of correlations (measured once per neuron) for the four data
sets. Analysis was restricted to neurons robustly tuned during both epochs
(Experimental Procedures). Red dot indicates the distribution mean.
(E) Average correlation as a function of when perimovement activity was as-
sessed. Perimovement activity was measured at a single time point, after
smoothing with a 20 ms Gaussian kernel. Correlations are initially high,
because preparatory tuning is being correlated with itself.
Neuron
Cortical Preparatory Activity
perimovement activity. Second, perhaps preparatory and peri-
movement activity code the same thing (e.g., reach direction)
with unrelated preferences (e.g., different preferred directions).
Third, preparatory and perimovement activity may code funda-
mentally different things and do so with unrelated preferences.
The motor system might decode reach endpoint from prepara-
tory activity and then produce perimovement activity represent-
ing the velocity trajectory necessary to reach that endpoint.
Finally, under the dynamical systems view, preparatory activity
may be directly and mechanistically linked with perimovement
activity, but in a manner not obvious at the single-neuron level
(Churchland et al., 2006b; Cisek, 2006b). These possibilities
are addressed below.
Testing Preparatory Tuning in DifferentSpaces/Reference FramesOf the above hypotheses, the first supposes that preparatory
activity is tuned for nothing reliable. The next two suppose that
preparatory activity is tuned for task or movement parameters
(e.g., reach endpoint, trajectory, or speed). The last supposes
that preparatory activity should somehow relate to the popula-
tion-level pattern of perimovement activity. What is preparatory
activity in fact tuned for?
It is worth expanding upon the usual caveat that most exper-
imentally quantifiable variables (reach endpoint, reach velocity,
muscle activity) correlate with one another (Mussa-Ivaldi, 1988;
Sanger, 1994; Scott, 2000; Scott, 2008). This has important
consequences. Suppose preparatory activity truly represents
reach endpoint (i.e., is some straightforward function of reach
endpoint and can be readily decoded to infer endpoint).
Suppose perimovement activity represents reach velocity.
Preparatory activity will then appear tuned not only for reach
endpoint but also for reach velocity and perimovement activity
(all these factors are correlated). Yet reach endpoint does not
correlate perfectly with reach velocity, particularly for the tasks
used here. Preparatory activity (which, in this example, is tuned
for endpoint) would therefore have its strongest relationship with
endpoint and would have somewhat weaker relationships with
the other variables. The central question is thus: what is prepara-
tory activity best tuned for?
To investigate this question, wemeasured howwell a preferred
direction (PD) accounts for preparatory tuning. We asked in what
space that PD best captures tuning. If preparatory activity is
tuned for endpoint, then the PD will capture tuning most effec-
tively when expressed in a ‘‘reach-endpoint space,’’ where the
axes capture horizontal and vertical endpoint. If preparatory
activity is tuned for initial reach velocity, the PD will be most
effective in an ‘‘initial-velocity space.’’ A wide variety of such
spaces is possible. Indeed, a central goal of this field has been
to determine in which space, or reference frame, the PD best
captures tuning.
Figure 5 illustrates, for one example neuron, how the PD can
capture tuning in different spaces. Preparatory activity showed
a clear preference for some conditions (shaded red) over others
(shaded green). Figure 5B illustrates a traditional method for
accounting for such preferences. The 28 conditions (each corre-
sponding to a target location and instructed speed) are located in
a space defined by the horizontal and vertical reach endpoints.
Preparatory firing rate is indicated by symbol size/color. The
PD points toward the most active responses and attempts to
provide a fit according to:
xnzbo +g3S3PD; Equation 1
where xn is a c 3 1 vector containing the neuron’s preparatory
response for the c conditions, bo and g are the firing rate offset
and gain, S is a c 3 k matrix containing the location of each
condition in a k-dimensional space, and the PD is a k 3 1 direc-
tion in that space. The performance of the PD can be gauged by
plotting the true responses (xn) versus the fit provided by the PD
(right-hand side of Equation 1). Doing so (Figure 5D) shows that
the PD in endpoint space captures the pattern of preparatory
activity reasonably well.
Neuron 68, 387–400, November 4, 2010 ª2010 Elsevier Inc. 391

0
0
0
0
0projection onto PD (arbitrary units)
25
65
0projection onto PD (arbitrary units)
endpoint and peak velocity (4-D space)25
65
spik
es/s
(pr
epar
ator
y)
endpoint (2-D space)
0
25
65
peri-movement PCs (2-D space)
0
25
65
projection onto PD (arbitrary units)
projection onto PD (arbitrary units)
peri-movement PCs (4-D space)
spik
es/s
(pr
epar
ator
y)
endpoint (2-D space) peri-movement PCs (2-D space)-128
-128 128
128
horizontal position (mm)
vert
ical
pos
ition
(m
m)
PC1 score
PC
2 sc
ore
fast
slow
cell A1
−400 TARGET 300 −100 GO −200 MOVE 400
0
70sp
ikes
/ se
cond
A
CB
ED
GF
Figure 5. Example PDs in a Space Based onMove-
ment Endpoints and the ‘‘Perimovement Space’’
(A) Firing rate as a function of time for an example neuron.
All 28 conditions are shown.
(B) Mean reach endpoint for each condition. Red-to-green
shading and symbol size indicate preparatory firing rate
for that condition. Symbol thickness indicates instructed
speed. The PD (arrow) points toward conditions with the
greatest preparatory activity.
(C) The same 28 conditions located in the perimovement
space. Each axis corresponds to a population-level
pattern of perimovement activity (a PC). The subsection
of this pattern coming from a single neuron (A34, chosen
arbitrarily) is plotted at the end of each axis. Thus, the
rightmost red symbol corresponds to a condition in which
the ‘‘PC1 pattern’’ was strongly present.
(D) Firing rate versus each condition’s projection onto the
PD, using the endpoint space from (B).
(E) Similar to (D), but for the perimovement space.
(F) Same as (D), but for a 4D space defined by reach
endpoint and peak velocity.
(G) Same as (E), but for a 4D perimovement space.
Neuron
Cortical Preparatory Activity
Might the PD perform better still if expressed in a different
space? Many spaces are possible. For example, to construct
an ‘‘endpoint-and-peak-velocity’’ space, one needs simply to
measure average endpoint and peak velocity for each condition.
Each condition is then described by four numbers (horizontal and
vertical endpoint and peak velocity) and lives in a four-dimen-
sional space. We can then ask how well a PD in this four-dimen-
sional space captures the pattern of preparatory activity
392 Neuron 68, 387–400, November 4, 2010 ª2010 Elsevier Inc.
(Figure 5F). We refer to spaces constructed in
this manner as ‘‘task’’ spaces. Task spaces
are constructed by the experimenter to capture
salient aspects of the task (e.g., target location)
or of performance (e.g., peak velocity). The use
of such task spaces is common in systems
neuroscience. The many studies that ask which
reference frame best captures neural responses
(e.g., Kakei et al., 1999) are asking which task
space is preferable. More generally, whenever
neural responses are posited to depend linearly
on some set of k factors, that relationship can be
formalized via a PD in k-dimensional space.
How well the PD performs is a test of whether
activity truly depends on those k factors. Tradi-
tional ‘‘cosine tuning’’ models fall into the above
category: cosine tuning for velocity is equivalent
to a linear dependence on horizontal and
vertical velocity (Georgopoulos et al., 1982).
Testing Preparatory Tuningin PCA-Based SpacesA presumed purpose of preparatory tuning is for
changes in a given neuron’s activity to con-
tribute, in a small but specific way, to changes
in some future aspect of movement. A neuron
tuned for reach endpoint would, through its
firing, contribute some small change to the
eventual reach endpoint. Of course, preparatory activity might
be tuned not for static factors (e.g., endpoint) but for time-
varying parameters (e.g., velocity). A change in preparatory firing
rate would then presumably impact the future temporal profile of
that parameter (perhaps scaling velocity overall). This situation
should still be experimentally tractable. Provided one can
describe, using a small number of parameters, how velocity
varies with condition, then preparatory activity should faithfully
Neuron
Cortical Preparatory Activity
covary with those parameters (if it is truly tuned for future
velocity). Such parameterizations can be provided by dimen-
sionality reduction techniques such as principal component
analysis (PCA).
This approach can also address the hypothesis that prepara-
tory activity constitutes an initial state that largely determines
(via local and feedback dynamics) the population-level pattern
of perimovement activity. In this view, changes in preparatory
activity produce specific changes in the pattern of perimovement
activity. For a large class of dynamical systems, this relationship
is straightforward: the greater a given neuron’s preparatory rate,
the stronger some subsequent perimovement pattern becomes.
PCA can be used to reduce perimovement activity to a simple set
of component patterns. Under the dynamical systems view,
preparatory activity should be tuned for these component
patterns. If a particular pattern is prominent for a given condition,
then the preparatory rate of a neuron contributing to that pattern
should be high.
The PCA-based approach (Figures 5C, 5E, and 5G; Figure S2)
constructs a low-dimensional space that captures how time-
varying factors (velocity, perimovement activity, etc.) differ
across conditions. To illustrate the necessity of dimensionality
reduction, consider the full-dimensional space describing the
perimovement response. The relevant matrix (call this T) is large:
c 3 nt, where c is the number of conditions, n is the number of
neurons, and t is the number of time points. The c conditions
thus reside in a space with thousands of dimensions. PCA can
reduce this dimensionality from c3 nt to c3 k, with k in the range
of 3–14. The resulting c3 kmatrix, Tred, then conveniently yields
the location of each condition in a k-dimensional space
(Figure S2).
To illustrate, Figure 5C plots the 28 conditions in a two-dimen-
sional (k = 2) perimovement space. The location of each symbol
indicates, for that condition, the strength of the two most prom-
inent perimovement patterns (the first two PCs). The PD captures
preparatory tuning reasonably well (Figures 5C and 5E). In fact,
the PD generally performed adequately regardless of the space
in which it was expressed. As discussed above, this is expected,
given correlations between movement parameters. One thus
wishes to ask in which space the PD best captures the pattern
of preparatory responses. We tested a variety of spaces, falling
into three categories. First, we tested task spaces, constructed
by hand selecting likely important factors (as in Figure 5B).
Second, we tested the perimovement space (Figure 5C). Finally,
PCA was used to produce a kinematics-based space and an
electromyogram (EMG)-based space (substituting time-varying
kinematic variables or EMG records for perimovement activity).
Most tested spaces were greater than two-dimensional.
Figures 5F and 5G plot PD performance in a four-dimensional
task space and a four-dimensional perimovement space. The
improvement in fit (relative to Figures 5D and 5E) is expected.
The use of a PD is equivalent to linear regression; we are now
regressing against four explanatory factors rather than two.
To combat potential overfitting, we computed the PD based on
all but one condition (red circled points in Figures 5D–5G) and
assessed performance for the left-out condition. This cross-
validation procedure was repeated, leaving out each condition
in turn. We define performance as 1 minus the squared error,
averaged across all left-out conditions and normalized appropri-
ately (Experimental Procedures).
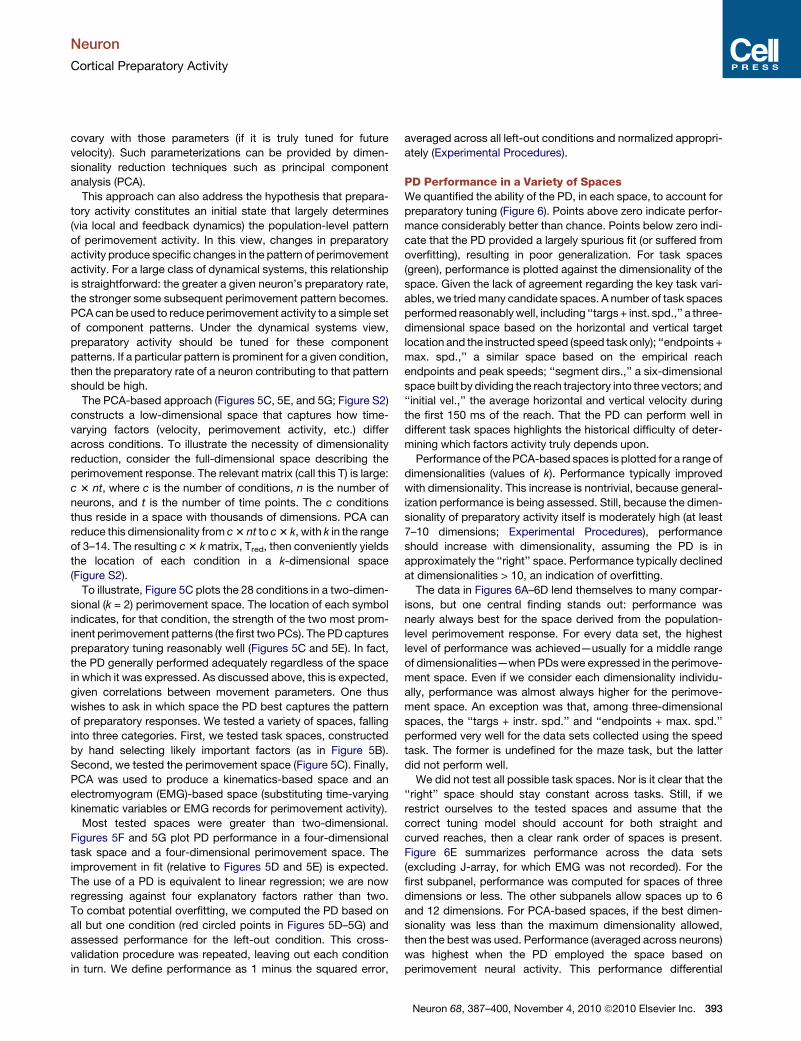
PD Performance in a Variety of SpacesWe quantified the ability of the PD, in each space, to account for
preparatory tuning (Figure 6). Points above zero indicate perfor-
mance considerably better than chance. Points below zero indi-
cate that the PD provided a largely spurious fit (or suffered from
overfitting), resulting in poor generalization. For task spaces
(green), performance is plotted against the dimensionality of the
space. Given the lack of agreement regarding the key task vari-
ables, we triedmany candidate spaces. A number of task spaces
performed reasonablywell, including ‘‘targs+ inst. spd.,’’ a three-
dimensional space based on the horizontal and vertical target
location and the instructed speed (speed task only); ‘‘endpoints +
max. spd.,’’ a similar space based on the empirical reach
endpoints and peak speeds; ‘‘segment dirs.,’’ a six-dimensional
space built by dividing the reach trajectory into three vectors; and
‘‘initial vel.,’’ the average horizontal and vertical velocity during
the first 150 ms of the reach. That the PD can perform well in
different task spaces highlights the historical difficulty of deter-
mining which factors activity truly depends upon.
Performance of the PCA-based spaces is plotted for a range of
dimensionalities (values of k). Performance typically improved
with dimensionality. This increase is nontrivial, because general-
ization performance is being assessed. Still, because the dimen-
sionality of preparatory activity itself is moderately high (at least
7–10 dimensions; Experimental Procedures), performance
should increase with dimensionality, assuming the PD is in
approximately the ‘‘right’’ space. Performance typically declined
at dimensionalities > 10, an indication of overfitting.
The data in Figures 6A–6D lend themselves to many compar-
isons, but one central finding stands out: performance was
nearly always best for the space derived from the population-
level perimovement response. For every data set, the highest
level of performance was achieved—usually for a middle range
of dimensionalities—when PDs were expressed in the perimove-
ment space. Even if we consider each dimensionality individu-
ally, performance was almost always higher for the perimove-
ment space. An exception was that, among three-dimensional
spaces, the ‘‘targs + instr. spd.’’ and ‘‘endpoints + max. spd.’’
performed very well for the data sets collected using the speed
task. The former is undefined for the maze task, but the latter
did not perform well.
We did not test all possible task spaces. Nor is it clear that the
‘‘right’’ space should stay constant across tasks. Still, if we
restrict ourselves to the tested spaces and assume that the
correct tuning model should account for both straight and
curved reaches, then a clear rank order of spaces is present.
Figure 6E summarizes performance across the data sets
(excluding J-array, for which EMG was not recorded). For the
first subpanel, performance was computed for spaces of three
dimensions or less. The other subpanels allow spaces up to 6
and 12 dimensions. For PCA-based spaces, if the best dimen-
sionality was less than the maximum dimensionality allowed,
then the best was used. Performance (averaged across neurons)
was highest when the PD employed the space based on
perimovement neural activity. This performance differential
Neuron 68, 387–400, November 4, 2010 ª2010 Elsevier Inc. 393

endpoints+orth. exc.endpoints+viapoint
endpoints+halfpoint
segmentdirs
kitchen sink
endpoints+max. spd.
endpoints+max. vel.
targs+inst. spd.
initial vel.
monkey A
2 6 10 14
monkey B
2 6 10 14
monkey J
2 6 10 14
monkey J array
2 6 10 14
initial vel.
endpoints+orth. exc.
endpoints+halfpointendpoints+max. vel.
kitchen sinkendpoints+viapoint
segmentdirs
initial vel.
endpoints+orth. exc.
endpoints+max. spd.
endpoints+max. vel.
endpoints+halfpointendpoints+viapoint
segment dirs
kitchen sink
0
0.8
perf
orm
ance
(1
- er
ror)
0
0.8
perf
orm
ance
(1
- er
ror)
endpoints+max. spd.targs+inst. spd.
targs
targs
initial vel.
segment dirs
kitchen sink
endpoints+max. spd.endpoints+orth. exc. endpoints+max. vel.
endpoints+halfpointendpoints+viapoint
peri-movement space
kinematic space
EMG space
dimensionality of space dimensionality of space
peri-
mov
emen
t spa
ce
kine
mat
ic s
pace
*
initi
al v
el.
*
EM
G s
pace
*
endp
oint
s +
max
. spd
.
*
endp
oint
s +
ort
h. e
xc.
*0
0.5
perf
orm
ance
peri-
mov
emen
t spa
ce
EM
G s
pace
*
kine
mat
ic s
pace
*
segm
ent d
irs.
*
endp
oint
s +
hal
fpoi
nt
*
initi
al v
el.
*
endp
oint
s +
max
. vel
.
*
endp
oint
s +
max
. spd
.
*
endp
oint
s +
ort
h. e
xc.
*
peri-
mov
emen
t spa
ce
EM
G s
pace
*
kine
mat
ic s
pace
*
segm
ent d
irs.
*
endp
oint
s +
hal
fpoi
nt
*
initi
al v
el.
*
kitc
hen
sink
*
endp
oint
s +
max
. vel
.
*
endp
oint
s +
max
. spd
.
*
endp
oint
s +
ort
h. e
xc.
*
summary(up to 3 dim.)
summary(up to 12 dim.)
summary(up to 6 dim.)
B
DC
E
A
estimated upper limit
Figure 6. Ability of the PD to Account for Preparatory Tuning
(A–D) Performance of the PD for the four data sets. For PCA-based spaces (perimovement, kinematic, EMG), performance is plotted over a range of tested dimen-
sionalities. Task spaces (green) are plotted versus their respective dimensionalities. Gray line is an estimate of the upper limit on performance, given measure-
ment error (Experimental Procedures).
(E) Summary of performance, spanning data sets from monkeys A, B, and J. We combined only across spaces defined for all data sets (e.g., ‘‘targs + inst. spd.’’
was not included, but ‘‘endpoints + max. spd.’’ was included). Subpanels plot performance for spaces of the indicated dimensionality or less.
Bars plot standard errors. Asterisks indicate performance significantly worse (p < 0.001) than the best space.
Neuron
Cortical Preparatory Activity
394 Neuron 68, 387–400, November 4, 2010 ª2010 Elsevier Inc.

speed task
maze task
-150 -100 -50 0 50 1000
100
Time w.r.t movement onset (ms)
% o
rigin
al p
erfr
oman
ce
2 4 6 8 10 12 14Dimensions regressed against
0
0.8
1 -
erro
r
originalperi-movement space
shuffled space
A B
0 1PD consistency (competing space)
0
1
PD
con
sist
ency
(per
i-mov
emen
t spa
ce)
D monkey A
B
J (array)J
kinematics
segment directionstargs + inst. speedEMG
C
0
1
Nor
mal
ized
per
form
ance
all r
ecor
ding
site
s
ante
rior
post
erio
r
rand
om d
ivis
ion
Figure 7. Further Controls and Analyses
(A) Performance of the ‘‘shuffled’’ perimovement spaces, averaged over all the
data sets. During shuffling, either the firing rate for each neuron/condition was
left intact (50% probability) or the perimovement pattern was inverted. This
was done by preserving activity up to 150 ms before movement onset and
reflecting (vertically) all subsequent activity around the firing rate at that time.
(B) Performance (averaged across neurons) versus the start of the perimove-
ment interval. Performance was measured using the best dimensionality for
that data set/start time.
(C) Performance of the perimovement space for subsets of the original data.
Performance was computed for a six-dimensional space, normalized, and
averaged across data sets. Leftmost bar: performance for all data. Gray
bars: performance for sites with AP locations R the median (anterior) or %
the median (posterior). Second black bar: performance when data were
randomly subdivided.
(D) PD consistency for the perimovement space versus that for a variety of
other spaces. Kinematic and EMG spaces were chosen because they had
performed the best overall (after the perimovement space) in the analysis in
Figure 6. ‘‘Targs. + inst. speed’’ and ‘‘segment directions’’ spaces were
chosen because they performed well for the speed and maze tasks, respec-
tively. ‘‘Targs. + inst. speed’’ was undefined for the maze task; the similar
‘‘endpoints + max. spd.’’ space was analyzed instead.
Neuron
Cortical Preparatory Activity
increased at higher dimensionalities, indicating that the peri-
movement space better captured higher-dimensional aspects
of the data. Although a few task spaces performed well at lower
dimensionalities, no single task space performed consistently
well across data sets. As a result, the task spaces were largely
outcompeted by the PCA-based kinematic and EMG spaces,
which were in turn outperformed by the perimovement space.
Notably, the perimovement space performed well despite the
low correlation between preparatory and perimovement activity
at the single-neuron level (Figure 4).
ControlsMight the perimovement space perform well because it is based
in part on activity (the beginning of the perimovement epoch) that
correlates with preparatory activity? This is unlikely for three
reasons. First, when using a PD to capture a given neuron’s
preparatory activity, the perimovement space was based on
the responses of all the other neurons (Experimental Proce-
dures). Second, because perimovement activity is typically
stronger than preparatory activity, the perimovement space is
unlikely to be dominated by the trailing end of preparatory
activity. To illustrate this, we employed a shuffled control in
which each condition’s perimovement response was randomly
inverted on half the conditions (Figure 7, legend). The PCA-
based ‘‘shuffled space’’ performed poorly (Figure 7A); any
contribution from the trailing end of preparatory activity
(preserved despite shuffling) is insufficient to allow good perfor-
mance. Finally, the start of the perimovement window was
150 ms before movement onset but could be slid later in time
with little decline in performance (Figure 7B). Even when the
window began at movement onset (at which point the correlation
between preparatory and perimovement tuning is almost zero;
Figure 4E), performance was still at 97% (monkey J) and 94%
(monkeys A and B) of its original value.
Might the perimovement space perform well simply because it
is high dimensional? This is unlikely. Regressing against a high-
dimensional space will improve fit, but not generalization perfor-
mance (unless those higher dimensions really are relevant).
For example, the shuffled space is high dimensional but
performed poorly. Also, the high-dimensional task spaces
(including the gratuitously high-dimensional ‘‘kitchen sink’’
space) always underperformed the perimovement space.
Finally, the perimovement space performed well even at the
lower dimensionalities.
A final possible concern is that the perimovement space is
somehow at an advantage because it involves relating neural
activity with other neural activity. This is unlikely for a number
of reasons. First, the analysis in Figure 4 similarly related neural
activity during the two epochs, yet found little consistent rela-
tionship. Second, the measurement of neural activity is noisier
than the measurement of kinematic parameters or of EMG.
Based on a finite number of neurons, the perimovement space
will, if anything, be at a disadvantage. Third, a given neuron’s
preparatory activity was explained using a space derived from
the perimovement activity of all the other neurons. Finally, one
expects preparatory activity that is tuned for one thing (e.g.,
reach endpoint) to relate to perimovement activity tuned for
another (e.g., reach velocity). Yet any such secondary relation-
ship should be weaker than the direct relationship between
preparatory activity and the factor it is truly tuned for. However,
we found that preparatory activity was best explained in the peri-
movement space.
Comparison of Anterior versus Posterior SitesA number of response properties—including the prevalence of
preparatory activity—vary with anterior/posterior location within
Neuron 68, 387–400, November 4, 2010 ª2010 Elsevier Inc. 395

Neuron
Cortical Preparatory Activity
and between PMd/M1 (Kalaska et al., 1997; Kalaska et al.,
1998; Weinrich et al., 1984). We similarly found preparatory
activity to be more prevalent at anterior sites (data not shown).
However, with respect to our central results, anterior and poste-
rior sites were similar. The poor correlation between preparatory
and perimovement tuning (at the single-cell level) was equally
prevalent at anterior and posterior sites. Regressing tuning
correlation (as in Figure 4) against AP location yielded little or
no effect: r = �0.05, p = 0.82; r = �0.03, p = 0.85; r = �0.07,
p = 0.52; and r = 0.20, p = 0.27 for the four data sets.
The ability of the perimovement space to capture tuning also
held for both anterior and posterior sites (Figure 7C). Some
caution is required: any division of the data will likely yield poorer
performance, because the perimovement space is impacted
more by sampling noise. To combat this complication, we
normalized performance by its estimated upper limit (e.g., the
gray line in Figures 6A–6D). Performance, after dividing based
on anatomy, was only slightly different than if we down-selected
the data randomly. Performance was slightly better at anterior
sites, though this may occur simply because stronger tuning
can be more accurately measured and thus more accurately
captured by the PD.
Stability of the PDA common experimental design involves measuring the PD
before and after an imposed manipulation, such as a change
in arm posture or the addition of a load (e.g., Caminiti et al.,
1990; Kakei et al., 1999; Kalaska et al., 1989; Scott et al.,
1997). Often, the manipulation is carefully chosen to be maxi-
mally revealing with respect to the candidate spaces being
considered. However, the central logic holds more generally: if
the PD is expressed in the ‘‘right’’ space, it ought not change
when remeasured in another context. Our data sets employed
many (27–108) conditions, affording the opportunity to perform
a less creative, but not necessarily less effective, version of
this class of experiment. For each neuron, we randomly chose
25 conditions (with replacement) and measured the PD, then
randomly chose another 25 conditions and remeasured the
PD. (This analysis is possible because the PD is computed
via regression, which does not require a uniform arrangement
of conditions.) ‘‘PD consistency’’ was the dot product of the
two PDs.
Figure 7D plots average PD consistency in the perimovement
space versus that in a variety of other spaces. The perimovement
space always employed the same dimensionality as the space
with which it was compared. We chose two task spaces that
had performed well for at least one of the two tasks in the
analysis in Figure 6. For PCA-based kinematic and EMG spaces,
we employed the dimensionality that yielded the highest perfor-
mance for that data set in Figure 6. Thus, the task, kinematic, and
EMG spaces were given the best possible chance to compete
favorably with the perimovement space. Yet for every compar-
ison, and for all four data sets, the PD was most stable when
measured in the perimovement space.
Tuning from a Dynamical Systems PerspectiveThe finding that the PD performs best in a perimovement space
initially appears paradoxical, given the generally weak correla-
396 Neuron 68, 387–400, November 4, 2010 ª2010 Elsevier Inc.
tion between preparatory and perimovement tuning (Figure 4).
More broadly, what kind of a representation does this finding
imply? How might that representation be decoded? These
issues can be addressed under the interpretation that prepara-
tory activity serves as the initial state of a dynamical system
whose subsequent evolution produces perimovement activity
(Churchland et al., 2006b; Churchland et al., 2010; Cisek,
2006b; Fetz, 1992; Schaffer et al., 2006; Sussillo and Abbott,
2009; Yu et al., 2009). This suggestion is compatible with both
of our basic findings. The critical observation is that the trajectory
of a linear dynamical system is a weighted sum of component
patterns. Changes in the initial state lead to linear changes in
the magnitudes of those component patterns (Figure 8A).
If one knows how strongly each pattern is present, one can infer
the initial state. This will be approximately true for a nonlinear
system, to the degree that it can be approximated by a time-
varying linear system (see Supplemental Experimental
Procedures for a derivation and further illustration).
To illustrate the above, Figure 8 shows simple simulated
dynamics: circular trajectories through state space. We em-
ployed 25 initial states (25 ‘‘conditions’’; Figure 8B). These deter-
mine the phase and amplitude of the subsequent activity. The
system was held at its initial state (a rough analogy with prepara-
tory activity) and then released. At the single-unit level
(Figure 8C), preparatory activity seems to bear little relationship
to perimovement activity. The correlation of preparatory activity
with perimovement activity (averaged over the gray interval) was
0.08. Furthermore, a given preparatory firing rate could lead to
opposing patterns of perimovement activity (asterisks,
Figure 8C), much as was the case for the data (e.g.,
Figure 3C). This occurs because a given firing rate for unit 1
can correspond to different initial states (asterisks, Figure 8B).
Yet hidden in Figure 8C is a straightforward relationship.
When the initial rate of unit 1 is high, the subsequent pattern
contains a strong cosine-shaped modulation for unit 1 and
a strong sine-shaped modulation for unit 2. The orthogonal
activity pattern—a negative sine for unit 1 and a cosine for
unit 2—is completely uncorrelated with the initial state of unit
1 (it relates to the initial state of unit 2). Thus, unit 1 can be
said to have a ‘‘preferred direction’’ that points toward the first
of these population-level patterns and is orthogonal to the
second pattern.
Figure 8D illustrates such a PD (same format as for Figure 5C).
PCA yields a space that captures all activity patterns that are
possible for this system. Traces on each axis plot the pattern
captured by that principal component (black and blue for units
1 and 2). Each symbol’s location is given by the weights required
so that those patterns sum to the actual perimovement pattern
seen for that condition. Symbol size/color indicates the prepara-
tory rate of unit 1 for that condition. The PD points toward the
pattern recruited by the activity of unit 1 (Figure 8A) and
perfectly captures preparatory tuning. This occurs because
the space in Figure 8D is a linear transformation (in this case
a nearly pure rotation) of the space in Figure 8B. Given that there
was a direction in that original space (the horizontal axis) that
captured the initial activity of unit 1, there will also be a direction
(the PD) in the transformed space that captures the initial activity
of unit 1.
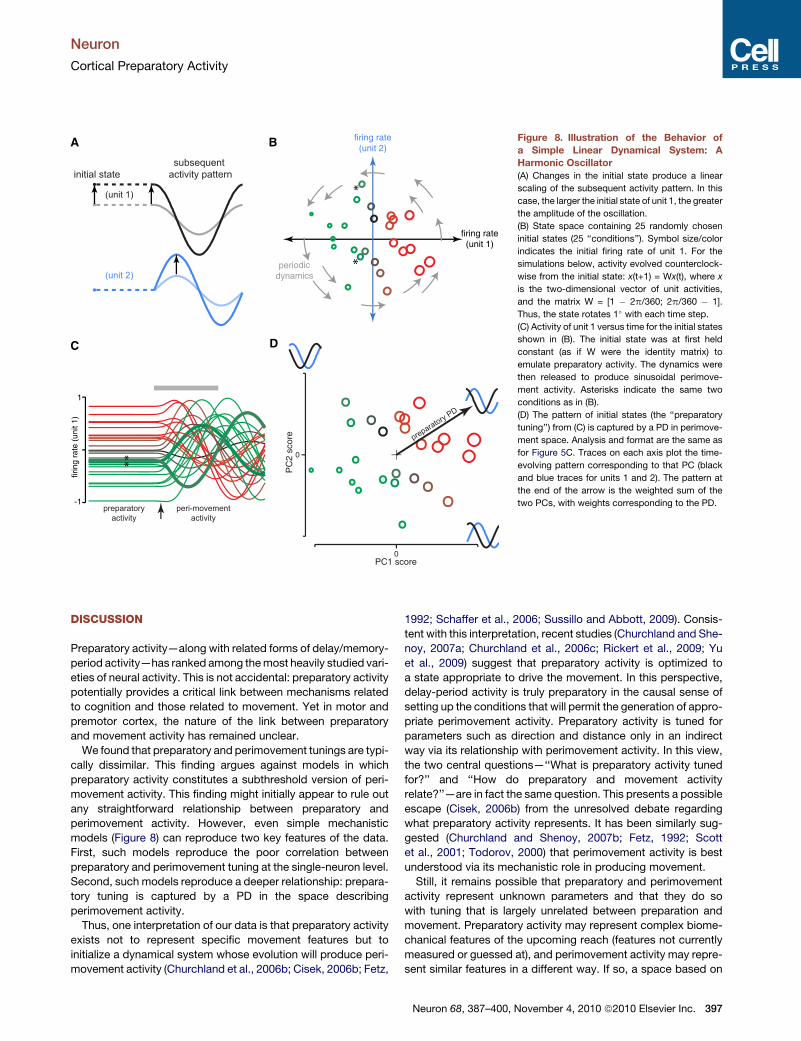
Figure 8. Illustration of the Behavior of
a Simple Linear Dynamical System: A
Harmonic Oscillator
(A) Changes in the initial state produce a linear
scaling of the subsequent activity pattern. In this
case, the larger the initial state of unit 1, the greater
the amplitude of the oscillation.
(B) State space containing 25 randomly chosen
initial states (25 ‘‘conditions’’). Symbol size/color
indicates the initial firing rate of unit 1. For the
simulations below, activity evolved counterclock-
wise from the initial state: x(t+1) = Wx(t), where x
is the two-dimensional vector of unit activities,
and the matrix W = [1 � 2p/360; 2p/360 � 1].
Thus, the state rotates 1� with each time step.
(C) Activity of unit 1 versus time for the initial states
shown in (B). The initial state was at first held
constant (as if W were the identity matrix) to
emulate preparatory activity. The dynamics were
then released to produce sinusoidal perimove-
ment activity. Asterisks indicate the same two
conditions as in (B).
(D) The pattern of initial states (the ‘‘preparatory
tuning’’) from (C) is captured by a PD in perimove-
ment space. Analysis and format are the same as
for Figure 5C. Traces on each axis plot the time-
evolving pattern corresponding to that PC (black
and blue traces for units 1 and 2). The pattern at
the end of the arrow is the weighted sum of the
two PCs, with weights corresponding to the PD.
Neuron
Cortical Preparatory Activity
DISCUSSION
Preparatory activity—along with related forms of delay/memory-
period activity—has ranked among themost heavily studied vari-
eties of neural activity. This is not accidental: preparatory activity
potentially provides a critical link between mechanisms related
to cognition and those related to movement. Yet in motor and
premotor cortex, the nature of the link between preparatory
and movement activity has remained unclear.
We found that preparatory and perimovement tunings are typi-
cally dissimilar. This finding argues against models in which
preparatory activity constitutes a subthreshold version of peri-
movement activity. This finding might initially appear to rule out
any straightforward relationship between preparatory and
perimovement activity. However, even simple mechanistic
models (Figure 8) can reproduce two key features of the data.
First, such models reproduce the poor correlation between
preparatory and perimovement tuning at the single-neuron level.
Second, such models reproduce a deeper relationship: prepara-
tory tuning is captured by a PD in the space describing
perimovement activity.
Thus, one interpretation of our data is that preparatory activity
exists not to represent specific movement features but to
initialize a dynamical system whose evolution will produce peri-
movement activity (Churchland et al., 2006b; Cisek, 2006b; Fetz,
1992; Schaffer et al., 2006; Sussillo and Abbott, 2009). Consis-
tent with this interpretation, recent studies (Churchland and She-
noy, 2007a; Churchland et al., 2006c; Rickert et al., 2009; Yu
et al., 2009) suggest that preparatory activity is optimized to
a state appropriate to drive the movement. In this perspective,
delay-period activity is truly preparatory in the causal sense of
setting up the conditions that will permit the generation of appro-
priate perimovement activity. Preparatory activity is tuned for
parameters such as direction and distance only in an indirect
way via its relationship with perimovement activity. In this view,
the two central questions—‘‘What is preparatory activity tuned
for?’’ and ‘‘How do preparatory and movement activity
relate?’’—are in fact the same question. This presents a possible
escape (Cisek, 2006b) from the unresolved debate regarding
what preparatory activity represents. It has been similarly sug-
gested (Churchland and Shenoy, 2007b; Fetz, 1992; Scott
et al., 2001; Todorov, 2000) that perimovement activity is best
understood via its mechanistic role in producing movement.
Still, it remains possible that preparatory and perimovement
activity represent unknown parameters and that they do so
with tuning that is largely unrelated between preparation and
movement. Preparatory activity may represent complex biome-
chanical features of the upcoming reach (features not currently
measured or guessed at), and perimovement activity may repre-
sent similar features in a different way. If so, a space based on
Neuron 68, 387–400, November 4, 2010 ª2010 Elsevier Inc. 397

Neuron
Cortical Preparatory Activity
perimovement activity would likely outperform all other tested
spaces if none involved an accurate guess regarding the right
features. In this view, the success of the perimovement space
underscores our ignorance regarding the true factors being rep-
resented.
The ‘‘representational’’ and ‘‘dynamical systems’’ views are
not necessarily at odds. Even if we accept the representational
view, the dynamical systems perspective in some sense has to
be true. Suppose preparatory activity represents reach endpoint
and perimovement activity represents muscle activity. There
must exist lawful and quantifiable dynamics that convert the
former representation into the latter. However, such dynamics
would need to be fairly complex and nonlinear. Preparatory
activity would probably not be readily explained by a PD in
perimovement space. Such a PD would certainly underperform
the PD in the correct (endpoint) space. Under the representa-
tional perspective, if one can identify the correct factors, the
PD should perform best in that space. Under the dynamical
systems perspective, so long as the dynamics are even approx-
imately linear, the perimovement space should outperform all
traditional spaces.
A caveat under either interpretation is that, although the peri-
movement space performed better on average, there were indi-
vidual neurons whose activity was better captured in one of the
other spaces. It seems plausible that some neurons do truly
‘‘represent’’ known task parameters (e.g., visual target location)
even if others play a different role. In particular, responses in
rostral premotor cortex (from which we did not record) seem
more closely tied to visual aspects of the task (Pesaran et al.,
2006; Shen and Alexander, 1997).
In summary, we found that the preparatory tuning of an M1/
PMd neuron was typically weakly related to its subsequent peri-
movement tuning. We then asked which set of variables (which
‘‘reference frame’’) best explained preparatory tuning. The most
successful reference frame was a space built to capture the
population-level patterns of movement-related activity. These
findings are consistent with the view that preparatory tuning
serves not to represent specific factors but to initialize a dynam-
ical system whose future evolution will produce movement.
EXPERIMENTAL PROCEDURES
Task Design and Behavior
Animal protocols were approved by the Stanford University Institutional Animal
Care and Use Committee. Our basic methods have been described previously
(Churchland et al., 2006c). Briefly, monkeys performed delayed reaches on
a frontoparallel screen. Delays ranged from 0 to 1000 ms (the exact range
varied by monkey). To allow sufficient preparatory activity, we analyzed only
trials with delays >400 ms. Fixation was enforced (at the central spot) during
the delay for monkey J only.
For single-electrode recordings using the maze task, we employed four sets
of 27 mazes each. Each neuron was recorded for one or more of these, but
rarely for all. The monkey J data set thus consists of four smaller data sets
of �53 neurons each. Population-level analyses were performed at the level
of these smaller data sets and then averaged. For the monkey J-array data
set, all 108 conditions were interleaved in the standard way.
Neural Recordings and Data Sets
Penetrations were guided by stereotaxic criteria, the known response proper-
ties of M1 and PMd, and the effects of microstimulation. Recordings were
398 Neuron 68, 387–400, November 4, 2010 ª2010 Elsevier Inc.
medial to the arcuate spur and lateral to—or, in a few instances, within the
lateral bank of—the precentral dimple. Few, if any, recordings were made
within rostral PMd, near the arcuate sulcus. Analysis of preparatory responses
was restricted to neurons with at least 10 spikes/s of preparatory tuning.
Electrode arrays were implanted in PMd and surface M1 (Figure S3). The re-
sulting data set involved simultaneous recordings and much larger trial counts
per neuron (2155). However, isolations were only occasionally of the same high
isolation quality as for the single-electrode recordings. Many array recordings
were of contaminated single-unit isolations or isolations of two or more
neurons. Still, some array-based isolations were of high quality, including
those in Figures 3E and 3F. Firing rate modulation was typically lower for the
array recordings, presumably because of the lack of selection bias. We thus
used a lower inclusion criterion: >5 spikes/s of preparatory tuning, which
was acceptable given the higher signal-to-noise ratio provided by the higher
trial count.
Correlations between Preparatory and Perimovement Tuning
For the preparatory epoch, firing rate was averaged from 200 ms before the go
cue until 100 ms after. For the perimovement epoch, activity was averaged
from 100 ms before movement onset until 350 ms after. The vector of prepa-
ratory rates (one per condition) was correlated with the vector of perimove-
ment rates. Analysis was restricted to neurons with robust perimovement
tuning (at least 1.5 times as strong as preparatory tuning). For all other analyses
(e.g., those in Figure 5, Figure 6, and Figure 7), neurons were analyzed regard-
less of the strength of perimovement activity.
Using a PD to Capture Preparatory Tuning
Activity during the preparatory epoch was fit using the model xn z bo + Sb,
where xn is a c 3 1 vector of preparatory firing rates (one for each of the c
conditions) for neuron n, S is a c 3 k matrix containing the location of every
condition in a k-dimensional space, bo is a scalar firing rate offset, and b is
a k 3 1 vector of coefficients. b and bo were found using linear regression
(Matlab, Mathworks). E.g., if S describes the location of each condition in
the space of horizontal and vertical target locations, b might be [1;0] for
a neuron with a rightward preference. The matrix S is the same for every
neuron, but all other variables differ. The vector b can be represented as
g 3 PD: a gain times a preferred direction of unit length.
Task Spaces
The ‘‘targets + instructed speed’’ space was three-dimensional: horizontal and
vertical target location plus instructed speed (1 for slow, 2 for fast). A similar
space, ‘‘endpoints + maximum speed,’’ was constructed based on the actual
reach endpoints and peak speed. Other task spaces were ‘‘initial velocity’’
(2D), the average horizontal and vertical velocity during the first 150 ms of
the reach; ‘‘endpoints + orthogonal excursion’’ (3D), the horizontal and vertical
endpoints and themaximum excursion from a straight reach (positive for coun-
terclockwise); ‘‘endpoints + viapoint’’ (4D), the horizontal and vertical
endpoints and the horizontal and vertical coordinates of the maximum depar-
ture from a straight reach; ‘‘endpoints +maximum velocity’’ (4D), the horizontal
and vertical endpoints and peak horizontal and vertical velocities; ‘‘endpoints +
halfpoint’’ (4D), the horizontal and vertical endpoints and horizontal and
vertical coordinates of the point halfway along the reach trajectory; ‘‘segment
directions’’ (6D), the individual horizontal and vertical displacements after
dividing the reach trajectory into three segments; and ‘‘kitchen sink’’ (9D and
11D for the speed and maze tasks). This last space was designed primarily
as a control for whether high dimensionality alone is sufficient to yield good
performance. It included the segment directions, the maximum counterclock-
wise excursion from a straight line, and the horizontal and vertical location of
that maximum excursion. For monkey J, it also included whether any barriers
were present (0 or 1) and whether distractor targets were present (0 or 1).
PCA-Based Spaces
To illustrate this approach, consider that reaches for different conditions differ
in velocity at most times. To fully characterize such differences, we can create
a c 3 2t matrix T, in which each row corresponds to a condition and contains
horizontal and vertical reach velocities for all t times. We can then use PCA to
reduce dimensionality from c 3 2t to c 3 k. The resulting matrix, Tred, then

Neuron
Cortical Preparatory Activity
captures the differences between conditions in a k-dimensional space. Note
that PCA ismore commonly applied to amatrix in which each row corresponds
to a time and each column to a neuron. Dimensionality reduction is then used
to denoise and visualize responses (for review, see Churchland et al., 2007).
Here PCA is used to parameterize key differences between conditions, rather
as one could have done by hand picking k features such as peak velocity. See
Figure S2 for further illustration.
The perimovement T matrix contained data from 150 ms before movement
onset until 400 ms (speed task) or 800 ms (maze task) after onset. Each row
contained data from all neurons except the neuron whose preparatory activity
wewere trying to capture. Responses were not normalized; neuronswith weak
perimovement activity were included but had little impact on Tred.
Each row of the kinematic T matrix included horizontal and vertical position,
velocity, and acceleration (150 ms before movement onset until after the
reach), normalized to have unity range across times/conditions. Each neuron
contributed one kinematic variable (so that the T matrix was of similar size to
that for perimovement activity).
Each row of the EMG Tmatrix contained activity for multiple muscles (same
time window as for the neural data). Each muscle’s activity was normalized to
have a unity range across times/conditions (a necessity, given the arbitrary
units of EMG).
PD Performance
Performance was assessed using leave-one-out cross validation. One condi-
tion was left out, and we found the PD that best captured tuning for the remain-
ing conditions. We then computed the error between the left-out preparatory
firing rate and that predicted by thePD. Performancewas quantified as 1minus
the mean squared error (averaged across all conditions, each left out in turn)
normalized by the variance of the data. Thus, performance equal to 1 indicates
that the PD generalized perfectly. Performance equal to 0 indicates that one
could have done similarly well by ignoring the PD and predicting every condi-
tion’s firing rate to be the mean firing rate. Performance below 0 typically
indicates overfitting.
SUPPLEMENTAL INFORMATION
Supplemental Information includes five figures and Supplemental Experi-
mental Procedures and can be found with this article online at doi:10.1016/j.
neuron.2010.09.015.
ACKNOWLEDGMENTS
This work was supported by a Helen Hay Whitney postdoctoral fellowship and
National Institutes of Health (NIH) postdoctoral training fellowship (M.M.C.),
the Burroughs Welcome Fund Career Awards in the Biomedical Sciences
(M.M.C., K.V.S.), the Michael Flynn Stanford Graduate Fellowship and NIH-
NINDS-CRCNS-R01 (J.P.C.), a National Science Foundation (NSF) graduate
research fellowship (M.T.K.), and the following awards to K.V.S.: NIH Direc-
tor’s Pioneer Award 1DP1OD006409, NIH NINDS R01-NS054283, DARPA
REPAIR (N66001-10-C-2010), Stanford Center for Integrated Systems, NSF
Center for Neuromorphic Systems Engineering at Caltech, Office of Naval
Research, and the Whitaker Foundation. We thank M. Risch for surgical and
veterinary assistance and S. Eisensee for administrative support.
Accepted: September 1, 2010
Published: November 3, 2010
REFERENCES
Bastian, A., Riehle, A., Erlhagen, W., and Schoner, G. (1998). Prior information
preshapes the population representation of movement direction in motor
cortex. Neuroreport 9, 315–319.
Bastian, A., Schoner, G., and Riehle, A. (2003). Preshaping and continuous
evolution of motor cortical representations during movement preparation.
Eur. J. Neurosci. 18, 2047–2058.
Batista, A.P., Santhanam, G., Yu, B.M., Ryu, S.I., Afshar, A., and Shenoy, K.V.
(2007). Reference frames for reach planning in macaque dorsal premotor
cortex. J. Neurophysiol. 98, 966–983.
Caminiti, R., Johnson, P.B., and Urbano, A. (1990). Making arm movements
within different parts of space: Dynamic aspects in the primate motor cortex.
J. Neurosci. 10, 2039–2058.
Churchland, M.M., and Shenoy, K.V. (2007a). Delay of movement caused by
disruption of cortical preparatory activity. J. Neurophysiol. 97, 348–359.
Churchland, M.M., and Shenoy, K.V. (2007b). Temporal complexity and
heterogeneity of single-neuron activity in premotor andmotor cortex. J. Neuro-
physiol. 97, 4235–4257.
Churchland, M.M., Afshar, A., and Shenoy, K.V. (2006a). A central source of
movement variability. Neuron 52, 1085–1096.
Churchland, M.M., Santhanam, G., and Shenoy, K.V. (2006b). Preparatory
activity in premotor and motor cortex reflects the speed of the upcoming
reach. J. Neurophysiol. 96, 3130–3146.
Churchland, M.M., Yu, B.M., Ryu, S.I., Santhanam, G., and Shenoy, K.V.
(2006c). Neural variability in premotor cortex provides a signature of motor
preparation. J. Neurosci. 26, 3697–3712.
Churchland, M.M., Yu, B.M., Sahani, M., and Shenoy, K.V. (2007). Techniques
for extracting single-trial activity patterns from large-scale neural recordings.
Curr. Opin. Neurobiol. 17, 609–618.
Churchland, M.M., Yu, B.M., Cunningham, J.P., Sugrue, L.P., Cohen, M.R.,
Corrado, G.S., Newsome, W.T., Clark, A.M., Hosseini, P., Scott, B.B., et al.
(2010). Stimulus onset quenches neural variability: A widespread cortical
phenomenon. Nat. Neurosci. 13, 369–378.
Cisek, P. (2006a). Integrated neural processes for defining potential actions
and deciding between them: A computational model. J. Neurosci. 26, 9761–
9770.
Cisek, P. (2006b). Preparing for speed. Focus on ‘‘Preparatory activity in pre-
motor and motor cortex reflects the speed of the upcoming reach’’. J. Neuro-
physiol. 96, 2842–2843.
Crammond, D.J., and Kalaska, J.F. (2000). Prior information in motor and pre-
motor cortex: Activity during the delay period and effect on pre-movement
activity. J. Neurophysiol. 84, 986–1005.
Erlhagen, W., and Schoner, G. (2002). Dynamic field theory of movement prep-
aration. Psychol. Rev. 109, 545–572.
Erlhagen, W., Bastian, A., Jancke, D., Riehle, A., and Schoner, G. (1999). The
distribution of neuronal population activation (DPA) as a tool to study interac-
tion and integration in cortical representations. J. Neurosci. Methods 94,
53–66.
Fetz, E.E. (1992). Are movement parameters recognizably coded in the activity
of single neurons? Behav. Brain Sci. 15, 679–690.
Fu, Q.G., Flament, D., Coltz, J.D., and Ebner, T.J. (1995). Temporal encoding
ofmovement kinematics in the discharge of primate primarymotor and premo-
tor neurons. J. Neurophysiol. 73, 836–854.
Georgopoulos, A.P., Kalaska, J.F., Caminiti, R., and Massey, J.T. (1982). On
the relations between the direction of two-dimensional arm movements and
cell discharge in primate motor cortex. J. Neurosci. 2, 1527–1537.
Georgopoulos, A.P., Crutcher, M.D., and Schwartz, A.B. (1989). Cognitive
spatial-motor processes. 3. Motor cortical prediction of movement direction
during an instructed delay period. Exp. Brain Res. 75, 183–194.
Ghez, C., Hening, W., and Gordon, J. (1991). Organization of voluntary move-
ment. Curr. Opin. Neurobiol. 1, 664–671.
Hanes, D.P., and Schall, J.D. (1996). Neural control of voluntary movement
initiation. Science 274, 427–430.
Hatsopoulos, N.G., Xu, Q., and Amit, Y. (2007). Encoding of movement frag-
ments in the motor cortex. J. Neurosci. 27, 5105–5114.
Hocherman, S., and Wise, S.P. (1991). Effects of hand movement path on
motor cortical activity in awake, behaving rhesus monkeys. Exp. Brain Res.
83, 285–302.
Neuron 68, 387–400, November 4, 2010 ª2010 Elsevier Inc. 399

Neuron
Cortical Preparatory Activity
Kakei, S., Hoffman, D.S., and Strick, P.L. (1999). Muscle and movement repre-
sentations in the primary motor cortex. Science 285, 2136–2139.
Kalaska, J.F., Cohen, D.A., Hyde, M.L., and Prud’homme, M. (1989). A
comparison of movement direction-related versus load direction-related
activity in primatemotor cortex, using a two-dimensional reaching task. J. Neu-
rosci. 9, 2080–2102.
Kalaska, J.F., Scott, S.H., Cisek, P., and Sergio, L.E. (1997). Cortical control of
reaching movements. Curr. Opin. Neurobiol. 7, 849–859.
Kalaska, J.F., Sergio, L.E., and Cisek, P. (1998). Cortical control of whole-arm
motor tasks. Novartis Found. Symp. 218, 176–190, discussion 190–201.
Kaufman, M.T., Churchland, M.M., Santhanam, G., Yu, B.M., Afshar, A., Ryu,
S.I., and Shenoy, K.V. (2010). Roles of monkey premotor neuron classes in
movement preparation and execution. J. Neurophysiol. 104, 799–810.
Messier, J., and Kalaska, J.F. (2000). Covariation of primate dorsal premotor
cell activity with direction and amplitude during a memorized-delay reaching
task. J. Neurophysiol. 84, 152–165.
Mussa-Ivaldi, F.A. (1988). Do neurons in the motor cortex encode movement
direction? An alternative hypothesis. Neurosci. Lett. 91, 106–111.
Pesaran, B., Nelson, M.J., and Andersen, R.A. (2006). Dorsal premotor
neurons encode the relative position of the hand, eye, and goal during reach
planning. Neuron 51, 125–134.
Requin, J., Riehle, A., and Seal, J. (1988). Neuronal activity and information
processing in motor control: From stages to continuous flow. Biol. Psychol.
26, 179–198.
Rickert, J., Riehle, A., Aertsen, A., Rotter, S., and Nawrot, M.P. (2009).
Dynamic encoding of movement direction in motor cortical neurons. J. Neuro-
sci. 29, 13870–13882.
Riehle, A., and Requin, J. (1989). Monkey primary motor and premotor cortex:
Single-cell activity related to prior information about direction and extent of an
intended movement. J. Neurophysiol. 61, 534–549.
Riehle, A., and Requin, J. (1993). The predictive value for performance speed
of preparatory changes in neuronal activity of the monkey motor and premotor
cortex. Behav. Brain Res. 53, 35–49.
Rosenbaum, D.A. (1980). Human movement initiation: Specification of arm,
direction, and extent. J. Exp. Psychol. Gen. 109, 444–474.
Sanger, T.D. (1994). Theoretical considerations for the analysis of population
coding in motor cortex. Neural Comput. 6, 29–37.
Schaffer, E.S., Rajan, K., Churchland, M.M., Shenoy, K.V., and Abbott, L.F.
(2006). Generating complex repeatable patterns of activity by gain modulating
network neurons. In Society for Neuroscience Annual Meeting, Atlanta, GA.
400 Neuron 68, 387–400, November 4, 2010 ª2010 Elsevier Inc.
Schall, J.D., and Thompson, K.G. (1999). Neural selection and control of visu-
ally guided eye movements. Annu. Rev. Neurosci. 22, 241–259.
Scott, S.H. (2000). Role of motor cortex in coordinatingmulti-joint movements:
Is it time for a new paradigm? Can. J. Physiol. Pharmacol. 78, 923–933.
Scott, S.H. (2008). Inconvenient truths about neural processing in primary
motor cortex. J. Physiol. 586, 1217–1224.
Scott, S.H., Sergio, L.E., and Kalaska, J.F. (1997). Reaching movements with
similar hand paths but different arm orientations. II. Activity of individual cells in
dorsal premotor cortex and parietal area 5. J. Neurophysiol. 78, 2413–2426.
Scott, S.H., Gribble, P.L., Graham, K.M., and Cabel, D.W. (2001). Dissociation
between hand motion and population vectors from neural activity in motor
cortex. Nature 413, 161–165.
Sergio, L.E., Hamel-Paquet, C., and Kalaska, J.F. (2005). Motor cortex neural
correlates of output kinematics and kinetics during isometric-force and arm-
reaching tasks. J. Neurophysiol. 94, 2353–2378.
Shadlen, M.N., and Newsome, W.T. (2001). Neural basis of a perceptual deci-
sion in the parietal cortex (area LIP) of the rhesus monkey. J. Neurophysiol. 86,
1916–1936.
Shen, L., and Alexander, G.E. (1997). Preferential representation of instructed
target location versus limb trajectory in dorsal premotor area. J. Neurophysiol.
77, 1195–1212.
Sussillo, D., and Abbott, L.F. (2009). Generating coherent patterns of activity
from chaotic neural networks. Neuron 63, 544–557.
Tanji, J., and Evarts, E.V. (1976). Anticipatory activity of motor cortex neurons
in relation to direction of an intended movement. J. Neurophysiol. 39, 1062–
1068.
Todorov, E. (2000). Direct cortical control of muscle activation in voluntary arm
movements: A model. Nat. Neurosci. 3, 391–398.
Turner, R.S. (1991). Movement- and instruction-related activity in the globus
pallidus of the monkey. PhD thesis, University of Washington, Seattle,
Washington.
Weinrich, M., Wise, S.P., and Mauritz, K.H. (1984). A neurophysiological study
of the premotor cortex in the rhesus monkey. Brain 107, 385–414.
Wise, S.P., Weinrich, M., and Mauritz, K.H. (1986). Movement-related activity
in the premotor cortex of rhesus macaques. Prog. Brain Res. 64, 117–131.
Yu, B.M., Cunningham, J.P., Santhanam, G., Ryu, S.I., Shenoy, K.V., and Sa-
hani, M. (2009). Gaussian-process factor analysis for low-dimensional single-
trial analysis of neural population activity. J. Neurophysiol. 102, 614–635.