Corruption and Its Alternative
33
Discussion Paper No. 604 CORRUPTION AND ITS ALTERNATIVES: A TAKEOFF THEORY OF GOOD GOVERNANCE Evan Osborne May 2004 The Institute of Social and Economic Research Osaka University 6-1 Mihogaoka, Ibaraki, Osaka 567-0047, Japan
Transcript of Corruption and Its Alternative

8/4/2019 Corruption and Its Alternative
http://slidepdf.com/reader/full/corruption-and-its-alternative 1/33
Discussion Paper No. 604
CORRUPTION AND ITS ALTERNATIVES:
A TAKEOFF THEORY OF GOOD GOVERNANCE
Evan Osborne
May 2004
The Institute of Social and Economic Research
Osaka University
6-1 Mihogaoka, Ibaraki, Osaka 567-0047, Japan

8/4/2019 Corruption and Its Alternative
http://slidepdf.com/reader/full/corruption-and-its-alternative 2/33
Corruption and Its Alternatives: A Takeoff
Theory of Good Governance
Evan OsborneWright State U. Dept. of Economics and Osaka U. Institute of Social and Economic
Research3640 Col. Glenn Hwy.
Dayton, OH 45435
(937) 775 4599
(937) 775 2441 (Fax)[email protected]

8/4/2019 Corruption and Its Alternative
http://slidepdf.com/reader/full/corruption-and-its-alternative 3/33
Abstract
Corruption is a function of its return relative to engaging in productive activities.
This paper presents an approach for thinking about the institutional features of societies
and the resulting amount of corruption. The empirical results suggest that political
competition is more important than competition in information-producing industries.
The rent-seeking view of the relation between government and corruption is rejected in
favor of the Becker (1983) model of political competition. The paper suggests that
societies that continually stay open to productivity-enhancing activities will eventually
enter a takeoff stage of anti-corruption efforts analogous to the eventual improvement in
income distribution that occurs in successful industrialization.

8/4/2019 Corruption and Its Alternative
http://slidepdf.com/reader/full/corruption-and-its-alternative 4/33
Corruption is a topic that has soared in importance in the development community
in recent years. Its role as an impediment to modernization has been empirically
documented by Mo (2001) and Mauro (1995). Its capacity to distort public resource-use
decisions has been demonstrated by Tanzi and Davoodi (2000), and has been interpreted
as rent-seeking by Krueger (1974). Its endogenous generation has been traced in
Mohtadi and Roe (2003) and Barreto (2000). Another influential theoretical approach
has been that of Murphy, Shleifer and Vishny (1993, hereafter MSV), who in the
Hirshleifer (1991) tradition depict the amount of rent-seeking as a function of the relative
return to appropriative as opposed to productive activity.
The relation between technological progress and corruption is one that merits
more study. This relation, suggested by but not explicitly explored in earlier work, has
powerful implications for corruption control. It suggests that policies that increase
productivity can endogenously control corruption by decreasing the desirability of
producing rent-seeking opportunities. This paper derives precise conditions whereby
progress in productive technology makes corruption control more worthwhile, and tests
whether these conditions hold. The empirical results allow for re-interpretation of the
expected effectiveness of corruption control at various stages of development. Sections 1
and 2 explore endogenous corruption where production is available as an alternative,
Section 3 tests the model and Section 4 re-interprets corruption control in light of the
findings.
1. The returns to parasitism
One empirical fact about corruption readily suggests itself – that it is inversely
1

8/4/2019 Corruption and Its Alternative
http://slidepdf.com/reader/full/corruption-and-its-alternative 5/33
related to a nation’s per capita income. Figure 1 plots the 2003 ratings of the anti-
corruption group Transparency International – ranging from zero to ten, with zero the
most corrupt – against per capita income in 2000, obtained from the World Bank’s World
Development Indicators database. The relationship is somewhat concave, with a
regression of the TI score on per capita GDP and per capita GDP squared included for
comparison.1
Rich countries are corrupt, poor ones are not, and there are a striking
number of countries with almost minimal per capita income and high degrees of
corruption. Roughly half the countries in the world, in other words, are in a low-income,
high-corruption equilibrium, one of two outcomes predicted by the MSV model. The
relation between income and corruption has been explored empirically by Paldam (2002)
using a single-equation model.
Per capita GDP
Ctry labels: TI rating Fitted values
115.881 56372
1.3
9.7
ETH
SLE
MWI
TZAMOZMDG
NGA
MLI
YEM
SDN
KEN
UGAVNM
HTI
GMB
BGD
ZMB
GHA
INDNICUZB
GEOAZEAGO
PAK
SEN
ZWEMDV
CMR
HNDCIV
CHNSYR
COG
LKA
KGZUKRALB
ONGBOL
ARM
IDN
PHL
EGY
YUG
WBG
MAR
ECU
ROM
BGR
KAZ
BHR
GUMDZA
JOR
IRN
PRY
SLVJAM
LTU
DOM
COLPER
NAM
RUS
TUN
MKD
LVA
BLR
THA
LBNTUR
BLZ
PAN
VEN
MEX
CRI
BWA
ZAF
SVKPOL
MUS
EST
BRA
MYS
TTO
HRVCZE
CHL
HUN
URY
SAU
ARG
SVN
PRT
KORGRC
KWT
CYP
ISR
NZL
ESP
ITA
GBRCANAUS
HKG
IRL
SGP
FRA
BEL
NLD
SWE
ISL
USA
FIN
GER
AUT
NOR
DNK
JPN
CHE LUX
Figure 1: Corruption and per capita income.
1. The regression is 2.484125 + 0.0003286 PCGDP – 4.23E-09 PCGDP 2
(n = 122, F =
322.50, R2
= 0.8247.
2
8/4/2019 Corruption and Its Alternative
http://slidepdf.com/reader/full/corruption-and-its-alternative 6/33
The traditional explanation for this relationship is that corruption destroys growth,
so that fighting corruption is causally prior to successful industrialization. But suppose
the reverse is true – that growth causes corruption reduction. As societies become more
productive,2
it is conceivable that a unit of resources devoted to appropriation becomes
more costly. If so, the members of society may find it less attractive or be willing to
endure a greater burden to fight it.
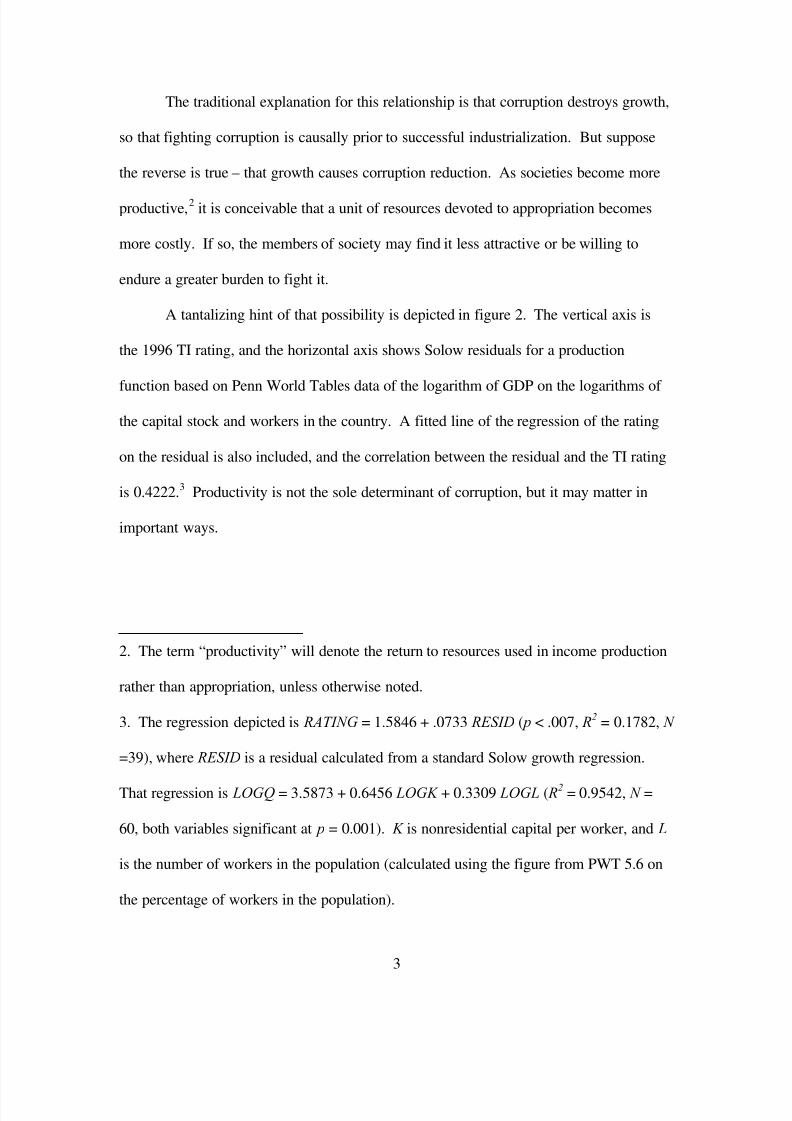
A tantalizing hint of that possibility is depicted in figure 2. The vertical axis is
the 1996 TI rating, and the horizontal axis shows Solow residuals for a production
function based on Penn World Tables data of the logarithm of GDP on the logarithms of
the capital stock and workers in the country. A fitted line of the regression of the rating
on the residual is also included, and the correlation between the residual and the TI rating
is 0.4222.3 Productivity is not the sole determinant of corruption, but it may matter in
important ways.
2. The term “productivity” will denote the return to resources used in income production
rather than appropriation, unless otherwise noted.
3. The regression depicted is RATING = 1.5846 + .0733 RESID ( p < .007, R2 = 0.1782, N
=39), where RESID is a residual calculated from a standard Solow growth regression.
That regression is LOGQ = 3.5873 + 0.6456 LOGK + 0.3309 LOGL ( R2 = 0.9542, N =
60, both variables significant at p = 0.001). K is nonresidential capital per worker, and L
is the number of workers in the population (calculated using the figure from PWT 5.6 on
the percentage of workers in the population).
3

8/4/2019 Corruption and Its Alternative
http://slidepdf.com/reader/full/corruption-and-its-alternative 7/33
Solow residuals
Country labels: 1996 TI rating Fitted values
20.6026 124.188
.69
10.7505
ECU
POL
BOL
KOR
PHLCOLIND
CHE
TUR
NGA
TWN
THA
GRC
JPN
FINNOR
KEN
DNK
CHL
VEN
NZLSWE
ARG
AUT
GERAUS
BELFRA
CAN
ESP
ISR
IRL
MEX
POR
NLD
ITA
GBR
USA
HKG
Figure 2 – Corruption and productivity.
The argument can be simply illustrated. Let the basic production function for the
economy be Y = Af (l ). l is total input of labor to productive activity, and f has the
standard textbook properties of production functions. There are positive but diminishing
returns throughout, so that f l > 0, f ll < 0. Assume also that f (0) = 0 and . To
illustrate the argument as parsimoniously as possible, assume that government has no role
in providing public services in and of themselves. Its only functions are to restrict the
options in private production. This can be modeled by having the government be simply
a dispenser of permits. X is the number of such permits that exist. These can be thought
of as inputs that must be purchased to enable production, even though they come at a cost
of deadweight loss in production. The model is thus of rent-seeking not just as diversion
of productive effort but as outright parasitism. Factors are not just diverted, but used
inefficiently. One might imagine that each permit is a weight that a worker must strap to
his back when entering the workplace. The permits stand for real economic phenomena
0
)0(lim→
∞=
l
f
4

8/4/2019 Corruption and Its Alternative
http://slidepdf.com/reader/full/corruption-and-its-alternative 8/33
involving artificially inefficient factor use – requirements to do business with the family
members of government officials or with other firms who have also paid bribes, to pay
extra for domestic products shielded from foreign competition, etc. Assume then that
production once permits exist is actually Y' ≡ Af (l )[1 – t ( X )], where X is the number of
permits and t ′ > 0, t′′ < 0 and t (0) = 0.
Permits are paid for like labor, out of produced income. And like output,
they are generated by applying the only scarce resource, labor, according to X =
g (e; α), with g e > 0, g ee < 0. α is a shift-parameter vector that is negatively related
to the marginal productivity of effort in creating permits, so that g eα < 0. It can be
thought of as the extent to which social institutions mitigate against successful
rent-seeking.
The economy operates under a full employment constraint:
e + l = N , (1)
with N the economy’s labor endowment. Government is thus not a single entity that
pursues some objective (e.g., maximizing welfare, payoffs to supporters or votes), but an
outlet for entrepreneurial endeavor like productive activity.
Total income produced accrues either to laborers or to permit producers:
Y = wee + wl l . (2)
5

8/4/2019 Corruption and Its Alternative
http://slidepdf.com/reader/full/corruption-and-its-alternative 9/33
we and wl are the wages in each activity. They will be equal to the value of
marginal product:
we = pg e(.), (3)
wl = Af l (.)[1 – t ( X )]. (4)
p is the price of permits, measured against the numeraire, income. The model is
closed by imposing the equilibrium condition that the marginal return to labor in the two
activities is equal:
we = wl . (5)
Given the exogenous α, there are thus eight unknowns – the wage rates we and wl ,
the permit price p, total consumption C , total labor devoted to each activity e and l ,
permits produced X and output produced Y . Some important figures for the analysis here
are the total number of permits in equilibrium X *, the equilibrium amount of effort
devoted to permit production e*, and the loss of output relative to the equilibrium with no
permits:
Y = Af ( N ) – Af (l*)[1 – t ( X *)]. (6)
6

8/4/2019 Corruption and Its Alternative
http://slidepdf.com/reader/full/corruption-and-its-alternative 10/33
Note that it is possible to have a golden equilibrium in which no permits are
issued (e* = 0) and income is maximized. But given the assumptions about f the contrary
result is not possible. In other words, there is no possibility of a perfectly corrupt society.
The economic interpretation for this result is that for at least some interval labor must be
used for production so that there is some output to be distributed to permit owners.
Denmark had a score of 10.0 in the 1998 TI ratings, which the organization characterizes
as “perfectly corruption free.” No nation, in contrast, has thus far received a score of
zero. A sufficient condition for the golden equilibrium is that g e(0, α) < Af l ( N ). This
condition is more likely as α is greater. If it does not hold than an interior solution
obtains.
Several results follow directly from analysis of the above framework. First,
corruption is a negative function of α. Second, there will be co-movements in the
equilibrium size of the state X* and the equilibrium amount of corruption e* as α varies.
The weaker are the exogenous constraints on the productivity of permit-creation, the
bigger its relative return and hence the larger the relative division of N among l and e.
This result is explicitly derived in Krueger (1974), and is the central point of Tullock
(1967). Thus, states with higher (lower) α should have both more (less) government
interference and more (less) corruption. This result requires that the two variables be
considered in a simultaneous framework. The idea that corruption and government are
both endogenous also appears in Erlich and Lui (1999).
2. Corruption and productivity
Another important implication is that more technologically advanced societies
7

8/4/2019 Corruption and Its Alternative
http://slidepdf.com/reader/full/corruption-and-its-alternative 11/33
may have less corruption, for at least one and possibly two reasons. In the usual way,
technological progress in production is modeled as an increase in A. Totally
differentiating (6) and rearranging terms yields
( ) ( ) ( )[ ] ( ) ( )[ ] ( )( )
dA
dX
dX
X dt l Af
dA
dl X t l Af X t l f N f
dA
Y d +−−−−= 11 . (7)
The change inY will always have two components. The first is due to the direct
opportunity cost of a given amount of rent-seeking. Output must be created using less
than the full employment endowment N because labor in the amount e* is unavailable for
production because it has been diverted to creation. This distance, the diversion effect, is
given by A[ f ( N ) – f (e*)]. This is the effect emphasized historically in the rent-seeking
literature. The second source of inefficiency, the millstone effect, is caused by
production away from the frontier with the smaller labor pool. It occurs because permit
production destroys some part of potential income. The diversion effect moves
production back along the production frontier, and the millstone effect moves the
equilibrium within it.
An increase in A increases the marginal return to production labor, and so labor is
reallocated from e to l . Permit production declines, and the diversion effect is
unequivocally smaller, as represented in (7) by ( ) ( )[ ]dA
dl
X t l f −
1 . However, the direction
of the change in the millstone effect, and hence the total loss Y , is ambiguous. On the
one hand less effort is being diverted from production, and fewer permits are being
produced, so the tax on production t ( X*) is smaller. In (7) this is given by
8

8/4/2019 Corruption and Its Alternative
http://slidepdf.com/reader/full/corruption-and-its-alternative 12/33
( )( )
dA
dX
dX
X dt l Af , which can be restated as ( )
( )dA
dl
de
dX
dX
X dt l Af − . On the other hand, the
smaller fraction is being taken of greater output, and so in absolute terms it is still
possible for Y to grow. This positive effect of higher productivity on Y is given by the
remaining terms in (7), ( ) ( ) ( )[ ] X t l f N f −− 1 .
Whether or not the total amount of corruption increases or decreases because of
the increase in A thus becomes an empirical question, but permit production
unambiguously declines. The answer depends first on the responsiveness of g to changes
in e. The more concave g is, the less reallocation of e will be needed to restore wage
equality in the two sectors. This means that the absolute value of the diversion effect is
lower and the likelihood that the total millstone effect on output, and hence the two
effects combined, is negative is greater. An analogous argument holds for the concavity
of f : the less concave it is, the less reallocation of labor between the sectors occurs. If
large, discrete changes in A occur, this increases the income-destroying portion of the
millstone effect, and hence makes it more likely that the deadweight loss from corruption
increases. Note that this is a contrast to MSV, who find that an improvement in
productivity cannot lead to an increase in appropriation.
Other than in MSV, the relation between the state of production technology and
the social cost of corruption has not been emphasized in the literature. Even in MSV the
establishment and strengthening of property-rights protection, which establishes the
productivity of rent-seeking effort and is so important in that model, is largely
unexplored. Here, nations with more advanced division of labor or production
technology may have more to lose from corruption. In a society with low productivity,
the effort spent seeking permits may be diverted from, for example, street peddling. But
9

8/4/2019 Corruption and Its Alternative
http://slidepdf.com/reader/full/corruption-and-its-alternative 13/33
in an advanced society, permit-generating effort will be diverted from productive activity
of far greater value owing to complex division of labor and the presence of large amounts
of productivity-enhancing technology, e.g. from a semiconductor factory. It is hence is
certainly more costly on a per-unit basis and may be more costly in total.
This is a significant claim because of the light it sheds on the relation between
corruption and prosperity. While it is well-established that corruption harms economic
growth, it is also true that increasing the gains to exchange will lower the return to
corruption. Depending on the nature of the collective-choice process, the greater losses
to corruption in a more productive society may result in a greater investment in its
control. The stylized fact of the coincidence of prosperity and clean governance may not
be simply a function of corruption deterring growth, but of lack of growth providing little
motivation for investment in fighting corruption, and a great deal of motivation for
engaging in it. If the model is an accurate description of the corruption process, nations
with higher productivity will empirically have less corruption and will be wealthier, not
just because they are more productive but because there is less deadweight loss from
permit-seeking.
3. The empirical model
The implications
Several empirical questions arise from the above framework, beyond the most
elementary one of the relation between technological advances and corruption. The first
is an older controversy descended from the fatalistic Virginia school of public choice.
Krueger (1974) and MSV depict a rent-seeking trap in which extensive government
10

8/4/2019 Corruption and Its Alternative
http://slidepdf.com/reader/full/corruption-and-its-alternative 14/33
intervention raises the return to appropriation, which draws labor away from production
and causes the production of yet more intervention. Government activity beyond the
protection of property rights will cause more corruption. If a rent-seeking trap develops
of the sort predicted by Krueger and MSV, government size will increase corruption, and
corruption too will increase government spending. There is also a particular variant with
respect to democracy. For example, Cheung (1998) argues that it promotes not just poor
economic performance but corruption as well, as politicians auction off government
favors to factions in an electorate ill-prepared to appreciate the costs of such measures.
On the other hand the Chicago school of public choice argues that governance,
and democratic governance in particular, is a means to provide public services that
coexist with rent-seeking in a manner that minimizes the latter. Politicians and
bureaucrats are subject to competitive pressures, which may differ in type but not in
fundamental nature from those of market traders. Excessively costly intervention
provokes competition from political traders – electoral candidates, potential appointees to
the bureaucracy, etc. – who bid down both the level of intervention and the level of
bribery and other costs associated with it. In other words, political markets behave in
exactly the same way as any other markets. The argument is laid out most famously in
Becker (1983), and finds echoes in Olson (2000). Collective choice determines spending,
which then determines lower corruption. An extension that has proven particularly
influential is Wittman (1989), who argues that democracy in particular improves the
competitiveness of the political process, and hence should enhance efficiency, defined
not around income maximization but preferences of the citizenry.
11

8/4/2019 Corruption and Its Alternative
http://slidepdf.com/reader/full/corruption-and-its-alternative 15/33
If the Chicago hypothesis is correct, we would expect that institutional features of
societies that lower the cost of political competition – i.e., that lower g' – would lower the
amount of corruption. Such features might include open immigration and emigration
laws, freedom of thought (in press, speech and religion), and limits on the ability of the
state to prosecute political opposition. The Wittman variant would also suggest that
democratic means for deciding political power should promote more effective corruption
control.
The two schools of thought also have different implications for the meaning of
government spending. In Virginia-school thinking it is simply rents successfully sought,
while in Chicago-school thinking it is something that arises from public desires for social
insurance, construction of public goods or other widely desired goals beyond property-
rights protection.
The dynamics of government size over time are themselves the subject of an
extensive empirical literature. The claim that national per capita income increases
demand for government spending, regulation and production has been investigated a
number of times. Among the papers that investigate the growth of spending, a key
controversy is whether the demand for such spending is income-elastic. While the
growth of government spending as countries have gotten wealthier has been noted in the
past (Peltzman, 1980), the large empirical literature on whether the latter causes the
former is mixed. For example, Kolluri et al. (2000) and Thornton (1999) find that it does
and Afxentiou and Serletis (1996 IEJ) find otherwise. In any event, the theory is
sufficiently entrenched to indicate that any empirical model in which government
12

8/4/2019 Corruption and Its Alternative
http://slidepdf.com/reader/full/corruption-and-its-alternative 16/33
spending is a left-hand variable indicates that per capita income be included on the right-
hand side.
The Empirical Specification
Several versions of the following basic simultaneous empirical model are used to
test the above implications:
CORRUPTION = a0 + a1 GOV + a2 PCS + a3 OPEN + a4 COMPETITION +
a5 FRACTION + a6 CULTURE (8a)
GOV = b0 + b1 CORRUPTION + b2 PCGDP + b3 POLRIGHTS +
b4 URBAN + b5 AVGSCHOOL (8b)
PCGDP = c0 + c1 CORRUPTION + c2 PCS (8c)
The estimation is by three-stage least squares. CORRUPTION is the sum of two
World Bank measures of governance quality, “corruption control” and “rule of law,” for
2002. These survey-based data are available at
http://info.worldbank.org/governance/kkz2002/tables.asp . A higher number denotes
better governance. GOV is government consumption spending as a fraction of GDP,
which is a proxy for rent-seeking in Virginia-school thinking and a desired outcome of
collective choice, to be protected from the impact of corruption, in Chicago-school
theory. PCS is the number of personal computers per 1000 population in 2000, and
proxies for A. It is from the World Bank’s World Development Indicators. OPEN is
13

8/4/2019 Corruption and Its Alternative
http://slidepdf.com/reader/full/corruption-and-its-alternative 17/33
imports plus incoming foreign direct investment as a percentage of GDP. It is included
on the assumption that more pressure from globalization of the economy results in
endogenously better governance.
COMPETITION is a combination of two variables that measure how easy it is to
bring political pressure to bear to lower corruption. POLRIGHTS is the Freedom House
measure of political rights, which ranges from one to seven, with one denoting the most
freedom. This variable is widely used in empirical work, but for present purposes it is
worth investigating it in some detail. A country’s rating depends on the extent to which
public officials are chosen by election, whether electoral competition is meaningful,
whether elected officials have significant power, whether citizens can organize into
effective political groups, whether the country is free from domination by traditional or
military hierarchies, and whether minorities have self-governance and/or substantial
participation in government. INFOSOC is the 2003 compilation of a measure created by
Norris (2001, Table 3.2) of the combination of old and new media available in a country
– of the penetration of newspapers, radio, television and stationary and mobile telephones
plus the percentage of the population that regularly uses the Internet, the percentage that
uses personal computers and the number of Web hosts.
POLRIGHTS and INFOSOC measure two different aspects of the cost of
changing government policy, including anti-corruption efforts. The former measures the
cost to citizens of opposing a policy once they have made a decision on its merit, and the
latter measures how costly it is to gain the information necessary to make the decision. 4
4. The argument that freedom of thought, i.e. of speech, religion and the press, is a way
to make information markets more competitive has been made by Posner (2003).
14

8/4/2019 Corruption and Its Alternative
http://slidepdf.com/reader/full/corruption-and-its-alternative 18/33
Because it is more narrowly defined, INFOSOC is a superior arrangement than Freedom
House’s companion measure to POLRIGHTS , which measures civil liberties and is
widely used in other work. While the civil-liberties measure is partly based on “freedom
of expression, assembly, association, education, and religion, it also incorporates a
“generally equitable system of the rule of law.” 5 It is thus best seen as a measure of both
an input and an output in the framework here.
FRACTION is the combination of the measures of ethnic, linguistic and religious
fractionalization generated by Alesina (2003). If greater tribal fractionalization raises the
costs of coordination across tribal lines to fight corruption or facilitates the creation of
smaller tribally defined groups around which to organize, greater fractionalization can in
the framework here increase the marginal productivity of permit-production effort.6
That
paper finds that, on a simple correlation basis, this index is positively correlated with
corruption. Finally, CULTURE stands for vectors of cultural dummies that attempt to
account for global differences in preferences that might make corruption more or less
undesirable. While the model assumes that corruption is undesirable because it lowers
income, it is possible that corrupt practices yield offsetting utility. Such a cultural source
for corruption has been theoretically posited by Huang and Wu (1994) and Montaner
(2000), though theoretically discounted by Paldam (2002). There are three attempts to
measure such differences, based on geography, colonial heritage or modal religion.
Dummies are included in the first specification for sub-Saharan Africa, Spanish-speaking
5. Quoted descriptions are from Freedom House (2003).
6. For an analysis of widespread tribal fractionalization proving productive for rent-
seeking in India see Osborne (2001).
15

8/4/2019 Corruption and Its Alternative
http://slidepdf.com/reader/full/corruption-and-its-alternative 19/33
Latin America, the former Soviet Union and members of the Arab League. The second
specification includes dummies for Anglo-American, French or Iberian colonial heritage.
The third uses dummies taking the value one if the modal religion is Protestant
Christianity (including Anglicanism), Catholicism or Islam, the three religions with
sufficient representation in the data set to merit inclusion. PCGDP and URBAN are the
2000 values of per capita income and the percentage of the population that is urban, from
the WDI.
(8a) includes, in addition to the causation from government to corruption posited
by the rent-seeking literature, three elements of α – political competition, information
production and fractionalization. PCS measures A. If the MSV model is correct it should
be positively signed. In addition to including the amount of government spending to test
for the simultaneous rent-seeking trap, (8b) contains variables recommended by some of
the growth-of-government literature, which contends that public spending expands in
higher-income and more urbanized (Peltzman, 1980; Kau and Rubin, 2002) nations. (8c)
is the equation for equilibrium income, Af (l *)[1-t ( X *)].
Results are reported in Table 1. Because INFOSOC and POLRIGHTS are highly
correlated ( ρ = -.5870), a model without POLRIGHTS in (8a) is also reported for each
cultural specification. With respect to the prime issue raised in the above analysis, in all
specifications a higher level of technological productivity is associated with less
corruption. Other issues are clarified as well. The result of Alesina (2003) is somewhat
robust to the extension here, in that FRACTIONALIZATION is significant at at least the
ten-percent level in five of the six specifications. POLRIGHTS is significant in all
specifications in which it is included.
16

8/4/2019 Corruption and Its Alternative
http://slidepdf.com/reader/full/corruption-and-its-alternative 20/33
The results of the variables representing the competitiveness of political markets
are striking. In the specifications with both variables POLRIGHTS is significant in the
expected direction while INFOSOC is only significant (in the expected direction) once,
when it is the only political-market competition variable included. This result suggests
that political competition is extremely important in promoting better governance, and that
information sufficient to allow citizens to agitate for it prevails even when penetration of
new and old media is not particularly pronounced. It may be that the necessary
information about corruption’s nature, scope and particulars can emerge even without
such conventional measures of its availability, so that the means to act on the information
is of primary importance. Political markets, in other words, can function well (at least
with respect to corruption) even when the market size of the formal information-
generating industry is not large.
As for the cultural dummies, the only constant finding is that LATIN is significant
and negatively signed. Religious and colonial-heritage variables are never significant.
Nations with Latin backgrounds tend to have more than the expected amount of
corruption, other things equal. Figure 3 plots the actual amount of corruption versus what
would be expected without the Latin penalty for Latin countries in the data set, i.e. the
predicted value from the structural-form estimation of (8a) in the full specification
without accounting for the Latin dummy. The average Latin country in the sample is
45.3 percent more corrupt than would be expected (n = 9). This anomaly, the only
consistent cultural result, remains to be explained. Other than that, corruption appears to
be a phenomenon of income maximization rather than intrinsic preferences.
17

8/4/2019 Corruption and Its Alternative
http://slidepdf.com/reader/full/corruption-and-its-alternative 21/33
World Bank Governance Index
45-degree line Ctry: Expected Corruption
-3.24 4.38
-3.24
4.38
PRY
ECU
HND
ARGCOL
NIC
PER
URYCRI
Figure 3 – Expected corruption for Latin nations.
Also of interest is the failure to confirm the standard version of the rent-seeking
model as it applies to government spending. Both corruption and government spending
are typically significant in the simultaneous framework. But unlike rent-seeking theory
predicts, the signs are positive. The quality of governance is always a positive and
significant predictor of the amount of spending, while spending is in three of six
specifications a significant predictor of quality of governance. In other words, nations
that have greater government spending tend to spend more on corruption control for a
given level of productivity, and nations with better governance are willing to engage in
more government spending. This suggests that government spending grows for reasons
external to corruption, but if it is bigger because of social preferences then societies may
find it worthwhile to invest more in corruption control, a topic explored in Section 4
below. The results, combined with the positive effect of more effective political
competition on corruption control, provides support for optimistic models of political
18

8/4/2019 Corruption and Its Alternative
http://slidepdf.com/reader/full/corruption-and-its-alternative 22/33
competition generally and electoral competition in particular as means to control the
deadweight losses of government spending.
4. Interpretation and Speculation
The results are suggestive on a number of counts with respect to the causes and
effects of corruption. One finding is that the relation between corruption and government
spending is the opposite of what traditional models of rent-seeking would predict if the
former is an output of the latter, other things equal. In addition, Fig. 1 suggests that
wealthy nations that devote large percentages of national income to extensive welfare
states are also among the least corrupt. That is a phenomenon that begs explanation.
Given that large amounts of income are transferred via the government in such programs
as state pensions and health-care systems, why are these societies, with so many tempting
rent-seeking targets, not more corrupt than they are? The answer may be that large
government spending, particularly in an advanced society, carries a corruption penalty
that is too high. If corruption also causes each unit of government spending to be subject
to corruption-induced waste, more corruption implies that these costs, too, are greater. It
is then easier to justify spending more resources on the prevention of such waste by
greater enforcement of property rights. The role of an independent judiciary as suggested
by Landes and Posner (1975) provides one plausible means of corruption control,
although the lack of any measures of judicial independence prevents a direct test of an
association between government spending and such independence.
The findings may also explain what has come to be known as the “Tullock
paradox.” Rent-seeking scholars have puzzled for years over the seemingly small
19

8/4/2019 Corruption and Its Alternative
http://slidepdf.com/reader/full/corruption-and-its-alternative 23/33
amount of rent-seeking expenditures relative to the size of the rents being sought. Most
of the evidence has been anecdotal, with Tullock himself (1997) citing a large number of
examples from the U.S. But societies that invest a great deal in the rule of law both lower
the returns to rent-seeking and insure that the rents that are parceled out are more stable,
thus discouraging endless cycles of rent-seeking warfare. While the paradox has always
focused on the seemingly implausibly high benefit/cost ratios for the winners in a
vigorous rent-seeking market, it is worth remembering that for every winner there may be
many losing pressure groups. Strategies that raise α will also cause each of these groups
to spend few resources in its unsuccessful efforts. The most important effect of cleaner
governance is thus to insure that the combined amount spent by winners and losers is
small.
The results also suggest that there is an under-emphasized dynamic and
endogenous aspect to corruption. While it is surely true that corruption hampers
economic growth, it is also true that rapid growth and rising prosperity increase
the social cost of corruption. If the market for governmental authority is at least
somewhat competitive, whether via elections or not, then as nations prosper their
political systems should begin to weed out the most corrupt practices accordingly.
If α is lowered over time by such a Becker (1983)-type competitive process, the
relatively high amount of corruption in poorer societies may be due not just to the
deleterious effects of corruption on growth but to the fact that the costs, political
and otherwise, of the investments needed to protect against it are not yet justified
by the benefits. If education, modern technology efficiently applied and the
division of labor advance sufficiently rapidly to enable rapid growth then the
20

8/4/2019 Corruption and Its Alternative
http://slidepdf.com/reader/full/corruption-and-its-alternative 24/33
corruption tax may grow so costly that political competition overcomes the inertia
of existing rent-seeking pressures and brings about political changes to reduce it.
If not countries may stagnate in the rent-seeking trap.
History is replete with anecdotes of better governance and prosperity
coinciding. While he does not make the connection, Barzun (2000) notes that
Venice was by a substantial margin the best-governed state in late-Renaissance
Europe, even as it was the most commercial. The puzzle of governance in
Renaissance Italy has also drawn the attention of Putnam (1993). Southern Italy
was governed vertically, with a feudal hierarchy extending down from the king,
while Northern Italy was governed horizontally, with mutual defense pacts
between relatively equal community associations. But the usual assumption is
that causation runs from government structure to prosperity – better governance
led to more wealth creation. However corruption control, with its enforcement
requirements and the need to provide adequate compensation to civil servants, is
not free, and its cost may have to be justified for a welfare-maximizing
government to find it worthwhile.
The pattern of corruption may well have an endogenous timeline as a
country industrializes, just as income distribution has been demonstrated to have
(Kuznets, 1968). There may be a takeoff point for anti-corruption efforts that is
analogous to and indeed may trail by some consistent margin the better-known
takeoff stage in industrialization. Once there is a widespread introduction of
enough productivity-enhancing shocks the two effects of cleaner governance
enhancing growth and higher productivity enhancing corruption control may
21

8/4/2019 Corruption and Its Alternative
http://slidepdf.com/reader/full/corruption-and-its-alternative 25/33
reinforce one another. Anecdotal evidence on societies suddenly making
substantial efforts to control corruption is common. Singapore and Hong Kong,
which are now thought of as model states with respect to corruption control, were
actually quite corrupt until reforms were launched in the mid-1960s in the former
case and the early 1970s in the latter, after rapid growth had begun but well before
it had ended. Similar launches of anti-corruption efforts have been documented
for the United Kingdom, the first industrial power, in the mid-nineteenth century
and for the U.S. later in that century (Rose-Ackerman, 1999). If the dating of
these efforts is accurate it appears that they all occurred after the industrialization
process was well underway. Miwa and Ramseyer (2000) present an example
from the other side in which Japanese firms in the early twentieth century, when
industrialization was still young, established arbitration procedures to avoid a
very corrupt judiciary.
The ability to use government to transfer wealth is in some sense
instability in property rights, in that the right to use property in exchange is
constrained. The firm that requires a license to import (especially if it must pay a
bribe to get one) finds its ability to exchange resources it owns in voluntary
exchange for that import limited and more costly. The domestic monopolist
protected by bribes lowers the purchasing ability of the labor time of its
customers. The problem of corruption control may be just an example of the
broader Demsetz (1967) analysis of property rights evolving only when the
benefits to establishing them justify the costs of enforcing them.
22

8/4/2019 Corruption and Its Alternative
http://slidepdf.com/reader/full/corruption-and-its-alternative 26/33
5. Conclusion
Development is about dynamics and transformation. Thus how corruption
might evolve over time is a question of great interest. The introduction of modern
technology and economic organization brings with it all manner of well-known
changes – migration to the cities, declining fertility, etc. The cost of corruption is
something else that changes over time. Raising the relative return to production
may cause an endogenous decrease in rent-seeking activity. Further, if
government officials have self-interest that promotes corruption but the society as
a whole has an interest in controlling it, these two functions trade off. That
corruption is a negative function of the cost of creating opportunities for it is a
central finding of this paper. The implication is that policies that promote
productivity, e.g. improvements in education and public health or liberalized
economies, can generate incentives for investing in the rule of law. This is in no
way to diminish the importance of organized anti-corruption campaigns in poor
countries, but just as with environmental and safety regulation in there are limits
to the ability of the state to achieve goals by passing laws, limits that are much
more compelling in impoverished nations.
References
Afxentiou, Panos C. and Serletis, Apostolos. “Government Expenditures in the
European Union: Do They Converge or Follow Wagner's Law?” International Economic
Journal 10 (3), Autumn 1996, 33-47.
23

8/4/2019 Corruption and Its Alternative
http://slidepdf.com/reader/full/corruption-and-its-alternative 27/33
Alesina, Alberto. “Fractionalization.” Journal of Economic Growth 8 (2), June
2003, 155-94.
Barreto, Raul A. “Endogenous Corruption in a Neoclassical Growth Model.”
European Economic Review 44 (1), January 2000, 35-60.
Barzun, Jacques. From Dawn to Decadence: 500 Years of Western Cultural Life,
1500 to the Present . New York: Harper Collins, 2001.
Becker, Gary S. “A Theory of Competition Among Pressure Groups for Political
Influence.” Quarterly Journal of Economics 98 (3), August 1983, 371-400.
Cheung, Steven N.S. “The Curse of Democracy as an Instrument in Collapsed
Communist Economies.” Contemporary Economic Policy 16 (2), April 1998, 247-249.
Demsetz, Harold. “Toward a Theory of Property Rights.” American Economic
Review 57 (2), May 1967, 347-359.
Ehrlich, Isaac and Lui, Francis T. “Bureaucratic Corruption and Endogenous
Economic Growth.” Journal of Political Economy 107 (6), December 1999, S270-S293.
Freedom House. Freedom in the World 2003: The Annual Survey of Political
Rights and Civil Liberties. New York: Freedom House, 2003.
Hirshleifer, Jack. “The Paradox of Power.” Economics and Politics 3 (3),
November 1991, 177-200
Huang, Peter H., and Wu, Ho Mou. “More Order Without More Law: A Theory
of Social Norms and Organizational Cultures.” Journal of Law, Economics and
Organization 10 (2), October 1994, 390-406.
Kau, James B. and Rubin, Paul H. “The Growth of Government: Sources and
Limits.” Public Choice 113 (3-4), December 2002, 389-402.
24

8/4/2019 Corruption and Its Alternative
http://slidepdf.com/reader/full/corruption-and-its-alternative 28/33
Kolluri, Bharat R., Panik, Michael J. and Wahab, Mahmoud S. “Government
Expenditure and Economic Growth: Evidence from G7 Countries.” Applied Economics
32 (8), June 2000, 1059-68.
Krueger, Anne O. “The Political Economy of the Rent-Seeking Society.”
American Economic Review 64 (3), June 1974, 291-303.
Kuznets, Simon. Toward a Theory of Economic Growth, With Reflections on the
Economic Growth of Modern Nations. New York: Norton, 1968.
Landes, William M. and Posner, Richard A. “The Independent Judiciary in an
Interest-Group Perspective.” Journal of Law and Economics 18 (3), December 1975,
875-901.
Mauro, Paolo. “Corruption and Growth.” Quarterly Journal of Economics 110
(3), August 1995, 681-712.
Miwa, Yoshiro and Ramseyer, J. Mark. “Corporate Governance in Transitional
Economies: Lessons from the Prewar Japanese Cotton Textile Industry.” Journal of
Legal Studies 29 (1), January 2000, 171-204.
Mo , Pak Hung. “Corruption and Economic Growth.” Journal of Comparative
Economics 29 (1), March 2001, 66-79.
Mohtadi, Hamid and Roe, Terry L. “Democracy, Rent Seeking, Public Spending
and Growth.” Journal of Public Economics 87 (3-4), March 2003, 445-66.
Montaner, Carlos Alberto. “Culture and the Behavior of Elites in Latin America.”
In Lawrence E. Harrison and Samuel P. Huntington (eds.), Culture Matters : How Values
Shape Human Progress. New York: Basic Books (2000), 56-64.
25

8/4/2019 Corruption and Its Alternative
http://slidepdf.com/reader/full/corruption-and-its-alternative 29/33
Murphy, Kevin M., Shleifer, Andrei and Vishny, Robert W. “Why is Rent-
Seeking so Costly to Growth?” American Economic Review 83 (2), May 1993, 409-14.
Norris, Pippa. The Digital Divide: Civic Engagement, Information Poverty, and
the Internet Worldwide. New York: Cambridge U. Press, 2001.
Osborne, Evan. "Culture, Development, and Government: Reservations in India."
Economic Development and Cultural Change 49 (3), April 2001, 659-685.
Olson, Mancur. Power and Prosperity: Outgrowing Communist and Capitalist
Dictatorships. New York: Basic Books, 2000.
Paldam, Martin. “The Cross-Country Pattern of Corruption: Economics, Culture
and the Seesaw Dynamics.” European Journal of Political Economy 18 (2), June 2002,
215-40.
Peltzman, Sam. “The Growth of Government.” The Journal of Law and
Economics 23 (2), October 1980, 209-287.
Posner, Richard A. Economic Analysis of Law. New York: Aspen Publishers
(2003).
Putnam, Robert D. “What makes democracy work?” National Civic Review 82
(2), Spring 1993, 101-107.
Rose-Ackerman, Susan. Corruption and Government: Causes, Consequences
and Reform. Cambridge, U.K.: Cambridge University Press, 1999.
Tanzo, Vito, and Davoodi, Hamid. “Corruption, Public Investment and Growth.”
In Viti Tanzo (ed.), Policies, Institutions and the Dark Side of Economics. Northampton,
MA: Elgar (2000), 154-70.
26

8/4/2019 Corruption and Its Alternative
http://slidepdf.com/reader/full/corruption-and-its-alternative 30/33
Thornton, John. “Cointegration, Causality and Wagner’s Law in 19th
Century
Europe.” Applied Economics Letters 6 (7), July 1999, 413-416.
Tullock, Gordon. “The Welfare Costs of Tariffs, Monopolies and Theft.”
Western Economic Journal 5 (3), June 1967, 224-32.
Tullock, Gordon. “Where is the Rectangle?” Public Choice 91 (2), April 1997,
149-59.
Wittman, Donald. “Why Democracies Produce Efficient Results.” Journal of
Political Economy 97 (6), December 1989, 1395-424.
27

8/4/2019 Corruption and Its Alternative
http://slidepdf.com/reader/full/corruption-and-its-alternative 31/33
Table 1Regression Results
Geography as cultureWith POLRIGHTS
WBSUM GOV PCGDP INTERCEPT -1.418555 INTERCEPT 15.38464*** INTERCEPT 5502.004***
(-1.28) (5.76) (8.38)
GOV .1296418* WBSUM 3.891733*** PCS 29.84462***(2.03) (3.45) (4.48) PCS .006269*** PCGDP -.0006735** WBSUM 2272.393***
(4.23) (-2.61) (4.16)
OPEN -.0027672 POLRIGHTS .0537489
(-1.11) (0.14) FRACTION -.3747026* URBAN .0854309*
(-2.20) (2.22)
INFOSOC .0133384
(1.16) POLRIGHTS -.1890665*
(-2.24)
AFRICA .1708384(0.60)
ARAB .414682
(0.92) LATIN -.8088764**
(-3.17)USSR -1.007727**
(-2.83) R2 .8272 .1059 .8913
Χ 2 416.1654*** 27.14104*** 568.0146***
N 69
Without POLRIGHTS WBSUM GOV PCGDP
INTERCEPT -3.382208*** INTERCEPT 18.79233*** INTERCEPT 5561.989***(-3.19) (11.03) (8.49)
GOV .2010441** WBSUM 34.435863*** PCS 29.02824***(2.68) (4.12) (4.37)
PCS .0044369* PCGDP -.0008045** WBSUM 2343.126***
(2.55) (-3.27) (4.30)OPEN -.002575 POLRIGHTS -.3253623
(-1.01) (-1.01) FRACTION -.256598 URBAN .0651084*
(-1.36) (1.78) INFOSOC .0277866*
(1.99) AFRICA .1075546
(0.35) ARAB -.0699911
(-0.17) LATIN -.6418411*
(-2.13)USSR -.8740332*
(-2.38)
R2 .6932 .0061 .8903
Χ 2 213.0734*** 36.47703*** 568.9656***
N 69
28

8/4/2019 Corruption and Its Alternative
http://slidepdf.com/reader/full/corruption-and-its-alternative 32/33
Table 1 (continued)Colonial heritage as culture
With POLRIGHTS WBSUM GOV PCGDP
INTERCEPT -1.195998 INTERCEPT 13.40274*** INTERCEPT 5568.614***(-1.11) (5.76) (7.22)
GOV .1077118* WBSUM 2.434738* PCS 28.94224***
(1.67) (1.93) (3.35) PCS .0082935*** PCGDP -.0003975 WBSUM 2350.046***(4.71) (-1.44) (3.24)
OPEN .000366 POLRIGHTS -.0786562(0.10) (-0.19)
FRACTION -.4631047* URBAN .0905269*(-2.31) (2.34)
INFOSOC .0016048(0.13)
POLRIGHTS -.1818573**(-2.74)
ANGLO .2605764
(0.87) FRANCE .3304371
(1.04)
IBERIA -.4587754(-1.58)
R2 .8337 .2352 .8903
Χ 2 381.0644*** 21.67442*** 555.7198***
N 69Without POLRIGHTS
WBSUM GOV PCGDP
INTERCEPT -1.918384* INTERCEPT 18.79233*** INTERCEPT 5561.989***
(-1.74) (11.03) (8.49)GOV .0971011 WBSUM 34.435863*** PCS 29.02824***
(1.45) (4.12) (4.37)
PCS .00776608*** PCGDP -.0008045** WBSUM 2343.126***
(4.13) (-3.27) (4.30)OPEN .0015961 POLRIGHTS -.3253623
(0.39) (-1.01)
FRACTION -.4289032* URBAN .0651084*(-2.01) (1.78)
INFOSOC .0144997(1.14)
ANGLO .2497119(0.78)
FRANCE .1556793(0.47)
IBERIA -.3361216(-1.08)
R2 .8202 .1905 .8857
Χ 2 344.3236*** 25.66064*** 558.6742***
N 69
29

8/4/2019 Corruption and Its Alternative
http://slidepdf.com/reader/full/corruption-and-its-alternative 33/33
Table 1 (continued)Religion
With POLRIGHTS WBSUM GOV PCGDP
INTERCEPT -.7609738 INTERCEPT 12.87168*** INTERCEPT 5614.329**(-0.59) (5.76) (6.95)
GOV .0720183 WBSUM 2.030967* PCS 28.32376**
(0.84) (1.93) (3.07) PCS .0086001*** PCGDP -.0003246 WBSUM 2403.163**(5.04) (-1.44) (3.09)
OPEN .0018012 POLRIGHTS -.1206088(0.51) (-0.30)
FRACTION -.3019184* URBAN .0926311*(-1.77) (2.31)
INFOSOC .0055977(0.44)
POLRIGHTS -.209615*(-2.49)
CATHOLIC -.3171243
(-1.10) PROTESTANT -.3725017
(-0.97)
ISLAM .2875778(0.57)
R2 .8484 .2525 .8895
Χ 2 398.3437*** 21.19363*** 551.5256***
N 69Without POLRIGHTS
WBSUM GOV PCGDP
INTERCEPT -3.047503* INTERCEPT 18.79233*** INTERCEPT 5561.989***
(-2.46) (11.03) (8.49)GOV .1570492 WBSUM 34.435863*** PCS 29.02824***
(1.56) (4.12) (4.37)
PCS .0066399** PCGDP -.0008045** WBSUM 2343.126***
(3.15) (-3.27) (4.30)OPEN .0015362 POLRIGHTS -.3253623
(0.42) (-1.01)
FRACTION -.1787926 URBAN .0651084*(-1.01) (1.78)
INFOSOC .019743(1.26)
CATHOLIC -.1133079(-0.35)
PROTESTANT -.3263573(-0.83)
ISLAM .0645997(0.14)
R2 .7539 .1992 .8868
Χ 2 207.8016*** 23.51664*** 5583.3751***
N 69