CORROSION PROTECTION PROVIDED BY …2243/datastream/OBJ/...CORROSION PROTECTION PROVIDED BY...
260
CORROSION PROTECTION PROVIDED BY TRIVALENT CHROMIUM PROCESS CONVERSION COATINGS ON ALUMINUM ALLOYS By Liangliang Li A DISSERTATION Submitted to Michigan State University in partial fulfillment of the requirements for the degree of Chemical Engineering – Doctor of Philosophy 2013
Transcript of CORROSION PROTECTION PROVIDED BY …2243/datastream/OBJ/...CORROSION PROTECTION PROVIDED BY...

CORROSION PROTECTION PROVIDED BY TRIVALENT CHROMIUM PROCESS CONVERSION COATINGS ON ALUMINUM ALLOYS
By
Liangliang Li
A DISSERTATION
Submitted to Michigan State University
in partial fulfillment of the requirements for the degree of
Chemical Engineering – Doctor of Philosophy
2013
ABSTRACT
CORROSION PROTECTION PROVIDED BY TRIVALENT CHROMIUM PROCESS CONVERSION COATINGS ON ALUMINUM ALLOYS
By
Liangliang Li
High strength aluminum alloys are widely used in aviation and aerospace
industries because of their desirable strength/weight ratio that results from the alloy
addition (e.g., Cu, Fe etc). However, this alloy addition causes pitting corrosion of the
aluminum surrounding those intermetallic inclusions. One efficient way to inhibit the
corrosion is through the protective coating system that contains the topcoat, primer, and
conversion coating. The conversion coating is in direct contact with the alloy surface
and is expected to provide both good corrosion protection and adhesion. The chromate
conversion coating (CCC) has been widely used in aviation/aerospace industry and
provides excellent active corrosion protection and adhesion to aluminum alloys.
Unfortunately, the Cr(VI) is toxic and chromate is a carcinogen. Therefore, a trivalent
chromium process (TCP) coating was developed as a drop-in replacement of CCC.
This dissertation focuses on a fundamental understanding of the formation
mechanism, chemical structure, and basic electrochemical properties of the TCP
coating on three high strength aluminum alloys: AA2024-T3, AA6061-T6, and AA7075-
T6. The formation of the TCP coating is driven by an increase in the interfacial pH. The
coating is about 50-100 nm thick and has a biphasic structure consisting of a
ZrO2/Cr(OH)3 top layer and an AlF63-
/Al(OH)3 interfacial layer. The coating contains
hydrated channels and or defects.

The TCP coating provides good corrosion protection to all three aluminum alloys
evidenced by e.g., increased Rp, decreased icorr, and higher Epit for the coated alloys
than uncoated samples. However, the protection by TCP is increased for AA2024-T3 <
AA7075-T6 < AA6061-T6. The protection mechanisms include (i) reducing oxygen
reduction kinetics, (ii) partially blocking the mass transfer of dissolved O2 and ions to
the metal, and (iii) insulating the electron transfer through the non-conductive oxide
layer. The TCP coating (Cr(III)/Zr-based) provides better corrosion protection compared
to other non-Cr alternatives of CCC, e.g., Ti/Zr- and Zn/Zr-based conversion coatings,
Another significant finding of this work is that the TCP coating provides some
active corrosion protection by transiently forming Cr(VI) species (e.g., CrO42-
). The
formation involves two steps: (i) O2 diffuses through the defects to the Cu-rich
intermetallic sites where it is reduced to H2O2; (ii) H2O2 oxidizes nearby Cr(III) to Cr(VI).
The insights gained from this fundamental study provide information to improve
the corrosion protection provided by TCP. For example, the coating contains defects
through which dissolved O2 and ions can still diffuse to the underlying metal. Therefore,
its corrosion protection can be improved by (i) compressing the coating structure and (ii)
reducing the alloy sites where defects form. The former is achieved by optimizing the
curing temperature and time and the corrosion resistance is increased by ~4×; the latter
is through optimization of the deoxidation/desmutting time and solution and the
corrosion protection property is improved by ~5×.

iv
ACKNOWLEDGEMENTS
My success in graduate school was made possible by the combined effort of a
number of people.
I would like to first thank my advisor, Dr. Greg Swain. He continually and
convincingly conveyed a spirit of adventure in regard to research and an excitement as
to teaching. He provided me with a research environment that encouraged me to solve
scientific problems. His understanding and patience supported me through my research.
I have been awarded the Dissertation Completion Fellowship, which would have been
impossible without his advising and mentoring. I enjoyed working with him and am
sincerely grateful for him and his guidance.
I would also like to thank my committee professors, Dr. Scott Barton, Dr.
Lawrence Drzal, and Dr. Andre Lee. They provided professional guidance and generous
advice. I also thank several other great professors, Dr. Gerald Frankel and Dr. Rudy
Buchheit from The Ohio State University (OSU), Dr. Mark Orazem from University of
Florida, Dr. Wei Lai from Michigan State University (MSU) for their generous advice,
persistent encouragement, and insightful comments. I would also like to take this
opportunity to thank Dr. Robert Ofoli who was my first advisor in graduate school.
Without his understanding and support during my transferring group, I could not get the
chance to work in my interested research fields.
My sincere thanks also go to my past and current group members for their
sharing information and experiences. Dr. Doo Young Kim and Dr. Matthew Fhaner
encouraged and helped train me to become the scientist I am today. I would also send

v
thanks to David Woodbury, Brandon Whitman, Dr. Xingyi Yang, Marion France,
LeighAnn Tomaswick, Yan Zhu, Chen Qiu and Catharine Munson along with all other
Swain Group member.
I would like to thank my friends I made during my graduate school. I cannot gain
the success without their support, understanding, and help. I thank Xinting Lin, Huang
Wu, Ruiguo Yang, Yan Li, Pitichon Klomjit (OSU), Zhicao Feng (OSU), Chao Cheng,
and Heyi Hu for their academic and personal help. I thank Dr. Stanley Flegler, Carol
Flegler, Abigail Tirrell, and Per Askeland for their technical support.
Finally, I would like to thank my family, especially my parents for their support
and understanding when I had to decline family functions for work reasons. I cannot
achieve so much without their encouragement and motivation.

vi
TABLE OF CONTENTS
LIST OF TABLES .................................... ....................................................................... x
LIST OF FIGURES........................................................................................................ xii
CHAPTER 1. INTRODUCTION AND BACKGROUND ....................... ............................ 1
1.1 Aluminum Alloys ............................................................................................... 1
1.1.1 Designation system, chemical compositions, and mechanical properties .. 1
1.1.2 Applications ............................................................................................... 3
1.2 Corrosion and Corrosion Protection for Aluminum Alloys ................................. 4
1.2.1 Corrosion types .......................................................................................... 4
1.2.2 Corrosion protection methods .................................................................... 7
1.3 Chromate Conversion Coatings ...................................................................... 12
1.4 Non-Chromate Conversion Coatings .............................................................. 14
1.5 Metal Surface Pretreatment ............................................................................ 17
1.5.1 Cleaning/degreasing ................................................................................ 17
1.5.2 Etching ..................................................................................................... 17
1.5.3 Deoxidizing/desmutting ............................................................................ 18
1.6 Research Objective and Aims ......................................................................... 19
CHAPTER 2. EXPERIMENTAL SECTION .............................. ..................................... 22
2.1 Reagents......................................................................................................... 22
2.2 Preparation of TCP-coated aluminum alloys ................................................... 23
2.3 Physical and Chemical Characterization ......................................................... 24
2.3.1 Raman Spectroscopy............................................................................... 24
2.3.2 X-ray Photoelectron Spectroscopy .......................................................... 24
2.3.3 Auger Depth Profiling ............................................................................... 25
2.3.4 Scanning Electron Microscopy / Energy-Dispersive X-ray Spectroscopy 25
2.3.5 Transmission Electron Microscopy .......................................................... 25
2.3.6 Atomic Force Microscopy ......................................................................... 26
2.3.7 Spectroscopic ellipsometry ...................................................................... 26
2.3.8 Contact angle measurement .................................................................... 27
2.4 Electrochemical Characterization .................................................................... 27
2.5 In situ pH Measurement .................................................................................. 36
2.5.1 Tungsten Microelectrode Preparation ...................................................... 36
2.5.2 OCP traces of the tungsten microelectrode in buffer solutions ................ 37
2.5.3 Calibration Curves of OCP vs. pH ........................................................... 38
2.6 Accelerated corrosion (degradation) tests ...................................................... 40
2.6.1 Full immersion test ................................................................................... 40

vii
2.6.2 Atmospheric corrosion test – humidified air ............................................. 41
2.6.3 Amophseric corrosion test - moist SO2 .................................................... 41
2.6.4 Thin layer test .......................................................................................... 43
2.7 Galvanic coupling ............................................................................................ 44
CHAPTER 3. FORMATION, STRUCTURE, AND BASIC ELECTROCHEMISTRY OF TRIVALENT CHROMIUM PROCESS (TCP) COATINGS ON AA2024 -T3 .................. 46
3.1 Introduction ..................................................................................................... 46
3.2 Results ............................................................................................................ 48
3.2.1 OCP and pH changes during formation of TCP coatings ......................... 48
3.2.2 AFM topography of TCP-coated alloys .................................................... 52
3.2.3 Auger depth profiling of TCP coatings ..................................................... 53
3.2.4 Chemical structure of Cr in TCP coatings ................................................ 55
3.2.5 SEM/EDAX analysis of TCP-coated aluminum alloys .............................. 56
3.2.6 Basic electrochemistry of TCP-coated aluminum alloys .......................... 57
3.2.7 Mass transfer inhibition ............................................................................ 62
3.3 Discussion....................................................................................................... 65
3.3.1 Formation of TCP coatings ...................................................................... 65
3.3.2 Structure of TCP coatings ........................................................................ 66
3.3.3 TCP as charge transfer inhibitor .............................................................. 68
3.3.4 TCP as a poorly conductive barrier to ETR .............................................. 68
3.3.5 TCP as a physical barrier that diminishes O2 mass transfer .................... 69
3.4 Conclusions .................................................................................................... 71
CHAPTER 4. TRANSIENT FORMATION OF CR(VI) IN TRIVALENT CHROMIUM PROCESS COATINGS IN AA2024-T3 PROBED BY RAMAN SPECT ROSCOPY ..... 73
4.1 Introduction ..................................................................................................... 73
4.2 Results ............................................................................................................ 76
4.2.1 Raman spectra for reference Cr and mixed Cr/Al oxides. ........................ 76
4.2.2 Transient formation of Cr(VI) caused by H2O2. ........................................ 80
4.2.3 TCP-coated AA2024 samples before immersion testing.......................... 84
4.2.4 Transient formation of Cr(VI) during immersion testing. .......................... 87
4.2.5 Corrosion protection linked with the transient formation of Cr(VI). ........... 90
4.3 Discussion....................................................................................................... 94
4.3.1 What is the mechanism by which the Cr(VI) oxide species transiently form in the TCP coating on AA2024? ............................................................................. 94
4.3.2 What is the chemical environment around the Cr(VI) oxide species that form? 96
4.3.3 Does the Cr(VI) oxide species provide any active corrosion protection? . 97
4.4 Conclusion ...................................................................................................... 98

viii
CHAPTER 5. THE FORMATION, STRUCTURE AND BASIC ELECTROCHEMICAL PROPERTIES OF TCP COATINGS ON AA6061-T6 AND AA7075- T6 ..................... 100
5.1 Introduction ................................................................................................... 100
5.2 Results .......................................................................................................... 102
5.2.1 Formation of the TCP coating ................................................................ 102
5.2.2 Structure of the TCP coating .................................................................. 103
5.2.3 Stability of the TCP coating .................................................................... 108
5.2.4 Transient formation of Cr(VI) during immersion ..................................... 110
5.2.5 Corrosion protection provided by the TCP coating. ............................... 112
5.3 Discussion..................................................................................................... 123
5.3.1 Formation mechanism and chemical structure ...................................... 123
5.3.2 Stability of the TCP coating on AA6061 and AA7075 ............................ 125
5.3.3 Transient formation of Cr(VI) ................................................................. 126
5.3.4 Corrosion protection .............................................................................. 127
5.4 Conclusion .................................................................................................... 130
CHAPTER 6. STABILITY OF TCP COATINGS DURING ACCELERATED CORROSION TESTS .................................................................................................. 132
6.1 Introduction ................................................................................................... 132
6.2 Results and Discussion ................................................................................. 134
6.2.1 Full immersion ....................................................................................... 134
6.2.2 Atmospheric corrosion ........................................................................... 137
6.2.3 Thin layer mist exposure ........................................................................ 140
6.3 Conclusion .................................................................................................... 142
CHAPTER 7. EFFECTS OF THE DEOXIDATION/DESMUTTING TIME AND SOLUTION CHEMISTRY ON THE CORROSION INHIBITION PROVIDED BY THE TCP COATING ON AA2024 ............................. .......................................................... 143
7.1 Introduction ................................................................................................... 143
7.2 Results .......................................................................................................... 146
7.2.1 Deoxidizing/desmutting in acidic fluoride Smut-Go. ............................... 146
7.2.2 Deoxidizing/desmutting in alkaline halide-free 0.1 M NaOH. ................. 150
7.3 Discussion..................................................................................................... 160
7.4 Conclusion .................................................................................................... 163
CHAPTER 8. EFFECTS OF CURING TEMPERATURE AND TIME ON THE CORROSION INHIBITION PROVIDED BY THE TCP COATING O N AA2024-T3 .... 165
8.1 Introduction ................................................................................................... 165
8.2 Results .......................................................................................................... 166
8.2.1 Curing temperature. ............................................................................... 166
8.2.2 Curing time. ........................................................................................... 172

ix
8.3 Discussion..................................................................................................... 174
8.3.1 Effect of the curing temperature and time .............................................. 174
8.3.2 Effect mechanisms ................................................................................ 176
8.4 Conclusion .................................................................................................... 177
CHAPTER 9. CORROSION PROTECTION PROVIDED BY OTHER NON-CHROMIUM CONVERSION COATINGS ON AA2024-T3 .................. ............................................ 179
9.1 Introduction ................................................................................................... 179
9.2 Results .......................................................................................................... 180
9.2.1 Formation of Ti/Zr coatings .................................................................... 180
9.2.2 Chemical Structure ................................................................................ 181
9.2.3 Basic Electrochemical Properties .......................................................... 187
9.2.4 Galvanic Couples of 5200-coated AA2024-T3 and Ti-6Al-4V fasteners. 192
9.2.5 Accelerated Corrosion Tests. ................................................................. 195
9.3 Discussion..................................................................................................... 196
9.3.1 Formation mechanism and chemical structure ...................................... 196
9.3.2 Corrosion protection property ................................................................ 198
9.4 Conclusion .................................................................................................... 199
CHAPTER 10. EFFECTS OF GALVANIC COUPLING WITH SS A286 CRES AND TI-6AL-4V FASTENERS ON CORROSION INHIBITION PROVIDED B Y TRIVALENT CHROMIUM PROCESS (TCP) COATINGS ON AA2024-T3 PANELS ...................... 201
10.1 Introduction ................................................................................................... 201
10.2 Results .......................................................................................................... 202
10.2.1 Basic electrochemical properties ........................................................... 202
10.2.2 Accelerated corrosion tests .................................................................... 207
10.3 Discussion..................................................................................................... 213
10.3.1 Corrosion protection provided by the TCP coating ................................ 213
10.3.2 Effects of Fasteners on Corrosion Protection by TCP ........................... 214
10.4 Conclusions .................................................................................................. 214
CHAPTER 11. SUMMERY AND FUTURE WORK ............... ...................................... 216
11.1 Summery....................................................................................................... 216
11.2 Future Work .................................................................................................. 221
BIBLIOGRAPHY.. .................................... ................................................................... 224
x
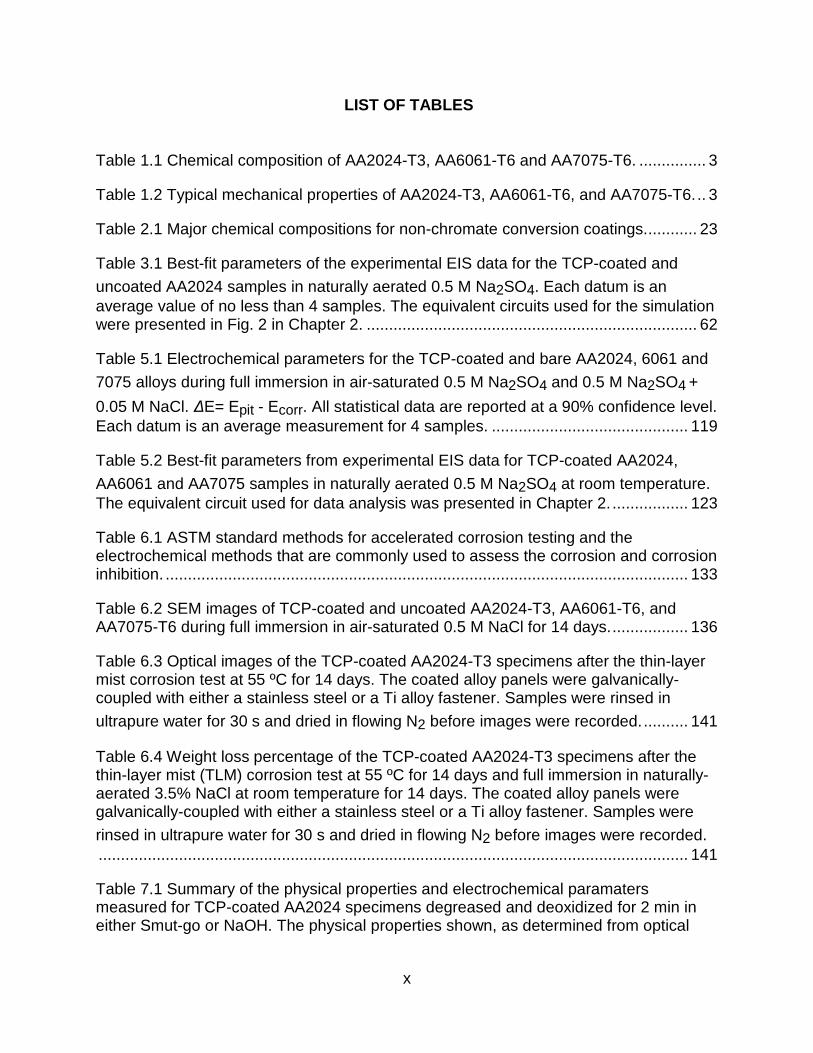
LIST OF TABLES
Table 1.1 Chemical composition of AA2024-T3, AA6061-T6 and AA7075-T6. ............... 3
Table 1.2 Typical mechanical properties of AA2024-T3, AA6061-T6, and AA7075-T6. .. 3
Table 2.1 Major chemical compositions for non-chromate conversion coatings. ........... 23
Table 3.1 Best-fit parameters of the experimental EIS data for the TCP-coated and
uncoated AA2024 samples in naturally aerated 0.5 M Na2SO4. Each datum is an average value of no less than 4 samples. The equivalent circuits used for the simulation were presented in Fig. 2 in Chapter 2. .......................................................................... 62
Table 5.1 Electrochemical parameters for the TCP-coated and bare AA2024, 6061 and
7075 alloys during full immersion in air-saturated 0.5 M Na2SO4 and 0.5 M Na2SO4 +
0.05 M NaCl. ∆E= Epit - Ecorr. All statistical data are reported at a 90% confidence level. Each datum is an average measurement for 4 samples. ............................................ 119
Table 5.2 Best-fit parameters from experimental EIS data for TCP-coated AA2024,
AA6061 and AA7075 samples in naturally aerated 0.5 M Na2SO4 at room temperature. The equivalent circuit used for data analysis was presented in Chapter 2. ................. 123
Table 6.1 ASTM standard methods for accelerated corrosion testing and the electrochemical methods that are commonly used to assess the corrosion and corrosion inhibition. ..................................................................................................................... 133
Table 6.2 SEM images of TCP-coated and uncoated AA2024-T3, AA6061-T6, and AA7075-T6 during full immersion in air-saturated 0.5 M NaCl for 14 days. ................. 136
Table 6.3 Optical images of the TCP-coated AA2024-T3 specimens after the thin-layer mist corrosion test at 55 ºC for 14 days. The coated alloy panels were galvanically-coupled with either a stainless steel or a Ti alloy fastener. Samples were rinsed in
ultrapure water for 30 s and dried in flowing N2 before images were recorded. .......... 141
Table 6.4 Weight loss percentage of the TCP-coated AA2024-T3 specimens after the thin-layer mist (TLM) corrosion test at 55 ºC for 14 days and full immersion in naturally-aerated 3.5% NaCl at room temperature for 14 days. The coated alloy panels were galvanically-coupled with either a stainless steel or a Ti alloy fastener. Samples were
rinsed in ultrapure water for 30 s and dried in flowing N2 before images were recorded. .................................................................................................................................... 141
Table 7.1 Summary of the physical properties and electrochemical paramaters measured for TCP-coated AA2024 specimens degreased and deoxidized for 2 min in either Smut-go or NaOH. The physical properties shown, as determined from optical

xi
profilometry, are the surface roughness (RMS), pit density, pit diameter and pit
depth.The electrochemical parameters shown are Ecorr, Epit, and Rp. ....................... 154
Table 7.2 Best-fit parameters, Cco, Rpo, Cdl, and Rp, for the EIS data obtained for TCP-coated AA2024 specimens formed after deoxidation for 2 min in either Smut-Go or NaOH. ......................................................................................................................... 158
Table 8.1 Best-fit parameters from experimental EIS results of the TCP-coated AA2024 after overnight curing at varied temperatures: room temperature (RT), 55, 100, and
150 °C. The measurements were conducted in naturall y aerated 0.5 M Na2SO4 at room temperature. ................................................................................................................ 170
Table 9.1 Ecorr, Rp, and defect parameter for 5200-, TCP- and NCP-coated AA2024. The electrochemical measurements were carried out in air-saturated electrolyte solutions. Data were also recorded for the uncoated alloys (immediately after
degreasing and deoxidation/desmutting) as control. The Rp values are calculated by
taking the inverse of the slope of the E vs. i curves at Ecorr (± 30 mV). Each datum is an average value of at least 3 samples. ........................................................................... 190
Table 9.2 Best-fit parameters for the experimental EIS data for the 5200-coated and
uncoated AA2024 samples in air-saturated 0.5 M Na2SO4. The equivalent circuits used for the simulation was presented in Chapter 2. ........................................................... 194
Table 9.3 Basic electrochemical parameters of the 5200-coated AA2024 panel, Ti-6Al-4V fastener, and the galvanic couples. The coupled samples were set up as shown in
Chapter 2. Measurements were carried out in air-saturated 0.5 M Na2SO4 + 0.1% NaCl and 3.5% NaCl, respectively. Each datum is an average value of at least 3 samples. 194
Table 10.1 Basic electrochemical parameters, Ecorr, Rp, and igal for the uncoated and TCP-coated AA2024 panels galvanically coupled with Ti-6Al-4V fasteners, and TCP-coated Al alloy panels coupled with SS A286 CRES fasteners. Measurements were
conducted in 0.5 M Na2SO4 + 0.1% NaCl that was purged with O2 for 30 min prior to the measurements....................................................................................................... 205
Table 10.2 Optical images of the TCP-coated AA2024 panels before and after the thin-layer mist exposure at 50 ºC and full immersion at room temperature in 3.5% NaCl for 14 days. The Al alloy panels were galvanically-coupled with SS A286 CRES and Ti-6Al-4V fasteners during the tests. ...................................................................................... 209
Table 10.3 Weigh loss data for galvanically-coupled TCP-coated AA2024 panels after full immersion at room temperature and exposure to a thin-layer mist (TLM) test at 40 ºC for 14 days. The solution used for both accelerated corrosion tests was naturally aerated 3.5% NaCl. The panels were galvanically coupled with SS A286 CRES and Ti-6Al-4V fasteners. ......................................................................................................... 210

xii
LIST OF FIGURES
Figure 1.1 Optical micrograph of the cross section of the pitting corrosion of AA2024. .. 5
Figure 1.2 Cross-sectional optical micrograph of an intergranular corrosion site on AA2024-T3. ..................................................................................................................... 6
Figure 1.3 Optical micrograph of the cross section of SCC. ............................................ 7
Figure 1.4 Schematic of a typical multi-coating system that is used to protect aluminum
alloys from corrosion. The chromate, CrO42-
, in the conversion coating enables the self-healing of this multi-coating system by transporting to the scratched area and forming a
passivating Cr(OH)3 layer. For interpretation of the references to color in this and all other figures, the reader is referred to the electronic version of this dissertation. ......... 11
Figure 2.1 Schematic of single-compartment glass cell with working, reference, and counter electrodes. ........................................................................................................ 28
Figure 2.2 The equivalent circuit model used to represent the TCP-coated alloy. ........ 30
Figure 2.3 Simulated EIS spectra of phase shift vs. log frequency generated using the equivalent circuit shown in Fig. 2.2B. The parameter values used in the simulation were:
Re=100 Ω, Qpo=1 × 10⁻⁶
sn/(Ω·cm
2), npo=0.85, Qdl=1 × 10
-6 s
n/(Ω·cm
2),and ndl=0.85.
Two values were varied: (A) Rpo from 1 × 10³ to 1 × 10
4 Ω and (B) Rp (or Rct) from 5 ×
105 to 5 × 10
6 Ω. ........................................................................................................... 31
Figure 2.4 A model cyclic potentiodynamic polarization curve for an aluminum alloy in a chloride-containing electrolyte. Several characteristic electrochemical parameters are
labeled: Ecorr is the corrosion potential measured at the open circuit condition; Epit is the pitting potential where the passivating oxide layer breaks down during the forward
scan and the current density increases sharply; irev is the anodic current density limit
where the scan is reversed in the active direction; Eptp is the pit transition potential at
the inflection point in the reversal scan; Erep is the repassivation potential which is defined as the value where the current density falls to zero during the reversal scan. .. 35
Figure 2.5 SEM image of the conically-shaped tungsten microelectrode etched in 1 M KOH. ............................................................................................................................. 37
Figure 2.6 Tungsten microelectrode potential stability when in contact with solutions of different pH: 1.56, 3.68, 5.04, 7.31 and 9.14. Measurements were made at room temperature (21-27 ºC). ................................................................................................. 38

xiii
Figure 2.7 The stabilized (<1 min) tungsten microelectrode potential as a function of the pH in the two different solution groups: 0.1 M phosphate buffers and model hexafluorozirconate baths. ............................................................................................ 40
Figure 2.8 Schematic of the apparatus used for the atmospheric corrosion testing in humidified air. ................................................................................................................ 41
Figure 2.9 Schematic of the “bird house” used for the moist SO2 atmospheric exposure tests. .............................................................................................................................. 42
Figure 2.10 Schematic of the thin layer mist (TLM) testing (A) during one test cycle and (B) between two test cycles. The container was well sealed during one cycle but opened for 15 min to replace the air inside. Several sprays were carried out between cycles to ensure the sample surface was dampened. .................................................................. 44
Figure 2.11 Schematic of the galvanic couples of the AA2024 panel and the fastener (A) during accelerated corrosion testing and (B) during the electrochemical measurement of the galvanic current. ...................................................................................................... 45
Figure 3.1 OCP-time profiles recorded during formation of the TCP coatings on AA2024 immediately after degreasing and deoxidizing. The profile of a high oxide AA2024 sample, immersed in boiled water for 1 min after deoxidizing, was also shown here as comparison. Coatings were formed at room temperature (21-27 ºC). ........................... 49
Figure 3.2 OCP-time profiles recorded during the formation of the TCP coating on AA2024. The two metal samples were boiled in water for 1 min to produce a hydroxide/oxyhydroxide layer. Two different strengths of the Alodine® 5900 solution were used: full strength (100%) and diluted (50%). Coatings were formed at room temperature (21-27 ºC). ................................................................................................ 50
Figure 3.3 A typical pH trace at the AA2024 surface (empty squares, right y axis) before, during and after formation of the T5900 conversion (TCP) coating. The OCP of the W/WO3 microelectrode and the AA2024 sample (solid circles and squares, respectively, left y axis) were also recorded. The formation of the coating occurred during the 18 to 28 min period, as indicated by the grey background. .................................................... 52
Figure 3.4 Ex situ tapping mode AFM images of uncoated and TCP-coated AA2024
specimens. Images (10 × 10 µm2) are presented in the height mode. .......................... 53
Figure 3.5 Scanning Auger electron spectroscopy depth profiling analysis of TCP-coated AA2024. Depth profiling levels are shown for several important elements including Al, Zr, O, Cr, Cu, K and F. Arrows in (A) identify traces for Zr and O. Arrow in (B) identifies the F signal. .............................................................................................. 55
Figure 3.6 XPS survey scan in the Cr 2p region for a TCP-coated AA2024 sample. .... 56

xiv
Figure 3.7 (A) SEM micrograph of aTCP-coated AA2024 specimen, and (B-E) EDAX line profiles for Cu, Cr, Zr, and O, respectively, across the coating as demarked by the line in (A). ...................................................................................................................... 58
Figure 3.8 Potentiodynamic polarization curves for TCP-coated and uncoated AA2024
samples. Measurements were conducted in naturally aerated 0.5 M Na2SO4. The scan rate was 2 mV/s. ........................................................................................................... 59
Figure 3.9 Corrosion potential (Ecorr) and polarization resistance (Rp) data for TCP-
coated and uncoated AA2024 specimens measured in naturally aerated 0.5 M Na2SO4.
Rp was determined by the inverse of the slope of E-i curves at Ecorr. Each datum is an average value of no less than 4 samples. The asterisks indicate statistically significant differences at the 95% confidence level. ....................................................................... 60
Figure 3.10 Bode plots for the TCP-coated AA2024 at Ecorr. Measurements were made
in air-saturated 0.5 M Na2SO4 + 0.01 M NaCl after the samples were aged in air
overnight at room temperature. All samples had a geometric area of 0.2 cm2 exposed to
the electrolyte solution during measurements. .............................................................. 61
Figure 3.11 Cathodic potentiodynamic sweeps for an (A) uncoated and (B) TCP-coated AA2024 rotating disk electrode at different rotation rates in naturally aerated 0.5 M
Na2SO4. Scan rate = 2 mV/sec. .................................................................................... 64
Figure 3.12 Plots of ilim for the oxygen reduction reaction as a function of w0.5 recorded
using uncoated AA2024, Cu and TCP-coated AA2024 rotating disk electrodesin
naturally aerated 0.5 M Na2SO4. The theoretical Levich plot for of the 4e- reduction of
oxygen is also shown for comparison. The variables in the theoretical curve were: n=4,
A=0.283 cm2, CO2=1×10
-4 M, DO2=1×10
-4 cm
2/s, and ν=0.01 cm
2/s.1 ........................ 64
Figure 3.13 Schematic of the biphasic chemical structure of the TCP coating on AA2024. The thickness values listed are those estimated from measurements made in vacuo, and are likely less the true thickness. ............................................................................ 66
Figure 3.14 Simulated Levich plots for TCP-coated AA2024 according to Eq. (3.2) with
the assumption that n=4, F=96500 As, Cbulk=1 × 10⁻⁴
M, v=0.01 cm2/s, Dsol=1 × 10
-5
cm2/s, δTCP =100 nm. DTCP was varied from 10
-5 to 10
-8 cm
2/s. .................................. 71
Figure 4.1 Raman spectra for reference chromium compounds: (a) 0.1M K2CrO4
solution, (b) 0.1M K2Cr2O7 solution, (c) Cr2O3 pasted with water, (d) Cr(OH)3 salt, (e) Cr(III)/Cr(VI) mixed oxide, (f) Al(III)/Cr(VI) mixed oxide at pH 4.2 and (g) at pH 7.8. The spectra were obtained using Chromex Raman 2000 using a 532 nm, 20 mW power

xv
laser. The integration time was 3-10 s. The 1048 cm-1
peak in (d) is attributed to NO3-
in Cr(NO3)3 that is used to prepare Cr(OH)3. ................................................................ 78
Figure 4.2 Raman band frequency of Cr(VI)-O bonds vs. pH for the mixed oxides of Al(III)/Cr(VI) and Cr(III)/Cr(VI). ...................................................................................... 79
Figure 4.3 Raman spectra for the TCP-coated samples aged (a) in air and (b) in vacuum at room temperature overnight. Spectra were acquired within the pitted areas. ...................................................................................................................................... 81
Figure 4.4 Raman spectra for the TCP-coated samples immersed in 0.5 M NaCl (a) with and (b) without oxygen for three days. Spectra were acquired on the terrace near the pits. ................................................................................................................................ 81
Figure 4.5 Raman spectra of the TCP-coated samples immersed in 0.5 M Na2SO4
added with H2O2 by (a) 1%, (b) 0.1% and (c) 0.011% (v/v). Spectra were recorded on the terrace near the pits. (d) A spectrum recorded on the terrace of a coated sample
immersed in 0.5 M non-H2O2 Na2SO4. ......................................................................... 83
Figure 4.6 (A) SEM micrograph of the surface of a TCP-coated AA2024 sample. Three regions are identified as (a) a large pit (~10 µm diam.), (b) relatively smooth terrace sites with no damage and (c) several elongated precipitates (~1 µm) distributed over the undamaged terrace sites. (B) Raman spectra for (a1) in a pit with a spectrum that is
featured with multiple peaks at 434, 552, 680 and 854 cm-1
, (a2) in a pit that exhibits
only one peak at 556 cm-1
, (b) on the terrace devoid of any pits, (c) on the elongated precipitates. The spectra for (d) a non-chrome 5200-coated sample and (e) a bare sample are also shown as control. ................................................................................ 86
Figure 4.7 Raman spectra for the TCP-coated AA2024 immersed in naturally aerated 0.5 M NaCl for 3 days. They were acquired (a) in a pit that contains a Cr-rich intermetallic particle, (b) in a pit devoid of Cu and (c) at a terrace site, and (d) on an elongated precipitate. Relevant reference spectra of (e) a Cr(III)/Cr(VI) mixed oxide and (f) a bare sample are shown as control. ........................................................................ 88
Figure 4.8 Plots of the intensity of the Cr(VI) peak as a function of immersion time in air-
saturated (a) 0.5 M Na2SO4, (b) 0.5 M NaCl and (c) daily-refreshed 0.5 M NaCl. Spectra were recorded on the terrace near the pits. The trend lines are drawn in solid. ...................................................................................................................................... 90
Figure 4.9 Profiles of pit density and band areas of Cr(VI)-O vs. immersion time on the TCP-coated AA2024 samples immersed in the air-saturated 0.5 M NaCl for 15 days. . 91
Figure 4.10 (A) Video micrograph of a scratched TCP-coated AA2024 sample after 1-
day immersion in 0.5 M NaCl + 0.01% (v/v) H2O2 solution. Afterwards, the scratched sample was rinsed in tap water for 10 s and dried in air at room temperature for 30 min

xvi
before spectra recording. (B) Raman spectrum of the scratched sample before immersion and spectra after immersion (a) on the coated area, (b) in or near the pitted area in the scratched area and (c) at the terrace site in the scratched area. ................. 93
Figure 4.11 Schematic illustration of the mechanism for the transient formation of Cr(VI) in the TCP coating during immersion in the air-saturated solution. ............................... 99
Figure 5.1 Ecorr vs. time profiles recorded during the formation of the TCP coating on AA6061 and AA7075 at room temperature (20-25 °C). F ull strength (100%) Alodine® 5900 RTU solution was used with the sample under full immersion. .......................... 103
Figure 5.2 Auger depth profiles for the TCP coatings on (A) AA6061 and (C) AA7075. The elemental profiles are enlarged in (B) AA6061 and (D) AA7075. Dashes lines are approximate boundaries between the hydrated zirconia overlayer and the interfacial layer at the alloy surface. ............................................................................................ 105
Figure 5.3 (A) An SEM image, (B) EDX spectrum at the Al matrix site, and (C) elemental line profiles across an Fe and Si-rich intermetallic particle in the TCP-coated AA6061. Profiles were recorded after overnight aging in air. White features in the image are elongated precipitates of the TCP coating. .................................................................. 107
Figure 5.4 (A) An SEM image, (B) EDX spectrum on the Al matrix site, and (C) elemental line profiles across two intermetallic sites in the TCP-coated AA7075. Profiles were recorded on a film after overnight aging in air. ................................................... 108
Figure 5.5 (A) Pit density vs. time profiles of the TCP-coated AA6061 and AA7075 recorded before and after the deoxidizing pretreatment step, and during full immersion
testing in naturally aerated 0.5 M Na2SO4 for 14 days at room temperature. The pit density of the coated AA2024 is also shown here for comparison. All data represent averages and standard errors for 3 samples of each alloy. (B) Backscattered SEM images of AA6061 and AA7075 samples before and after deoxidizing. Bright features indicate the higher-atomic-weight intermetallic particles relative to Al matrix; dark features indicate pits due to attack during deoxidizing (some are pointed by arrows). 109
Figure 5.6 Pit density vs. time profiles recorded during full immersion testing of TCP-coated AA2024, AA6061 and AA7075 in air-saturated 0.5 M NaCl for 14 days at room temperature. Data represent averages and standard errors for 3 samples of each alloy. .................................................................................................................................... 110
Figure 5.7 Raman spectra recorded at (a) an Fe-rich intermetallic site and (b) the terrace near but outside the pit on the TCP-coated AA6061, (c) a Cu-rich intermetallic site and (d) the terrace outside the pit on the coated AA7075, all after full immersion in naturally aerated 0.5 M NaCl for 15 days. Spectra for (e) the Cr(III)/Cr(VI) mixed oxide and (f) the Al(III)/Cr(VI) mixed oxide (pH 7.40) are also shown for comparison. ......... 111
Figure 5.8 Cr(VI) peak intensity vs. time for the three TCP-coated alloys that were immersed in the naturally aerated 0.5 M NaCl for about 30 days. Spectra were

xvii
recorded on the terrace near the pits. Data represent averages and standard deviations for 3 samples of each alloy. ......................................................................................... 112
Figure 5.9 Potentiodynamic scans for bare and TCP-coated AA6061 and AA7075 recorded in two different naturally aerated electrolyte solutions: (A) AA6061 and (B)
AA7075 in 0.5 M Na2SO4, and (C) AA6061 and (D) AA7075 in 0.5 M Na2SO4 + 0.05 M NaCl. Scan rate = 2 mV/s. ........................................................................................... 114
Figure 5.10 Corrosion potentials (Ecorr) for TCP-coated AA2024, AA6061 and AA7075
in naturally aerated (A) 0.5 M Na2SO4 and (B) 0.5 M Na2SO4 + 0.05 M NaCl. Ecorr values were also recorded for the bare alloys (degreased and deoxidized) as controls. Each datum is an average value of no less than 4 samples. The asterisks indicate statistically-significant differences at the 95% confidence level. .................................. 116
Figure 5.11 Polarization resistance (Rp) for TCP-coated AA2024, AA6061 and AA7075
in naturally aerated (A) 0.5 M Na2SO4 and (B) 0.5 M Na2SO4 + 0.05 M NaCl. Rp values were also recorded for the uncoated alloys (degreased and deoxidized) as controls. Each datum is an average value of no less than 4 samples. The asterisks indicate statistically- significant differences at the 95% confidence level. ................... 117
Figure 5.12 Bode plots for the TCP-coated alloys (AA2024, AA6061 and AA7075) at
Ecorr. Measurements were made in naturally aerated 0.5M Na2SO4 after the samples were aged in air overnight at room temperature. All samples had a geometric area of
0.2 cm2 exposed to the electrolyte solution during measurements. ............................ 122
Figure 5.13 Proposed mechanism for transient formation of Cr(VI) on the TCP-coated aluminum alloys during immersion in naturally aerated electrolyte solution. ............... 127
Figure 6.1 Polarization resistance data, Rp, for the TCP-coated AA2024, AA6061, and
AA7075 during full immersion in naturally aerated 0.5 M Na2SO4 for 14 days. .......... 135
Figure 6.2 Rp for TCP-coated AA2024, AA6061, and AA7075 at different time points during a 14-day atmospheric exposure test in humidified air (RH=100%) at (A) room temperature and (B) 55 ºC for 1, 7, and 14 days. ........................................................ 138
Figure 6.3 Optical images for the (A) TCP-coated and (D) uncoated AA2024-T3 after
exposure in moist SO2 atmosphere (RH=100%) at 40 ºC for 14 days. The alloy panels were galvanically coupled with Ti-6Al-4V fasteners. SEM images of the corroded areas (solid black circles) in (A) and (D) are shown in (B) and (E), respectively. Images of the dashed black circles in (B) and (E) are shown in (C) and (F) with a higher magnitude. .................................................................................................................................... 139

xviii
Figure 7.1 Proposed conversion coating structure on (A) an alloy pretreated to minimize surface roughening and pitting and (B) an alloy pretreated in a manner that increases surface roughening and pitting. ................................................................................... 145
Figure 7.2 Profilometry contour plots (left) of AA2024 specimens before and after deoxidation in Smut-Go for different times. SEM micrographs (right) of TCP-coated AA2024 specimens prepared by deoxidation for different times in Smut-Go. Red arrows indicate the pits and damage sites, whereas yellow ones indicate the visible intermetallics. .............................................................................................................. 147
Figure 7.3 Plots of the (A) surface roughness (RMS), (B) pit density, (C) pit depth and (D) equivalent pit diameter for AA2024 specimens treated in Smut-go for different times. Values for the alloy before deoxidation are also shown for comparison (◊). Data were
obtained from the analysis of profilometry contour plots. Only the pits of 7 µm2 or
greater in area and 0.5 µm or greater in depth were regarded as significant. (E) Plot of the TCP coating thickness, as determined from ellipsometry, on AA2024 specimens treated in Smut-go for different times. Each datum is an average value of 3 spots on each sample. Asterisk indicates significant difference from the values for the untreated controls (0-min treatment). .......................................................................................... 149
Figure 7.4 (A) Corrosion potential, Ecorr and (B) polarization resistance, Rp, for TCP-coated AA2024 specimens after deoxidation times of 0.5, 2, 6, and 12 min. All
measurements were made in naturally aerated 0.5 M Na2SO4 + 0.01 M NaCl. Each datum is an average of three replicates with the standard error revealed by the bars. 150
Figure 7.5 SEM micrographs of the uncoated AA2024 after (A) degreasing, (B) degreasing and deoxidizing for 2 min in 0.1 M NaOH and (C) degreasing and deoxidizing for 2 min in Smut-Go. The micrographs were taken with the samples tilted by 54º towards the secondary electron detector. These intermetallic compounds contain Al, Cu, Fe, and Mn according to EDAX analysis data that are not shown here. .......... 151
Figure 7.6 SEM micrograph and EDAX elemental line profiling data for the TCP-coated AA2024 formed after degreasing and a deoxidation time of 2 min in 0.1 M NaOH. .... 153
Figure 7.7 Representative electrochemical impedance spectra (EIS) for TCP-coated AA2024 specimens prepared using a 2-min deoxidation in either Smut-Go or NaOH at room temperature. Curves for the TCP-coated sample without deoxidation (-∆-) are also
shown for comparison. Measurements were conducted at Ecorr in naturally aerated 0.5
M Na2SO4 + 0.01 M NaCl. .......................................................................................... 158
Figure 7.8 Representative potentiodynamic polarization curves for TCP-coated AA2024 formed after deoxidizing (2 min) in Smut-Go (--) or NaOH (--). Curves for the TCP-coated substrates formed without any deoxidation step (-∆-) are shown for comparison.
Measurements were conducted in naturally aerated 0.5 M Na2SO4 + 0.01 M NaCl. Scan rate = 2 mV/s. ..................................................................................................... 160

xix
Figure 8.1 Weight loss of a TCP coating during thermogravimetric analysis under an N2 atmosphere. The sample was obtained by carefully scraping the coatings from three TCP-coated AA2024 specimen surfaces using a sharp blade. .................................. 167
Figure 8.2 (A) Polarization resistance, Rp, and (B) corrosion current density, icorr data for the TCP-coated () and uncoated () AA2024 after overnight curing in air at varied temperatures: room temperature (RT), 55, 100, and 150 °C. The measurements were
conducted in naturally aerated 0.5 M Na2SO4. Each datum is an average value of 3 samples. ...................................................................................................................... 168
Figure 8.3 Bode plots for the TCP-coated AA2024 at Ecorr after overnight curing at the various temperature: room temperature (RT, ), 55 (), 100 (), and 150 °C ( ). Three
measurements were made in naturally aerated 0.5M Na2SO4. .................................. 170
Figure 8.4 (A) Defect parameter, (B) coating thickness, and (C) contact angle of static water on the TCP-coated () and uncoated () AA2024 after overnight curing in air at various temperatures: room temperature (RT), 55 and 100 °C. Each datum is an average of 3 measurements. The open squares in (B) represent the thickness of Al-oxide layers. ................................................................................................................ 171
Figure 8.5 Effects of curing period on the physical and chemical properties of the TCP-coated AA2024 during curing in air at room temperature (RT): (A) thickness of TCP coatings for the coated samples () and that of Al oxide films for the uncoated samples (), and (B) contact angle of static water on the uncoated (), TCP-coated () and non-Cr TCP-coated () samples. Each datum is an average of 3 measurements. ........... 173
Figure 8.6 Effects of curing periods on the electrochemical properties of the TCP-coated
() AA2024 during curing in air at room temperature (RT): (A) Ecorr and (B) Rp. Data of the uncoated () is shown as control. Each datum is an avercure of 3 measurements. .................................................................................................................................... 174
Figure 9.1 Open circuit potential of the AA2024 sample (dark marks) and the interfacial pH (open marks) at the alloy surface recorded during formation of the 5200 coating (grey background). The pH traces with the white background reflect the value of the coating solution. The coating was formed by immersion at room temperature (21-27 ºC). .................................................................................................................................... 181
Figure 9.2 An (A) SEM image, (B) EDX spectrum at the Al terrace site (boxed area), and (C) elemental line profiles across two Cu-rich intermetallic compounds in the 5200-coated AA2024. Profiles were recorded after overnight aging in air. ........................... 182
Figure 9.3 An (A) SEM image and (B-F) elemental line profiles for Cu, Zr, O, Zn, and F across the Cu-rich intermetallic compounds in the NCP-coated AA2024. Profiles were recorded after overnight aging in air. ........................................................................... 184

xx
Figure 9.4 Auger depth profiles of several characteristic elements in the (A) 5200 and (B) NCP coatings on AA2024. Dashes lines are approximate boundaries between the coatings and Al matrix at the alloy surface. Data courtesy of Dr. Wayne Jennings from Case Western Reserve University (Swagelok Center for Surface Analysis of Materials). .................................................................................................................................... 185
Figure 9.5 TEM images of the cross section of the (A) 5200 and (B) NCP coatings at the Al terrace site, and (C) the 5200 coating at the Cu-rich intermetallic sites on AA2024. The Pt layer is to protect the coating from deformation during TEM specimen preparation using FIB milling. Data courtesy of Mr. Hendrik Colijn from The Ohio State University. ................................................................................................................... 186
Figure 9.6 Slow-scan potentiodynamic polarization curves recorded for 5200-coated
AA2024 in air-saturated 0.5 M Na2SO4. Data were also recorded for the uncoated (immediately after degreasing and deoxidation/desmutting) sample, a TCP-coated samples and an NCP-coated sample, for comparison. The scan rate was 2 mV/s. The
measurement of the NCP-coated sample was performed in 0.5 M Na2SO4 + 0.1% NaCl. .................................................................................................................................... 188
Figure 9.7 Bode plots of the 5200-coated and uncoated AA2024 in air-saturated 0.5 M
Na2SO4. ...................................................................................................................... 192
Figure 9.8 Optical images of the 5200-coated AA2024 galvanically coupled with Ti-6Al-4V fasteners (A) before any accelerated corrosion testing, and after 14-day (B) full
immersion in air-saturated 0.5 M Na2SO4 + 0.1% NaCl and (C) exposure in moist SO2 at 40 ºC. The image of (D) an uncoated AA2024 sample galvanically coupled with the Ti alloy fastener is also shown as control. ....................................................................... 196
Figure 10.1 Galvanic current density (igal) vs. time profiles for TCP-coated and uncoated AA2024-T3 panels when coupled with fasteners made of SS A286 CRESSS A286 CRES and Ti-6Al-4V. The current density was normalized to the geometric area of
the Al alloy panels. Measurements were conducted in naturally aerated 0.5 M Na2SO4
+ 0.1% NaCl after 30-min purging with O2. ................................................................. 203
Figure 10.2 (A) Cathodic and (B) anodic polarization curves for the isolated fasteners, theTCP-coated AA2024 panels, and the galvanically-coupled TCP-coated panels. Fasteners include SS A286 CRES and Ti-6Al-4V. The currents were normalized to the geometric area of the fasteners and Al alloy panels. Measurements were conducted in
0.5 M Na2SO4 + 0.1% NaCl after a 30-min purge with O2. The scan rate was 1 mV/s. .................................................................................................................................... 206
Figure 10.3 Polarization curves for galvanically-coupled TCP-coated AA2024 panels with Ti-6Al-4V fasteners before and after (A) full immersion in 3.5% NaCl at room
temperature and (B) exposure to moist SO2 at 40 ºC, both for 14 days. The

xxi
electrochemical measurements were conducted in naturally aerated 0.5 M Na2SO4 + 0.1% NaCl for the samples after full immersion testing while naturally aerated 0.5 M
Na2SO4 was used for the samples after the moist SO2 test. The scan rate was 1 mV/s. .................................................................................................................................... 211
Figure 10.4 (A) Cathodic and (B) anodic polarization curves for the isolated fasteners and TCP-coated AA2024 panels, and the galvanic couples. Fasteners include SS A286 CRES and Ti-6Al-4V. The currents were normalized to the geometric area of the
fasteners and Al alloy panels. Measurements were conducted in 0.5 M Na2SO4 + 0.1%
NaCl that was purged with O2 for 30 min before measurements. The scan rate was 1 mV/s. ........................................................................................................................... 212

1
CHAPTER 1. INTRODUCTION AND BACKGROUND
1.1 Aluminum Alloys
The aerospace industry used materials with high strength and low weight.
Aluminum is one of these materials facing these challenges. Alloying of aluminum with
other metallic (e.g., Cu, Fe, Mn, etc.) or semi-metallic (e.g., Si) elements strengthens
the alloys’ mechanical properties. The high strength aluminum alloys are used in a large
number of aerospace applications, ranging from simple components through to primary
load bearing structures. Among these alloys, 2024-T3, 6061-T6, and 7075-T6 are the
three heat-treated types that are sometimes referred to as the group of “aerospace
alloys”.
1.1.1 Designation system, chemical compositions, an d mechanical properties
The three heat-treated aluminum alloys, AA2024-T3, AA6061-T6, and AA7075-
T6, belong to the wrought alloy family that are designated by the 4 digits and thermal
treatment T followed with a digit.1-2
The first digit indicates the principal alloy elements.
The second single digit, if different from 0, indicates a modification of the specific alloy.
The third and fourth digits are arbitrary numbers given to identify a specific alloy in the
series. The aluminum alloys are strengthened by the thermal treatment T. This process
consists of three steps: (i) heat treating, (ii) rapidly quenching to a lower temperature,
and (iii) aging.1, 3
During the heattreatment, the aluminum is heated to a temperature
that is high enough toliquify the metal and allow the introduction of the alloying elements.
After holding at the heat treating temperature for a period of time, solute atoms diffuse
into the solvent matrix. The alloy is then quenched to a lower temperature (e.g., room

2
temperature) to keep the alloying elements trapped in solution. During aging, the
alloying elements trapped in solution precipitate to form a uniform distribution of very
fine particles. The natural aging indicates a hardening process for a few days at room
temperature, while the artificial aging is by heating the alloys to an intermediate
temperature. If it is cold worked during heat treatment, it is designated as the T3
condition (solution heat treated, cold worked, and then naturally aged), If it is aged by
reheating to an intermediate temperature, it is designated as T6 (solution heat treated
and artificially aged). As an example of the aforementioned designations, the
designation 2024-T3 would indicate that alloy 24 (which defines the specific chemistry)
belongs to the original 2xxx series of wrought alloys and is strengthened by solution
heating, cold working, and then naturally aging. On reheating to an intermediate
temperature, the host metal rejects the alloying element in the form of an extremely fine
precipitate only several angstroms in diameter. The fine precipitate creates matrix
strains in the lattice that act as barriers to the motion of dislocations and provide
resistance to slip, thereby increasing the strength and hardness.4
The elemental compositions of AA2024-T3, AA6061-T6 and AA7075-T6 are
presented in Table 1.1.5 The composition in weight percent is provided by the
Aluminum Association.
The typical mechanical properties of these three alloys are shown in Table 1.2.1,
6 These values can differ depending on the alloy size and method of manufacture. The
data are intended for comparing alloys and tempers.

3
Table 1.1 Chemical composition of AA2024-T3, AA6061-T6 and AA7075-T6.
wt.% Cu Fe Mg Mn Si Zn Ti Cr Al
2024-T3 3.8-4.9 0.5 1.2-1.8 0.3-0.9 0.5 0.25 0.15 0.1 Bal.
6061-T6 0.15-0.4 0.7 0.8-1.2 0.15 0.4-0.8 0.25 0.15 0.04-0.35 Bal.
7075-T6 1.2-2 0.5 2.1-2.9 0.3 0.4 5.1-6.1 0.2 0.18-0.28 Bal.
Table 1.2 Typical mechanical properties of AA2024-T3, AA6061-T6, and AA7075-T6.
Tensile strength (MPa)
Yield strength (MPa)
Elongation at break (%)
a
2024-T3 483 345 18
6061-T6 310 276 12
7075-T6 572 503 11 a 1.6mm thickness
1.1.2 Applications
AA2024-T3 is a high strength, high performance alloy that is often used for
aerospace applications. It has excellent strength over a wide range of temperatures.
However, AA2024-T3 is considered non-weldable by arc welding because of its
susceptibility to hot cracking and stress corrosion cracking. Therefore, it can be welded
only through friction welding.6-7
AA6061-T6 is found widely throughout the welding fabrication industry, is used
predominantly in the form of extrusions, and is incorporated in many structural

4
components. This alloy is naturally solidification crack sensitive, and for this reason, it
should be arc welded with adequate amounts of filler material (4xxx and 5xxx filler
materials) during the process.7-8
AA7075-T6 is one of the highest strength aluminum alloys. It is often used in
high performance applications, such as aircraft, aerospace, and competitive sporting
equipment. Like AA2024-T3, AA7075-T3 is considered an unsuitable candidate for arc
welding but can be welded by the friction stir welding (FSW) joining technique.6-8
1.2 Corrosion and Corrosion Protection for Aluminum Alloys
1.2.1 Corrosion types
The improved strength of the aluminum alloys leads to compromised elastic
strain, electrical and thermal conductivity because of crystalline defects.1, 4
Fatigue
sensitivity is increased through deformation and propagation of crystal defects that
create crack failure. Metal homogeneity is reduced, which increases the quantity of
interstitial defects and permeability to atoms or small molecules. Moreover, contact of
the aluminum with dissimilar metals or with other alloying elements causes galvanic
coupling that leads to electrochemical corrosion. Corrosion can be categorized
according to four types:1, 4, 6
Pitting corrosion is normally encountered with all aluminum alloys because of the
galvanic coupling between the more noble intermetallic metals and the aluminum.9-10
It
initiates locally at second-phase particles as shown in Figure 1.1. For example, the Al

5
phase acts as an anode when in contact with a Cu-rich inclusion that serves as the
cathode. Al is oxidized to Al3+
that is dissolved in the electrolyte solution, while Cu-rich
inclusions are the sites for the reduction of dissolved O2. Pitting can be accelerated by
presence of chloride ions, which causesevere pitting at potentials above the pitting
potential Epit.10
A guide for examination and evaluation of pitting corrosion can be seen
in ASTM G46.11
Figure 1.1 Optical micrograph of the cross section of the pitting corrosion of AA2024.
Intergranular corrosion (IGC) occurs mostly at the grain boundaries.4, 9
It usually
occurs randomly over the entire surface due to the compositional differences between
precipitates on the boundaries, the solute depleted grain margins, and the higher solute
grain interiors shown in Figure 1.2.12
IGC usually reaches a self-limiting depth due to
limiting transport of O2 down the narrow corroded path. When the self-limited depth is
reached, IGC spreads laterally. However, if IGC results in splitting or exfoliation, the
corrosion will not be self-limiting. Therefore, IGC has a more damaging contribution to
corrosion fatigue than pitting corrosion. IGC and its occurrence on aluminum alloys can
be assessed according to ASTM G110.13
AA2024

6
Figure 1.2 Cross-sectional optical micrograph of an intergranular corrosion site on AA2024-T3.
Exfoliation corrosion occurs in aluminum alloys that have a highly directional
grain structure.4, 9
The corrosion is initiated by the lateral intergranular corrosion and
occurs on subsurface grain boundaries parallel to the metal surface. The entrapped
corrosion products produce internal stresses that tend to lift off the overlying metal. The
spalling off of the metal creates fresh metal surfaces for continued corrosion. In other
words, the exfoliation corrosion does not become self limiting. The method for visual
assessment of the exfoliation corrosion on aluminum alloys can be found in ASTM
G34.14
Stress corrosion cracking (SCC) in aluminum alloys occurs mostly at
intergranular boundaries.1, 4, 9
Cross sections of SCC frequently are evidenced by
branched cracks as shown in Figure 1.3. It requires the interaction of a metallurgically
susceptible material, a corrosive environment, and sustained tensile stress. There is
generally a threshold stress above which SCC is initiated. This threshold stress is
dependent on the environment, the test specimen and part configuration, and the
method of loading (e.g., bending, extension, and constant loading, etc.). The initiation
period increases as the applied stress is decreased and can be varied from a few hours

7
to many years. Once SCC begins, the crack grows linearly at a constant rate
independent of the applied stress. This cracking continues until either unstable crack
growth occurs leading to rapid failure, or the applied stress falls below the threshold
required for crack propagation. The standard test method for SCC is seen in ASTM
G47.15
Figure 1.3 Optical micrograph of the cross section of SCC.
1.2.2 Corrosion protection methods
Several methods have been used to protect aluminum alloys from corrosion. The
essential idea is to passivate the alloy surface through isolating the metallic surface
from contact with the environment (moisture, salts, acids, oxygen, etc.).16
Corrosion inhibitors. A corrosion inhibitor is a chemical substance which, when
added in small concentrations to an environment, minimizes or prevents corrosion.17
Corrosion inhibitors are used to protect metals from corrosion, including temporary
protection during storage or transport as well as localized protection. An efective

8
inhibitor is compatible with the environment, is economical for application, and produces
the desired effect when present at low concentrations.
Inhibitor selection is based on the metal and the environment. Inhibitors can be
classified into environmental conditioners and interface inhibitors. The environmental
conditioners remove the corrosive species in the medium and decrease corrosivity of
the medium by scavenging the aggressive substances. For example, in near neutral
and alkaline solutions, hydrazine can be used to decrease the oxygen content that
leads to a reduction in the oxygen reduction reaction, as shown in the following
equation:18
−++
+↔−+ 24NO4H022H)2NH22(NH25O (1.1)
Interface inhibitors control corrosion by forming a film at the metal/environment
interface. They can be classified into cathodic, anodic and mixed inhibitors, depending
on whether they inhibit the anodic, cathodic, or both electrochemical reactions. Anodic
inhibitors are usually used in near-neutral solutions where sparingly soluble corrosion
products, such as oxides, hydroxides, or salts, are formed. They passivate the alloy
surface and inhibit the anodic metal dissolution reaction. Cathodic inhibitors, such as
phosphates, silicates, and borates, form protective films that decrease the cathodic
reactions rate by blocking the oxygen chemisorption and or limiting the diffusion of
oxygen to the metal surface in near-neutral and alkaline solutions. The mixed inhibitors
are most organic compounds that adsorb on the metal surface physically or chemically,
or form a polymeric film.

9
Coatings. The application of coatings to metal is the oldest means of corrosion
control.15
It was assumed that protection with paint films was based simply on isolation
of the metal from the corrosive environment, specifically water and oxygen.19-20
However, in the late 1940s several other anticorrosive pigments were introduced and
these advances led to a more organized understanding of corrosion control by
coatings.21-22
Corrosion control by coatings can be subclassified into three techniques:
(i). The barrier coating protects the metal substrate by acting as an ionic filter. It
ensures that the paint film has a high electrical resistance to mitigate current transfer
between anodic and cathodic sites.19-20, 23
In addition, the barrier can also inhibit the
oxygen transport to the metal, thus reducing the rate and impede the cathodic
reaction.24-25
Whether protecting by an ionic filter or oxygen deprivation, the
fundamental requirements of a barrier system are that the coating should be
impermeable to ionic moieties and to oxygen, and should maintain adhesion with the
metal under wet service conditions.15
Impermeability to ionic solutions and oxygen is
thought to be rate determining for corrosion beneath barrier films, while permeability of
the film to water is generally thought to have greater direct consequence on de-
adhesion, leading subsequently to corrosion.26-27
(ii). The sacrificial coating protects a metal substrate by preventing current
discharge from the metal to the environment.28
This cathodic protection effect is
accomplished by applying a film pigmented with a more anodic metal (usually zinc, for
10
protecting aluminum and its alloys).29-30
Loadings of the anodic zinc dust pigment must
be high enough to ensure a continuous current flow through the film itself and across
the interface (i.e., between anodic film and cathodic metal substrate).18, 30
All discharge
occurs to the zinc pigment, and as long as the conductivity of these sacrificial pigments
is sufficient to just sustain current flow from the coating to the environment, the
substrate metal remains protected.
(iii). Inhibitory primers control corrosion by modifying the interfacial (primer/metal)
environment so that passivation (or inhibition) of the metal substrate may be achieved
and maintained.31
In this case, the primer’s formulation promotes moisture permeation
of the coating, such that soluble inhibiting pigments in the coating film can be
transported to the metal where they react to form passive (or inhibitory) films. This
requires (i) a relatively high volume concentration of a soluble pigment and sufficient
water absorption into the film, and (ii) an ionic impermeability with that have favorable
passivator (pigments) / depassivator (O2, ions) ratios. This design ensures release of
soluble inhibitive ions by the pigment that are then carried to the metal surface beneath
the primer where passive films may be established, but little permeability of the
depassivating ions (chloride, sulfates, etc.) into the film from the environment.
In the aerospace industry, one of the most effective strategies for corrosion
protection is through the application of multi-coating system.16
Topcoats are usually
applied over primers and render additional service, that is, either enhanced
impermeability to moisture, oxygen, and ionic species or improved weathering
resistance.

11
Figure 1.4 Schematic of a typical multi-coating system that is used to protect aluminum
alloys from corrosion. The chromate, CrO42-
, in the conversion coating enables the self-healing of this multi-coating system by transporting to the scratched area and forming a
passivating Cr(OH)3 layer. For interpretation of the references to color in this and all other figures, the reader is referred to the electronic version of this dissertation.
However, inhibitory primers and topcoats neither adhere well to nor protect the
underlying aluminum because of the native oxide layer that is a polar and weakly binds
with polymer primers.1, 32
Therefore, “conversion coatings” are applied to properly
condition the metal for interaction with the primers and topcoats, as shown in Figure 1.4.
Such coatings provide corrosion inhibition and promotes adhesion of the primer.31
Conversion coatings commonly used with aluminum alloys include phosphate-, cobalt-,
titanium-, zirconium-, manganate-, silicate-, chromate-, and other rare earth-based
systems. They all produce a coating that provides not only a defensive layer against
corrosion but also promotes adhesion that is required for a stable performance of the
organic primers and the topcoats. In addition, scratching may occur on the aircraft
during service. For the multi-coating system containing a conversion coating that can
self-heal, as shown in Fig.1.4, the mobile ions (e.g., CrO42-, VO4
3-)
34, 54-57 are
12
transported to the scratched area and get reduced to form a insoluble oxide layer (e.g.,
Cr(OH)3, V2O3). This passivates the corroding surface.
1.3 Chromate Conversion Coatings
The most widely used conversion coating in the aerospace industry is the
chromate conversion coating (CCC) under the trade names Alodine® from Henkel 33
or
Iridite® from MacDermid 34
. It provides stable and consistent corrosion protection on
aluminum alloys for as long as 1,400 h during neutral salt spray testing according to
ASTM B117.35-36
The formation, structure, and corrosion protective properties were
thoroughly studied from late 1990s to early 2000s by an interdisciplinary research team
lead by Dr. Gerald Frankel at The Ohio State University.37-43
Formation of CCC
involves several sequential steps: (i) etching of the native aluminum oxide film layer by
fluoride to activate the metal surface, (ii) reduction of Cr(VI) in the coating bath to Cr(III)
accelerated by a Fe(CN)6-4
/-3
mediator and (iii) polymerization of Cr(III)-O-Cr(VI) mixed
oxide and adsorption of chromate onto the backbone.36
The resulting CCC is a
Cr(VI)/Cr(III) mixed oxide with a 3:1 Cr(III):Cr(VI) molar ratio. The coating is generally
0.1 to 1 µm thick depending on the coating time. CCC provides active, self-healing
corrosion protection to aluminum alloys by inhibiting transport of dissolved O2 and ions
from the environment through the coating, blocking cathodic intermetallic sites for O2
chemisorption and anodic Al sites where corrosion initiates and chloride adsorb, and
reducing the tunneling rate of electrons through the coating film. Furthermore, the
13
outstanding corrosion protection provided by CCC is also attributed to its “self healing”
capability that was studied by Frankel et al using an artificial scratch cell.44
In this
mechanism, the mobile chromate stored in the coating leaches into the solution,
migrates to nearby uncoated, defective areas, adsorbs at the actively corroding sites
where it gets reduced to form an insoluble layer of passivating Cr(III) hydroxide. CCC
meets military specification, MIL-DTL-5541F.36
It is an approved material to produce
Class 1A coating, which indicates maximum corrosion protection whether painted or
unpainted. CCC also improves adhesion of paint finish systems on aluminum and its
alloys.35
However, hexavalent chromium is carcinogenic to humans and represents key
environmental pollutant.45-47
It causes lung cancer by chronic inhalation, exacerbate
dermatitis by contact with chromate-dyed textiles or chromate-tanned leather shoes,
and irritation or even ulcers in the stomach and intestines through ingestion. Hexavalent
chromium is transported into cells via the sulfate transport mechanisms due to the
similarity of chromate and sulfate in terms of their structure and charge.46
Inside cells,
Cr(VI) is reduced to Cr(V) by vitamin C and other reducing agents. The damage is
caused by hydroxyl radicals generated during reoxidation of the pentavalent chromium
by hydrogen peroxide in cells.

14
1.4 Non-Chromate Conversion Coatings
Due to the toxic and carcinogenic nature of hexavalent chromium, an
increasingly stringent legislation regarding their use and waste disposal has been
established. The Occupational Safety and Health Administration (OSHA) published its
final standard for Cr(VI) compounds in 2006, regulating a permissive exposure limit
(PEL) of 5 µg/m3 for airborne exposure.
48 The National Institute for Occupational Safety
and Health (NIOSH) proposed a recommended exposure limit (REL) of 0.2 µg/m3 for
airborne exposure.49
Therefore, great efforts have been focused on development of
alternative pretreatment conversion coatings that contain no hexavalent chromium but
exhibit equally good corrosion protection of aluminum alloys and primer/paint adhesion
as CCCs.
To this end, in the mid 1990’s, Sanchem Inc. designed the permanganate- and
silicate-based conversion coatings for an aluminum alloy (AA1100). In the late 1990’s,
Henkel Corp. developed a cobalt conversion coating that provided good primer/paint
adhesion and electrical contact resistance, but failed salt spray corrosion tests. Since
early 2000’s, Dr. O’Keefe and his research group from University of Missouri at Rolla
have been working on development of a cerium conversion coating (CeCC) of which the
electrodeposited version has promised good corrosion protection on multiple aluminum
alloys and paint adhesion.50-54
The coating forms a Ce(III)/Ce(VI) mixed oxide and its
thickness is in the range of several hundreds of nanometers depending on the
preparation process (e.g., degreasing temperature). Salt spray tests showed that CeCC
provided some good corrosion protection to aluminum alloys. However, it is crucial to
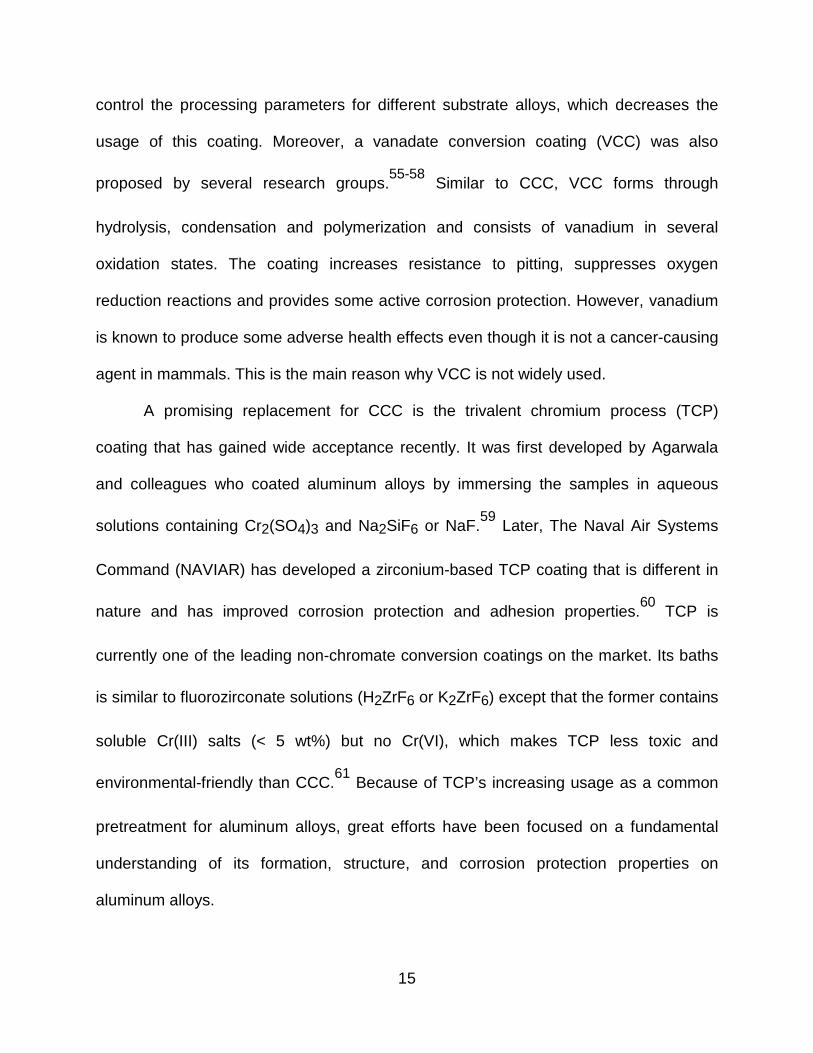
15
control the processing parameters for different substrate alloys, which decreases the
usage of this coating. Moreover, a vanadate conversion coating (VCC) was also
proposed by several research groups.55-58
Similar to CCC, VCC forms through
hydrolysis, condensation and polymerization and consists of vanadium in several
oxidation states. The coating increases resistance to pitting, suppresses oxygen
reduction reactions and provides some active corrosion protection. However, vanadium
is known to produce some adverse health effects even though it is not a cancer-causing
agent in mammals. This is the main reason why VCC is not widely used.
A promising replacement for CCC is the trivalent chromium process (TCP)
coating that has gained wide acceptance recently. It was first developed by Agarwala
and colleagues who coated aluminum alloys by immersing the samples in aqueous
solutions containing Cr2(SO4)3 and Na2SiF6 or NaF.59
Later, The Naval Air Systems
Command (NAVIAR) has developed a zirconium-based TCP coating that is different in
nature and has improved corrosion protection and adhesion properties.60
TCP is
currently one of the leading non-chromate conversion coatings on the market. Its baths
is similar to fluorozirconate solutions (H2ZrF6 or K2ZrF6) except that the former contains
soluble Cr(III) salts (< 5 wt%) but no Cr(VI), which makes TCP less toxic and
environmental-friendly than CCC.61
Because of TCP’s increasing usage as a common
pretreatment for aluminum alloys, great efforts have been focused on a fundamental
understanding of its formation, structure, and corrosion protection properties on
aluminum alloys.

16
Several other fluorozirconate coatings have also been developed and are sold
commercially. For example, there is a Zr/Ti-based coating that consists of
fluorozirconate and fluorotitanate in the coating bath . Henkel developed it in early
1980s and is known by Alodine® 5200 62
or 5700 63
. Alodine® 5700 is a ready-to-use
or diluted version of 5200 (concentrated). The coatings can be applied by immersion,
spray, and wipe, etc. Previous studies have shown that Alodine® 5200-coated AA2024
suffered corrosion within 48 h during a neutral salt fog test (ASTM B 117).64
However,
it is interesting to note that the 5200 coating provides respectable performance in
corrosion resistance and adhesion when bonded with other chromate-free primers (e.g.,
Mil-PRF-85582 N, Mil-PRF-53030, etc).65
This is attributed to its excellent adhesion
properties. Some AA2024 panels coated with 5200 and primers (i.e., Mil-PR-53030)
and topcoats (i.e., Mil-C-53039) even exceeded performance of CCCs in terms of
corrosion resistance. However, little is known about its chemical structure and if there is
any corrosion protection provided by only the 5200 coating.
Another member in the fluorozirconate coating family is the Zr/Zn-based
conversion coating. Studies have shown that Zn2+
is an effective soluble inhibitor at
acidic and neutral pH.66
Therefore NAVAIR paired the inhibitor Zn2+
with the
fluorozirconate barrier coating by adding zinc sulfate to the fluorozirconate coating bath.
It is currently under development in NAVAIR. Therefore, characterization of its structure,
stability, and corrosion protective property is needed for a fundamental understanding of
the Zr/Zn-based conversion coating.

17
1.5 Metal Surface Pretreatment
Prior to application of various types of conversion coatings on aluminum alloys, it
is essential to clean the metal surface by removing contaminants, and to expose bare
metal by deoxidizing the native oxide films. Thorough studies have shown that these
surface pretreatments are critical for the corrosion protection performance of conversion
coatings.
1.5.1 Cleaning/degreasing
Oils and contaminants come from the fabrication lubricants. They can prevent the
assembly and adhesion of a uniform conversion coating on the metal surface. A non-
uniform coating may lead to localized areas of high cathodic or anodic activity, both of
which enhance corrosion. Therefore, aluminum alloys are always cleaned/degreased
before coating.67
Cleaner/degreasers are classified as alkaline, neutral, and acidic, and
are selected for use based on the alloy composition, the presence of a passating oxide
layer or smut, and the presence of other complex contaminants.
1.5.2 Etching
Many of the oils and lubricants can be removed by a cleaning/degreasing step.
An alkaline solution treatment can be used to remove the remaining grease
contamination with possible etching of the alloy surface that is dependent on the
alkalinity of the solution and the immersion time.67
The alkaline etchants tend to
remove the more active aluminum but leave the behind the more noble metals, such as
copper. Enhanced surface copper concentrations may lead to greater corrosion
sensitivity for aluminum. Therefore, selectively reducing copper content is usually a goal
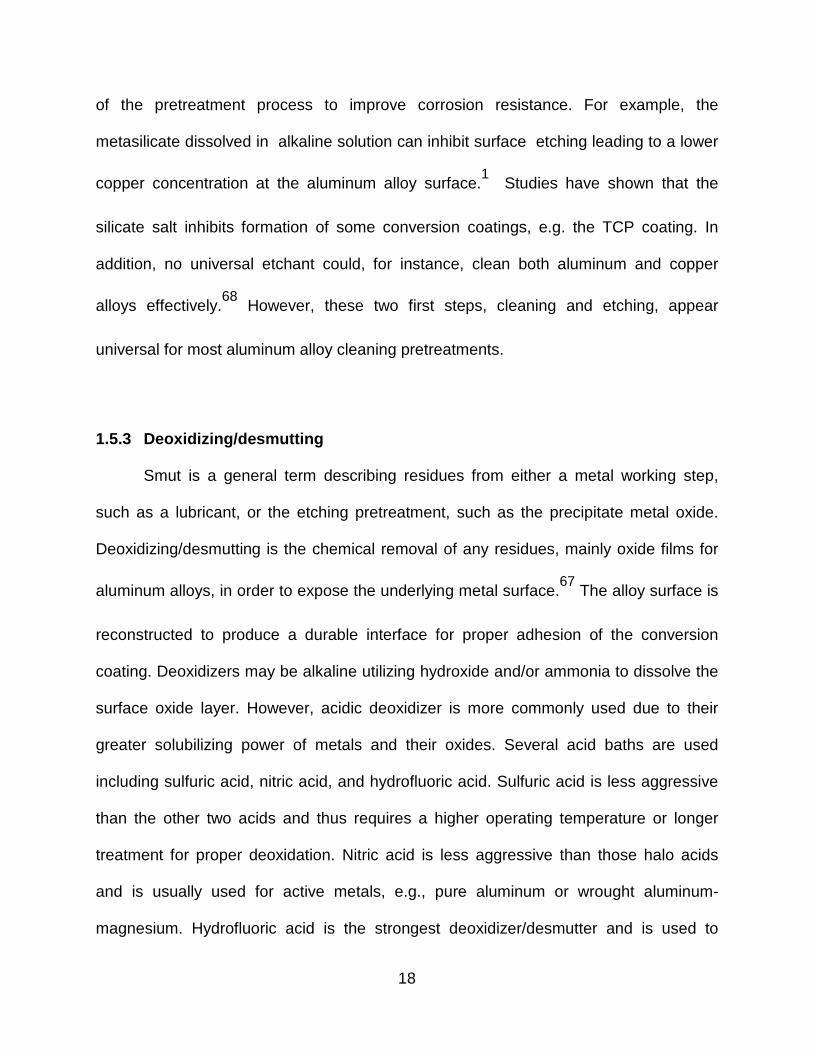
18
of the pretreatment process to improve corrosion resistance. For example, the
metasilicate dissolved in alkaline solution can inhibit surface etching leading to a lower
copper concentration at the aluminum alloy surface.1 Studies have shown that the
silicate salt inhibits formation of some conversion coatings, e.g. the TCP coating. In
addition, no universal etchant could, for instance, clean both aluminum and copper
alloys effectively.68
However, these two first steps, cleaning and etching, appear
universal for most aluminum alloy cleaning pretreatments.
1.5.3 Deoxidizing/desmutting
Smut is a general term describing residues from either a metal working step,
such as a lubricant, or the etching pretreatment, such as the precipitate metal oxide.
Deoxidizing/desmutting is the chemical removal of any residues, mainly oxide films for
aluminum alloys, in order to expose the underlying metal surface.67
The alloy surface is
reconstructed to produce a durable interface for proper adhesion of the conversion
coating. Deoxidizers may be alkaline utilizing hydroxide and/or ammonia to dissolve the
surface oxide layer. However, acidic deoxidizer is more commonly used due to their
greater solubilizing power of metals and their oxides. Several acid baths are used
including sulfuric acid, nitric acid, and hydrofluoric acid. Sulfuric acid is less aggressive
than the other two acids and thus requires a higher operating temperature or longer
treatment for proper deoxidation. Nitric acid is less aggressive than those halo acids
and is usually used for active metals, e.g., pure aluminum or wrought aluminum-
magnesium. Hydrofluoric acid is the strongest deoxidizer/desmutter and is used to

19
dissolve the metasilicate deposits formed during alkaline etching.1 These baths can
also be used as mixtures, in which the concentration of the halogen determines the
surface reactivity and the deoxidizing rate. Excessive deoxidizing can cause pitting
corrosion that is an undesired result. Additives are added to inhibit the dissolution
process preventing excessive deoxidation. Mixtures of deoxidizers with these additives
help to regulate their aggressiveness. For example, the zincate solution is usually
added to the deoxidizer and retards excess surface dissolution or corrosion.
1.6 Research Objective and Aims
The overall goal of this research was to develop a fundamental understanding of
the mechanisms by which the trivalent chromium process (TCP) conversion coatings
form and protect various aluminum alloys (2024-T3, 6061-T6, and 7075-T6) from
corrosion. The TCP coating was a Henkel product named Alodine® T5900. Specifically,
we investigated the coating structure and chemical composition, the role of the
substrate surface structure and chemistry on the coating structure, and the degree of
corrosion inhibition (mechanism and kinetics) provided by the coating during different
accelerated degradation tests. This Zr/Cr(III)-based TCP coating was also compared
with other commercial non-chromated conversion coatings, e.g., the Ti/Zr-based
Alodine® 5200, the Zn/Zr-based non-chromate pretreatment (NCP) coating. The
importance of the work is that it provides scientists and engineers with information about
the conditions under which the TCP coating studied in this research provides corrosion
protection as well as information about the corrosion inhibition mechanism and kinetics.
This scientific insight will be useful for development of improved corrosion mitigation

20
strategies. A number of important issues related to these non-chromate conversion
coatings were researched:
Aim 1: To investigate the formation mechanism, chemical composition and structure of
the several non-chromated conversion coatings on aluminum alloys. A home-made
tungsten microelectrode was used to record the pH increase in the interfacial region
during coating formation. Scanning electron microscopy (SEM), energy-dispersive x-ray
spectroscopy (EDAX) and several other analytical techniques were used to investigate
the physical and chemical structure of the coating.
Aim 2: To assess the native corrosion inhibition provided by these conversion coatings
on three different aluminum alloys (2024-T3, 6061-T6, and 7075-T6) and to investigate
the mechanisms by which the coatings inhibit the corrosion. Various electrochemical
methods were used to assess the corrosion inhibition including the corrosion potential
(Ecorr), polarization resistance (Rp), Tafel slopes, corrosion current (icorr) and pitting
potential (Epit) in different electrolyte solutions. The coating structure was characterized
by SEM/EDAX, scanning auger electron spectroscopy and Raman spectroscopy..
Aim 3: To determine if any transient formation of Cr(VI) species occurs in trivalent
chromium process (TCP) coatings and, if so, by what mechanism does this occur.
Raman spectroscopy was used to probe the coatings before and after different
environmental corrosion tests for the Cr(III)-O vibration mode near 540 cm-1
and the
Cr(VI)-O mode near 865 cm-1
.

21
Aim 4: To assess the chemical stability of the conversion coatings and the corrosion
inhibition they provide (mechanisms and kinetics) during different accelerated corrosion
tests. Coated specimens were exposed to fully immersed in high concentration salt
solutions, to humidified SO2 atmosphere, and athin layer mist of concentrated salt
solutions at elevated temperature.
Aim 5: To understand how substrate surface pretreatment and post treatment of the
coated specimens affects the corrosion inhibition provided by the conversion coating.
This work included investigating the effects of the deoxidation/desmutting chemistry
and treatment time, and post-formation heat treatment and aging on the conversion
coating structure and performance.
Aim 6: To investigate the conversion inhibition provided by the coatings alloy
specimens galvanically-coupled with a metal fastener (Ti-6Al-4V or stainless steel
CRES A296) during the different accelerated corrosion tests. Various electrochemical
methods were used to determine parameters such as Ecorr, Rp, Tafel slopes, icorr, and
Rpit in different electrolyte solutions. The coating structure was characterized by
SEM/EDAX, scanning auger electron spectroscopy and Raman spectroscopy. Optical
microscopy was used to determine the extent of corrosion (pitting and surface damage).
Gravimmetric analysis was performed to quantify the mass loss.

22
CHAPTER 2. EXPERIMENTAL SECTION
2.1 Reagents
All chemicals used were analytical grade quality or better. Sodium sulfate
(Na2SO4), sodium chloride (NaCl) and hydrogen peroxide (H2O2) were purchased from
CCI Chemical (Vernon, CA); potassium chromate (K2CrO4) was purchased from JT
Baker Reagent (Center Valley, PA); potassium dichromate (K2Cr2O7), chromium oxide
(Cr2O3), aluminum nitrate (Al(NO3)3) and chromium nitrate (Cr(NO3)3) were purchased
from Sigma-Aldrich (St. Louis, MO); and sodium hydroxide (NaOH) was purchased from
Spectrum Chemical (New Brunswick, NJ). The Turco® 6849 and Turco® Liquid Smut-
Go NC solutions were provided by Henkel Corp. (Madison Heights, MI). Both were
diluted with ultrapure water to 20% (v/v) before use. The Cr(III)/Zr (TCP) bath, Alodine®
5900 RTU obtained from Henkel Corp. was used as received.61
The Ti/Zr-based
coating solution was Alodine® 5200 from Henkel Corp. and was used after diluted by 20%
v/v.62
The Zn/Zr-based coating (NCP) was applied by NAVAIR and the Si/Zr coating
(Boegel)69
was obtained from Boeing. Table 2.1 lists the primary chemical composition
of each coating solution. All solutions were prepared using ultrapure water (Barnstead)
with a resistivity of ~17 MΩ·cm.

23
Table 2.1 Major chemical compositions for non-chromate conversion coatings.
Coating solutions Product Name Compositions Descrip tion
Cr(III)/Zr (TCP) Henkel Alodine® T 5900
K2ZrF6, Cr2(SO4)3,
H2SO4, HBF4 Ready to use (RTU)
Ti/Zr Henkel Alodine® 5200 K2ZrF6, H2TiF6 Diluted by 20% v/v
Zn/Zr NAVIAR NCP K2ZrF6, ZnSO4 Coated by NAVAIR
Si/Zr Boegel - Coated by Boeing
2.2 Preparation of TCP-coated aluminum alloys
The metal samples were obtained as a 2 mm-thick sheets. They were cut into 1 cm2
squares and polished to smooth and clean surface. Mechanical grinding by hand was
performed wet on 1500 grit alumina paper initially. Samples were then polished to a
mirror-like finish on separate felt pads using alumina grit (0.3 µm diam.) slurried with
ultrapure water. Each polishing step lasted for 10 min and was followed by a 10-min
ultrasonic cleaning in ultrapure water. The polished samples were then degreased in 20%
(v/v) Turco® 6849 at 55 °C for 10 min, followed by rinsing with tap water for 2 min. The
degreased samples were then deoxidized in 20% (v/v) Turco® Liquid Smut-Go NC for 2
min at room temperature (21-27 °C). This was follow ed by rinsing with tap water for
another 2 min. Finally, the cleaned and deoxidized samples were immersed in full
strength Alodine® T 5900 RTU for 10 min at room temperature. The TCP-coated
samples were then rinsed with tap water for 2 min and air dried at room temperature
overnight in a covered dish.70
For the 5200 coating, deoxidized samples were

24
immersed in Alodine® 5200 (20% v/v) for 2 min and then rinsed in ultrapure water for 30
s.71
This was followed by curing overnight at room temperature in a covered petri dish.
2.3 Physical and Chemical Characterization
2.3.1 Raman Spectroscopy
A Chromex Raman 2000 spectrograph (Bruker) equipped with a Nd:YAG laser
(500 mW) was used to record the transiently formed Cr(VI)-O species in the trivalent
chromium process (TCP) coating. This was accomplished by monitoring the Cr(III)-O
vibrational mode near 540 cm-1
and the Cr(VI)-O mode near 860 cm-1
. The laser
source with an output at 532 nm along with a 1200 line/mm grating were used to obtain
all spectra. The spectrograph also consisted of a charge-coupled device (CCD) detector
cooled to -38 °C. In addition to a holographic band rejection filter, a notch filter was
positioned at the entrance slit of the spectrograph for improved source light rejection. An
Olympus 40×/0.80 W objective lens provided a laser spot size of 3-5 µm with a laser
power of 17 mW at the sample (~80 kW/cm2). The Logitech QuickCam was used for
recording images of the sample surface. Wavenumber calibration was accomplished
using a naphthalene solid standard.
2.3.2 X-ray Photoelectron Spectroscopy
X-ray photoelectron spectra (XPS) were recorded using a Perkin-Elmer PHI 5400
ESCA system with a magnesium Kα X-ray source (1254 eV). A take-off angle of 45º
was used for all measurements at a base pressure less than 5 ×10⁻⁹
Torr. The

25
spectrometer was calibrated using the C1s line of graphite at 284.6 eV. The XPS can be
used to quantify Cr(III) and Cr(VI) species. However, it should be noted that the Cr(VI)
deeper in the coating than the escape depth of 2-10 nm would not be detected.
2.3.3 Auger Depth Profiling
The scanning auger electron measurements were made at the Swagelok Center
for Surface Analysis of Materials (Case Western Reserve University) using a Perkin-
Elmer PHI-680 scanning Auger microprobe. Inert gas sputtering (PHE-06-350) was
used to remove surface contaminants and coating materials from a small area for depth
profiling. The ion gun was operated with argon gas at ca. 1keV.
2.3.4 Scanning Electron Microscopy / Energy-Dispers ive X-ray Spectroscopy
Scanning electron micrographs (SEM) were obtained using a field-emission
scanning electron microscope (JSM-7500F, JEOL, Ltd., Tokyo, Japan). Energy
dispersive X-ray spectroscopy (EDS) was used for the elemental line-scan analysis.
Data were analyzed using INCA software.
2.3.5 Transmission Electron Microscopy
An FEI Nova Dual Beam SEM/FIB instrument was used to prepare cross-
sectional samples from coated specimens. FIB milling was conducted with a 30 keV Ga
ion beam and a 5 keV electron beam. A layer of Pt with a thickness of ~1.5 µm was
sputter deposited on the area of interest to protect the coating from milling. Electron
transparent foils with dimensions of 15 µm × 5 µm were produced by FIB and finally
thinned to a thickness of ~100 nm. The extraction of foils was performed using a
micromanipulator with a Pyrex needle (~1 µm in diameter) under an optical microscope.

26
Then the thin foils were placed on a 200-mesh Ni grid with a carbon support film for
TEM examination.
An FEI Tecnai F20 microscope was used to characterize the cross-sectional foils
at high magnification. EDX line profiles were acquired at 200 kV. FEI/Emispec TIA
software was used to analyze the data.
2.3.6 Atomic Force Microscopy
Atomic force microscopy (AFM) was performed in air using a Nano Scope IIIa
scanning probe microscope (Veeco Instruments Inc., CA). In the contact mode,
pyramidal-shaped Si3N4 tips, mounted on gold cantilevers (100 µm legs, 0.38 N/m
spring constant), were used for obtaining the topographical images. In the tapping mode,
RTESP tips (125 µm leg, 40 N/m spring constant, 300 kHz resonant frequency, 8 nm tip
radius) were used.
2.3.7 Spectroscopic ellipsometry
The thicknesses of coatings and the Al oxide layer were determined using ex situ
ellipsometry.72-73
The ellipsometer measured a change in the light polarization as the
probing beam reflects or transmits at the sample surface in terms of a phase difference
∆ and an amplitude ratio Ψ. The data were then fit to a model to calculate the optical
properties and thickness of the thin-film coatings. Our ellipsometric data were acquired
on a VASE (J.A. Woollam Co., NE) instrument from 300 to 2500 nm. The experimental
data were fit to the Cauchy’s equation shown below:72-74

27
4λ
C2λ
BAn ++= (2.1)
where n is the refractive index, λ is wavelength of incident light, and A, B, and C are the
Cauchy fit parameters.
2.3.8 Contact angle measurement
The wettability of the coated alloy surface was assessed by measuring the static
contact angle of ultrapure water on the specimen.75
One droplet (ca. 0.05 mL) of
ultrapure water was dropped on the alloy surface and its contact angle was measured
using a video system (FTÅ200, First Ten Angstroms, Inc., VA).
2.4 Electrochemical Characterization
All electrochemical measurements were conducted in a single-compartment
glass cell using a CH Instruments potentiostat (Model CHI 650A, Austin, TX) shown in
Figure 2.1. The coated sample was mounted at the bottom of the cell with an o-ring
defining the exposed geometric area (0.2 cm2). The counter electrode was a Pt wire
sealed in glass that was placed in a separate glass tube with an attached porous glass
frit. The reference was an Ag/AgCl electrode (4 M KCl, E0
= 0.197 V vs. NHE) that was
housed in a Luggin capillary with a cracked glass tip. All measurements were made in
air-saturated Na2SO4 or NaCl electrolyte solutions at room temperature (21-27 ºC).
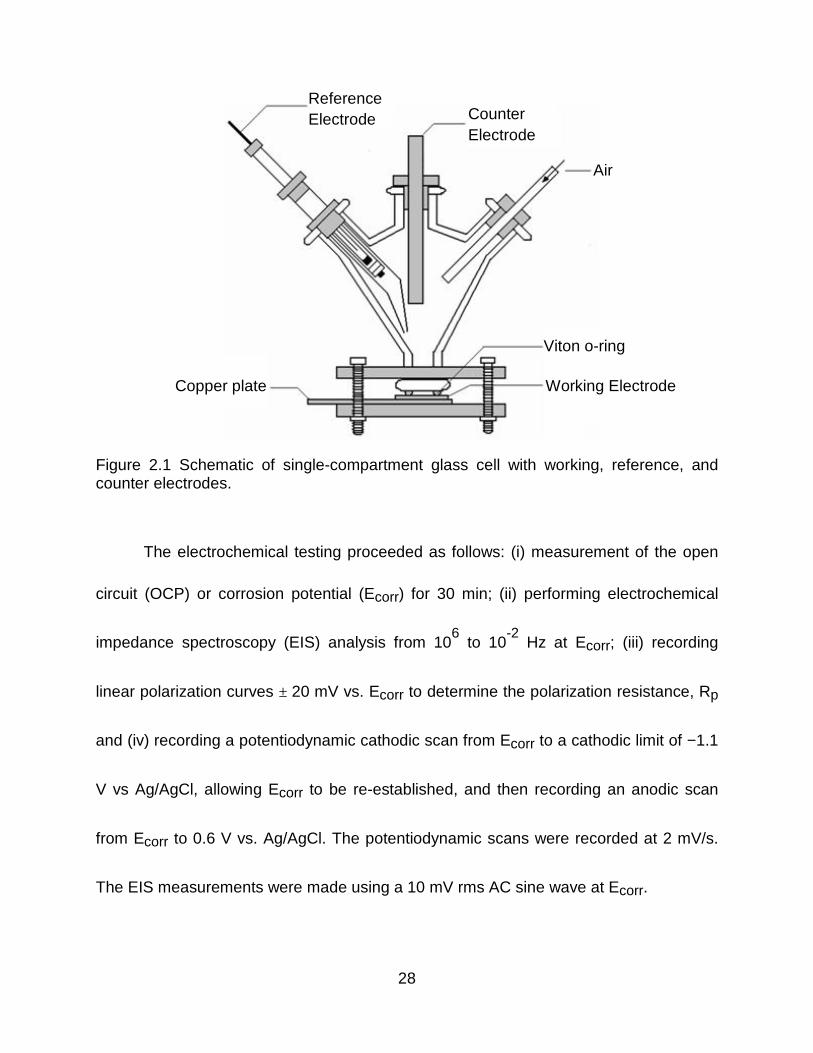
28
Figure 2.1 Schematic of single-compartment glass cell with working, reference, and counter electrodes.
The electrochemical testing proceeded as follows: (i) measurement of the open
circuit (OCP) or corrosion potential (Ecorr) for 30 min; (ii) performing electrochemical
impedance spectroscopy (EIS) analysis from 106 to 10
-2 Hz at Ecorr; (iii) recording
linear polarization curves ± 20 mV vs. Ecorr to determine the polarization resistance, Rp
and (iv) recording a potentiodynamic cathodic scan from Ecorr to a cathodic limit of −1.1
V vs Ag/AgCl, allowing Ecorr to be re-established, and then recording an anodic scan
from Ecorr to 0.6 V vs. Ag/AgCl. The potentiodynamic scans were recorded at 2 mV/s.
The EIS measurements were made using a 10 mV rms AC sine wave at Ecorr.
Viton o-ring
Working Electrode Copper plate
Air
Reference Electrode Counter
Electrode

29
Figure 2.2 shows the equivalent circuits and models used to evaluate and
interpret the impedance data.76
We modeled the uncoated alloy surface using the
circuit in Fig. 2.2A, while the TCP coating acts as a thin-film barrier layer that contains
some pores or hydrated channels through which the electrolyte solution can penetrate
and reach a small portion of the metal surface as shown in Fig. 2.2B. In these
equivalent circuits, Rel is the resistance of the bulk electrolyte, Rpo and Rp (also called
Rct) represent the resistance of the electrolyte in the pores and the polarization
resistance of the metal to corrosion, respectively. CPEco is a constant phase element
that represents the potential-dependent coating capacitance, and CPEdl represents the
potential-dependent electrolyte-metal interfacial capacitance in the coating defects and
pores. The CPE components are expressed by mathematical parameters, Q and n, that
are used to calculate the effective coating capacitance by Cpo=Q1/n
R1/n-1
.76-77
For
statistical analysis, all measurements on a sample type were replicated at least 3 times.
Figure 2.3 shows the simulated phase shift vs. log frequency plots generated
using the equivalent circuit shown in Fig. 2.2B. Most of the parameters were held
constant in the simulations (Re, Qpo, npo, Qdl, and ndl) except for two : Rpo and Rp. As
seen, the phase angle of the higher-frequency peak increases with increasing Rpo. This
indicates that the higher-frequency time constant is associated with the hydrated
channels and defects of the coating. Similarly, the lower-frequency peak becomes wider
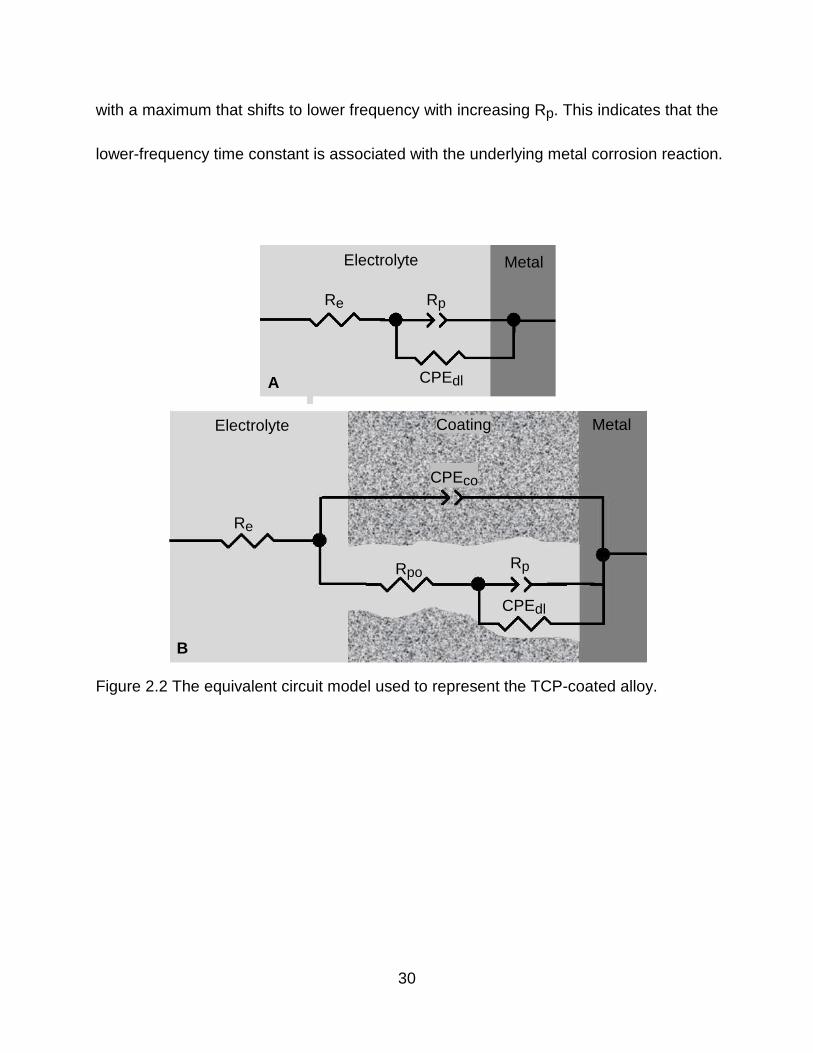
30
with a maximum that shifts to lower frequency with increasing Rp. This indicates that the
lower-frequency time constant is associated with the underlying metal corrosion reaction.
Figure 2.2 The equivalent circuit model used to represent the TCP-coated alloy.
Rp Rpo
CPEdl
CPEco
Re
Metal Electrolyte Coating
Re
CPEdl
Rp
Metal Electrolyte
A
B
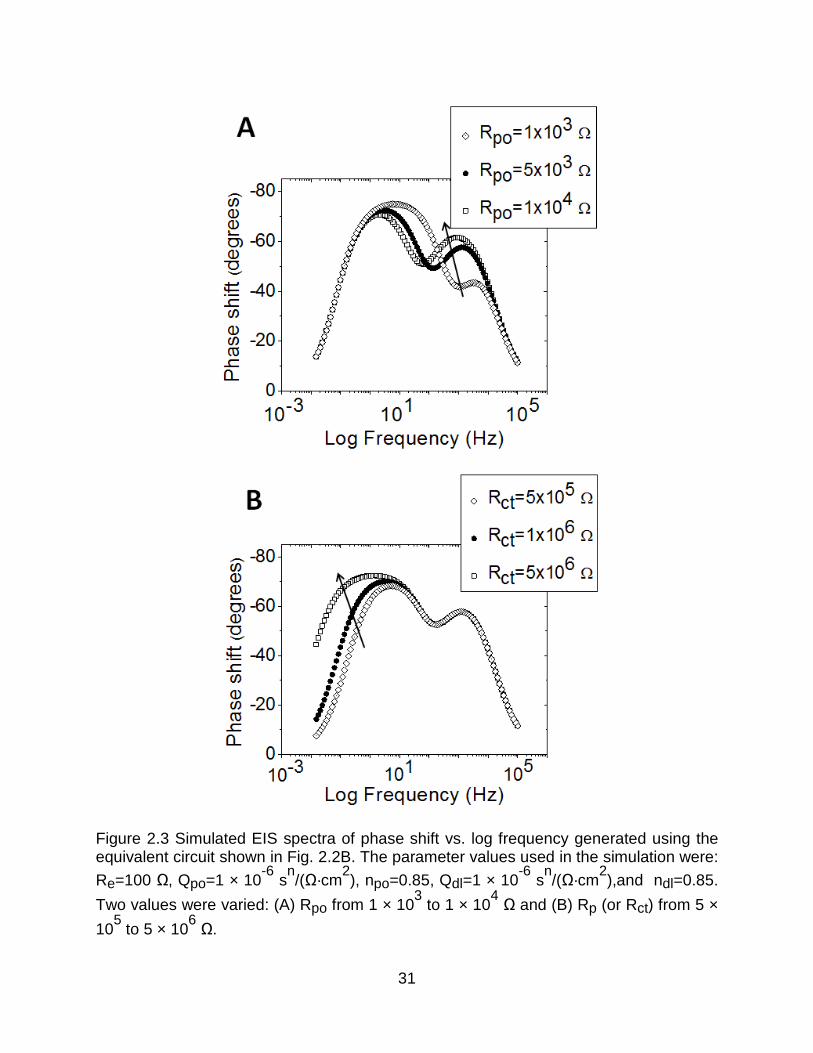
31
Figure 2.3 Simulated EIS spectra of phase shift vs. log frequency generated using the equivalent circuit shown in Fig. 2.2B. The parameter values used in the simulation were:
Re=100 Ω, Qpo=1 × 10⁻⁶
sn/(Ω·cm
2), npo=0.85, Qdl=1 × 10
-6 s
n/(Ω·cm
2),and ndl=0.85.
Two values were varied: (A) Rpo from 1 × 10³ to 1 × 10
4 Ω and (B) Rp (or Rct) from 5 ×
105 to 5 × 10
6 Ω.

32
The polarization resistance (Rp) at Ecorr was determined by linear polarization
curves according to the following equation:
0∆Ep
∆i∆E
R→
= (2.2)
where ∆E is the variation about ±20 mV around Ecorr and ∆i is the resulting current. Rp
values determined by linear polarization curves were comparable to values determined
from the low frequency EIS data.
The corrosion current density (icorr) is a measurement of the corrosion rate at
Ecorr based on the assumption of steady corrosion. It can be used to calculate an
apparent uniform corrosion rate (e.g., weight loss per year) by Faraday’s Law:
corrinFρ
M=rate Corrosion (2.3)
where M is the molecular weight of the corroding metal (MAl=27.0 g/mol), n is the
number of electron in the corrosion reaction (nAl=3), F is the Faraday constant
(F=96500 C/mol), and ρ is the density of the metal (ρAl=2.70 g/cm3)l. The corrosion
current density (icorr) at Ecorr was determined by Tafel analysis of the potentiodynamic
curve data.78
For large cathodic overpotentials (Eappl - Ecorr), the Butler-Volmer
equation can be simplified to the following,

33
ccorr b
ηlogilogi += (2.4)
where η = Eappl-Ecorr is cathodic overpotential, and bc is the cathodic Tafel slope. icorr
was also be calculated using the Rp data according to the following equation (Stearn-
Geary equation):
)pR
(cbab
cbab.corri
13032
+= (2.5)
where ba is the anodic Tafel slope.
The TCP coating is an electrical insulator and is electrochemically inert at low
anodic overpotentials. These property allow one to estimate the apparent coating
porosity, which we refer to as a defect parameter, from dc polarization data using the
following equation:79
abcorr∆E
10TCPp,Rbarep,R
P
−
×=
(2.5)
where Rp,bare and Rp,TCP is the polarization resistance of bare and TCP-coated alloys,
respectively; ∆Ecorr is the difference of Ecorr for the bare and TCP-coated alloys.; ba is
the anodic Tafel slope for the bare alloy. This method of calculating an apparent
porosity parameter has been used by several research groups for plasma vapor

34
deposited (PVD) ceramic coatings on steels.79-80
We applied this parameter to the
conversion-coated samples.
Potentiodynamic polarization curves were the primary tool used to determine the
electrochemical parameters that reflect the corrosion status of the specimens. Figure
2.4 shows a model cyclic potentiodynamic polarization curve foran aluminum alloy in a
chloride electrolyte solution. Ecorr is the equilibrium potential of the specimen with no
net current flowing.The forward potentiodynamic scan starts at Ecorr with the applied
potential being changed in the positive direction (noble direction) at a slow scan rate
until the current density reaches a pre-selected limit irev. During this positive scan, the
critical pitting potential is reached, Epit, where the passivating oxide film breaks down
and pitting commences.81-82
At Epit, the current density shows a sharp increase above
the background passive current density. The irev is linearly related to the charge passed
during pit growth and therefore can be used as one method to assess the extent of
pitting severity on the forward scan.83
Once the current density reaches irev, the scan is
reversed in the negative or active direction. The alloy undergoes severe pitting until the
pit transition potential, Eptp, is reached, shown as the inflection point in the reversal
scan. Eptp is usually indicative of the first stages of pit repassivation.83
The total charge
passed from Epit to Eptp is a direct measure of the extent of pitting during the entire
cyclic potentiodynamic scan.84-86
The surface fully repassivates as the scan reaches

35
the repassivation potential, Erep, which can also be considered as the potential above
which pits can grow. Erep is defined as the potential at which the current density
intercepts with the cathodic scan in this study. More positive Epit values reflect greater
inhibition to pitting corrosion. Erep values that are more negative of Ecorr means that the
alloy is susceptible to pitting corrosion. Erep values more positive than Ecorr means that
under open circuit conditions, the alloy is stable against pitting corrosion.
Figure 2.4 A model cyclic potentiodynamic polarization curve for an aluminum alloy in a chloride-containing electrolyte. Several characteristic electrochemical parameters are
labeled: Ecorr is the corrosion potential measured at the open circuit condition; Epit is the pitting potential where the passivating oxide layer breaks down during the forward
scan and the current density increases sharply; irev is the anodic current density limit
where the scan is reversed in the active direction; Eptp is the pit transition potential at
the inflection point in the reversal scan; Erep is the repassivation potential which is defined as the value where the current density falls to zero during the reversal scan.

36
2.5 In situ pH Measurement
A method of locally measuring the interfacial pH change during formation of the
non-chromate conversion coatings (i.e., TCP and Zr/Ti-based coatings) involves the use
of a tungsten microelectrode positioned near the alloy surface.87
The potential of a
tungsten electrode is pH sensitive (Nernstian, ~ -60 mV/pH) due to the natural
formation of a surface oxide layer.87-89
2.5.1 Tungsten Microelectrode Preparation
The tungsten wire (0.01’’ diameter, FHC Inc., Bowdoin, ME) was cut into 2-cm
lengths. Electrical connection was made by attaching a longer Cu wire to one end of the
tungsten wire with conductive silver epoxy and super glue. The two wires were then
insulated with polypropylene from a heated pipette tip, leaving about 0.5-cm of the
tungsten wire exposed.90
The exposed tungsten was then electrochemically etched in 1
M KOH by applying a 12 V AC relative to a carbon counter electrode. This processed
formed a conically-shaped tip. The voltage was applied using a variable autotransformer
(Staco Energy Products, Dayton, OH). The wire was etched until visible gas evolution
ceased (ca. 30 s). The sharpened microelectrodes were then ultrasonically cleaned in
ultrapure water for 10 min while suspended vertically to avoid tip damage. The resulting
microelectrode was conically shaped with a tip about 30 µm in diameter and the cylinder
about 80 µm wide. The exposed cone length was about 500 µm. A scanning electron
micrograph of a typical microelectrode is shown in Figure 2.5.

37
Figure 2.5 SEM image of the conically-shaped tungsten microelectrode etched in 1 M KOH.
2.5.2 OCP traces of the tungsten microelectrode in buffer solutions
The open circuit potential (OCP) of W/WO3 can be used to measure the local
solution pH.87
Figure 2.6 shows the tungsten microelectrode potential as a function of
time during full immersion in solutions of variable pH. The mock coating solutions were
prepared by dissolving 1 g potassium hexafluorozirconate (K2ZrF6), 0.28 g chromium
nitrate (Cr(NO3)3) in 50 mL ultrapure water, and using 0.1 M H2SO4 and 0.1 M NaOH to
adjust the solution pH. The solution pH was verified using a conventional glass pH
electrode (FB-5, Fisher Scientific Inc.). These solutions were designed to mimic the
chemical composition of the 5900 and 5200 baths. After each measurement, the
microelectrode was rinsed in ultrapure water. As can be seen in Fig. 2.6, the
microelectrode potential quickly stabilized at each pH. The short response time is
noteworthy and is important for measuring the transient pH change that occurs during
the conversion coating formation (see below).
100 µm
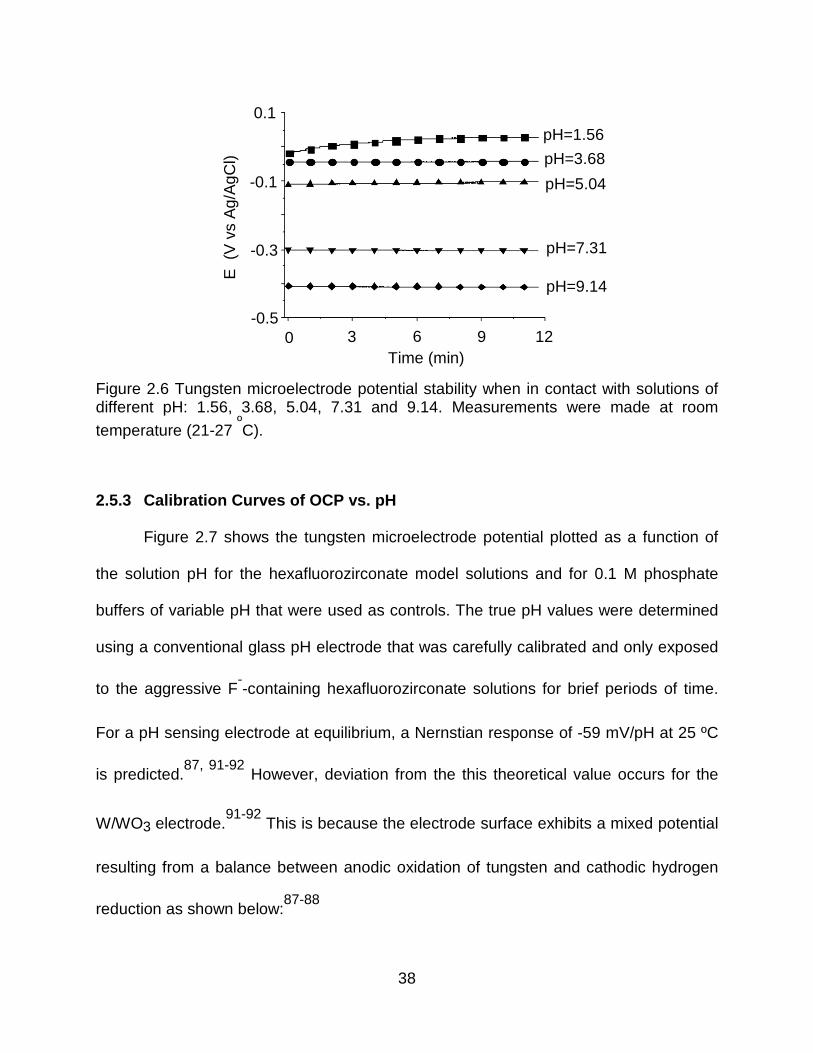
38
Figure 2.6 Tungsten microelectrode potential stability when in contact with solutions of different pH: 1.56, 3.68, 5.04, 7.31 and 9.14. Measurements were made at room
temperature (21-27 ºC).
2.5.3 Calibration Curves of OCP vs. pH
Figure 2.7 shows the tungsten microelectrode potential plotted as a function of
the solution pH for the hexafluorozirconate model solutions and for 0.1 M phosphate
buffers of variable pH that were used as controls. The true pH values were determined
using a conventional glass pH electrode that was carefully calibrated and only exposed
to the aggressive F--containing hexafluorozirconate solutions for brief periods of time.
For a pH sensing electrode at equilibrium, a Nernstian response of -59 mV/pH at 25 ºC
is predicted.87, 91-92
However, deviation from the this theoretical value occurs for the
W/WO3 electrode.91-92
This is because the electrode surface exhibits a mixed potential
resulting from a balance between anodic oxidation of tungsten and cathodic hydrogen
reduction as shown below:87-88
Time (min)
E (
V v
s A
g/A
gCl)
0.1
-0.1
-0.3
-0.5 0 3 6 9 12
pH=9.14
pH=7.31
pH=5.04
pH=3.68
pH=1.56

39
-32 6e 6H (s) WO O3H W ++→+
+ (2.5)
2 - 2H 2e H →+
+ (2.6)
Our measurements revealed a near-Nernstian response for the tungsten
electrode in phosphate buffer solutions with a slope of -64 mV/pH. Phosphate buffers
have been widely used in pH-relevant studies as the phosphate anion does not strongly
interact the tungsten surface within the measurement periods.93-94
A near-Nernstian
electrode response was also observed in the hexafluorozirconate solutions with a slope
of -63 mV/pH. In other words, the aggressive chemicals (e.g., hexafluorozirconate,
Cr(III) salts) in the model coating solutions do not appear to interact strongly with the
tungsten surface to alter the pH response. Two additional tungsten microelectrodes
were also tested (data not shown here). For all three microelectrodes, identical pH-
potential responses were found at 61.8 ± 0.6. These results reveal that the potential of
the tungsten microelectrode is affected primarily by the H+ activity, and not by the other
chemical constituents in the 5900 or 5200 baths. The curves in Fig. 2.7 allow us to
calculate the interfacial pH near the aluminum alloy surface during the formation of the
conversion coating.

40
Figure 2.7 The stabilized (<1 min) tungsten microelectrode potential as a function of the pH in the two different solution groups: 0.1 M phosphate buffers and model hexafluorozirconate baths.
2.6 Accelerated corrosion (degradation) tests
2.6.1 Full immersion test
One accelerated corrosion test was a full immersion one. Specimens were fully
immersed in 10 mL naturally aerated electrolyte solutions (e.g., Na2SO4, NaCl) in glass
vials (20 mL) continuously for 1, 7 and 14 days at room temperature.95
Each vial
contains one sample. The glass vials were sealed during the test with replacement of
the air in the container every 24 h. The replenishment was achieved by simply opening
the lid and exposing the solution to the open air for 30 min. At the end of the test period,
the specimens were removed from the glass vials and then rinsed with flowing ultrapure
water before examinations.
0.2
pH 10 8 6 4 2 0
0
-0.2 E
(V
vs
Ag/
AgC
l)
-0.4
Phosphate buffer, experimental Phosphate buffer, linear-fit, y=0.18-0.06x Model buffer, experimental Model buffer, linear-fit, y=0.22-0.06x
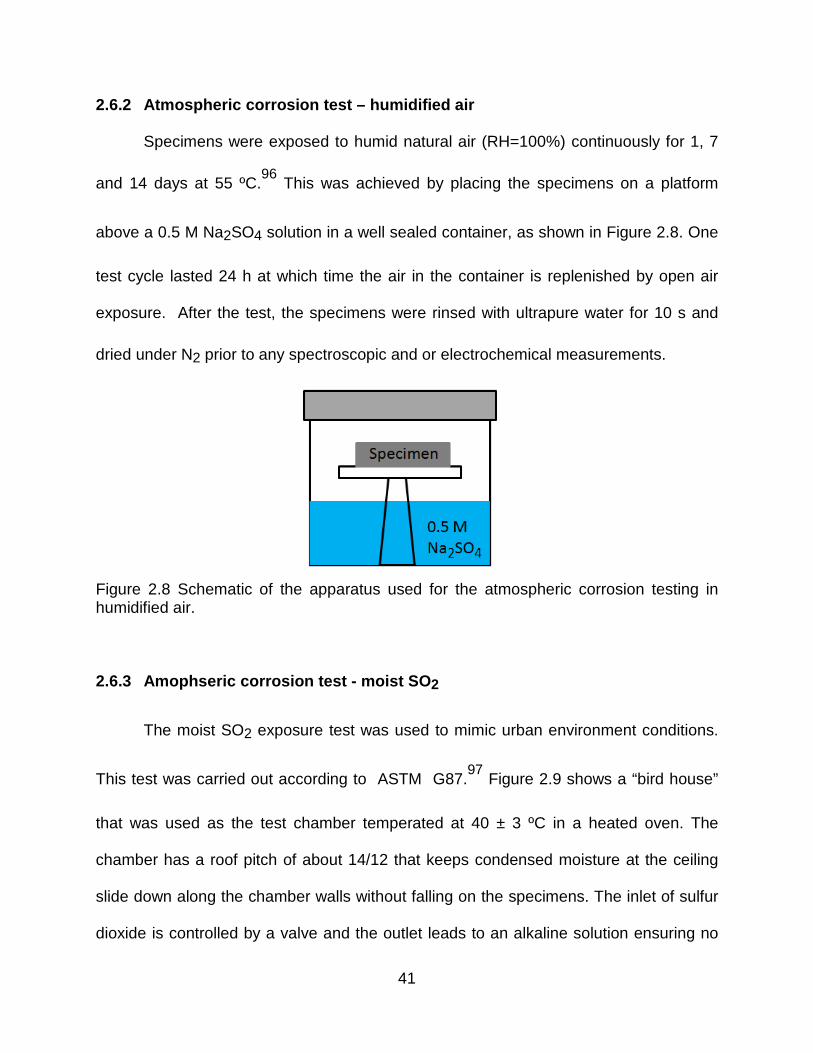
41
2.6.2 Atmospheric corrosion test – humidified air
Specimens were exposed to humid natural air (RH=100%) continuously for 1, 7
and 14 days at 55 ºC.96
This was achieved by placing the specimens on a platform
above a 0.5 M Na2SO4 solution in a well sealed container, as shown in Figure 2.8. One
test cycle lasted 24 h at which time the air in the container is replenished by open air
exposure. After the test, the specimens were rinsed with ultrapure water for 10 s and
dried under N2 prior to any spectroscopic and or electrochemical measurements.
Figure 2.8 Schematic of the apparatus used for the atmospheric corrosion testing in humidified air.
2.6.3 Amophseric corrosion test - moist SO 2
The moist SO2 exposure test was used to mimic urban environment conditions.
This test was carried out according to ASTM G87.97
Figure 2.9 shows a “bird house”
that was used as the test chamber temperated at 40 ± 3 ºC in a heated oven. The
chamber has a roof pitch of about 14/12 that keeps condensed moisture at the ceiling
slide down along the chamber walls without falling on the specimens. The inlet of sulfur
dioxide is controlled by a valve and the outlet leads to an alkaline solution ensuring no
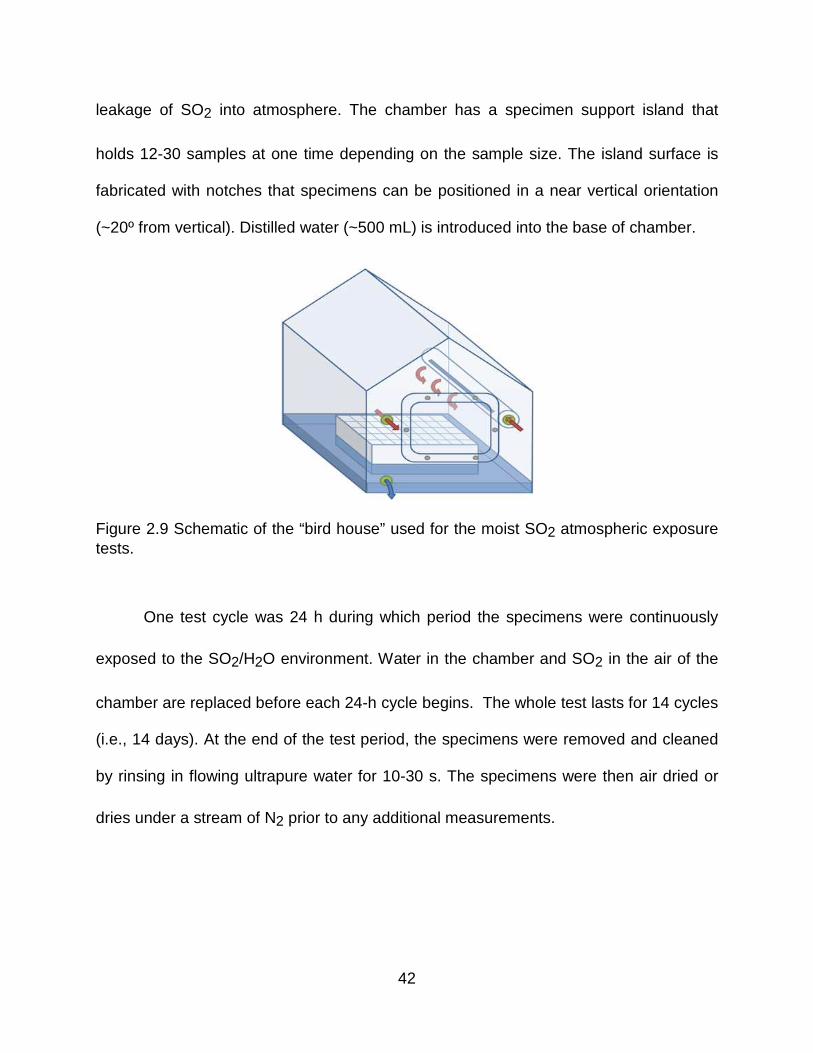
42
leakage of SO2 into atmosphere. The chamber has a specimen support island that
holds 12-30 samples at one time depending on the sample size. The island surface is
fabricated with notches that specimens can be positioned in a near vertical orientation
(~20º from vertical). Distilled water (~500 mL) is introduced into the base of chamber.
Figure 2.9 Schematic of the “bird house” used for the moist SO2 atmospheric exposure tests.
One test cycle was 24 h during which period the specimens were continuously
exposed to the SO2/H2O environment. Water in the chamber and SO2 in the air of the
chamber are replaced before each 24-h cycle begins. The whole test lasts for 14 cycles
(i.e., 14 days). At the end of the test period, the specimens were removed and cleaned
by rinsing in flowing ultrapure water for 10-30 s. The specimens were then air dried or
dries under a stream of N2 prior to any additional measurements.

43
2.6.4 Thin layer test
Aircrafts experience humid environments in service. In some cases, these
environments can contain high salt content, such as service at sea on an aircraft carrier.
Moisture condenses on surfaces with high salt content. The thickness of the electrolyte
layer is usually on the order of low millimeter down to micrometers. To assess the
protective properties of the non-chromate coatings in these conditions, we developed a
thin-layer mist (TLM) test accomplished by spraying a 3.5% NaCl aerosol on the
specimen surface, as shown in Figure 2.10. The specimen was positioned horizontally
on a platform above ultrapure water in a sealed container. The temperature was
maintained at 55 ºC that kept the relative humidity (RH) at 100% during the test. One
test cycle was 24 h during which period the specimens were continuously exposed. The
air in the container and the electrolyte mist were replenished each 24-h cycle by
opening the container to the natural air for 15 min and spraying the 3.5% NaCl mist to
wet the alloy surface. The whole test lasted for 14 cycles (i.e., 14 days). At the end of
the period, the electrolyte layer was rinsing away with flowing ultrapure water for 10-30
s. The specimens were then dried in flowing N2 before follow-up examinations.

44
Figure 2.10 Schematic of the thin layer mist (TLM) testing (A) during one test cycle and (B) between two test cycles. The container was well sealed during one cycle but opened for 15 min to replace the air inside. Several sprays were carried out between cycles to ensure the sample surface was dampened.
2.7 Galvanic coupling
Due to the difficulties of welding high strength aluminum alloys, they are joined
together by fasteners 98
that are usually made of stainless steels, titanium alloys, and
carbon steels. The stainless steel (SS) and Ti alloy fasteners are usually more noble
than aluminum alloy components and act as the cathode in the galvanic couple while
the Al alloys are the anode. This galvanic interaction can drive the corrosion of the Al
alloys and cause severe failure.
During the accelerated corrosion tests, the SS A286 CRES and TTi-6Al-4V
fasteners were galvanically coupled with the Al alloy panels as shown in Figure 2.11. A
hole (6 mm diam.) was drilled first through the Al alloy panel at the center. Then the

45
panel was coated and coupled with the fastener (100 in·oz torque). During the
accelerated corrosion testing, the fastener was in direct contact with the alloy panel (Fig.
2.11A). However, during the electrochemical measurement, the fastener was isolated
with the alloy panel using nonconductive o-rings, electrical and Teflon tape as shown in
Fig. 2.11B. This design is to measure the galvanic current between the fastener and
alloy panel.
Figure 2.11 Schematic of the galvanic couples of the AA2024 panel and the fastener (A) during accelerated corrosion testing and (B) during the electrochemical measurement of the galvanic current.
46
CHAPTER 3. FORMATION, STRUCTURE, AND BASIC ELECTRO CHEMISTRY OF TRIVALENT CHROMIUM PROCESS (TCP) COATINGS ON AA2 024-T3
3.1 Introduction
Chromate conversion coatings (CCCs) have been widely used a protective
coating on high strength aluminum alloys for the last decades.99
The formation and
structure of CCCs on aluminum alloys were extensively studied by McCreery and
colleagues.100-108
Formation of CCC initiates by the reduction of Cr(VI) species in the
coating bath to Cr(III),; aprocess is catalyzed by ferri/ferrocyanide at Al matrix sites.101-
103 Cr(III) binds to Cr(VI) species in the bath to form an insoluble Cr(III)/Cr(VI) mixed
oxide that has an approximate molar ratio of Cr(VI) : Cr(III) = 1: 3.103, 109
Studies have
shown that this binding is reversible and that the Cr(III)/Cr(VI) mixed oxide can leach
Cr(VI) into the aqueous solution.100, 107-108
At the intermetallic sites, such as Cu-rich
particles, the reduction of Cr(VI) at the metal surface is spontaneous and is self-limiting
to approximately one Cr(III) monolayer due to the ohmic resistance of the layer.103, 109
This monolayer likely interacts with Cr(VI) species in the coating bath to forms a mixed
Cr(III)/Cr(VI) oxide. In other words, at the early stage, CCC forms preferentially at the
Cu-rich intermetallic sites, which process is self limited due to the inhibition of electron
transfer by the Cr(III) monolayer; afterwards, reduction of Cr(VI) on the Al matrix sites
are accelerated by ferri/ferrocyanide; eventually, CCC forms a mixed oxide layer of
several micrometers on Al matrix and a monolayer of Cr(III) on the Cu-rich intermetallic
compounds. These layers are effective at reducing both anodic and cathodic reaction
47
kinetics on the Al matrix and intermetallic compounds, respectively.103
The corrosion
mechanism involves (i) blocking active sites, especially for O2 adsorption, (ii) reducing
the electronic transport through the poorly conductive mixed oxide film, and (iii)
suppressing diffusion of dissolved O2 and ions to the metal surface.110
In presence of
Cl-, adsorbed Cr(VI) lowers the zeta potential and the pH of zero charge of Al oxide
films which inhibits chloride adsorption.111
Unfortunately, CCCs contain Cr(VI) that is toxic and a potent carcinogen. Current
research is directed toward the identification and or development of alternate non-
chromate coatings that are less toxic, but equally as effective as CCCs. The new
trivalent chromium process (TCP) coating has been developed at NAVAIR as a drop-in
alternative for the chromate conversion coating (CCC).112-113
The TCP coating bath
contains no toxic and carcinogenic Cr(VI) species. It has recently gained a wide
acceptance as a promising replacement for CCC for providing excellent corrosion
protection on high strength aluminum alloys.113
For example, TCP-coated AA2024-T3
exhibited no evidence of corrosion after 2-week exposure to a neutral salt fog (ASTM
B117).64-65
Beach exposure for 30 days also revealed that the TCP coating inhibits
corrosion on Al alloys.64
While the coating provides corrosion inhibition, little is known
about the mechanism of this protection. In this chapter, data are presented that support
the corrosion inhibition mechanism by the conversion coating. The mechanism is
dependent on the aluminum alloy. In addition, little fundamental insight exists regarding

48
the formation mechanisms and structure of TCP coatings on aluminum alloys. The
results presented and discussed herein also address the formation mechanism,
composition and structure of the TCP coating on AA2024-T3.
3.2 Results
3.2.1 OCP and pH changes during formation of TCP co atings
Figure 3.1 shows the open circuit potential (OCP) versus time profiles recorded
during the formation of a TCP coating on a degreased and deoxidized AA2024
specimen. The immersion lasted 10 min. Curves for two coatings solutions are
presented: (i) the “ready to use (RTU)” 100% full-strength Alodine® T5900 RTU solution
and (ii) the RTU solution diluted by 50% (v/v) with ultrapure water. The OCP transients
are similar in shape and magnitude for both solutions. The TCP bath is very aggressive
toward the alloy surface as evidenced by the cathodic shift in the OCP to ca. -0.95 V vs
Ag/AgCl within the first 60 s. The fluoride in the solution facilitates the dissolution of the
oxide layer on these surfaces. The oxide layer dissolution exposes the bare aluminum
(activates the metal) is an essential first step in the formation of the TPC coating.114
The OCP transient then goes through a minimum before a slight positive increase to -
0.90 V within the first 100-200 s. Afterwards, the potential stabilizes at this value for the
duration of the immersion period.

49
Figure 3.1 OCP-time profiles recorded during formation of the TCP coatings on AA2024 immediately after degreasing and deoxidizing. The profile of a high oxide AA2024 sample, immersed in boiled water for 1 min after deoxidizing, was also shown here as comparison. Coatings were formed at room temperature (21-27 ºC).
The importance of the initial oxide layer dissolution during the coating formation
process is illustrated in Figure 3.2. In this figure, OCP-time transients are shown for high
oxide AA2024 samples in 50 and 100% Alodine® T5900. The samples were prepared
by degreasing and deoxidation, followed by immersion in boiling water for 1 min. This
leads to formation of a thicker Al oxide film layer on the alloy surface. For this high oxide
AA2024, there is a slower cathodic shift in the OCP to -0.9 V vs Ag/AgCl as compared
to the low oxide sample in Fig. 3.1. This reflects an extra time needed to dissolve the
thicker oxide and expose bare Al. The cathodic limit of ca. -0.9 V is reached after about
500 s on the high oxide samples as compared to the 100 s seen for the low oxide
surfaces. Once the oxide film is dissolved, then the TCP formation is in an identical
manner on all of the surfaces, based on the similarity in the OCP values. The increase
in the surface pH due to hydrogen discharge and oxygen reduction reaction drives the
0 200 400 600 Time (s)
-0.50
-0.80
-0.60
-0.70
E (
V v
s A
g/A
gCl)
-0.90
-1.00
50% 100%
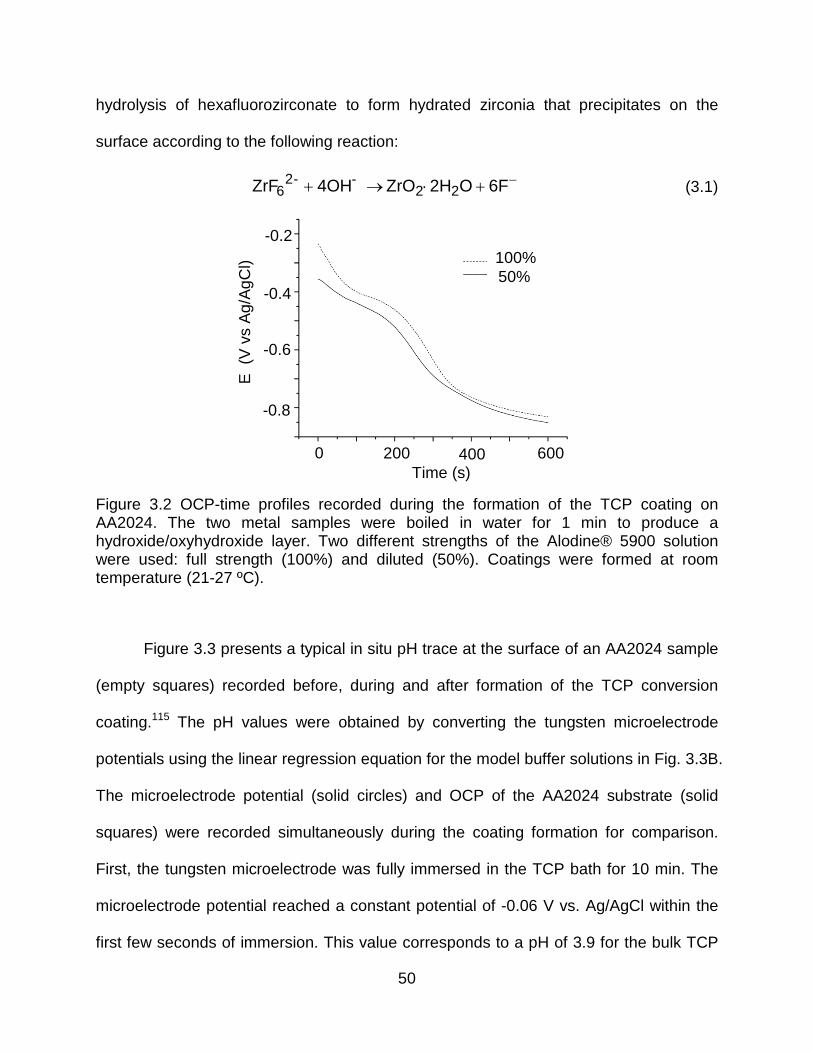
50
hydrolysis of hexafluorozirconate to form hydrated zirconia that precipitates on the
surface according to the following reaction:
6F O2HZrO 4OH ZrF 22--2
6−
+⋅→+ (3.1)
Figure 3.2 OCP-time profiles recorded during the formation of the TCP coating on AA2024. The two metal samples were boiled in water for 1 min to produce a hydroxide/oxyhydroxide layer. Two different strengths of the Alodine® 5900 solution were used: full strength (100%) and diluted (50%). Coatings were formed at room temperature (21-27 ºC).
Figure 3.3 presents a typical in situ pH trace at the surface of an AA2024 sample
(empty squares) recorded before, during and after formation of the TCP conversion
coating.115 The pH values were obtained by converting the tungsten microelectrode
potentials using the linear regression equation for the model buffer solutions in Fig. 3.3B.
The microelectrode potential (solid circles) and OCP of the AA2024 substrate (solid
squares) were recorded simultaneously during the coating formation for comparison.
First, the tungsten microelectrode was fully immersed in the TCP bath for 10 min. The
microelectrode potential reached a constant potential of -0.06 V vs. Ag/AgCl within the
first few seconds of immersion. This value corresponds to a pH of 3.9 for the bulk TCP
0 200 400 600 Time (s)
-0.2
-0.8
-0.4
-0.6
E (
V v
s A
g/A
gCl)
50% 100%
51
bath. The microelectrode was then repositioned close to the AA2024 sample surface
followed by adding the coating solution. Immediately when both the microelectrode and
the alloy sample were fully immersed in the solution, the OCP measurement started.
Parallel with the cathodic shift of the AA2024 OCP during the first 2 min, the tungsten
microelectrode potential also decreased rapidly. The decrease in tungsten electrode
potential is an indication of an increase in the local solution pH according to Fig. 3.3B.
As the oxide layer on the aluminum alloy gets dissolved in the coating bath, the OCP for
the alloys shifts considerably cathodic. This cathodic shift is reflective of the increased
rate of cathodic reactions needed to balance the increased rate of corrosion due to the
dissolution of the passivating oxide. The cathodic reactions consume H+ ions: (i) oxygen
reduction and (ii) hydrogen evolution. A H+ concentration gradient develops at the alloy
surface relative to the solution bulk. The interfacial pH shifts from 3.9 to near 7 during
the initial stages of coating formation. The variation in the response period is due to a
lag time needed for development of the concentration gradient of H+ from the alloy
surface to the microelectrode.

52
Figure 3.3 A typical pH trace at the AA2024 surface (empty squares, right y axis) before, during and after formation of the T5900 conversion (TCP) coating. The OCP of the
W/WO3 microelectrode and the AA2024 sample (solid circles and squares, respectively, left y axis) were also recorded. The formation of the coating occurred during the 18 to 28 min period, as indicated by the grey background.
3.2.2 AFM topography of TCP-coated alloys
Figure 3.4 shows ex situ tapping-mode AFM images of polished, degreased and
deoxidized AA2024 surfaces before and after TCP coating. Height mode images are
shown over a 10 ×10 mm2 area. The uncoated surface (Fig. 3.4A) is relatively smooth
with no intermetallics or defects in the imaged area. The roughness is 20.9 nm (root
mean square, rms) over the 100 mm2 area. The image of the coated surface (Fig. 3.4B)
reveals a nodular morphology. The film conforms to the underlying surface topography
as a similar nominal roughness of 21.3 nm (rms) is found over the same geometric area.
On these length scales, the coating conforms to the underlying metal topography and
appears devoid of large-scale cracks and imperfections.
1.5
-0.9
0.9
-0.3
E (
V v
s A
g/A
gCl)
0.3
OCP of AA2024 OCP of W microelectrode pH at alloy surface
13
7
-5
pH
1
0 10 20 30 Time (min)
40 50

53
Figure 3.4 Ex situ tapping mode AFM images of uncoated and TCP-coated AA2024
specimens. Images (10 × 10 µm2) are presented in the height mode.
3.2.3 Auger depth profiling of TCP coatings
Figure 3.5 presents elemental depth profiling data for TCP-coated AA2024
samples obtained by scanning auger microprobe analysis. Tracking the Al signal with
depth indicates the film is on the order of 50 nm thick (in vacuo). Further evidence that
the immersion coating is about 50 nm thick comes from tracking the Cu signal with
depth. This Cu signal arises from intermetallic particles at the alloy surface and should
not be affected by the aggressive TCP coating solution. As can be seen, the Cu signal
intensity starts to increase at about 50 nm into the coating. Recently reported
ellipsometric data of a hydrated coating, formed in a manner similar to our coatings,
revealed a nominal film thickness of 90 nm for a 10 min immersion coating.72
Therefore,
we suppose the true (hydrate) thickness of our TCP coating is on the order of 90-100
nm. Cracks in the coating are observed from time to time during SEM imaging,
consistent with tensile stress caused by a reduction in film volume in vacuum. A
A. B.
2 4
6 8
10 µm
2 4
6 8
10 µm
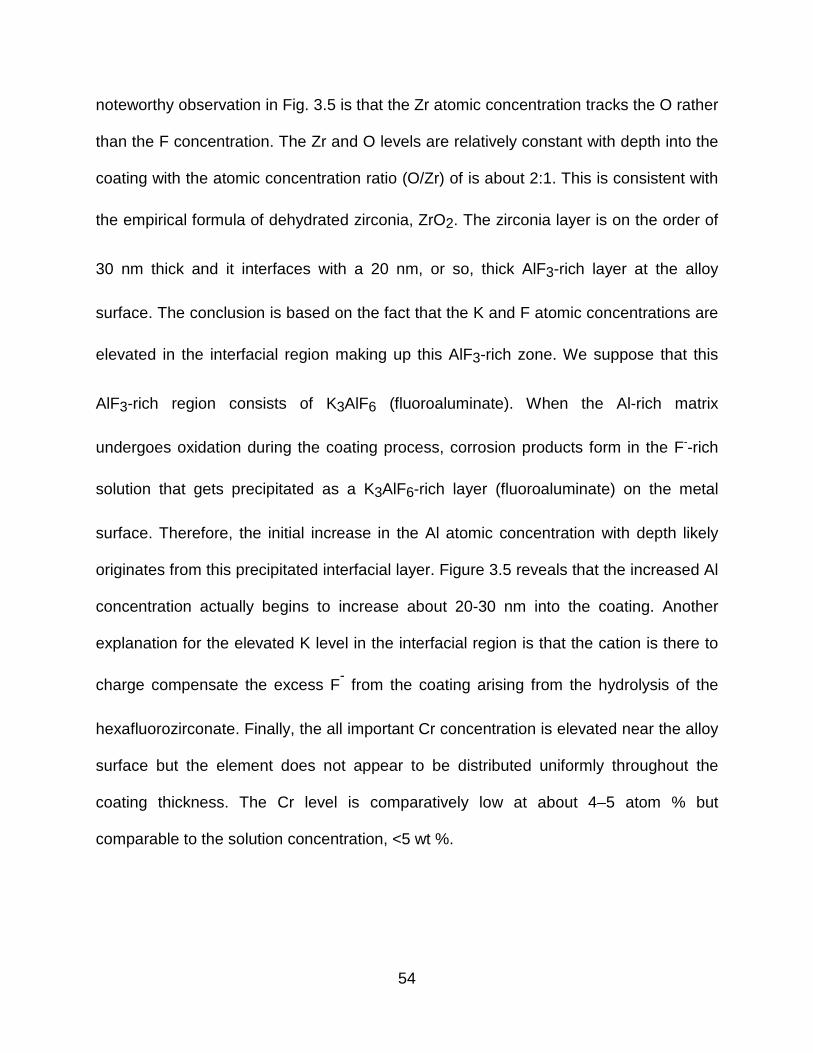
54
noteworthy observation in Fig. 3.5 is that the Zr atomic concentration tracks the O rather
than the F concentration. The Zr and O levels are relatively constant with depth into the
coating with the atomic concentration ratio (O/Zr) of is about 2:1. This is consistent with
the empirical formula of dehydrated zirconia, ZrO2. The zirconia layer is on the order of
30 nm thick and it interfaces with a 20 nm, or so, thick AlF3-rich layer at the alloy
surface. The conclusion is based on the fact that the K and F atomic concentrations are
elevated in the interfacial region making up this AlF3-rich zone. We suppose that this
AlF3-rich region consists of K3AlF6 (fluoroaluminate). When the Al-rich matrix
undergoes oxidation during the coating process, corrosion products form in the F--rich
solution that gets precipitated as a K3AlF6-rich layer (fluoroaluminate) on the metal
surface. Therefore, the initial increase in the Al atomic concentration with depth likely
originates from this precipitated interfacial layer. Figure 3.5 reveals that the increased Al
concentration actually begins to increase about 20-30 nm into the coating. Another
explanation for the elevated K level in the interfacial region is that the cation is there to
charge compensate the excess F- from the coating arising from the hydrolysis of the
hexafluorozirconate. Finally, the all important Cr concentration is elevated near the alloy
surface but the element does not appear to be distributed uniformly throughout the
coating thickness. The Cr level is comparatively low at about 4–5 atom % but
comparable to the solution concentration, <5 wt %.

55
Figure 3.5 Scanning Auger electron spectroscopy depth profiling analysis of TCP-coated AA2024. Depth profiling levels are shown for several important elements including Al, Zr, O, Cr, Cu, K and F. Arrows in (A) identify traces for Zr and O. Arrow in (B) identifies the F signal.
3.2.4 Chemical structure of Cr in TCP coatings
Additional evidence for the presence of Cr species in the coating comes from
XPS data. Figure 3.6 shows the Cr 2p region of the survey scan for TCP-coated
AA2024. XPS is useful for assessing the oxidation state of the Cr in the coating. There
are two peaks in the spectrum at ca. 576 and 586 eV. They represent Cr 2p3/2 and
2p1/2 photoelectrons, respectively. The 2p3/2 peak is sensitive to the Cr oxidation state
and can be fit with two peaks when both Cr(III) and Cr(VI) are present in a mixed oxide:
576.7 eV for Cr(III) and 579.3 eV for Cr(VI). A narrow Cr 2p3/2 peak is seen for the TCP
coating with no higher binding energy tail. Therefore, the coating as formed appears to
C
Al
O
Mg F
K Cr Cu Zr
60
0
50
10 Ato
mic
Con
cent
ratio
n (%
)
20
30
40
0 10 20 Depth (nm)
50 30 40
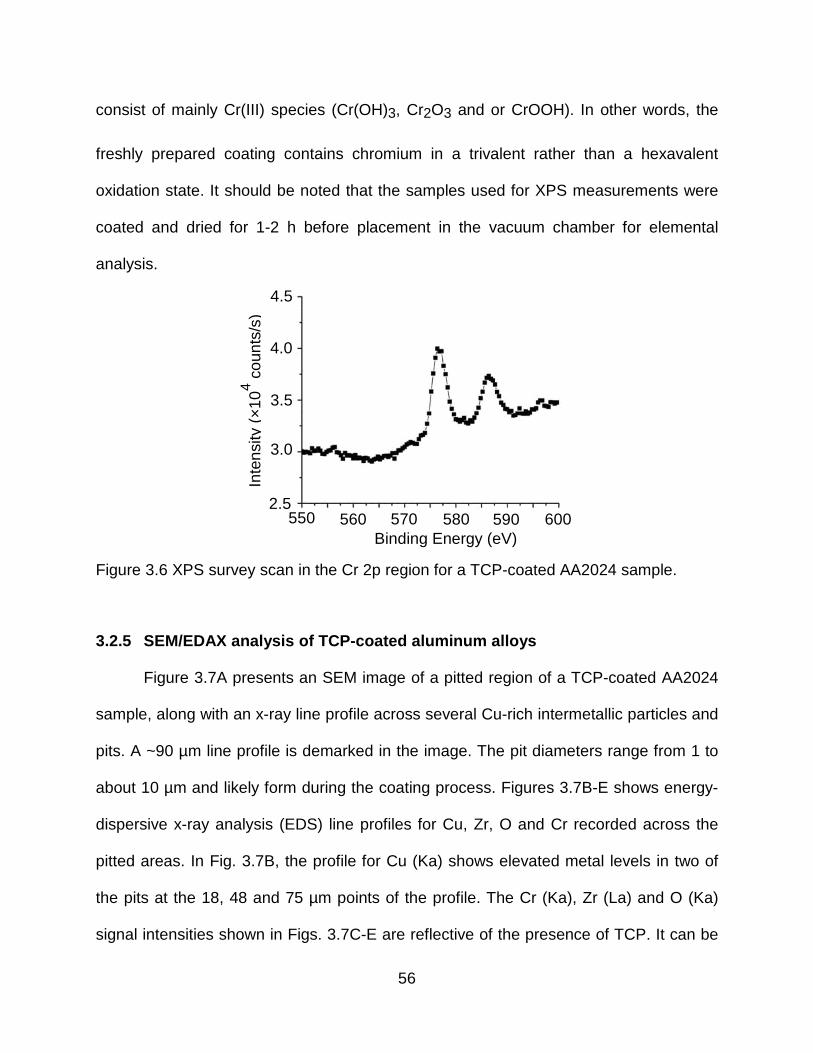
56
consist of mainly Cr(III) species (Cr(OH)3, Cr2O3 and or CrOOH). In other words, the
freshly prepared coating contains chromium in a trivalent rather than a hexavalent
oxidation state. It should be noted that the samples used for XPS measurements were
coated and dried for 1-2 h before placement in the vacuum chamber for elemental
analysis.
Figure 3.6 XPS survey scan in the Cr 2p region for a TCP-coated AA2024 sample.
3.2.5 SEM/EDAX analysis of TCP-coated aluminum allo ys
Figure 3.7A presents an SEM image of a pitted region of a TCP-coated AA2024
sample, along with an x-ray line profile across several Cu-rich intermetallic particles and
pits. A ~90 µm line profile is demarked in the image. The pit diameters range from 1 to
about 10 µm and likely form during the coating process. Figures 3.7B-E shows energy-
dispersive x-ray analysis (EDS) line profiles for Cu, Zr, O and Cr recorded across the
pitted areas. In Fig. 3.7B, the profile for Cu (Ka) shows elevated metal levels in two of
the pits at the 18, 48 and 75 µm points of the profile. The Cr (Ka), Zr (La) and O (Ka)
signal intensities shown in Figs. 3.7C-E are reflective of the presence of TCP. It can be
550 560 570 Binding Energy (eV)
600 580 590
4.5
4.0
2.5
Inte
nsity
(×
104 c
ount
s/s)
3.0
3.5

57
seen that the signal intensities for all three elements are higher near the pit edges than
on the terraces surrounding the pits. This is a common observation from probing
numerous pit areas on TCP-coated AA2024. The Zr and O signals arise from the
hydrated zirconia, ZrO2·2H2O, that precipitates during the immersion process. The Cr
signal arises from Cr(III) localized within the coating, likely Cr2O3. Based on the x-ray
signal intensities, the levels of Cr regionally in the coating are less than the Zr or O
levels, as expected.
3.2.6 Basic electrochemistry of TCP-coated aluminum alloys
Figure 3.8 presents the potentiodynamic polarization curves for TCP-coated and
uncoated AA2024 specimens measured in naturally aerated 0.5 M Na2SO4. The
presence of the coating does not cause a significant shift in the corrosion potential
(Ecorr) . However, the coating produces attenuated anodic and cathodic currents around
the Ecorr. For example, the anodic current density at 0.1 V is about a factor of 10× lower
for the TCP-coated alloy compared to the uncoated sample. Attenuated current is also
seen for the cathodic scan from Ecorr to about -1.0 V vs Ag/AgCl. The cathodic current
in this potential region is arises from oxygen reduction and the inhibition by TCP may
result from the blockade of at least some of the Cu-rich intermetallic sites.
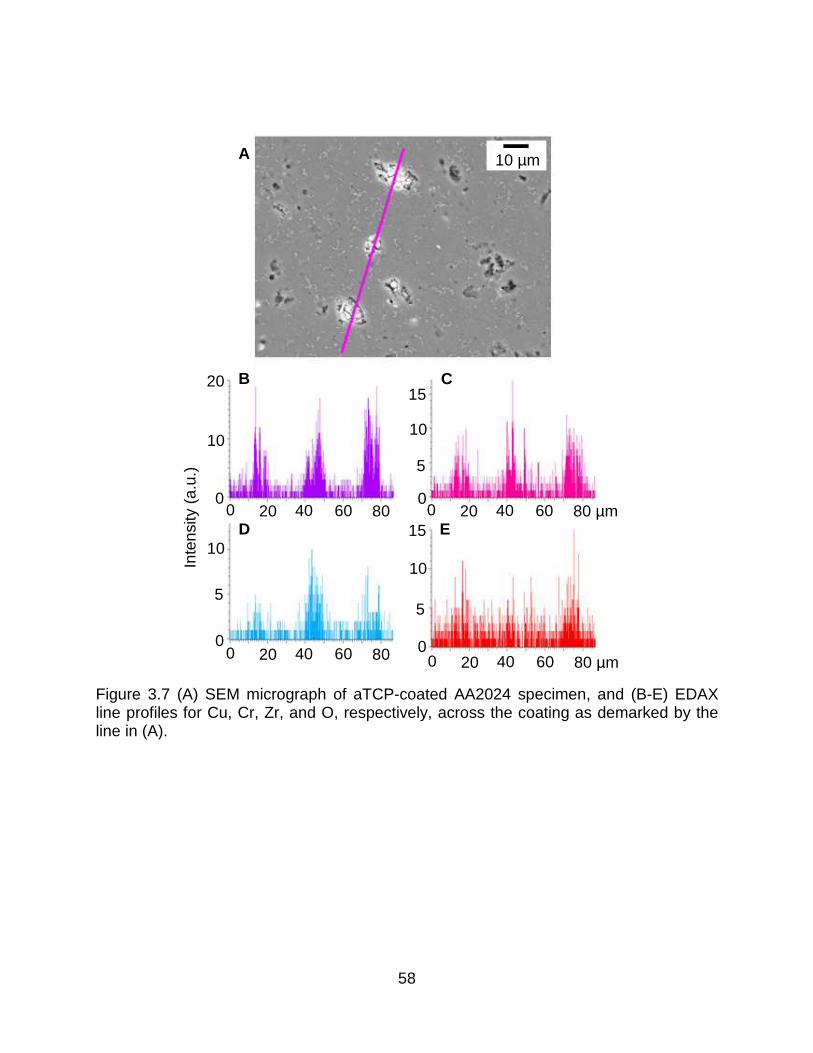
58
Figure 3.7 (A) SEM micrograph of aTCP-coated AA2024 specimen, and (B-E) EDAX line profiles for Cu, Cr, Zr, and O, respectively, across the coating as demarked by the line in (A).
20
10
0
Inte
nsity
(a.
u.)
5
10
0
10
0
5
15
0
5
15
10
10 µm
20 40 0 60 80 20 40 0 60 80 µm
20 40 0 60 80 20 40 0 60 80 µm
A
B C
D E
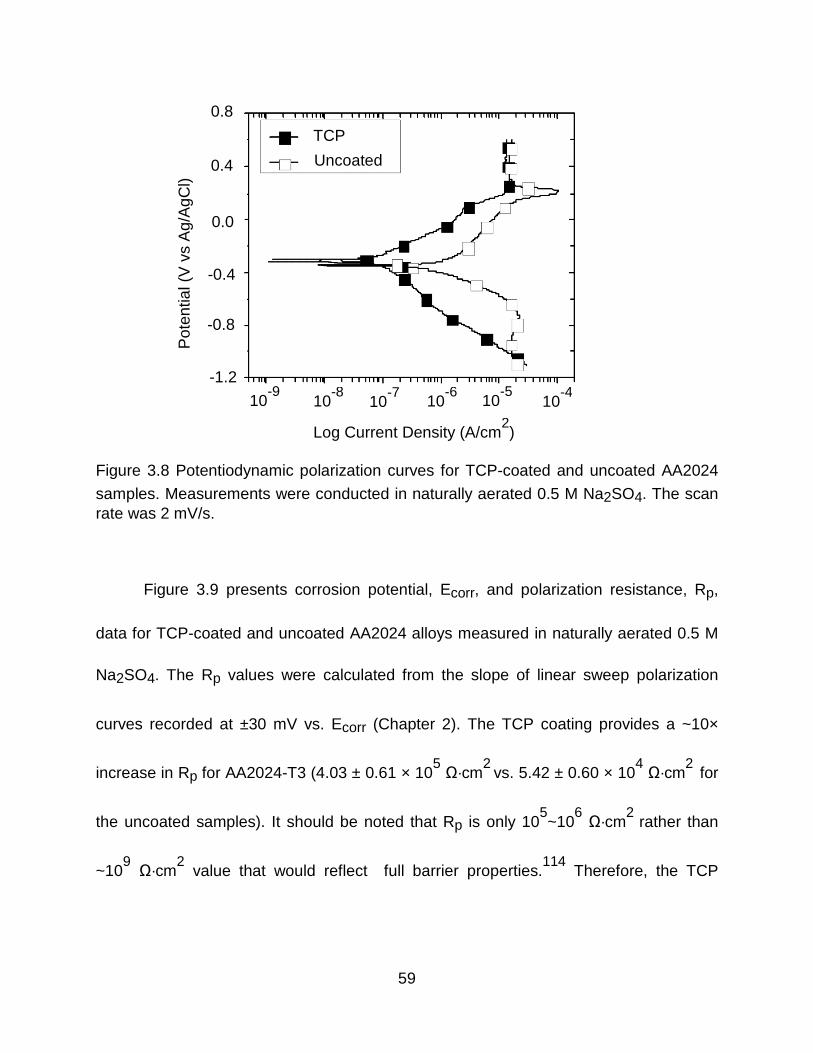
59
Figure 3.8 Potentiodynamic polarization curves for TCP-coated and uncoated AA2024
samples. Measurements were conducted in naturally aerated 0.5 M Na2SO4. The scan rate was 2 mV/s.
Figure 3.9 presents corrosion potential, Ecorr, and polarization resistance, Rp,
data for TCP-coated and uncoated AA2024 alloys measured in naturally aerated 0.5 M
Na2SO4. The Rp values were calculated from the slope of linear sweep polarization
curves recorded at ±30 mV vs. Ecorr (Chapter 2). The TCP coating provides a ~10×
increase in Rp for AA2024-T3 (4.03 ± 0.61 × 10⁵ Ω·cm
2 vs. 5.42 ± 0.60 × 10
4 Ω·cm
2 for
the uncoated samples). It should be noted that Rp is only 105~10
6 Ω·cm
2 rather than
~109 Ω·cm
2 value that would reflect full barrier properties.
114 Therefore, the TCP
0.8
0.4
0.0
-0.4
-0.8
-1.2
10-7
10-8
10-9
10-6
10-5
10-4
Log Current Density (A/cm2)
Pot
entia
l (V
vs
Ag/
AgC
l)
TCP
Uncoated

60
coating, while partially passivating the alloy, likely consists of hydrated channels/pores
and or defects.
Figure 3.9 Corrosion potential (Ecorr) and polarization resistance (Rp) data for TCP-
coated and uncoated AA2024 specimens measured in naturally aerated 0.5 M Na2SO4.
Rp was determined by the inverse of the slope of E-i curves at Ecorr. Each datum is an average value of no less than 4 samples. The asterisks indicate statistically significant differences at the 95% confidence level.
Figure 3.10 shows the typical Bode plots for the TCP-coated AA2024 specimens
at Ecorr. Measurements were conducted in naturally aerated 0.5 M Na2SO4 + 0.01 M
NaCl. Table 1.1 presents the best-fit parameters for these EIS data to the equivalent
circuits shown in Figure 2 of Chapter 2. The uncoated AA2024-T3 shows one time
constant that is attributed to the interfacial capacitance at the metal surface, while the
TCP-coated sample exhibits two time constants due to its microporous or defect
structure. The higher frequency time constant corresponds to the coating and the lower
frequency one that is attributed to the double layer at the uncoated metal region
0
-0.2
Pot
entia
l (V
vs
Ag/
AgC
l)
-0.4
-0.6
-0.8
106
Pol
ariz
atio
n R
esis
tanc
e (Ω
·cm
2 )
105
104
Bare TCP Bare TCP
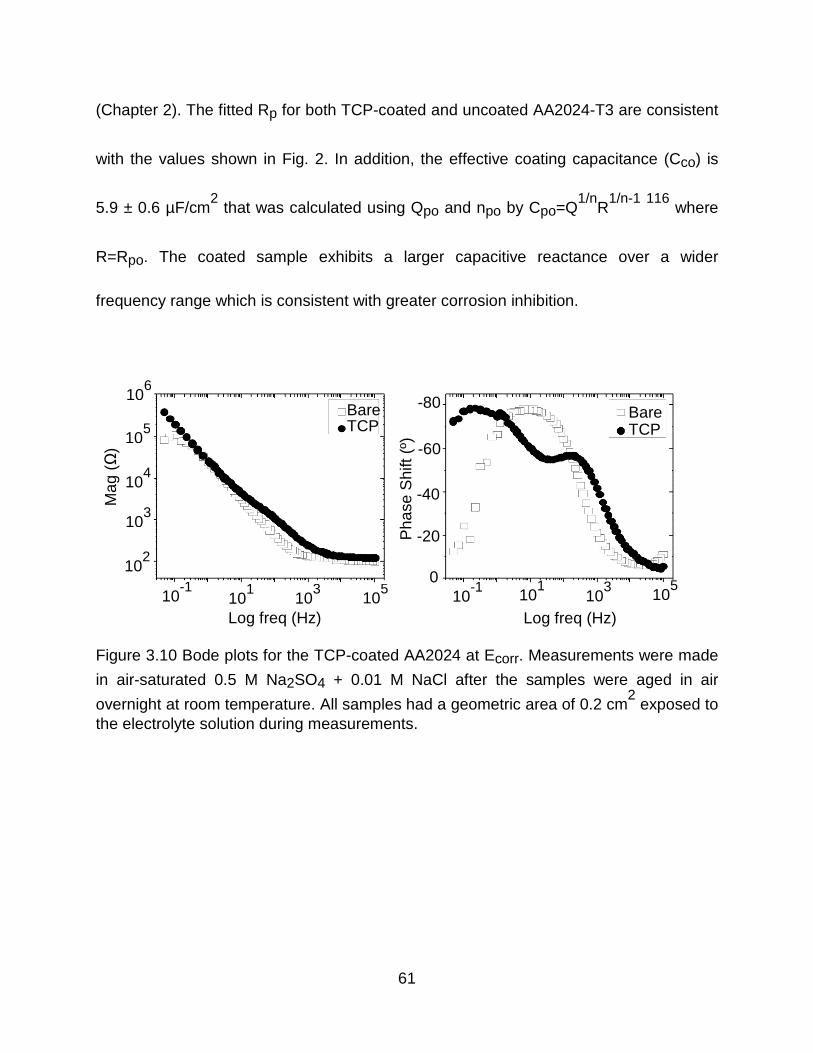
61
(Chapter 2). The fitted Rp for both TCP-coated and uncoated AA2024-T3 are consistent
with the values shown in Fig. 2. In addition, the effective coating capacitance (Cco) is
5.9 ± 0.6 µF/cm2 that was calculated using Qpo and npo by Cpo=Q
1/nR
1/n-1 116
where
R=Rpo. The coated sample exhibits a larger capacitive reactance over a wider
frequency range which is consistent with greater corrosion inhibition.
Figure 3.10 Bode plots for the TCP-coated AA2024 at Ecorr. Measurements were made
in air-saturated 0.5 M Na2SO4 + 0.01 M NaCl after the samples were aged in air
overnight at room temperature. All samples had a geometric area of 0.2 cm2 exposed to
the electrolyte solution during measurements.
Mag
(Ω
)
106
105
104
103
102
Pha
se S
hift
(º)
-80
-60
-40
-20
0 10
5 10
3 10
1 10
-1 10
5 10
3 10
1 10
-1
Log freq (Hz) Log freq (Hz)
Bare TCP
Bare TCP
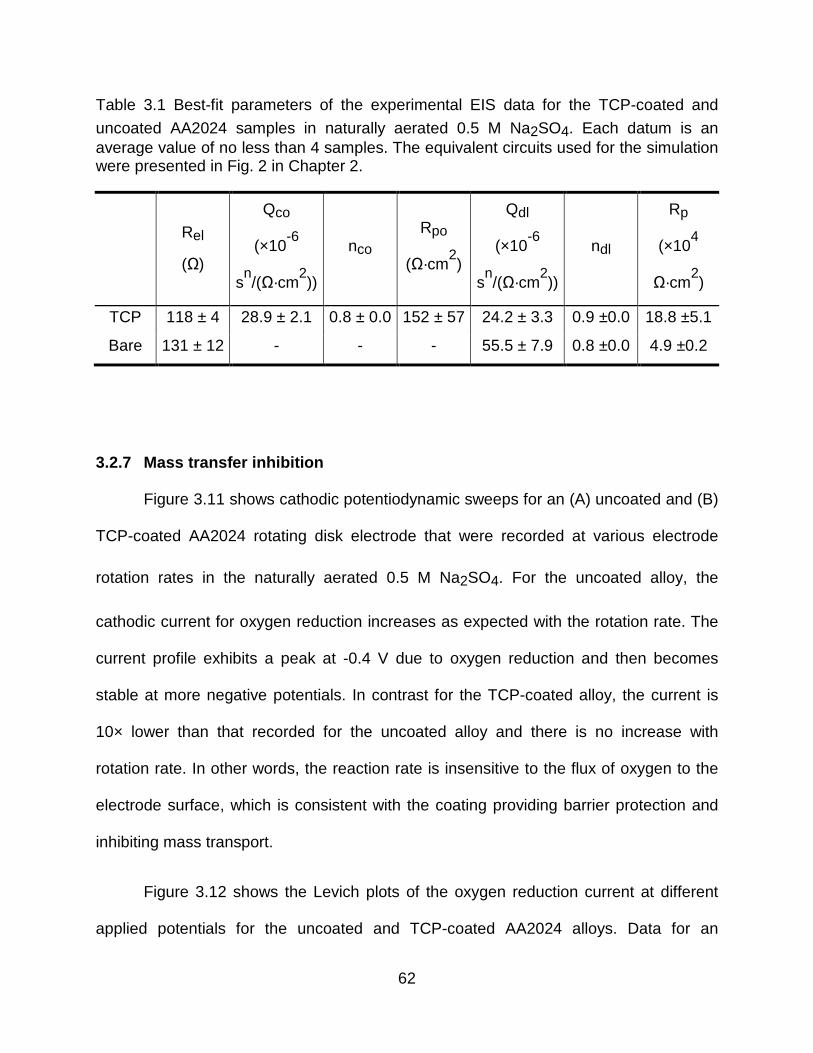
62
Table 3.1 Best-fit parameters of the experimental EIS data for the TCP-coated and
uncoated AA2024 samples in naturally aerated 0.5 M Na2SO4. Each datum is an average value of no less than 4 samples. The equivalent circuits used for the simulation were presented in Fig. 2 in Chapter 2.
Rel
(Ω)
Qco
(×10-6
sn/(Ω·cm
2))
nco Rpo
(Ω·cm2)
Qdl
(×10-6
sn/(Ω·cm
2))
ndl
Rp
(×104
Ω·cm2)
TCP 118 ± 4 28.9 ± 2.1 0.8 ± 0.0 152 ± 57 24.2 ± 3.3 0.9 ±0.0 18.8 ±5.1
Bare 131 ± 12 - - - 55.5 ± 7.9 0.8 ±0.0 4.9 ±0.2
3.2.7 Mass transfer inhibition
Figure 3.11 shows cathodic potentiodynamic sweeps for an (A) uncoated and (B)
TCP-coated AA2024 rotating disk electrode that were recorded at various electrode
rotation rates in the naturally aerated 0.5 M Na2SO4. For the uncoated alloy, the
cathodic current for oxygen reduction increases as expected with the rotation rate. The
current profile exhibits a peak at -0.4 V due to oxygen reduction and then becomes
stable at more negative potentials. In contrast for the TCP-coated alloy, the current is
10× lower than that recorded for the uncoated alloy and there is no increase with
rotation rate. In other words, the reaction rate is insensitive to the flux of oxygen to the
electrode surface, which is consistent with the coating providing barrier protection and
inhibiting mass transport.
Figure 3.12 shows the Levich plots of the oxygen reduction current at different
applied potentials for the uncoated and TCP-coated AA2024 alloys. Data for an

63
uncoated Cu rotating disk electrode are also presented for comparison. The ilim data for
the uncoated and TCP-coated AA2024-T3 at -0.7 V vs Ag/AgCl are plotted against the
rotation rate1/2
. For the uncoated alloys, the potentiodynamic curves show a similar
trend that is the current density increases from OCP and reaches a peak at about -0.4 V
vs Ag/AgCl. The curves then decreases slightly before approaching a plateau. Moreover,
in the mass-transfer controlled region (e.g., from -0.4 to -1.0 V vs Ag/AgCl), the current
density increases as the rotating rate increases. However, the ilim value is smaller on
the uncoated AA2024 compared to the uncoated Cu, which is attributed to the greater
ORR active areas on the Cu electrode than that on AA2024. The slope ofthe curve for
uncoated AA2024 is less than than the expected value for the case with the oxygen
reduction reaction (n=4) is proceeding under diffusion control. The lower slowis likely
due to formation of an passivatimng oxide layer at both the Al and the Cu-rich
intermetallic sites. The passivating oxide layer functions as a barrier for both electron
transfer from the underlying metal and mass transport of oxygen. Therefore the higher
angular velocity does not increase ilim to the level expected for n=4. In contrast, the
TCP-coated AA2024-T3 exhibits ilim (e.g., -0.01 µA/cm2) that is smaller by about one
order of magnitude than that for the uncoated sample (e.g., -0.2 to -0.6 µA/cm2)
throughout this potential window shown in Fig. 4B. The curves have no plateau or peaks,
which indicates a mass transfer inhibition of the dissolved O2. It is also noted that there
is no significant change in the current density as the rotating rate increases. This
independence of ilim to w0.5
(Fig. 5) is attributed to both the mass transfer inhibition

64
provided by the TCP coating and the fact that this coating contains ZrO2, Cr(OH)3, and
Al(OH)3) which are poorly conductive materials.
Figure 3.11 Cathodic potentiodynamic sweeps for an (A) uncoated and (B) TCP-coated AA2024 rotating disk electrode at different rotation rates in naturally aerated 0.5 M
Na2SO4. Scan rate = 2 mV/sec.
Figure 3.12 Plots of ilim for the oxygen reduction reaction as a function of w
0.5 recorded
using uncoated AA2024, Cu and TCP-coated AA2024 rotating disk electrodesin
naturally aerated 0.5 M Na2SO4. The theoretical Levich plot for of the 4e- reduction of oxygen is also shown for comparison. The variables in the theoretical curve were: n=4,
A=0.283 cm2, CO2=1×10
-4 M, DO2=1×10
-4 cm
2/s, and ν=0.01 cm
2/s.
110
0.0
-0.2
Cur
rent
Den
sity
(µ
A/c
m2 )
-0.4
-0.6
-0.8
0.01
0.00
-0.01
-0.02
-0.03
0.0 -0.4 -1.0 -0.2 -0.6 Potentail (V vs Ag/AgCl) Potential (V vs Ag/AgCl)
A B
Cur
rent
Den
sity
(µ
A/c
m2 )

65
3.3 Discussion
3.3.1 Formation of TCP coatings
The formation of TCP immersion coatings occurs by a series of chemical steps,
initially driven by an increase in the interfacial pH. The initial chemical step involves
dissolution of the native oxide layer, as evidenced by the negative shift in the OCP (Fig.
3.1). This is in agreement with recent observations made by Dong et al. and Jaworowski
et al.113
The hydrogen discharge that accompanies the oxidation and dissolution of the
Al alloy consumes protons and causes an interfacial pH increase (Fig. 3.3). Oxygen
reduction is also a counterbalancing cathodic reaction that occurs at the Cu-rich
intermetallics and contributes to the interfacial pH increase. The increased pH up to ca.
7 at the metal surface, as well as an OCP of the alloys of ca. -0.9 V vs Ag/AgCl, lead to
hydrolysis of hexafluorozirconate to form a hydrated zirconia layer. Energy-dispersive x-
ray spectroscopy (EDX) analysis revealed that TCP coating consists of Zr and O,
consistent with the formation of zirconia (Fig. 3.5), and that the coating is present over
most regions of the alloy surface (Fig. 3.7). EDX data were also consistent with a
biphasic coating consisting of an outer ZrO2·2H2O layer and an interfacial KxAlF3+x-rich
layer (fluoroaluminate, AlF63-
). This is based on the elevated levels of Al, F and K
detected at the interface of coatings and alloys using Auger electron spectroscopy (AES)
depth profiling (Fig. 3.5). Once the oxide layer is dissolved, the exposed aluminum
undergoes oxidation in the fluoride-rich coating solution (pH 3.8-4) forming AlF63-
ions.
The fluoride at the metal surface originates from the hydrolysis of hexafluorozirconate
and the HBF4 in the coating solution. Al3+
formation is promoted by the presence of F-.
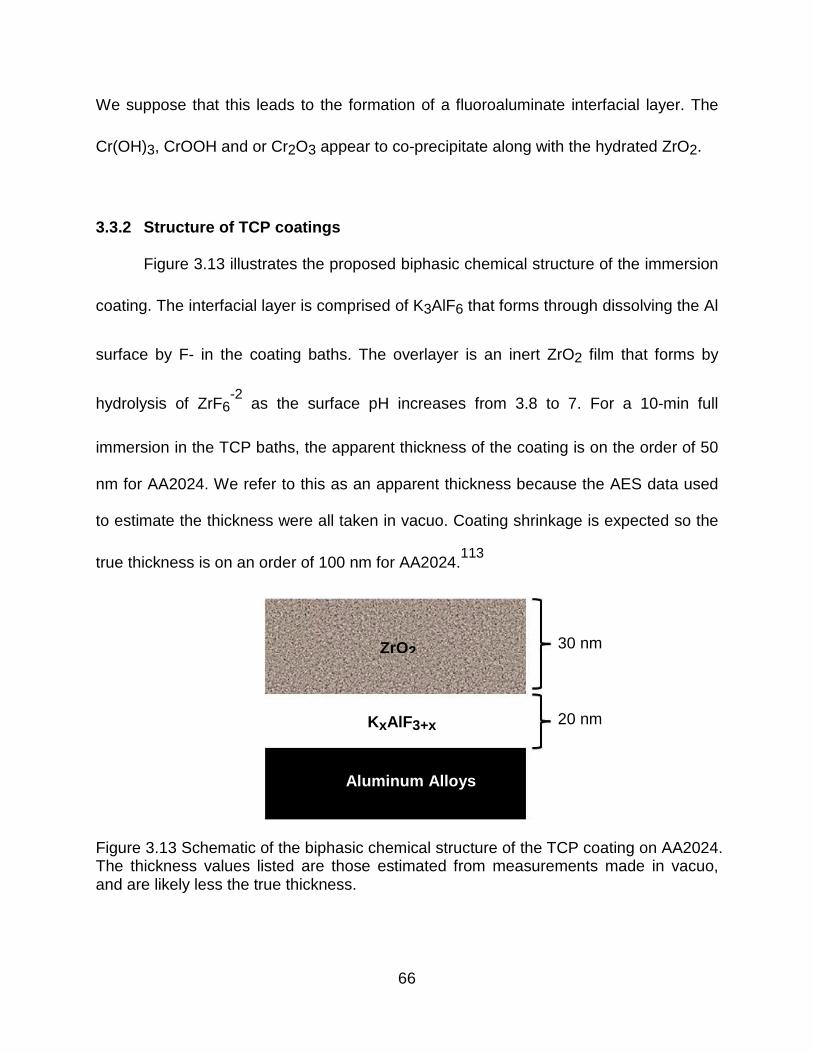
66
We suppose that this leads to the formation of a fluoroaluminate interfacial layer. The
Cr(OH)3, CrOOH and or Cr2O3 appear to co-precipitate along with the hydrated ZrO2.
3.3.2 Structure of TCP coatings
Figure 3.13 illustrates the proposed biphasic chemical structure of the immersion
coating. The interfacial layer is comprised of K3AlF6 that forms through dissolving the Al
surface by F- in the coating baths. The overlayer is an inert ZrO2 film that forms by
hydrolysis of ZrF6-2
as the surface pH increases from 3.8 to 7. For a 10-min full
immersion in the TCP baths, the apparent thickness of the coating is on the order of 50
nm for AA2024. We refer to this as an apparent thickness because the AES data used
to estimate the thickness were all taken in vacuo. Coating shrinkage is expected so the
true thickness is on an order of 100 nm for AA2024.113
Figure 3.13 Schematic of the biphasic chemical structure of the TCP coating on AA2024. The thickness values listed are those estimated from measurements made in vacuo, and are likely less the true thickness.
30 nm
20 nm
ZrO2
KxAlF3+x
Aluminum Alloys

67
Line profiling x-ray analysis revealed the coating forms on most areas of the
aluminum alloy and enriched at the intermetallic sites (Fig. 3.7). Furthermore, the
immersion coating does not form an impermeable barrier on the alloy surface. This
conclusion is based on the fact that the polarization resistance is 105-10
6 Ω·cm
2 in air-
saturated 0.5 M Na2SO4 rather than ~109 Ω·cm
2, as expected for more impermeable
barrier coatings on aluminum alloys. We suppose the biphasic coating is hydrated and
contains channels and pathways through which dissolved O2 and ions can diffuse to
reach the underlying metal surface. This leads to localized corrosion on the coated
surface.
Cr is incorporated but its distribution does not appear uniform throughout the
coating. Cr levels are elevated in and around pits based on EDX analysis (Fig. 3.7). A
steeper pH gradient likely exists near these sites during the coating formation and this
may be a driver for the formation of Cr(III) oxide. Several elongated precipitates were
seen on the surface of the coated alloys (Fig. 3.7). This is attributed to the pH increase
(Fig. 3.3) that leads to precipitation of Cr(III) oxide species, e.g., Cr2O3, Cr(OH)3, and or
CrOOH, during formation of the coatings. Cr exists as Cr(III) oxides in the TCP coating
after the overnight aging in air at room temperature (Fig. 3.6). Some Cr(VI) was seen in
the pit around the intermetallic compounds, which is attributed to transient formation of
Cr(VI) at the Cu- or Fe-rich intermetallic sites where is not completely dried after
overnight aging. More details of transient formation of Cr(VI) in the TCP coating will be
discussed in the next chapter.
68
3.3.3 TCP as charge transfer inhibitor
Rp is calculated at Ecorr as shown in Chapter 2. Therefore, the increased Rp
indicates a charge transfer inhibition effect by the TCP coating. The corrosion for both
anodic and cathodic reactions are reduced by blocking the active sites for Al oxidation
and O2 reduction. For example, the suppressed Cu stripping peak shown in Fig. 3.8
indicates that fewer Cu sites are exposed for the coated alloy sample and the O2
reduction is inhibited. In addition, it should be noted that the coating does not block all
the active sites completely since Rp is only ~106 Ω·cm
2 rather than ≥ 10
9 Ω·cm
2 that is
expected for a completely inert surface. The TCP-coated alloy shows a two time
constant spectrum with the high-freq time constant indicating a porous structure of the
coating (Fig. 3.10). Therefore, the coating blocks some active sites for Al oxidation and
O2 reduction but does not completely passivate the alloy surface due to the existence of
hydrated channels and or defects.
3.3.4 TCP as a poorly conductive barrier to ETR
A thin layer of oxide naturally forms on Al when exposed to the atmosphere (~10
nm thick) after deoxidation.. Furthermore, the oxide layer on Cu intermetallic sites may
not be dissolved depending on the chemical nature of the deoxidizer used. . These
oxide layers are poorly conductive and act as electronic barriers that inhibit electron
transfer (ETR).103, 110
This leads to an ilim that is weakly dependent of w0.5
and the
Levich slope that is much smaller than the predicted value when n=4 (Fig. 3.12). The
same applies to the TCP coating that also contains poorly conductive oxides, such as
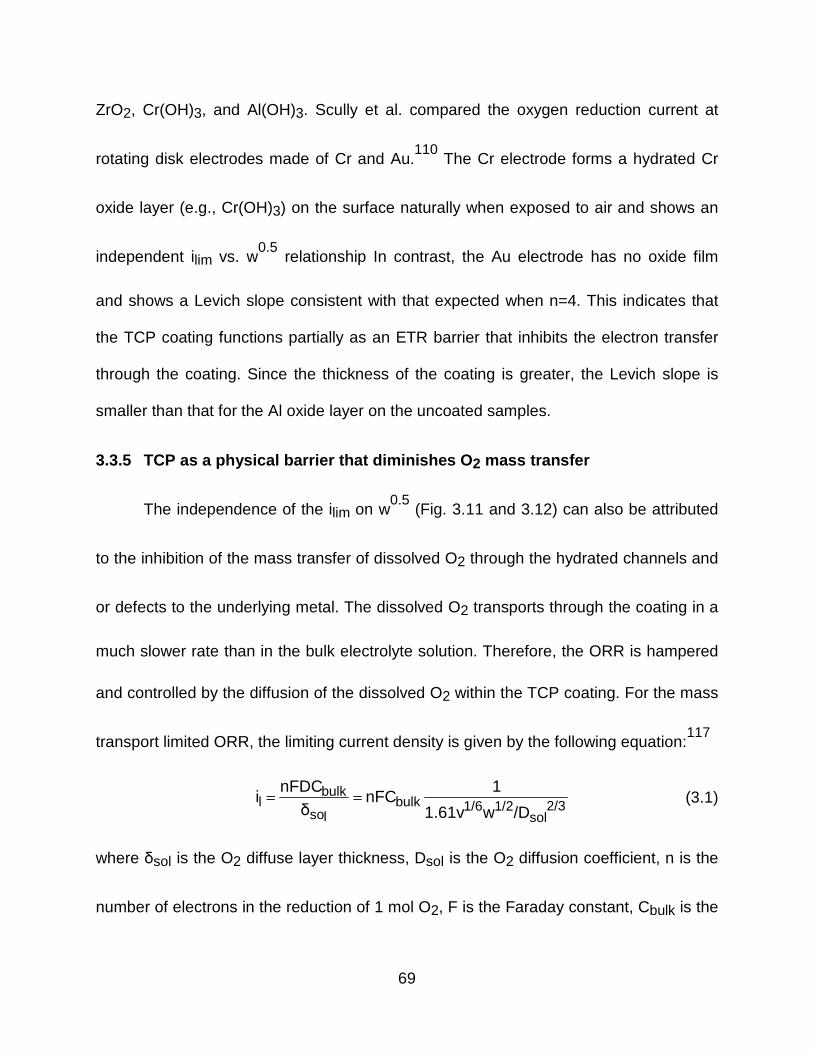
69
ZrO2, Cr(OH)3, and Al(OH)3. Scully et al. compared the oxygen reduction current at
rotating disk electrodes made of Cr and Au.110
The Cr electrode forms a hydrated Cr
oxide layer (e.g., Cr(OH)3) on the surface naturally when exposed to air and shows an
independent ilim vs. w0.5
relationship In contrast, the Au electrode has no oxide film
and shows a Levich slope consistent with that expected when n=4. This indicates that
the TCP coating functions partially as an ETR barrier that inhibits the electron transfer
through the coating. Since the thickness of the coating is greater, the Levich slope is
smaller than that for the Al oxide layer on the uncoated samples.
3.3.5 TCP as a physical barrier that diminishes O 2 mass transfer
The independence of the ilim on w0.5
(Fig. 3.11 and 3.12) can also be attributed
to the inhibition of the mass transfer of dissolved O2 through the hydrated channels and
or defects to the underlying metal. The dissolved O2 transports through the coating in a
much slower rate than in the bulk electrolyte solution. Therefore, the ORR is hampered
and controlled by the diffusion of the dissolved O2 within the TCP coating. For the mass
transport limited ORR, the limiting current density is given by the following equation:117
2/3sol
1/21/6bulklso
bulkl
/Dw1.61v
1nFC
δ
nFDCi == (3.1)
where δsol is the O2 diffuse layer thickness, Dsol is the O2 diffusion coefficient, n is the
number of electrons in the reduction of 1 mol O2, F is the Faraday constant, Cbulk is the
70
bulk concentration of the dissolved O2, v is the viscosity constant of the solution, and w
is the rotation rate of the RDE. If the transport of dissolved O2 through the TCP coating
is taken into consideration, Eq. (3.1) becomes:
TCPTCP2/3
sol1/21/6bulk
TCPTCPlsolso
bulkl
/Dδ/Dw1.61v
1nFC
/Dδ/Dδ
nFCi
+=
+= (3.2)
where δTCP is the length of the pathways that dissolved O2 diffuse from the
electrolyte/coating interface to the coating/metal interface. DTCP is the diffusion
coefficient of dissolved O2 in the TCP coating. With the assumption that n=4, F=96500
As, Cbulk=1 × 10⁻⁴
M, v=0.01 cm2/s, Dsol=1 × 10
-5 cm
2/s,
110 and δTCP is taken as the
thickness of the TCP coating (e.g., 100 nm 113
), the simulated Levich plots are shown in
Figure 3.14 as DTCP is varied between 10-5
and 10-8
cm2/s. It can be seen that the
TCP coating suppress ORR rates below the Levich predictions and ilim becomes weakly
dependent on the w0.5
. Therefore, the behavior of the TCP-coated AA2024 electrode in
Fig. 3.11B and 3.12 can be explained in part by the mass transfer inhibition of the
dissolved O2 within the TCP coating.

71
Figure 3.14 Simulated Levich plots for TCP-coated AA2024 according to Eq. (3.2) with
the assumption that n=4, F=96500 As, Cbulk=1 × 10⁻⁴
M, v=0.01 cm2/s, Dsol=1 × 10
-5
cm2/s, δTCP =100 nm. DTCP was varied from 10
-5 to 10
-8 cm
2/s.
3.4 Conclusions
Trivalent chromium process (TCP) coatings were formed on AA2024 samples
that were first degreased and deoxidized. The TCP coating in vacuum is approximately
50 nm thick and forms over most of the Al alloy surface. The true coating thickness
(hydrated conditions) is on the order of 90-100 nm. The formation of the hydrated
zirconia (ZrO2·2H2O) coating is driven by an increase in the interfacial pH caused by (i)
dissolution of the oxide layer and (ii) localized oxygen reduction at Cu-rich intermetallic
sites. The coating composition is biphasic consisting of a hydrated zirconia overlayer
and a K- and F-rich fluoroalunminate interfacial layer (K3AlF6). At least initially, Cr(OH)3
1.2
il im
(m
A/c
m2 )
0.0
0.6
0 50 40
w0.5
(rpm0.5
)
10 20 30
DTCP=10-5
cm2/s
DTCP=10-6
cm2/s
DTCP=10-7
cm2/s
DTCP=10-8
cm2/s

72
is coprecipitated with the hydrated zirconia. The Cr-rich regions of the coating are in and
around pits. The TCP coating provides both anodic and cathodic protection by
physically blocking Al-rich sites (oxidation) and Cu-rich intermetallics (reduction). This is
evidenced by the 10× greater polarization resistance for the TCP-coated alloys.
In addition, this chapter characterized the electrochemical properties of the TCP
coating on AA2024-T3 and investigated the mechanisms by which the TCP coating
inhibits corrosion. The TCP coating provides both cathodic and anodic protection as
evidenced by suppressed current density at potentials around Ecorr compared to those
for the uncoated samples. The TCP-coated AA2024-T3 exhibits an Rp that is ~10×
greater than that for the uncoated alloys, which indicates an open circuit protection. The
TCP coating protects the alloy by providing an ohmically resistant layer and serving as a
barrier to O2 diffusion to the underlying metal. However, it should be noted that the
TCP coating is not a perfect barrier layer and contains hydrated channels/pores and or
defects that allow diffusion of some dissolved O2 the underlying metal.
73
CHAPTER 4. TRANSIENT FORMATION OF CR(VI) IN TRIVAL ENT CHROMIUM PROCESS COATINGS IN AA2024-T3 PROBED BY RA MAN SPECTROSCOPY
4.1 Introduction
Chromate conversion pretreatment coatings (CCCs) are effective inhibitors of
localized pitting corrosion on high strength aluminum alloys.99-108
As a consequence,
they have been widely employed in the aerospace industry.99
Research has revealed
that CCCs possess “self-healing” capability and provide “active” corrosion protection to
the alloys, which is attributed release of a soluble Cr(VI) species (i.e. chromate) from
the coating, its transport through the solution and its action at nearby corroding sites.
Unfortunately, hexavalent Cr is highly toxic and, therefore, is a tightly-regulated
environmental pollutant. Its toxicity and carcinogenicity creates a risk to human health
and to the environment. As a consequence, there has been a focus in recent years on
developing alternate, less-toxic pretreatment coatings that provide equally effective
corrosion protection as CCCs.
The Trivalent Chromium Process (TCP) coating is the leading CCC replacement
and it provides corrosion protection to aerospace aluminum alloys, including AA2024-
T3.99, 113, 118
TCP coatings are formed by solution immersion in a bath containing
hexafluorozirconate (H2ZrF6 or K2ZrF6), trivalent chromium salts (e.g. Cr2(SO4)3), and
a fluoroborate salt (BF4-). The bath pH is maintained between 3.8 and 4.0 using
hydrofluoric (HF) or sulfuric acid (H2SO4).112, 119
Chapter 3 covered the formation,

74
structure, basic electrochemical properties of the TCP coating on AA2024-T3. The
formation of the coating is a pH-increase driven process that leads to hydrolysis of the
dissolved fluorozirconate precursor to form a hydrated zirconia (ZrO2·2H2O) coating.
The soluble Cr(III) salt in the bath also reacts with hydroxide at elevated pH to form
Cr(III) oxides (e.g. Cr2O3, Cr(OH)3, and or CrOOH) that are coprecipitated with the
hydrated zirconia.
While the coating bath contains no Cr(VI) species, a point of concern is whether
there is any transient formation of Cr(VI) in the coating during exposure to the
environment. In this work, Raman spectroscopy was used to probe for the transient
formation of Cr(VI) oxide species in the coating during full immersion testing.
Raman spectroscopy is extensively used in the material science community.
Spectral data are produced that serve as a “fingerprint” for the identification of lattice
structures in a solid and the chemical composition of a coating. The method is quite
useful for characterizing coatings that contain Cr oxide species, like CCC or TCP. Since
the Raman cross-section for Cr(VI)-O is about 3 orders of magnitude larger than that for
Cr(III)-O, the technique is sensitive to the presence of Cr(VI).120
Another advantage of
the method is that the band positions are reflective of the molecular structure and local
chemical environment. For example, the characteristic bands for Cr(VI)-O and Cr(III)-O
are easily distinguished by their peak positions: Cr(III)-O in the range of 520-580 cm-1
and Cr(VI)-O in the 840-904 cm-1
range. The Cr(III)-O band position shifts between 520
- 580 cm-1
depending on the state of hydration.121-123
Analogously, the Cr(VI)-O peak

75
position shifts depending on the interaction with other metals, such as Al, Mg, Mn, etc.
to form mixed-metal oxides.123
In this chapter, research was conducted to to answer three questions:
(1) Do Cr(VI) oxide species transiently form in the TCP and, if so, by what mechanism
do they form in the coating on AA2024?
(2) When does it form and what is the chemical environment around the Cr(VI) oxide
species ?
(3) Does the Cr(VI) oxide species provide any active corrosion protection on AA2024?
Our hypothesis regarding the formation iss that dissolved oxygen is reduced at
the Cu-rich intermetallic sites to hydrogen peroxide, H2O2, and that this H2O2 diffuses
to nearby Cr-rich sites in the coating where it oxidizes native Cr(III) in the coating to
Cr(VI). H2O2 is produced from the two-electron reduction of dissolved oxygen, as
shown below.20
Therefore, we suppose the conversion of Cr(OH)3 transiently to
chromate (CrO42-
) involves the following two steps:
O2 + 2H+ +2e
- ↔ H2O2
(4.1)
2Cr(OH)3 + 3H2O2 + 4OH- ↔ 2CrO4
2- + 8H2O (4.2)

76
4.2 Results
4.2.1 Raman spectra for reference Cr and mixed Cr/A l oxides.
Figure 4.1 presents Raman spectra for several reference chromium oxides both
as solid samples and salts dissolved in solution. Several standard solid compounds
were prepared and used to qualitatively correlate the Raman spectral features with the
chemical composition. A Cr(III)/Cr(VI) mixed oxide standard was prepared by dissolving
4.0 g Cr(NO3)3·9H2O and 0.5 g K2Cr2O7 in 50 mL H2O and then adding 1.0 M NaOH
dropwise into the stirred solution until the pH exceeded 4.5. The precipitate was then
filtered, rinsed with H2O, and dried in air at room temperature. The Al(III)/Cr(VI) mixed
oxide was prepared by adding 1.0 M NaOH dropwise to a 50 mL solution containing 0.2
M Al(NO3)3 and 0.03M K2Cr2O7. A precipitate formed at a pH above about 3. The
precipitates were filtered at different pH as the NaOH solution continued to be added.
Chromate (CrO42-
) and dichromate (Cr2O72-
) are easily distinguished when dissolved in
0.1 M solutions (Fig. 4.1-a, b). Both exhibit a strong Cr(VI)-O peak in the 840-904 cm-1
range. The Cr(VI)-O band frequency shifts depending on the local environmental pH.124
For example, at high pH (pH=9.36 for 0.1 M K2CrO4), Cr(VI) exists primarily as CrO42-
that is characterized by a peak at 847 cm-1
(Fig. 4.1-a). At low pH (pH=4.10 for 0.1M
K2Cr2O7), Cr(VI) exists as Cr2O72-
with a characteristic peak at 904 cm-1
(Fig. 4.1-b).
At even lower pH (pH=2-5) and with a low total concentration (below 0.002 M) of
chromate, Cr(VI) exists predominantly in HCrO4- that has a peak at 899 cm
-1.107

77
Although the equilibrium distribution of CrO42-
, HCrO4-
and Cr2O72-
is complex and
depends on the local pH, the Cr(VI)-O bands are positioned in the 840-904 cm-1
range,
which easily distinguishes them from the Cr(III)-O bands in the range of 520-580 cm-1
.
Cr2O3 and Cr(OH)3 are the two possible Cr(III) oxides in the TCP coating. Fig. 4.1-c
shows a peak at 540 cm-1
for the reference Cr2O3 and Fig. 4.1-d shows a broad peak
at 530 cm-1
for Cr(OH)3. The difference in band shape and peak position is due to
differential states of hydration.101, 121, 123 The 1048 cm
-1 peak in Fig. 4.1-d is attributed
to the N-O bond in the Cr(NO3)3 salt that was used to prepare the solid.121
It should be
noted that Raman scattering cross-section for Cr(III)-O is considerably smaller than that
for Cr(VI)-O.120
Therefore, the relative intensity of Cr(III)-O to Cr(VI)-O peaks is not a
quantitative indicator of the Cr(III)/Cr(VI) ratio. These reference spectra were used as
“fingerprints” to identify and distinguish Cr(III)-O and Cr(VI)-O species spatially in the
TCP coating.
Spectra for two mixed oxides, Cr(III)/Cr(VI) and Al(III)/Cr(VI), were also recorded
and are shown in Fig. 4.1-e and f. These mixed oxides were prepared as described in
the Experimental section. The Cr(III)/Cr(VI) mixed oxide is the main chemical
constituent in the CCC, while the Al(III)/Cr(VI) mixed oxide is considered to be the
corrosion product in the CCC-coated alloys.107
For the Cr(III)/Cr(VI) mixed oxide, the
Cr(VI)-O peak is centered at 860 cm-1
and does not shift with pH. The pH
independence of this band position can be used to distinguish a Cr(III)/Cr(VI) from

78
Al(III)/Cr(VI) mixed oxide. Figure 4.1-f presents a spectrum for Al(III)/Cr(VI) at pH 5.3.
The Cr(VI)-O peak at 874 cm-1
shifts to lower frequency with increasing pH (e.g. 847
cm-1
at 7.8 in Fig. 4.1-g).
Figure 4.1 Raman spectra for reference chromium compounds: (a) 0.1M K2CrO4
solution, (b) 0.1M K2Cr2O7 solution, (c) Cr2O3 pasted with water, (d) Cr(OH)3 salt, (e) Cr(III)/Cr(VI) mixed oxide, (f) Al(III)/Cr(VI) mixed oxide at pH 4.2 and (g) at pH 7.8. The spectra were obtained using Chromex Raman 2000 using a 532 nm, 20 mW power
laser. The integration time was 3-10 s. The 1048 cm-1
peak in (d) is attributed to NO3-
in Cr(NO3)3 that is used to prepare Cr(OH)3.
847
904
536
526 1048
860
874
847
a
b
c
d
e
f
g
400 600 800 1000 1200
Raman Shift (cm-1
)
Inte
nsity
(a.
u.)

79
Figure 4.2 shows the pH dependence of the Cr(VI)-O peak position for mixed
oxides of Al(III)/Cr(VI) and Cr(III)/Cr(VI). These were formed by dropwise addition of
NaOH, as described in the Experimental section. For Al(III)/Cr(VI), the Cr(VI)-O peak
position shifts from 904 cm-1
to 847 cm-1
as the pH is increased from 3.5 to 7.8. In
contrast, the Cr(VI)-O peak for Cr(III)/Cr(VI) is independent of pH at 860 cm-1
. It has
been reported that the Cr(VI)-O peak for Al(III)/Cr(VI) has multiple components at 847,
874 and 904 cm-1
whose intensities vary with the pH.107
It was observed in our work
that the position of the predominant peak shifts from 904 to 847 cm-1
with increasing pH
with an asymmetric band shape for the Al(III)/Cr(VI) mixed oxide.
Figure 4.2 Raman band frequency of Cr(VI)-O bonds vs. pH for the mixed oxides of Al(III)/Cr(VI) and Cr(III)/Cr(VI).
Al(III)/Cr(VI) mixed oxide Cr(III)/Cr(VI) mixed oxide
pH 3 4 5 6 7 8
920
900
840
880
860 Ram
an S
hift
(cm
-1)

80
4.2.2 Transient formation of Cr(VI) caused by H 2O2.
An important question to answer is by what chemical reaction does the Cr(VI)-O
species form from the Cr(III) oxide in the coating. We hypothesized that Cr(III) is
oxidized to Cr(VI) by H2O2 that is produced by the two-electron reduction of dissolved
oxygen at nearby Cu-rich intermetallic sites. To determine if this reaction is possible, we
coated two AA2024 samples with TCP. One was aged one overnight under a vacuum
while the other aged in the laboratory air for the same period of time. Both samples
were aged at room temperature. Our hypothesis was that if O2 availability was limited
(in vacuo) then the corresponding level of H2O2 would be limited in the hydrated
coating and there would be little oxidation of Cr(III) to Cr(VI)-O. In other words, no
Cr(VI)-O peak was expected in the Raman spectrum for the sample aged in vacuo.
Multiple spectra were acquired across the TCP-coated surfaces and two
representatives are shown in Figure 4.3. The Cr(VI)-O peak, centered at 854 cm-1
was
often detected in and around the pits on the sample aged in air while no such peak was
found in the coating aged in vacuo. For the latter, only the Cr(III)-O peak at 538 cm-1
was observed. The 438 and 680 cm-1
peaks are associated with Cu-O bonds of the Cu-
rich intermetallic compound.125-127
No evidence of any Cr(VI)-O species was found
when probing the coated sample aged in vacuum. This confirms the involvement of
dissolved oxygen in the transient formation of Cr(VI), likely through the production of
H2O2.

81
Figure 4.3 Raman spectra for the TCP-coated samples aged (a) in air and (b) in vacuum at room temperature overnight. Spectra were acquired within the pitted areas.
Figure 4.4 Raman spectra for the TCP-coated samples immersed in 0.5 M NaCl (a) with and (b) without oxygen for three days. Spectra were acquired on the terrace near the pits.
100
853 680
535
438
538
400 600 800 1000 1200
Raman Shift (cm-1
)
Inte
nsity
(a.
u.)
b
a
400 600 800 1000 1200
Raman Shift (cm-1
)
Inte
nsity
(a.
u.)
100
860 520
a
b

82
To further confirm the importance of dissolved O2 in the conversion of Cr(III)-O to
Cr(VI)-O, we coated another two samples and immersed them for 3 days in 0.5 M NaCl,
with and without dissolved O2. After immersion and prior to Raman analysis, the
samples were rinsed for 10 s in ultrapure water. The sample immersed in the air-
saturated solution was then dried in the laboratory air (room temperature) for 30 min.
The sample immersed in the O2-free solution was dried for the same period of time in
vacuo at room temperature. Figure 4.4-a shows that the 860 cm-1
Cr(VI)-O band forms
during immersion in the air-saturated solution but does not in the deaerated solution.
For the sample immersed in the air-saturated electrolyte, both the Cr(VI)-O peak and
the Cr(III)-O peak are present, consistent with the formation of a mixed oxide. In
contrast, the spectrum for the sample immersed in the deaerated electrolyte shows only
the Cr(III)-O peak at 520 cm-1
. These results further confirm the necessary role of
dissolved oxygen in the transient formation of Cr(VI) in the TCP coating
To test how effective (kinetically) H2O2 is at oxidizing Cr(III) to Cr(VI), we coated
three alloys and immersed each in an air-saturated 0.5 M Na2SO4 containing a
different concentrations of H2O2 (0.01, 0.1 and 1% (v/v)). Our hypothesis was that the
Cr(VI)-O peak intensity would increase proportionally with the H2O2 solution
concentration if this oxidant acts rapidly to oxidize Cr(III)-O. The immersion period was
1 h in each solution. A TCP-coated sample immersed in H2O2-free 0.5M Na2SO4 for
the same period of time was used as the control. Before acquiring Raman spectra, the

83
samples were removed from the immersion solution, rinsed in tap water for 30 s and
aged in the in air for 30 min. Spectra were acquired on the terrace sites near pits about
10 µm in diameter Figure 4.5 shows that the Cr(VI)-O peak at 860 cm-1
increases
proportionally with the H2O2 concentration. The sample immersed in H2O2-free Na2O4
solution has no significant Cr(VI)-O peak intensity. These results confirm the ability of
H2O2 to rapidly oxidize Cr(III) to Cr(VI) in the coating.
Figure 4.5 Raman spectra of the TCP-coated samples immersed in 0.5M Na2SO4
added with H2O2 by (a) 1%, (b) 0.1% and (c) 0.011% (v/v). Spectra were recorded on the terrace near the pits. (d) A spectrum recorded on the terrace of a coated sample
immersed in 0.5 M non-H2O2 Na2SO4.
400 600 800 1000 1200
Raman Shift (cm-1
)
Inte
nsity
(a.
u.)
100 860 a
b
c
d

84
4.2.3 TCP-coated AA2024 samples before immersion te sting.
After coating with TCP, samples were aged overnight in air at room temperature.
It is supposed that coatings are hydrated during the aging period, which airs facilitates
O2 dissolution into the coating. This is followed by reduction of at least some of the O2
to H2O2 at the Cu intermetallic sites and this product then locally oxidizes Cr(III) in the
coating to Cr(VI). Figure 4.6A shows a SEM micrograph of a coated AA2024 sample
after overnight aging. The surface, typical of all coated samples investigated (n>10), is
characterized by three distinct features: (a) a large pit (~10 µm diam.), (b) relatively
smooth terrace sites with no damage and (c) several elongated precipitates (~1 µm)
distributed over the undamaged terrace sites. Raman spectra were recorded from each
of these three sites and representative ones are shown in Figure 4.6B. The TCP-coated
AA2024 sample contains two types of pits. One type contains Cu-rich intermetallic
compounds and the other is devoid of Cu.128-129
There is a characteristic spectrum for
each. Figure 4.6B-a1 shows the spectrum acquired at a Cu-rich pit. The two sharp
peaks at 434 and 680 cm-1
are attributed to Cu-O vibrations.125-127
The broad peak at
556 cm-1
is attributed to a Cr(III)-O bond from either Cr(OH)3 or α-CrOOH. This is
evidence that the TCP coating forms on at least some of the Cu-rich intermetallic sites,
consistent with our previously reported EDX results (Chapter 3). The 854 cm-1
peak
arises from a Cr(VI)-O bond presumably produced from the oxidation of Cr(III) in the
coating by H2O2. Figure 4.6B-a2 is the spectrum acquired from a pit devoid of Cu.
Consequently, there are no 434 or 680 cm-1
peaks seen. The weak 556 cm-1
peak is

85
attributed to Cr(III)-O. A spectrum recorded from a terrace site is shown in Figure 4.5B-b
and contains only the Cr(III)-O peak at 520 cm-1
. Figure 4.6B-c shows a typical
spectrum acquired at one of the elongated precipitate particles. The broad peak at 536
cm-1
is due to the hydrated Cr(III) oxide in the TCP coating. Both Cr(OH)3 and α-
CrOOH have an amorphous structure.130-131
The length of Cr(III)-O bond varies as OH
or H2O is incorporated. Thus, Cr(VI) can even transiently form near the Cu-rich
intermetallic phases during overnight aging. Spectra for AA2024 samples, bare and
coated with the non-chrome containing Alodine® 5200, are also presented in Figs.
4.6B-d and 4.6B-e for comparison. Both are featureless within the spectral window, as
expected. The take-home message is that Cr(VI) oxide species can transiently form in
the TCP coating even during overnight aging. However, the Cr(VI) species are localized
near Cu-rich intermetallic sites presumably due to the confined nature of the pockets of
water in the hydrated coating.
Spectra for the TCP-coated samples aged in the laboratory air for 15 days were
also studied (data not shown here). Spectral features similar to those shown in Figure
4.6 were found. The Cr(VI)-O peak in the 840-904 cm-1
range always accompanied the
Cu-O peaks at 434 and 680 cm-1
. Spectra from the coating in pits devoid of Cu and on
the Al terrace sites contain only the Cr(OH)3 or α-CrOOH peak in the 520-580 cm-1
range.
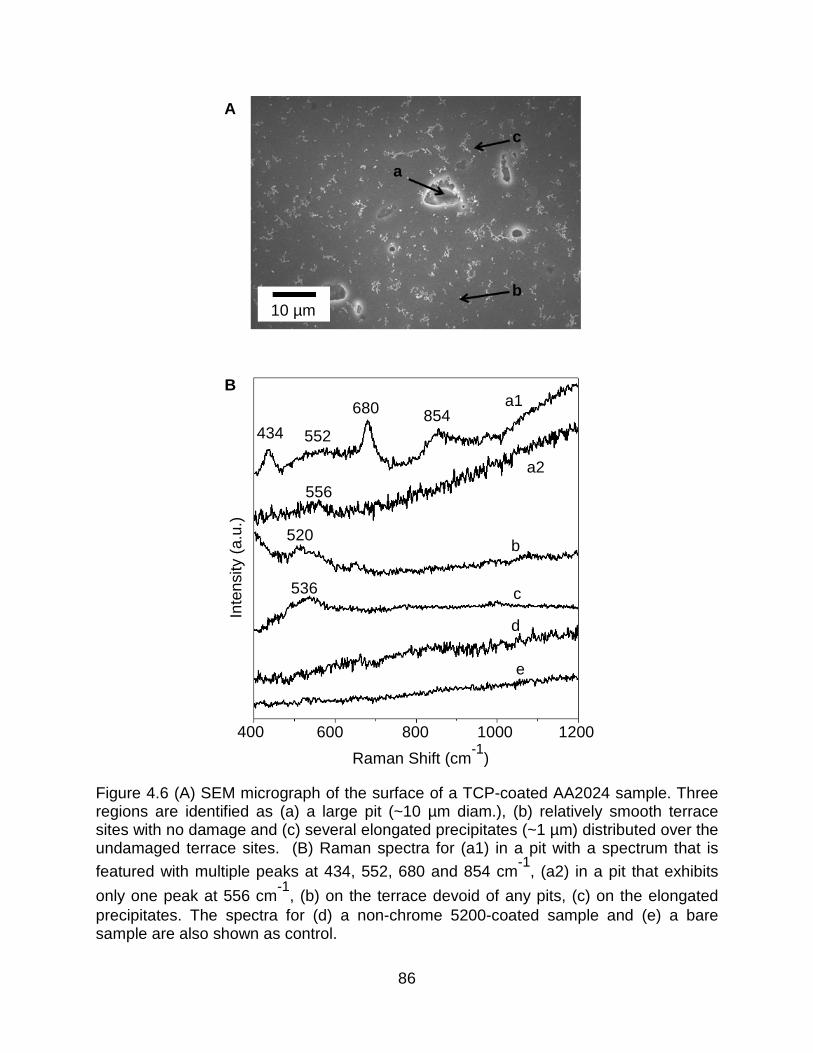
86
Figure 4.6 (A) SEM micrograph of the surface of a TCP-coated AA2024 sample. Three regions are identified as (a) a large pit (~10 µm diam.), (b) relatively smooth terrace sites with no damage and (c) several elongated precipitates (~1 µm) distributed over the undamaged terrace sites. (B) Raman spectra for (a1) in a pit with a spectrum that is
featured with multiple peaks at 434, 552, 680 and 854 cm-1
, (a2) in a pit that exhibits
only one peak at 556 cm-1
, (b) on the terrace devoid of any pits, (c) on the elongated precipitates. The spectra for (d) a non-chrome 5200-coated sample and (e) a bare sample are also shown as control.
400 600 800 1000 1200
Raman Shift (cm-1
)
Inte
nsity
(a.
u.)
854 680
520
536
b
a1
b
c
d
e
a2
434 552
556
a
c
10 µm
A
B

87
4.2.4 Transient formation of Cr(VI) during immersio n testing.
After the typical overnight aging in air at room temperature, the TCP-coated
samples were then immersed in air-saturated 0.5 M NaCl solution for 30 days. Spectra
were recorded at different times during the immersion period. At the time of
measurement, each sample was removed from the solution, rinsed with tap water for 10
s and dried in air for 30 min. Figure 4.7 shows representative spectra acquired at a pit
and on the terrace sites after 3 days. The spectrum in Figure 4.7-a has multiple peaks
reflective of the formation of both Cr(OH)3 or α-CrOOH (556 cm-1
) and Cr(VI)-O (847
cm-1
) near a Cu-rich intermetallic site (434 and 680 cm-1
). In contrast, in pits devoid of
Cu, the spectrum has only the Cr(VI)-O peak at 860 cm-1,as shown in Figure 4.7-b.
Contrary to the samples aged in air, the Cr(VI)-O peak is found in most pits regardless
of the presence of Cu during full solution immersion. Spectra in Figure 4.7-c and d were
acquired at a terrace site and from an elongated precipitate particle (Fig. 4.6),
respectively. Both exhibit both a Cr(III)-O peak at 520 cm-1
and a Cr(VI)-O peak at 860
cm-1
, which is the suggestion of a mixed oxide. Figure 4.7-e shows a spectrum for the
mixed Cr(III)/Cr(VI) oxide that contains a symmetric peak at 860 cm-1
. As a control, an
uncoated AA2024 sample was immersed in the air-saturated 0.5M NaCl for 30 days,
removed and rinsed with tap water for 10 s, and then dried under flow N2 at room
temperature. Figure 4.7-f is a spectrum for this sample. No peaks are present, as
expected. These results indicate that under full immersion, Cr(VI)-O and mixed
Cr(III)/Cr(VI) oxides can form in areas outside of the immediate Cu-rich intermetallic

88
region. The bulk solution allows H2O2 produced locally at the Cu-rich intermetallic sites
to diffuse away from these sites and oxidize Cr(III) in the coating at locations remote of
the intermetallic.
Figure 4.7 Raman spectra for the TCP-coated AA2024 immersed in naturally aerated 0.5 M NaCl for 3 days. They were acquired (a) in a pit that contains a Cr-rich intermetallic particle, (b) in a pit devoid of Cu and (c) at a terrace site, and (d) on an elongated precipitate. Relevant reference spectra of (e) a Cr(III)/Cr(VI) mixed oxide and (f) a bare sample are shown as control.
847
680
520
520
b
c
d
a 434 552
860
e
f
860
860
860
400 600 800 1000 1200
Raman Shift (cm-1
)
Inte
nsity
(a.
u.)

89
Figure 4.8A shows the Cr(VI)-O 860 cm-1
peak area for TCP-coated AA2024 as
a function of the immersion time in (a) air-saturated 0.5 M Na2SO4, (b) air-saturated 0.5
M NaCl and (c) a 0.5 M NaCl solution that was re-oxygenated daily. Prior to recording
the spectra, a sample was removed from the immersion solution, rinsed with tap water
for 10 s and then aged in air for 30 min. Each datum represents the average and
standard deviation of spectral recordings from 5 different locations on a sample. The
spectra were recorded at terrace sites near to but outside of pits. Two trends are seen
for all the samples: (i) the Cr(VI)-O peak area increases rapidly within the first five days
of immersion before reaching a relatively constant level for the remainder period, and (ii)
the peak intensity is larger for the sample immersed in 0.5 M NaCl than the sample in
0.5M Na2SO4. Additionally, the sample immersed in a 0.5 M NaCl solution that was
refreshed with dissolved O2 daily exhibits the largest Cr(VI) peak area (i.e., greatest
coating content) over the immersion period. The stability of the peak area after the first
five days suggests that the transiently formed Cr(VI) content in the coating is stable at
least under these immersion test conditions.
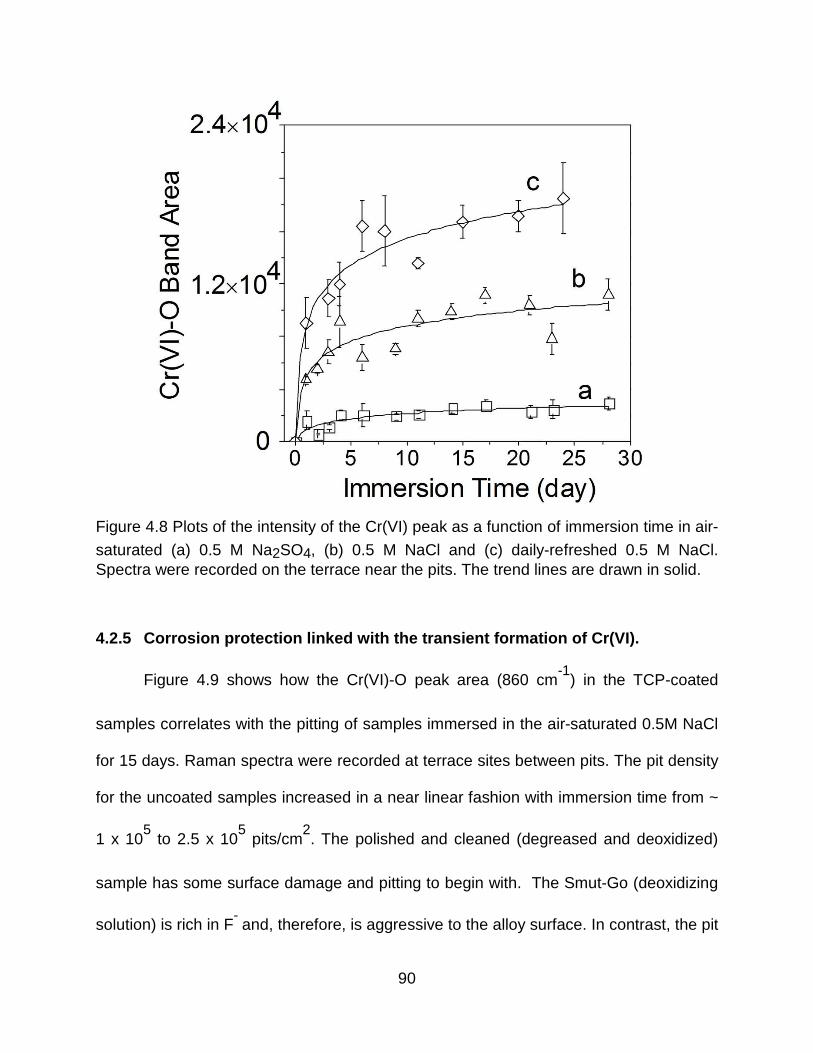
90
Figure 4.8 Plots of the intensity of the Cr(VI) peak as a function of immersion time in air-
saturated (a) 0.5 M Na2SO4, (b) 0.5 M NaCl and (c) daily-refreshed 0.5 M NaCl. Spectra were recorded on the terrace near the pits. The trend lines are drawn in solid.
4.2.5 Corrosion protection linked with the transien t formation of Cr(VI).
Figure 4.9 shows how the Cr(VI)-O peak area (860 cm-1
) in the TCP-coated
samples correlates with the pitting of samples immersed in the air-saturated 0.5M NaCl
for 15 days. Raman spectra were recorded at terrace sites between pits. The pit density
for the uncoated samples increased in a near linear fashion with immersion time from ~
1 x 10⁵ to 2.5 x 10
5 pits/cm
2. The polished and cleaned (degreased and deoxidized)
sample has some surface damage and pitting to begin with. The Smut-Go (deoxidizing
solution) is rich in F- and, therefore, is aggressive to the alloy surface. In contrast, the pit

91
density on the coated samples remained relatively constant at ~ 1 x 10⁵ pits/cm
2. The
Cr(VI)-O peak area (860 cm-1
) increased with time but the pit density remained
relatively constant. The results suggest there is a correlation between the formation of
Cr(VI)-O species and pitting resistance.
Figure 4.9 Profiles of pit density and band areas of Cr(VI)-O vs. immersion time on the TCP-coated AA2024 samples immersed in the air-saturated 0.5 M NaCl for 15 days.
A question to consider though is, does the transiently formed Cr(VI) species
actively protect the surface? This was probed by scratch testing a TCP-coated sample.
Figure 4.10A shows an optical micrograph of a TCP-coated region of the AA2024
surface adjacent to an uncoated area. The uncoated region was produced by scratch
removal of the TCP coating with a sharp blade. The sample was then immersed in air-
saturated 0.5 M NaCl + 0.01% (v/v) H2O2 for 24 h. Due to absence of the coating, the
PD, bare PD, TCP Band area, bare Band area, TCP
Pit
Den
sity
(×
105 /c
m2 )
Cr(V
I)-O B
and Area (×
104 a.u.)
0 8 15 Immersion Time (days)
2.5
2.0
1.5
1.0
0.5
0
2.0
1.5
1.0
0.5
0

92
uncoated area corroded during immersion and a resulting circular pit (region c) with a ~
20 µm diameter is seen (Fig. 4.10A-b). Spectra from the three different spots were
recorded and are presented in Fig. 4.10B. As seen in Fig. 4.10B, the spectrum from the
scratched area prior to full immersion is featureless with no Cr(III)-O or Cr(VI)-O peaks.
In the coated area (region b), a strong 861 cm-1
peak is evident and attributed to the
formation of Cr(VI) by H2O2 (Fig. 4.10B-b). In or near the circular pit (region c), the
spectrum features a broad Cr(III)-O peak at 587 cm-1
and a Cr(VI)-O peak at 856 cm-1
(Fig. 4.10B-c), consistent with the formation of a mixed Cr(III)/Cr(VI) oxide. The origin of
the 976 cm-1
peak is unknown but the literature shows this mode is present in the
Raman spectrum for a CrO3 reference compound. The Cr(III) and Cr(VI) species
detected on the scratched surface are consistent with active transport of Cr(VI). Figure
4.10B-d shows the spectrum obtained at a terrace site in the scratched area between
the circular pit and the coated area. It has weak intensity for Cr(III)- or Cr(VI)-O. In
summary, it seems that the Cr(III) in the coating is transiently oxidized to Cr(VI) (e.g.,
CrO42-
) by locally produced H2O2. The Cr(VI) species has some mobility and can be
released into the solution. Solution CrO42-
species in the nearby solution phase can
then react at corroding sites on the aluminum alloy to produce Cr(OH)3 or α-CrOOH that
is reflected as a broad peak at 587 cm-1
.107, 124
The following reaction is proposed:
2Al + CrO42-
+ 5H+ → Cr(OH)3 + H2O + 2Al
3+ (4.3)

93
Figure 4.10 (A) Video micrograph of a scratched TCP-coated AA2024 sample after 1-
day immersion in 0.5 M NaCl + 0.01% (v/v) H2O2 solution. Afterwards, the scratched sample was rinsed in tap water for 10 s and dried in air at room temperature for 30 min before spectra recording. (B) Raman spectrum of the scratched sample before immersion and spectra after immersion (a) on the coated area, (b) in or near the pitted area in the scratched area and (c) at the terrace site in the scratched area.
A
B
10 µm
400 600 800 1000 1200
Raman Shift (cm-1
)
861
Inte
nsity
(a.
u.)
b
c
a
Before immersion
587 843 976 1085
a
b
c
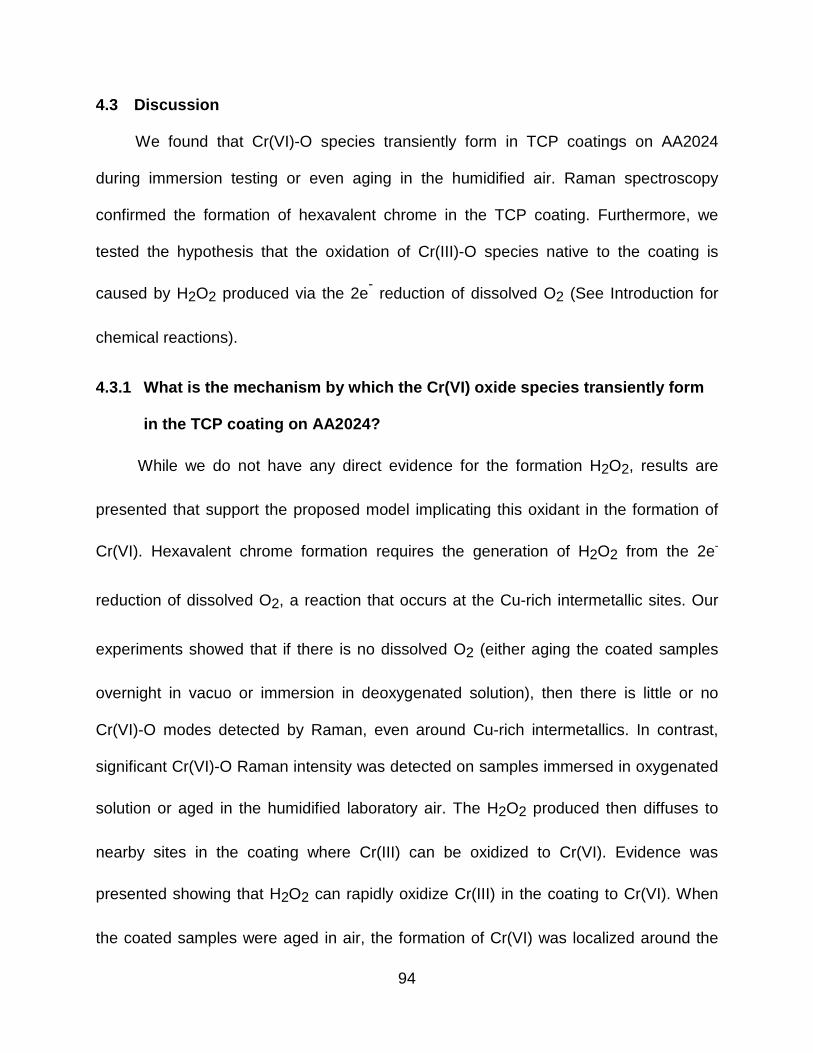
94
4.3 Discussion
We found that Cr(VI)-O species transiently form in TCP coatings on AA2024
during immersion testing or even aging in the humidified air. Raman spectroscopy
confirmed the formation of hexavalent chrome in the TCP coating. Furthermore, we
tested the hypothesis that the oxidation of Cr(III)-O species native to the coating is
caused by H2O2 produced via the 2e- reduction of dissolved O2 (See Introduction for
chemical reactions).
4.3.1 What is the mechanism by which the Cr(VI) oxi de species transiently form
in the TCP coating on AA2024?
While we do not have any direct evidence for the formation H2O2, results are
presented that support the proposed model implicating this oxidant in the formation of
Cr(VI). Hexavalent chrome formation requires the generation of H2O2 from the 2e-
reduction of dissolved O2, a reaction that occurs at the Cu-rich intermetallic sites. Our
experiments showed that if there is no dissolved O2 (either aging the coated samples
overnight in vacuo or immersion in deoxygenated solution), then there is little or no
Cr(VI)-O modes detected by Raman, even around Cu-rich intermetallics. In contrast,
significant Cr(VI)-O Raman intensity was detected on samples immersed in oxygenated
solution or aged in the humidified laboratory air. The H2O2 produced then diffuses to
nearby sites in the coating where Cr(III) can be oxidized to Cr(VI). Evidence was
presented showing that H2O2 can rapidly oxidize Cr(III) in the coating to Cr(VI). When
the coated samples were aged in air, the formation of Cr(VI) was localized around the

95
Cu-rich intermetallics. Support for this is the fact that the Raman spectra from these
sites almost always contain the 860 cm-1
Cr(VI)-O band as well as the two Cu-O bands
at 434 and 680 cm-1
for the Cu intermetallic. When aged in air, the coating likely
contains isolated pockets of water with some of these pockets being located around Cu-
rich intermetallic particles. The isolated nature of the water limitshow far from the
generation site the H2O2 can diffuse and react. The situation is different under full
immersion as a bulk water layer exists. Under these conditions, the diffusion of H2O2 is
not confined, hence Cr(VI)-O and mixed Cr(VI) oxide species were detected by Raman
spectroscopy over most areas of a coated surface, not just to regions around a Cu
intermetallic compound.
It would appear that the direct oxidation of Cr(III) to Cr(VI) by dissolved O2 is too
slow kinetically to account for the observed trends in Cr(VI) formation. Several
researchers reported that this oxidation reaction rate is slow.132
H2O2 is a stronger
oxidant than O2 (1.76 vs 1.23 V vs SHE). Pettine et al. studied the oxidation of Cr(III) in
solutions with H2O2 and concluded that this reaction controls the rate of oxidation.133-
134 H2O2 is presumably produced from the reduction of dissolved O2 by a two-electron
process. Normally, O2 reduction occurs by a four-electron pathway to water on Cu.135
However, Unwin et al. have shown that the two-electron pathway to H2O2 can be
favored on Cu under conditions of O2 high flux.136
They demonstrated this by SECM

96
measurements of O2 reduction on Cu nanoparticles of varying size. We previously
reported that the TCP coating on AA2024 has a biphasic structure consisting of a
hydrated zirconia (ZrO2·2H2O) overlayer and a K3AlF6 interfacial layer (Chapter 3). We
suppose the biphasic coating is hydrated and contains channels through which
dissolved O2 can diffuse and reach the Cu sites. In addition, we found that the Cu-rich
intermetallic sites are partially coated with defects that are on the order of several
nanometers. High rates of mass transport might be achieved at nanoscopic domains of
partially-coated Cu intermetallics.
4.3.2 What is the chemical environment around the C r(VI) oxide species that
form?
A variety of Cr(VI) oxides and mixed oxides are formed in the coating during
immersion testing or even aging in air. On the terrace sites, the Cr(III) oxide (Cr(OH)3 or
α-CrOOH) making up the elongated precipitates of the TCP coating are oxidized to
Cr(VI) or mixed Cr(III)/Cr(VI) oxides. The Cr(VI) species appears to be primarily
chromate, CrO42-
. Near pits that contain no Cu-rich intermetallic compound, Cr(VI) or a
mixed Cr(III)/Cr(VI) oxide is also produced.
In and around pits that contain a Cu-intermetallic, the chemical environment of
the chromate is quite different. Nearby Al behaves as the anode and gets oxidized to
Al3+
. The O2 reduction reaction at the Cu-rich site consumes protons and increases the
local pH in the pit. This pH changes drives the hydrolysis of Al3+
to form Al(OH)x3-x
. We

97
suppose the Al(OH)x3-x
interacts with the transiently formed Cr(VI) in or near the pits,
mediated by H2O2, and forms a mixed oxide of Al(III)/Cr(VI). Spanos et al. studied the
interaction of chromate and aluminum hydroxide, and found that in the pH range of 6.1
to 7.5, an Al(III)-O-Cr(VI) covalent bond forms when Al(OH)x3-x
and chromate (CrO42-
)
interact.137
However, in a lower pH range (< 6.0) the Al(OH)x3-x
is protonized to form
Al(OH2)x3+
that electrostatically bind anionic chromate (CrO42-
).137
The mixed oxide of
Al(III)/Cr(VI) mainly exists in the pits and may function as a reservoir for the transiently
formed Cr(VI). We suppose another storage site is on the terrace where a mixed oxide
of Cr(III)/Cr(VI) forms. The spectrum in Fig. 4.3-c features a Cr(III)-O peak at 520 cm-1
and a Cr(VI)-O peak at 860 cm-1
. Both Cr(OH)3 or α-CrOOH and chromate (CrO42-
) are
expected to co-exist in the coating.
4.3.3 Does the Cr(VI) oxide species provide any act ive corrosion protection?
The soluble chromate (CrO42-
) is expected to be more mobile during solution
immersion than the relatively insoluble Cr(OH)3 or α-CrOOH at neutral pH. The active
protection provided by the chromate (CrO42-
) in the chromate conversion coatings
(CCCs) has been discussed by Frankel et al.108
To elucidate the mechanism of action,
they performed tests in an artificial scratch cell in which a bare sample and a CCC-
coated sample are connected by a thin layer of electrolyte solution (1.8 mm gap). The
CrO42-
released from CCC populates the solution phase and can then react at

98
corroding metal sites several millimeters away. Similar to CCCs but with a much lower
concentration of Cr(VI), the transiently formed CrO42-
also appears to be released into
the solution phase.108
After the sample was immersed in a NaCl + H2O2 solution, the
Cr(VI)-O species were detected in the coating (Fig. 4.9B-a) due to the oxidation of Cr(III)
to the Cr(VI) species by H2O2. Cr(VI)-O Raman bonds were detected on the uncoated
samples consistent with some active corrosion protection. We suppose, similar to CCCs,
the stored chromate (CrO42-
) can be released into the solution phase. It can diffuse to
and react at corroding sites where it gets reduced to passivating Cr(OH)3 or α-CrOOH.
Future studies will focus on developing a greater understanding of how chromate
released from the TCP coating can actively protect aluminum alloys from corrosion.
4.4 Conclusion
Raman spectroscopy was employed to study the transient formation of Cr(VI) in a
TCP coating on AA2024-T3. The Cr(VI) formation occurs when the coated alloy is
immersed in naturally aerated electrolyte solutions or even during exposure to humid
air (aging). The formation involves two steps (Fig. 4.11). Oxygen diffuses through the
hydrated channels to the Cu-rich intermetallic sites where it gets reduced to H2O2. The
H2O2 is a strong oxidant and diffuses to nearby sites to oxidize native Cr(III) in the
coating to Cr(VI). In samples aged in the laboratory air, the Cr(VI) formation is localized
to intermetallic areas where the H2O2 is formed. When fully immersed, the locally

99
produced H2O2 can diffuse to sites remote from the pits and oxidize the Cr(III). The
Cr(VI) exists mainly in the form of chromate (CrO42-
). It combines Al3+
or Al(OH)x to
form a mixed oxide of Al(III)/Cr(VI) in the pits. Some chromate (CrO42-
) leaks into the
solution, diffuses to the terrace and binds Cr(III) to form a Cr(III)/Cr(VI) mixed oxide.
The covalent, polymeric Cr(III)/Cr(VI) mixed oxide accounts for the chemical stability of
the TCP coating. Although it is still not clear if the TCP coating provides an active
corrosion protection, but the leaking of chromate might occur during the immersion in
solutions. While there is clear transient formation of Cr(VI) in the TCP conversion
coating, it is unknown if there would be formation of this species when the conversion
coating is used in combination with a primer and topcoat (e.g., paint). Future work will
address this issue.
Figure 4.11 Schematic illustration of the mechanism for the transient formation of Cr(VI) in the TCP coating during immersion in the air-saturated solution.
O2
Cr(III)/Cr(VI)
Cu Al
Cr(III)/Cr(VI)
Cr(VI) Cr(III) Cr(III) Cr(VI)
H2O2 H2O2 Al(III)/Cr(VI) Al(III)/Cr(VI)

100
CHAPTER 5. THE FORMATION, STRUCTURE AND BASIC ELECTROCHEMICAL PROPERTIES OF TCP COATINGS ON AA606 1-T6 AND AA7075-T6
5.1 Introduction
AA6061-T6 and AA7075-T3 are high strength aluminum alloys that are widely
used in the aerospace industry. Their desirable mechanical properties result from the
combination of alloy addition and heat treatment. The regions around the Cu- and Fe-
rich intermetallic compounds are particularly prone to localized pitting corrosion. For
example, AA6061 contains mainly Fe-Si intermetallics, while AA7075 has several
intermetallic compounds including Al-Cu, Al-Fe, Al-Cu-Fe, and Al-Cu-Fe-Mg-Si, et
al.138-140
These intermetallic phases commonly exhibit distinct cathodic activity, as
compared the surrounding Al matrix, and this renders the local Al susceptible to
corrosion.140-142 For example, pitting corrosion generally begins near a noble
intermetallic phase, which acts as a cathodic site for the reduction reaction (e.g. O2
reduction), while the local Al functions as an anode with the metal being oxidized to Al3+
.
In the early stage of corrosion, the nearby Al matrix is attacked and circumferential pits
appear peripheral to the intermetallics.143
Intermetallic dealloying can also occur and
this can induce secondary corrosion where the dissolved Cu redeposits on the
surface.143-144
The Trivalent Chromium Process (TCP) coating (immersion), one of the leading
replacement alternatives for the Cr(VI)-containing chromate conversion coatings, has
been studied on AA2024-T3 as reported in the previous chapters. In Chapter 3, it was

101
shown that the formation of the TCP coating is initiated by an interfacial pH increase. It
drives hydrolysis of hexafluorozirconate in the bath to a hydrated zirconia layer that
precipitates on top of a K3AlF6 interfacial layer on the Al matrix. The biphasic coating is
on the order of 100 nm thick. The TCP coating forms across the entire sample surface
and is often enriched around the Cu-rich intermetallic sites. In Chapter 4, it was shown
that transient formation of Cr(VI) occurs in the TCP coating on AA2024 during full
immersion in corrosive electrolyte solutions. The mobile Cr(VI) species (e.g., CrO42-
)
provide some active protection. In Chapter 3, the basic electrochemical properties of
TCP coatings on AA2024 were discussed. The results revealed that the TCP coating
provides both cathodic and anodic protection by serving as a barrier layer inhibiting
contact of dissolved oxygen and solution species with the underlying metal surface.
Little information exists for TCP coatings on other high strength aluminum alloys. We
addressed this knowledge gap by the work, and present data on the formation, structure
and electrochemical properties of TCP coatings formed on AA6061-T6 and AA7075-T6.
Several key questions were addressed in this chapter:
(1) What is formation mechanism and chemical structure of the TCP coating on
AA6061 and AA7075?
(2) Is there any evidence for transient formation of Cr(VI) species under full
immersion testing and if so at what sites?
(3) Does the TCP coating provide any corrosion protection to AA6061 and AA7075
in mild and aggressive aqueous electrolyte solutions?

102
5.2 Results
5.2.1 Formation of the TCP coating
The open circuit potentials (OCP) of AA6061 and AA7075 alloy samples were
recorded during immersion formation of the TCP coating, and are presented in Figure
5.1. The profiles for both alloys are similar to each other and to the typical profile for
AA2024 (Chapter 3). The OCP for both alloys shifts cathodically to between -1.2 and -
1.3 V vs. Ag/AgCl soon after immersion. Both profiles pass through a minimum before
stabilizing at a slightly less negative potential. The cathodic shift of the alloy potential
occurs because of dissolution of the passivating oxide by the H+ and F
- ions in the bath.
This dissolution activates the metal surface by exposing the underlying aluminum. With
the metal unpassivated, corrosion of the aluminum occurs. The metal potential shifts
cathodic because of the increased rates of counterbalancing cathodic reactions:
dissolved oxygen reduction and hydrogen evolution. Both reactions consume protons
and increase in the interfacial pH. The following two reactions represent the oxide
dissolution and oxygen reduction reactions that likely occur:
O23Hx3x2AlF2xF6H3O2Al +−
→−
++
+ (6.1)
−→
−++ 4OH4eO22H2O (6.2)
The increased interfacial pH causes the hydrolysis of hexafluorozirconate and Cr(III) in
the coating bath to form a precipitating layer of ZrO2·2H2O and Cr(OH)3. The balance
between the surface processes and the precipitation of hydrated zirconia seems to
stabilize after 2-6 min, with the response being longer for AA6061. The longer period

103
before OCP stabilization of AA6061 (ca. 6 min) is probably due to a more homogeneous
and thicker passivating oxide layer than that exists on AA7075.
Figure 5.1 Ecorr vs. time profiles recorded during the formation of the TCP coating on AA6061 and AA7075 at room temperature (20-25 °C). F ull strength (100%) Alodine® 5900 RTU solution was used with the sample under full immersion.
5.2.2 Structure of the TCP coating
Figure 5.2 presents the Auger electron spectroscopy depth profilesthrough the
TCP coating on each alloy. The depth profiles into the TCP-coated AA6061 and
AA7075 are shown in Fig. 5.2A and C, respectively. The profiles are shown on an
enlarged scale in Fig. 5.2B (AA6061) and D (AA7075). For both coated alloys, the
characteristic coating elements, e.g., Zr, Cr, O, and K (elevated in the interfacial region),
are detected. As was the case for AA2024, the TCP coating on these two alloys has an
apparent biphasic structure (Chapter 3). For the first ca. 30 nm into the coating, Zr
tracks the O signal with an atomic concentration ratio (O/Zr) of about 2:1. This is
consistent with the empirical formula of dehydrated zirconia, ZrO2. In the interfacial
0 200 400 600 Time (s)
-0.5
-1.1
-0.7
-0.9
E (
V v
s A
g/A
gCl)
-1.3
AA6061 AA7075

104
region between the zirconia and the alloy, the K and Al signals increase, consistent with
a K3AlF6 interfacial layer. This interfacial region appears to be between 25-75 nm. The
overall coating thickness is greater for AA6061 than AA7075. As Fig. 5.2B and D show,
the Cr content appears to be enriched for the first 30-40 nm which is consistent with the
ZrO2 overlayer. The Cr signal then decreases with depth through the K+-rich interfacial
layer. Since the Cr signal comes from the TCP coating, the decreased Cr signal
intensity at ca. 100 nm into the TCP-coated AA6061 can be used as an indicator of the
approximate coating thickness on AA6061 (in vacuo). Similarly, the coating on AA7075
appears to be about 80 nm thick. Evidence for the thickness of the coating comes from
tracking the Ca signals. The Ca signal presumably results from the tap water rinse used
in the coating formation. We suppose that the TCP coating both on AA6061 and
AA7075, similar to the coating on AA2024 (Chapter 3), contains hydrated channels that
allow Ca2+
to penetrate the coating. It should be noted that these measurements were
made in vacuo and this causes the coating to shrink due to water loss. Therefore, the
true (hydrated) thickness on both alloys is expected to be several tens of nanometers
larger than the values estimated from these measurements.

105
Figure 5.2 Auger depth profiles for the TCP coatings on (A) AA6061 and (C) AA7075. The elemental profiles are enlarged in (B) AA6061 and (D) AA7075. Dashes lines are approximate boundaries between the hydrated zirconia overlayer and the interfacial layer at the alloy surface.
Figure 5.3 presents (A) an SEM micrograph of a TCP-coated AA6061 sample,
along with (B) energy dispersive X-ray (EDX) spectra for the coated and uncoated alloy,
and (C) line profiles for several elements across a coating. The micrograph shows that
the coated surface is fairly smooth with the exception of several elongated precipitate
particles. The line profile in this image crosses an intermetallic compound and multiple
elongated precipitate particles that are characteristic of the TCP coating (i.e., likely
precipitates from the coating solution). The intermetallic compound (left of image)
consists of mainly Fe and Si, as evidenced by elevated elemental intensities at ca. 3 µm
0 50 100
Al 60
40
20
Ato
mic
Con
cent
ratio
n (%
)
0
60
40
20
0
0 50 100
0 50 100 0 50 100
O
Zr C Ca
Cr K
Al
O
C Ca
Cr K
40
20
0
40
20
0
Al
O
Zr
C
Cr K Ca
Al O
Zr
C
Cr K Ca
A B
C D

106
(Fig. 5.3C). This intermetallic compound is about 3 µm in diameter. The signals for the
characteristic elements of the TCP coating, e.g. Zr, O, Cr and F, are present. Their
intensity tracks the Fe and Si intensities indicating the TCP coating forms on and
around the intermetallic compound. The spectrum (Fig. 5.3B) was acquired within the
red square in the micrograph, away from the intermetallic site or any elongated
precipitates. The TCP-coated sample (red) exhibits significantly stronger signals of Zr,
Cr, O, and F elements compared to a bare sample (black). The presence of these
elements indicates that coating forms across the Al matrix in between the intermetallic
compounds. Compared to the Zr and Cr signals in the line scans, the TCP coating
appears to be enriched at the intermetallic site. The Zr and O signals arise from the
zirconia and the Cr signal comes from Cr(III) oxide (see Raman spectroscopy results
below). The F signal is attributed to FeFx or SiFx that forms from the attack by F- on the
Fe-rich intermetallic during immersion in the F--rich TCP bath.
Figure 5.4A presents (A) an SEM micrograph of a TCP-coated AA7075 sample
along with (B) energy dispersive X-ray (EDX) spectra for the coated and uncoated alloy,
and (C) line profiles for several elements across an intermetallic compound and the
elongated precipitate particles of TCP. The coating on AA7075 consists of smooth
features with fewer of the elongated precipitates than are typically present in the coating
on AA6061. Two types of intermetallic compounds and surrounding features are
apparent from the data. One intermetallic is a Cu-rich one, as seen by the increased Cu
signal at 10 µm (Fig. 5.4C). A surrounding trench where the Al matrix has been
corroded is detectable. The signal intensities for Zr, O and Cr all track the Cu signal
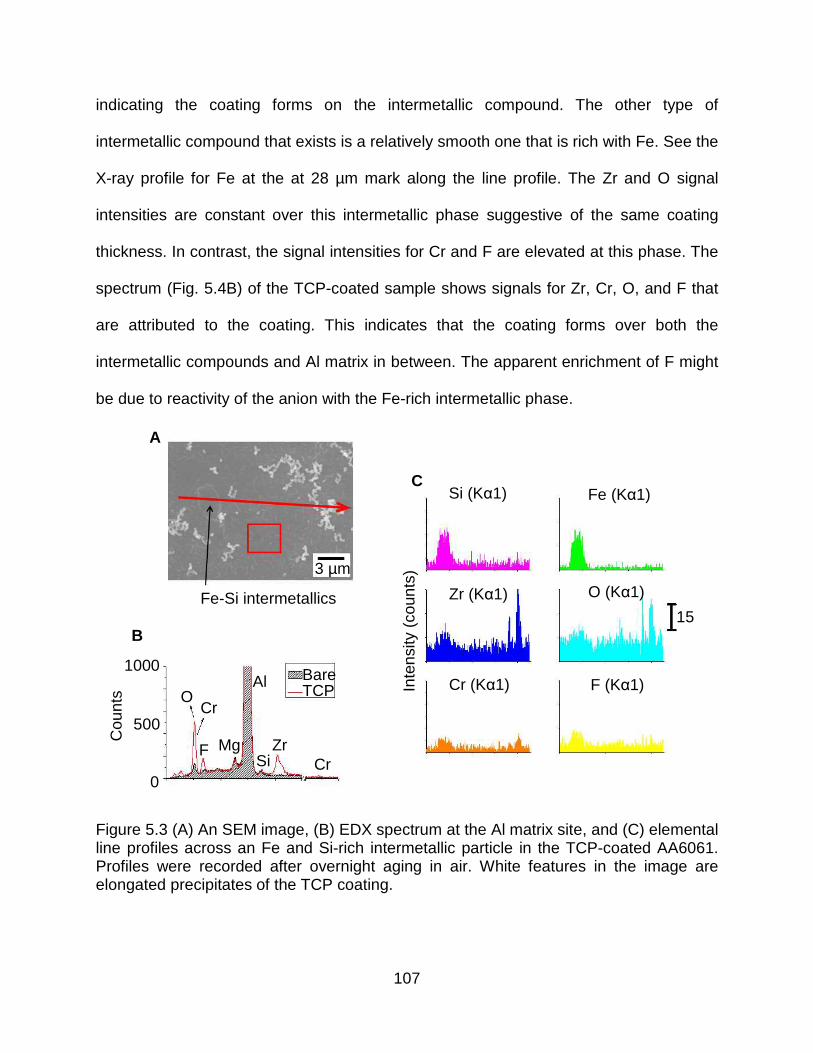
107
indicating the coating forms on the intermetallic compound. The other type of
intermetallic compound that exists is a relatively smooth one that is rich with Fe. See the
X-ray profile for Fe at the at 28 µm mark along the line profile. The Zr and O signal
intensities are constant over this intermetallic phase suggestive of the same coating
thickness. In contrast, the signal intensities for Cr and F are elevated at this phase. The
spectrum (Fig. 5.4B) of the TCP-coated sample shows signals for Zr, Cr, O, and F that
are attributed to the coating. This indicates that the coating forms over both the
intermetallic compounds and Al matrix in between. The apparent enrichment of F might
be due to reactivity of the anion with the Fe-rich intermetallic phase.
Figure 5.3 (A) An SEM image, (B) EDX spectrum at the Al matrix site, and (C) elemental line profiles across an Fe and Si-rich intermetallic particle in the TCP-coated AA6061. Profiles were recorded after overnight aging in air. White features in the image are elongated precipitates of the TCP coating.
Cou
nts
1000
500
Bare
0
TCP Al
Si Zr
Cr
O Cr
F Mg
Si (Kα1) Fe (Kα1)
O (Kα1) Zr (Kα1)
Cr (Kα1) F (Kα1)
15
Inte
nsity
(co
unts
) 3 µm
Fe-Si intermetallics
A
B
C
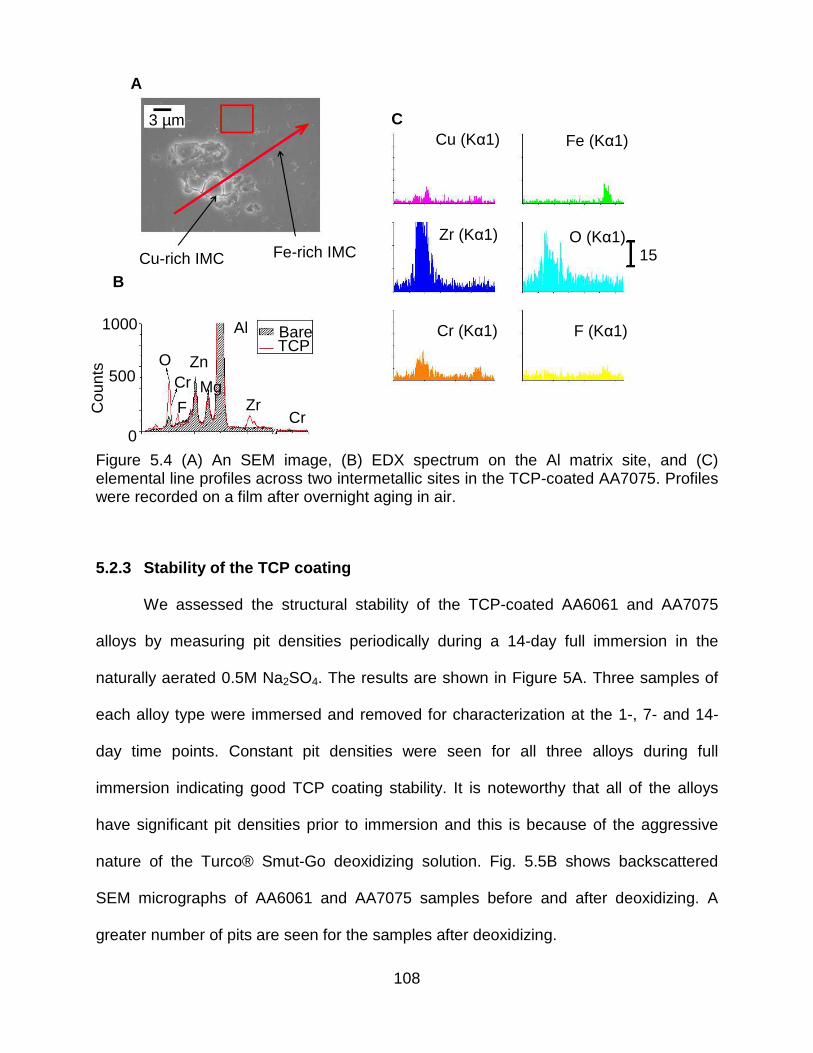
108
Figure 5.4 (A) An SEM image, (B) EDX spectrum on the Al matrix site, and (C) elemental line profiles across two intermetallic sites in the TCP-coated AA7075. Profiles were recorded on a film after overnight aging in air.
5.2.3 Stability of the TCP coating
We assessed the structural stability of the TCP-coated AA6061 and AA7075
alloys by measuring pit densities periodically during a 14-day full immersion in the
naturally aerated 0.5M Na2SO4. The results are shown in Figure 5A. Three samples of
each alloy type were immersed and removed for characterization at the 1-, 7- and 14-
day time points. Constant pit densities were seen for all three alloys during full
immersion indicating good TCP coating stability. It is noteworthy that all of the alloys
have significant pit densities prior to immersion and this is because of the aggressive
nature of the Turco® Smut-Go deoxidizing solution. Fig. 5.5B shows backscattered
SEM micrographs of AA6061 and AA7075 samples before and after deoxidizing. A
greater number of pits are seen for the samples after deoxidizing.
Cou
nts
1000
500
Bare
0
TCP Al
Cu (Kα1) Fe (Kα1)
O (Kα1) Zr (Kα1)
Cr (Kα1) F (Kα1)
15
3 µm
Cu-rich IMC
A
B
C
Fe-rich IMC
Zr Cr
O Cr
F Mg
Zn
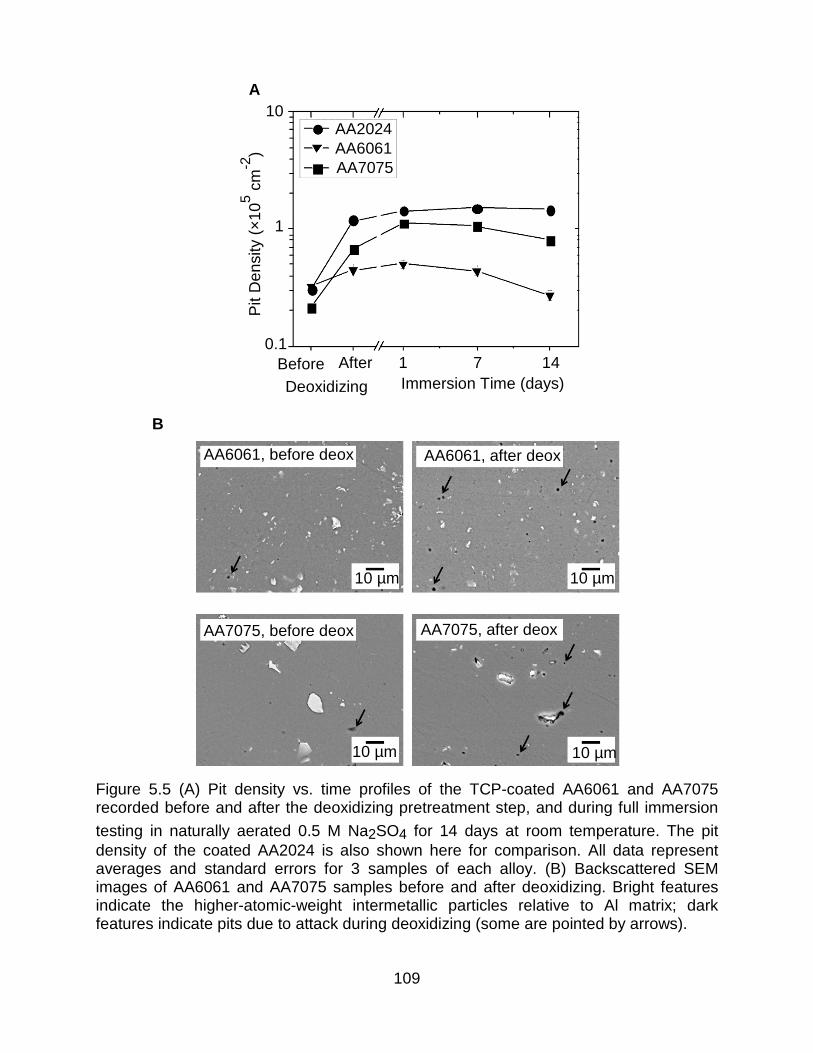
109
Figure 5.5 (A) Pit density vs. time profiles of the TCP-coated AA6061 and AA7075 recorded before and after the deoxidizing pretreatment step, and during full immersion
testing in naturally aerated 0.5 M Na2SO4 for 14 days at room temperature. The pit density of the coated AA2024 is also shown here for comparison. All data represent averages and standard errors for 3 samples of each alloy. (B) Backscattered SEM images of AA6061 and AA7075 samples before and after deoxidizing. Bright features indicate the higher-atomic-weight intermetallic particles relative to Al matrix; dark features indicate pits due to attack during deoxidizing (some are pointed by arrows).
AA2024 AA6061 AA7075
Before 1 7 14
Pit
Den
sity
(×
105 c
m-2
)
After
Deoxidizing Immersion Time (days)
10
1
0.1
A
B
AA6061, before deox
AA7075, before deox AA7075, after deox
AA6061, after deox
10 µm 10 µm
10 µm 10 µm

110
Figure 5.6 Pit density vs. time profiles recorded during full immersion testing of TCP-coated AA2024, AA6061 and AA7075 in air-saturated 0.5 M NaCl for 14 days at room temperature. Data represent averages and standard errors for 3 samples of each alloy.
5.2.4 Transient formation of Cr(VI) during immersio n
In Chapter 4, it was shown that Cr(VI) can transiently form on TCP-coated
AA2024 during full solution immersion. The same holds true for TCP-coated AA6061
and AA7075. Three samples of each alloy were immersed in the air-saturated 0.5 M
NaCl for 15 days. Spectra were collected at five spots on each sample. Figure 7
presents typical spectra acquired at a Fe-rich intermetallic site and on the terrace site
away from pit area of coated AA6061 and AA7075. The spectra acquired near an
intermetallic and on the terrace away from any intermetallic on AA6061 consists of a
symmetric 860 cm-1
peak (Fig. 5.7-a, b), which indicates the presence of a mixed
Cr(III)/Cr(VI) oxide (Fig. 5.7-e). The same applies for the spectrum acquired at a terrace
site on AA7075 (Fig. 5.7-d). In contrast, the spectrum acquired at a Cu-rich intermetallic
AA2024 AA6061 AA7075
1 7 14
Pit
Den
sity
(×
105 c
m-2
)
Immersion Time (days)
1.5
1.0
0.5
0
2.0

111
site on AA7075 consists of an asymmetric peak centered at 850 cm-1 (Fig. 5.7-c).
Additionally, there are peaks at 437 and 678 cm-1
that are attributed to Cu-O bonds
associated with the Cu-rich intermetallic compound.125-126
The varied Cr(VI)-O peak
position is caused by the interaction of the Cr(VI)-O species with Al oxides.107, 121, 145
The 850 cm-1
Cr(VI) peak in Fig. 5.7-c is identified as the Al(III)/Cr(VI) mixed oxide at
pH 7.40 (Fig. 5.7-f).
Figure 5.7 Raman spectra recorded at (a) an Fe-rich intermetallic site and (b) the terrace near but outside the pit on the TCP-coated AA6061, (c) a Cu-rich intermetallic site and (d) the terrace outside the pit on the coated AA7075, all after full immersion in naturally aerated 0.5 M NaCl for 15 days. Spectra for (e) the Cr(III)/Cr(VI) mixed oxide and (f) the Al(III)/Cr(VI) mixed oxide (pH 7.40) are also shown for comparison.
400 600
In te
nsity
(a.
u.)
Raman Shift (cm-1
) 800 1000 1200
a
b
c
d
e
f
860
860
850 678 536 437
860
860
850
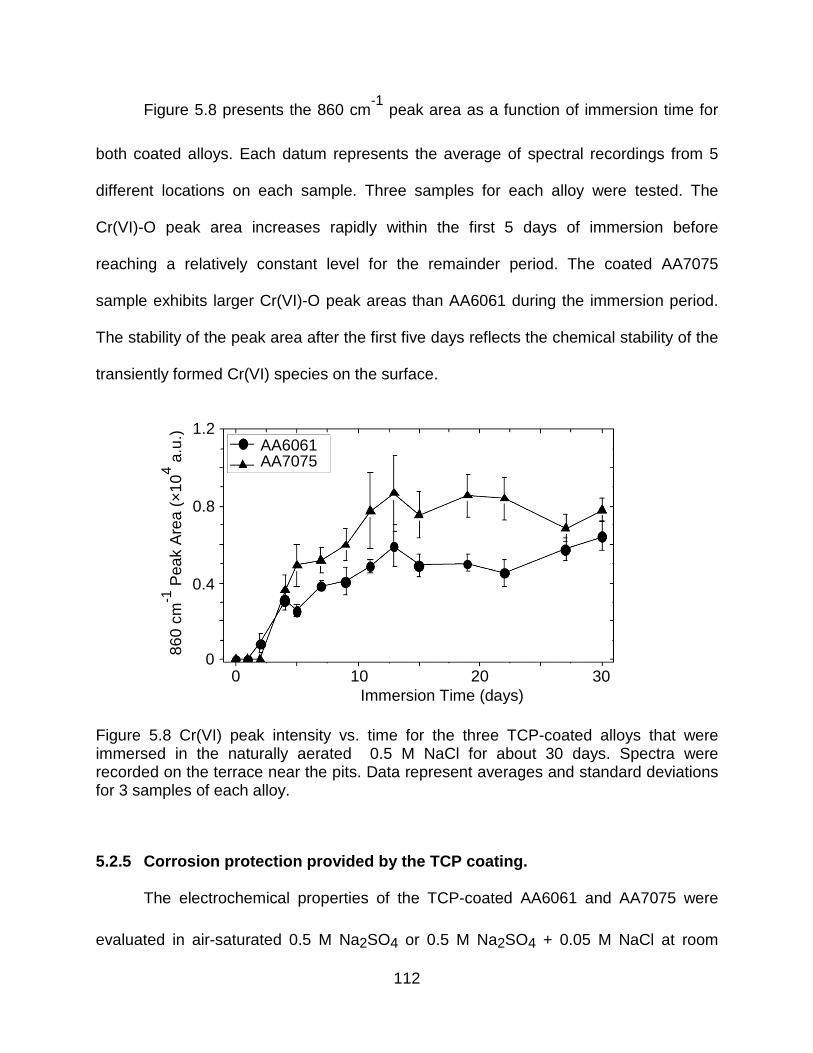
112
Figure 5.8 presents the 860 cm-1
peak area as a function of immersion time for
both coated alloys. Each datum represents the average of spectral recordings from 5
different locations on each sample. Three samples for each alloy were tested. The
Cr(VI)-O peak area increases rapidly within the first 5 days of immersion before
reaching a relatively constant level for the remainder period. The coated AA7075
sample exhibits larger Cr(VI)-O peak areas than AA6061 during the immersion period.
The stability of the peak area after the first five days reflects the chemical stability of the
transiently formed Cr(VI) species on the surface.
Figure 5.8 Cr(VI) peak intensity vs. time for the three TCP-coated alloys that were immersed in the naturally aerated 0.5 M NaCl for about 30 days. Spectra were recorded on the terrace near the pits. Data represent averages and standard deviations for 3 samples of each alloy.
5.2.5 Corrosion protection provided by the TCP coat ing.
The electrochemical properties of the TCP-coated AA6061 and AA7075 were
evaluated in air-saturated 0.5 M Na2SO4 or 0.5 M Na2SO4 + 0.05 M NaCl at room
860
cm-1
Pea
k A
rea
(×10
4 a.u
.)
0 10 Immersion Time (days)
20 30
AA6061 AA7075
0
0.4
0.8
1.2
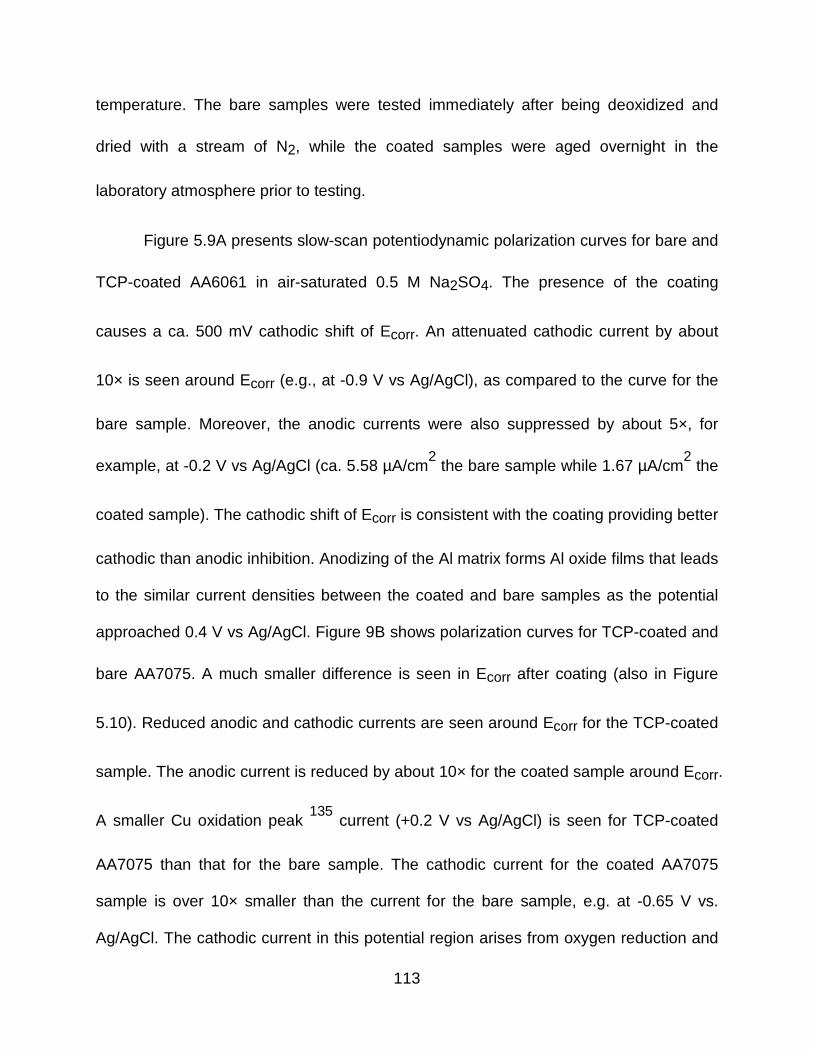
113
temperature. The bare samples were tested immediately after being deoxidized and
dried with a stream of N2, while the coated samples were aged overnight in the
laboratory atmosphere prior to testing.
Figure 5.9A presents slow-scan potentiodynamic polarization curves for bare and
TCP-coated AA6061 in air-saturated 0.5 M Na2SO4. The presence of the coating
causes a ca. 500 mV cathodic shift of Ecorr. An attenuated cathodic current by about
10× is seen around Ecorr (e.g., at -0.9 V vs Ag/AgCl), as compared to the curve for the
bare sample. Moreover, the anodic currents were also suppressed by about 5×, for
example, at -0.2 V vs Ag/AgCl (ca. 5.58 µA/cm2 the bare sample while 1.67 µA/cm
2 the
coated sample). The cathodic shift of Ecorr is consistent with the coating providing better
cathodic than anodic inhibition. Anodizing of the Al matrix forms Al oxide films that leads
to the similar current densities between the coated and bare samples as the potential
approached 0.4 V vs Ag/AgCl. Figure 9B shows polarization curves for TCP-coated and
bare AA7075. A much smaller difference is seen in Ecorr after coating (also in Figure
5.10). Reduced anodic and cathodic currents are seen around Ecorr for the TCP-coated
sample. The anodic current is reduced by about 10× for the coated sample around Ecorr.
A smaller Cu oxidation peak 135
current (+0.2 V vs Ag/AgCl) is seen for TCP-coated
AA7075 than that for the bare sample. The cathodic current for the coated AA7075
sample is over 10× smaller than the current for the bare sample, e.g. at -0.65 V vs.
Ag/AgCl. The cathodic current in this potential region arises from oxygen reduction and
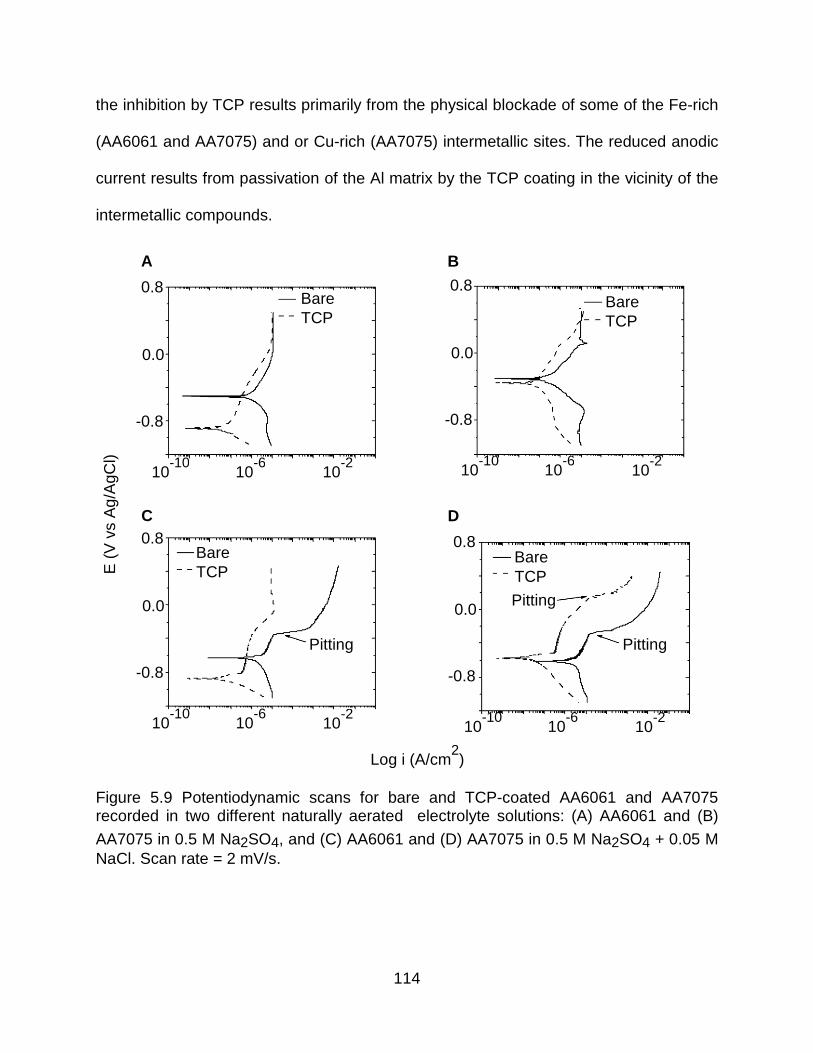
114
the inhibition by TCP results primarily from the physical blockade of some of the Fe-rich
(AA6061 and AA7075) and or Cu-rich (AA7075) intermetallic sites. The reduced anodic
current results from passivation of the Al matrix by the TCP coating in the vicinity of the
intermetallic compounds.
Figure 5.9 Potentiodynamic scans for bare and TCP-coated AA6061 and AA7075 recorded in two different naturally aerated electrolyte solutions: (A) AA6061 and (B)
AA7075 in 0.5 M Na2SO4, and (C) AA6061 and (D) AA7075 in 0.5 M Na2SO4 + 0.05 M NaCl. Scan rate = 2 mV/s.
E (
V v
s A
g/A
gCl)
10-10
-0.8
0.0
0.8
10-6
10-2
Log i (A/cm2)
10-10
-0.8
0.0
0.8
10-6
10-2
10-10
-0.8
0.0
0.8
10-6
10-2
10-10
-0.8
0.0
0.8
10-6
10-2
Bare TCP
Bare TCP
Bare TCP
Bare TCP
Pitting Pitting
Pitting
C D
B A

115
Polarization curves for the two alloys were also recorded in naturally aerated 0.5
M Na2SO4 + 0.05 M NaCl, as shown in Figure 5.9C for AA6061 and Figure 5.9D for
AA7075. Similar to the Na2SO4 results, the cathodic and anodic currents for the coated
alloys are suppressed around Ecorr by about 10× or more. In addition, due to the
presence of Cl-, the alloys are susceptible to pitting. The bare alloy samples have pitting
potentials, Epit, of -0.343 V vs Ag/AgCl for AA6061 and -0.269 V vs. Ag/AgCl for
AA7075. At potentials slightly positive of Epit, the current densities for both bare alloys
increase rapidly by 3 orders of magnitude. Importantly, the TCP coating provides some
inhibition to pitting by Cl-. For example, Epit for TCP-coated AA7075 is positively-shifted
by ~400 mV to ca. 0.171 V vs Ag/AgCl. Furthermore, TCP-coated AA6061 shows no
evidence of pitting up to an anodic limit of 0.5 V vs. Ag/AgCl for all tested samples.
Figure 5.10 presents Ecorr for the TCP-coated and bare alloy samples. These
values were collected after the samples were fully immersed in the air-saturated
electrolyte solutions for 30 min. The data for AA2024 in Na2SO4 are taken from our
previous report (Chapter 3). The coated AA2024 and AA7075 samples have Ecorr
values that are not significantly different from the bare samples in both Na2SO4 and
Na2SO4 + NaCl, according to an unpaired t-test. In contrast, Ecorr for the TCP-coated
AA6061 samples is about 400 mV negative of the value for the bare samples in Na2SO4.
Ecorr for the coated sample is about 200 mV negative of that for the bare alloy in
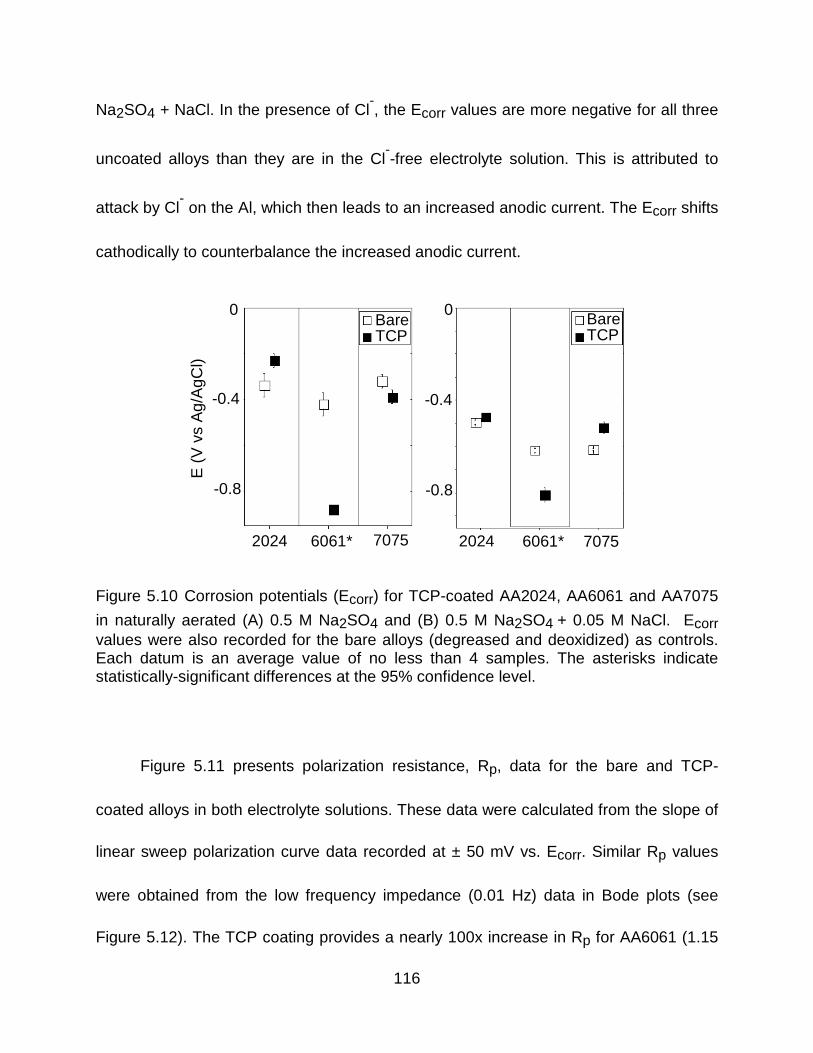
116
Na2SO4 + NaCl. In the presence of Cl-, the Ecorr values are more negative for all three
uncoated alloys than they are in the Cl--free electrolyte solution. This is attributed to
attack by Cl- on the Al, which then leads to an increased anodic current. The Ecorr shifts
cathodically to counterbalance the increased anodic current.
Figure 5.10 Corrosion potentials (Ecorr) for TCP-coated AA2024, AA6061 and AA7075
in naturally aerated (A) 0.5 M Na2SO4 and (B) 0.5 M Na2SO4 + 0.05 M NaCl. Ecorr values were also recorded for the bare alloys (degreased and deoxidized) as controls. Each datum is an average value of no less than 4 samples. The asterisks indicate statistically-significant differences at the 95% confidence level.
Figure 5.11 presents polarization resistance, Rp, data for the bare and TCP-
coated alloys in both electrolyte solutions. These data were calculated from the slope of
linear sweep polarization curve data recorded at ± 50 mV vs. Ecorr. Similar Rp values
were obtained from the low frequency impedance (0.01 Hz) data in Bode plots (see
Figure 5.12). The TCP coating provides a nearly 100x increase in Rp for AA6061 (1.15
E (
V v
s A
g/A
gCl)
-0.8
-0.4
0
-0.8
-0.4
0 Bare TCP
Bare TCP
2024 6061* 7075 2024 6061* 7075
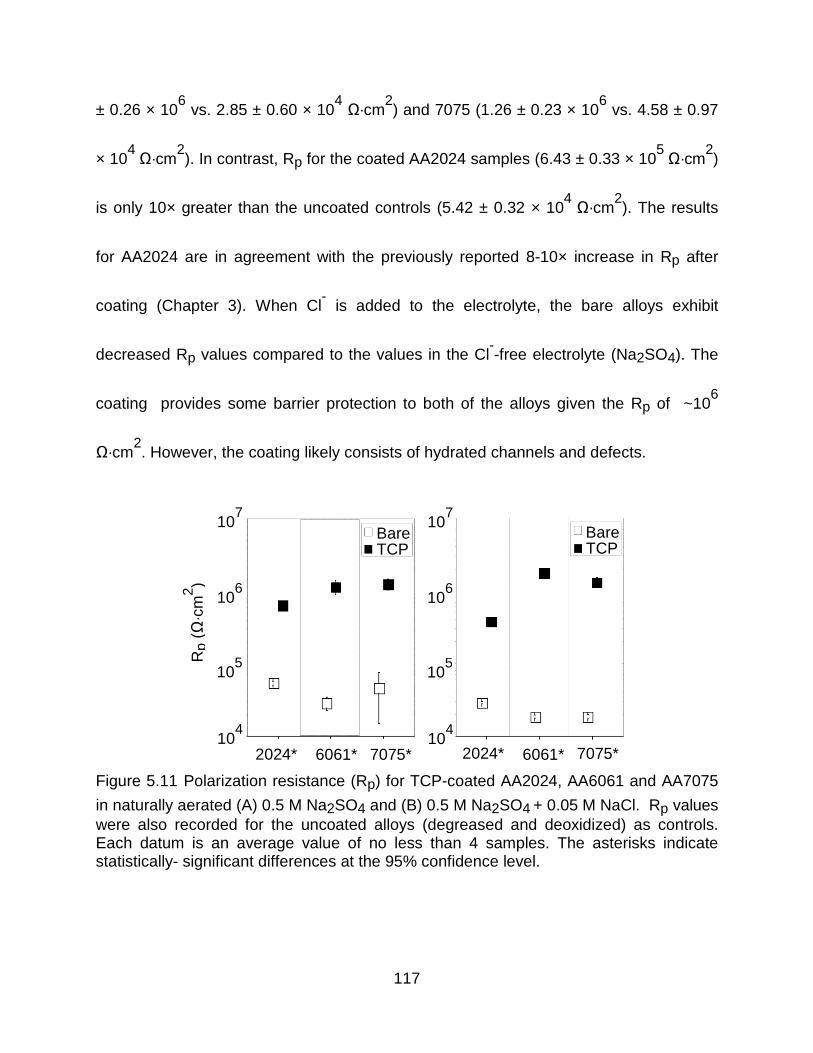
117
± 0.26 × 10⁶ vs. 2.85 ± 0.60 × 10
4 Ω·cm
2) and 7075 (1.26 ± 0.23 × 10
6 vs. 4.58 ± 0.97
× 104 Ω·cm
2). In contrast, Rp for the coated AA2024 samples (6.43 ± 0.33 × 10
5 Ω·cm
2)
is only 10× greater than the uncoated controls (5.42 ± 0.32 × 10⁴ Ω·cm
2). The results
for AA2024 are in agreement with the previously reported 8-10× increase in Rp after
coating (Chapter 3). When Cl- is added to the electrolyte, the bare alloys exhibit
decreased Rp values compared to the values in the Cl--free electrolyte (Na2SO4). The
coating provides some barrier protection to both of the alloys given the Rp of ~106
Ω·cm2. However, the coating likely consists of hydrated channels and defects.
Figure 5.11 Polarization resistance (Rp) for TCP-coated AA2024, AA6061 and AA7075
in naturally aerated (A) 0.5 M Na2SO4 and (B) 0.5 M Na2SO4 + 0.05 M NaCl. Rp values were also recorded for the uncoated alloys (degreased and deoxidized) as controls. Each datum is an average value of no less than 4 samples. The asterisks indicate statistically- significant differences at the 95% confidence level.
Rp
(Ω·c
m2 )
104
105
Bare TCP
Bare TCP
2024* 6061* 7075* 2024* 6061* 7075*
106
107
104
105
106
107

118
Table 5.1 summarizes other electrochemical parameters measured for the bare
and TCP-coated alloys in air-saturated 0.5 M Na2SO4 and 0.5M Na2SO4 + 0.05 M NaCl.
Generally, the more aggressive Cl-, as compared to SO4
2- , leads to more severe attack
of the uncoated alloys. For example, icorr is larger by 2× in the NaCl-containing
electrolyte than that in Na2SO4. Moreover, in the presence of Cl-, uncoated alloy
samples undergo pitting at Epit. In contrast, the TCP-coated alloys still undergo pitting
but more resistant to it as evidenced by a positive shift in Epit resulting in larger
difference between Ecorr and Epit (so called ∆E). The TCP-coated AA2024 exhibits a
200 mV larger ∆E than the bare sample, while ∆E for the coated AA7075 is increased
by about 350 mV. Amazingly, the coated AA6061 was not even pitted in the potential
window from -1.0 V to 0.5 V vs Ag/AgCl. A smaller icorr is seen for all three coated
alloys after coating with TCP: 10× for AA2024, and 100× for both AA6061 and AA7075.
These results indicate that the TCP coating provides corrosion protection to all the
aluminum alloys even in the aggressive Cl--containing solution, with the greatest level of
protection seen for AA6061 and AA7075. Our observation that TCP provides a greater
level of corrosion resistance to AA7075, as compared to AA2024, is consistent with data
from Nickerson et al.60
for salt-spray tests.

119
Table 5.1 Electrochemical parameters for the TCP-coated and bare AA2024, 6061 and 7075 alloys during full immersion
in air-saturated 0.5 M Na2SO4 and 0.5 M Na2SO4 + 0.05 M NaCl. ∆E= Epit - Ecorr. All statistical data are reported at a 90% confidence level. Each datum is an average measurement for 4 samples.
Alloys
AA2024 AA6061 AA7075
Bare TCP Bare TCP Bare TCP
0.5 M
Na2SO4
icorr (µA/cm2) 0.11 ± 0.03 0.01 ± 0.00 0.19 ± 0.03 0.01 ± 0.00 0.11 ± 0.01 0.01 ± 0.00
Porosity (%) - 5.12 ± 2.78 - 0.27 ± 0.09 - 2.62 ± 1.54
0.5 M
Na2SO4 + 0.05 M
NaCl
Epit (V vs Ag/AgCl)
-0.34 ± 0.05 -0.12 ± 0.05 -0.27 ± 0.11 No pitting -0.35 ± 0.08 0.07 ± 0.06
∆E (V) 0.16 ± 0.05 0.35 ± 0.06 0.34 ± 0.10 >1.31 0.26 ± 0.09 0.59 ± 0.08
icorr (µA/cm2) 0.28 ± 0.09 0.01 ± 0.00 0.37 ± 0.01 0.01 ± 0.00 0.30 ± 0.01 0.01 ± 0.00
Porosity(%) - 7.07 ± 4.58 - 0.40 ± 0.12 - 1.45 ± 0.49

120
Table 5.1 also presents calculated (apparent) porosity data for the TCP-coated
alloys, assessed during full immersion in the two air-saturated electrolyte solutions. The
porosity is a structural parameter that is a reflective of the presence of hydrated
channels and defects in the coating. The calculation was described in Chapter 2, using
average values of Rp,bare, Rp,TCP, Ecorr and ba for the bare and TCP-coated alloys.
The TCP coating exhibits the trend of a decreasing porosity in the following order:
AA2024 > AA7075 > AA6061 in both electrolyte solutions.
The electrochemical impedance properties were also measured for the three
TCP-coated alloys in air-saturated 0.5 M Na2SO4. Figure 5.12 presents the typical
impedance-frequency and phase shift-frequency plots for the coated alloys. Table 5.2
shows the best fit parameters of the equivalent circuit that was used to analyze the
experimental data. In the impedance-frequency profile (Fig. 5.12, left), the high-
frequency impedance Rel is primarily determined by the resistance through the
electrolyte solution (0.5 M Na2SO4). Therefore, the values are identical for all three
alloys (ca. around 110 Ω). Rpo, normalized by the geometric area of the exposed
sample, represents the electrolyte resistance in the hydrated channels and defects of
the coating. The smaller Rpo value for the TCP-coated AA2024 (525 Ω·cm2) is
consistent with a larger porosity or defect density in the coating than on AA6061 (1351
Ω·cm2) and AA7075 (1184 Ω·cm
2). The low-frequency impedance may be used to
estimate the polarization resistance, Rp, at the coating/metal interface. These values

121
are consistent with the Rp values determined from linear sweep voltammetric data, as
shown in Fig. 5.11. The phase shift-frequency profiles (Fig. 5.12, right) reveal two
distinct time constants for all three TCP-coated alloys. The time constant at the higher
frequency is usually associated with the coating (Rpo × CPEco), while the low-frequency
time constant is with the coating-metal interface (Rp × CPEdl).76-77
The highest phase
angles for both time constants increase from AA2024, AA7075 to AA6061. This
indicates a greater heterogeneity on AA2024, AA7075, than AA6061 (Chapter 3).
Therefore, the constant phase elements (CPEs) were used to represent the
inhomogeneous electrolyte/coating and coating/metal interfaces. Its impedance can be
expressed as Z=(jω)-n
Q-1
, where n is a ratio that reflects the heterogeneity of the
coated alloys.116
The TCP-coated AA6061 exhibited the highest nco (0.93) and ndl (1)
values, which reflected a good homogeneity of the coating and coating/metal interface.
AA2024 and AA7075 exhibit smaller nco (0.80 for AA2024, 0.86 for AA7075) and ndl
(0.86 for AA2024, 0.82 for AA7075) values which are suggestive of more non-uniform
coating structures on these two alloys. The differing interfacial properties between three
coated alloys are attributed to their respective intermetallic composition. The effective
capacitance is determined according to Ceff=Q1/n
R1/n-1
.116
Ceff for the TCP-coated
AA2024 is in a good agreement with values reported by Frankel et al.146

122
Figure 5.12 Bode plots for the TCP-coated alloys (AA2024, AA6061 and AA7075) at
Ecorr. Measurements were made in naturally aerated 0.5M Na2SO4 after the samples were aged in air overnight at room temperature. All samples had a geometric area of
0.2 cm2 exposed to the electrolyte solution during measurements.

123
Table 5.2 Best-fit parameters from experimental EIS data for TCP-coated AA2024,
AA6061 and AA7075 samples in naturally aerated 0.5 M Na2SO4 at room temperature. The equivalent circuit used for data analysis was presented in Chapter 2.
Alloys Rel (Ω)
Qco
(×10-6
sn/(Ω·cm
2))
nco Cco
(µF/cm2)
Rpo
(Ω·cm2)
Qdl
(×10-6
sn/(Ω·cm
2))
ndl
Rp
(×105
Ω·cm2)
AA2024 115 16.04 0.80 2.49 525 11.51 0.86 3.30
AA6061 115 6.16 0.93 3.41 1351 0.15 1 6.46
AA7075 105 9.57 0.86 2.44 1184 1.48 0.82 9.54
5.3 Discussion
5.3.1 Formation mechanism and chemical structure
Similar to AA2024, the formation of the TCP coating occurs in two steps on both
alloys. The initial step involves dissolution of the passivating Al oxide layer by H+ and F
-
in the coating bath. This is evidenced by the negative OCP shift (Fig. 5.1). F- in the bath
facilitates the metal dissolution by forming soluble AlF63-
species. K+ ions are present at
the interface region to compensate the excessive negative ions. However, the minimum
OCP for AA6061 during the first 200-s immersion in the TCP bath is more negative and
its duration at the minimum value is longer than AA7075. H+ and F
- attack the alloy
surface more severely on AA6061 than AA7075, evidenced by a more negative and
longer OCP of AA6061 for the first 200-s immersion in TCP bath. This leads to the
thicker interfacial layer (K3AlF6) seen on the AA6061 surface than AA7075 (Fig. 5.2).
The second step is the hydrolysis of hexafluorozirconate (ZrF62-
) to form the hydrated

124
zirconia (ZrO2·2H2O) overlayer, which is driven by an increased interfacial pH
accompanying the hydrogen evolution and oxygen reduction reactions (ORR) on the
metal surface. The zirconia (ZrO2) layer forms over the K3AlF6 interfacial layer, as
evidenced by the atomic concentration ratio of O/Zr (2:1) (Fig. 5.1). Since both alloy
samples were immersed in the TCP bath for 10 min, no significant difference was seen
in the thickness of the ZrO2 overlayers (~30 nm) on AA6061 or AA7075. Consequently,
the TCP coating appears to form a biphasic structure including the ZrO2 overlayer and a
K3AlF6 interfacial layer. The apparent coating thickness on AA6061 is about 100 nm
and this is slightly greater than the apparent coating thickness on AA2024 (ca. 50 nm)
and AA7075 (ca. 80 nm) (Fig. 5.2). In addition, the coating consists of hydrated
channels or defects through which dissolved oxygen and electrolyte species can react
the underlying surface. In other words, the coating forms a partially blocking layer over
the surface. This is evidenced by Rp values (106 Ω·cm
2) that are less than the 10
9
Ω·cm2 value expected for a full barrier layer (Fig. 5.5). It should be noted that the
estimated coating thickness, based on data in Fig. 5.2, is likely less than the true
(hydrated) value due to shrinkage of the coating in vacuum (Chapter 3).
The TCP-coated intermetallics exhibit varied morphologies depending on their
different composition. For example, a mud-like morphology is seen for the Cu-rich site
(Fig. 5.4A) while a smooth morphology is seen for the Fe-rich site (Fig. 5.3A and 5.4A).
Compared to Fe-rich intermetallics (e.g. Fe2Si), Cu-rich intermetallics (e.g. Al2Cu)

125
exhibit a faster cathodic ORR kinetics. This leads to a greater level of corrosion in the
surrounding metal. This likely is a cause for the differences in morphology around the
two intermetallic sites. EDX data revealed that the TCP coating forms on most areas of
the two alloys and is enriched around the intermetallics. This was evidenced by the
elevated signal intensities of Zr, O and Cr (Fig. 5.3B and 5.4B).
5.3.2 Stability of the TCP coating on AA6061 and AA 7075
The TCP coating is designed to protect aluminum alloys from corrosion. To this
end, a structurally and chemical stable coating is required for optimum performance. To
assess the structural stability of the TCP coating on the two aluminum alloys, we
measured pit densities as a function of immersion time. Figure 5.5 shows that the
significant pitting occurs during the deoxidization of the metals in the F--rich Alodine®
Smut-Go (20% v/v) solution. The surrounding Al matrix is attacked and dissolved to
such an extent that dealloying of the intermetallic compounds may occur (e.g. Al2CuMg).
The attacked surface becomes rougher and even exhibits significant pitting as
compared to the untreated alloys. The pitting undoubtedly depends on the deoxidizing
time, which we did not vary from the recommendation of the coating supplier. The
stability of the TCP coating was assessed by measuring how much the pit density
changes for the coated alloys during a 14-day full immersion in air-saturated 0.5 M
Na2SO4 or 0.5 M NaCl. The pit density was unchanged for the coated alloys in both
electrolytes (Fig. 5.5 and 5.6). In contrast, the pit density increased for both uncoated
alloys, particularly in NaCl. These results indicate the TCP coating functions as a stable
126
barrier layer for much of the alloy surface. Presumably, dealloying of the intermetallics
are also inhibited by the coating.
5.3.3 Transient formation of Cr(VI)
Transient formation of Cr(VI) oxide species was detected in the TCP coating on
both AA6061 and AA7075 during full immersion in naturally aerated electrolyte
solutions. We have reported how Cr(VI)-O species form transiently in the TCP coating
on AA2024-T3 during immersion testing (Chpater 4). We hypothesize the formation
mechanism is the same for AA6061 and AA7075 (Figure 5.13). Hydrogen peroxide
(H2O2), generated from a two-electron oxygen reduction, locally oxidizes Cr(III)-O to
Cr(VI)-O near the noble intermetallic sites (e.g., Fe-rich for AA6061, Cu-rich and Fe-rich
intermetallics for AA7075). Some chromate (CrO42-
) combines the corroded Al(III)
oxides to form Al(III)/Cr(VI) mixed oxides at the Cu-rich sites. But it is interesting to
notice that little Al(III)/Cr(VI) signal is detected at Fe-rich sites because of no significant
Al oxidation. Other CrO42-
or H2O2 then diffuses to Al matrix surface and forms
Cr(III)/Cr(VI) mixed oxides at the terrace away from pit areas.
Variation in the concentration of Cr(VI)-O species that forms transiently in the TCP
coating on AA6061 and AA7075 (Fig. 5.8) is relevant to the composition of their
intermetallics. Cu-rich intermetallics have faster oxygen reduction reaction (ORR)
kinetics than Fe-rich intermetallics.140
AA7075 contains a higher percentage of Cu (1.2-
2 wt%) than AA6061 (0.15-0.4 wt% Cu). Larger amounts of H2O2 are expected to be
generated at intermetallic sites in AA7075 than AA6061. Moreover, some defects are

127
seen in the TCP coating at the intermetallic sites, much more at Cu-rich sites than Fe-
rich sites that have a smooth morphology (Fig. 5.3 and 5.4). Cu-rich sites have a larger
amount of dissolved O2 that diffuse through defects to the intermetallics than Fe-rich
sites. Therefore, a larger concentration of Cr(VI)-O species form transiently in the TCP
coating on AA7075 than AA6061.
Figure 5.13 Proposed mechanism for transient formation of Cr(VI) on the TCP-coated aluminum alloys during immersion in naturally aerated electrolyte solution.
5.3.4 Corrosion protection
The TCP coating provides modest cathodic and anodic corrosion protection to
both aluminum alloys by physical blocking intermetallic sites as well as sites on the Al
matrix. This is evidenced by suppressed cathodic and anodic currents at potentials
around Ecorr in both the mild and aggressive electrolyte solutions (Fig. 5.2 and 5.3). The
TCP coating provides corrosion protection to both AA6061 and AA7075 (Fig. 6-2C and
D) even in the presence of Cl-. It is well known that Cl
- can induce severe pitting in
aluminum alloys.140
The difference between Ecorr and Epit (∆E) is a measure of the
O2 O2
H2O2 Al(III)/Cr(VI)
Cr(III)/Cr(VI)
Cr(VI) Cr(III)
Cr(III) Cr(VI)
H2O2
Cu Al
Fe
Cr(III)/Cr(VI)

128
susceptibility to localized pitting corrosion.121
The more positive Epit is relative to Ecorr,
the more resistant the alloy is to pitting. In the case of the coated alloys, TCP increases
∆E by about 200 mV for AA7075, and more than 1,000 mV for AA6061. Clearly, the
TCP coating provides resistance to attack by Cl- by physically blocking the surface.
More quantitative evidence for the corrosion protection is the higher Rp and
correspondingly lower icorr values by 10-100× for the TCP-coated alloys as compared to
the bare samples (see Fig. 5.4 and Table 5.2). It should be noted, though, that the TCP
coating does not provide full barrier protection as such coated metals exhibit Rp values
≥ 109 Ω·cm
2. The lower Rp values for the TCP-coated metals suggest that the alloy is
partially blocked by the coating that consists of hydrated channels and defects through
which dissolved O2 and ions can be transported to the underlying metal surface.
However, overall, our results demonstrate that under open-circuit conditions, TCP
provides corrosion protection to both AA6061 and AA7075 in both mild and aggressive
electrolyte solutions.
How do the three alloys compare in terms of the corrosion resistance provided by
TCP? Data available show that the TCP coating provides a higher level of corrosion
resistance to AA6061 than AA7075, as evidenced by the higher Rp, smaller icorr and
larger ∆E (Epit – Ecorr). The difference in Rp between the coated and uncoated surfaces
trended as follows: AA6061 > AA2024 > AA7075. Recalling our previous results for
AA2024, the TCP coating provides a greater level of corrosion protection to AA6061
129
and AA7075 based on the larger Rp values. This variation in passivation is attributed to
a combination of the different intermetallic compounds in each alloy, their physical size
and the physical nature of the coating on each alloy. For example, we previously
reported that the TCP coating has a rougher morphology on and around the Cu-rich
sites of AA2024 and AA7075, compared to the smoother morphology on the Fe-rich
sites of AA6061 and AA7075. The coating conformally forms over the alloy surface. It is
likely, though, that the coating is more defective around the topographically rough Cu-
rich intermetallics of AA2024 and AA7075 than the smoother Fe-rich intermetallics of
AA6061. The consequence of the rough topographical features is that the Cu-rich sites
are not completely coated by TCP. In other words, the coating around these
intermetallics contains a greater number of defects and imperfections (Chapter 3).
Hydrated channels and defects in the coating can be quantified by the porosity (P).
AA2024 exhibits a 10× larger TCP coating porosity than the Fe-rich AA6061 (see Table
5.2). AA7075 has less Cu content than AA2024 and equal Fe content with AA6061.
Therefore, it is not surprising that the coating on AA7075 exhibits a roughness and
porosity that are between AA2024 and AA6061.
In presence of Cl-, severe pitting corrosion generally occurs on aluminum alloys
Epit. The difference between Epit and Ecorr, ∆E, was used to evaluate susceptibility of
the coated alloy pitting corrosion by Cl-.121
∆E is increased in the presence of TCP for
all three alloys. However, AA6061 consists mainly of Fe-rich intermetallics (Fe-Si) and
exhibits an increased ∆E for the coated samples to a larger extent compared to AA2024
that has mainly Cu-rich intermetallics. AA7075 has a vast variety of intermetallics that

130
include both Cu-rich and Fe-rich intermetallics. The TCP-coated AA7075 does not
ensure an increased ∆E as large as AA6061, but better than AA2024. In other words,
the likelihood of severe pitting corrosion in those coated alloys decreases in the order of
AA2024, AA7075 and AA6061. This is attributed to variable porosity of the coatings on
the three alloys. In summary, the TCP coating provides protection from pitting corrosion
on all three alloys, but much better on AA6061 than on AA7075. The TCP coating can
inhibit pitting corrosion in AA2024 but not as effective as AA6061 and AA7075.
5.4 Conclusion
This study focused on the formation, structure and electrochemical properties of
the TCP conversion coating on AA6061 and AA7075. The formation of the TCP coating
on both alloys is similar to AA2024. The formation of a hydrated zirconia layer
(ZrO2·2H2O) is driven by an increase in the interfacial pH caused by the dissolution of
the passivating Al oxide layer followed by increased rates of the cathodic reactions
(localized oxygen reduction reaction (ORR) and hydrogen evolution on the activated
metal. These reactions consume protons and cause the interfacial pH to increase. The
coating exhibited a biphasic structure consisting of a hydrated zirconia overlayer and
potassium fluoroaluminate interfacial layer. The TCP coating thickness on AA6061 in
vacuo was about 100 nm, which is greater than the thickness on both AA7075 (ca. 80
nm) and AA2024 (ca. 50 nm). The coating was structurally stable on both alloys during
a 14-day full immersion test in both Na2SO4 or NaCl. This was evidenced by an
unchanging pit density and unchanging Rp values. The transient formation of Cr(VI)-O
131
species suggests that in addition to passively protecting the aluminum alloy from
corrosion, there might also be some active protection similar to the mechanism of
chromate conversion coatings.
The coating provides corrosion protection to both alloys as evidenced by the 10-100×
increase in Rp and anodic shifts of Epit. The coating provides corrosion protection to
both alloys during full immersion tests (room temperature) in both air-saturated Na2SO4
and Na2SO4 + NaCl. Evidence of corrosion protection was the 10-100× increase in Rp
to the range of ~106 Ω·cm
2 and decrease in icorr to 20-30 nA/cm
2 in both electrolyte
solutions for the coated alloys as compared to the bare controls. The coating on
AA6061 functions primarily as a cathodic inhibitor while on AA7075 it provides both
anodic and cathodic protection. The coating provides corrosion protection even in the
presence of Cl- as no pitting was detected on AA6061 at potentials up to 0.5 V vs.
Ag/AgCl and Epit for AA7075 shifted positive by ~400 mV. Based on the electrochemical
parameters, the coating’s dielectric constant was calculated to be about 100. A model is
presented that describes the alloy is partially blocked the coating with some hydrated
channels and defects through which ions and dissolved oxygen can reach portions of
the underlying alloy surface.

132
CHAPTER 6. STABILITY OF TCP COATINGS DURING ACCELE RATED CORROSION TESTS
6.1 Introduction
In many cases, corrosion is the life-limiting factor of aluminum alloys. Corrosive
failures can occur unexpectedly during the service. Therefore, corrosion tests are
applied to predict the service life of the alloys. They are also used to assess the
corrosion inhibition provided by various protection methods. There are three major
types of corrosion tests: laboratory, field, and service testing. The service testing
provides the highest fidelity results followed by fielding testing. However, the service
and field tests can consume enormous time. New systems may be halfway through their
lifecycles before real data on the field test would indicate any corrosion problems. The
timescales involved in such tests preclude the opportunity for proper materials selection.
Accelerated corrosion testing in the laboratory is increasingly more important for
predicting material performance as the laboratory environment is better controlled and
approaches that of the service environment. Such testing can provide meaningful test
data in a reasonable time frame and supports election of the most corrosion resistance
materials selection.
Acceleration can be achieved by increasing the salt solution concentration,
temperature, UV intensity, pressure for stress corrosion cracking (SCC), relative
humidity, and SO2 concentration, etc. To account for the variation of corrosion with
configuration, several standardized tests are performed for particular environments, as
evidenced by the many ASTM methods. Table 1 shows several common tests under a

133
variety of environments and the electrochemical methods that are usually used to
assess the corrosion and corrosion inhibition properties.
Table 6.1 ASTM standard methods for accelerated corrosion testing and the electrochemical methods that are commonly used to assess the corrosion and corrosion inhibition.
ASTM Standards Description
Immersion testing G-31
147 Full immersion
G-44 148
Intermittent immersion
Salt spray (fog) testing B-117
149 Neutral salt spray
G-85 150
Cyclic acidic salt spray
Atmospheric corrosion testing
G-50 96
Humid atmosphere
G-87 97
Moist SO2 exposure
Electrochemical methods
G3 151
Electrochemical properties including
Ecorr, Rp, and polarization curves
G-106 152
Electrochemical impedance
G-71 153
Galvanic corrosion
D-6208 154
Repassivation potential
Accelerated testing does not have to correlate exactly to the service environment
as long as the corrosion mechanism remains the same. Therefore, meticulous
execution and well control of variables during the testing are necessary to obtain useful
results. This goal is to accelerate the test while keeping the corrosion mechanism the
same as the service corrosion mechanism. For example, ASTM B-117 is a neutral salt
spray test that is accelerated by increasing the NaCl concentration from 3.5% to 20%.

134
The salt fog produces a severe pitting corrosion in the specimen. This test is commonly
used because it is well standardized and easily controllable. However, prediction of
performance in service and field environments is not well correlated with the salt spray
results when used as stand-alone data. In addition, this salt fog conditions are seldom
experienced by airplanes or space shuttles and, thus, the test does not simulate well
the service or field environment.
Therefore, several accelerated corrosion tests have been used to better simulate
the service environments for the aerospace aluminum alloys. In this chapter, for
example, the full immersion test is to mimic the situation where the coated Al alloys are
fully immersed in salt solutions (Na2SO4, NaCl); the humid atmosphere corrosion test
(RH=100%) is used to simulate the highly humid environment along the coast or on
aircraft carriers; the moist SO2 atmosphere is used to model the urban environment;
and the thin layer mist test is used to model the situation of moisture condensation. .
The stability of the conversion coating was assessed by optical observation of corrosion,
weight change of the specimen, and basic electrochemical measurements.
6.2 Results and Discussion
6.2.1 Full immersion
Figure 6.1 presents the polarization resistance, Rp, data for the TCP-coated
AA2024-T3, AA6061-T6, and AA7075-T6 during full immersion in naturally aerated0.5
M Na2SO4 for 14 days. The samples were taken out from the solution, rinsed with tap
water for 30 s, dried in flowing N2, and tested electrochemically as described in Chapter

135
2. It can be seen in Fig. 6.1 that Rp for the TCP-coated AA2024 is in the range of 105-
106 Ω·cm
2 that is 10x less than the 10
6-10
7 Ω·cm
2 for the coated AA6061 and AA7075.
This is consistent with the conclusion in Chapter 5 that the TCP coating provides a
better corrosion inhibition on AA6061 and AA7075 relative to AA2024. Moreover, the Rp
values for all three alloys are relatively consistent throughout the entire immersion
period, which indicates good TCP coating stability.
Figure 6.1 Polarization resistance data, Rp, for the TCP-coated AA2024, AA6061, and
AA7075 during full immersion in naturally aerated 0.5 M Na2SO4 for 14 days.
Table 6.2 shows the SEM images of the TCP-coated Al alloys during the full
immersion in air-saturated 0.5 M NaCl that is more aggressive than Na2SO4. Samples
were continuously immersed for 14 days. Images for the uncoated samples are also
shown as control. The samples were rinsed in ultrapure water for 30 s before imaging. It
can be seen that no significant pitting corrosion or morphology change occurs to the
0 5 10 15 Time (days)
107
106
Rp
(Ω
·cm
2 )
105
AA6061 AA7075
AA2024

136
Table 6.2 SEM images of TCP-coated and uncoated AA2024-T3, AA6061-T6, and AA7075-T6 during full immersion in air-saturated 0.5 M NaCl for 14 days.
Immersion Time (days)
1 7 14
2024
Alloy
6061
7075
Bare
TCP
Bare
Bare
TCP
TCP
Treatment

137
coated specimens during the test period immersion in aggressive NaCl. In contrast,
there is significant damage on the uncoated specimens as evidenced by the pitting,
cracking 4, 9, 155
and dealloying of Cu-containing intermetallics 156-157
. The white
precipitates seen in the images for the coated samples are characteristic of the TCP
coating. The fact that they are not dissolved in the solution is also an indicator of coating
stability.
The full immersion testing was also conducted on the galvanic couple of TCP-
coated AA2024 panels and fasteners made of SS 286 CRES and Ti-6Al-4V. The weight
loss data and optical images will be shown in the later section.
6.2.2 Atmospheric corrosion
Figure 6.2 shows the Rp data for TCP-coated AA2024, AA6061, and AA7075
during atmospheric exposure to humid air (RH=100%) over a 14-day period at (A) room
temperature and (B) 55 ºC. Rp for the TCP-coated AA2024 was relatively consistent
throughout the exposure period while Rp for the other two alloys increased after 7 and
14 days. First, the non-decreasing Rp values reflect good stability of the coating under
these test conditions. Second, the increasing Rp seen for AA6061 and AA7075 results
from the formation of a passivating oxide layer in the pores/channels and defects of the
coating with the metal are exposed.158

138
Figure 6.2 Rp for TCP-coated AA2024, AA6061, and AA7075 at different time points during a 14-day atmospheric exposure test in humidified air (RH=100%) at (A) room temperature and (B) 55 ºC for 1, 7, and 14 days.
Figure 6.3 shows the optical and SEM images of TCP-coated and uncoated
AA2024-T3 specimens after exposure to a moist SO2 atmosphere for 14 days at 44 oC.
In this test, the alloy panels were galvanically-coupled with a Ti alloy fastener (Chapter
Before 1 day 7 day 14 day
107
106 R
p (Ω
·cm
2 )
AA7075
AA2024
AA6061
105
108
A
Before 1 day 7 day 14 day
107
106 R
p (Ω
·cm
2 )
105
108
B
AA7075
AA2024
AA6061

139
2). Corrosion is clearly seen across the entire uncoated alloy surface (Fig. 6.3D) in the
form of pitting (Fig. 6.3E) and subsurface undercutting 159
(Fig. 6.3F). In contrast little
change in pitting or surface roughening is seen for the TCP-coated specimens (Fig.
6.3A). Some corrosion products precipitate locally on the coated alloy surface (Fig. 6.3B)
but most regions show little evidence for corrosive damage (Fig. 6.3C). These results
indicate that the TCP coating provides corrosion inhibition in the moist SO2 testing
environment.
Figure 6.3 Optical images for the (A) TCP-coated and (D) uncoated AA2024-T3 after
exposure in moist SO2 atmosphere (RH=100%) at 40 ºC for 14 days. The alloy panels were galvanically coupled with Ti-6Al-4V fasteners. SEM images of the corroded areas (solid black circles) in (A) and (D) are shown in (B) and (E), respectively. Images of the dashed black circles in (B) and (E) are shown in (C) and (F) with a higher magnitude.
140
6.2.3 Thin layer mist exposure
Table 6.3 shows optical images of the TCP-coated AA2024-T3 specimens after
the full immersion test (see above) at room temperature and thin-layer mist (TLM) test
at 55 ºC in air-saturated 3.5% NaCl, both for 14 days. The alloy panels were
galvanically-coupled to either a stainless steel (SS A286 CRES) or Ti alloy (Ti-6Al-4V)
fastener (Chapter 2). The areas where the panels are in direct contact with the
fasteners (washers) are damaged and show circular-shaped marks around the hole.
Comparing the effects of the different fasteners, it can be seen that the specimens
coupled with SS fastener underwent a greater level of corrosion than the specimens
coupled with the Ti alloy fastener.160-161
In addition, the specimens after the 14-day
TLM testing were corroded to a greater extent than those after the full immersion testing,
especially for the panels coupled with the SS fastener. This is also seen from the weight
loss of the coated AA2024 panels, as shown in Table 6.4. The SS-coupled panels
showed a greater weight loss percentage than those coupled with Ti alloy fasteners.
This is attributed to the fact that dissolved O2 has a shorter diffusion pathway through
the thin layer of electrolyte solution to the coated alloy surface than that through the bulk
solution during the immersion test. Additionally, the salt concentration in the small
volume droplets likely progressively increased with droplet evaporation. Therefore, for
the same period of testing, a greater amount of O2 diffuses to the panels in the TLM test
and causes a more severe corrosion than that in the full immersion test.
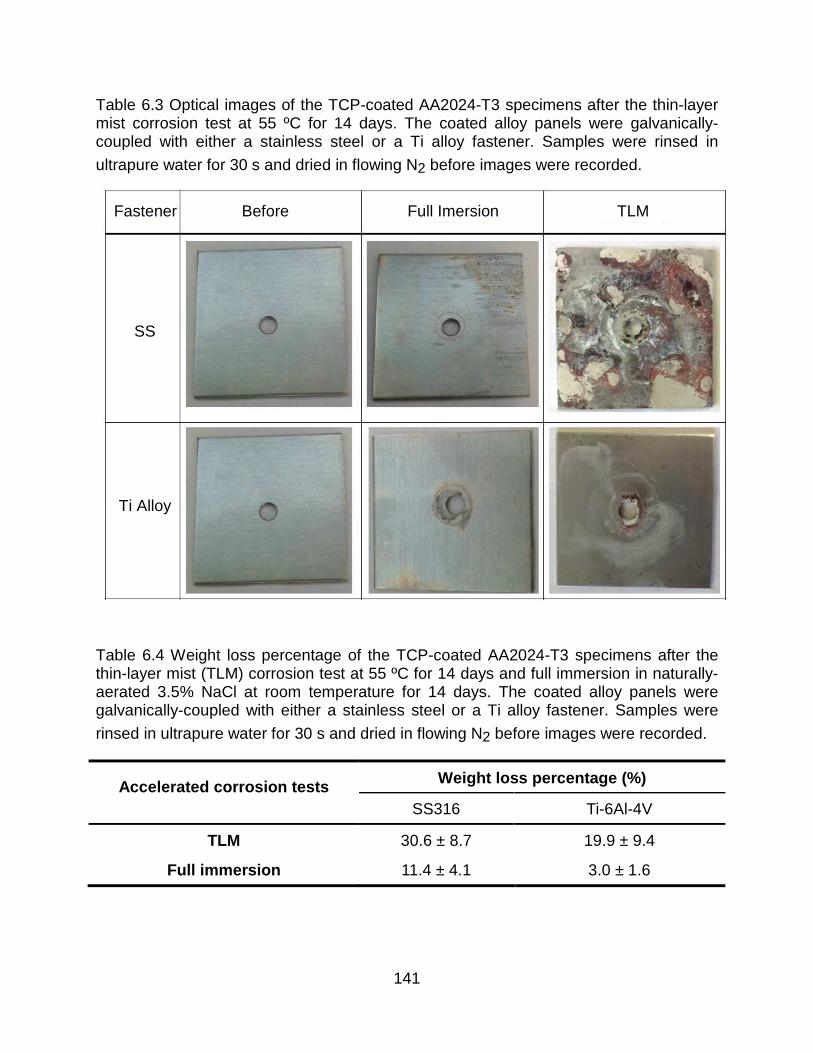
141
Table 6.3 Optical images of the TCP-coated AA2024-T3 specimens after the thin-layer mist corrosion test at 55 ºC for 14 days. The coated alloy panels were galvanically-coupled with either a stainless steel or a Ti alloy fastener. Samples were rinsed in
ultrapure water for 30 s and dried in flowing N2 before images were recorded.
Table 6.4 Weight loss percentage of the TCP-coated AA2024-T3 specimens after the thin-layer mist (TLM) corrosion test at 55 ºC for 14 days and full immersion in naturally-aerated 3.5% NaCl at room temperature for 14 days. The coated alloy panels were galvanically-coupled with either a stainless steel or a Ti alloy fastener. Samples were
rinsed in ultrapure water for 30 s and dried in flowing N2 before images were recorded.
Accelerated corrosion tests Weight loss percentage (%)
SS316 Ti-6Al-4V
TLM 30.6 ± 8.7 19.9 ± 9.4
Full immersion 11.4 ± 4.1 3.0 ± 1.6
Fastener Full Imersion TLM
SS
Before
Ti Alloy

142
6.3 Conclusion
The stability and corrosion inhibition provided by the TCP coating on aluminum
alloys were assessed by optical/microscopic inspection, weight change, and
electrochemical measurements after three different accelerated corrosion tests. The
tests included: full immersion at room temperature, atmospheric exposure to humid air
at room temperature, moist SO2 atmospheric exposure, and a thin layer mist (TLM) test.
The TCP coating exhibited good physical and chemical stability and provided consistent
corrosion protection for at least 14 days during full immersion in air-saturated 0.5 M
NaCl and exposure to humidified air. The coating also provided corrosion inhibition to
the alloy during the moist SO2 atmospheric test. For the galvanically-coupled
specimens, the degree of corrosion inhibition provided by TCP depended on the
fastener type. More extensive corrosion was seen for the SS A286 CRES fastener,
presumably because this alloy supports more rapid oxygen reduction reaction kinetics.
This is clearly evident in the thin layer mist (TLM) test results, which shows the
aluminum alloys coupled with the SS fastener are more extensively corroded than those
with Ti alloy fastener.
143
CHAPTER 7. EFFECTS OF THE DEOXIDATION/DESMUTTING TIME AND SOLUTION CHEMISTRY ON THE CORROSION INHIBITION PROVIDED BY THE TCP COATING ON AA2024
7.1 Introduction
Conversion pretreatment coatings are one component of a multi-layer coating
system that is typically used to protect aluminum alloys from corrosion. These coatings
are designed to protect an underlying metal surface from corrosion, especially in and
around defects, and to provide adhesion with a primer overlayer. The corrosion
inhibition provided by the coating depends on its chemical composition, physical
structure and thickness, all of which affect oxygen and water/electrolyte accessibility to
the metal surface.162
Conversion coating thicknesses are generally in the 100-500 nm
range.
For optimum conversion coating performance, it is essential to properly prepare
the metal surface. The preparation or pretreatment typically involves two steps:
degreasing and deoxidation/desmutting. Effective cleaning produces a contaminant-free
surface on which to form the conversion coating.163-164
For aluminum alloys, there are
two types of surface contaminants that require removal: cutting and lubrication oils from
the processing and shaping of the alloy, and metal oxides (i.e., smut).164
Degreasers
are used to remove the oil contaminants. This is often followed by application of an
acidic deoxidizer (also called desmutting or pickling) that is used to dissolve the smut.
Studies have shown that the degreasing and deoxidizing/desmutting
pretreatments can affect the performance of conversion coatings on aluminum

144
alloys.165-170
The formation and structure of the coating as well as the corrosion
inhibition it provides are significantly affected by the temperature used for alkaline
cleaning, and the acidic or alkaline nature of the solution used for deoxidation.170-171
In
the case of chromate conversion coatings (CCC), the cleanliness and surface chemistry
of the alloy strongly influence the coating formation171-172
, composition173-174
and
performance175
. Additionally, the deoxidizing pretreatment can alter the surface copper
content and distribution,165, 176-177
which can affect the corrosion inhibition provided by
the CCC.175, 178
Prior work has shown that the TCP coating inhibits corrosion on aluminum alloys,
in part, by serving as a barrier layer.114, 118, 146, 179-180
To date though, there has
been little work reported on how the substrate pretreatment affects the corrosion
inhibition provided by the coating. Guo et al. investigated the effect of pretreatment on
the TCP coating performance by comparing a commercially-recommended process
(degreasing in Turco® 6849 and deoxidizing in Turco® Smut-Go NC) with degreasing in
an alkaline Na2SiO3 solution and deoxidizing in the HNO3 + Sanchem 1000 solution.181
At least for these two pretreatments, they found no significant difference in the TCP
formation or performance. Wernick et al.182
, Buchheit et al.183
, and Mankowski et
al.184
reported that the acidic deoxidation step is critical for conversion coating
formation as it alters the morphology and chemistry of the alloy surface. Proper

145
substrate pretreatment is obviously the key for the formation of a continuous, low defect
TCP conversion coating.
We hypothesized that the corrosion inhibition provided by a TCP coating would
depend on the chemical nature of the deoxidizer and the treatment time due to effects
on the substrate’s surface roughness, pit density, and pit depth. Figure 7.1A depicts the
formation of a low defect, uniform conversion coating on a metal substrate pretreated in
a way that minimizes surface roughening and pitting. In contrast, Figure 7.1B depicts
the formation of a defective coating that incompletely covers a substrate due to the
surface roughening and pitting produced by an aggressive deoxidation pretreatment.
The formation of a continuous conversion coating on the steep walls and sharp edges of
deep pits is likely a challenge. It is at these sites where initiation of corrosion and
coating degradation likely occur. We report herein on the corrosion inhibition provided a
TCP coating (Alodine® 5900) on AA2024-T3. Prior to formation of the coating, alloy
surfaces were degreased and deoxidized in either an aggressive acidic fluoride medium
(Turco® Smut-Go) for different periods of time or in less aggressive 0.1 M NaOH.
Figure 7.1 Proposed conversion coating structure on (A) an alloy pretreated to minimize surface roughening and pitting and (B) an alloy pretreated in a manner that increases surface roughening and pitting.

146
7.2 Results
7.2.1 Deoxidizing/desmutting in acidic fluoride Smu t-Go.
Figure 7.2 shows profilometry contour plots (left) of AA2024 specimens after
treatment times from 0-12 min in Smut-go. Corresponding SEM micrographs (right) of
TCP-coated panels that were deoxidized for the same times are also presented. In the
contour plots, only a few pits are detected on the alloys after the shorter treatment times
(0.5 and 2 min). In contrast, significantly greater roughness and pitting are seen for the
longer times (6 and 12 min). Rather deep pits with depths on the order of 1 µm were
observed after the 12-min treatment. The increased surface damage with treatment time
is also apparent in the SEM micrographs of the TCP-coated substrates. A greater level
of roughening and pitting can be seen for the substrates pretreated by longer
deoxidation times, particularly the 6 and 12-min treatments. The damage is especially
pronounced near the intermetallic inclusions. The elongated precipitates visible in the
images are characteristic of this TCP coating.114
The bright collar around the pit mouth
is due to the “edge” effect of the electron beam during imaging in the secondary
electron mode.185

147
Figure 7.2 Profilometry contour plots (left) of AA2024 specimens before and after deoxidation in Smut-Go for different times. SEM micrographs (right) of TCP-coated AA2024 specimens prepared by deoxidation for different times in Smut-Go. Red arrows indicate the pits and damage sites, whereas yellow ones indicate the visible intermetallics.
1 µm
-2 µm
Before No deox 10 µm
30 s 30 s
2 min 2 min
6 min 6 min
12 min 12 min
1.0 0.5
0 0.65
1.3 µm
1.0 0.5
0 0.65
1.3 µm
1.0 0.5
0 0.65
1.3 µm
1.0
0.5
0 0.65
1.3 µm
1.0 0.5
0 0.65
1.3 µm
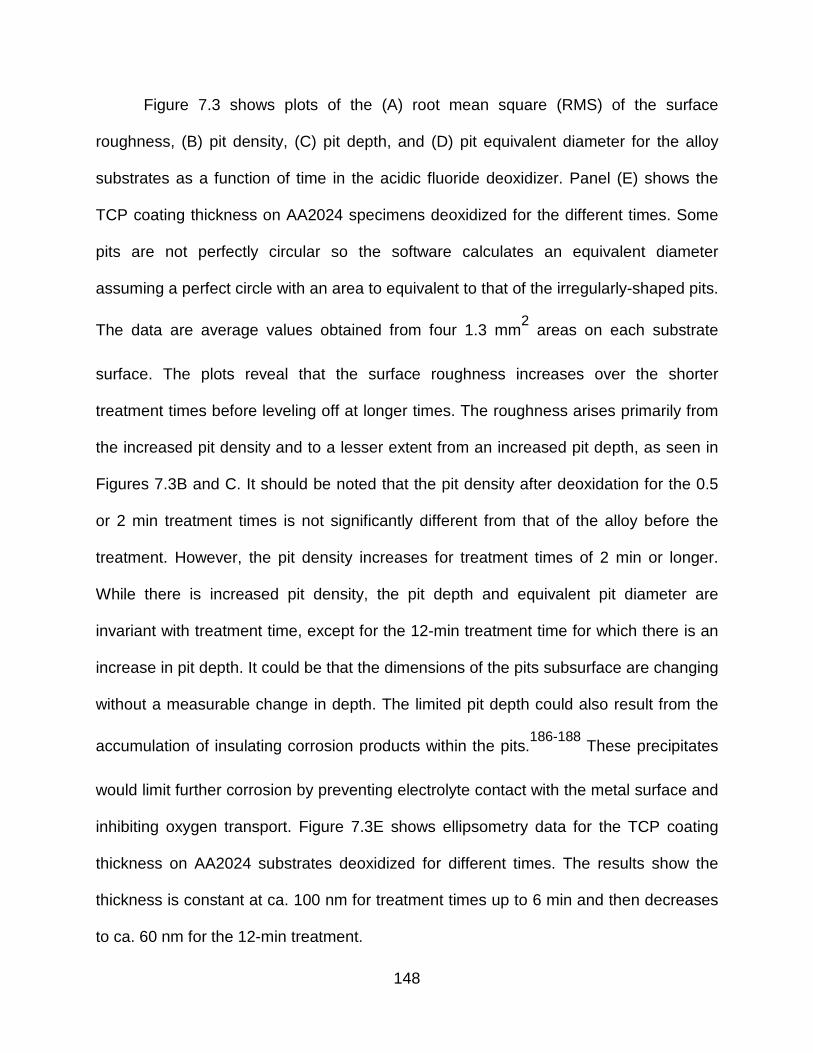
148
Figure 7.3 shows plots of the (A) root mean square (RMS) of the surface
roughness, (B) pit density, (C) pit depth, and (D) pit equivalent diameter for the alloy
substrates as a function of time in the acidic fluoride deoxidizer. Panel (E) shows the
TCP coating thickness on AA2024 specimens deoxidized for the different times. Some
pits are not perfectly circular so the software calculates an equivalent diameter
assuming a perfect circle with an area to equivalent to that of the irregularly-shaped pits.
The data are average values obtained from four 1.3 mm2 areas on each substrate
surface. The plots reveal that the surface roughness increases over the shorter
treatment times before leveling off at longer times. The roughness arises primarily from
the increased pit density and to a lesser extent from an increased pit depth, as seen in
Figures 7.3B and C. It should be noted that the pit density after deoxidation for the 0.5
or 2 min treatment times is not significantly different from that of the alloy before the
treatment. However, the pit density increases for treatment times of 2 min or longer.
While there is increased pit density, the pit depth and equivalent pit diameter are
invariant with treatment time, except for the 12-min treatment time for which there is an
increase in pit depth. It could be that the dimensions of the pits subsurface are changing
without a measurable change in depth. The limited pit depth could also result from the
accumulation of insulating corrosion products within the pits.186-188
These precipitates
would limit further corrosion by preventing electrolyte contact with the metal surface and
inhibiting oxygen transport. Figure 7.3E shows ellipsometry data for the TCP coating
thickness on AA2024 substrates deoxidized for different times. The results show the
thickness is constant at ca. 100 nm for treatment times up to 6 min and then decreases
to ca. 60 nm for the 12-min treatment.

149
Figure 7.3 Plots of the (A) surface roughness (RMS), (B) pit density, (C) pit depth and (D) equivalent pit diameter for AA2024 specimens treated in Smut-go for different times. Values for the alloy before deoxidation are also shown for comparison (◊). Data were
obtained from the analysis of profilometry contour plots. Only the pits of 7 µm2 or
greater in area and 0.5 µm or greater in depth were regarded as significant. (E) Plot of the TCP coating thickness, as determined from ellipsometry, on AA2024 specimens treated in Smut-go for different times. Each datum is an average value of 3 spots on each sample. Asterisk indicates significant difference from the values for the untreated controls (0-min treatment).
The surface roughness and pit density both have an effect on the corrosion
inhibition provided by the TCP conversion coating as is indicated by the electrochemical
data presented in Figure 7.4. Plots of the (A) corrosion potential, Ecorr, and (B)
polarization resistance, Rp, for TCP-coated AA2024 samples deoxidized for periods of
time from 0.5-12 min are presented. There was no statistically significant change in
Ecorr for the TCP-coated alloys for all the treatment times (-0.3 to -0.4 V). Interestingly,
Rp progressively decreased with treatment time by up to 4× for the 12-min deoxidation
70
60
0 4
Rou
ghne
ss (
nm)
50
8 12
20
10
0 4 Pit
Den
sity
(m
m-2
)
0 8 12
1.5
1.0
0 4
Pit
Dep
th (
µm
)
0.5
8 12 0
4
0 4
Pit
Dia
met
er (
µm
)
8
8 12 0
Deoxidizing Time (min) Deoxidizing Time (min)

150
time. Actually, Rp for the sample treated for 12 min, 0.96 (± 0.23) × 105 Ω·cm
2, is
similar to the value for the degreased and deoxidized but uncoated alloy in the same
electrolyte.114
The decreasing Rp suggests that the coating is providing progressively
inferior barrier protection. It is likely that the roughness and pitting (density and
dimensions) are such that the conversion coating incompletely covers the exposed
surface or is more defective, as depicted in Figure 7.1B.
Figure 7.4 (A) Corrosion potential, Ecorr and (B) polarization resistance, Rp, for TCP-coated AA2024 specimens after deoxidation times of 0.5, 2, 6, and 12 min. All
measurements were made in naturally aerated 0.5 M Na2SO4 + 0.01 M NaCl. Each datum is an average of three replicates with the standard error revealed by the bars.
7.2.2 Deoxidizing/desmutting in alkaline halide-fre e 0.1 M NaOH.
Comparison tests were performed TCP-coated specimens that were deoxidized
in alkaline (0.1 M NaOH) solution, which etches the aluminum more uniformly as
compared to the acidic Smut-Go. Alkaline etch treatments react with the aluminum to
0 4 8 12 Deoxidizing Time (min)
0 4 8 12 Deoxidizing Time (min)
0.0
-0.4
E (
V v
s A
g/A
gCl)
-0.8
10
Rp
(×10
5 Ω·c
m2 )
1

151
generate hydrogen, and complex oxides and hydroxides of aluminum. For example, the
following oxide dissolution/metal corrosion reaction can occur:
Al(OH)3 + NaOH → Na[Al(OH)4] (7.1)
2Al + 2NaOH + 6H2O → 2Na[Al(OH)4] + 3H2 (7.2)
Figure 7.5 presents a comparison of SEM micrographs of AA2024 specimens
after (A) degreasing, (B) degreasing and deoxiding for 2 min in 0.1 M NaOH and (C)
degreasing and deoxidizing in Smut-Go for 2 min. The intermetallic inclusion, several
micrometers in dimension, after degreasing (Fig. 7.5A), and degreasing and deoxidizing
in NaOH (Fig. 7.5B) remained fairly smooth. There was no dissolution of the inclusion or
any trenching of the aluminum around the inclusion. In contrast, treatment in Smut-Go
caused dissolution of the inclusion such that Al and Mg were removed leaving behind a
pitted crater with Cu deposits at the bottom.184
The crater has steep walls and
significant roughening and pitting at the base. It is these features that are likely difficult
to completely coat with the TCP (refer to Figure 7.1B).
Figure 7.5 SEM micrographs of the uncoated AA2024 after (A) degreasing, (B) degreasing and deoxidizing for 2 min in 0.1 M NaOH and (C) degreasing and deoxidizing for 2 min in Smut-Go. The micrographs were taken with the samples tilted by 54º towards the secondary electron detector. These intermetallic compounds contain Al, Cu, Fe, and Mn according to EDAX analysis data that are not shown here.
2 µm 2 µm 2 µm
A B C

152
Figure 7.6 presents an SEM micrograph of a TCP-coated AA2024 specimen
prepared by degreasing and deoxidizing in NaOH for 2 min. EDX elemental line profiling
data across an intermetallic inclusion are also presented. First, a much smoother
substrate surface is evident in this image as compared to the images shown in Figure
7.2 for the Smut-go treated substrates. Second, it can be seen that the intermetallic
inclusion is rich in Cu, Fe, and Mn with no dealloying. The elongated precipitates (white)
again are characteristic of this TCP coating are visible in the image. They contain Zr, O,
Cr, and F as evidenced by the increased elemental intensities at ca. 20 and 90 µm.114
The intermetallic inclusion in the center of the image is about 10 µm in diameter. The
coating is enriched at this site, compared to the surrounding aluminum matrix, as
evidenced by the increased signal intensities for Zr, O, Cr, and F at ca. 50 µm. The Zr
and O signals arise from the zirconia and the Cr signal comes from Cr(III) oxide in the
TCP coating.114, 180
The F signal arises, at least in part, from the biphasic structure of
the TCP coating.114, 180

153
Figure 7.6 SEM micrograph and EDAX elemental line profiling data for the TCP-coated AA2024 formed after degreasing and a deoxidation time of 2 min in 0.1 M NaOH.
400
200
0 30
Inte
nsity
(co
unts
)
0 60 90
400
200
0 30 0
60 90
400
200
0 30 0
60 90 µm
400
200
0 30 0
60 90
400
200
0 30 0
60 90 µm
400
200
0 30 0
60 90
400
200
0 30 0
60 90 µm
1000
5000
0 30 0
60 90 10 µm

154
Table 7.1 Summary of the physical properties and electrochemical paramaters measured for TCP-coated AA2024 specimens degreased and deoxidized for 2 min in either Smut-go or NaOH. The physical properties shown, as determined from optical profilometry, are the surface roughness (RMS), pit density, pit diameter and pit depth.The
electrochemical parameters shown are Ecorr, Epit, and Rp.
Treatments Physical Properties Electrochemistry
RMS (nm)
Pit density
(/mm2)
Pit diam. (µm)
Pit depth (µm)
Ecorr (V vs Ag/AgCl)
Epit (V vs Ag/AgCl)
Rp
(×105 Ω·cm
2)
Without Deox 51.3 ± 1.4 1.0 ± 0.6 5.9 ± 0.5 -0.9 ± 0.1 -0.42 ± 0.02 0.17 ± 0.03 2.15 ± 0.85
Smut-Go 60.7 ± 3.3* 2.3 ± 1.6 5.9 ± 2.2 -0.1 ± 0.2 -0.30 ± 0.06 0.58 ± 0.07* 2.35 ± 0.13
NaOH 58.8 ± 1.0* 1.8 ± 0.7 4.6 ± 0.6 -0.6 ± 0.0* -0.39 ± 0.01 0.78 ± 0.10* 12.23 ± 4.66*
All measurements were conducted in naturally aerated 0.5 M Na2SO4 + 0.01 M NaCl. Data for coated alloys without any deoxidation pretreatment are shown for comparison. Each datum represents a mean value ± S.E.M. (n ≥ 3). Asterisks are used to indicate the statistically significantly different values between the three treatments (t-test at 95% confidence interval). All values are compared to those for the coated samples formed without any deoxidation.

155
Table 7.1 presents data for the surface roughness (RMS), pit density, pit
diameter, and pit depth for alloys after degreasing and a 2-min deoxidation in either
Smut-Go or NaOH. The deoxidized alloys exhibit several physical properties that are
statistically similar to those for the untreated controls (without deox). The exceptions are
the roughness and the pit depth. The surface roughness for the substrates pretreated in
both media is slightly greater than the roughness for the control samples. No differences
are seen in the pit density or pit diameter of the pretreated samples relative to the
controls. The pit depth for the alkaline treated samples is less than that for either the
Smut-go treated or the untreated controls due to the more uniform etching of the
surrounding aluminum matrix. In short, the 2-min treatment times in both media produce
minimal changes in the substrate surface structure, as compared to the longer
deoxidation times in Smut-go. The main difference appears to be the reduced pit depth
after pretreatment in NaOH.
Table 7.1 presents some electrochemical data recorded for the TCP-coated
substrates in naturally aerated 0.5 M Na2SO4 + 0.01 M NaCl. Shown are Ecorr, the
breakdown potential for pit initiation, Epit, and Rp for the TCP-coated alloys prepared
using a 2-min deoxidation step in the two media. Data for the coated samples without
deoxidation are also shown for comparison. No significant difference in Ecorr is seen for
all three sample sets. However, the breakdown or pitting potential, Epit, for the coated
samples after either deoxidation treatment is more noble than the value for the coated
samples without any deoxidation. For example, Epit is shifted positive by 400 mV (0.58
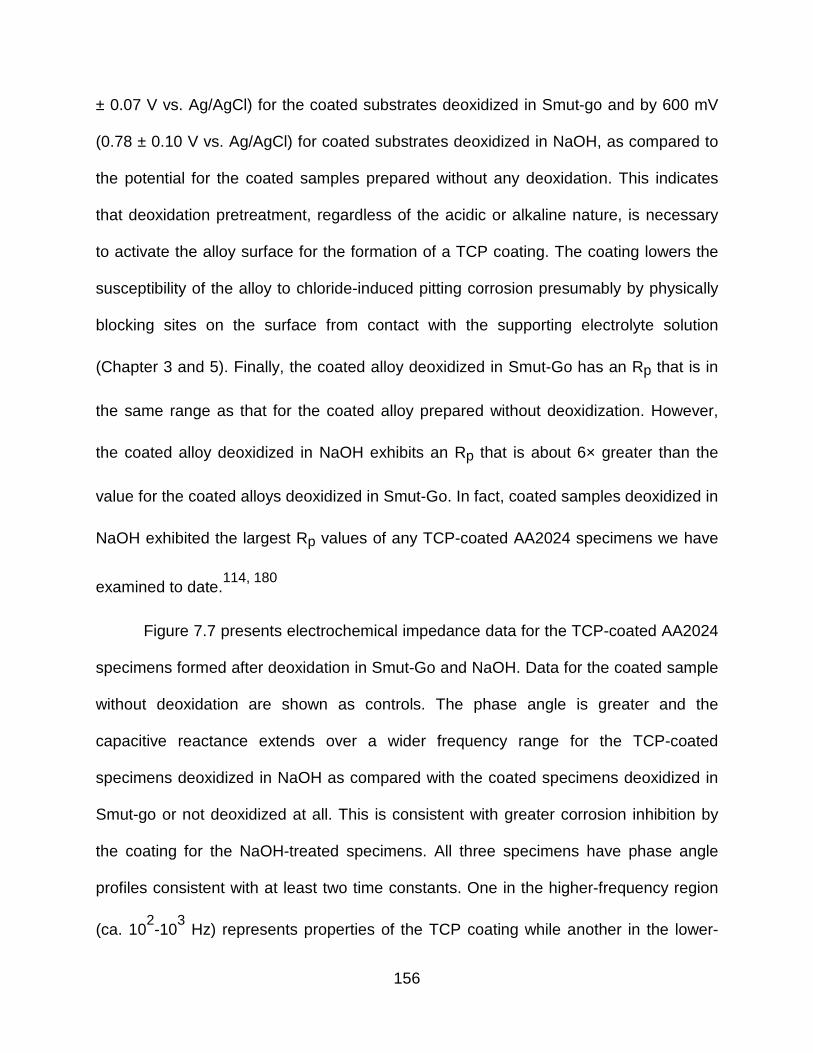
156
± 0.07 V vs. Ag/AgCl) for the coated substrates deoxidized in Smut-go and by 600 mV
(0.78 ± 0.10 V vs. Ag/AgCl) for coated substrates deoxidized in NaOH, as compared to
the potential for the coated samples prepared without any deoxidation. This indicates
that deoxidation pretreatment, regardless of the acidic or alkaline nature, is necessary
to activate the alloy surface for the formation of a TCP coating. The coating lowers the
susceptibility of the alloy to chloride-induced pitting corrosion presumably by physically
blocking sites on the surface from contact with the supporting electrolyte solution
(Chapter 3 and 5). Finally, the coated alloy deoxidized in Smut-Go has an Rp that is in
the same range as that for the coated alloy prepared without deoxidization. However,
the coated alloy deoxidized in NaOH exhibits an Rp that is about 6× greater than the
value for the coated alloys deoxidized in Smut-Go. In fact, coated samples deoxidized in
NaOH exhibited the largest Rp values of any TCP-coated AA2024 specimens we have
examined to date.114, 180
Figure 7.7 presents electrochemical impedance data for the TCP-coated AA2024
specimens formed after deoxidation in Smut-Go and NaOH. Data for the coated sample
without deoxidation are shown as controls. The phase angle is greater and the
capacitive reactance extends over a wider frequency range for the TCP-coated
specimens deoxidized in NaOH as compared with the coated specimens deoxidized in
Smut-go or not deoxidized at all. This is consistent with greater corrosion inhibition by
the coating for the NaOH-treated specimens. All three specimens have phase angle
profiles consistent with at least two time constants. One in the higher-frequency region
(ca. 102-10
3 Hz) represents properties of the TCP coating while another in the lower-

157
frequency region (ca. 0.1-100 Hz) represents the double layer at the exposed metal
surface.116
Table 7.2 shows the best-fit parameters of the experimental EIS data to the
equivalent circuit for a porous coating (Chapter 2). The data reveal that the coated
specimen formed after NaOH treatment exhibits a ~5× greater Rpo and a ~5× smaller
Cdl compared to coated specimens formed after Smut-Go treatment. This is attributed
to a more continuous and less defective conversion coating, which results from the
lower degree of surface roughening and pitting. In other words, less metal is exposed to
the electrolyte solution for the coated specimens when the alkaline etch are used. This
leads to a ~10× greater Rp for the samples deoxidized in NaOH. This is consistent with
the Rp values in Table 7.1, which were determined from linear polarization curves. The
TCP-coated samples formed without deoxidation exhibit a greater Rpo and a smaller Cdl
as compared to the coated samples formed after deoxidation in Smut-Go. This is
attributed to the Al oxide layer that forms during degreasing at 55 °C that is not
completely removed during immersion in the coating solution.
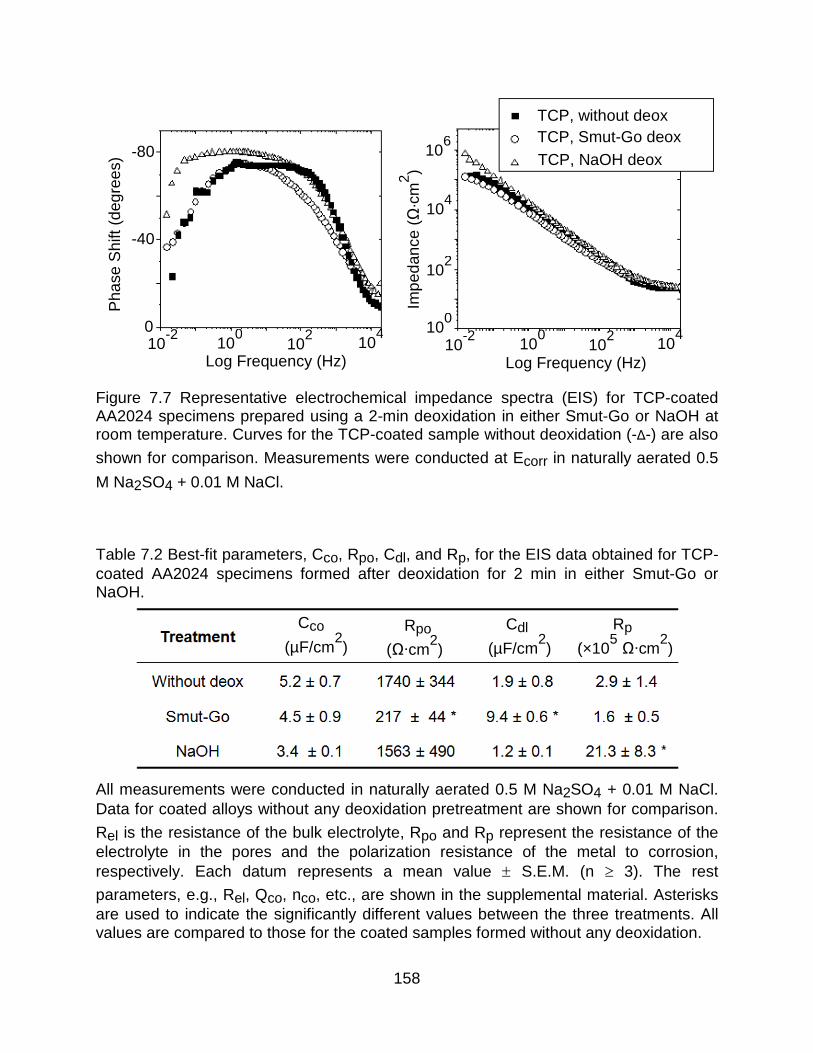
158
Figure 7.7 Representative electrochemical impedance spectra (EIS) for TCP-coated AA2024 specimens prepared using a 2-min deoxidation in either Smut-Go or NaOH at room temperature. Curves for the TCP-coated sample without deoxidation (-∆-) are also
shown for comparison. Measurements were conducted at Ecorr in naturally aerated 0.5
M Na2SO4 + 0.01 M NaCl.
Table 7.2 Best-fit parameters, Cco, Rpo, Cdl, and Rp, for the EIS data obtained for TCP-coated AA2024 specimens formed after deoxidation for 2 min in either Smut-Go or NaOH.
All measurements were conducted in naturally aerated 0.5 M Na2SO4 + 0.01 M NaCl. Data for coated alloys without any deoxidation pretreatment are shown for comparison.
Rel is the resistance of the bulk electrolyte, Rpo and Rp represent the resistance of the electrolyte in the pores and the polarization resistance of the metal to corrosion, respectively. Each datum represents a mean value ± S.E.M. (n ≥ 3). The rest
parameters, e.g., Rel, Qco, nco, etc., are shown in the supplemental material. Asterisks are used to indicate the significantly different values between the three treatments. All values are compared to those for the coated samples formed without any deoxidation.
10-2
0
-40
-80
Pha
se S
hift
(deg
rees
)
Log Frequency (Hz) 10
0 10
2 10
4
106
Impe
danc
e (Ω
·cm
2 )
Log Frequency (Hz) 10
0 10
2 10
4 10
-2
104
102
100
TCP, without deox TCP, Smut-Go deox TCP, NaOH deox
Cco
(µF/cm2)
Rp
(×105 Ω·cm
2)
Cdl
(µF/cm2)
Rpo
(Ω·cm2)

159
Figure 7.8 presents potentiodynamic polarization curves for TCP-coated AA2024
samples prepared by 2-min deoxidation in either Smut-Go or NaOH. Curves for the
coated substrates without any deoxidation pretreatment are also shown for comparison.
The cathodic current at about ca. -0.6 V vs Ag/AgCl results from the reduction of
dissolved oxygen that occurs primarily at Cu-rich intermetallic sites. The coated sample
deoxidized in NaOH exhibits greater suppression of the cathodic current in this potential
region by a factor of about 10× as compared to the coated samples prepared with no
deoxidation step or after deoxidation in Smut-go. This is due, at least in part, to the
oxide layer that forms on the Cu sites during treatment in NaOH.110
The oxide film
appears to be sufficiently thick that it is not completely dissolved in the fluoride-
containing TCP bath. Therefore, fewer active copper sites are available for dissolved
oxygen reduction as compared to the coated substrates formed without any deoxidation
or after deoxidation in Smut-Go. Further evidence for the more passive copper oxide
film after deoxidation in NaOH is the suppressed copper stripping peak (Cu → Cu2+
) at
ca. about 0.2 V vs. Ag/AgCl. In contrast, the anodic currents are attenuated at similar
levels for deoxidized substrates regardless of the deoxidation treatment. The
suppressed currents could also be due to the formation of a magnesium oxide film
across the entire alloy surface during immersion in NaOH.189
For magnesium-
containing alloys, such as AA2024-T3 and AA7075-T6, magnesium diffuses to the
surface and forms an oxide layer of several tens of nanometers thick.189-193
According
to the E-pH diagram of Mg, the oxide film contains mainly Mg(OH)2 that is stable in
aqueous solutions of pH greater than about 11.194-195
This Mg oxide film may be

160
beneficial in terms of forming a less defective TCP coating.189
Finally, Epit is shifted to
more positive potentials for both deoxidized samples, as compared to the coated
sample formed with no deoxidation. The breakdown potential for the substrate
deoxidized in NaOH is shifted the most positive consistent with greater corrosion
inhibition.
Figure 7.8 Representative potentiodynamic polarization curves for TCP-coated AA2024 formed after deoxidizing (2 min) in Smut-Go (--) or NaOH (--). Curves for the TCP-coated substrates formed without any deoxidation step (-∆-) are shown for comparison.
Measurements were conducted in naturally aerated 0.5 M Na2SO4 + 0.01 M NaCl. Scan rate = 2 mV/s.
7.3 Discussion
The results indicate that controlling the deoxidation/desmutting chemistry and
treatment time is important for achieving optimum TCP-linked corrosion inhibition. This
is because the pretreatment can have significant effects on the surface roughness, pit
10-9
i (A/cm
2)
10-7
10-5
10-3
10-1
E (
V v
s A
g/A
gCl)
0.8
0.4
0.0
-0.4
-0.8
Without deox Smut-Go
NaOH

161
density and pit depth, all of which impact the conversion coating coverage and corrosion
inhibition. Substrate surfaces with less damage (roughening and pitting) support the
formation of more continuous and defect-free TCP coatings, and this leads to improved
corrosion inhibition. In this work, the improved corrosion inhibition was manifested by
positive shifts in the chloride-linked breakdown or pitting potential, Epit, and increases in
the polarization resistance, Rp. Achieving such the most protective coating is possible
only if the deoxidation/desmutting chemistry and treatment time are controlled in such a
way to minimize surface roughening, pitting and the formation of deep (steep-walled)
pits.
When AA2024 is deoxidized/desmutted in the acidic fluoride Smut-Go, the
fluoride ions adsorb on and are incorporated into the Al oxide film.196-197
This causes
passivation layer breakdown and leads to significant pitting corrosion, particularly
around the intermetallic sites (Fig. 7.2). This aggressive solution produces increased
surface roughening, pit densities and pit depths. The surface damage becomes more
extensive with treatment time, particularly the 6 and 12-min treatments. The deeper pits
have steep walls and sharp edges that cannot be effectively passivated by the TCP
coating. These are likely the sites where corrosion and coating degradation initiate, as
depicted schematically in Figure 7.1B. Dealloying of the intermetallics also occurs
during deoxidation in Smut-Go, leaving behind only more noble Cu particles at the
bottom of pits. In addition to the inferior corrosion inhibition by TCP coatings formed the
more damaged specimens, there is a reduced TCP coating thickness for the 12-min

162
treatment time. The reason for the coating thinning is unclear at this point. In any event,
a thinner coating is likely more defective and as a consequence is less passivating.
As is the case in the acidic fluoride Smut-Go (pH < 4), the passivating aluminum
oxide film is also dissolved in NaOH (pH > 9). However, compared to the aggressive
localized corrosion mediated by fluoride in Smut-Go (Fig. 7.5C), the aluminum is
dissolved more uniformly (Fig. 7.5B) in alkaline media according to Rxn. (7.1). This is
evidenced by the unchanged roughness, pit density, and pit diameter for alloy samples
treated in 0.1 M NaOH compared to those values prior to treatment (Table 7.1). The
uniform dissolution of the Al leads to a decreased pit depth (Table 7.1).
The corrosion inhibition provided by the TCP coating on AA2024 was assessed
in naturally aerated 0.5 M Na2SO4 + 0.01 M NaCl. The polarization resistance, Rp, for
the TCP-coated substrates decreases progressively as a function of the deoxidizing
time in Smut-Go (Fig. 7.4B). The breakdown potential for pit initiation was also observed
to shift to less positive potentials as a function of the deoxidizing time (data not shown).
Both of these trends reflect reduced corrosion inhibition and they correlate with the
increased surface roughness and pit density for the substrates after pretreatment. In
addition, the reduced coating thickness after the 12-min treatment in Smut-Go (Fig.
7.3E) likely gives rise to more facile mass transport of dissolved O2 to the underlying
metal surface.
In contrast, the best corrosion inhibition we have recorded so far for TCP
conversion coatings on aluminum alloys was achieved on specimens deoxidized in
NaOH. Due to the fact that the specimen surface is not as roughened and pitted as it is

163
in Smut-go, the TCP coating presumably forms more uniformly and with fewer defects,
hence the improved corrosion inhibition. Additionally, the alkaline treatment forms
surface oxides on the Cu intermetallic sites and this serves to inhibit dissolved oxygen
reduction. While our results indicate an alkaline deoxidation treatment is preferred for
AA2024 in order to achieve the most corrosion inhibitory TCP coating, a limitation is that
some “smut” is not dissolved at elevated pH. Therefore for those substrates, significant
desmutting is necessary. In this case, the treatment conditions and time should be kept
as short as possible to minimize surface roughening and pitting
7.4 Conclusion
Research was conducted to understand the effect of deoxidation/desmutting
chemistry and treatment time on the corrosion inhibition provided by TCP coatings on
AA2024-T3 surfaces. Key parameters describing the alloy surface condition, such as
roughness, pit density, and pit depth, are important to control in order to achieve
continuous and low defect conversion coating, which provides the greatest level of
corrosion inhibition. Deoxidation/desmutting in the acidic fluoride Smut-Go causes
increased surface roughening, pit density and pit depth with increasing treatment time.
This aggressive solution causes localized aluminum dissolution around the Cu-rich
intermetallic particles. It produces deep pits with the steep walls and sharp edges that
are difficult to conformally coat with TCP. Therefore, these sites are likely the location
where corrosion and coating degradation initiate. Short immersion times (e.g., 0.5 to 2
min) is recommended for the use with Smut-Go. The most corrosion inhibitory TCP
coating was formed on specimens deoxidized in NaOH. This is attributed to more

164
uniform aluminum dissolution, which leads to less surface roughening and pitting,
especially around intermetallic inclusions. A more continuous and lower defect
conversion coating forms on the alkaline treated alloy surface and this leads to greater
corrosion inhibition as evidenced by a ~10× greater Rp and a more noblel Epit. The
corrosion inhibition also results from the formation surface oxides on the Cu
intermetallic sites, which serve to inhibit the chemisorption of dissolved oxygen, hence
its reduction.

165
CHAPTER 8. EFFECTS OF CURING TEMPERATURE AND TIME ON THE CORROSION INHIBITION PROVIDED BY THE TCP COATING O N AA2024-T3
8.1 Introduction
The TCP coating provides corrosion protection to AA2024 by serving as a barrier
layer, as shown in Chapter 5. It is evidenced by that the polarization resistance, Rp, is
10-100× greater for the coated alloys as compared to the uncoated controls (Chapter 6).
However, it is noted that the coating appears to possess some hydrated channels and
or defects through which solution species and dissolved O2 can be transported to
localized regions of the underlying metal.
A question of interest is, is there any beneficial effect gained by curing the TCP
coating after formation? In other words, can the defect density in the coating be reduced
through controlled curing? In one of only two reports describing curing effects, Guo and
Frankel showed that long-term (48 h) atmospheric curing produces small cracks in the
TCP coating.198
The authors, however, did not report how the corrosion protection was
impacted by these coating alterations. We reported an interesting preliminary finding
that atmospheric curing of TCP-coated AA2024 at room temperature for 72 h increased
Rp from ~105 to 10
9 Ω·cm
2.199
This significant increase in Rp, reflective of improved
barrier properties, was only observed on a few of the coated samples tested.
To date, no systematic study has been conducted on how curing affects the
physical structure and corrosion protection of TCP coatings on aluminum alloys. Herein,
we address this knowledge gap by focusing on the following two questions:
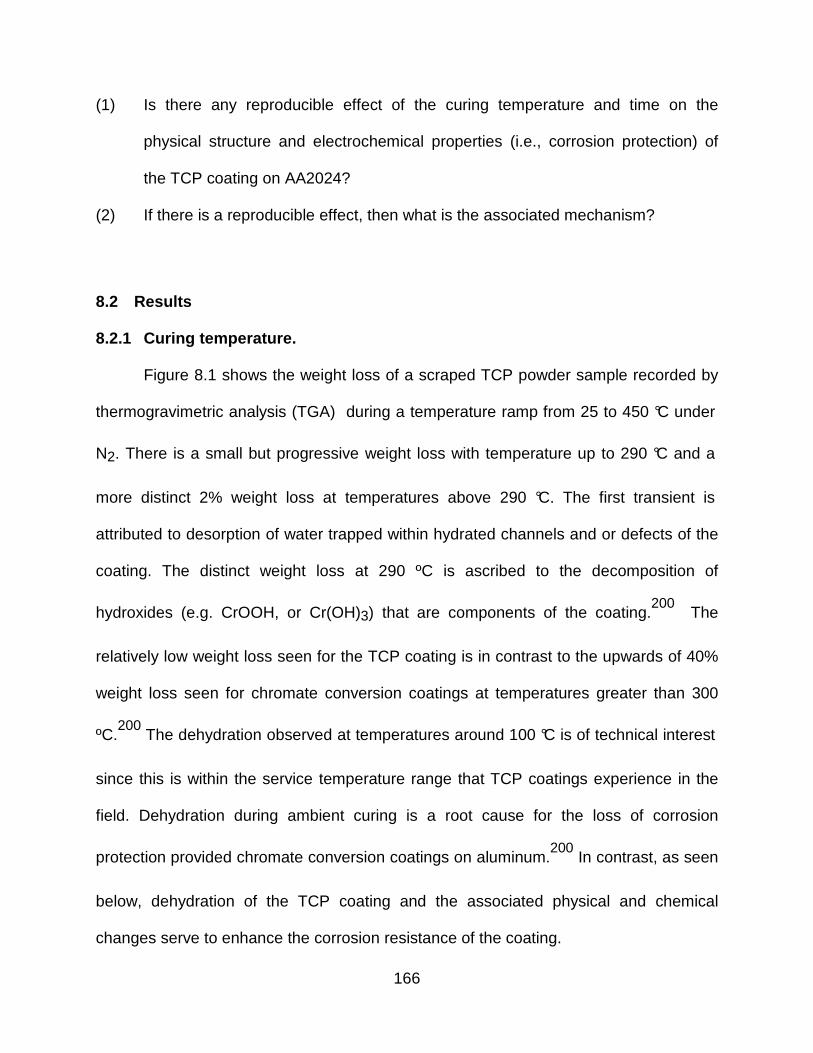
166
(1) Is there any reproducible effect of the curing temperature and time on the
physical structure and electrochemical properties (i.e., corrosion protection) of
the TCP coating on AA2024?
(2) If there is a reproducible effect, then what is the associated mechanism?
8.2 Results
8.2.1 Curing temperature.
Figure 8.1 shows the weight loss of a scraped TCP powder sample recorded by
thermogravimetric analysis (TGA) during a temperature ramp from 25 to 450 °C under
N2. There is a small but progressive weight loss with temperature up to 290 °C and a
more distinct 2% weight loss at temperatures above 290 °C. The first transient is
attributed to desorption of water trapped within hydrated channels and or defects of the
coating. The distinct weight loss at 290 ºC is ascribed to the decomposition of
hydroxides (e.g. CrOOH, or Cr(OH)3) that are components of the coating.200
The
relatively low weight loss seen for the TCP coating is in contrast to the upwards of 40%
weight loss seen for chromate conversion coatings at temperatures greater than 300
ºC.200
The dehydration observed at temperatures around 100 °C is of technical interest
since this is within the service temperature range that TCP coatings experience in the
field. Dehydration during ambient curing is a root cause for the loss of corrosion
protection provided chromate conversion coatings on aluminum.200
In contrast, as seen
below, dehydration of the TCP coating and the associated physical and chemical
changes serve to enhance the corrosion resistance of the coating.
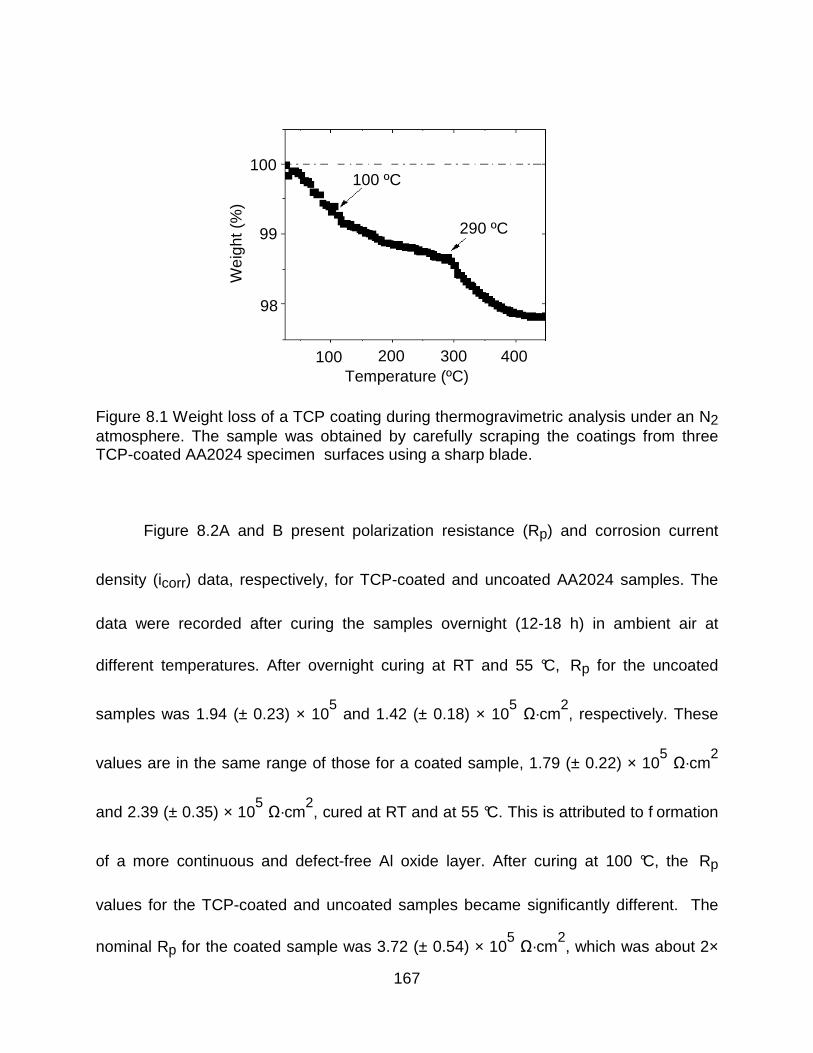
167
Figure 8.1 Weight loss of a TCP coating during thermogravimetric analysis under an N2 atmosphere. The sample was obtained by carefully scraping the coatings from three TCP-coated AA2024 specimen surfaces using a sharp blade.
Figure 8.2A and B present polarization resistance (Rp) and corrosion current
density (icorr) data, respectively, for TCP-coated and uncoated AA2024 samples. The
data were recorded after curing the samples overnight (12-18 h) in ambient air at
different temperatures. After overnight curing at RT and 55 °C, Rp for the uncoated
samples was 1.94 (± 0.23) × 105 and 1.42 (± 0.18) × 10
5 Ω·cm
2, respectively. These
values are in the same range of those for a coated sample, 1.79 (± 0.22) × 105 Ω·cm
2
and 2.39 (± 0.35) × 105 Ω·cm
2, cured at RT and at 55 °C. This is attributed to f ormation
of a more continuous and defect-free Al oxide layer. After curing at 100 °C, the Rp
values for the TCP-coated and uncoated samples became significantly different. The
nominal Rp for the coated sample was 3.72 (± 0.54) × 105 Ω·cm
2, which was about 2×
100 200 300 400 Temperature (ºC)
100
99 W
eigh
t (%
)
98
100 ºC
290 ºC

168
greater than that of the uncoated sample, 1.19 (± 0.07) × 105 Ω·cm
2. Inversely, icorr
decreased by 2× as the temperature increased from RT to 100 °C. A noteworthy
difference was observed for samples cured at 150 °C . Rp decreased significantly to ca.
3.02 (± 0.22) × 104 Ω·cm
2; a value 2× smaller than the value for uncoated samples after
curing at 150 °C and 10× smaller than the values at other temperatures. In contrast, for
the uncoated samples, the nominal Rp value decreased by 2× as the curing
temperature increased from RT to 150 °C, 0.80 (± 0. 10) × 105 Ω·cm
2, due to formation
of more defective oxide films at high temperatures.201
This Rp value after curing at
150 °C is comparable to that for the uncoated sampl es right after deoxidizing (ca. 3 ×
104 Ω·cm
2).
199 Consistent with this, icorr increased by 10× for samples cured at 150 °C
as compared to those at RT.
Figure 8.2 (A) Polarization resistance, Rp, and (B) corrosion current density, icorr data for the TCP-coated () and uncoated () AA2024 after overnight curing in air at varied temperatures: room temperature (RT), 55, 100, and 150 °C. The measurements were
conducted in naturally aerated 0.5 M Na2SO4. Each datum is an average value of 3 samples.
RT 55 ºC 100 ºC 150 ºC
10
1
Rp
(×10
5 Ω·c
m2 )
0.1
RT 55 ºC 100 ºC 150 ºC
0.1
i cor
r (µ
A/c
m2 )
0.01
169
Figure 8.3 presents the electrochemical impedance spectra for TCP-coated
AA2024 after overnight curing at the different temperatures. Table 9.1 shows the best-fit
parameters of the experimental data for RT, 55, and 100 °C to the equivalent circuits
shown in Chapter 2. The phase-frequency profiles (Fig. 8.3B) show two distinct time
constants (peaks) for the coated AA2024 cured at RT, 55, and 100 °C. The higher-
frequency (~103 Hz) time constant arises from the hydrated channels and defects of the
coating (Rpo), while the lower-frequency (~100 Hz) time constant is associated with the
corrosion of the underlying exposed metal (Rp) (see Chapter 2). The high-frequency
impedance Rel, as shown in the impedance-frequency profile (Fig. 8.3A), is essentially
the bulk electrolyte resistance that is about 20 Ω·cm2. Rpo is the electrolyte resistance
in the hydrated channels and or defects of the coating. The fact that that Rpo increases
with temperature up to 100 ºC is consistent with a decreasing number of hydrated
channels and or defects, or a shrinkage of the dimension of these. The Rp values are
consistent with the data in Fig. 8.2A that were obtained from polarization curves. Qpo
and npo are mathematical parameters that are usually used to calculate the effective
coating capacitance by Cpo=Q1/n
R1/n-1
.76-77
The Cpo value decreases as the
temperature increases from RT to 100 °C, which is m ainly attributed to structural
changes as shown in Figure 8.4.

170
Figure 8.3 Bode plots for the TCP-coated AA2024 at Ecorr after overnight curing at the various temperature: room temperature (RT, ), 55 (), 100 (), and 150 °C ( ). Three
measurements were made in naturally aerated 0.5M Na2SO4.
Table 8.1 Best-fit parameters from experimental EIS results of the TCP-coated AA2024 after overnight curing at varied temperatures: room temperature (RT), 55, 100, and
150 °C. The measurements were conducted in naturall y aerated 0.5 M Na2SO4 at room temperature.
Temp (ºC)
Rel
(Ω·cm2)
Qpo
(×10-6
sn/(Ω·cm
2))
npo Cpo
(µF/cm2)
Rpo
(Ω·cm2)
Qdl
(×10-6
sn/(Ω·cm
2))
ndl
Rct
(×105
Ω·cm2)
RT 22 31.05 0.80 1.84 261 20.21 0.93 2.73
55 19 17.92 0.72 0.86 1554 4.22 0.87 3.48
100 20 24.79 0.84 0.21 4717 4.58 0.74 3.95
150 25 - - - - 6.57 0.81 0.29
Figure 8.4A presents data for the apparent porosity or defect parameter change
in the coating after overnight curing at the different temperatures. The hypothesis is that
curing at elevated temperature dehydrates the coating causing it to shrink and become
more continuous over the surface. The dimensions and or number of hydrated channels
106
Mag
(Ω
)
10-2
Log f (Hz)
100 10
2 10
4 10
6
104
102
10-2
Log f (Hz)
100 10
2 10
4 10
6
Pha
se S
hift
(º)
-80
-60
-40
-20
0
RT 55 ºC 100 ºC 150 ºC
A B

171
and defects are expected to decrease. A more continuous and less defective coating
would explain the increased Rp values. The defect parameter, which is reflective of the
fraction of hydrated channels and or defects, decreases modestly from 0.25 to 0.13% as
the overnight-curing temperature increases from RT to 100 °C. Additionally, a more
defect-free Al oxide layer likely forms on the exposed regions of the Al alloy where the
channels and defects originally exist. Shrinkage or densification of the coating is evident
in the ellipsometric data presented in Figure 8.4B. Clearly, the coating thickness
decreases with curing temperature up to 100 °C. Fig ure 8.4C presents the static water
contact angle for the TCP-coated alloy as a function of the curing temperature. The
contact angle increases from 7.9 (± 1.3) º at RT, to 20.1 (± 4.3) º at 55 °C, and to 102.2
(± 2.8) º at 100 °C. As the coating becomes less hy drated and shrinks, the coating
becomes more hydrophobic.
Figure 8.4 (A) Defect parameter, (B) coating thickness, and (C) contact angle of static water on the TCP-coated () and uncoated () AA2024 after overnight curing in air at various temperatures: room temperature (RT), 55 and 100 °C. Each datum is an average of 3 measurements. The open squares in (B) represent the thickness of Al-oxide layers.
RT 55 ºC 100 ºC
0.4
0.3
Def
ect P
aram
eter
(%
)
0.2
0.1
RT 55 ºC 100 ºC
80
60
Thi
ckne
ss (
nm)
40
20
100
Con
tact
Ang
le (
deg.
)
60
20
RT 55 ºC 100 ºC
80
40
0

172
8.2.2 Curing time.
Figure 8.5 presents the effects of curing time at room temperature (RT) on the
physical properties of the TCP coating. Fig. 8.5A shows that the coating is about 90 nm
thick at formation and remains the same thickness during the 7-day curing period. This
thickness is consistent with other published data.72, 198-199, 202
However, the static
water contact angle increases gradually from 5.6 (± 1.8) º after overnight curing to 63.1
(± 0.3) º after 7-day curing, as shown in Fig. 8.5B. Clearly, the coated surface becomes
more hydrophobic with time, suggestive of a chemical change. The chemical change is
linked to the Cr(III) oxides.200
This is evidenced by the much smaller water contact
angle of the non-Cr TCP-coated alloy surface compared to that of the full TCP-coated
surface throughout the whole 7-day curing, as seen in Fig. 8.5B. Furthermore, a thin Al
oxide film of several nanometers in thickness forms on the uncoated sample during
curing at RT, as shown in Fig. 8.5A.
Figure 8.6 shows effects of curing periods on the electrochemical properties of
the TCP-coated AA2024 during curing in air at room temperature (RT): (A) Ecorr and (B)
Rp. The Ecorr value shifts in the positive direction as the samples were cured for a
longer period, as shown in Figure 8.6A. This is attributed to formation of Al oxides at the
bottom of the channels and defects in the TCP coating on the alloys, but only at the Al
matrix sites. A similar trend is also seen for the uncoated samples. Figure 8.6B shows
the Rp values for the TCP-coated and uncoated samples as functions of the curing
period. The uncoated sample after 1-day curing exhibits an Rp value (ca. 2×10⁵ Ω·cm
2)

173
that is about 10× greater than that right after deoxidization (ca. 3×10⁴ Ω·cm
2). This is
due to formation of an inert Al oxide film. The Rp value stays relatively constant in this
range through the entire 7-day curing period. In contrast, Rp for the TCP-coated alloy
increases by about 4×, from ca. 2×10⁵ Ω·cm
2 after overnight curing to ca. 8×10
5 Ω·cm
2
after 7-day curing. This is attributed to dehydration of the coating, which reduced the
number of defects and hydrated channels, as well as the formation of a more defect-
free Al oxide film in those uncoated regions that restricts access of solution species and
dissolved O2 to the metal surface.
Figure 8.5 Effects of curing period on the physical and chemical properties of the TCP-coated AA2024 during curing in air at room temperature (RT): (A) thickness of TCP coatings for the coated samples () and that of Al oxide films for the uncoated samples (), and (B) contact angle of static water on the uncoated (), TCP-coated () and non-Cr TCP-coated () samples. Each datum is an average of 3 measurements.
80
Thi
ckne
ss (
nm)
40
20
60
0
TCP Uncoated
TCP Uncoated Non-Cr TCP
0 2 4 6 Time (days)
8 0 2 4 6 Time (days)
8
60
Con
tact
Ang
le (
deg.
) (n
m)
20
40
0
60
A B
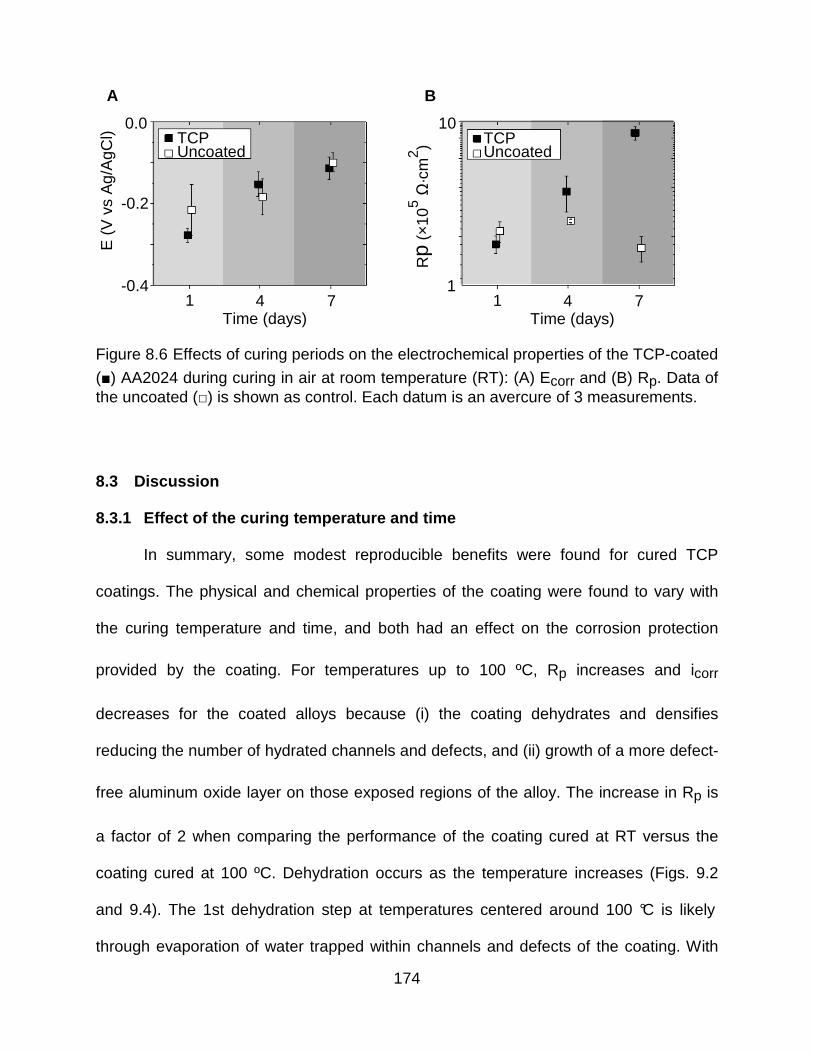
174
Figure 8.6 Effects of curing periods on the electrochemical properties of the TCP-coated
() AA2024 during curing in air at room temperature (RT): (A) Ecorr and (B) Rp. Data of the uncoated () is shown as control. Each datum is an avercure of 3 measurements.
8.3 Discussion
8.3.1 Effect of the curing temperature and time
In summary, some modest reproducible benefits were found for cured TCP
coatings. The physical and chemical properties of the coating were found to vary with
the curing temperature and time, and both had an effect on the corrosion protection
provided by the coating. For temperatures up to 100 ºC, Rp increases and icorr
decreases for the coated alloys because (i) the coating dehydrates and densifies
reducing the number of hydrated channels and defects, and (ii) growth of a more defect-
free aluminum oxide layer on those exposed regions of the alloy. The increase in Rp is
a factor of 2 when comparing the performance of the coating cured at RT versus the
coating cured at 100 ºC. Dehydration occurs as the temperature increases (Figs. 9.2
and 9.4). The 1st dehydration step at temperatures centered around 100 °C is likely
through evaporation of water trapped within channels and defects of the coating. With
E (
V v
s A
g/A
gCl)
-0.4
0.0
-0.2
TCP Uncoated
TCP Uncoated
1 4 7 Time (days)
1 4 7 Time (days)
10
1
Rp
(×10
5 Ω·c
m2 )
A B
175
this loss of water, the coating becomes thinner. Consistent with the decrease in the
number of hydrated channels and defects, the apparent porosity (i.e., defect parameter
measure) of the coating decreases by about 2× after curing at 55 and 100 °C compared
to that at room temperature (RT) (Fig. 9.4A). The loss of water leads to shrinkage of the
coating as the thickness, determined by ellipsometry, decreases from about 90 nm at
RT to about 70 nm at 55 and 100 °C (Fig. 9.4B). In addition, curing at elevated
temperature (100 °C) also induces formation of a mo re defect-free Al oxide layer on the
exposed areas of the alloy. This also contributes to a decrease in the apparent coating
porosity and the increase Rp. The coating also becomes progressively more
hydrophobic with curing temperature as evidenced by the increasing static water
contact angle from 7.9 ± 1.3 at RT to 102.2 ± 2.8 degrees at 100 ºC (Fig. 9.4C). We
showed that this change in contact angle is largely due to the presence of Cr(III) in the
coating as the same hydrophobic changes were not observed for hexafluorozirconate
coatings devoid of Cr(III). In summary, overnight curing at up to 100 ºC produces
modest increases in the corrosion resistance of the coatings, as assessed from Rp
values, by a factor of two. Unfortunately, we did not observe any of the significantly
increased in Rp values (~109 Ω·cm
2) as was previously reported.
199 The decreased
apparent porosity is an indication of fewer hydrated channels and defects as pathways
for the transport of solution species and dissolved O2 to the underlying metal surface.
Curing at 150 ºC caused deleterious changes in the coating. At this temperature,
significant coating dehydration occurs such that cracks form and sections of the coating
detach from the surface. This exposes an increased fraction of the alloy surface to

176
contact with the electrolyte solution. As a consequence, Rp decreases to the same
range as that for the bare sample (ca. 3×10⁴ Ω·cm
2) right after desmutting. Clearly,
curing at this elevated temperature is not recommended.
Besides the curing temperature, the curing time can affect the structure of the
TCP coating and the corrosion protection it provides on AA2024. With curing at RT, the
coating thickness (Fig. 9.5A) does not appear to change significantly but the wettability
does. There is a progressive increase in the static water contact angle from 5.6 ± 1.8 at
day 1 to 63.1 ± 0.3 degrees at day 7. Importantly, Rp increases by 4× during this period
from 2 × 10⁵ to 8 × 10
5 Ω·cm
2 (Fig. 9.6B). Frankel et al. reported possible shrinkage of
the coating for long periods of atmospheric curing (48 h). We did not observe any
significant shrinkage, at least under our curing conditions (Fig. 9.5A). Therefore, for
curing time at RT, unlike the effects of curing temperature, a thinning or densification of
the coating is not the explanation for the increased Rp. We attribute the increased
corrosion resistance to (i) growth of a more defect-free aluminum oxide layer on the
exposed areas of the alloy and (ii) the increased hydrophobicity of the coating. Changes
associated with the Cr(III) species cause the coating to become more hydrophobic over
time. The new structure inhibits water from contacting the underlying metal surface.
8.3.2 Effect mechanisms
For the coatings cured at elevated temperature, the 2× increase in Rp is
attributed to a reduction in the number of hydrated channels and defects because of (i)
thinning of the coating due to dehydration, (ii) changes in the chemical nature of the
177
Cr(III) species that make the coating more hydrophobic and (iii) growth of a more
defect-free aluminum oxide layer on the exposed regions of the alloy surface. For the
coatings cured at room temperature for different periods of time, the 4× increase in Rp
occurs because of (i) changes in the chemical nature of the Cr(III) species that make
the coating more hydrophobic and (ii) growth of a more defect-free Al oxide layer on the
exposed regions of the alloy surface. Buchheit et al. used the extended x-ray fine
structure technique and found a shortening in Cr(III)-Cr(III) nearest neighbor distances
upon dehydration of the Cr(III) oxide layer.200
This leads to a short-range structural
rearrangement and polymerization of these Cr(III) oxides.200, 203
While the corrosion
resistance of the coating can be improved with curing, the more hydrophobic coating
might be a disadvantage for topcoat adhesion as many of the coatings used are
aqueous-based. This point remains to be studied.
8.4 Conclusion
The effects of curing temperature and time on the electrochemical properties (i.e.,
corrosion resistance) of TCP coatings on AA2024-T3 were investigated. The TCP
coating undergoes dehydration and condenses when cured at elevated temperatures.
This along with the growth of a more defect-free aluminum oxide layer occurs during
curing overnight at elevated temperature (≤ 100 ºC). The coating also becomes
progressively hydrophobic with the loss of water and associated chemical changes. All
three contribute to the improved corrosion protection. However, curing at 150 ºC causes
excessive dehydration and shrinkage of the coating such that it undergoes severe

178
cracking and even detachment from the metal surface. A longer curing period at room
temperature enhances the corrosion resistance by 4× of the TCP-coated alloy by
forming an aluminum oxide layer on the metal sites exposed in the coating channels
and defects. The improvement in corrosion inhibition with curing at room temperature is
also associated with increasing hydrophobicity of the coating. The best improvement in
corrosion resistance was seen for coatings cured at room temperature for 7 days.

179
CHAPTER 9. CORROSION PROTECTION PROVIDED BY OTHER NON-CHROMIUM CONVERSION COATINGS ON AA2024-T3
9.1 Introduction
Besides the trivalent chromium process (TCP) coating, several non-chromium
conversion coating alternatives have been developed to match the process and
technical performance of the chromate conversion coating (CCC). Chapter 1 has
introduced the Zr/Ti-based coating that has fluorozirconate and fluorotitanate in the
coating bath formula. Henkel developed it in early 1980s as known by Alodine® 5200.62
Previous study has showed that Alodine® 5200-coated AA2024 suffered corrosion
within 48 hours during a neutral salt fog test (ASTM B 117).64
Another member in the
fluorozirconate coating family is the Zr/Zn-based conversion coating, namely the non-
chromium pretreatment (NCP) coating. This coating contains the soluble inhibitor
ZnSO4 in the coating solution 66
and it is currently under development in NAVAIR.
However, little is known about the formation, structure, and basic electrochemical
properties of the 5200 and NCP coatings on AA2024. This chapter addresses this
knowledge gap by investigating the formation mechanism, physical structure and basic
electrochemical properties of the 5200 and NCP coatings on AA2024. Their corrosion
protective properties are compared with the TCP coating. This chapter also reports the
coating performance in the galvanic coupled system during two accelerating corrosion
tests: (i) full immersion in NaCl-containing electrolyte solutions at room temperature
(ASTM D6943) and (ii) exposure in moist SO2 at 40 ºC (ASTM G87).

180
9.2 Results
9.2.1 Formation of Ti/Zr coatings
Figure 9.1 presents the open circuit potential (OCP) of an AA2024 sample and
the pH in the interfacial region, both vs. time, recorded during the formation of the 5200
coating. A tungsten microelectrode was positioned near the alloy surface during the
coating formation. The potential of the tungsten microelectrode changes proportionally
with the solution pH.87-89, 92
For a better recording of the pH change, the immersion
was prolonged from the usual 2 to 6 min. Two distinguishable regions are seen. For the
first about 10 s, the OCP of the alloy (solid squares) shifted negatively to about ca. -0.9
V vs Ag/AgCl, during which time the alloy surface is activated by F- and H
+ in the
coating bath; the Al oxide layer is dissolved. The consumption of H+ by cathodic
reactions, such as hydrogen discharge and oxygen reduction, causes the interfacial pH
increase, as shown by the open squares in Fig. 9.1. This pH increase initiates
hydrolysis of fluorometalates in the coating bath to form metal oxide that deposits on the
surface, as shown by the following two chemical reactions:
-6FO22H2TiO-4OH-26TiF ++→+ (9.1)
-6FO22H2ZrO-4OH-26ZrF ++→+ (9.2)
For the remaining immersion period, OCP stabilizes at about -0.9 V vs Ag/AgCl and the
surface pH also stabilizes at about 8. After the 6-min immersion, the microelectrode was
removed from the alloy surface and the pH value re-equilibrates to 2.0-3.5, which is the
value of the coating bath.

181
Figure 9.1 Open circuit potential of the AA2024 sample (dark marks) and the interfacial pH (open marks) at the alloy surface recorded during formation of the 5200 coating (grey background). The pH traces with the white background reflect the value of the coating solution. The coating was formed by immersion at room temperature (21-27 ºC).
9.2.2 Chemical Structure
Figure 9.2 presents (A) an SEM micrograph of the surface of a 5200-coated
AA2024 sample, along with (B) energy-dispersive x-ray (EDAX) spectra collected on the
Al terrace site and (C) line profiles across two intermetallic compounds. The alloy
surface is relatively clean and features several Cu-rich intermetallic compounds and pits.
The diameter of these intermetallic particles ranges from 10 to 15 µm in the long
dimension. The x-ray spectrum collected on the Al terrace (within the red box in Fig.
9.2B) shows distinct signals for Zr (Lα1), O (Kα1), and Ti (Kα1), all characteristic
components of the 5200 coating. EDAX line profiling across the two intermetallic
particles shows that both particles are enriched with Cu, as evidenced by the increased
signal at ca. 20 and 70 µm (Fig. 9.2C). Enhanced signals for Zr (Lα1), O (Kα1), and Ti
(Kα1) are also seen at the Cu-rich intermetallic sites relative to the surround Al sites (Fig.
-0.6
1.2
0.6
0.0
-1.2 0 10 20
1
7
12
Time (min)
E (
V v
s A
g/A
gCl)
pH
OCP of AA2024 pH at alloy surface

182
9.2D-F). This is a common observation from examining several 5200-coated samples. A
greater interfacial pH change is expected near these sites due to the more signal
oxygen reduction reaction kinetics and this presumably leads to greater coating
deposition. In summary, the 5200 coating appears to form over most of the alloy surface
including the intermetallic inclusions.
Figure 9.2 An (A) SEM image, (B) EDX spectrum at the Al terrace site (boxed area), and (C) elemental line profiles across two Cu-rich intermetallic compounds in the 5200-coated AA2024. Profiles were recorded after overnight aging in air.
20 µm
Bare TCP
Ti
Al
Si Zr Mg F
O
40
20
0
Cu Lα1_2 Zr Lα1
Ti Kα1 O Kα1
0 20 40 80 µm 60
6
3
0 0 20 40 80 µm 60
15
10
0 0 20 40 80 µm 60
5
6
0 0 20 40 80 µm 60
3
A B
C D
E F
Inte
nsity
(a.
u.)
Inte
nsity
(a.
u.)
Inte
nsity
(a.
u.)
Inte
nsity
(a.
u.)

183
Figure 9.3 presents (A) an SEM micrograph of the surface of a NCP-coated
AA2024 sample (no sanding or polishing), along with (B) energy-dispersive x-ray (EDAX)
spectra collected on the Al terrace site and (C) line profiles across two intermetallic
compounds. Similar to the 5200 and TCP coatings,199
EDAX line profiling across the Al
terrace and the two intermetallic particles shows that the enhanced signals for Zr (Lα1),
O (Kα1), and Ti (Kα1) at the Cu-rich intermetallic sites relative to the surround Al sites
(Fig. 9.3B-F). This indicates that the NCP coating forms across the alloy surface and
enriches at the intermetallic inclusions.
Figure 9.4 presents the XPS depth profiles through the (A) 5200 and (B) NCP
coatings on AA2024. The characteristic coating elements, e.g. Zr, Ti, O, and F, are
detected for the 5200 coating (Fig. 9.4A). The Ti, Zr and O signals are elevated for the
first ca. 30 nm into the coating. They are attributed to titania (TiO2) and zirconia (ZrO2),
respectively. The O signal does not start to decrease until ca. 60 nm. This decrease is
accompanied by an increase in the Al signal. This is the Al-O-F interfacial region. The F
signal is virtually constant through the coating. The coating thickness is on the order of
about 30 nm with an Al-O-F interfacial region. In contrast, the NCP coating shows a
biphasic structure, similar to the TCP coating, with a ZrO2 top layer and AlF3/Al2O3
interfacial layer (Fig. 9.4B). The top layer is about 40 nm thick and the interfacial layer is
about 20 nm, which makes the overall coating thickness of about 60 nm. However, it
should be noted that measurements in vacuo cause shrinkage of the hydrated coating
due to loss of water. The true (hydrated) thickness of the 5200 and NCP coatings on

184
AA2024 is expected to be somewhat greater than the values estimated from this
measurement.
Figure 9.3 An (A) SEM image and (B-F) elemental line profiles for Cu, Zr, O, Zn, and F across the Cu-rich intermetallic compounds in the NCP-coated AA2024. Profiles were recorded after overnight aging in air.
15
10
0
Zn Kα1
Inte
nsity
(a.
u.)
5
300
200
0
Zr Lα1
0 30 90 µm 60
Inte
nsity
(a.
u.)
100
80
40
0
F Kα1_2
0 30 90 µm 60
200
100
0
O Kα1
0 30 90 µm 60
150
100
0
Cu Kα1
0 30 90 µm 60
50
10 µm
0 30 90 µm 60
A B
C D
E F

185
Figure 9.4 Auger depth profiles of several characteristic elements in the (A) 5200 and (B) NCP coatings on AA2024. Dashes lines are approximate boundaries between the coatings and Al matrix at the alloy surface. Data courtesy of Dr. Wayne Jennings from Case Western Reserve University (Swagelok Center for Surface Analysis of Materials).
A
B
Al/Al2O3 ZrO2
TiO2
ZrO2
AlF3/Al2O3

186
Figure 9.5 presents TEM images of a cross section the (A) 5200 and (B) NCP
coatings at the Al terrace site, and (C) the 5200 coating at the Cu-rich intermetallic sites
on AA2024. A layer of Pt was deposited on top of the coating to protect the coating from
damage during TEM specimen preparation by focused ion beam (FIB) milling and also
to improve the image contrast. Fig. 9.5A shows that the coating is thin ranging from 20
to 30 nm at the Al terrace site (the white arrow and scale bar). There are also places
(the black arrow) where the coating appears detached from the metal surface, due to
film shrinkage by dehydration in vacuo. This is similar to the NCP coating in Fig. 9.5B.
Detachment is attributed to the shrinkage of the coating. The NCP coating is about 70
nm thick, which is consistent with the XPS depth profiling data in Fig. 9.4B. Fig. 9.5C
shows the 5200 coating at the intermetallic sites. After deoxidation/desmutting in acidic
F--rich Smut-Go®, the Al, Mg, and Fe in the Cu-rich intermetallic particles are dissolved
leaving only Cu particles resided at the pit bottom. The coating forms in the gaps
between particles, which causes the enrichment shown in Fig. 9.2 and 9.3.
Figure 9.5 TEM images of the cross section of the (A) 5200 and (B) NCP coatings at the Al terrace site, and (C) the 5200 coating at the Cu-rich intermetallic sites on AA2024. The Pt layer is to protect the coating from deformation during TEM specimen preparation using FIB milling. Data courtesy of Mr. Hendrik Colijn from The Ohio State University.
A B C
5200 coating Detachment
Pt
Detachment
NCP coating
Al Al
Pt Pt
5200 coating
Cu particles
Al
100 nm 100 nm 100 nm
187
9.2.3 Basic Electrochemical Properties
Figure 9.6 shows typical potentiodynamic polarization curves for 5200-, TCP-,
and NCP-coated AA2024 at a slow scan rate of 2 mV/s. Curves for uncoated samples
are also shown as control. All the measurements were conducted in air-saturated 0.5 M
Na2SO4 except for the NCP-coated sample, which was measured in 0.5 M Na2SO4 +
0.1 wt% NaCl. It can be seen that no major difference exists in Ecorr between the
uncoated AA2024 and the 5200- and TCP-coated samples, while Ecorr for the NCP-
coated sample shifts in the positive direction. This trend suggests that the 5200 coating
affects the kinetics of the anodic and cathodic reactions to similar extents. It is clear that
both the anodic and cathodic current densities for the 5200-coated samples are
significantly larger than those for the TCP- and NCP-coated samples in the mediums. In
fact, the current densities for the 5200-coated sample are nearly identical to those for
the uncoated samples (no suppression). The NCP-coated sample exhibits the most
reduced anodic current density of the three samples. It should be noted that these NCP-
coated alloys were prepared by NAVAIR and then sent via mail to us for
electrochemical tests. Thus, the coating may have cured and formed a more stable
structure after the 2-week aging before testing. It is also possible that a thicker Al oxide
layer forms overfull at Al terrace sites in between the coated regions, which would
explain the improved anodic current density suppression.

188
Figure 9.6 Slow-scan potentiodynamic polarization curves recorded for 5200-coated
AA2024 in air-saturated 0.5 M Na2SO4. Data were also recorded for the uncoated (immediately after degreasing and deoxidation/desmutting) sample, a TCP-coated samples and an NCP-coated sample, for comparison. The scan rate was 2 mV/s. The
measurement of the NCP-coated sample was performed in 0.5 M Na2SO4 + 0.1% NaCl.
Table 9.1 presents corrosion potential (Ecorr), polarization resistance (Rp), and
defect parameter (P) data for the 5200-coated AA2024. They are compared with the
values for TCP- and NCP-coated alloys. Data for the uncoated samples are shown as
controls. The Rp values shown here are calculated by taking the inverse of the E vs. i
curve at Ecorr ± 30 mV and they are in an agreement with the values for the 5200-
coated AA2024 calculated by the EIS simulation (Table 9.2). Statistical tests show no
significant difference in Ecorr for the 5200-coated (-0.31 ± 0.04 V vs. Ag/AgCl) and
uncoated (-0.35 ± 0.04 V) alloys at the 95% confidence level. The TCP-coated samples
exhibit an Ecorr (-0.23 ± 0.03 V) in the same range as the values for uncoated and
E (
V v
s A
g/A
gCl)
0.4
-0.8
0
-0.4
-1.2
10-11
10-9
10-7
10-5
10-3
Bare 5200 TCP NCP
i (A/cm2)

189
5200-coated samples. In contrast, Ecorr for the NCP-coated samples (-0.15 ± 0.00 V)
shifts in the positive direction. The 5200-coated AA2024 specimens exhibit an Rp value
(6.7 ± 0.6 × 10⁴ Ω·cm
2) that is on the same range as that for the uncoated samples (6.5
± 1.5 × 10⁴ Ω·cm
2). This indicates the coating provides no significant corrosion
resistance is on AA2024 in this medium. In contrast, the TCP- and NCP-coated alloys
exhibit Rp’s that are ~10× greater than the values for the uncoated and 5200-coated
samples. Based on the Rp values, the NCP coating appears to provide comparable
corrosion protection to that of the TCP coating on AA2024. This is consistent with the
defect parameter data: the 5200 coating exhibits a defect parameter that is ~10× larger
than the values for the TCP or NCP coatings. In addition, the 5200 and TCP coatings
exhibit βc and βa that are in the same range as the uncoated samples, which indicates
that these two coatings have no effects on the electrochemical activities (e.g., free
energy barrier) for either Al oxidation or O2 reduction. However, the NCP coating
exhibits a greater βc, which indicates a better passivated surface. This is consistent with
the positive shift of Ecorr for the NCP-coated alloys compared to other treatments. In
addition, βa for the NCP-coated alloy is significantly smaller than that for the other three
treatments, which appears to indicate a trend that the NCP-coated alloy is more
vulnerable to be attacked on the Al phase. But it should be noted that the NCP-coated
samples were tested in a more aggressive Cl- containing solution that Cl
- causes a
more aggressive attack to the anodic Al phase.

190
Table 9.1 Ecorr, Rp, and defect parameter for 5200-, TCP- and NCP-coated AA2024. The electrochemical measurements were carried out in air-saturated electrolyte solutions. Data were also recorded for the uncoated alloys (immediately after
degreasing and deoxidation/desmutting) as control. The Rp values are calculated by taking the inverse of the slope of the
E vs. i curves at Ecorr (± 30 mV). Each datum is an average value of at least 3 samples.
Treatment Ecorr (V vs Ag/AgCl)
Rp
(×104 Ω·cm
2)
P (%)
βc (mV/dec)
βa (mV/dec)
Electrolyte
Bare -0.31 ± 0.04 5.1 ± 0.7 - -196 ± 17 218 ± 22 0.5 M Na2SO4
5200 -0.35 ± 0.04 6.5 ± 1.0 65 ± 7 -144 ± 10 171 ± 15 0.5 M Na2SO4
TCP -0.23 ± 0.03 64.3 ± 3.3a 5 ± 3 -190 ± 34 203 ± 24 0.5 M Na2SO4
NCPb -0.15 ± 0.01
a 71.3 ± 22.1
a 4 ± 1 -307 ± 93 88 ± 30a 0.5 M Na2SO4 +
0.1% NaCl
a Signifacant difference is seen for these values relative to the other unmarked values in the same column.
b NCP-coated AA2024 were prepared by NAVAIR, Patuxent River, MD.

191
Figure 9.7 shows the Bode plots of the 5200-coated and uncoated AA2024 in air-
saturated 0.5 M Na2SO4. Table 9.2 shows the best-fit parameters for the experimental
EIS data of the 5200-coated and uncoated AA2024 samples. The equivalent circuits
used were shown Chapter 2. In the mag vs log freq plot (Fig. 9.7A), the high-frequency
impedance Rel is primarily determined by the electrolyte resistance and therefore the
values are identical for the coated and uncoated samples. The low-frequency
impedance Rp value represents the polarization resistance at the coating/metal
interface and it can be seen that there is no significant difference between the coated
and uncoated samples. The phase shift vs. log freq plot (Fig. 9.7B) reveals one time
constant for the uncoated AA2024, which represents the double layer on the metal
surface. In contrast, two distinct time constants are seen for the 5200-coated alloy
sample and this indicates a porous structure of the coating. However, it should be noted
that the phase shifts for both samples are smaller than 90º that is expected for an ideal
capacitor. Therefore, the constant phase elements (CPEs) were used to represent the
inhomogeneous electrolyte/coating and coating/metal interfaces. Its impedance can be
expressed as Z=(jω)-n
Q-1
,76
where n is a ratio that reflects the heterogeneity of the
coated alloys. The effective capacitance is determined according to Ceff=Q1/n
R1/n-1
.76-
77 The Ceff for the 5200 coating is much greater than our previously reported value for
the TCP coating (2.49 µF/cm2).
204 This is attributed to a more porous structure for the
5200 coating that exhibits s a greater surface area than the TCP coating.

192
Figure 9.7 Bode plots of the 5200-coated and uncoated AA2024 in air-saturated 0.5 M
Na2SO4.
9.2.4 Galvanic Couples of 5200-coated AA2024-T3 and Ti-6Al-4V fasteners.
The corrosion protective property of the 5200 coating is also assessed in the
galvanic couples of the 5200-coated AA2024-T3 panels and the Ti-6Al-4V fasteners by
investigating the basic electrochemical properties of the couples. Table 9.3 shows Ecorr,
Rp, igal, βa, and βc for the coated alloy panels, fasteners, and the galvanic couples. The
couples were assembled with the alloy panel and the fastener isolated as shown in
Chapter 2, which ensures the igal measurement. The Ti-6Al-4V fastener shows a higher
Ecorr and greater Rp than the coated alloy panels, which indicates that the fastener is
more noble and acts as the cathode while the alloy panel is the anode. It is noted that
igal is significantly increased when the couples were tested in the more aggressive 3.5%
NaCl than that in the 0.5 M Na2SO4 + 0.1% NaCl. This is attributed to the more severe
attack by a higher concentration of Cl- on the alloy panels and the fasteners, which is
Bare 5200 TCP NCP
Bare 5200 TCP NCP
Mag
(Ω
·cm
2 )
10-1 100 101 102 104
Log freq (Hz)
103
106
105
104
103
102
101 10-1 100 101 102 104 103
Log freq (Hz)
Pha
se S
hift
(deg
rees
) -80
-60
-40
-20
0
A B
193
evidenced by the decreased βa for the panels, fasteners, and couples. Furthermore, βa
for the alloy panel is reduced to a greater extent than that for the fasteners. This
preferential attack on the anodic panel leads to an increased anode/cathode area ratio
that causes the increased igal for the electrolyte solution with a higher Cl- concentration.
In addition, the cathodic reaction is mainly O2 reduction within this potential window
(e.g., from 0 to -1.0 V vs Ag/AgCl) and its rate depends on the concentration of
dissolved O2 rather than the Cl- concentration. Therefore, βc for the panels, fasteners,
and couples shows no significant difference between these two solutions.

194
Table 9.2 Best-fit parameters for the experimental EIS data for the 5200-coated and uncoated AA2024 samples in air-
saturated 0.5 M Na2SO4. The equivalent circuits used for the simulation was presented in Chapter 2.
Treatment Rel (Ω)
Qco
(×10-6
sn/(Ω·cm
2))
nco Cco
(µF/cm2)
Rpo
(Ω·cm2)
Qdl
(×10-6
sn/(Ω·cm
2))
ndl Rp
(×104 Ω·cm
2)
Uncoated 131±12 - -
- 55.5±7.9 0.8±0.0 4.9±0.2
5200 113±2 41.9±5.1 0.8±0.0 10.4±1.0 1483±259 14.5±2.4 0.8±0.0 6.3±1.2
TCP 118±4 28.9±2.1 0.8±0.0 5.9±0.6 152±57 24.2±3.3 0.9±0.0 18.8±5.1
NCP 103±4 11.5±0.0 0.8±0.0 1.4±0.0 104±16 23.1±1.5 0.8±0.0 427.5±96.9
Table 9.3 Basic electrochemical parameters of the 5200-coated AA2024 panel, Ti-6Al-4V fastener, and the galvanic couples. The coupled samples were set up as shown in Chapter 2. Measurements were carried out in air-saturated 0.5 M
Na2SO4 + 0.1% NaCl and 3.5% NaCl, respectively. Each datum is an average value of at least 3 samples.
Ecorr
(V vs Ag/AgCl)
Rp
(×104 Ω·cm
2)
igal
(µA/cm2)
βa
(mV/dec)
βc
(mV/dec)
0.5 M Na2SO4 + 0.1% NaCl
Panel -0.51 ± 0.01 23.6 ± 1.9 0.8 ± 0.2
257 ± 5 -383 ± 12
Fastener -0.10 ± 0.01 55.0 ± 7.9 691 ± 68 -415 ± 26
Couple -0.45 ± 0.02 14.2 ± 7.0 - 368 ± 34 -221 ± 8
3.5% NaCl
Panel -0.64 ± 0.02 10.6 ± 3.5 2.4 ± 0.2
35 ± 2 -366 ± 18
Fastener -0.27 ± 0.04 32.1 ± 9.6 254 ± 79 -462 ± 99
Couple -0.57 ± 0.01 1.9 ± 0.5 - 53 ± 8 -290 ± 43

195
9.2.5 Accelerated Corrosion Tests.
The corrosion inhibition provided by the 5200 coating on AA2024 was assessed
by measuring electrochemical parameters, such as Ecorr, Rp, and igal, before and after
the galvanically coupled samples were exposed to various accelerated environmental
tests for 14 days: (i) full immersion in 0.5 M Na2SO4 + 0.1% NaCl at room temperature
(23-27 ºC), and (ii) exposure to moist SO2 at 40 ºC. Table 9.3 shows the basic
electrochemical parameters of the 5200-coated AA2024 panel, the Ti-6Al-4V fastener,
and the coupled samples. The configuration is shown in Chapter 2. They were
measured in both 0.5 M Na2SO4 + 0.1% NaCl and 3.5% NaCl.
Figure 9.8 shows optical images of the galvanically-coupled 5200-coated
AA2024 samples (A) before accelerated corrosion testing, after (B) full immersion and
(C) moist SO2 exposure tests. Fig. 9.8D shows the uncoated sample after the moist
SO2 exposure testing that exhibits clear damage and corrosion across the entire alloy
surface. Similarly, the coated samples after the 14-day accelerated corrosion testing in
both environments were severely corroded, evidenced by the localized pitting and
damage (indicated by arrows). In addition, it appears that a greater level of damage is
seen on the sample after the full immersion testing compared to that after the moist SO2
exposure testing. These images provide qualitative evidence that the 5200 coating does
not provide enough corrosion protection to the alloy, at least in the full immersion and
moist SO2 exposure conditions.

196
Figure 9.8 Optical images of the 5200-coated AA2024 galvanically coupled with Ti-6Al-4V fasteners (A) before any accelerated corrosion testing, and after 14-day (B) full
immersion in air-saturated 0.5 M Na2SO4 + 0.1% NaCl and (C) exposure in moist SO2 at 40 ºC. The image of (D) an uncoated AA2024 sample galvanically coupled with the SS fastener is also shown as control.
9.3 Discussion
9.3.1 Formation mechanism and chemical structure
The formation of 5200 coatings on AA2024 is driven by an increase in the
interfacial pH (Fig. 9.1). Consumption of H+ and F
- by dissolution of Al oxide films, along
with hydrogen discharge and oxygen reduction reaction, leads to an increased pH at the
metal surface. This interfacial pH increase drives hydrolysis of the two fluorometalates
to form a mixed oxide layer (Rxn. (9.1) and (9.2)). This layer is about 20-30 nm thick in
vacuo. EDX analysis revealed that the 5200 coating consists of Zr, Ti and O, which is

197
consistent with TiO2 and ZrO2 that is present over most regions of the alloy surface.
The stronger Zr, Ti, and O signals are seen at the Cu-rich intermetallic sites compared
to those at Al terrace sites (Fig. 9.2). This is attributed to two reasons. First, besides
consumption of H+ by hydrogen discharge at the Al terrace sites surrounding the Cu-
rich intermetallic sites, oxygen reduction reaction (ORR) at the intermetallic sites
consumes H+ and drives the pH increase to a higher level, The pH at Cu-rich
intermetallic sites is increased to a higher level that provides a greater driving force for
hydrolysis of the fluorometalates to form a thicker ZrO2/TiO2 mixed oxide layer at the
intermetallic site (Fig. 9.2). The other reason is that the intermetallic site forms several
small Cu particles as the active elements such as Al, Mg and Mn in the compounds are
dissolved upon attack by H+ and F
-. The coating materials fill the pores between these
Cu particles (Fig. 9.5C), which is seen as the increased x-ray signals of Zr, Ti and O
elements at the intermetallic sites. In addition, the 5200 coating contain hydrated
channels and or defects that act as pathways through which dissolved oxygen and ions
diffuse to the metals. This is based on the observation that the Rp of 5200-coated
AA2024 is on the range of 104 Ω·cm
2 that is 5 orders of magnitude smaller than 10
9
Ω·cm2 for a completely blocking barrier. Shrinkage may occur due to dehydration in
vacuo (Fig. 9.5A)

198
9.3.2 Corrosion protection property
Preliminary data in our previous report showed that the 5200 coating provides
slightly improved corrosion resistance to AA2024 according to the seemingly increased
Rp values.199
In this work, we found that 5200 coating does not provide any corrosion
protection to AA2024 and the increased Rp reported previously was due to the
formation of Al oxide layers. Table 9.1 shows that the 5200-coated AA2024 after
overnight aging has an Rp that is not statistically different from that of the uncoated
samples. Neither cathodic or anodic protection is provided by the 5200 coating seen in
the potentiodynamic polarization scans (Fig. 9.6). Additionally, the 5200 coating does
not show any corrosion protection to the AA2024 samples that are galvanically coupled
with Ti alloy fasteners and severe corrosion is seen on the panels (Fig. 9.8). Therefore,
one significant finding in this work is that the 5200 coating does not provide any
corrosion protection on AA2024. This is consistent with the findings reported by Smith
and Miller based on visual signs of corrosion.205
However, it should be noted that the
protective coating system in the field usually contains three layers: (i) conversion
coatings, (ii) primers and (iii) top coats. The poor corrosion protection provided by the
5200 coating alone does not indicate the uselessness of this coating. In fact, several
studies have shown that some coating systems with the 5200 conversion coating
provide a good corrosion protection partially due to its excellent adhesion property.65,
205-206
199
In contrast, the TCP and NCP coatings significantly improve the corrosion
resistance of AA2024 as evidenced by (i) the about 10× greater Rp (Table 9.1) and (ii)
suppressed cathodic and anodic currents (Fig. 9.6) for both the TCP- and NCP-coated
alloys compared to the uncoated samples. However, it should be noted that all three
coatings contain defects and do not completely blocking the alloy surface. These
defects allow diffusion of dissolved oxygen and ions to the metals. The 5200 coating
obtains a thinner structure (Fig. 9.4 and 9.5) that contains shorter pathways relative to
the TCP and NCP coatings.199
It is evidenced by the relatively greater defect parameter
for the 5200 coating and the underlying alloy becomes more susceptible to being
attacked, compared to the other two coatings (Table 9.1).
9.4 Conclusion
The results reported herein describe the formation, structure, and electrochemical
properties of the 5200 coating on AA2024. Formation of the coating on AA2024 is a pH
driven process that leads to hydrolysis of hexafluormetalates (i.e. TiF62-
and ZrF62-
) to
form metal oxide layers (i.e. TiO2 and ZrO2). The coating forms across the entire alloy
surface and enrichs at the Cu-rich intermetallic sites. The 5200 coating exhibits a
thickness on the range of 20-30 nm in vacuo. Hydrated channels and or defects exist in
the coating and allow diffusion of dissolved O2 and ions to the metals. The 5200 coating
exhibits a good chemical stability during both full immersion and atmospheric corrosion
testing for at least 14 days. However, no significant corrosion protection is provided by
200
the 5200 coating on AA2024 due to the coating’s ultrathin and defective structures.
Severe corrosion occurs after 14-day exposure in the moist SO2.

201
CHAPTER 10. EFFECTS OF GALVANIC COUPLING WITH SS A 286 CRES AND TI-6AL-4V FASTENERS ON CORROSION INHIBITION PROVIDE D BY TRIVALENT CHROMIUM PROCESS (TCP) COATINGS ON AA2024 -T3 PANELS
10.1 Introduction
High strength aluminum alloy 2024-T3 is widely used as an aircraft structural
component. The metal alloys are joined together by fasteners due to the difficulty of
welding.207
Fasteners in the aerospace industry are usually stainless steels or titanium
alloys. A benefit of using these two types of fasteners is their ability to function over a
wide range service temperatures.208
This is due to their noble nature relative to the
aluminum alloys. Two dissimilar conductive materials that are in electrical contact in an
electrolyte forms a galvanic couple. This coupling leads to the galvanic corrosion of the
more active material (e.g., metal oxidation/corrosion) that acts as the anode, while the
more noble material acts as the cathode (e.g., O2 reduction). A current, called the
galvanic current, flows from the anode, through the electrolyte to the cathode. It is a
measure of the galvanic corrosion rate. Therefore, when the Al alloy panels are
connected with fasteners and exposed to humid air or a salt solution, an ionic
connection is made. This coupling can result in severe deterioration of the Al alloy.
Studies have shown that galvanic coupling leads to a more severe corrosion damage to
a metal than what is observed with the uncoupled metal is exposed to the same
conditions.209-210
A protective coating is one way to inhibit galvanic corrosion. Frankel
et al. studied the effects of the galvanic coupling on the corrosion protection provided by
a multi-coating system on Al alloy panels when coupled with SS A286 CRES or Ti-6Al-

202
4V fasteners.209-210
The corrosion inhibition was evidenced by a smaller galvanic
current for completely coated panels as compared to coated and scribed panels.
Factors that affect the corrosion protection provided by a multi-coating system include
the fastener material (SS A286 CRES vs. Ti-6Al-4V), the corrosive environment (full
immersion vs. neutral salt spray), and the anode/cathode areas. For example, data
showed that coupling with the SS fastener caused more rapid failure of the panel than
when coupled with the Ti alloy fastener. However, little was reported on the
mechanisms by which the TCP coating provides less corrosion protection to the Al alloy
panels when coupled with SS A286 CRES fasteners than with Ti-6Al-4V. In addition,
information is lacking about the corrosion inhibition provided the TCP conversion
coating on the Al alloy panels when they are galvanically coupled. Therefore, this
chapter focuses on the corrosion inhibition provided by the TCP coating AA2024-T3
panels when coupled with SS A286 CRES and Ti-6Al-4V fasteners. Several
electrochemical parameters, e.g., corrosion potential (Ecorr), polarization resistance
(Rp), and galvanic current density (igal) are reported that serve as benchmarks for the
corrosion status of the specimen. The assembling of the galvanic couples was shown in
Chapter 2.
10.2 Results
10.2.1 Basic electrochemical properties
Figure 11.1 shows galvanic current density-time transients for the TCP-coated
and uncoated AA2024-T3 panels when coupled with SS A286 CRES and Ti-6Al-4V
fasteners. Measurements were conducted in naturakllly aerated 0.5 M Na2SO4 + 0.1%
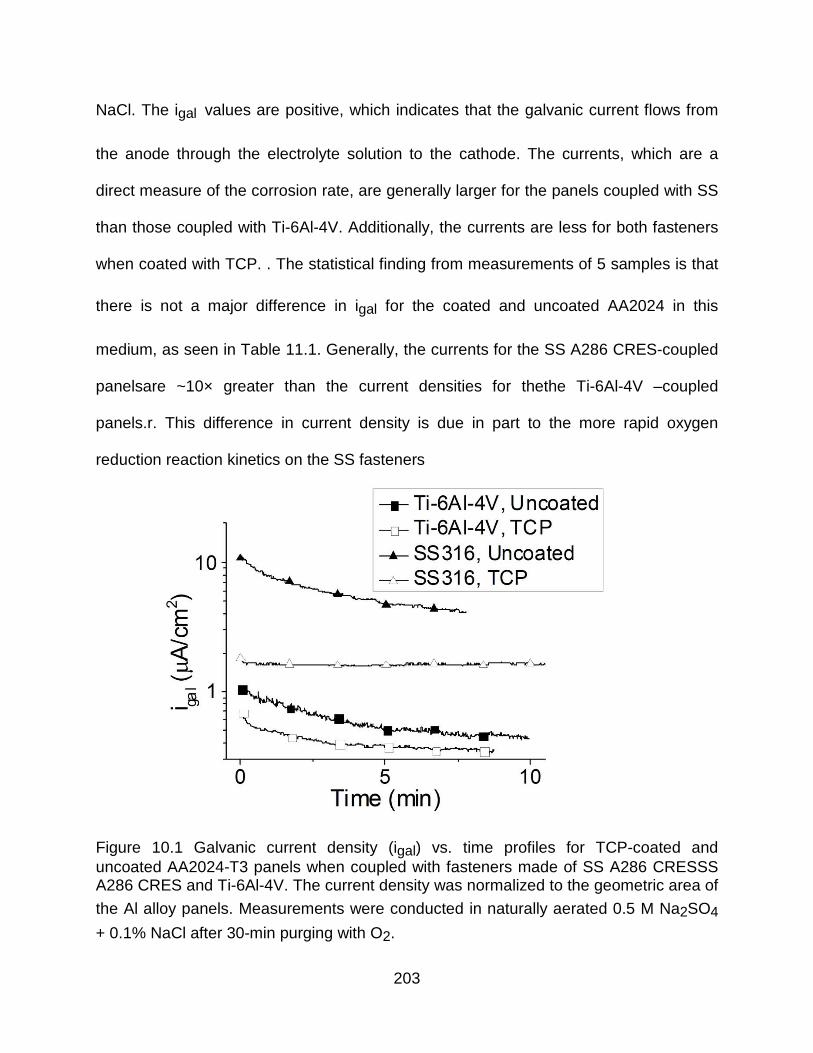
203
NaCl. The igal values are positive, which indicates that the galvanic current flows from
the anode through the electrolyte solution to the cathode. The currents, which are a
direct measure of the corrosion rate, are generally larger for the panels coupled with SS
than those coupled with Ti-6Al-4V. Additionally, the currents are less for both fasteners
when coated with TCP. . The statistical finding from measurements of 5 samples is that
there is not a major difference in igal for the coated and uncoated AA2024 in this
medium, as seen in Table 11.1. Generally, the currents for the SS A286 CRES-coupled
panelsare ~10× greater than the current densities for thethe Ti-6Al-4V –coupled
panels.r. This difference in current density is due in part to the more rapid oxygen
reduction reaction kinetics on the SS fasteners
Figure 10.1 Galvanic current density (igal) vs. time profiles for TCP-coated and uncoated AA2024-T3 panels when coupled with fasteners made of SS A286 CRESSS A286 CRES and Ti-6Al-4V. The current density was normalized to the geometric area of
the Al alloy panels. Measurements were conducted in naturally aerated 0.5 M Na2SO4
+ 0.1% NaCl after 30-min purging with O2.

204
Table 10.1 presents a summary of basic electrochemical parameters, corrosion
potential (Ecorr), polarization resistance (Rp), and galvanic current density (igal) for the
uncoated and TCP-coated AA2024 panels galvanically coupled with Ti-6Al-4V fasteners.
Ecorr was measured after 30-min full immersion of the samples in naturally aerated 0.5
M Na2SO4 + 0.1% NaCl solution; and igal was measured after 2-h immersion in the
solution. Average values were calculated from measurements of 5 samples. Ecorr for
the fastener is more positive than that for the panel, which makes the fastener a
cathode and the panel an anode. This can also be seen by the positive values for igal,
which indicates a current flowing from the fastener to panel. Ecorr for the couple falls
between the values for the panels and fastener separately, which is consistent with the
mixed potential theory. Rp values for the couples are smaller than those for the panels
and fasteners. This is due to that the galvanic coupling forms a potential difference
between the fastener and panels and drives the current flow between the cathode
(fasteners) and anode (panels). Comparing Rp for the couple between uncoated (0.6 (±
0.1) ×104 Ω·cm
2) and coated AA2024 (4.1 (± 2.1) ×10
4 Ω·cm
2), the TCP coating
increases the Rp by about 10× that is consistent with the increase for the individual
panels (from 2.0 (± 0.5) to 26.2 (± 1.5) ×104 Ω·cm
2). This indicates that the TCP coating,
as a barrier coating, provides some corrosion protection to the galvanically coupled
AA2024 panel. However, igal shows no significant difference with and without the TCP
coating. This is because the majority of oxygen reduction occurs at the uncoated

205
fastener (cathode) and the Al in the panel (anode) is oxidized correspondingly. The
electron flows through inside the metals, which is not affected by the coating on the
surface.
Comparing Ecorr for the TCP-coated panels coupled with different fastener, the
one with SS fastener (-0.65 ± 0.04 V) is ~100 mV lower than that with Ti alloy fastener.
Rp for the panel and couple with SS fasteners are both ~5× smaller for that with Ti alloy
fasteners. Furthermore, igal for the coated panel with SS fastener is ~5× greater than
that with the Ti alloy fastener. These data indicate that the TCP-coated panels are more
vulnerable to corrosion when coupled with SS than with Ti alloy fasteners.
Table 10.1 Basic electrochemical parameters, Ecorr, Rp, and igal for the uncoated and TCP-coated AA2024 panels galvanically coupled with Ti-6Al-4V fasteners, and TCP-coated Al alloy panels coupled with SS A286 CRES fasteners. Measurements were
conducted in 0.5 M Na2SO4 + 0.1% NaCl that was purged with O2 for 30 min prior to the measurements.
Uncoated, Ti-6Al-4V
TCP, Ti-6Al-4V
TCP, SS316
Ecorr (V vs Ag/AgCl)
Panel -0.50 ± 0.04 -0.46 ± 0.02 -0.65 ± 0.04
Fastener -0.11 ± 0.03 -0.07 ± 0.02 -0.01 ± 0.01
Couple -0.44 ± 0.02 -0.42 ± 0.01 -0.32 ± 0.05
Rp (×104 Ω·cm2)
Panel 2.0 ± 0.5 26.2 ± 1.5 8.1 ± 1.4
Fastener 15.1 ± 4.1 13.8 ± 3.2 14.1 ± 1.1
Couple 0.6 ± 0.1 4.1 ± 2.1 0.5 ± 0.2
igal (µA/cm2) 0.48 ± 0.14 0.58 ± 0.15 5.99 ± 2.23
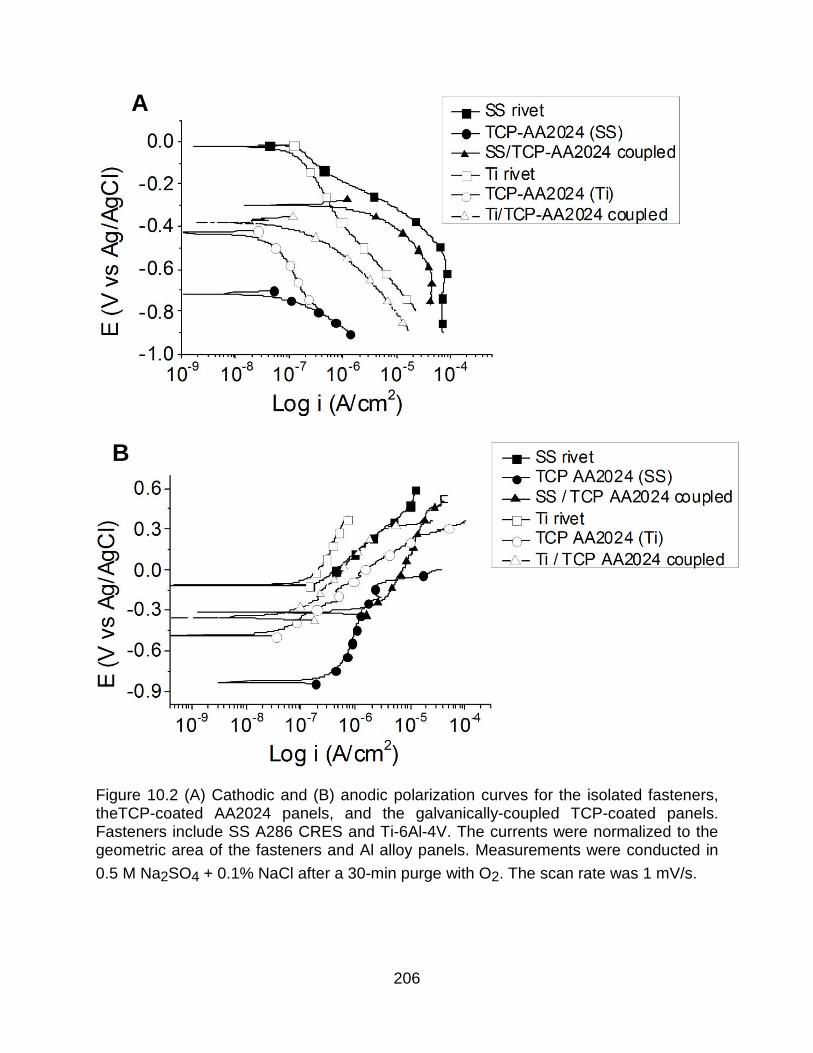
206
Figure 10.2 (A) Cathodic and (B) anodic polarization curves for the isolated fasteners, theTCP-coated AA2024 panels, and the galvanically-coupled TCP-coated panels. Fasteners include SS A286 CRES and Ti-6Al-4V. The currents were normalized to the geometric area of the fasteners and Al alloy panels. Measurements were conducted in
0.5 M Na2SO4 + 0.1% NaCl after a 30-min purge with O2. The scan rate was 1 mV/s.
A
B
207
Figure 10.2 shows the (A) cathodic and (B) anodic potentiodynamic scans for
uncoupled TCP-coated AA2024 panels, the individual SS A286 CRES and Ti-6Al-4V
fasteners, and the TCP coated panels when galvanically coupled. Measurements were
conducted in 0.5 M Na2SO4 + 0.1% NaCl after 30 min purging with O2. The scan rate
was 1 mV/s. The cathodic and anodic current densities for the coupled panels fall
between those for the uncoupled panels and the individual fasteners. This applies for
both fasteners. Moreover, both fasteners exhibits a greater cathodic but smaller anodic
current densities compared to the values for the uncoupled Al alloy panels. This is
consistent with the oxygen reduction occurring mainly on the fastener. However, it is
interesting to note that the SS fastener exhibits a greater cathodic current density than
the Ti alloy fastener. Correspondingly, the anodic current density is greater for the Al
alloy panel coupled with the SS fastener than that with Ti alloy fastener. The panel is
severely pitted at a lower Epit for the SS than Ti alloy fastener.
10.2.2 Accelerated corrosion tests
Table 10.2 shows the optical images of the TCP-coated AA2024 panels before
and after a thin layer mist (TLM) exposure at 55 ºC and full immersion at room
temperature in 3.5% NaCl for 14 days. The Al alloy panels were galvanically-coupled
with SS A286 CRES and Ti-6Al-4V fasteners during the tests. In both accelerated
corrosion tests, the panels were more severely corroded across the whole surface
when coupled with SS than with Ti. The panels coupled with the Ti alloy fasteners
showed only mild corrosion and surface damage, mainly in the region where the
fastener was in direct contact with the fastener. This general observation confirms that
the TCP-coated panels are more susceptible to corrosion when coupled with SS. These

208
observations are also consistent with the predictive electrochemical parameters
reported in Table 10.1. The localized corrosion and surface damage for the TCP-coated
panels coupled with Ti could results from damage to the coating with the fasterner is
attached. In addition for both fasteners, the TLM causes a more severe corrosion on the
panels than the full immersion test. This is because of a greater flux of dissolved O2 to
the metal surface through the thin layer of solution in the TLM test than through the bulk
solution in the full immersion test.
Table 10.3 shows the weight loss recorded forthe galvanically-coupled the TCP-
coated AA2024 panels after the full immersion and thin layer mist (TLM) test. A greater
weight loss is seen for the panels after the TLM than the full immersion tests. Also,
thehe panels coupled with the SS fasteners showed greater weight loss than those
coupled with the Ti alloy fasteners. This is consistent with the greater level of coirrosion
seen on the optical micrographs and with the electrochemical parameters shown in
Table 11.1 and Figure 11.1.
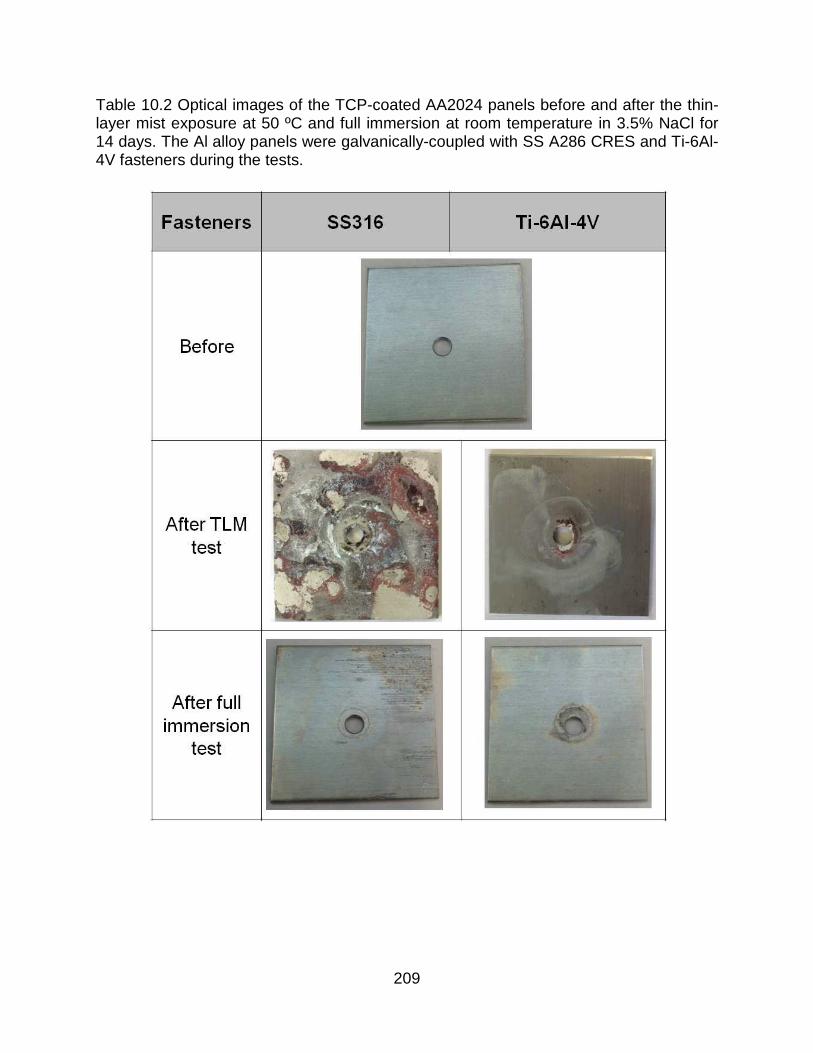
209
Table 10.2 Optical images of the TCP-coated AA2024 panels before and after the thin-layer mist exposure at 50 ºC and full immersion at room temperature in 3.5% NaCl for 14 days. The Al alloy panels were galvanically-coupled with SS A286 CRES and Ti-6Al-4V fasteners during the tests.

210
Table 10.3 Weigh loss data for galvanically-coupled TCP-coated AA2024 panels after full immersion at room temperature and exposure to a thin-layer mist (TLM) test at 40 ºC for 14 days. The solution used for both accelerated corrosion tests was naturally aerated 3.5% NaCl. The panels were galvanically coupled with SS A286 CRES and Ti-6Al-4V fasteners.
Accelerated corrosion tests
Weight loss percentage (%)
SS316 Ti-6Al-4V
Full immersion 11.4 ± 4.1 3.0 ± 1.6
TLM 30.6 ± 8.7 19.9 ± 9.4
Figure 10.3 shows potentiodynamic scans for galvanically-coupled TCP-coated
AA2024 panel and an individual Ti-6Al-4V fastener before and after (A) full immersion in
naturally-aerated 3.5% NaCl at room temperature and (B) exposure in moist SO2
atmosphere at 40 ºC, both for 14 days. The electrochemical measurements were
conducted in 0.5 M Na2SO4 + 0.1% NaCl. The scan rate was 1 mV/s. The cathodic
current density indicates the oxygen reduction reaction and shows no significant
difference. In contrast, the anodic current density is increased by one order of
magnitude after both accelerated corrosion tests. Furthermore, Epit for the samples after
full immersion for 14 days is about 700 mV lower than that before the testing.

211
Figure 10.3 Polarization curves for galvanically-coupled TCP-coated AA2024 panels with Ti-6Al-4V fasteners before and after (A) full immersion in 3.5% NaCl at room
temperature and (B) exposure to moist SO2 at 40 ºC, both for 14 days. The
electrochemical measurements were conducted in naturally aerated 0.5 M Na2SO4 + 0.1% NaCl for the samples after full immersion testing while naturally aerated 0.5 M
Na2SO4 was used for the samples after the moist SO2 test. The scan rate was 1 mV/s.
B
A

212
Figure 10.4 shows the optical images of the (A) uncoated and (B) TCP-coated
AA2024 panels galvanically coupled with Ti-6Al-4V fasteners after exposure to moist
SO2 at 40 ºC for 14 days. No significant corrosion is seen on the fasteners for the
coated or uncoated panels. This is consistent with the noble nature of the Ti-6Al-4V
alloy. However, the uncoated panels are corroded across the entire surface while only a
few locally corroded spots are seen on the coated panels. This is consistent with the Rp
data in Table 11.1: the TCP coating provides some corrosion protection to the panels in
a galvanic couple system with fasteners.
Figure 10.4 (A) Cathodic and (B) anodic polarization curves for the isolated fasteners and TCP-coated AA2024 panels, and the galvanic couples. Fasteners include SS A286 CRES and Ti-6Al-4V. The currents were normalized to the geometric area of the
fasteners and Al alloy panels. Measurements were conducted in 0.5 M Na2SO4 + 0.1%
NaCl that was purged with O2 for 30 min before measurements. The scan rate was 1 mV/s.

213
10.3 Discussion
10.3.1 Corrosion protection provided by the TCP coa ting
The TCP coating provides some corrosion protection to the galvanically coupled
AA2024 panels. This is evidenced by the 10x increase in Rp with the coating (Table
11.1). Although the cathodic fasteners were not coated and exposed to the electrolyte
solution, it should be noted that the AA2024 panels contain some Cu-rich intermetallic
sites that also act as a cathode. Some dissolved O2 can diffuse to the Cu-rich sites and
get reduced. Previous study has shown that the TCP coating partially blocks the
diffusion of the dissolved O2 to the metal. Therefore, the TCP coating functions as a
barrier coating on the Al alloy panel and inhibits some O2 reduction. This can also be
seen by the local pitting on the coated panels compared to the severe corrosion across
the entire uncoated panels after 14-day exposure in moist SO2 at 40 ºC (Fig. 11.4).
However, the fastener has a greater surface area than the Cu-rich intermetallic
sites in the Al alloy panels. Oxygen reduction that occurs at the fastener dominates the
cathodic current. Therefore, exposure of the uncoated fastener to the electrolyte
solution keeps the overall oxygen reduction unaffected by the coating on the Al alloy
panel. This ensures the electron flows through inside the fastener and panel at an
unchanged igal with and without the coating. Even though the TCP coating also inhibits
the anodic Al oxidation as a barrier coating, the panel still corrodes as long as the
fastener is exposed to the solution.

214
10.3.2 Effects of Fasteners on Corrosion Protection by TCP
Both SS A286 CRES and Ti-Al6-V4 fasteners are relatively noble than the Al
alloy panels and therefore act as the cathode. However, significant difference is seen on
the effects of these two types of fasteners on the corrosion protection provided by the
TCP coating. The SS fastener has higher O2 reduction activity, which is evidenced by
the greater cathodic current densities on the SS fastener than on Ti alloy fastener (Fig.
11.2). This leads to a more active Al alloy panel evidenced by the negative-shifted Ecorr
(Table 11.1). The panel is oxidized or corroded to a greater extent when coupled with
the SS fastener than with the Ti alloy fastener (Fig. 11.2). Through the same
accelerated corrosive environments, e.g., full immersion and TLM in 3.5% NaCl, the
panels coupled with SS fasteners were corroded more severely than those with Ti alloy
fasteners.
10.4 Conclusions
The corrosion protection provided by the TCP coating to the galvanically-coupled
AA2024-T3 panels was investigated for the SS A286 CRES and Ti-6Al-4V fasteners.
TCP functions as a barrier coating that inhibits diffusion of O2 and solution species to
the underlying metal panel. The extent of galvanic corrosion was greater with the SS
than with the Ti alloy fasteners. The TCP coating does provide some corrosion inhibition
as the corrosion is more severe on the galvanically-coupled panels without the coating.
The more extensive corrosion with the SS fasteners is evidenced by greater igal and
lower Rp values, greater weight loss and the damage seen in the optical micrographs.

215
For the SS fasteners, the corrosion occurs over most areas of the panels near and
removed from the fastener. In contrast, the corrosion with the Ti fasteners is very
localized to the region where the fastener head contacts the panel. For the SS A286
CRES fasteners, the greater rate of the oxygen reduction reaction leads to the greater
level of metal corrosion. The TCP coating, while providing some barrier protection does
consist of pores/channels and defects through which dissolved O2 and solution species
can reach the underlying metal. Finally, the TCP coating provides greater corrosion
inhibition under full immersion testing that under the more aggressive thin-layer mist test.

216
CHAPTER 11. SUMMERY AND FUTURE WORK
11.1 Summery
The trivalent chromium process coating (TCP) is one of the leading replacement
of the toxic chromate conversion coating (CCC) in aerospace industry. This dissertation
focuses on a fundamental understanding of the formation mechanism, chemical
structure, and corrosion protection properties of the TCP coating on three high strength
aluminum alloys: AA2024-T3, AA6061-T6, and AA7075-T6. These scientific studies
provide information to improve the the corrosion protection property of the TCP coating.
Chapter 3 and 6 showed that the TCP coating exhibits similar formation
mechanism and chemical structure on the three aluminum alloys. The formation of the
TCP coating is driven by an increase in the interfacial pH caused by (i) dissolution of the
oxide layer by H+ and F
- and (ii) localized oxygen reduction at Cu-rich intermetallic sites.
This pH increases leads to hydrolysis of the fluorhexuzirconate to form hydrated ZrO2.
And precipitation of Cr3+
to form Cr(OH)3. Therefore, the coating composition is
biphasic consisting of a hydrated ZrO2/Cr(OH)3 overlayer and a K- and F-rich
fluoroalunminate interfacial layer (K3AlF6). The thickness of the TCP coating in vacuum
is approximately 50 nm on AA2024, 100 nm on AA6061, and 70 nm on AA7075. It coats
most of the Al alloy surface and enriches at the intermetallic sites. However, it should be
noted that the true coating thickness (e.g., 90-100 nm for AA2024) is greater than these
in vacuo values.
217
Chapter 4 and 5 discussed the transient formation of Cr(VI) in the TCP coating
on the aluminum alloys using Raman spectroscopy. The Cr(VI) formation occurs when
the coated alloy is immersed in air-saturated electrolyte solutions or even after exposure
to humid air (curing). The formation involves two steps: (i) oxygen diffuses through the
hydrated channels to the Cu-rich intermetallic sites where it gets reduced to H2O2; (ii)
the H2O2 is a strong oxidant and diffuses to nearby sites to oxidize native Cr(III) in the
coating to Cr(VI). In samples aged in the laboratory air, the Cr(VI) formation is localized
to intermetallic areas where the H2O2 is formed. When fully immersed, the locally
produced H2O2 can diffuse to sites remote from the pits and oxidize the Cr(III). The
Cr(VI) exists mainly in the form of chromate (CrO42-
). It combines Al3+
or Al(OH)x to
form a mixed oxide of Al(III)/Cr(VI) in the pits. Some chromate (CrO42-
) leaks into the
solution, diffuses to the terrace and binds Cr(III) to form a Cr(III)/Cr(VI) mixed oxide.
The covalent, polymeric Cr(III)/Cr(VI) mixed oxide accounts for the chemical stability of
the TCP coating. Although it is still not clear if the TCP coating provides an active
corrosion protection, but the leaking of chromate might occur during the immersion in
solutions.
Chapter 3, 5, and 6 investigated the corrosion protection provided by the TCP
coating on aluminum alloys. The TCP coating provides both cathodic and anodic
protection evidenced by suppressed current density compared to those for the uncoated
samples. It can also be seen by the ~10-100× increase in Rp. However, the corrosion
protection provided by TCP is much better on AA6061-T6 than on AA7075-T6; and TCP

218
can inhibit pitting corrosion in AA2024-T3 but not as effective as the other two alloys.
The protection mechanisms involve (i) reducing the oxygen reduction kinetics, (ii)
partially blocking the mass transfer of dissolved O2 and ions to the metal, (iii) insulating
the electron transfer through the non-conductive ZrO2/Cr(OH)3 layer, (iv) providing
active corrosion protection due to transient formation of Cr(VI), and (v) reducing the
likelihood of severe pitting in the Cl--containing solution. The corrosion protection
provided by the TCP coating is consistent for at least 14 days in various accelerated
corrosion tests. The coating exhibits good stability and endures the corrosive
environments such as full immersion in salt water, humid atmosphere, moist SO2, and
thin layer mist (TLM). Some corrosion protection is also provided to the galvanically
coupled aluminum alloy panels with SS and Ti alloy fasteners. The protection depends
on the types of fasteners.
Chapter 7 discussed the effect of deoxidation/desmutting on the corrosion
protection provided by TCP coatings on AA2024-T3. Deoxidation in acidic fluoride
Smut-Go was compared with those in alkaline media (NaOH). The alloy surface is more
severely pitted around the Cu-rich intermetallic compounds in Smut-Go than in NaOH.
The TCP coating becomes defective after deoxidizing in the Smut-Go for a longer
period of time (> 2 min), which leads to a decreased corrosion protection. However, a
uniform etching of the Al oxide film and the formation of the Cu oxide film at the
intermetallic sites occur during the deoxidizing in an alkaline NaOH solution. The
recommendation from this work is to use an alkaline etch.
219
Chapter 8 showed the effects of curing temperature and time on the corrosion
protection provided by the TCP coating on AA2024-T3. The TCP coating undergoes
dehydration and condenses when cured at elevated temperatures. This along with the
growth of a more defect-free aluminum oxide layer occurs during curing overnight at
elevated temperature (≤ 100 ºC). The coating also becomes progressively hydrophobic
with the loss of water and associated chemical changes. All three contribute to the
improved corrosion protection. However, curing at 150 ºC causes excessive dehydration
and shrinkcure of the coating such that it undergoes severe cracking and even
detachment from the metal surface. A longer curing period at room temperature
enhances the corrosion resistance by 4× of the TCP-coated alloy by forming an
aluminum oxide layer on the metal sites exposed in the coating channels and defects.
The improvement in corrosion protection with curing at room temperature is also
associated with increasing hydrophobicity of the coating. The best improvement in
corrosion resistance was seen for coatings cured at room temperature for 7 days.
Chapter 9 compared the formation mechanism, chemical structure, and corrosion
protection for the TCP coating with other non-chromium conversion coatings, e.g., 5200
(Ti/Zr) and NCP (Zn/Zr). Formation of the 5200 coating on AA2024 is similar to that of
the TCP coating: a pH increase drives hydrolysis of hexafluormetalates (i.e. TiF62-
and
ZrF62-
) to form metal oxide layers (i.e. TiO2 and ZrO2). Both 5200 and NCP coatings
form across the entire alloy surface and enrichs at the intermetallic sites. The thickness
of the 5200 coating is 20-30 nm in vacuo that is smaller than that for the TCP (50-60 nm)
and NCP (70 nm) coatings. Hydrated channels and or defects exist in the all three

220
coating and allow diffusion of dissolved O2 and ions to the metals. No significant
corrosion protection is provided by the 5200 coating on AA2024 due to the coating’s
ultrathin and defective structures; severe corrosion occurs after 14-day exposure in the
moist SO2. In contrast, the NCP coating provides similar corrosion protection as the
TCP coating in terms of basic electrochemical properties.
Chapter 10 studied the corrosion protection provided by the TCP coating to the
galvanically-coupled AA2024-T3 panels with the SS A286 CRES and Ti-6Al-4V
fasteners. TCP functions as a barrier coating that inhibits diffusion of O2 and solution
species to the underlying metal panel. The extent of galvanic corrosion was greater with
the SS than with the Ti alloy fasteners. The TCP coating does provide some corrosion
inhibition as the corrosion is more severe on the galvanically-coupled panels without the
coating. The more extensive corrosion with the SS fasteners is evidenced by greater igal
and lower Rp values, greater weight loss and the damage seen in the optical
micrographs. For the SS fasteners, the corrosion occurs over most areas of the panels
near and removed from the fastener. In contrast, the corrosion with the Ti alloy
fasteners is very localized to the region where the fastener head contacts the panel. For
the SS A286 CRES fasteners, the greater rate of the oxygen reduction reaction leads to
the greater level of metal corrosion. The TCP coating, while providing some barrier
protection does consist of pores/channels and defects through which dissolved O2 and
solution species can reach the underlying metal. Finally, the TCP coating provides
221
greater corrosion inhibition under full immersion testing that under the more aggressive
thin-layer mist test.
11.2 Future Work
Task 1: While a primary focus of this work was on the corrosion protection provided by
the surface pretreatment, it should be noted that it is very rare that a “conversion
coating” alone will be the final finish on an assembly. Therefore, these aluminum alloys
will be primed (e.g., epoxy matrix loaded with SrCrO4) with an epoxy or polyurethane
enamel topcoat. The corrosion protection will be assessed for the whole multi-coat
system. A series of DC and AC electrochemical measurements will be performed in well
controlled solution environments to generate a database of polarization resistances (Rp),
corrosion potentials (Ecorr), corrosion currents (icorr), anodic and cathodic
potentiodynamic curves to determine the corresponding Tafel slopes (ba and bc), pitting
potentials (Epit) and repassivation potentials (Erep). Given the multitude of Navy
defense assets and the complex environments these assets experience, three types
accelerated corrosion tests will be performed: (i) full immersion testing in air-saturated
electrolyte solutions as a function of the solution chemistry and temperature, (ii) surface
contact by a thin-layer (~500 µL) as a function of the solution chemistry and
temperature and (iii) atmospheric exposure to a humidified gaseous environment.
Task 2: The aluminum alloys are usually joined using SS and Ti-6Al-4V fasteners that
form galvanic couples with the aluminum alloys. Therefore, the extent and nature of

222
corrosion in the couples will be assessed by forensic investigation. More detailed
studies will be performed on galvanic combinations that do not follow the trends
predicted by simple mixed potential theory, e.g. if the galvanic potentials, corrosion
rates or pitting tendency is different than the predictions. When possible, the galvanic
open circuit potentials (OCPs) and galvanic current measured with a zero resistance
ammeter will be recorded in the same solutions used in Task 1. The results will be
compared to uniform corrosion rate and pit/no-pit predictions generated from Task 1.
Painted samples with scribes exposing the base metal will also be tested to examine
how coatings interfere with or alter galvanic corrosion interactions.
Task 3: The electrochemically measured variables will be correlated with the extent of
pitting (pit density, pit area and pit depth) and or coating delamination, as assessed by
microscopy and weight change, as a function of the solution chemistry, temperature and
exposure time. Qualitatively, the degree of corrosion resistance provided by the
conversion coatings will be determined based on a pitting or no pitting assessment.
Semi-quantitatively, the apparent rate of localized corrosion will be determined by
tracking the pit density, pit area, pit depth and weight change as a function of time. The
important matrix variables will be the metal type (e.g., aluminum alloys, Ti-6Al-4V alloy,
high strength steel and graphite epoxy composite), sample preparation, pretreatment
coating, electrolyte composition (mild and aggressive), temperature (25 and 55 oC), and
immersion time.

223
BIBLIOGRAPHY

224
BIBLIOGRAPHY
1. Davis, J. R. ASM Specialty Handbook: Aluminum and Aluminum Alloys. ASM International: Materials Park, OH, 1993.
2. Kaufman, J. G. Introduction to Aluminum Alloys and Tempers. ASM International:
Materials Park, OH, 2000.
3. Campbell, F. C. Elements of Metallugy an dEngineering Alloys. ASM
International: Materials Park, OH, 2008.
4. Davis, J. R. Corrosion of Aluminum and Aluminum Alloys. ASM International:
Materials Park, OH, 1999.
5. International Alloy Designations and Chemical Composition Limits for Wrought
Aluminum and Wrought Aluminum Alloys. The Aluminum Association: Arlington, VA, 2009.
6. ASM Handbook: Properties and Selection: Nonferrous Alloys and Special-
Purpose Materials, Vol. 2. ASM International: Materials Park, OH, 1990.
7. Mathers, G. The Welding of Aluminum and Its Alloys. Woodhead Publishing:
Philadelphia, PA, 2002.
8. Mandal, N. R. Aluminum Welding. Woodhead Publishing: Philadelphia, PA, 2001.
9. ASM Handbook, Vol 13A: Corrosion: Fundamentals, Testing, and Protections.
ASM International: Materials Park, OH, 2003.
10. Stansbury, E. E.; Buchanan, R. A. Fundamentals of Electrochemical Corrosion.
ASM International: Materials Park, OH, 2000.
11. ASTM Standard G46: Standard Guide for Examination and Evaluation of Pitting
Corrosion. ASTM International: West Conshohocken, PA, 2013.
12. M. H. Larsen, J. C. Walmsley, O. Lunder, R. H. Mathiesen, and K. Nisancioglu J.
Electrochem. Soc. 2008, 155, pp C550.

225
13. ASTM Standard G110: Standard Practice for Evaluating Intergranular Corrosion
Resistance of Heat Treatable Aluminum Alloys by Immersion in Sodium Chloride + Hydrogen Peroxide Solution. ASTM International: West Conshohocken, PA, 2009.
14. ASTM G34: Standard Test Method for Exfoliation Corrosion Susceptibility in
2XXX and 7XXX Series Aluminum Alloys (EXCO Test). ASTM International: West Conshohocken, PA, 2013.
15. ASTM G47: Standard Test Method for Determining Susceptibility to Stress-
Corrosion Cracking of 2XXX and 7XXX Aluminum Alloy Products. ASTM International: West Conshohocken, PA, 2011.
16. Revie, R. W. Uhlig's Corrosion Handbook. 3rd ed.; John Wiley & Sons, Inc.:
Hoboken, NJ, 2011.
17. Riggs, O. L., Jr.; Nathan, C. C. Corrosion Inhibitors. NACE: Houston, TX, 1973; p
pp 11.
18. Noack, M. G. Mater. Perform. 1982, 21 (3), pp 26.
19. Mayne, J. E. O. Official Digest 1952, 24 (127), pp 127.
20. Bacon, R. C.; Smith, J. J.; Rugg, R. M. Ind. Eng. Chem. 1948, 40 (1), pp 161.
21. Mayne, J. E. O. Br. Corros. J. 1970, 5, pp 106.
22. Hartley, R. A. J. Mater. 1972, 7 (3), pp 361.
23. Kinsella, E. M.; Mayne, J. E. O. Br. Polym. J. 1969, 1 (4), pp 173.
24. Thomas, N. JOCCA 1991, 53 (8), pp 669.
25. Morcillo, M. JOCCA 1990, 73 (1), pp 24.
26. Leidheiser, H.; Funke, W. JOCCA 1987, 70 (5), pp 121.
226
27. Funke, W. JOCCA 1985, 68 (9), pp 229.
28. Hare, C. H. J. Protect. Coat. Linings 1998, 15 (7), pp 17.
29. Munger, C. G. Corrosion Control by Protective Coatings. NACE International:
Houston, TX, 1984; p 129.
30. Leclerq, M. J. Protect. Coat. Linings 1990, 7 (3), pp 57.
31. Svoboda, M.; Mleziva, J. Prog. Org. Coat. 1984, 12 (3), pp 251.
32. Cubberly, W. H.; Bakerjian, R. Tool and Manufacturing Engineers Handbook.
SME: Dearborn, MI, 1989; p 48-1.
33. Alodine® 1200S. MSDS 592728; Henkel Corporation: Madison Heights, MI, 2013.
34. Iridite® 14-2. MSDS 78659; MacDermid Industrial Solutions: Waterbury, CT,
2004.
35. Leggat, R. B.; Taylor, S. R.; Zhang, W.; Buchheit, R. G. Corrosion 2002, 58 (3),
pp 283.
36. MIL-DTL-5541: Military Specification, Chemical Conversion Coatings on
Aluminum and Aluminum Alloys. The U.S. Department of Defense: Washington, DC, 2006.
37. Zhao, J; Frankel, G; McCreery, R. L. J. Electrochem. Soc. 1998, 145 (7), pp 2258.
38. Sehgal, A.; Lu, D.; Frankel, G. S. J. Electrochem. Soc. 1998, 145 (8), pp 2834.
39. Akiyama, E; Frankel, G. S. J. Electrochem. Soc. 1999, 146 (11), pp 4095.
40. Ramsey, J. D.; McCreery, R. L. J. Electrochem. Soc. 1999, 146 (11), pp 4076-
4081, doi: 10.1149/1.1392594.

227
41. Xia, L; Akiyama, E; Frankel, G; McCreery, R. L. J. Electrochem. Soc. 2000, 147 (7), pp 2556.
42. Lu, D.; Schmutz, P.; Frankel, G. S. Corrosion 2002, 58 (2), pp 137.
43. Akiyama, E.; Markworth, A. J.; McCoy, J. K.; Frankel, G. S.; Xia, L.; McCreery, R.
L. J. Electrochem. Soc. 2003, 150 (2), pp B83.
44. Zhao, J.; Xia, L.; Sehgal, A.; Lu, D.; McCreery, R. L.; Frankel, G. S. Surf. Coat.
Technol. 2001, 140, pp 51.
45. Sedman, R. M.; Beaumont, J.; McDonald, T. A.; Reynolds, S.; Krowech, G.;
Howd, R. J. Environ. Sci. Health C Environ. Carcinog. Ecotoxicol. Rev. 2006, 24 (1), pp 155.
46. Proctor, D. M.; Otani, J. M.; Finley, B. L.; Paustenbach, D. J.; Bland, J. A.;
Speizer, N.; Sargent, E. V. J. Toxicol. Environ. Health A 2002, 65 (10), pp 701.
47. Dayan, A. D.; Paine, A. J. Human & Experimental Toxicology 2001, 20, pp 439.
48. Occupational Safety & Health Administration. Occupational Safety and Health
Standards: Chromium (VI), Part 1910, Standard 1910.1026, 2006. 49. National Institute for Occupational Safety and Health. Criteria for a
Recommended Standard: Occupational Exposure to Hexavalent Chromium, NIOSH Publication Number 2013-128, 2013.
50. Hayes, S. A.; Yu, P.; O'Keefe, T. J.; O'Keefe, M. J.; Stoffer, J. O. J. Electrochem.
Soc. 2002, 149 (12), pp C623.
51. Treu, B. L.; Joshi, S.; Pinc, W. R.; O'Keefe, M. J.; Fahrenholtz, W. G. J.
Electrochem. Soc. 2010, 157 (8), pp C282.
52. Jones, P. S.; Yu, P.; Pinc, W. R.; O'Keefe, M. J., Fahrenholtz, W. G.; O'Keefe, T.
J. Int. J. Appl. Ceram. Tec. 2008, 5 (1), pp 63.
53. Heller, D. K.; Fahrenholtz, W. G.; O'Keefe, M. J. Corros. Sci. 2010, 52 (2), pp 360.

228
54. Joshi, S.; Kulp, E. A.; Fahrenholtz, W. G.; O'Keefe, M. J. Corros. Sci. 2012, 60, pp 290.
55. Cook, R. L.; Taylor, S. R. Corrosion 2000, 53, pp 321.
56. Kumar, C. S.; Rao, V. S.; Raja, V. S.; Sharma, A. K.; Mayanna, S. M. Corros. Sci.
2002, 44, pp 387.
57. Guan, H.; Buchheit, R. G. Corrosion 2004, 60 (3), pp 284.
58. Hamdy, A. S.; Beccaria, A. N.; Temtchenko, T. Surf. Coat. Technol. 2002, 155,
pp 184.
59. Pearlstain, F.; Agarwala, V. S. Trivalent Chromium Solutions for Sealing
Anodized Aluminum. United States Patent 5,374,347, 1994.
60. Nickerson, B. C.; Lipnickas, E. Proceedings of the 2003 Tri-Service Corrosion
Conference: Las Vegas, NV, Nov. 17-21, 2003; 2003.
61. Alodine® T 5900 RTU. MSDS 756387; Henkel Corporation: Madison Heights, MI,
2011.
62. Alodine® 5200 Makeup. MSDS 594142, Henkel Corporation: Madison Heights,
MI, 2012.
63. Alodine® 5700 Wipes. MSDS 869854, Henkel Corporation: Madison Heights, MI,
2013.
64. B.E. Placzankis, C.E. Miller, and B.D. Mullis Examination of Nonchromate
Conversion Coatings for Aluminum Armor From Three Final Candidates Using Accelerated Corrosion and Adhesion Test Methods; ARL-TR-2601; Army Research Laboratory: Aberdeen Proving Ground, MD, 2001.
65. P. Smith, C. Miller Performance of Chromate-Free Pretreatment Options for
CARC Systems; ARL-TR-4049; Army Research Laboraroty: Aberdeen Proving Ground, MD, 2007.
66. Mahajanam, S. P. V.; Buchheit, R. G. Corrosion 2008, 64 (3), pp 230.

229
67. ASM Handbook Vol. 05: Surface Engineering. ASM International: Materials Park,
OH, 1994.
68. Kutz, M. Handbook of Environmental Degradation of Materials. William Andrew
Inc.: Norwich, NY, 2012.
69. Legg, K. O. Chromate Alternatives for Metal Treatment and Sealing, DoD Metal
Finishing Workshop: Layton, UT, 2007.
70. Alodine® T 5900 RTU. Technical Process Bulletin; Henkel Corporation: Madison
Heights, MI, 2008.
71. Alodine® 5200. Technical Data Sheets; Henkel Corporation: Madison Heights,
MI, 2007.
72. Dardona, S.; Jaworowski, M. Appl. Phys. Lett. 2010, 97, pp 181908.
73. Fujiwara, H. Spectroscopic Ellipsometry: Principles and Applications. Wiley: New
York, 2007; p 158.
74. Campestrini, P.; Bohmb; S.; Schram, T.; Terryn, H.; De Wit, J. H. W. Thin Solid
Films 2002, 410, pp 76.
75. Mittal, K. L. Contact Angle, Wettability and Adhesion. CRC Press: Boca Raton,
2006; p 267.
76. Orazem, M. E.; Tribollet, B. Electrochemical Impedance Spectroscopy. 1st ed.;
Wiley-Interscience: Hoboken, NJ, 2008.
77. Lai, W.; Haile, S. M. J. Am. Ceram. Soc. 2005, 88, pp 2979.
78. Bard, A.J.Faulkner, L. R. Electrochemical Methods. 2nd ed.; Wiley: Hoboken, NJ,
2000.
79. Creus, J.; Mazille, H.Idrissi, H. Surf. Coat. Technol. 2000, 130, pp 224.

230
80. Liu, C.; Bi, Q.; Leyland, A.Matthews, A. Corros. Sci. 2003, 45, pp 1257.
81. H. Bohni, and H.H. Uhlig J. Electrochem. Soc. 1969, 116, pp 906.
82. Galvele, J. R. J. Electrochem. Soc. 1976, 123, pp 464.
83. Comotti, I. M.; Trueba, M.; Trasatti, S. P. Surf. Interface. Anal. 2013, Special
issue article, doi: 10.1002/sia.5270.
84. B.N. Stirrup, N.A. Hampson, and I.S. Midglay J. Appl. Electrochem. 1975, 5, pp
229.
85. M. Asaduzzaman, C.M. Mustafa, and M. Islam Chemical Industry & Chemical
Engineering Quarterly 2011, 17, pp 477.
86. M. Yasudo, F. Weinberg, and D. Tromans J. Electrochem. Soc. 1990, 137, pp
3708.
87. Fenster, C.; Smith, A. J.; Abts, A.; Milenkovic, S. Hassel, A. W. Elctrochem.
Commun. 2008, 10, pp 1125.
88. Anik, M.; Osseo-Asare, K. J. Electrochem. Soc. 2002, 149, pp B224.
89. Lillard, R. S.; Kanner, G. S.; Butt, D. P. J. Electrochem. Soc. 1998, 145, pp 2718.
90. Fhaner, M.; Zhao, H.; Bian, X.; Galligan, J. J.Swain, G. M. Diam. Relat. Mater.
2011, 20, pp 75.
91. MacDonald, D. D.; Liu, J.Lee, D. J. Appl. Electrochem. 2004, 34, pp 577.
92. Kriksunov, L. B.; MacDonald, D. D.; Millett, P. J. J. Electrochem. Soc. 1994, 141,
pp 3002.
93. Patrik, E.; Orazem, M. S.; Sanchez, J. C.; Nishida, T. J. Neurosci. Methods 2011,
198, pp 158.
231
94. Metikoš-Huković, M.Grubač, Z. J. Electrochem. Soc. 2003, 556, pp 167.
95. ASTM D6943: Standard Practice for Immersion Testing of Industrial Protective
Coatings. ASTM International: West Conshohocken, PA, 2010.
96. ASTM G50: Standard Practice for Conducting Atmospheric Corrosion Tests on
Metals. ASTM International: West Conshohocken, PA, 2003.
97. ASTM G87: Standard Practice for Conducting Moist SO2 Tests. ASTM
International: West Conshohocken, PA, 2013.
98. ASTM G71: Standard Guide for Conducting and Evaluating Galvanic Corrosion
Tests in Electrolytes. ASTM International: West Conshohocken, PA, 1998.
99. A. Iyer, W. Willis, S. Frueh, W. Nickerson, A. Fowler, J. Barnes, L. Hagos, J.
Escarsega, J. La Scala and S. L. Suib Plat. Surf. Finish. 2010, 5, pp 32.
100. E. Akiyama, A. J. Markworth, J. K. McCoy, G. S. Frankel, L. Xia, and R. L.
McCreery J. Electrochem. Soc. 2003, 150, pp B83.
101. McCreery, B. L. Hurley and R. L. J. Electrochem. Soc. 2003, 150, pp B367.
102. W. Zhang, B. Hurley, and R. G. Buchheit J. Electrochem. Soc. 2002, 149, pp
B357.
103. McCreery, W. J. Clark and R. L. J. Electrochem. Soc. 2002, 149, pp B379.
104. J. Zhao, L. Xia, A. Sehgal, D. Lu, R. L. McCreery, and G. S. Frankel Surf. Coat.
Technol. 2001, 140, pp 51.
105. W. R. McGovern, P. Schmutz, R. G. Buchheit, and R. L. McCreery J.
Electrochem. Soc. 2000, 147, pp 4494.
106. L. Xia, E. Akiyama, G. Frankel, and R. McCreery J. Electrochem. Soc. 2000, 147,
pp 2556.
107. McCreery, J. D. Ramsey and R. L. J. Electrochem. Soc. 1999, 146, pp 4076.

232
108. J. Zhao, G. Frankel, and R. L. McCreery J. Electrochem. Soc. 1998, 145, pp
2258.
109. L. Xia, and R.L. McCreery J. Electrochem. Soc. 1999, 146, pp 3696.
110. M.A. Jakab, D.A. Little, J.R. Scully J. Electrochem. Soc. 2005, 152, pp B311-
B320.
111. M. Kendig, R. Addison, and S. Jeanjaquet J. Electrochem. Soc. 1999, 146, pp
4419.
112. W.C. Nickerson, E. Lipnickas Proceedings of the 2003 Tri Service Corrosion
Conference, Las Vegas, NV, 2003.
113. Jaworowski, S. Dardona and M. Appl. Phys. Lett. 2010, 97, pp 181908.
114. L. Li, G.P. Swain, A. Howell, D. Woodbury, G.M. Swain J. Electrochem. Soc.
2011, 158, pp C274-C283.
115. L. Li, A.L. Desouza, G.M. Swain Analyst 2013, 138 (15), pp 4398.
116. Tribollet, M.E. Orazem and B. Electrochemical Impedance Spectroscopy. 1st ed.;
Wiley, John & Sons, Incorporated: 2008.
117. Faulkner, A.J. Bard and L.R. Electrochemical Methods: Fundamental and
Applications. 2 ed.; Wiley: 2000.
118. X. Dong, P. Wang, S. Argekar, D.W. Schaefer Langmuir 2010, 26, pp 10833.
119. Berger, R.; Bexell, U.; Grehk, T. M.Hornstrom, S. E. Surf Coat Tech 2007, 202
(2), pp 391-397.
120. McCreery, R. L. Raman Spectroscopy for Chemical Analysis. Wiley: New York,
2000.

233
121. McCreery, L. Xia and R.L. Journal of Electroanalytical Chemistry 1998, 145, pp 3083.
122. J. E. Maslar, W. S. Hurst, W. J. Bowers, Jr., J. H. Hendricks, M. I. Aquino, and i.
Levin App. Surf. Sci. 2001, 180, pp 102.
123. McCreery, J. D. Ramsey and R. L. Corros. Sci. 2004, 46, pp 1729.
124. J. D. Ramsey, L. Xia, M. X. Kendig, and R. L. McCreery Corros. Sci. 2001, 43, pp
1557.
125. H. Y. H. Chan, C. G. Takoudis, and M. J. Weaver J. Phys. Chem. B 1999, 103,
pp 357.
126. Gewirth, K. L. Stewart and A. A. Langmuir 2007, 23, pp 9911.
127. M. Ivanda, D. Waasmaier, A. Endriss, J. Ihringer, A. Kirfel, and W. Kiefer J.
Raman Spectrosc. 28, pp 487.
128. G. S. Chen, M. Gao, and R. P. Wei Corrosion 1996, 52, pp 8.
129. R. G. Buchheit, R. P. Grant, P. F. Hlava, B. McKenzie, and G. L. Zender J.
Electrochem. Soc. 1997, 144, pp 2621.
130. M. W. Kendig, A. J. Davenport, and H. S. Isaacs Corros. Sci. 1993, 34, pp 41.
131. B. P. Payne, M. C. Biesinger, N. S. Mclntyre J. Electron Spectrosc. 2011, 184, pp
29.
132. Rai, L. E. Eary and D. Environ. Sci. Technol. 1987, 21, pp 1187.
133. Millero, M. Pettine and F. J. Limnol. Oceanogr. 1990, 35, pp 730.
134. Millero, M. Pettine and F. J. Mar. Chem. 1991, 34, pp 29.

234
135. M. A. Jakab, D. A. Little, and J. R. Scully J. Electrochem. Soc. 2005, 152, pp B311.
136. A. L. Colley, J. V. Macpherson, and P. R. Unwin Electrochem. Commun. 2008,
10, pp 1334.
137. N. Spanos, S. Slavov, C. Kordulis, and A. Lycourghotis Langmuir 1994, 10, pp
3134.
138. Polmear, I. J. Light Alloys. 3rd ed.; Arnold: London, UK, 1995.
139. Q. Meng and G. S. Frankel J. Electrochem. Soc. 2004, 151, pp 271.
140. Buchheit, N. Birbilis and R.G. J. Electrochem. Soc. 2005, 152, pp B140-B151.
141. Buchheit, R.G. J. Electrochem. Soc. 1995, 142, pp 3994.
142. Nisancioğlu, K. J. Electrochem. Soc. 1990, 137, pp 69.
143. M. Buchler, T. Watari, and W. H. Smyrl Corros. Sci. 2000, 42, pp 1661.
144. G.O. Ilevbare, O. Schneider, R.G. Kelly, and J.R. Scully J. Electrochem. Soc.
2004, 151, pp 465.
145. L. Li, D.Y. Kim, and G.M. Swain J. Electrochem. Soc. 2012, 159, pp C326.
146. Frankel, Y. Guo and G.S. Corrosion 2012, 68, pp 045002-1.
147. ASTM G31: Standard Practice for Laboratory Immersion Corrosion Testing of
Metal. ASTM International: West Conshohocken, PA, 2004.
148. ASTM G44: Standard Practice for Exposure of Metals and Alloys by Alternate
Immersion in Neutral 3.5?% Sodium Chloride Solution. ASTM International: West Conshohocken, PA, 2013.
235
149. ASTM B117: Standard Practice for Operating Salt Spray (Fog) Apparatus. ASTM International: West Conshohocken, PA, 2011.
150. ASTM G85: Standard Practice for Modified Salt Spray (Fog) Testing. ASTM
International: West Conshohocken, PA, 2011.
151. ASTM G3: Standard Practice for Conventions Applicable to Electrochemical
Measurements in Corrosion Testing. ASTM International: West Conshohocken, PA, 2010.
152. ASTM G106: Standard Practice for Verification of Algorithm and Equipment for
Electrochemical Impedance Measurements. ASTM International: West Conshohocken, PA, 2010.
153. ASTM G71: Standard Guide for Conducting and Evaluating Galvanic Corrosion
Tests in Electrolytes. ASTM International: West Conshohocken, PA, 2009.
154. ASTM D6208: Standard Test Method for Repassivation Potential of Aluminum
and Its Alloys by Galvanostatic Measurement. ASTM International: West Conshohocken, PA, 2007.
155. Field, D. P.; Weiland, H.; Kunze, K. Can. Metall. Q. 1995, 34 (3), pp 203.
156. Buchheit, R. G.; Martinez, M. A.; Montes, L. P. J. Electrochem. Soc. 2000, 147,
pp 119.
157. Lacroix, L.; Ressier, L.; Blanc, C.; Mankowski, G. J. Electrochem. Soc. 2008, 155
(4), pp C131.
158. Li, L.; Swain, G. M. Proceedings of The 223rd Electrochemical Society Meeting:
Toronto, ON, Canada, 2013.
159. ASTM G46: Standard Guide for Examination and Evaluation of Pitting Corrosion.
ASTM International: West Conshohocken, PA, 2013.
160. Feng, Z. C.; Frankel, G. S. Corrosion 2013, doi: http://dx.doi.org/10.5006/0907.
236
161. Matzdorf, C. A.; Nickerson, W. C.; Rincon Troconis, B. C.; Frankel, G. S.; Li, L.; Buchheit, R. G. Corrosion 2013, doi: http://dx.doi.org/10.5006/0905.
162. Wit, J.H.W. De Corrosion Mechanisms in Theory and Practice. Marcel Dekker:
New York, 1995; p 581-628.
163. Haas, P. L. Hagans and C. M. Surf. Interface Anal. 1994, 21, pp 65.
164. C.M. Cotell, J.A. Spragues, and F.A. Smidt Jr. ASM Handbook. ASM
International: 1994; Vol. 5, p 405-411.
165. R.L. De Rosa, J.T. Grant, L. Katsen, M. Donley, and G.P. Bierwagen Corrosion
(Houston) 2000, 56, pp 395.
166. O. Lunder, and K. Nisancioglu Corrosion (Houston) 1988, 44, pp 414.
167. L. Fedrizzi, F. Deflorian, R. Canteri, M. Fedrizzi, P.L. Bonora Progress in
Understanding and Prevention of Corrosion, Proceedings of 10th European Corrosion Congress: London, UK, 1993.
168. I. Pires, L. Quintino, C.M. Rangel, G.E. Thompson, P. Skeldon, X. Zhou Trans.
Inst. Met. Finish. 2000, 78, pp 179.
169. L. Fedrizzi, A. Bianchi, F. Deflorian, S. Rossi, P.L. Bonora Electrochim. Acta.
2002, 47, pp 2159.
170. O. Lunder, B. Olsen, K. Nisancioglu Int. J. Adhes. Adhes. 2002, 22, pp 143.
171. D. Chidambaram, C.R. Clayton, G.P. Halada, M.W. Kendig J. Electrochem. Soc.
2004, 151, pp B605-B612.
172. P. Campestrini, E.P.M. Van Westing, and J.H.W. De Wit Electrochim. Acta. 2001,
46, pp 2553-2571.
173. P. Hagans, C.M. Haas Surf. Interface Anal. 1994, 21, pp 65.
174. A.E. Hughes, R. J. Taylor, B.R.W. Hinton Surf. Interface Anal. 1997, 25, pp 223.

237
175. D. Chidambaram, C.R. Clayton, M.W. Kendig, G.P. Halada J. Electrochem. Soc.
2004, 151, pp B613-B620.
176. G.P. Halada, J.R. Keams, C.R. Clayton, M.W. Kendig, S.L. Jeanjaquest, G.G.
Peterson, G. Shea-Mccarthy The Electrochemical Meeting Abstracts. Boston, MA, Nov. 1-6, 1998; Vol. 98-2.
177. X. Sun, R. Li, K.C. Wong, K.A.R. Mitchell, T. Foster J. Mater. Sci. 2001, 36, pp
3215.
178. P. Campestrini, E.P.M. Van Westing, J.H.W. De Wit Electrochim. Acta. 2001, 46,
pp 2631-2647.
179. S. Dardona, L. Chen, M. Kryzman, D. Goberman, M. Jaworowski Anal. Chem. 83,
83, pp 6127-6131.
180. L. Li, K.P. Doran, G.M. Swain J. Electrochem. Soc. 2013, 160, pp C1-C6.
181. Y. Guo, and G.S. Frankel Surf. Coat. Technol. 2012, 206, pp 3895-3902.
182. S. Wernick, R. Pinner, P.G. Sheasby The Surface Treatment and Finishing of
Aluminum and its Alloys. 5th ed.; ASM International: 1987.
183. R.G. Buchheit, A.E. Hughes ASM Handbook. ASM International: 2003; Vol. 13A,
p 720-735.
184. L. Lacrois, L. Ressier, C. Blanc, and G. Mankowski J. Electrochem. Soc. 2008,
155, pp C131-C137.
185. S.L. Flegler, J.W. Heckman, K.L. Klomparens Scanning and Transmission
Electron Microscopy: An Introduction. 1st ed.; Oxford University Press: 1999; p 77-78.
186. Schweitzer, P.A. Fundametnals of Metallic Corrosion: Atmospheric and Media
Corrosion of Metals. CRC Press: 2006; p 500.

238
187. Baboian, R. Corrosion Tests and Standards: Application and Interpretation. ASTM International: 2005; p 552.
188. Davis, J.R. Corrosion of Aluminum and Aluminum Alloys. ASM International:
1999; p 281.
189. S. Joshi, W.G. Fahrenholtz, M.J. O'Keefe Appl. Surf. Sci. 2011, 257, pp 1859.
190. S. Joshi, W.G. Fahrenholtz, M.J. O'Keefe Surf. Coat. Technol. 2011, 205, pp
4312-4319.
191. Hatch, J.E. Aluminum: Properties and Physical Metallurgy. ASM International:
1984.
192. K.J. Holub, L.J. Matienzo J. Appl. Surf. Sci. 1981, 9, pp 22-38.
193. T. Fujita, Z. Horita, T.G. Langdon Philos. Mag. 2002, 82, pp 2249-2262.
194. Revie, R.W. Uhlig's Corrosion Book. 2nd ed.; John Wiley & Sons: New York,
2000; p 815-816.
195. V. Fournier, P. Marcus, I. Olefjord J. Surf. Interface Anal. 2002, 34, pp 494-497.
196. T. Xue, W.C. Cooper, R. Pascual, S. Saimoto J. Appl. Electrochem. 1991, 21, pp
238-246.
197. Szklarska-Smialowska, Z. Corros. Sci. 1999, 41, pp 1743-1767.
198. Guo, Y.; Frankel, G. S. Surf. Coat. Technol. 2012, 206 (19-20), pp 3895-3902.
199. Li, L.; Swain, G. P.; Howell, A.; Woodbury, D.; Swain, G. M. J. Electrochem. Soc.
2011, 158 (9), pp C274-C283.
200. Lcuret, V.; Jeffcoate, C. S.; Issacs, H. S.; Buchheit, R. G. J. Electrochem. Soc.
2003, 250, pp B425.
239
201. Jeurgens, L. P. H.; Sloof, W. G.; Tichelaar, F. D.; and Mittemeijer, E. J. J. Appl. Phys. 1949, 92.
202. Dong, X. C.; Wang, P.; Argekar, S.; Schaefer, D. W. Langmuir 2010, 26 (13), pp
10833-10841.
203. Lin, X.; McCreery, R. L. J. Electrochem. Soc. 1998, 145, pp 3083.
204. Li, L.; Doran, K. P.; Swain, G. M. J. Electrochem. Soc. 2013, 160 (8), pp C396.
205. Matzdorf, C. Non-Chromate Aluminum Pretreatments, Phase I Report; PP0025;
Patuxent River, MD, 2003.
206. Matzdorf, C. Non-Chromate Aluminum Pretreatments, Phase II Report; PP0025;
Patuxent River, MD, 2004.
207. C. G. Rhodes, M. W. Mahoney and W. H. Bingel Scripta Mater. 1997, 36, pp 69.
208. Barrett, R. T. Fastener Design Manual. NASA Reference Publication: 1990.
209. C.A. Matzdorf, W. C. Nickerson, B. C. Rincon-Troconis, G. S. Frankel, L. Li, and
R. G. Buchheit Corrosion 2013, http://dx.doi.org/10.5006/0905.
210. Frankel, Z. Feng and G. S. Corrosion 2013, http://dx.doi.org/10.5006/0907.