Corrosion Preventative Compounds (CPCs) Effect on · PDF fileCorrosion Preventative Compounds...
132
Corrosion Preventative Compounds (CPCs) Effect on Aircraft Electrical Wiring Components Final Report Contract Number: F09650-03-D-0001 Delivery Order Number: 5014-RAY-001 Raytheon Project Number: 50-45-002 Prepared For: Naval Air Systems Command 47123 Buse Road Patuxent River, Maryland 20670-1547 Prepared By: R Raytheon Technical Services Company, LLC Customized Engineering and Depot Support 6125 East 21st Street Indianapolis, IN 46219-2058 Copyright © 2007 Raytheon Company All Rights Reserved This data was developed pursuant to Contract Numbers GS-10F-0229L, F09650-03-D-0001, and FA8501-06-D-0001 with the US Government and its contractors. The US Government’s rights in and to this copyrighted data are as specified in DFAR 252.227-7013, which was made part of the above contract.
Transcript of Corrosion Preventative Compounds (CPCs) Effect on · PDF fileCorrosion Preventative Compounds...
Corrosion Preventative Compounds (CPCs) Effect on Aircraft Electrical Wiring Components
Final Report
Contract Number: F09650-03-D-0001 Delivery Order Number: 5014-RAY-001
Raytheon Project Number: 50-45-002
Prepared For:
Naval Air Systems Command 47123 Buse Road
Patuxent River, Maryland 20670-1547
Prepared By:
R
Raytheon Technical Services Company, LLC Customized Engineering and Depot Support
6125 East 21st Street Indianapolis, IN 46219-2058
Copyright © 2007 Raytheon Company All Rights Reserved This data was developed pursuant to Contract Numbers GS-10F-0229L, F09650-03-D-0001, and FA8501-06-D-0001 with the US Government and its contractors. The US Government’s rights in and to this copyrighted data are as specified in DFAR 252.227-7013, which was made part of the above contract.
Report Documentation Page Form ApprovedOMB No. 0704-0188
Public reporting burden for the collection of information is estimated to average 1 hour per response, including the time for reviewing instructions, searching existing data sources, gathering andmaintaining the data needed, and completing and reviewing the collection of information. Send comments regarding this burden estimate or any other aspect of this collection of information,including suggestions for reducing this burden, to Washington Headquarters Services, Directorate for Information Operations and Reports, 1215 Jefferson Davis Highway, Suite 1204, ArlingtonVA 22202-4302. Respondents should be aware that notwithstanding any other provision of law, no person shall be subject to a penalty for failing to comply with a collection of information if itdoes not display a currently valid OMB control number.
1. REPORT DATE AUG 2011 2. REPORT TYPE
3. DATES COVERED 00-00-2011 to 00-00-2011
4. TITLE AND SUBTITLE Corrosion Preventative Compounds (CPCs) Effect on Aircraft ElectricalWiring Components
5a. CONTRACT NUMBER
5b. GRANT NUMBER
5c. PROGRAM ELEMENT NUMBER
6. AUTHOR(S) 5d. PROJECT NUMBER
5e. TASK NUMBER
5f. WORK UNIT NUMBER
7. PERFORMING ORGANIZATION NAME(S) AND ADDRESS(ES) Raytheon Technical Services Company, LLC,Customized Engineeringand Depot Support,6125 East 21st Street,Indianapolis,IN,46219-2058
8. PERFORMING ORGANIZATIONREPORT NUMBER
9. SPONSORING/MONITORING AGENCY NAME(S) AND ADDRESS(ES) 10. SPONSOR/MONITOR’S ACRONYM(S)
11. SPONSOR/MONITOR’S REPORT NUMBER(S)
12. DISTRIBUTION/AVAILABILITY STATEMENT Approved for public release; distribution unlimited
13. SUPPLEMENTARY NOTES Focused Workshop on Cadmium Plating Alternatives, August 30-31, 2011, Baltimore, MD. Sponsored by SERDP/ESTCP.
14. ABSTRACT
15. SUBJECT TERMS
16. SECURITY CLASSIFICATION OF: 17. LIMITATION OF ABSTRACT Same as
Report (SAR)
18. NUMBEROF PAGES
131
19a. NAME OFRESPONSIBLE PERSON
a. REPORT unclassified
b. ABSTRACT unclassified
c. THIS PAGE unclassified
Standard Form 298 (Rev. 8-98) Prescribed by ANSI Std Z39-18

CPC Effect on Aircraft Electrical Wiring Components TR285HN301 Final Report Revision: -
This page intentionally left blank.

CPC Effect on Aircraft Electrical Wiring Components TR285HN301 Final Report Revision: -
CHANGE RECORD This sheet is a record of each issue of this document. When the revised document is issued, the previous issue is automatically superseded.
Version Date Configuration Management
Changes Reason for Change
Rev - 11-30-07 Base document
Document Title: CPC Effect on Aircraft Electrical Wiring Components
Document Number: TR285HN301
CPC Effect on Aircraft Electrical Wiring Components TR285HN301 Final Report Revision: -
This page intentionally left blank.

CPC Effect on Aircraft Electrical Wiring Components TR285HN301 Final Report Revision: -
PREFACE
This technical report was prepared by the Wiring Interconnections Laboratory of the Raytheon Technical Services Company LLC, Indianapolis, Indiana. Support of this investigation was provided by Raytheon Net Centric Systems, McKinney, TX and the Materials Group of the Naval Air Systems Command. This report examines the effects of Corrosion Preventative Compounds (CPCs) on the performance of electrical wiring components used in typical naval aerospace vehicles.

CPC Effect on Aircraft Electrical Wiring Components TR285HN301 Final Report Revision: -
This page intentionally left blank.

CPC Effect on Aircraft Electrical Wiring Components TR285HN301 Final Report Revision: -
Executive Summary Corrosion continues to be a widespread and costly issue in the aircraft industry. With the use of Corrosion Preventative Compounds (CPCs) being effective on aircraft structures, the Air Force and NAVAIR have mandated that CPCs be applied to all areas of the aircraft for corrosion protection. Citing that most corrosion problems on electrical and electronic equipment are caused by moisture intrusion, the mandates include the application of CPCs on the exterior and interfaces of electrical connectors and on other wiring components. Many original equipment manufacturers have expressed concerns regarding the use of CPCs on electrical systems, and minimal testing has been performed to determine the effects of CPCs with respect to degradation of the Electrical Wiring Interconnect System (EWIS), the transfer of electrical signals, increased contamination, and routine maintenance actions. This test program was developed to evaluate and compare the effects of three CPCs on aircraft electrical wiring components, including a more recently developed MIL-L-87177 CPC, two presently used MIL-C-81309 Type III products, and a control.
1. So-Sure Green (SSG) – MIL-C-81309 Type III 2. ACF-50 – MIL-C-81309 Type III 3. Super Corr B (SCB) – MIL-L-87177 4. Control – no CPC applied in most cases, water used for immersion tests
The program followed modified test sequences from MIL-C-38999, AS39029, and AS22759, and evaluated:
1. the effects of CPCs on wiring system materials 2. galvanic corrosion of the components commonly used in wiring components 3. fretting corrosion inside connectors 4. effects of environmental contamination and routine environmental stressors, and 5. electrical applications where a wiping action occurs, as in mating and unmating of
electrical connector shells and contacts The findings indicated that some or all CPCs:
• inhibit corrosion on electrical wiring system components • initially, do not have an adverse affect on the transfer of electrical signals in wiring
systems, but eventually can cause degradation of the electrical signals. • after exposure to high temperatures for an extended duration, may cause problems
pertaining to maintenance of electrical wiring systems (increased forces for unmating connectors and removing wired contacts) and transfer of electrical signals (crystallized CPC).
• will degrade certain types of elastomers. • are susceptible to entrapping contaminants.

CPC Effect on Aircraft Electrical Wiring Components TR285HN301 Final Report Revision: -
The following recommendations relate to the use of CPCs on NAVAIR aircraft. • The use of a CPC on the connector interfaces is not recommended. The contact plating
protects the circuit terminations sufficiently, and the long-term behavior of the CPC can cause a reduction in the performance of the electrical circuits.
• CPC can be applied to the exterior of the connectors to protect against corrosion, but the
use of MIL-C-81309 CPCs on wire insulation and sleeving is discouraged due to the detrimental effects.
• Since the performance of the two evaluated MIL-C-81309 CPCs was so varied, use of the
Super Corr-B is recommended over various MIL-C-81309 CPCs. • CPCs provided corrosion protection to connectors and accessories, particularly in highly
corrosive salt environments. However, since the CPCs also caused some degradation of the electrical performance, the user will have to determine whether the increased corrosion protection outweighs the risk of degraded performance.
• The potential effects of CPCs to the circuits and wiring components during design,
installation of wiring in the aircraft, and maintenance operations should be considered. Safety factors are expected to allow for slight performance decreases during aging of the EWIS. The use of a CPC on the wiring may not have been considered originally, and should be factored into open wiring design if the practice of application continues.
• Perform field studies to determine whether the use of Super Corr-B can decrease the
maintenance costs of aircraft.
Electrical performance degrades as the EWIS ages. CPCs can affect this aging, protecting from corrosion, but negatively affecting the electrical performance when applied to connector interfaces. This degradation can be minimized by appropriate EWIS design, installation, and maintenance, but as the system ages, the degradation may have a greater effect on the performance, particularly with critical circuits. When considering both corrosion protection and wiring component degradation, Super Corr-B would be the recommended CPC choice. Field studies and additional laboratory testing would answer additional questions regarding the effectiveness and potential cost savings realized by the use of Super Corr-B or equivalent MIL-L-87177 material.

CPC Effect on Aircraft Electrical Wiring Components TR285HN301 Final Report Revision: -
Acknowledgements Assistance was necessary from the following people: Raytheon Technical Services Company LLC (RTSC)
Dan Auble Ken Croy Sue Ehle Bruce Everts Renee Garard Gary LaSalle Emmett Perkoski John Sprung Tim Ward Carl Wetzel
Raytheon Net Centric Systems Larry Taylor
NAVAIR Craig Matzdorf Todd Standish Fred Lancaster

CPC Effect on Aircraft Electrical Wiring Components TR285HN301 Final Report Revision: -
Table of Contents 1.0 Introduction 1 2.0 Background 1
2.1 Scope 2 3.0 Test Program 2
3.1 Test Samples 3 3.2 Test Plan 7 3.3 Test Protocols 10 3.4 Test Procedures 10
4.0 Test Results and Analysis 11
4.1 Application of CPC 11 4.2 Connectors 11 4.3 Contacts 29 4.4 Insulation materials 37
5.0 Conclusions 43 5.1 CPC 43 5.2 Connectors 43 5.3 Contacts 44 5.4 Insulating Materials 45 6.0 Recommendations 47 6.1 Future Testing 47 Appendices A Review of Previous Reports 49 B Test Protocol Example 54 C Test Procedures Summary 56 D Photographs 61 E Figures 98

CPC Effect on Aircraft Electrical Wiring Components TR285HN301 Final Report Revision: -
1.0 Introduction Corrosion continues to be a major problem in the aircraft industry. With various Corrosion Preventative Compounds (CPCs) being used with some success in reducing the corrosion on aircraft structures, maintenance personnel have also turned to these products in an attempt to protect electrical wiring components. Many original equipment manufacturers have expressed concerns and shared problems attributed to the application of CPCs to wiring components. Very little testing has been performed to determine if the compounds degrade each of the many different types of materials in the electrical systems, adversely affect the ability of electrical signals to pass through the systems, promote collection of contaminants, and/or adversely affect routine maintenance actions. The purpose of this test program was to evaluate the effects of CPCs on aircraft electrical wiring components, and to compare a new CPC product certified to meet MIL-L-87177, “Lubricants, Corrosion Preventive Compound, Water Displacing, Synthetic”, relative to two currently used products that meet MIL-C-81309 Type III, “Corrosion Preventive Compounds, Water Displacing, Ultra Thin Film”. 2.0 Background Several reports were reviewed, including those listed below, that have evaluated the performance of CPCs to reduce or eliminate failures of electrical components due to corrosion.
• Battelle Report 1996: “Evaluation of Lubricant Effectiveness for Corrosion Protection and Improved Reliability of Electrical and Electronic Connectors”
• W. H. Abbott, 2000: “Corrosion Monitoring of Air Force Field Sites and Effects of Lubrication on Corrosion Inhibition”
• David Horne, 2000: “Catastrophic Uncommanded Closures of Engine Feedline Fuel Valve from Corroded Electrical Connectors”
• James Hanlon, 2000: “MIL-L-87177 and a Commercial Lubricant Improve Electrical connector fretting corrosion behavior”
• W. H. Abbott, 1998: “Final Report: Evaluation of Lubricants for Corrosion Inhibition on Electrical Connectors”
• W. H. Abbott, 2000: “Effects of Lubrication on the reliability of Electrical Connectors” • Bryan Balazs, 2000: “Assessment of compatibility issues associated with the use of
electrical connector lubricant MIL-L-87177A” The following summarizes the main points of these reports, and a complete review is provided in appendix A.
• After screening the CPCs, the effects on avionics reliability were tested. There was a correlation between degradation of contact resistance with corrosive severity. Specific CPCs were shown to provide corrosion inhibition.
• A study evaluated fretting cycles on tin plated pins. Applying MIL-L-87177 CPC improved its mission capable rate by 16%.
1

CPC Effect on Aircraft Electrical Wiring Components TR285HN301 Final Report Revision: -
• Fretting research project was performed on nano-miniature connectors. Connectors without CPC failed after 45,000 fretting cycles, while the samples with CPC per MIL-L-87177 failed after 20 million cycles.
• Although some CPCs showed no compatibility issues, others actually promoted corrosion under certain conditions.
• Various materials have been tested with CPCs, including gold plated edge card connectors, electrical connectors, tin plated pins, nano-miniature connectors.
Current Air Force and NAVAIR mandates have dictated that CPCs must be applied to all areas of the aircraft for corrosion protection. The following Navy documents provide some guidance on the usage of CPCs:
• NAVAIR 16-1-540 identifies items that need to be preserved against corrosion, including electrical connectors and receptacles. MIL-C-81309 Type II Corrosion preventive compounds is called out to be applied as a thin film to a clean surface.
NAVAIR 01-1A-509 states that almost all corrosion problems on electrical and electronic equipment are caused by moisture intrusion at the connector or lead-in attachment points on cases and covers. The document specifies to spray MIL-C-81309 Type III into the pin and/or pin receptacle end of connectors prior to mating the connector halves, and spray on the connector shells after they are mated. The procedures provide a note that states that a CPC will deposit a thin non-conductive film, which must be removed for proper function of contact points and other electromechanical devices where no slipping or wiping action is involved.
2.1 Scope This test program was designed to evaluate 1) the direct effects of the CPCs on various materials used in the wiring system, including materials not previously examined in other test programs, such as connector grommets, wire insulation and sleeving), 2) galvanic corrosion of the metallic components commonly used in wiring components, 3) fretting corrosion inside connectors, and 4) effects of environmental contamination and routine environmental stressors as they relate to the above (salt fog, dust/sand, temperature and humidity, vibration). This program evaluated electrical applications where a wiping action occurs, as is typical with the mating and unmating of electrical connector shells and contacts in traditional aircraft wiring systems. 3.0 Test Program. The test program was designed to determine the interactions between three CPCs and various materials used in aircraft wiring systems. Previous reports and data indicated that fairly thorough testing of metals (based upon structures materials) had been conducted, but little data is available for the materials in electrical wiring systems.
2

CPC Effect on Aircraft Electrical Wiring Components TR285HN301 Final Report Revision: -
The program examined the following effects: material degradation based upon changes in the material properties (hardness, swelling, electrical properties, performance ability, etc.), corrosion growth (visual, increase in electrical resistance), and changes in functionality due to contamination, (mating forces, electrical resistance, changes in EMI shielding effectiveness, etc.). 3.1 Test Samples 3.1.1 Components and materials evaluated: Tables 1 through 3 provide basic part number descriptions, component designators, and material descriptions for the components evaluated in the program. The parts and materials selected are representative of components commonly found in aircraft wiring applications. Although some of the materials in this program are not permitted in new designs, they still may exist in aircraft currently in operation. 3.1.1.1 Connectors, Contacts, and Connector Accessories The MIL-DTL-38999 Series III connector is the Navy preferred connector type, and the MIL-DTL-5015 connector is used in applications where contact sizes larger than size 12 are required. Stainless steel bands are commonly used to attached braided shields to aluminum and composite shell connector accessories in the fleet. Table 1. Groups A, B, and C connector and connector accessory types.
Component Specification and Class
Component Designator
Component Description
MIL-DTL-38999 Series III, Class W
A Cadmium (over suitable underplate) plated aluminum, silicone grommets and epoxy inserts
MIL-DTL-38999 Series III, Class F
B Nickel plated aluminum, silicone grommets and epoxy inserts
MIL-DTL-38999 Series III, Class M
C Nickel plated composite, silicone grommets and epoxy inserts
MIL-DTL-5015, Class W D Cadmium over nickel plated aluminum, silicone grommets and epoxy inserts
MIL-DTL-24038, Class G E Chromated metal, epoxy inserts MIL-C-81659 rectangular, Class 1, Type II
F Chromated aluminum, silicone grommets and epoxy inserts
AS85049, Class W G Cadmium (over suitable underplate) plated aluminum, with plated copper shield
AS85049, Class J H Cadmium plated composite, with plated copper shield
3
CPC Effect on Aircraft Electrical Wiring Components TR285HN301 Final Report Revision: -
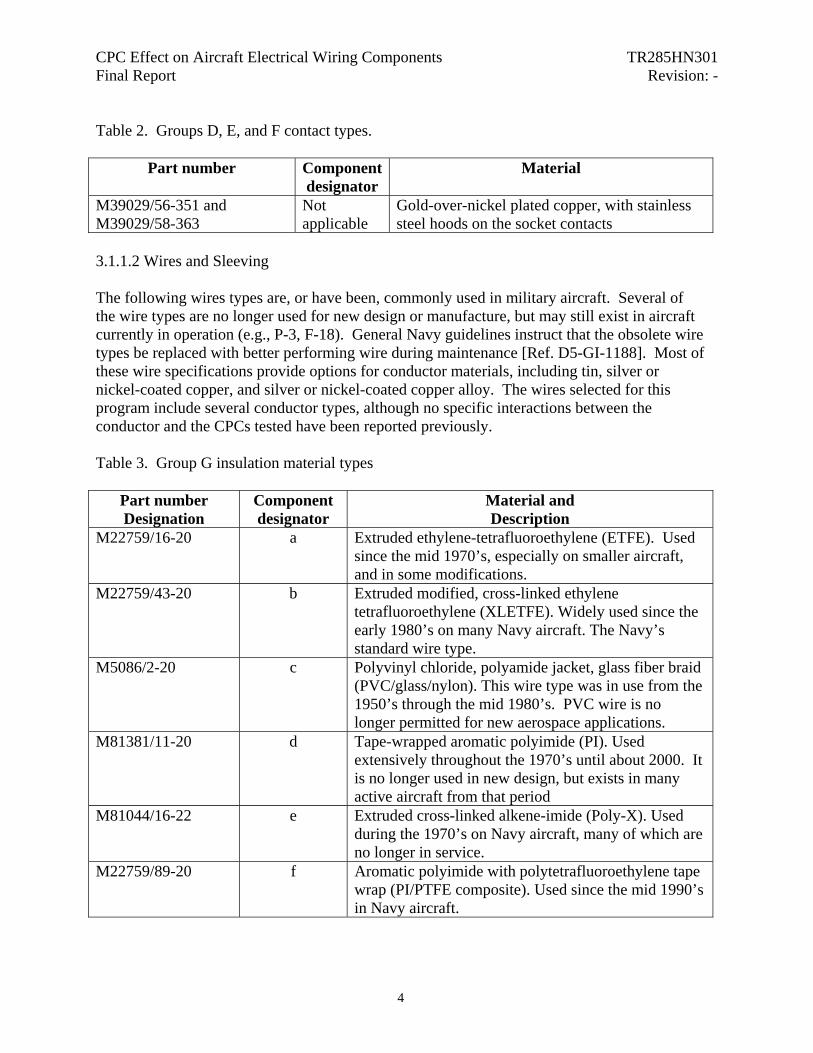
Table 2. Groups D, E, and F contact types.
Part number Component designator
Material
M39029/56-351 and M39029/58-363
Not applicable
Gold-over-nickel plated copper, with stainless steel hoods on the socket contacts
3.1.1.2 Wires and Sleeving The following wires types are, or have been, commonly used in military aircraft. Several of the wire types are no longer used for new design or manufacture, but may still exist in aircraft currently in operation (e.g., P-3, F-18). General Navy guidelines instruct that the obsolete wire types be replaced with better performing wire during maintenance [Ref. D5-GI-1188]. Most of these wire specifications provide options for conductor materials, including tin, silver or nickel-coated copper, and silver or nickel-coated copper alloy. The wires selected for this program include several conductor types, although no specific interactions between the conductor and the CPCs tested have been reported previously. Table 3. Group G insulation material types
Part number Designation
Component designator
Material and Description
M22759/16-20 a Extruded ethylene-tetrafluoroethylene (ETFE). Used since the mid 1970’s, especially on smaller aircraft, and in some modifications.
M22759/43-20 b Extruded modified, cross-linked ethylene tetrafluoroethylene (XLETFE). Widely used since the early 1980’s on many Navy aircraft. The Navy’s standard wire type.
M5086/2-20 c Polyvinyl chloride, polyamide jacket, glass fiber braid (PVC/glass/nylon). This wire type was in use from the 1950’s through the mid 1980’s. PVC wire is no longer permitted for new aerospace applications.
M81381/11-20 d Tape-wrapped aromatic polyimide (PI). Used extensively throughout the 1970’s until about 2000. It is no longer used in new design, but exists in many active aircraft from that period
M81044/16-22 e Extruded cross-linked alkene-imide (Poly-X). Used during the 1970’s on Navy aircraft, many of which are no longer in service.
M22759/89-20 f Aromatic polyimide with polytetrafluoroethylene tape wrap (PI/PTFE composite). Used since the mid 1990’s in Navy aircraft.
4
CPC Effect on Aircraft Electrical Wiring Components TR285HN301 Final Report Revision: -
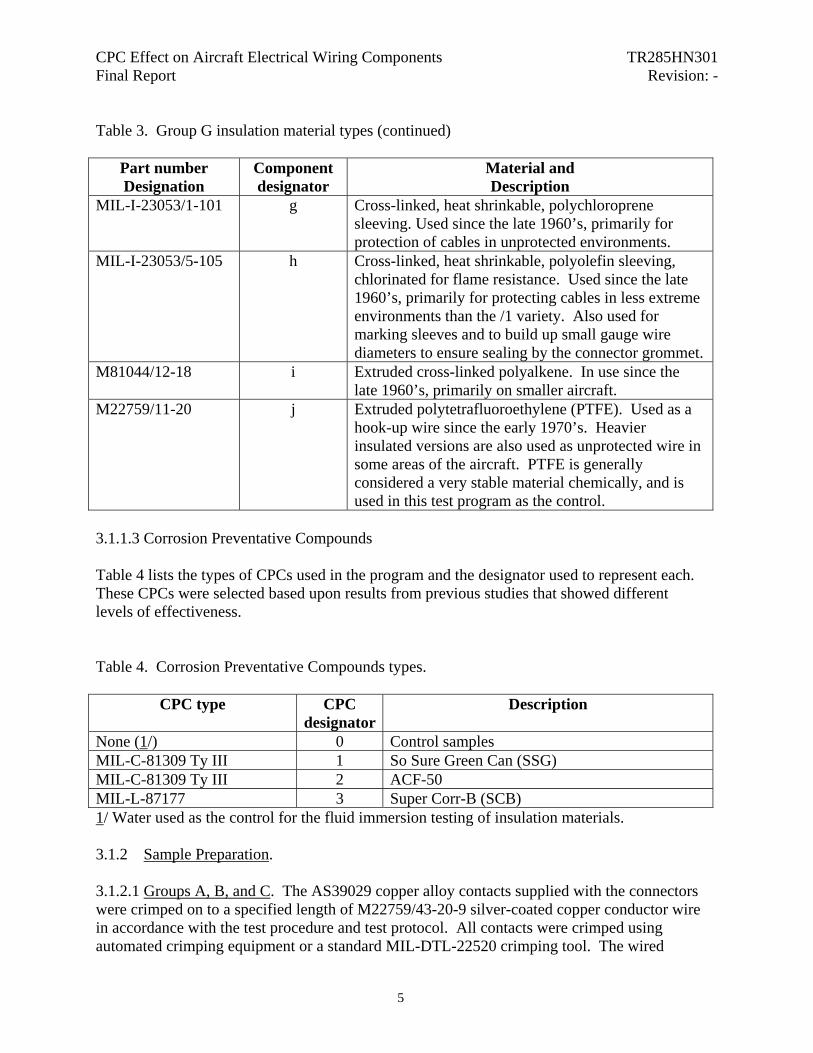
Table 3. Group G insulation material types (continued)
Part number Designation
Component designator
Material and Description
MIL-I-23053/1-101 g Cross-linked, heat shrinkable, polychloroprene sleeving. Used since the late 1960’s, primarily for protection of cables in unprotected environments.
MIL-I-23053/5-105 h Cross-linked, heat shrinkable, polyolefin sleeving, chlorinated for flame resistance. Used since the late 1960’s, primarily for protecting cables in less extreme environments than the /1 variety. Also used for marking sleeves and to build up small gauge wire diameters to ensure sealing by the connector grommet.
M81044/12-18 i Extruded cross-linked polyalkene. In use since the late 1960’s, primarily on smaller aircraft.
M22759/11-20 j Extruded polytetrafluoroethylene (PTFE). Used as a hook-up wire since the early 1970’s. Heavier insulated versions are also used as unprotected wire in some areas of the aircraft. PTFE is generally considered a very stable material chemically, and is used in this test program as the control.
3.1.1.3 Corrosion Preventative Compounds Table 4 lists the types of CPCs used in the program and the designator used to represent each. These CPCs were selected based upon results from previous studies that showed different levels of effectiveness. Table 4. Corrosion Preventative Compounds types.
CPC type CPC designator
Description
None (1/) 0 Control samples MIL-C-81309 Ty III 1 So Sure Green Can (SSG) MIL-C-81309 Ty III 2 ACF-50 MIL-L-87177 3 Super Corr-B (SCB) 1/ Water used as the control for the fluid immersion testing of insulation materials. 3.1.2 Sample Preparation. 3.1.2.1 Groups A, B, and C. The AS39029 copper alloy contacts supplied with the connectors were crimped on to a specified length of M22759/43-20-9 silver-coated copper conductor wire in accordance with the test procedure and test protocol. All contacts were crimped using automated crimping equipment or a standard MIL-DTL-22520 crimping tool. The wired
5
CPC Effect on Aircraft Electrical Wiring Components TR285HN301 Final Report Revision: -
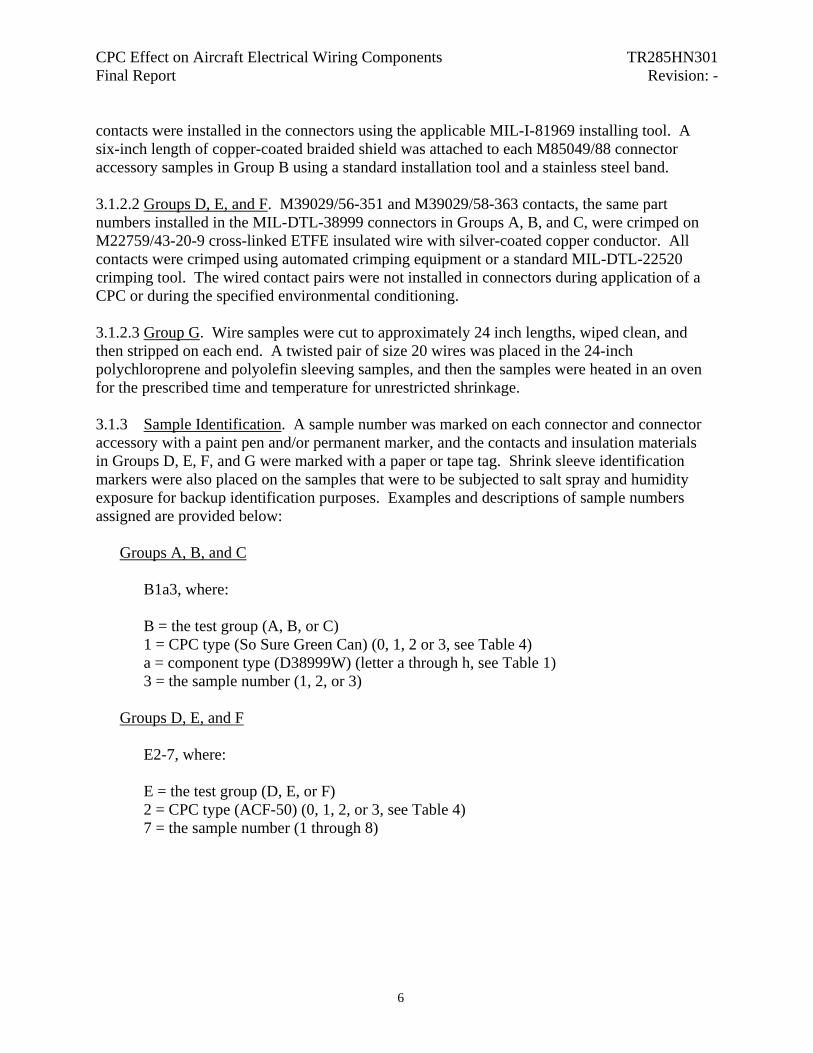
contacts were installed in the connectors using the applicable MIL-I-81969 installing tool. A six-inch length of copper-coated braided shield was attached to each M85049/88 connector accessory samples in Group B using a standard installation tool and a stainless steel band. 3.1.2.2 Groups D, E, and F. M39029/56-351 and M39029/58-363 contacts, the same part numbers installed in the MIL-DTL-38999 connectors in Groups A, B, and C, were crimped on M22759/43-20-9 cross-linked ETFE insulated wire with silver-coated copper conductor. All contacts were crimped using automated crimping equipment or a standard MIL-DTL-22520 crimping tool. The wired contact pairs were not installed in connectors during application of a CPC or during the specified environmental conditioning. 3.1.2.3 Group G. Wire samples were cut to approximately 24 inch lengths, wiped clean, and then stripped on each end. A twisted pair of size 20 wires was placed in the 24-inch polychloroprene and polyolefin sleeving samples, and then the samples were heated in an oven for the prescribed time and temperature for unrestricted shrinkage. 3.1.3 Sample Identification. A sample number was marked on each connector and connector accessory with a paint pen and/or permanent marker, and the contacts and insulation materials in Groups D, E, F, and G were marked with a paper or tape tag. Shrink sleeve identification markers were also placed on the samples that were to be subjected to salt spray and humidity exposure for backup identification purposes. Examples and descriptions of sample numbers assigned are provided below:
Groups A, B, and C B1a3, where: B = the test group (A, B, or C) 1 = CPC type (So Sure Green Can) (0, 1, 2 or 3, see Table 4) a = component type (D38999W) (letter a through h, see Table 1) 3 = the sample number (1, 2, or 3)
Groups D, E, and F
E2-7, where: E = the test group (D, E, or F) 2 = CPC type (ACF-50) (0, 1, 2, or 3, see Table 4) 7 = the sample number (1 through 8)
6

CPC Effect on Aircraft Electrical Wiring Components TR285HN301 Final Report Revision: -
Group G
G0j2, where: G = the test group 0 = CPC type (no CPC) (0, 1, 2, or 3, see Table 4) j = insulation type (PTFE) (letter a through j, see Table 3) 2 = the sample number (1, 2, or 3)
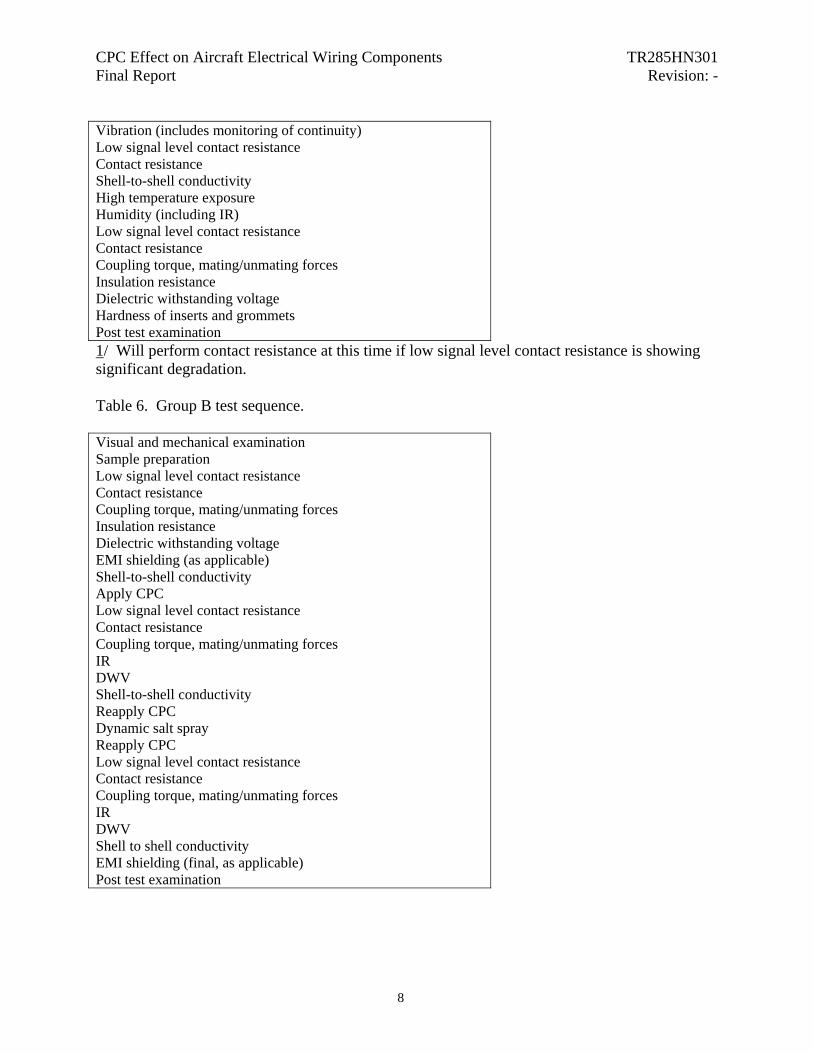
3.2 Test Plan Test groups were developed to subject the wiring components to environments considered to be reflective of actual service. When possible, standard test sequences and environments were used that had been previously established. Test Groups 2, 4 and 11 from Table VII in MIL-DTL-38999K were used as a baseline to develop Groups A, B, and C in the test program, (Tables 5, 6, and 7). Group D in the test plan (Table 8) was designed to simulate long-term storage conditions, such as in an aircraft hangar. Groups IV and III from Table XII in AS39029 were used for test plan Groups E and F, respectively (Tables 9 and 10). The AS22759 fluid immersion test was used as a baseline for the Group G test sequence (Table 11). Exceptions to the test plan were documented on the test protocol when a specific test did not apply to a particular component type, or was not within the scope of the test program. In each of the Groups A, B, C, and G, a total of twelve samples per component type were tested, with three samples being conditioned in one of the four CPC types. Table 5. Group A test sequence. Visual and mechanical examination Sample preparation Hardness of inserts and grommets Low signal level contact resistance (LSLCR) Contact resistance (CR) Coupling torque, mating/unmating forces Insulation resistance (IR) Dielectric withstanding voltage (DWV) Shell-to-shell conductivity Apply CPC Maintenance aging Low signal level contact resistance Contact resistance Insulation resistance Dielectric withstanding voltage Temperature cycling Low signal level contact resistance 1/ Coupling torque, mating/unmating forces Insulation resistance Dielectric withstanding voltage Reapply CPC
7
CPC Effect on Aircraft Electrical Wiring Components TR285HN301 Final Report Revision: -
Vibration (includes monitoring of continuity) Low signal level contact resistance Contact resistance Shell-to-shell conductivity High temperature exposure Humidity (including IR) Low signal level contact resistance Contact resistance Coupling torque, mating/unmating forces Insulation resistance Dielectric withstanding voltage Hardness of inserts and grommets Post test examination 1/ Will perform contact resistance at this time if low signal level contact resistance is showing significant degradation. Table 6. Group B test sequence. Visual and mechanical examination Sample preparation Low signal level contact resistance Contact resistance Coupling torque, mating/unmating forces Insulation resistance Dielectric withstanding voltage EMI shielding (as applicable) Shell-to-shell conductivity Apply CPC Low signal level contact resistance Contact resistance Coupling torque, mating/unmating forces IR DWV Shell-to-shell conductivity Reapply CPC Dynamic salt spray Reapply CPC Low signal level contact resistance Contact resistance Coupling torque, mating/unmating forces IR DWV Shell to shell conductivity EMI shielding (final, as applicable) Post test examination
8
CPC Effect on Aircraft Electrical Wiring Components TR285HN301 Final Report Revision: -
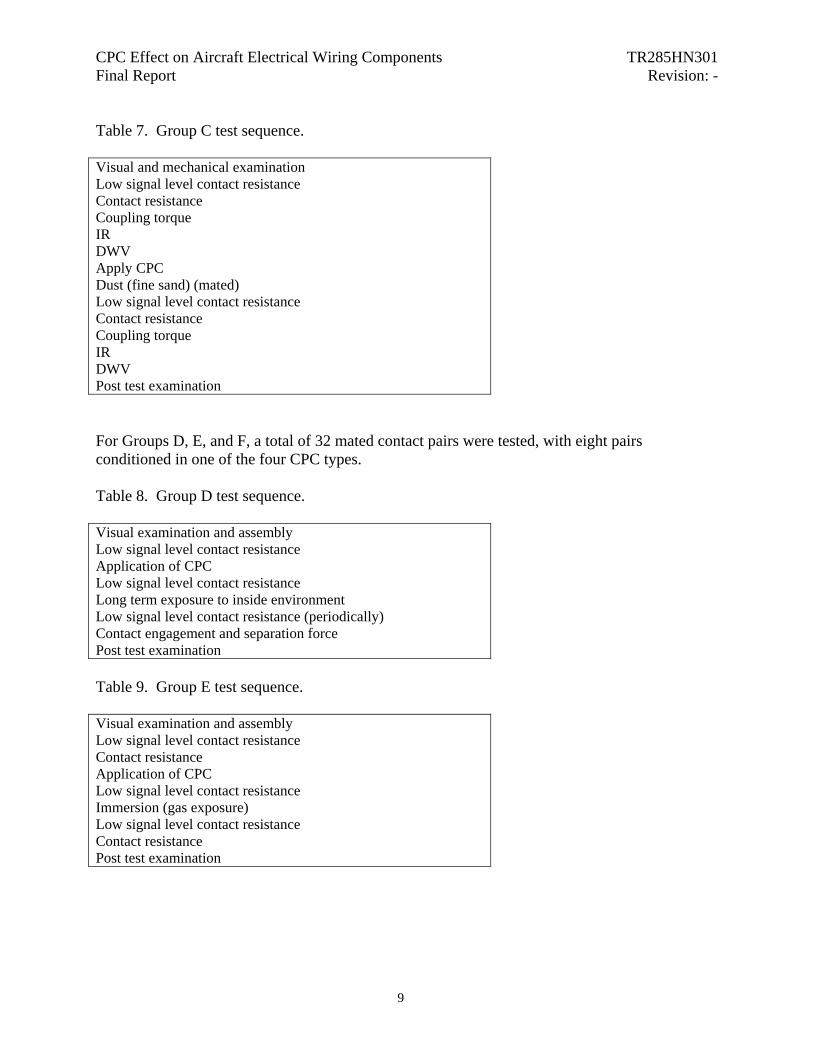
Table 7. Group C test sequence. Visual and mechanical examination Low signal level contact resistance Contact resistance Coupling torque IR DWV Apply CPC Dust (fine sand) (mated) Low signal level contact resistance Contact resistance Coupling torque IR DWV Post test examination For Groups D, E, and F, a total of 32 mated contact pairs were tested, with eight pairs conditioned in one of the four CPC types. Table 8. Group D test sequence. Visual examination and assembly Low signal level contact resistance Application of CPC Low signal level contact resistance Long term exposure to inside environment Low signal level contact resistance (periodically) Contact engagement and separation force Post test examination Table 9. Group E test sequence. Visual examination and assembly Low signal level contact resistance Contact resistance Application of CPC Low signal level contact resistance Immersion (gas exposure) Low signal level contact resistance Contact resistance Post test examination
9
CPC Effect on Aircraft Electrical Wiring Components TR285HN301 Final Report Revision: -
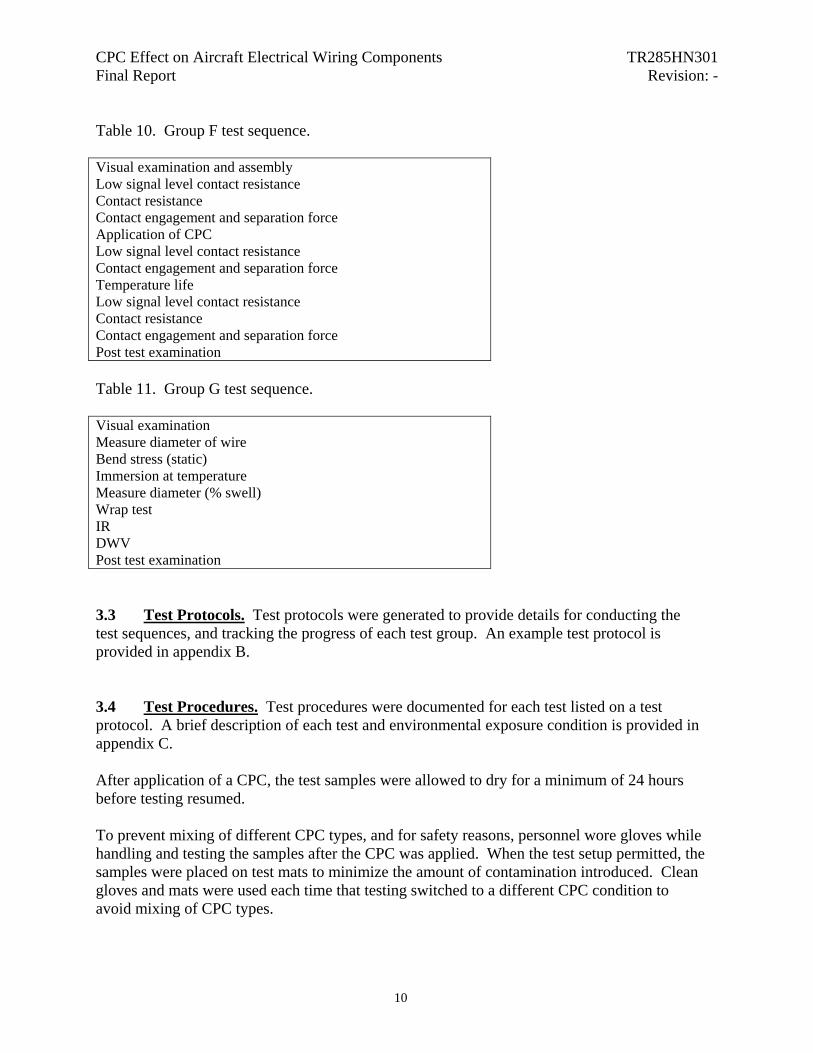
Table 10. Group F test sequence. Visual examination and assembly Low signal level contact resistance Contact resistance Contact engagement and separation force Application of CPC Low signal level contact resistance Contact engagement and separation force Temperature life Low signal level contact resistance Contact resistance Contact engagement and separation force Post test examination Table 11. Group G test sequence. Visual examination Measure diameter of wire Bend stress (static) Immersion at temperature Measure diameter (% swell) Wrap test IR DWV Post test examination 3.3 Test Protocols. Test protocols were generated to provide details for conducting the test sequences, and tracking the progress of each test group. An example test protocol is provided in appendix B. 3.4 Test Procedures. Test procedures were documented for each test listed on a test protocol. A brief description of each test and environmental exposure condition is provided in appendix C. After application of a CPC, the test samples were allowed to dry for a minimum of 24 hours before testing resumed. To prevent mixing of different CPC types, and for safety reasons, personnel wore gloves while handling and testing the samples after the CPC was applied. When the test setup permitted, the samples were placed on test mats to minimize the amount of contamination introduced. Clean gloves and mats were used each time that testing switched to a different CPC condition to avoid mixing of CPC types.
10
CPC Effect on Aircraft Electrical Wiring Components TR285HN301 Final Report Revision: -
4.0 Test Results and Analysis (comparison of CPCs, environments, component types)
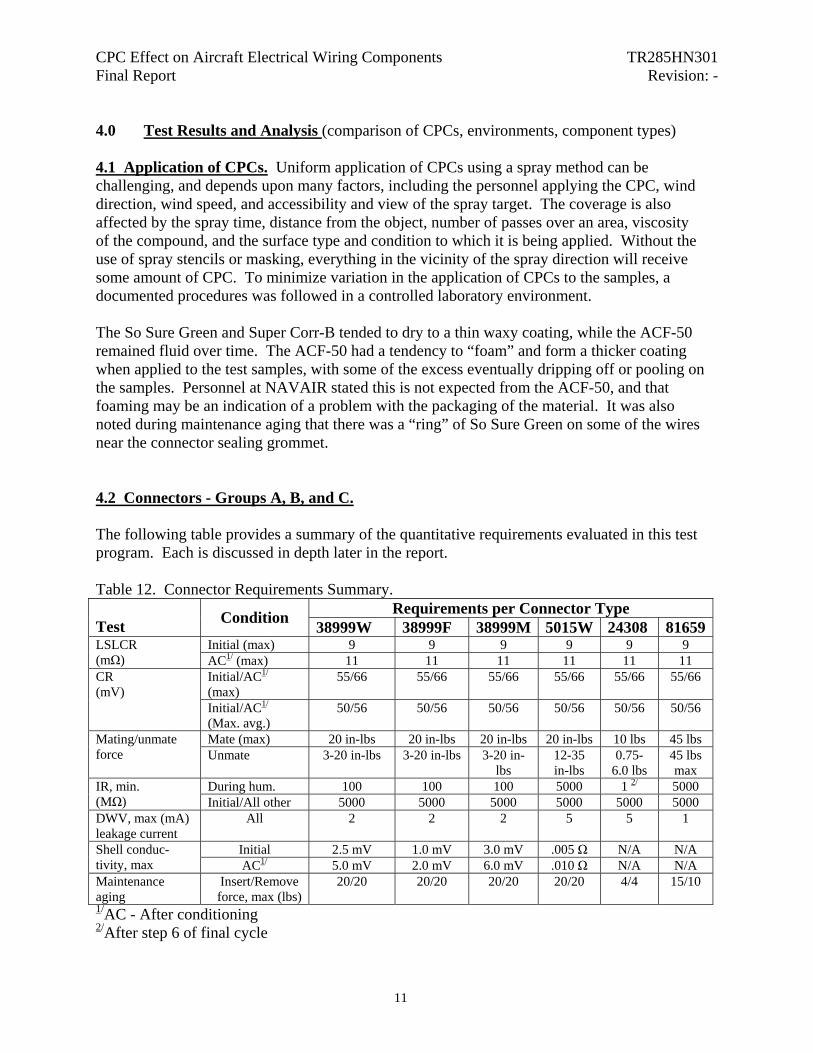
4.1 Application of CPCs. Uniform application of CPCs using a spray method can be challenging, and depends upon many factors, including the personnel applying the CPC, wind direction, wind speed, and accessibility and view of the spray target. The coverage is also affected by the spray time, distance from the object, number of passes over an area, viscosity of the compound, and the surface type and condition to which it is being applied. Without the use of spray stencils or masking, everything in the vicinity of the spray direction will receive some amount of CPC. To minimize variation in the application of CPCs to the samples, a documented procedures was followed in a controlled laboratory environment. The So Sure Green and Super Corr-B tended to dry to a thin waxy coating, while the ACF-50 remained fluid over time. The ACF-50 had a tendency to “foam” and form a thicker coating when applied to the test samples, with some of the excess eventually dripping off or pooling on the samples. Personnel at NAVAIR stated this is not expected from the ACF-50, and that foaming may be an indication of a problem with the packaging of the material. It was also noted during maintenance aging that there was a “ring” of So Sure Green on some of the wires near the connector sealing grommet. 4.2 Connectors - Groups A, B, and C. The following table provides a summary of the quantitative requirements evaluated in this test program. Each is discussed in depth later in the report. Table 12. Connector Requirements Summary.
Requirements per Connector Type Test Condition 38999W 38999F 38999M 5015W 24308 81659
Initial (max) 9 9 9 9 9 9 LSLCR (mΩ) AC1/ (max) 11 11 11 11 11 11
Initial/AC1/
(max) 55/66 55/66 55/66 55/66 55/66 55/66 CR
(mV) Initial/AC1/
(Max. avg.) 50/56 50/56 50/56 50/56 50/56 50/56
Mate (max) 20 in-lbs 20 in-lbs 20 in-lbs 20 in-lbs 10 lbs 45 lbs Mating/unmate force Unmate 3-20 in-lbs 3-20 in-lbs 3-20 in-
lbs 12-35 in-lbs
0.75-6.0 lbs
45 lbs max
During hum. 100 100 100 5000 1 2/ 5000 IR, min. (MΩ) Initial/All other 5000 5000 5000 5000 5000 5000 DWV, max (mA) leakage current
All 2 2 2 5 5 1
Initial 2.5 mV 1.0 mV 3.0 mV .005 Ω N/A N/A Shell conduc-tivity, max AC1/ 5.0 mV 2.0 mV 6.0 mV .010 Ω N/A N/A Maintenance aging
Insert/Remove force, max (lbs)
20/20 20/20 20/20 20/20
4/4 15/10
1/AC - After conditioning 2/After step 6 of final cycle
11

CPC Effect on Aircraft Electrical Wiring Components TR285HN301 Final Report Revision: -
4.2.1 Test results. A good understanding of the baseline performance of the various connectors is extremely important, especially when there are small differences in test results among the samples from different CPC conditions. Baseline tests performed in Phase IIa included the following:
• grommet hardness • low signal level contact resistance • contact resistance • coupling/uncoupling torque or mating/unmating forces • insulation resistance • dielectric withstanding voltage • shell-to-shell conductivity
As expected, since CPCs had not yet been applied, most of the data was consistent from sample to sample for a specific connector type. The test samples met most of the specification requirements before conditioning, and the exceptions are documented in the following paragraphs. The results from each test group are also provided for each test performed; however, not all connector types were tested in each group. For example, only the circular connectors were subjected to the Group C test sequence since the rectangular connectors are not intended to be used in applications where severe dust exposure would be expected. Although there are many ways the data could be analyzed, the intent was to look at general trends for each CPC and connector type. 4.2.1.1 Grommet hardness. Prior to the wired contacts being installed in the connectors, the Shore A hardness of the wire sealing grommets was measured. The connector grommets are not the typical configuration of a material that is subjected to a Shore hardness test since the grommets have contact cavities rather than being solid material. More deflection of the material will occur the nearer the test probe is to a cavity. In addition, the grommet of the M38999 Class M connectors did not extend much beyond the connector shell, so the foot of the hardness tester may have come in contact with the shell prior to the grommet being fully compressed, affecting the result. There is no hardness requirement specified for the connector grommets, so the intent was to compare the baseline and final results to determine whether the properties of the material changes when treated with a CPC. The hardness of the interfacial grommets could not be measured because the test probe could not reach the recessed surface inside the shell. The interfacial grommets may also be too thin to provide accurate measurements. However, the same material is used as for the wire sealing grommet, so similar results would be expected. Based upon the degradation noted during final inspection of the interfacial grommets after removal of the contacts, a significant change in the hardness of the wire sealing grommets was
12
CPC Effect on Aircraft Electrical Wiring Components TR285HN301 Final Report Revision: -
anticipated. However, Figures A0-1 and A0-2 show that the final hardness readings on the control and CPC samples were similar. The exception was on the ACF-50 samples of the M38999 class M connectors, where the hardness was 15% higher than on the control sample, but as previously mentioned, the grommet did not extend much past the shell on those samples. 4.2.1.2 LSLCR. The baseline LSLCR values on the mated pairs of connectors were well below the maximum requirement of 9 milliohms for samples prior to environmental conditioning, with the majority measuring in the 3.5-5.0 milliohm range. After conditioning (environmental exposure), the requirement increases to 11 milliohms maximum. 4.2.1.2.1 Group A. The LSLCR values on the control samples were not affected by any of the environmental tests, but following high temperature and humidity exposure, each connector type except M5015 exhibited an increase in LSLCR of greater than 100% for one or more of the CPC types. The average LSLCR of the M38999 Class W and M81659 samples sprayed with ACF-50 exceeded the requirement of 11 milliohms maximum (see Figures A1 and A2.). 4.2.1.2.2 Group B and C. Neither the application of a CPC nor exposure to a salt spray or dust test affected the LSLCR values. The measurements during baseline testing and after conditioning were well below the specification requirement for all the control and CPC samples. 4.2.1.3 Contact resistance. None of the baseline measurements exceeded the initial maximum or maximum average requirements of 55 and 50 millivolts, respectively. Measured values were in the 30-40 millivolt range. 4.2.1.3.1 Group A. Neither maintenance aging nor vibration affected the contact resistance of the samples. However, the CPC samples showed an increase in resistance following high temperature and humidity exposure, whereas the control samples did not. Samples from each CPC type exceeded the maximum average requirement in one or more connector types, with the increase in resistance being as high as 50% (see Figure A3 and A4). 4.2.1.3.2 Group B and C. After conditioning, the contact resistance of all samples was consistent, regardless of CPC type, and was below the maximum average requirement of 56 milliohms. Measured values were in the 30-40 millivolt range. 4.2.1.4 Coupling/uncoupling forces (circular connectors). All of the MIL-DTL-38999 connectors met the specified coupling and uncoupling force requirements during baseline testing. The MIL-DTL-5015 connectors met the initial coupling force requirements, but all samples measured below the specified uncoupling force range (see Table 13.)
13

CPC Effect on Aircraft Electrical Wiring Components TR285HN301 Final Report Revision: -
Table 13. Baseline Connector Coupling and Uncoupling Forces.
Coupling (in-lbs) Uncoupling (in-lbs) Connector Required (max) Measured Required Measured M38999 Cl. W 20 3.6-6.6 3-20 3.7-8.2 M38999 Cl. F 20 3.5-6.0 3-20 3.5-5.4 M38999 Cl. M 20 4.9-8.9 3-20 4.0-8.2 MIL-DTL-5015 20 3.7-8.2 12-35 2.5-10.8 MIL-DTL-5015 Retest
20 10.8-13.1 12-35 5.3-9.7
4.2.1.4.1 Group A. Following temperature cycling, the coupling and uncoupling force measurements were similar to the baseline results; however, after the CPC samples were exposed to 1000 hours of high temperature exposure, increases in force were observed. Since the circular connectors were subject to the high temperature and humidity tests in the mated condition, the uncoupling test was performed first. The M38999 Class W and M5015 (cadmium over nickel plated aluminum shell) connectors with a CPC applied exhibited a significant increase in uncoupling force. For those connector types, sixteen out of eighteen CPC samples exceeded the maximum requirement, whereas only one of the six control samples did (see Figures A5 and A6). The uncoupling force of all the M5015 connectors was approximately 50% below the minimum requirement prior to high temperature exposure. All of the M38999 Class M (nickel plated composite shell) connectors still met the requirement, but an increase in force was noted on the CPC samples. The increase in uncoupling force on the CPC samples may be attributed to the CPC forming a crystalline structure that bonded the plug and receptacle connectors. The coupling force results following high temperature and humidity conditioning were also higher than the baseline results, but all samples met the specification requirements. Higher values could affect maintenance and repair operations. 4.2.1.4.2 Group B. Since the connector pairs were unmated for the final 48 hours of the salt spray test, the coupling force test was performed first after the samples were cleaned and dried. Except for the M38999 class F connectors, the coupling force of the circular connectors increased for the control samples, but did not change significantly for the CPC samples. The uncoupling force was also higher on the control samples than on the CPC samples, with the only exception being a M5015 sample treated with Super Corr-B. All samples were lower than the maximum requirement, however, all except two of the M5015 connector samples still measured below the minimum requirement. An uncoupling force that is lower than the minimum specified requirement may result in unintentional unmating of the connectors, and loss of electrical signal. 4.2.1.4.3 Group C. The connector samples were to be fully mated when subjected to the dust exposure. However, when the laboratory that performed the test returned the samples, nine of
14
CPC Effect on Aircraft Electrical Wiring Components TR285HN301 Final Report Revision: -
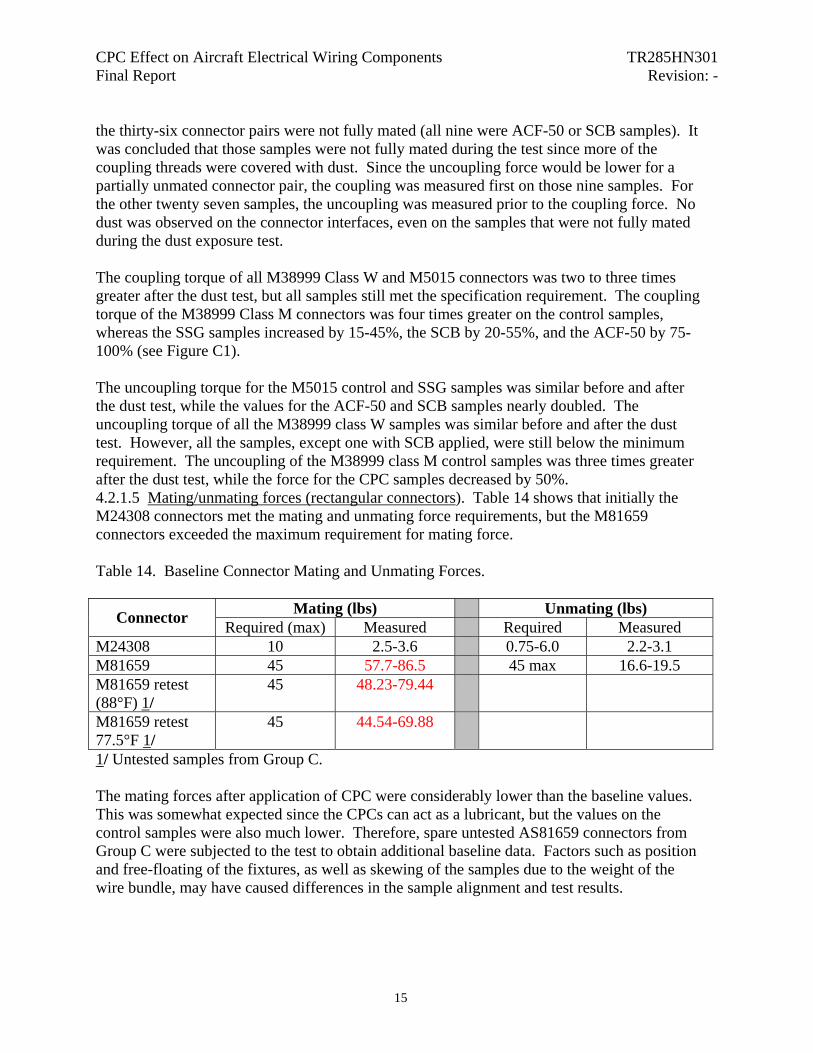
the thirty-six connector pairs were not fully mated (all nine were ACF-50 or SCB samples). It was concluded that those samples were not fully mated during the test since more of the coupling threads were covered with dust. Since the uncoupling force would be lower for a partially unmated connector pair, the coupling was measured first on those nine samples. For the other twenty seven samples, the uncoupling was measured prior to the coupling force. No dust was observed on the connector interfaces, even on the samples that were not fully mated during the dust exposure test. The coupling torque of all M38999 Class W and M5015 connectors was two to three times greater after the dust test, but all samples still met the specification requirement. The coupling torque of the M38999 Class M connectors was four times greater on the control samples, whereas the SSG samples increased by 15-45%, the SCB by 20-55%, and the ACF-50 by 75-100% (see Figure C1). The uncoupling torque for the M5015 control and SSG samples was similar before and after the dust test, while the values for the ACF-50 and SCB samples nearly doubled. The uncoupling torque of all the M38999 class W samples was similar before and after the dust test. However, all the samples, except one with SCB applied, were still below the minimum requirement. The uncoupling of the M38999 class M control samples was three times greater after the dust test, while the force for the CPC samples decreased by 50%. 4.2.1.5 Mating/unmating forces (rectangular connectors). Table 14 shows that initially the M24308 connectors met the mating and unmating force requirements, but the M81659 connectors exceeded the maximum requirement for mating force. Table 14. Baseline Connector Mating and Unmating Forces.
Mating (lbs) Unmating (lbs) Connector Required (max) Measured Required Measured M24308 10 2.5-3.6 0.75-6.0 2.2-3.1 M81659 45 57.7-86.5 45 max 16.6-19.5 M81659 retest (88°F) 1/
45 48.23-79.44
M81659 retest 77.5°F 1/
45 44.54-69.88
1/ Untested samples from Group C. The mating forces after application of CPC were considerably lower than the baseline values. This was somewhat expected since the CPCs can act as a lubricant, but the values on the control samples were also much lower. Therefore, spare untested AS81659 connectors from Group C were subjected to the test to obtain additional baseline data. Factors such as position and free-floating of the fixtures, as well as skewing of the samples due to the weight of the wire bundle, may have caused differences in the sample alignment and test results.
15

CPC Effect on Aircraft Electrical Wiring Components TR285HN301 Final Report Revision: -
4.2.1.5.1 Group A. The control and SSG samples of both rectangular connector types exhibited an increase in unmating force after exposure to extended high temperature and humidity, but only the SSG samples exceeded the maximum requirement. The mating force increased on the M24308 control samples after temperature cycling, and on the control and SSG samples after high temperature and humidity. In contrast, the AS81659 connectors failed the mating force initially and after temperature cycling, but the ACF-50, SCB, and two control samples met the requirement after high temperature and humidity. The lower values after environmental exposure could be attributed to permanent deformation (compression) of the interfacial grommet sealing towers, from being mated at elevated temperature. The M24308 connectors do not have an interfacial grommet. 4.2.1.5.2 Group B. When compared to the baseline results, the M24308 connector samples with SSG or SCB applied exhibited a one to two pound increase in the unmating force after both durability and salt spray. The control and ACF-50 samples typically increased less than one pound. All results were within the specification requirements. The presence of ACF-50 or SCB did not affect the AS81659 connectors samples, but the SSG samples exhibited a 35% increase after salt spray. The unmating force of the control samples decreased approximately 35% after salt spray exposure. There was not much difference in the mating force when comparing the control and CPC samples after salt spray exposure and durability, but the results on the M81659 connector samples after salt spray were ten to twenty pound higher than the results after durability. The M24308 connectors with SSG exhibited a one to two pound increase in mating force after both salt spray and durability, but all samples were 50-75% below the maximum requirement. All M81659 samples exceeded the maximum mating force requirement after durability and salt spray, but the baseline measurements had also exceeded the requirement. Group C. Not applicable. Rectangular connectors were not included in this group. 4.2.1.6 IR. All of the samples exceeded the minimum insulation resistance requirement of 5000 megohms during baseline testing, with the majority of the results exceeded the requirement by three or more orders of magnitude. It needs to be understood that IR measurements can vary by more than an order of magnitude due to environmental and testing conditions. Therefore, the results were analyzed as log values. 4.2.1.6.1 Group A. Contact-to-contact. Following maintenance aging, the SSG and ACF-50 samples exhibited an insulation resistance of one to two orders of magnitude lower than the control and SCB samples (see figure A7). However, after the completion of the humidity test, the insulation resistance of all samples was more consistent, with the variation being within one order of magnitude. All samples continued to meet the specification requirement after the environmental exposures. Contact-to-shell. The samples with either SSG or ACF-50 applied exhibited an insulation resistance that was one to two orders of magnitude lower than the control samples after
16
CPC Effect on Aircraft Electrical Wiring Components TR285HN301 Final Report Revision: -
maintenance aging and temperature cycling (see figure A8). The ACF-50 samples typically exhibited the lowest readings. The M24308 samples with SCB applied were one order of magnitude lower than the control samples after the same tests. The M38999 Class M samples with SCB were one order of magnitude lower than the control samples after temperature cycling, but the remainder of the SCB samples exhibited insulation resistance properties similar to the control samples. After exposure to high temperature and humidity, the difference among the control and CPC samples was less than one order of magnitude. After each environmental conditioning test, all samples exceeded the minimum requirement by more than two orders of magnitude. During humidity. The requirement for insulation resistance during humidity exposure is reduced from the original value for the M38999 and M24308 connector types, but not for the AS81659 and MIL-C-5015 connectors. The contact-to-contact results indicated that the SSG did not affect the insulation resistance during humidity, whereas the ACF-50 and SCB affected the M5015 and M38999 Class M samples, but not the other connector types (see figure A9). The M5015 samples treated with SCB and the M38999 Class M samples with ACF-50 or SCB showed a decrease in the contact-to-contact insulation resistance of one to two orders of magnitude compared to the control and SSG samples. These samples still exceeded the minimum insulation resistance requirement. Conversely, the insulation resistance of the M5015 samples with ACF-50 applied failed to meet the minimum requirement. There was no significant difference in the contact-to-shell test results for any of the connector or CPC types. 4.2.1.6.2 Group B. Contact-to-contact. The change in the insulation resistance following salt spray varied depending upon the connector type, CPC type, and connector half. All of the M81659 connector samples, and the socket halves of the M24308 and M38999 Class W connectors, exhibited a change of less than one order of magnitude. The following samples all exhibited a decrease of two or more orders of magnitude:
• SSG: M5015 pin and M38999 Class M pin connectors • ACF-50: M24308 pin, M38999 Class F socket, M5015 socket, M38999 Class M pin
and socket connectors • Control and SCB: M5015 sockets connectors
The M38999 Class F pin connectors exhibited a decrease of three to four orders of magnitude, but this was true for the control as well as the CPC samples (see Figure B1). Only the control samples of the M5015 pin connectors failed to meet the specification requirement following salt spray exposure. Due to the M5015 inserts being recessed deeper into the shell, it is possible that not all carbon tracking, salt deposits, or metal dust were removed during cleaning, creating a conductive path between test points. The ACF-50 on M38999 Class F socket and M24308 pin samples caused a decrease in insulation resistance of more than one order of magnitude compared to the control and other CPC samples (see figure B2).
17

CPC Effect on Aircraft Electrical Wiring Components TR285HN301 Final Report Revision: -
Contact-to-shell. As with contact-to-contact testing, variation was noted in the results of some connector types. The M24308 and M81659 socket samples, and all M38999 Class W samples exhibited a change of one order of magnitude or less for all CPC types. The following exhibited a decrease of two or more orders of magnitude:
• SSG: M5015 and M38999 Class M connectors • ACF-50: M5015, M38999 Class F and Class M connectors • SCB: M38999 Class F connectors
The ACF-50 caused the insulation resistance of the M38999 Class W and Class F samples to decrease by one order of magnitude more than the control and other CPC samples. Only the M5015 pin control samples failed to meet the specification requirement. 4.2.1.6.3 Group C. The samples that were subjected to the dust test showed similar trends to the samples exposed to the salt spray test. The insulation resistance was lower by one to two orders of magnitude compared to the baseline values, and the ACF-50 samples exhibited the lowest readings. 4.2.1.7 DWV. The equipment used for this test was set to trip if the leakage current exceeded 10 mA, and a digital multimeter was used to measure the actual leakage current. Although the requirement in each of the connector specifications is more stringent than the trip limit selected, this level allowed for measurements on connectors that started to exhibit some degradation, but were not catastrophic failures. One pair of contacts in four different M24308 connector samples from Group A, and one pair in one sample from Group B exceeded the maximum leakage current. The failures were always between the same two cavities, indicating a possible defect in the connector insert. For the M38999 connectors, one class W and one class M sample had a contact-to-shell DWV failure. All other measured values from Groups A, B, and C baseline testing were below the specified leakage current (see Tables 15 and 16). Table 15. Baseline Contact-to-contact DWV.
Contact-to-contact DWV Connector Maximum leakage current
(mA) Measured (mA)
M38999W 2 0.002-0.024 M38999F 2 0.0072-0.0108 M38999M 2 0.0012-0.0594 MIL-DTL-5015 5 0.0027-0.027 MIL-DTL-24308 5 0.0016-0.0152 1/
AS81659 1 0.003-0.0232 1/ Five of twenty-four connector pairs had one mated pair of contacts that exceeded a leakage current of 10 mA. The failures will be excluded from the comparative evaluation, and are not included in the range listed.
18
CPC Effect on Aircraft Electrical Wiring Components TR285HN301 Final Report Revision: -
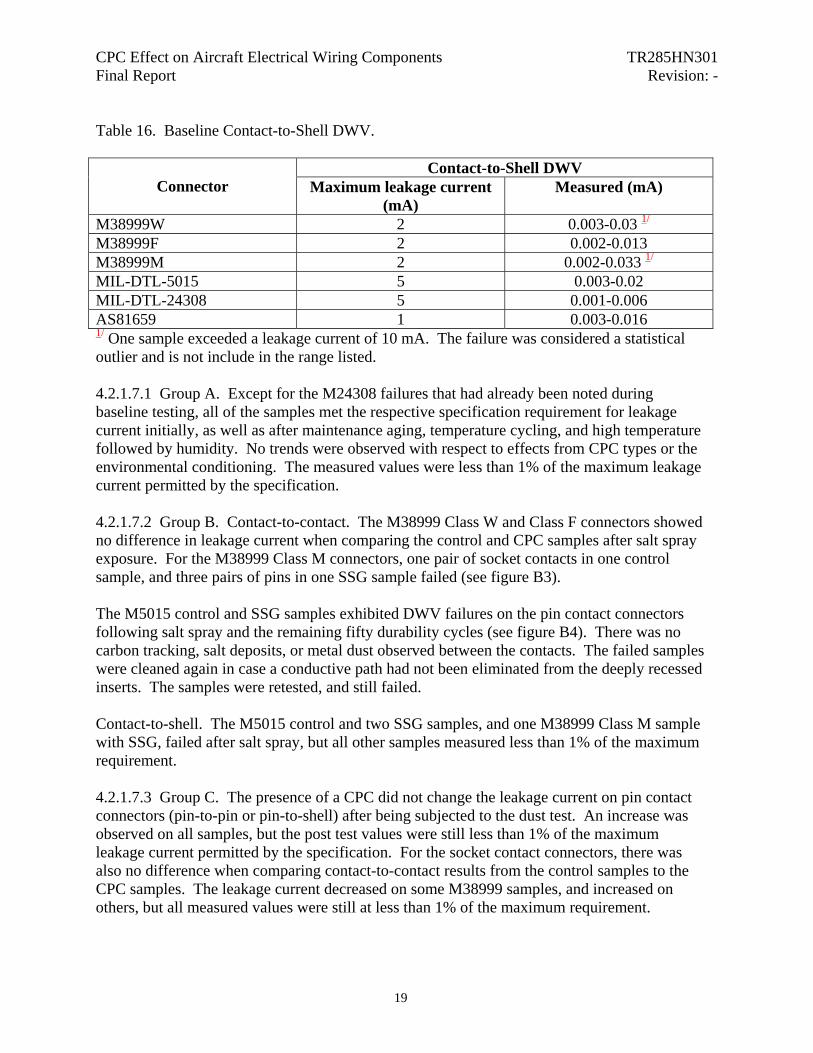
Table 16. Baseline Contact-to-Shell DWV.
Contact-to-Shell DWV Connector Maximum leakage current
(mA) Measured (mA)
M38999W 2 0.003-0.03 1/
M38999F 2 0.002-0.013 M38999M 2 0.002-0.033 1/
MIL-DTL-5015 5 0.003-0.02 MIL-DTL-24308 5 0.001-0.006 AS81659 1 0.003-0.016 1/ One sample exceeded a leakage current of 10 mA. The failure was considered a statistical outlier and is not include in the range listed. 4.2.1.7.1 Group A. Except for the M24308 failures that had already been noted during baseline testing, all of the samples met the respective specification requirement for leakage current initially, as well as after maintenance aging, temperature cycling, and high temperature followed by humidity. No trends were observed with respect to effects from CPC types or the environmental conditioning. The measured values were less than 1% of the maximum leakage current permitted by the specification. 4.2.1.7.2 Group B. Contact-to-contact. The M38999 Class W and Class F connectors showed no difference in leakage current when comparing the control and CPC samples after salt spray exposure. For the M38999 Class M connectors, one pair of socket contacts in one control sample, and three pairs of pins in one SSG sample failed (see figure B3). The M5015 control and SSG samples exhibited DWV failures on the pin contact connectors following salt spray and the remaining fifty durability cycles (see figure B4). There was no carbon tracking, salt deposits, or metal dust observed between the contacts. The failed samples were cleaned again in case a conductive path had not been eliminated from the deeply recessed inserts. The samples were retested, and still failed. Contact-to-shell. The M5015 control and two SSG samples, and one M38999 Class M sample with SSG, failed after salt spray, but all other samples measured less than 1% of the maximum requirement. 4.2.1.7.3 Group C. The presence of a CPC did not change the leakage current on pin contact connectors (pin-to-pin or pin-to-shell) after being subjected to the dust test. An increase was observed on all samples, but the post test values were still less than 1% of the maximum leakage current permitted by the specification. For the socket contact connectors, there was also no difference when comparing contact-to-contact results from the control samples to the CPC samples. The leakage current decreased on some M38999 samples, and increased on others, but all measured values were still at less than 1% of the maximum requirement.
19
CPC Effect on Aircraft Electrical Wiring Components TR285HN301 Final Report Revision: -
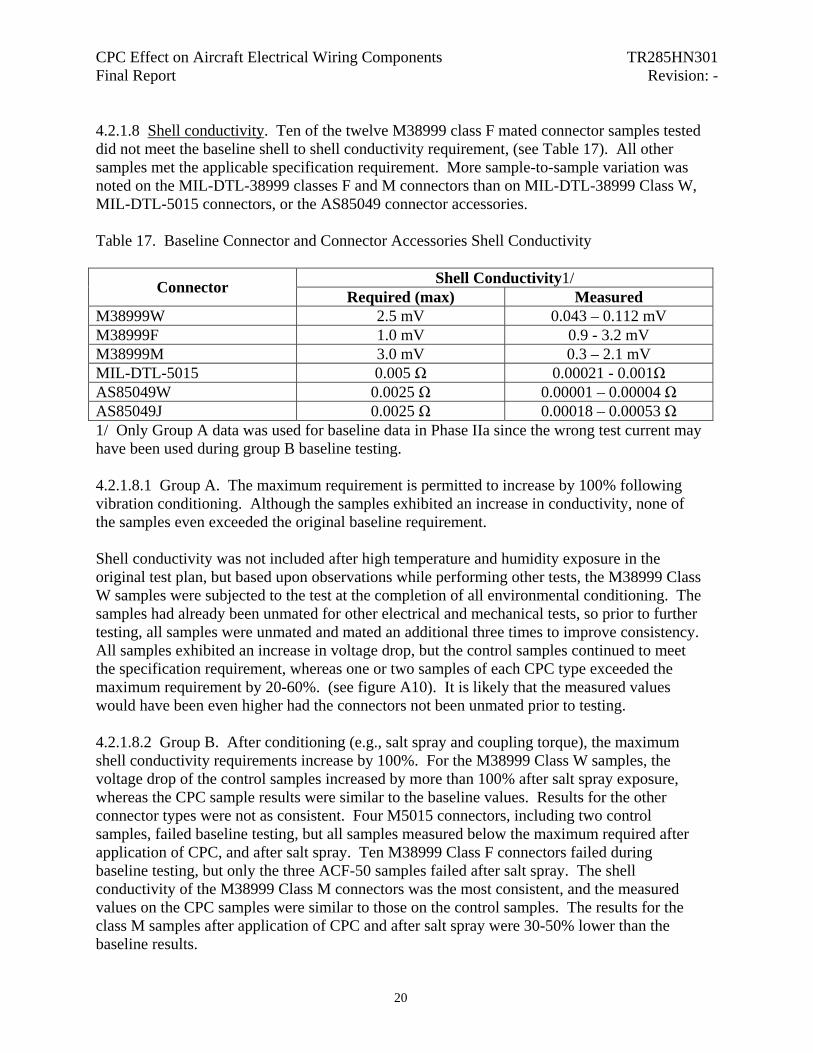
4.2.1.8 Shell conductivity. Ten of the twelve M38999 class F mated connector samples tested did not meet the baseline shell to shell conductivity requirement, (see Table 17). All other samples met the applicable specification requirement. More sample-to-sample variation was noted on the MIL-DTL-38999 classes F and M connectors than on MIL-DTL-38999 Class W, MIL-DTL-5015 connectors, or the AS85049 connector accessories. Table 17. Baseline Connector and Connector Accessories Shell Conductivity
Shell Conductivity1/ Connector Required (max) Measured M38999W 2.5 mV 0.043 – 0.112 mV M38999F 1.0 mV 0.9 - 3.2 mV M38999M 3.0 mV 0.3 – 2.1 mV MIL-DTL-5015 0.005 Ω 0.00021 - 0.001Ω AS85049W 0.0025 Ω 0.00001 – 0.00004 Ω AS85049J 0.0025 Ω 0.00018 – 0.00053 Ω 1/ Only Group A data was used for baseline data in Phase IIa since the wrong test current may have been used during group B baseline testing. 4.2.1.8.1 Group A. The maximum requirement is permitted to increase by 100% following vibration conditioning. Although the samples exhibited an increase in conductivity, none of the samples even exceeded the original baseline requirement. Shell conductivity was not included after high temperature and humidity exposure in the original test plan, but based upon observations while performing other tests, the M38999 Class W samples were subjected to the test at the completion of all environmental conditioning. The samples had already been unmated for other electrical and mechanical tests, so prior to further testing, all samples were unmated and mated an additional three times to improve consistency. All samples exhibited an increase in voltage drop, but the control samples continued to meet the specification requirement, whereas one or two samples of each CPC type exceeded the maximum requirement by 20-60%. (see figure A10). It is likely that the measured values would have been even higher had the connectors not been unmated prior to testing. 4.2.1.8.2 Group B. After conditioning (e.g., salt spray and coupling torque), the maximum shell conductivity requirements increase by 100%. For the M38999 Class W samples, the voltage drop of the control samples increased by more than 100% after salt spray exposure, whereas the CPC sample results were similar to the baseline values. Results for the other connector types were not as consistent. Four M5015 connectors, including two control samples, failed baseline testing, but all samples measured below the maximum required after application of CPC, and after salt spray. Ten M38999 Class F connectors failed during baseline testing, but only the three ACF-50 samples failed after salt spray. The shell conductivity of the M38999 Class M connectors was the most consistent, and the measured values on the CPC samples were similar to those on the control samples. The results for the class M samples after application of CPC and after salt spray were 30-50% lower than the baseline results.
20
CPC Effect on Aircraft Electrical Wiring Components TR285HN301 Final Report Revision: -
Accessories. Two SSG and two SCB M85049 Class W sample failed shell conductivity following salt spray exposure, but no M85049 Class J samples failed. The shell conductivity of one SCB and one SSG sample was fourteen times greater than the requirement, and the other SCB sample was five times greater. The other SSG sample that failed registered as an open circuit. All other CPC samples were similar to the control samples, and were well below the specification requirement. Group C. Not applicable. 4.2.1.9 EMI. (Group B only.) Different samples were used for the baseline tests than the rest of the test sequence since a hole needed to be drilled in the insert for EMI testing. Therefore, before and after data on the identical samples could not be compared. The control samples of the M38999 Class M connector type were not tested after salt spray. None of the baseline samples exceeded the minimum specification requirement at the highest frequency, but samples from all three CPC types exceeded the minimum at all other frequencies tested. However, the ACF-50 tracked closely to the minimum requirement. For the M38999 Class F connectors, the SCB samples provided better shielding effectiveness than the control samples (see figure B5). For the M38999 Class W samples, the control samples tracked closely to the minimum requirement after salt spray. The SSG samples provided shielding capability similar to the baseline samples at all frequencies, whereas the ACF decreased near the requirement line from three to ten gigahertz (see figure B6). 4.2.1.10 Maintenance aging. (Group A only) After application of a CPC, samples were allowed to dry for a minimum of twenty-four hours prior to testing being performed. The graphs indicate that the ACF-50 acted as a lubricant on the M38999, MIL-C-5015, and AS81659 connectors when installing and removing wired contacts (see figure A11). Conversely, the contact removal forces for the M38999 and M81659 connectors with SCB applied were two times higher than the forces on the control samples. The ACF-50 was in liquid form during the maintenance aging test, but the SCB had dried to a thin, hard coating. No effect from a CPC was noted on the M24308 samples (see figure A12), but that connector type does not have a wire sealing grommet, so the same type of frictional forces from the elastomer are not encountered. 4.2.2 Visual observations. 4.2.2.1 Post baseline examination. It was noted near the end of the baseline testing that some pins in the M81659 connectors were bent. Those pins were replaced to prevent damage to the connectors and further damage to the contacts. None of the bent contacts that were replaced had been subjected to baseline electrical testing. 4.2.2.2 Group A observations and discussions.
21

CPC Effect on Aircraft Electrical Wiring Components TR285HN301 Final Report Revision: -
4.2.2.2.1 Post vibration. During testing of the M81659 connectors in the first axis, three connector pairs unmated each time the test passed through the 50-150 hertz frequency range. At the completion of testing in that axis, it was noted that the mounting plate on the shaker was cracked, and the slip table to which the samples were mounted was no longer attached. This may have caused the samples to experience vibration levels different from what was specified. It was also noted that some of the screws that secure the inserts in the shells were missing. Prior to testing in the second axis, all insert screws were retightened, and the plug and receptacle shells were held together by screws with spacers between the shell flanges. None of the screws became loose during the final two axes of testing.
• M38999W connectors (black socket insert material) o Control. Black residue was noted at the base of the pin contacts, some in the
form of flakes on the insert. Some gold dust was also observed on the face of the socket insert.
o SSG. Some black residue was observed at the base of the pin contacts. Spots of CPC appeared on the insert faces. Part of a pin contact sealing tower had adhered to the socket insert, and part of the peripheral seal was damaged and attached to a pin contact.
o ACF-50. Wet black residue was noted at the base of the pin contacts. o SCB. Observations included black residue on the contacts, damage to the pin
contact seals, and fragments of the seals stuck to the socket insert face. • M38999M connectors (gray socket insert material)
o Control. There was some black residue at the base of the pin contacts, but not as much as on the class M38999W connectors.
o SSG. A small amount of black residue was observed. Some damage to the grommet was noted, with some sealing tower fragments adhering to the socket insert.
o ACF-50. A wet, black residue was observed on the contacts, but not to the extent as seen on the class M38999W connectors.
o SCB. No black residue was observed on some samples, and a small amount was observed on others. There was damage to some of the pin contact sealing towers, and fragments of these were attached on the socket insert.
• MIL-C-5015 connectors
o Control. Some gold dust was noted at the base of the pin contacts. Some black residue was noted on the pins.
o SSG. Some pin contact sealing towers had adhered to the socket insert. o ACF-50. Some black, wet residue was observed at the base of the pins. o SCB. There was a small tear near the outer edge of the interfacial grommet on
one sample, but no black residue was evident.
22

CPC Effect on Aircraft Electrical Wiring Components TR285HN301 Final Report Revision: -
• MIL-DTL-24308 connectors. Almost immediately during testing in the third axis, the fixture that was used to secure the wires for the vertically mounted samples experienced severe movement. This caused some of the ACF-50 (long transverse direction) and Super Corr-B (short transverse direction) samples to unmate. The fixtures and the samples were repositioned and the test was resumed. One control sample became unmated after three hours in the third axis tested, but this was attributed to insufficient slack in the wires that were secured to the vibrating surface. The test was stopped, and after the slack in the wires was readjusted, the test was resumed, and no further electrical discontinuities were noted. The following observations were made following vibration testing:
o Control. Wear on the pins and at the socket entry, and gold dust on the connector interfaces. Less gold dust, possibly because not trapped, like on CPc samples.
o SSG. Oily residue, wear on the pins and at the socket entry, and gold dust on the connector interfaces.
o ACF-50. Dark oily residue, wear on the pins and at the socket entry, and gold dust on the connector interfaces.
o SCB. Dark oily residue, wear on the pins and at the socket entry, and gold dust on the connector interfaces.
• AS81659 connectors. During the first axis, when the connectors were not jackscrewed
together, the screws that hold the inserts in to the shells were vibrating loose. When the connectors halves were secured during final two axes, the insert screws did not loosen.
4.2.2.2.2 Post high temperature. The chromate conversion coating on the M38999W and MIL-C-5015 samples turned darker, during the high temperature exposure, but there was no difference between the control samples and the ones treated with a CPC. It was noted that the M24308 connectors with ACF-50 applied were easier to unmate after high temperature exposure than the control, SSG, or SCB samples. The M24308 connectors were the only type that was unmated at this stage of the program since all other connectors were to remain mated for humidity test. 4.2.2.2.3 Post humidity testing. Photos are included in Appendix D. It was difficult to obtain good electrical connections with the test leads, on the windows stripped in the wire insulation, causing instability for the LSLCR and contact resistance measurements (had to readjust leads multiple times). Some of the M38999 class W and M5015 connectors with a CPC applied were difficult to unmate following the high temperature and humidity exposures. Upon unmating of the connectors, residue was noted on the mating threads, and inside the shells (see photos A1a2-3, A1c2-4, A2d2-1, A3a2-5, and A3c3-3). For the M5015 samples that had CPCs applied, on one or more samples from each CPC type, the pin insert interfacial grommet pulled from the hard dielectric, and was adhered to the hard dielectric of the socket interface instead (see photos A3d2-1 and A3d2-2). None of the M5015 control samples exhibited this condition.
23

CPC Effect on Aircraft Electrical Wiring Components TR285HN301 Final Report Revision: -
Although the ACF-50 had remained “wet” throughout much of the test program, the CPC on the samples began to show signs of the crystallizing (see photos A2a1-2 and A2a1-4). This likely occurred during the long term high temperature exposure, however, that could not be confirmed since the samples were not unmated or tested prior to the humidity exposure. M38999 class W and M exhibited damaged “sealing towers” on the interfaces of the pin contact connectors. The grommet material tore from the pin connector half, and had adhered to the hard dielectric at the contact entry locations on the socket connectors. Mating and unmating of the connectors during maintenance operations could cause these pieces of the grommet to enter the socket contacts, and adversely affect mating forces and the transfer of electrical signals. This condition was most severe on samples that were treated with a CPC, but also existed to a lesser degree on the control samples (see photos A0a1-1, A1a2-1, A2c2-1, and A3a2-1). 4.2.2.3 Group B observations and discussion.
• Baseline coupling torque was performed by a different person than the post CPC, durability and salt spray.
• The coupling force may go down after durability because the threads are “worn in”. • The ratcheting mechanism broke on M38999 Class W and Class F samples (both?)
reducing the force of the mating. • Permanent deformation (compression) of the sealing towers from being fully mated at
elevated temperature for an extended time may have reduced the mating force. 4.2.2.3.1 Post salt spray observations.
• M38999W connectors o Control. Samples exhibited pits on threads, flutes, and connector accessory
teeth, and there was no chromate conversion coating in some areas. White corrosion product or salt deposits remained on the shells and some cavities on the connector interfaces after cleaning. It was difficult to mate untested, loose pin contacts with the sockets installed in the tested connectors (Photos B0a1-4, B0a1-7).
o SSG. Samples exhibited some pitting on teeth and flutes, and at the base of the accessory threads (Photo B1a2-3). There was corrosion product or salt deposits on the shells, but not to the extent observed on the control samples. The part number marking was not legible in some areas.
o ACF-50. Some areas exhibited corrosion product or salt deposits, but there were no signs of pitting. There were areas with no chromate conversion coating remaining, which exposed the cadmium. The part number marking was partially illegible on one of the three samples (Photo B2a1-1).
24

CPC Effect on Aircraft Electrical Wiring Components TR285HN301 Final Report Revision: -
o SCB. There was less corrosion product or salt deposits observed than on the control samples. Pits were observed on the teeth, threads and flutes, and portions of the part marking were illegible (Photos B3a3-7, B3a3-6?).
• M38999F connectors
o Control. Some pitting was observed on the coupling ring flutes, and salt deposits or corrosion product remained after cleaning (Photos B0b1-2, B0b2-1).
o SSG. No corrosion product or pits were observed (Photo B1b1-1). o ACF-50. No corrosion product or pits were observed (Photo B2b1-1). o SCB. No corrosion product or pits were observed, but some of the part number
marking was illegible (Photo B3b1-2).
• M38999M connectors. o Control. Some green and white powdery residues were observed on the
receptacle flange and threads, and plug threads. Bubbles and cracks in the plating were noted, and corrosion product salt deposits collected around the “J” pin. (Photos B0c1-3 & -4, B0c1-1, B0c1-5 & -6, B0c2-1).
o SSG. There were some salt water stains on the shells, but otherwise, the samples were very clean (Photos B1c1-1).
o ACF-50. The samples were very clean. It was not obvious that the sample had been exposed to the salt spray test. (Photos B2c1-1).
o SCB. Similar to the ACF-50 samples, these were very clean. (Photos B3c1-1).
• MIL-C-5015 connectors. o Control. Observation included chipped plating on the receptacle teeth, pitting
on the receptacle flange, mating threads, and plug coupling ring flutes, plating damage on the rear accessory threads, corrosion product or salt deposits on the coupling ring, accessory threads, and on the “A” contact, and no chromate conversion coating remaining (Photos B0d1-3, -4 & -5, B0d3-2).
o SSG. The samples exhibited some pitting, chromate damage on the receptacle flange, plug flutes and rear accessory threads, corrosion product or salt deposits (Photos B1d1-3 &-5, B1d2-1).
o ACF-50. There was chipped plating near on mounting hole on the receptacle, and small areas where the chromate was no longer present, but otherwise looked clean.(Photos B2d3-1).
o SCB. The chromate conversion coating was no longer present in some areas, there was some pitting near receptacle mounting holes, on the coupling ring flutes, and on the teeth, and some salt deposits or corrosion product (Photos B3d1-2, B3d2-3 & -4, B3d3-1).
• M24308 connectors. None of the samples exhibited pitting, and only minimal salt
deposits or corrosion product were observed (Photos B0e1 ss).
25

CPC Effect on Aircraft Electrical Wiring Components TR285HN301 Final Report Revision: -
• M81659 connectors. o Control. Corrosion product or salt deposits were noted around the polarizing
inserts and posts, and the screws. Pitting and loss of plating was observed near the polarizing insert mounting strip. There were also signs of blistering on the blue plastic grommet retainer (Photos B0f1-1, B0f1-2, B0f1-3).
o SSG. Some corrosion product and pitting was observed around the polarizing inserts and the mounting strip. The blue plastic exhibited some blistering, as was noted for the control samples (Photos B1f2-1, B1f2-2, B1f2-4).
o ACF-50. No corrosion product or pits were observed (Photo B2f1-2). o SCB. There was some corrosion product or salt deposits along the polarizing
insert mounting strip and the screws, and pitting on the flange near the strip (Photos B3f1, B3f1-3).
• M85049W accessories. Only the samples with ACF-50 applied did not exhibit pooling
of salt water in the accessory. Salt deposits and/or corrosion product collected in the braid at the cable entry point, preventing the salt water from draining. During the cleaning process, it was noted that the plating was flaking off from the inside of the accessories that exhibited pooling.
o Control. Water had pooled in the accessory due to the salt build up in the braid and termination area. Severe areas of corrosion were noted on the threads, knurls, and near the braid termination area (Photos B0g1-4, B0g1-2, B0g1-6).
o SSG. Water had pooled in the accessory due to the salt build up in the braid and termination area. The plating and aluminum base material were severely attacked, with pitting on the teeth, knurls, and near the band termination area (Photos B1g1-1, B1g1-2, B1g1-3). The braid and band fell off one sample because less than half of the termination area remained intact.
o ACF-50. Only one of the three samples exhibited pitting on a tooth and near the band termination area. Some of the chromate conversion coating was no longer present, but these sample exhibited the most protection from corrosion (Photos B2g1-1, B2g2-2, B2g2-3). The areas that did exhibit pitting may not have had a uniform coating of the CPC applied.
o SCB. Water had pooled in the accessory due to the salt build up in the braid and termination area. A hole was observed near the termination area on one sample, and there was pitting on teeth and the coupling rings (Photos B3g1-2, B3g2-2, B3g3-2).
• M85049J accessories. None of the samples exhibited pooling of salt water in the
accessory like in the M85049W accessories, and no salt deposits or corrosion product collected on the braid at the cable entry point. All samples with a CPC applied exhibited a white, greasy coating prior to cleaning.
o Control. The corrosion product or salt deposits in some areas could not be removed when brushing under warm running water. None of the chromate conversion coating remained on the samples (Photos B0h1-2, B0h1-3).
o SSG. The samples looked similar to the control samples (Photos B1h1-2, B1h1-3).
26
CPC Effect on Aircraft Electrical Wiring Components TR285HN301 Final Report Revision: -
o ACF-50. Compared to the control and SSG samples, there was less corrosion product or salt deposits that remained after cleaning. The inner diameter of the parts was cleaner, and some chromate conversion coating was still present (Photos B2h1-2, B2h1-4).
o SCB. The samples did not exhibit as much corrosion product on the exterior as some of the other samples, but there was a considerable amount on the inside. None of the chromate conversion coating remained on the parts present (Photos B3h1-2, B3h1-3).
4.2.2.3.2 Durability. The M38999 class W, F, and M, and MIL-DTL-5015 connectors were subjected to the dynamic salt spray test, which consists of 50 cycles of durability (mate/unmate cycles), salt spray exposure in the mated and/or unmated conditions, and then the remaining durability cycles. Although the requirement for class M composite connectors is 1500 durability cycles, only 500 were performed during the dynamic salt spray test since standard 500 cycle contacts were received with the connectors, rather than the high durability contacts. Following the salt fog exposure, the samples were cleaned, then dried in an air circulating oven prior to the remaining durability cycles being performed. During the final 450 cycles of durability, a change was noted in the ratcheting mechanism of the M38999 class F samples. Each sample, whether a control sample or conditioned with a CPC, experienced temporary binding at least once, typically after 50-60% of the remaining cycles were completed. When the coupling ring was rotated a partial revolution in the opposite direction, then in the appropriate direction again, the binding would be eliminated. However, the sound and feel of the ratcheting mechanism was noticeably different after the binding occurred. The ratcheting became quieter, and the operation became smoother. Despite the ratcheting mechanism failing partially or completely, the ability to perform the remainder of the electrical tests in the sequence was not affected. To determine whether the salt spray exposure and/or the presence of a CPC contributed to the problems with the ratcheting mechanism, two untested and untreated M38999 class F samples were subjected to 500 cycles of durability. Binding first occurred on the two samples after 241 and 203 cycles, respectively. The sound of the ratcheting mechanism was still evident on one sample after completion of the 500 durability cycles, although it was quieter than it was initially. After 232 cycles on the other sample, the ratcheting mechanism had failed completely. Disassembly of these two samples and an untested sample revealed that the nubs on the three ratcheting system clips were breaking and lodging in the detents, causing the binding. All three nubs were broken on the sample which no longer exhibited an audible ratcheting mechanism. The ratcheting mechanism of a MIL-DTL-5015 control sample also exhibited problems during the remaining 50 durability cycles following salt spray exposure. Binding occurred during the first mate and unmate cycle. The ratcheting sound of the locking mechanism was no longer evident, and the rotation of the coupling ring often needed to be reversed to eliminate the binding.
27
CPC Effect on Aircraft Electrical Wiring Components TR285HN301 Final Report Revision: -
4.2.2.4 Group C observations and discussion. 4.2.2.5 Final inspection. See photos in appendix D. 4.2.2.5.1 Group A. 4.2.2.5.1.1 General observations on loaded connectors. M38999 class W Control - illegible marking of part number on receptacle, grommet damage SSG - grommet damage ACF-50 - illegible part number and insert marking on the receptacle, and grommet damage SCB - grommet damage M38999 class M Control - illegible marking on insert grommet and hard dielectric SSG - illegible marking on insert grommet and hard dielectric, grommet damage on the plug ACF-50 - illegible marking on insert and grommet damage SCB - grommet damage and illegible marking on hard dielectric M5015 Control - illegible marking of part number on plug SSG - illegible marking of part number on plug, receptacle grommet damage, and interfacial grommet transferred to plug from receptacle. ACF-50 - illegible part number marking on plug, damage to grommet, and interfacial grommet transferred to plug from receptacle SCB - illegible part number on plug, damage to grommet, and interfacial grommet transferred to plug from receptacle M24308 - no anomalies M81659 Control - wear on sealing towers SSG - wear on sealing towers ACF-50 - slight wear on the sealing towers SCB - wear on sealing towers 4.2.2.5.1.2 The following observations were made on the connectors that were unloaded for the final grommet hardness test. By the end of the Group A test sequence, samples from each CPC condition had sustained damage to the grommets, but the samples treated with ACF-50 samples exhibited the most degradation (see photos A0a1-1 final, A2a1-2 final, A3a2-2 final).
28
CPC Effect on Aircraft Electrical Wiring Components TR285HN301 Final Report Revision: -
M38999 Class M. After removal of the contacts from samples of each CPC type, it was noted that the top surface of the grommet was wavy rather than flat. It appeared that the grommet was pulling away from the hard dielectric in certain areas, possibly due to degradation of the adhesive bond between the two materials. This would be consistent with the damage to the adhesive bond on the M5015 samples with a CPC applied. M5015. The grommets of the control samples did not exhibit as much tearing and damage from the removal tool as the samples treated with a CPC. M81659. Some of the sealing towers were partially inverted (see photo A2f2-2 final), but this was observed on the control samples as well as those treated with CPC, and likely from the frictional forces of the pin contacts being removed from the connector. 4.2.2.5.2 Group B. See salt spray photos in appendix D. 4.2.2.5.3 Group C. All samples had similar observations recorded. 4.3 Contacts, Groups D, E, and F.
4.3.1 Group D, Long Term Exposure to Inside Environment. Contamination on electrical contact surfaces can cause changes in electrical characteristics, and mating/unmating forces. These concerns have been voiced by original equipment manufacturers regarding the application of CPCs on electrical wiring components. This test group was designed to evaluate the effects of contamination collected or trapped from the application of CPCs. Eight pairs of contacts from each of the four CPC conditions were exposed to storage conditions for nine months, from January to October 2006. The room did not have air conditioning, but did have a heater that operated during the colder periods. During the exposure time, the temperature in the storage area ranged from approximately 62 to 102°F, and the relative humidity ranged from approximately 6 to 76%. The chart recorder showed a corresponding decrease in the humidity when the temperature increased with heater operating cycles. Visual examinations and electrical testing were performed after four, six and nine months of exposure to the inside environment. Following these periodic inspections, the samples were sprayed again with the applicable CPC, prior to further exposure to the simulated storage environment. 4.3.1.1 Visual examination. A visual inspection performed after four months of exposure revealed that the Super Corr-B samples had collected more dust/contamination than the ACF-50 or So Sure Green samples, but the difference was not evident without the aid of magnification (see Photo D1 – D3). Photo D4 shows no contamination on the control samples at that time.
29

CPC Effect on Aircraft Electrical Wiring Components TR285HN301 Final Report Revision: -
After six months of exposure, a buildup of CPC was noted near the contact shoulder on the samples with ACF-50 applied (see Photo D5), and on the hoods of the Super Corr-B samples (see Photo D6). The Super Corr-B showed signs of solidifying. Visual inspection of the control and So Sure samples revealed no significant changes from the four month inspection. After the entire nine months of exposure, there was a build-up of So Sure Green around the contact shoulders and on the socket contact hoods, and some dust/contamination had collected on the samples (see Photo D7). The ACF-50 samples exhibited some buildup around the contact shoulders and on the socket hoods as shown in Photo D8. Photo D9 shows a buildup of Super Corr-B on the socket hoods, the pin mating surfaces, and at the entrance of the socket mating end. At the completion of the exposure, it was observed that all of the samples with a CPC applied showed signs of the CPC solidifying. This may have resulted from the combination of dust accumulation and the CPC being applied three times with subsequent long drying periods. Some dust/debris was also observed on the control samples (Photo D10). 4.3.1.2 Low signal level contact resistance (LSLCR). The test equipment used for the Group D baseline electrical resistance data did not provide results consistent enough for the level of accuracy needed to observe small performance changes. Since LSLCR test data was generated on the same contact and wire types as installed in the M38999 connectors in Group A, that data was utilized for the new baseline averages. The table shows that the there was very little difference among the baseline low signal level contact resistance (LSLCR) readings and those after four, six, and nine months of exposure to the inside environment. Table D1. Group D Low Signal Level Contact Resistance Averages.
Low Signal Level Contact Resistance (mΩ) Required Measured
CPC type Initial/AC1 (max)
Baseline average
After 4 months, average
After 6 months, average
After 9 months (final), average
None 9/11 4.39 4.47 4.44 4.51 So Sure Green
9/11 4.39 4.57 4.45 4.41
ACF-50 9/11 4.39 4.52 4.26 4.45 Super Corr-B
9/11 4.39 4.58 4.23 4.52
1/AC - After conditioning Figure D1 indicates that there was slightly more sample-to-sample variation for ACF-50 and Super Corr-B through six months of periodic LSLCR evaluations. Visual examination prior to the periodic LSLCR testing also revealed more contamination on these samples. The control samples exhibited more sample-to-sample variation after nine months of exposure than after previous periodic evaluations, and it was noted that the amount of contamination on these samples had increased compared to the observations made after six months.
30

CPC Effect on Aircraft Electrical Wiring Components TR285HN301 Final Report Revision: -
Since the pressure members of the socket contacts do not cause a wiping action on the complete pin contact surface, any contaminant that may not have been wiped from the contact, may have then been trapped by the subsequent application of CPC. How the contacts were oriented the next time the samples were mated (whether the wiping was over trapped contaminants or a cleaner surface) may have contributed to the variation in the results. All samples met the AS39029 initial and after conditioning requirements shown in Table D1. See Figure D1. (Group D LSLCR graph). 4.3.1.3 Contact engagement forces. The test plan did not originally specify measuring contact engagement or separation forces following the nine months of exposure to the inside environment. However, since some of the samples sprayed with a CPC seemed more difficult to mate prior to the final LSLCR test, the test plan was modified to include engagement force testing. No baseline or “with CPC” engagement force data was generated in Group D, so the data from Group F samples was used for comparison purposes (see Table D2). The table shows that the engagement forces after the long term exposure were similar to the baseline measurements on the Group F samples. The samples with ACF-50 or Super Corr-B applied exposed to the post long term inside exposure showed a decrease in engagement force, but those samples showed an increase prior to the environmental conditioning. The measured values on all samples were still below the maximum force specified in Table D2. The engagement and separation force tests in this program were performed in accordance with AS39029 electrical contact specification, which requires standard size gage pins to be mated with the sockets, rather than actual pin contacts. Using the long term exposure pin samples, that exhibited an accumulation of hardened CPC on the mating surface, would be expected to cause the engagement and separation forces to increase. In addition, had the measurements been performed prior to mating of the samples for the final LSLCR test, the forces may have been higher due to accumulation of CPC at the entrance of the socket contact. Mating the contacts for the test may have displaced the accumulation of CPC and contamination that resulted from the multiple applications and the long-term exposure. Measuring the engagement force with an actual pin contact, followed by LSLCR testing, then the separation test, would more accurately assess the impact from the presence of a CPC. Although some CPC collects at the mating end of the socket contact and inhibit entrance of a pin, it is more likely that the buildup along the length of the pin mating surface would cause changes in engagement and separation values.
31

CPC Effect on Aircraft Electrical Wiring Components TR285HN301 Final Report Revision: -
Table D2. Group D Engagement Force Averages
Engagement Force Required Measured
CPC type Max avg. Initial/AC 1/
(oz)
Baseline (oz) (from Group F)
With CPC (oz)
(from Group F)
% Change
Post Long Term Inside
Exposure (oz)
% Change
(baseline to final)
None 12/14 7.76 7.14 -8.0 6.43 -17.1 So Sure Green 12/14 7.67 7.48 -2.4 7.13 -5.5
ACF-50 12/14 7.88 9.14 15.9 7.31 -7.2 Super Corr-B 12/14 7.82 8.06 3.0 7.27 -7.0 1/AC - After conditioning See Figure D2. (Group D engagement force average bar graph.) 4.3.2 Group E, Industrial Gas Exposure. 4.3.2.1 Visual examination. There was no difference in appearance among the control samples and those treated with a CPC after the gas exposure test (see Photo E1). A bare copper coupon was placed in the desiccator with the test samples as a control to verify that the samples were being properly exposed to the gas. The part of the coupon that did not change was protected from the gas since it was in contact with the plate in the desiccator. As evidenced by the coupon (see Photo E1), if copper from the contacts was exposed, due to damage of the plating from the CPC or handling, there would be visual indications of such damage. 4.3.2.2 Low signal level contact resistance. Comparison of the baseline values with values after application of CPC and after gas exposure (see Table E1 and Figure E1) showed insignificant change in the LSLCR values. The measured values were approximately 70 to 75% less than the specified AS39029 maximum requirement. Note: All measurements in this group were taken with the original ohmmeter, and those results were used for comparative analysis. These results were approximately 2 milliohms lower than readings measured with a second ohmmeter on similar contacts.
32

CPC Effect on Aircraft Electrical Wiring Components TR285HN301 Final Report Revision: -
Table E1. Group E Low Signal Level Contact Resistance Averages.
Low Signal Level Contact Resistance (mΩ) Required Measured
CPC type Initial/AC1 (max)
Baseline After application of
CPC
Post Gas Exposure
None 9/11 2.82 2.75 2.76 So Sure Green 9/11 2.82 2.75 2.74 ACF-50 9/11 2.73 2.72 2.71 Super Corr-B 9/11 2.75 2.81 2.70 1/AC - After conditioning See Figure E1. (Group E LSLCR chart). 4.3.2.3 Contact resistance. Table E2 and Figure F2 show there was an increase in the contact resistance values after the gas exposure test, but there was less of an increase for the samples to which a CPC had been applied. The percent increase for the control samples (no CPC) was approximately twice that for samples with ACF-50 or Super Corr-B applied, and approximately 1.5 times higher than for the samples with So Sure Green applied. This indicates that application of the CPCs may have reduced degradation of the contact surfaces when subjected to gas exposure. All values were less than the AS39029 maximum values. Table E2. Group E Contact Resistance Averages.
Contact Resistance (mV) Required Measured CPC type Max. avg.
initial/AC1Baseline Post Gas
Exposure
% Increase
None 50/56 36.60 39.03 6.7 So Sure Green 50/56 36.91 38.45 4.2 ACF-50 50/56 36.80 37.80 2.7 Super Corr-B 50/56 36.72 37.82 3.0 1/AC - After conditioning See Figure E2. (Group E CR chart.) 4.3.3 Group F, Temperature Life 4.3.3.1 Visual examination. Photos F1 and F2 show some discoloration and residue on the samples with Super Corr-B applied. Photo F3 shows that both the pins and sockets with So Sure Green applied exhibited some fading of the stripe marking and the gold plating, and the
33
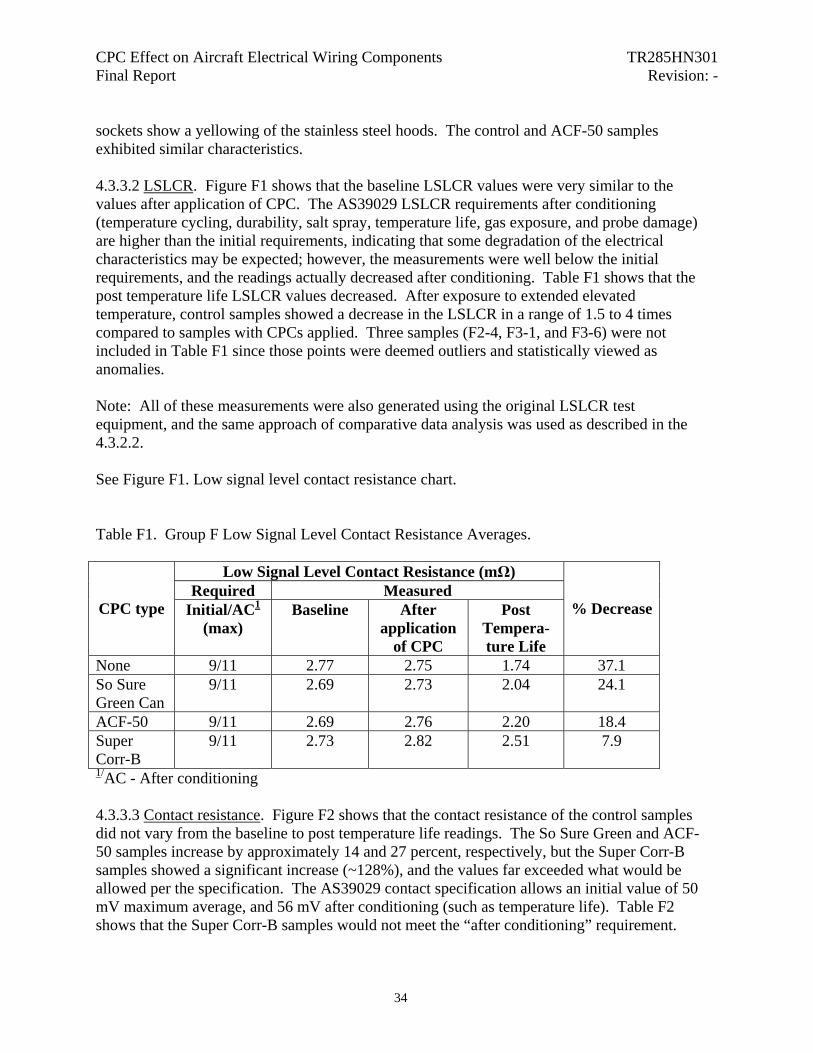
CPC Effect on Aircraft Electrical Wiring Components TR285HN301 Final Report Revision: -
sockets show a yellowing of the stainless steel hoods. The control and ACF-50 samples exhibited similar characteristics. 4.3.3.2 LSLCR. Figure F1 shows that the baseline LSLCR values were very similar to the values after application of CPC. The AS39029 LSLCR requirements after conditioning (temperature cycling, durability, salt spray, temperature life, gas exposure, and probe damage) are higher than the initial requirements, indicating that some degradation of the electrical characteristics may be expected; however, the measurements were well below the initial requirements, and the readings actually decreased after conditioning. Table F1 shows that the post temperature life LSLCR values decreased. After exposure to extended elevated temperature, control samples showed a decrease in the LSLCR in a range of 1.5 to 4 times compared to samples with CPCs applied. Three samples (F2-4, F3-1, and F3-6) were not included in Table F1 since those points were deemed outliers and statistically viewed as anomalies. Note: All of these measurements were also generated using the original LSLCR test equipment, and the same approach of comparative data analysis was used as described in the 4.3.2.2. See Figure F1. Low signal level contact resistance chart. Table F1. Group F Low Signal Level Contact Resistance Averages.
Low Signal Level Contact Resistance (mΩ) Required Measured
CPC type Initial/AC1 (max)
Baseline After application
of CPC
Post Tempera-ture Life
% Decrease
None 9/11 2.77 2.75 1.74 37.1 So Sure Green Can
9/11 2.69 2.73 2.04 24.1
ACF-50 9/11 2.69 2.76 2.20 18.4 Super Corr-B
9/11 2.73 2.82 2.51 7.9
1/AC - After conditioning 4.3.3.3 Contact resistance. Figure F2 shows that the contact resistance of the control samples did not vary from the baseline to post temperature life readings. The So Sure Green and ACF-50 samples increase by approximately 14 and 27 percent, respectively, but the Super Corr-B samples showed a significant increase (~128%), and the values far exceeded what would be allowed per the specification. The AS39029 contact specification allows an initial value of 50 mV maximum average, and 56 mV after conditioning (such as temperature life). Table F2 shows that the Super Corr-B samples would not meet the “after conditioning” requirement.
34
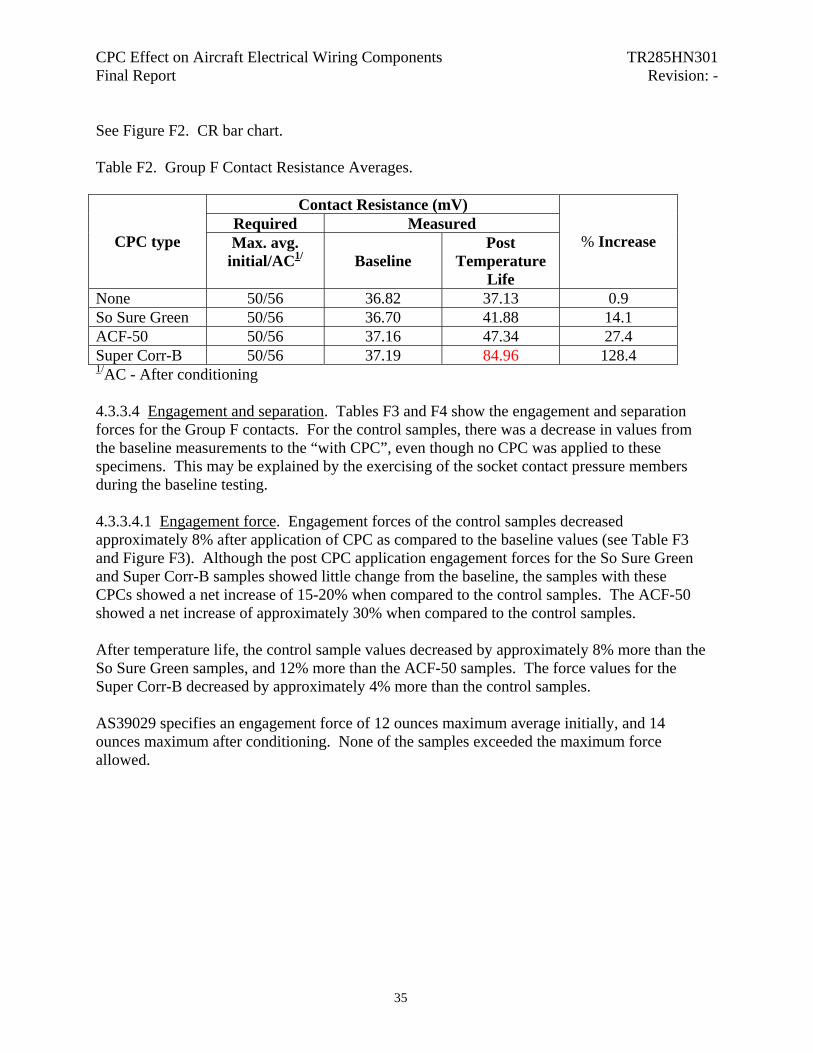
CPC Effect on Aircraft Electrical Wiring Components TR285HN301 Final Report Revision: -
See Figure F2. CR bar chart. Table F2. Group F Contact Resistance Averages.
Contact Resistance (mV) Required Measured
CPC type Max. avg. initial/AC1/
Baseline
Post Temperature
Life
% Increase
None 50/56 36.82 37.13 0.9 So Sure Green 50/56 36.70 41.88 14.1 ACF-50 50/56 37.16 47.34 27.4 Super Corr-B 50/56 37.19 84.96 128.4 1/AC - After conditioning 4.3.3.4 Engagement and separation. Tables F3 and F4 show the engagement and separation forces for the Group F contacts. For the control samples, there was a decrease in values from the baseline measurements to the “with CPC”, even though no CPC was applied to these specimens. This may be explained by the exercising of the socket contact pressure members during the baseline testing. 4.3.3.4.1 Engagement force. Engagement forces of the control samples decreased approximately 8% after application of CPC as compared to the baseline values (see Table F3 and Figure F3). Although the post CPC application engagement forces for the So Sure Green and Super Corr-B samples showed little change from the baseline, the samples with these CPCs showed a net increase of 15-20% when compared to the control samples. The ACF-50 showed a net increase of approximately 30% when compared to the control samples. After temperature life, the control sample values decreased by approximately 8% more than the So Sure Green samples, and 12% more than the ACF-50 samples. The force values for the Super Corr-B decreased by approximately 4% more than the control samples. AS39029 specifies an engagement force of 12 ounces maximum average initially, and 14 ounces maximum after conditioning. None of the samples exceeded the maximum force allowed.
35
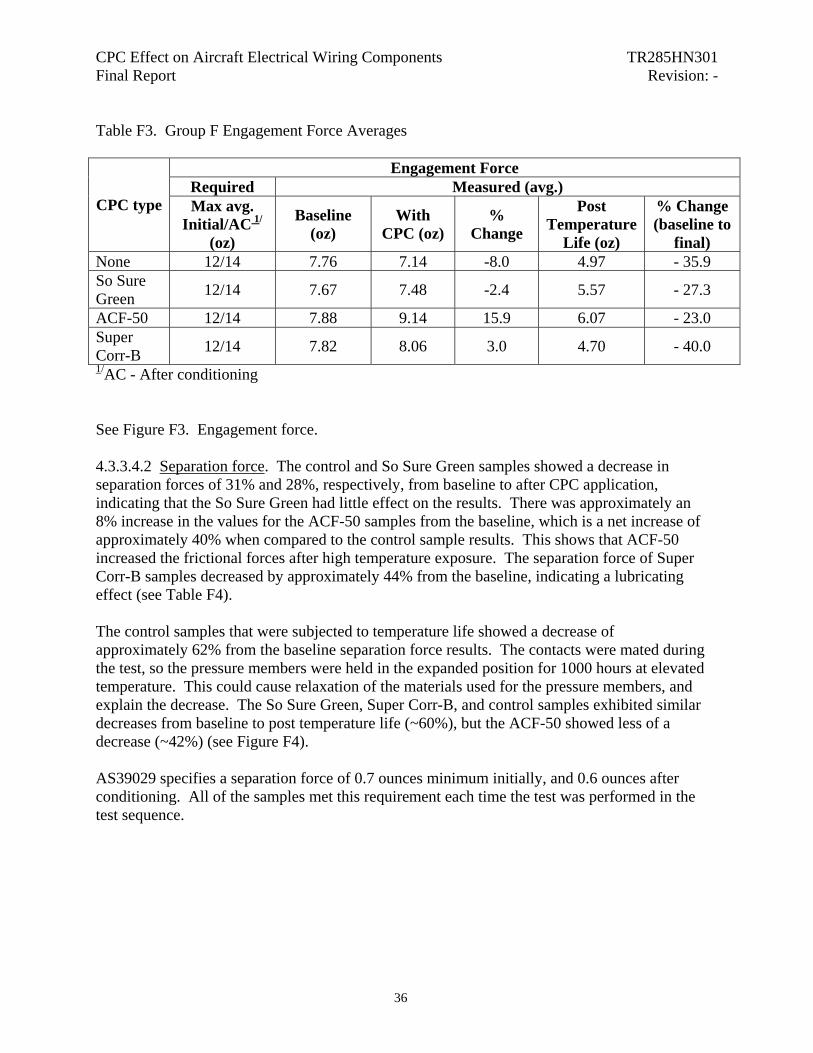
CPC Effect on Aircraft Electrical Wiring Components TR285HN301 Final Report Revision: -
Table F3. Group F Engagement Force Averages
Engagement Force Required Measured (avg.)
CPC type Max avg. Initial/AC 1/
(oz)
Baseline (oz)
With CPC (oz)
% Change
Post Temperature
Life (oz)
% Change (baseline to
final) None 12/14 7.76 7.14 -8.0 4.97 - 35.9 So Sure Green 12/14 7.67 7.48 -2.4 5.57 - 27.3
ACF-50 12/14 7.88 9.14 15.9 6.07 - 23.0 Super Corr-B 12/14 7.82 8.06 3.0 4.70 - 40.0 1/AC - After conditioning See Figure F3. Engagement force. 4.3.3.4.2 Separation force. The control and So Sure Green samples showed a decrease in separation forces of 31% and 28%, respectively, from baseline to after CPC application, indicating that the So Sure Green had little effect on the results. There was approximately an 8% increase in the values for the ACF-50 samples from the baseline, which is a net increase of approximately 40% when compared to the control sample results. This shows that ACF-50 increased the frictional forces after high temperature exposure. The separation force of Super Corr-B samples decreased by approximately 44% from the baseline, indicating a lubricating effect (see Table F4). The control samples that were subjected to temperature life showed a decrease of approximately 62% from the baseline separation force results. The contacts were mated during the test, so the pressure members were held in the expanded position for 1000 hours at elevated temperature. This could cause relaxation of the materials used for the pressure members, and explain the decrease. The So Sure Green, Super Corr-B, and control samples exhibited similar decreases from baseline to post temperature life (~60%), but the ACF-50 showed less of a decrease (~42%) (see Figure F4). AS39029 specifies a separation force of 0.7 ounces minimum initially, and 0.6 ounces after conditioning. All of the samples met this requirement each time the test was performed in the test sequence.
36
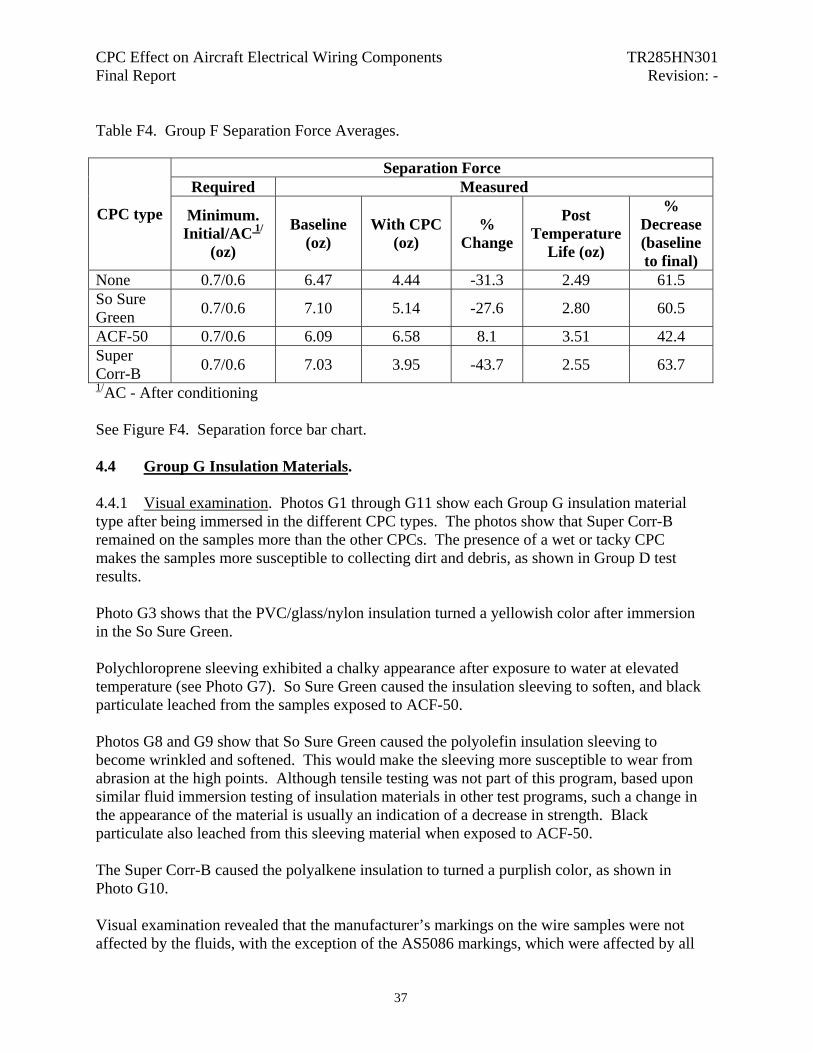
CPC Effect on Aircraft Electrical Wiring Components TR285HN301 Final Report Revision: -
Table F4. Group F Separation Force Averages.
Separation Force Required Measured
CPC type Minimum. Initial/AC 1/
(oz)
Baseline (oz)
With CPC (oz)
% Change
Post Temperature
Life (oz)
% Decrease (baseline to final)
None 0.7/0.6 6.47 4.44 -31.3 2.49 61.5 So Sure Green 0.7/0.6 7.10 5.14 -27.6 2.80 60.5
ACF-50 0.7/0.6 6.09 6.58 8.1 3.51 42.4 Super Corr-B 0.7/0.6 7.03 3.95 -43.7 2.55 63.7 1/AC - After conditioning See Figure F4. Separation force bar chart. 4.4 Group G Insulation Materials. 4.4.1 Visual examination. Photos G1 through G11 show each Group G insulation material type after being immersed in the different CPC types. The photos show that Super Corr-B remained on the samples more than the other CPCs. The presence of a wet or tacky CPC makes the samples more susceptible to collecting dirt and debris, as shown in Group D test results. Photo G3 shows that the PVC/glass/nylon insulation turned a yellowish color after immersion in the So Sure Green. Polychloroprene sleeving exhibited a chalky appearance after exposure to water at elevated temperature (see Photo G7). So Sure Green caused the insulation sleeving to soften, and black particulate leached from the samples exposed to ACF-50. Photos G8 and G9 show that So Sure Green caused the polyolefin insulation sleeving to become wrinkled and softened. This would make the sleeving more susceptible to wear from abrasion at the high points. Although tensile testing was not part of this program, based upon similar fluid immersion testing of insulation materials in other test programs, such a change in the appearance of the material is usually an indication of a decrease in strength. Black particulate also leached from this sleeving material when exposed to ACF-50. The Super Corr-B caused the polyalkene insulation to turned a purplish color, as shown in Photo G10. Visual examination revealed that the manufacturer’s markings on the wire samples were not affected by the fluids, with the exception of the AS5086 markings, which were affected by all
37
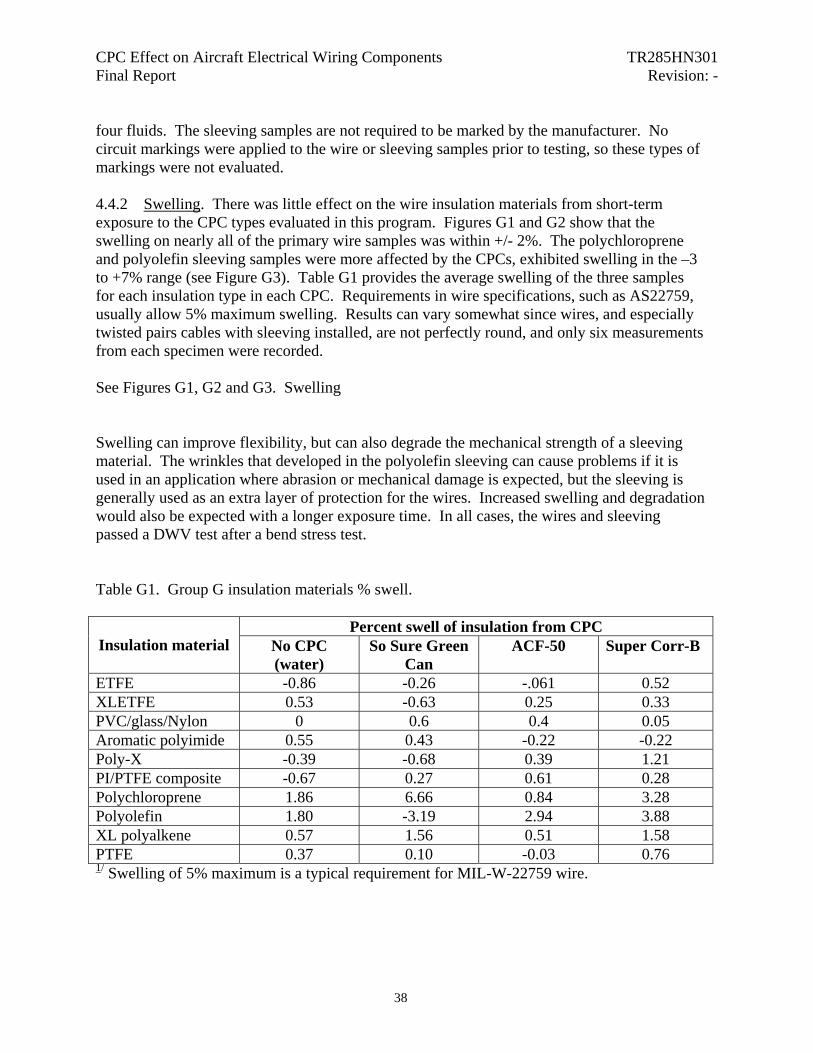
CPC Effect on Aircraft Electrical Wiring Components TR285HN301 Final Report Revision: -
four fluids. The sleeving samples are not required to be marked by the manufacturer. No circuit markings were applied to the wire or sleeving samples prior to testing, so these types of markings were not evaluated. 4.4.2 Swelling. There was little effect on the wire insulation materials from short-term exposure to the CPC types evaluated in this program. Figures G1 and G2 show that the swelling on nearly all of the primary wire samples was within +/- 2%. The polychloroprene and polyolefin sleeving samples were more affected by the CPCs, exhibited swelling in the –3 to +7% range (see Figure G3). Table G1 provides the average swelling of the three samples for each insulation type in each CPC. Requirements in wire specifications, such as AS22759, usually allow 5% maximum swelling. Results can vary somewhat since wires, and especially twisted pairs cables with sleeving installed, are not perfectly round, and only six measurements from each specimen were recorded. See Figures G1, G2 and G3. Swelling Swelling can improve flexibility, but can also degrade the mechanical strength of a sleeving material. The wrinkles that developed in the polyolefin sleeving can cause problems if it is used in an application where abrasion or mechanical damage is expected, but the sleeving is generally used as an extra layer of protection for the wires. Increased swelling and degradation would also be expected with a longer exposure time. In all cases, the wires and sleeving passed a DWV test after a bend stress test. Table G1. Group G insulation materials % swell.
Percent swell of insulation from CPC Insulation material No CPC
(water) So Sure Green
Can ACF-50 Super Corr-B
ETFE -0.86 -0.26 -.061 0.52 XLETFE 0.53 -0.63 0.25 0.33 PVC/glass/Nylon 0 0.6 0.4 0.05 Aromatic polyimide 0.55 0.43 -0.22 -0.22 Poly-X -0.39 -0.68 0.39 1.21 PI/PTFE composite -0.67 0.27 0.61 0.28 Polychloroprene 1.86 6.66 0.84 3.28 Polyolefin 1.80 -3.19 2.94 3.88 XL polyalkene 0.57 1.56 0.51 1.58 PTFE 0.37 0.10 -0.03 0.76 1/ Swelling of 5% maximum is a typical requirement for MIL-W-22759 wire.
38
CPC Effect on Aircraft Electrical Wiring Components TR285HN301 Final Report Revision: -
4.4.3 Insulation resistance of polymers. 4.4.3.1 Discussion. Some variation in the IR measurement was expected. Measurements are typically performed on a submersed length of wire that is 26 feet or longer; however, two-foot samples were tested in this program, resulting in greater variability due to less surface area. Some materials also have a relatively porous surface that allows fluid to penetrate beyond the outer surface, thus reducing the distance to the conductor. When conductive materials, such as an electrolyte test fluid or salt water penetrate into these pores, the insulation resistance decreases. However, CPCs are non-conductive materials that can actually fill the voids in the insulation and prevent the test solution from wetting the wire surface during the test, thus causing the IR to increase. Physical swelling can increase the thickness of the insulation material around the conductor. As long as the material does not degrade due to the exposure, and the porosity of the insulation does not increase allowing more electrolyte intrusion, the IR could actually increase. The minimum IR requirement varies from one wire type to another, depending upon the insulation material and construction. The requirements are expressed in units of megohms/1000 feet (identified as MΩ in this section of the report), and range from 40 MΩ for the PVC/glass/nylon insulated wire to 50,000 MΩ for the PTFE insulated wire. The sleeving materials do not specify an IR requirement, but do specify a DWV requirement. The wire specifications often impose requirements for IR after the humidity test, but the requirements are generally the same as the initial requirement, indicating that the humidity is not expected to have an appreciable effect on the wire performance. Two exceptions are the polyimide and PTFE insulation types. The polyimide is known to degrade from exposure to humidity, so the requirement changes from a minimum of 2500 MΩ for initial, to 5 MΩ after exposure. PTFE is fairly porous when manufactured as an extruded product, so no IR requirement is specified after humidity exposure. None of the specifications impose IR requirements following fluid immersion, so the results from this test program cannot be directly compared to a specification requirement. The temperature was 1˚C higher when performing the baseline measurements on the XLETFE, PVC/glass/nylon, and PI samples, which would make the baseline values slightly higher. Correcting the temperature to a standard value for the remainder of the measurements would not raise the values significantly. This difference is within the error already present in the test. 4.4.3.2 IR and DWV test results. Variation in the length of the specimen submerged, and variation in the insulation characteristics such as homogeneity of the thickness and porosity, can cause variability of the IR measurements by orders of magnitude. Therefore, all IR data was converted to a logarithmic scale to create a linear measurement for analysis. The following paragraphs discuss the results for the insulation types evaluated. The measured values on the twelve test samples of each insulation type were converted to megohms/1000 feet.
39

CPC Effect on Aircraft Electrical Wiring Components TR285HN301 Final Report Revision: -
Figures G4 and G5 provide the baseline and post immersion IR measurements, respectively, for all ten insulation materials tested. Table G2 summarizes the average effects of each fluid on the IR of each wire type tested. See Figures G6 through G15 after the applicable paragraphs below. Table G2. CPC Effect Matrix – Average % Change in Log Insulation Resistance Values
Insulation/CPC Water So Sure Green ACF-50
Super Corr B
ETFE -2% -21% -76% -8%
XLETFE -14% -3% -6% -12%
PTFE -13% -3% -10% -7%
PI/PTFE -30% -25% -13% -17%
Polyimide -5% -4% -15% -2%
Poly-X -23% -18% -27% -12%
Chloroprene -5% -60% -56% -14%
Polyolefin -2% -68% -45% -4%
Polyalkene -24% -17% 0% -2%
PVC/G/N -16% -15% -35% -8% Table G2 Legend
>60% Significant effect
40-59% Large effect 20-39% Moderate effect< 20% slight effect
ETFE: Initial IR values for the ETFE specimens averaged 3070 MΩ, with a standard deviation of 1300 MΩ (41%). These values were below the minimum IR specification requirement of 5000 MΩ, but this is likely due to the sample lengths used for this evaluation. Figure G6 shows that the average log values decreased by only 2 and 8% for the water and Super Corr B samples, respectively. The change from the other two fluids was larger, with the So Sure Green resulting in a 21% decrease, and the ACF-50 a 76% decrease. The variability in the results is apparent from the three specimens immersed in ACF-50. Two of the three specimens from the ACF-50 exhibited very low IR values, while the third essentially did not change from the initial value. This could have been the result of the sample length, or the inconsistent manner in which the CPC protects the surface of the insulation from being wet by the electrolyte solution during the IR testing. All specimens passed the subsequent DWV test.
40
CPC Effect on Aircraft Electrical Wiring Components TR285HN301 Final Report Revision: -
XLETFE: Initial IR values for the XLETFE specimens averaged 12800 MΩ, with a standard deviation of 6100 MΩ (48%). Two of the specimens had initial IR values that were below the minimum specification requirement of 5000 MΩ (see Figure G7). Again, this is most likely due to the variability from the shorter sample length. So Sure Green and ACF-50 caused 3-6% decreases in average log IR values on the XLETFE specimens, whereas the water and Super Corr B caused decrease by 12-14%. Following immersion testing, nine of the twelve the specimens were below the initial requirement, with the lowest being ~500 MΩ. For all but the Super Corr-B samples, one of the three samples was significantly different. These may have been outliers, but were not removed when calculating the average values. All specimens passed DWV testing. PVC/glass/nylon: Initial IR values for the PVC/glass/nylon specimens averaged 174 MΩ, with a standard deviation of 8 MΩ (5%). All specimens had initial IR values above the specification minimum of 40 MΩ. A decrease of 8-15% in the IR log values occurred on samples from the control group and two CPC types after fluid immersion, but the specimens immersed in ACF-50 experienced approximately a 35% decrease, mainly due to one sample (see Figure G8). Although the post immersion IR of this specimen was 36 KOhm/1000 feet, it and all other specimens passed the DWV test. Polyimide: Initial IR values for the M81381 aromatic polyimide specimens averaged 4260 MΩ, with a standard deviation of 2500 MΩ (60%). The initial requirement for this insulation type is 2500 MΩ minimum. Figure G9 shows a decrease of approximately 2-5% from the initial IR log values for the control, So Sure Green, and Super Corr-B samples, and a 15% decrease for the ACF-50 specimens. In all cases, the values remained above the 5 MΩ post-humidity test specification requirement. All specimens passed DWV testing. Poly-X: Initial IR values for the cross-linked polyalkane imide specimens averaged 10750 MΩ, with a standard deviation of 2400 MΩ (22%). Initial IR values were all above the specification requirement of 5000 MΩ, minimum. Water and ACF-50 had the greatest effect at 23% and 27% average decrease in the log values, respectively, while the Super Corr B and So Sure Green had the least effect with 12% and 18% average decreases, respectively (see Figure G10). All specimens passed the DWV test. PI/PTFE composite: Initial IR values for the polyimide/PTFE specimens averaged 20,000 MΩ, with a standard deviation of 4500 MΩ (22%). Initial IR values were all well above the specification requirement of 5000 MΩ. All fluids had some effect on the IR log values, as exhibited in Figure G11, with water and So Sure Green causing the largest decrease at 30 and 25%, respectively. All specimens passed DWV testing. Polychloroprene: Initial IR values for the polychloroprene specimens averaged 550 MΩ, with a standard deviation of 96 MΩ (17%). There is no IR specification requirement for this sleeving material. So Sure Green and ACF-50 caused decreases in the IR log values of 60% and 56%, respectively (see Figure G12), but all specimens passed the DWV test.
41

CPC Effect on Aircraft Electrical Wiring Components TR285HN301 Final Report Revision: -
Polyolefin: Initial IR values for the polyolefin specimens averaged 377 MΩ, with a standard deviation of 200 MΩ (53%). There is no IR specification requirement for this sleeving material. So Sure Green and ACF-50 caused decreases in the IR log values of 68% and 45%, respectively, but all specimens passed the DWV test. The results from the test specimens subjected to So Sure Green and ACF-50 showed more variation, with one of the three specimens in each fluid being affected more than the other two (see Figure G13). XL polyalkene: Initial IR values for the cross-linked polyalkene specimens averaged 5200 MΩ, with a standard deviation of 1200 MΩ (23%). Nearly all specimens were at or above the minimum specification requirements of 5000 MΩ. Water had the greatest effect on the samples, with an average IR log decrease of 24%, and So Sure Green specimens exhibited the second highest change, with a 17% average IR log decrease (see Figure G14). PTFE: Initial IR values for the PTFE specimens averaged 7400 MΩ, with a standard deviation of 7300 MΩ (98%). PTFE is considered a control sample for this test due to its low susceptibility to various chemicals, but none of the initial IR values approached the minimum specification requirement of 50,000 MΩ. Figure G15 shows that water had the greatest effect on the PTFE specimens, with approximately a 13% average decrease in the log values after immersion. Taking into account the high variability from the short specimen length, the data for this insulation type may be in the expected range for the different fluids.
42

CPC Effect on Aircraft Electrical Wiring Components TR285HN301 Final Report Revision: -
5.0 Conclusions 5.1 CPCs
• After exposure to temperature life, contacts with Super Corr-B (SCB) applied exhibit
dried CPC residue. The So Sure Green (SSG) and ACF-50 samples look similar to the control samples, with slight discoloration of the contacts.
• Repeated application of the CPCs results in build up of CPC material on the components.
• Unlike the SSG and SCB, the ACF-50 remains oily under normal test laboratory conditions. Samples with ACF-50 are slippery when handling, and would cause challenges when performing maintenance operations.
5.2 Connectors – (based upon connector types and CPCs tested in this program). General
• The ACF-50 causes the greatest decrease in insulation resistance after environmental conditioning. Samples treated with SCB, which is from a different military specification than the other CPCs, were the most similar to the control samples.
• The ACF-50 acts as a lubricant when installing and removing contacts from new connector samples, while the SCB causes an increase in the removal force.
• The hardness of the connector wire sealing grommets did not change significantly due to the presence of a CPC.
After temperature cycling and vibration
• Except for insulation resistance on ACF-50 and SSG samples, which decreased slightly, the presence of a CPC on samples subjected to elevated temperature for a short duration (e.g., temperature cycling) or vibration testing did not cause changes in the post conditioning electrical tests when compared to control samples.
• Except for the M24308 CPC samples, which exhibited lower force values than the controls, CPCs did not cause a change in the mating and unmating forces on connectors subjected to temperature cycling.
After high temperature and humidity
• CPCs cause the uncoupling force of M38999 Class W and M5015 connectors to increase above the specification limit.
• CPCs crystallize, creating potential problems for maintenance operations such as unmating of connectors and removal of wired contacts.
• The presence of a CPC causes an increase in LSLCR. Only the samples treated with ACF-50 exceeded the maximum specification requirement.
• Limited test results indicated that the presence of a CPC causes connector shell conductivity to increase above the maximum specification requirement.
• SSG causes the greatest increase in mating and unmating forces on M81659 rectangular connectors, while the presence of ACF-50 or SCB results in decreased forces.
43

CPC Effect on Aircraft Electrical Wiring Components TR285HN301 Final Report Revision: -
• With the exception of the M5015 pin connectors, CPCs do not affect the DWV characteristics of the connector samples.
• The presence of a CPC inside the connector causes the contact resistance to increase beyond the maximum specification requirement.
After salt spray
• The ACF-50 is the most effective CPC in inhibiting corrosion and protecting the electrical and mechanical characteristics. SSG and SCB did provide some protection in comparison to the control samples.
• The application of a CPC prior to salt spray causes the post test coupling and uncoupling force measurements of circular connectors to be lower than on samples without a CPC.
• SSG and SCB causes mating and unmating forces on rectangular connectors to be higher.
• Treating M38999 class F connectors with ACF-50 causes the samples to exceed the shell conductivity maximum specification requirement. In all other connector types, the CPC and control samples exhibit similar shell conductivity following exposure.
• The presence of SSG or SCB on aluminum M85049 class W accessories causes the shell conductivity to increase above the maximum specification requirement. The shell conductivity of the composite M85049 class J samples was not affected by CPCs.
• Application of ACF-50 or SCB prior to salt spray testing improves the ability of connectors to meet the DWV requirement after exposure.
• Connectors treated with SSG or SCB maintain shielding effectiveness levels that are similar to or higher than those of new connectors. Control and ACF-50 samples exhibit slight decreases in shielding effectiveness that approach the minimum requirements.
After dust
• The presence of a CPC does not adversely affect post dust test coupling and uncoupling forces.
Visual
• Connectors conditioned with a CPC and subjected to high temperature exposure exhibit
more damage to interfacial grommets and to the M5015 wire sealing grommets, than the control samples. The ACF-50 caused the most damage to the grommets.
5.3 Contacts.
• Samples sprayed with a CPC are more susceptible to collecting dust and debris than the control samples, and the Super Corr-B samples exhibited the most contamination.
• The CPCs evaluated did not impact the LSLCR characteristic of contacts subjected to
long term inside environment or gas exposure.
44
CPC Effect on Aircraft Electrical Wiring Components TR285HN301 Final Report Revision: -
• Control samples subjected to gas exposure showed approximately a 6% increase in contact resistance, whereas those with a CPC applied showed 3-4% increase, indicating that the CPCs protected the contacts from the full effect of the gas exposure.
• After temperature life, contact samples with CPCs exhibited higher LSLCR values than
the control samples, and the minimal change would not adversely affect electrical signal transfer.
• After temperature life, contact resistance increased by approximately 14, 27, and 128
percent for So Sure Green, ACF-50 and Super Corr-B samples, respectively. The Super Corr-B samples exceeded the maximum specification requirement, indicating that the transfer of electrical signals could be compromised by the higher resistance.
• Compared to the control samples, contacts treated with CPCs had higher contact
engagement forces prior to temperature life testing. After temperature life testing, the ACF-50 and So Sure Green samples exhibited higher engagement forces, but the Super Corr-B samples had lower values than the control samples.
• Periodic reapplication of ACF-50 and So Sure Green causes engagement forces to
approach or exceed the maximum allowed, due to build-up of the CPC and the presence of contamination.
• The separation forces of all samples decreased after thermal exposure; however, the
forces of the samples treated with ACF-50 decreased less than the others. All samples exceeded the minimum force, indicating that sufficient mechanical contact was being maintained.
5.4 Insulation materials – Test Group G
• Wire insulation was not significantly affected by exposure to CPCs.
• So Sure Green caused wrinkling and swelling of the polyolefin sleeving, which causes greater susceptibility to abrasion damage at the high points.
• The ACF-50 caused black particulate to leach from the polyolefin and polychloroprene
sleeving materials, indicating that a breakdown of the material had initiated.
• The insulation resistance of the wires decreased, but all of the specimens met the IR and DWV requirements after immersion.
CPCs had varying effects on the fluorocarbon based insulation types (ETFE,
XLETFE, PI/PTFE, and PTFE). So Sure Green caused a moderate decrease of the ETFE and PI/PTFE specimens, and ACF-50 caused a significant decrease for
45
CPC Effect on Aircraft Electrical Wiring Components TR285HN301 Final Report Revision: -
ETFE. Water affected the IR of the PI/PTFE specimens more than the PTFE control sample.
Two of the polyimide based insulation materials, Poly-X and PI/PTFE, were
affected by the short-term presence of water. The Poly-X was moderately affected by ACF-50, while the PI/PTFE was moderately affected by the So Sure Green.
The polychloroprene and polyolefin sleeving types were significantly affected by
both So Sure Green and ACF-50, but not by SCB.
PVC/glass/nylon was moderately affected by the ACF-50, but only slightly affected by the other CPCs.
Crosslinked polyalkene was moderately affected by water, but only slightly affected
by the CPCs.
• Changes in the electrical characteristics of the wire insulation types are minimal following short term CPC exposure.
• The polyolefin and polychloroprene sleeving present some mechanical concerns with
the softening of the material. • The CPCs had little effect on the manufacturer’s markings on the wire insulations.
46

CPC Effect on Aircraft Electrical Wiring Components TR285HN301 Final Report Revision: -
6.0 Recommendations • Avoid the use of a CPC on electrical connector interfaces. The contact plating provides
sufficient corrosion protection. • Based upon the testing performed, Super Corr-B (MIL-L-87177) is recommended if a
CPC is used on wiring systems since it did not detrimentally affect the wiring components, provides some corrosion protection, and the findings from the MIL-C-81309 CPCs (SSG and ACF-50) were inconsistent.
• Consider the potential effects of CPCs to the circuits and wiring components during
design, installation of wiring in the aircraft, and maintenance operations. • Users should consider whether an increase in corrosion protection would outweigh the
potential risk of affected signal transfer from an increase in contact resistance.
• Change the aircraft maintenance manuals to caution against spraying of SSG or ACF-50 on polyolefin and polychloroprene sleeving.
6.1 Additional Testing Recommendations.
• Perform field tests to determine whether the use of MIL-L-87177 reduces maintenance costs.
• Test mating and unmating forces after high temperature exposure and prior to humidity
to verify whether one or both environments contributed to the higher values. • Further investigate whether certain plating systems are more adversely affected by
CPCs. • Perform contact insertion and removal forces after high temperature testing to
determine the effect of CPCs on maintenance operations involving the replacement of wired contacts.
• Perform additional shell conductivity testing after extended duration at high
temperature to further investigate the effect of baked-on CPCs.
• More accurately assess changes in the Shore hardness of grommet materials conditioned with a CPC by testing solid blocks of the materials rather than inserts that have contact cavities and are captive in a shell.
47
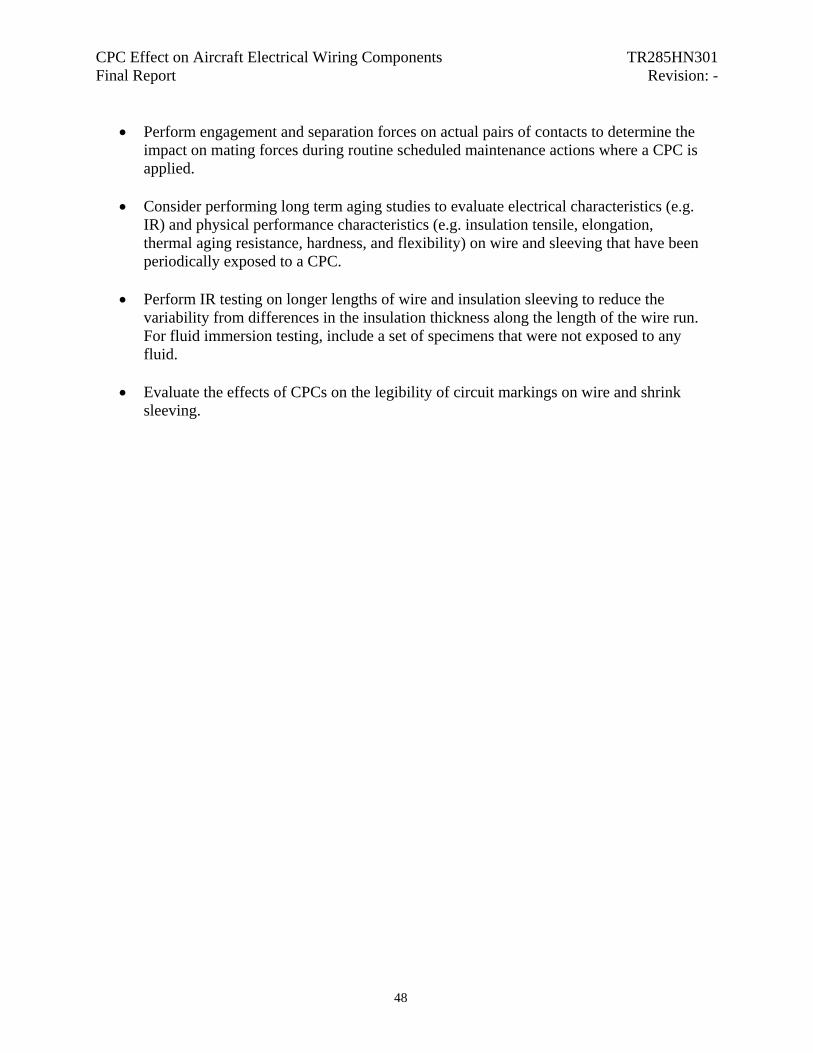
CPC Effect on Aircraft Electrical Wiring Components TR285HN301 Final Report Revision: -
• Perform engagement and separation forces on actual pairs of contacts to determine the impact on mating forces during routine scheduled maintenance actions where a CPC is applied.
• Consider performing long term aging studies to evaluate electrical characteristics (e.g.
IR) and physical performance characteristics (e.g. insulation tensile, elongation, thermal aging resistance, hardness, and flexibility) on wire and sleeving that have been periodically exposed to a CPC.
• Perform IR testing on longer lengths of wire and insulation sleeving to reduce the
variability from differences in the insulation thickness along the length of the wire run. For fluid immersion testing, include a set of specimens that were not exposed to any fluid.
• Evaluate the effects of CPCs on the legibility of circuit markings on wire and shrink
sleeving.
48

CPC Effect on Aircraft Electrical Wiring Components TR285HN301 Final Report Revision: -
Appendix A. Review of previous reports
49

CPC Effect on Aircraft Electrical Wiring Components TR285HN301 Final Report Revision: -
1. Battelle Report 1996: “Evaluation of Lubricant Effectiveness for Corrosion Protection and Improved Reliability of Electrical and Electronic Connectors” Problem: Electrical and electronic connectors as used by the military may experience degradation by thin film corrosion reactions in actual operational environments. Laboratories and field studies have shown that thin corrosion films can produce system failures including the intermittent/glitch/no-fault-found and failure-without-warning conditions. Possible Solution: It is known that lubricants can reduce corrosion rates in adverse environments and greatly reduce the degradation mechanism known as fretting corrosion. It is believed that wider applications of connector lubrication technology within the military can provide significant benefits. Issues:
• Lack of comprehensive field and laboratory data relating to long-term performance to lubricant type and to define the incremental benefits/performance enhancement versus perceived risks.
• Lack of well defined specifications/performance criteria for the qualification of connector lubricant systems, particularly for military applications.
Reason for Study: Air Force weapon systems are experiencing a high degree of Can Not Duplicate (CND’s), Bench-Check Serviceable (BCS), and Retest Okay (RETOK) rates. Prime candidate for such deficiencies can be traced to corrosion between connectors. Cost Savings: Savings in man-hours can be directly related to the reduction of corrosion between electronics connectors. Requirements:
• If lubricants were applied on electrical components or systems, would not promote degradation or risks.
• It would demonstrate that a high degree of corrosion inhibition could be achieved compared to the unlubricated condition.
• There should be a demonstration that lubricant technology would be implemented in military operating environments which processes pose no known health or environmental risks.
Experiment: Two lubricant standards: MIL-C-81309 and MIL-L-87177
• 12 different lubricants: 9 from 81309, 2 from 87177 and 1 commercial • Lubricants on gold plated electrical connectors • Field tests on 10 different sites for long term corrosion • Laboratory tests
Objectives:
• Conduct screening qualification of the 12 lubricants
50
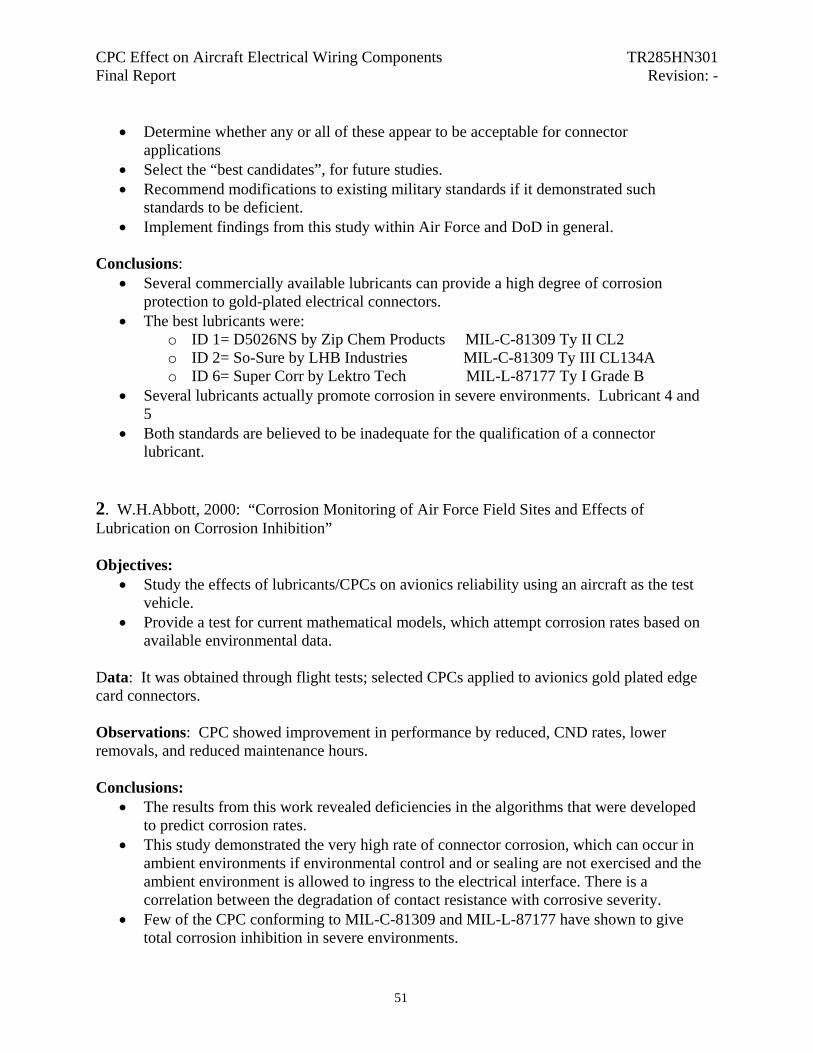
CPC Effect on Aircraft Electrical Wiring Components TR285HN301 Final Report Revision: -
• Determine whether any or all of these appear to be acceptable for connector applications
• Select the “best candidates”, for future studies. • Recommend modifications to existing military standards if it demonstrated such
standards to be deficient. • Implement findings from this study within Air Force and DoD in general.
Conclusions:
• Several commercially available lubricants can provide a high degree of corrosion protection to gold-plated electrical connectors.
• The best lubricants were: o ID 1= D5026NS by Zip Chem Products MIL-C-81309 Ty II CL2 o ID 2= So-Sure by LHB Industries MIL-C-81309 Ty III CL134A o ID 6= Super Corr by Lektro Tech MIL-L-87177 Ty I Grade B
• Several lubricants actually promote corrosion in severe environments. Lubricant 4 and 5
• Both standards are believed to be inadequate for the qualification of a connector lubricant.
2. W.H.Abbott, 2000: “Corrosion Monitoring of Air Force Field Sites and Effects of Lubrication on Corrosion Inhibition” Objectives:
• Study the effects of lubricants/CPCs on avionics reliability using an aircraft as the test vehicle.
• Provide a test for current mathematical models, which attempt corrosion rates based on available environmental data.
Data: It was obtained through flight tests; selected CPCs applied to avionics gold plated edge card connectors. Observations: CPC showed improvement in performance by reduced, CND rates, lower removals, and reduced maintenance hours. Conclusions:
• The results from this work revealed deficiencies in the algorithms that were developed to predict corrosion rates.
• This study demonstrated the very high rate of connector corrosion, which can occur in ambient environments if environmental control and or sealing are not exercised and the ambient environment is allowed to ingress to the electrical interface. There is a correlation between the degradation of contact resistance with corrosive severity.
• Few of the CPC conforming to MIL-C-81309 and MIL-L-87177 have shown to give total corrosion inhibition in severe environments.
51

CPC Effect on Aircraft Electrical Wiring Components TR285HN301 Final Report Revision: -
• It also revealed deficiencies on many of the commercial established CPCs, which are presently qualified to these specifications. The specs need to be upgraded to a more extensive and realistic evaluation for electronics applications.
• Cost savings could be up to several hundred million dollars. 3. David Horne, 2000: “Catastrophic Uncommanded Closures of Engine Feedline Fuel Valve from Corroded Electrical Connectors” Conclusion:
• Fretting corrosion and galvanic corrosion has been identified as sources of connector corrosion.
• MIL-L-87177 Grade B on the tin plated pins was effective in restoring the conductivity and preventing continued corrosion. It demonstrated 16% improved mission capable rate.
• Millions of dollars saved. 4. James Hanlon, 2000: “MIL-L-87177 and a Commercial Lubricant Improve Electrical connector fretting corrosion behavior” Study: Fretting research project on nano-miniature connectors. Data: 12 different connectors were fretted at 50 microns and 30 hertz under various lubricant conditions. Conclusions:
• Nano-miniature connectors fretted without lubricant are highly susceptible to fretting corrosion. With CR >0.5ohms fretting was detected from 2341 – 45,238 cycles. As fretting continued CR increased to over 100,000 ohms.
• Nano-miniature connectors fretted with MIL-L-87177 lubricant were detected from 430,000 –20million cycles. CR did not exceed 12 ohms until end of life with a CR of 10,000 ohms.
5. W.H.Abbot, 1998: “Final Report: Evaluation of Lubricants for Corrosion Inhibition on Electrical Connectors” Objectives:
• Address the issue of whether the nature of the volatile lubricant carrier has any effect on corrosion inhibition/contact performance.
• Evaluate the effects of the concentration of active lubricant in a volatile carrier. Ideal the minimal amount possible that would achieve corrosion inhibition.
52

CPC Effect on Aircraft Electrical Wiring Components TR285HN301 Final Report Revision: -
Lubricant: MIL-L-87177 bulk liquid form was used for this study. Data:
• Same Lubricant, different concentrations: 0,5,10,20 % in HCFC 141b • Tests: Concentration effects, corrosion study, thermal aging
Results:
• Corrosion: after 5 days of exposure you would see degradation on all samples but HCFC 141b was the best choice of solvent higher than 5%
• Concentration effects: Only the 20% concentration was effective in providing corrosion protection through 20 days exposure.
• Thermal Aging: It provided high degree of assurance that the lubricant will not suffer long-term degradation and will retain a high degree of corrosion inhibition after long-term aging. Same correlation as the concentration the higher concentration the better.
Conclusions: 20% solution of an MIL-L-87177 in HCFC 141b will be capable of providing long-term corrosion protection. 6. W.H.Abbot, 2000: “Effects of Lubrication on the reliability of Electrical Connectors” Conclusions:
• The results would lead to the recommendation of a lubricant concentration in the range of 20 weight percent MIL-L-87177 HCFC 141b volatile carrier.
• The present results indicate that it should be possible to conduct soldering operations on lubricated connectors with no adverse effects.
• The data showed that this type of lubricant cannot be reliably used at long-term temperatures much above 100-105 C. While it is possible that somewhat higher temperatures could be tolerated, it was clear that exposures at 125 C are beyond the capabilities of this lubricant type.
7. Bryan Balazs, 2000: “Assessment of compatibility issues associated with the use of electrical connector lubricant MIL-L-87177A” Conclusions: They do not foresee any detrimental compatibility issues, although it was suggested that a rigorous set of compatibility tests involving this lubricant system with appropriate materials would increase the confidence that there are no negative issues associated with the use of this lubricant.
53
CPC Effect on Aircraft Electrical Wiring Components TR285HN301 Final Report Revision: -
54
Appendix B. Test Protocols
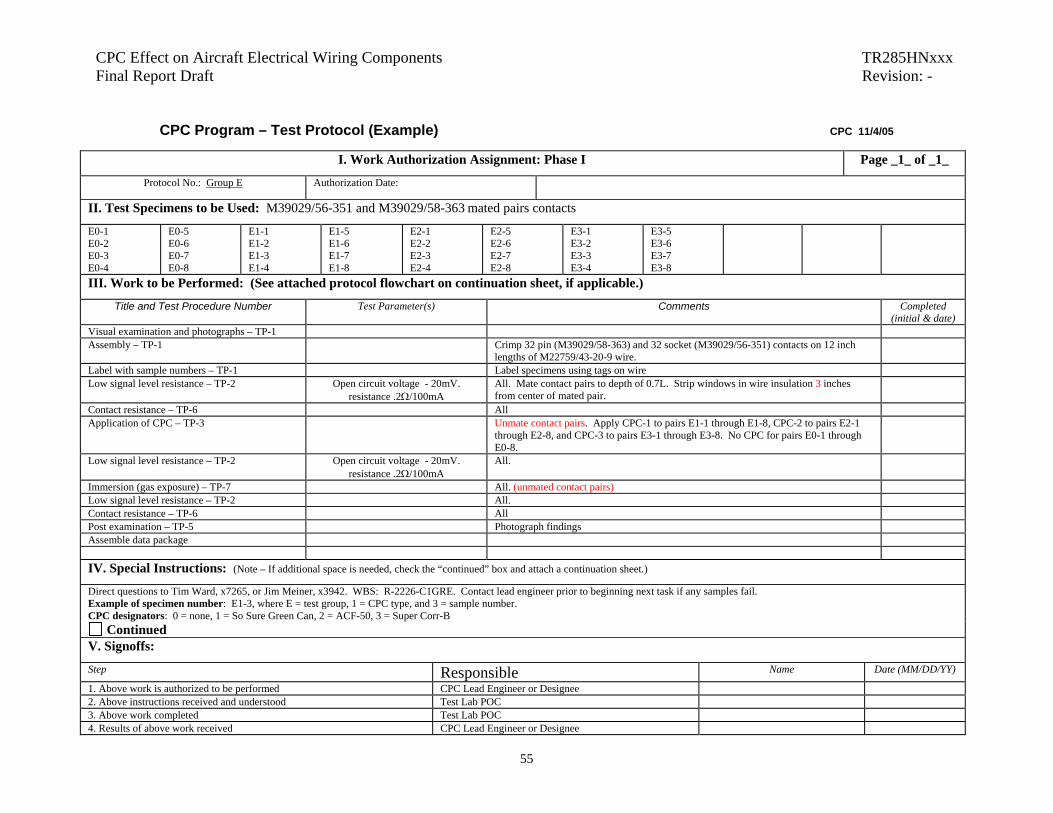
ffect on Aircraft Electrical Wiring Components TR285HNxxx Report Draft Revision: -
55
CPC Program – Test Protocol (Example) CPC 11/4/05
I. Work Authorization Assignment: Phase I Page _1_ of _1_
Protocol No.: Group E Authorization Date:
II. Test Specimens to be Used: M39029/56-351 and M39029/58-363 mated pairs contacts
E0-1 E0-2 E0-3 E0-4
E0-5 E0-6 E0-7 E0-8
E1-1 E1-2 E1-3 E1-4
E1-5 E1-6 E1-7 E1-8
E2-1 E2-2 E2-3 E2-4
E2-5 E2-6 E2-7 E2-8
E3-1 E3-2 E3-3 E3-4
E3-5 E3-6 E3-7 E3-8
III. Work to be Performed: (See attached protocol flowchart on continuation sheet, if applicable.)
Title and Test Procedure Number Test Parameter(s) Comments Completed (initial & date)
Visual examination and photographs – TP-1 Assembly – TP-1 Crimp 32 pin (M39029/58-363) and 32 socket (M39029/56-351) contacts on 12 inch
lengths of M22759/43-20-9 wire.
Label with sample numbers – TP-1 Label specimens using tags on wire Low signal level resistance – TP-2 Open circuit voltage - 20mV.
resistance .2Ω/100mA All. Mate contact pairs to depth of 0.7L. Strip windows in wire insulation 3 inches from center of mated pair.
Contact resistance – TP-6 All Application of CPC – TP-3 Unmate contact pairs. Apply CPC-1 to pairs E1-1 through E1-8, CPC-2 to pairs E2-1
through E2-8, and CPC-3 to pairs E3-1 through E3-8. No CPC for pairs E0-1 through E0-8.
Low signal level resistance – TP-2 Open circuit voltage - 20mV. resistance .2Ω/100mA
All.
Immersion (gas exposure) – TP-7 All. (unmated contact pairs) Low signal level resistance – TP-2 All. Contact resistance – TP-6 All Post examination – TP-5 Photograph findings Assemble data package IV. Special Instructions: (Note – If additional space is needed, check the “continued” box and attach a continuation sheet.)
Direct questions to Tim Ward, x7265, or Jim Meiner, x3942. WBS: R-2226-C1GRE. Contact lead engineer prior to beginning next task if any samples fail. Example of specimen number: E1-3, where E = test group, 1 = CPC type, and 3 = sample number. CPC designators: 0 = none, 1 = So Sure Green Can, 2 = ACF-50, 3 = Super Corr-B
Continued V. Signoffs:
Step Responsible Name Date (MM/DD/YY)
1. Above work is authorized to be performed CPC Lead Engineer or Designee 2. Above instructions received and understood Test Lab POC 3. Above work completed Test Lab POC 4. Results of above work received CPC Lead Engineer or Designee
CPC EFinal

CPC Effect on Aircraft Electrical Wiring Components TR285HNxxx Final Report Draft Revision: -
Appendix C. Test procedures
56

CPC Effect on Aircraft Electrical Wiring Components TR285HNxxx Final Report Draft Revision: -
The following summarize each of the test procedures used in this test program. Each test procedure was based upon standard industry test methods, and provide step-by-step guidance to perform the test, along with a standardized test data sheet to record the results. TP-1 Visual examination and assembly. Provides guidance for cutting, stripping, and crimping wired contacts, installing contacts in connectors, preparing wire and insulation sleeve samples, installing braided shields onto connector accessories, inspecting samples to ensure compliance with marking and workmanship requirements, labeling, and photographing the baseline condition of each component type to be tested. Wired contacts from Groups D, E, and F were crimped on 12 inch lengths of wire. Contacts installed in connectors in Groups A, B, and C were crimped on 12 or 36 inch lengths of wire, and the wire and insulation sleeving samples in Group G were 24 inches in length. A six inch length of braided shield was attached to each connector accessory sample in Group B using the designated band and tool. Sample identification numbers were applied by either a paint pen or a tape label. TP-2 Low signal level contact resistance. Evaluates contact resistance characteristics of electrical contacts size 16 and smaller under conditions where applied voltages and currents do not alter the physical contact interface or modify the nonconductive oxide films that may be present. The contacts were mated to either a depth of 0.7L per AS39029, or to the depth that resulted from fully mating the connector halves in which the contacts were installed. Measurement leads were placed six inches apart, and a 1KHz low voltage signal (20mV max) was applied. The average of the forward and reverse resistance measurements was recorded. TP-3 Application of Corrosion Preventative Compounds (CPCs). Provides guidance for the application of CPC on wired contacts, connectors, connector accessories, and insulation materials (sleeves and wires). The CPCs were sprayed on the test samples. TP-4 Long term exposure to inside environment. Evaluates the susceptibility of contacts sprayed with CPCs to collect contaminants when exposed to an environment that simulates long-term storage conditions. Temperature and humidity conditions were monitored throughout the nine month test, and periodic low signal level contact resistance measurements were performed. Contacts were unmated during the long-term storage exposure. TP-6 Contact resistance. Measures the contact resistance between a mated pin and socket contact. The pairs of contacts were mated to a depth of 0.7L as shown in Figure 5 of AS39029, or to the depth that resulted from fully mating the connector halves in which the contacts were installed. A test current of 7.5 amps was applied to the ends of the 20-gauge wires. Measurement leads were placed six inches apart, with readings in the forward and reverse directions being recorded. TP-7 Immersion (gas exposure). Ensures that unmated contacts will withstand industrial gas conditioning without defects detrimental to the mechanical or electrical performance. The unmated test samples were placed on a non-corrosive rack in a closed glass chamber having a volume 2 cubic feet maximum. A 10% solution of sulfurated potash NF was placed in distilled water. The contacts were not immersed in the solution, but were exposed to the sulfide vapor.
57

CPC Effect on Aircraft Electrical Wiring Components TR285HNxxx Final Report Draft Revision: -
The test samples were exposed to the sulfide vapor for a total of 100 hours, and then visually inspected for damage or physical anomalies, such as pitting and exposure of the base metals. TP-8 Contact engagement and separation force. Measures the force necessary for a socket contact to engage with and separate from a defined test. From the SAE AS31971 specification sheet, the proper gauge pins were identified for the size 20 contacts being tested. The socket was mounted in a suitable fixture on the movable table of the test stand. The applicable pin gauge was held in a chuck attached to the Chatillon Force Gauge. The force gauge was mounted on a test stand. For the engagement test, the maximum diameter gauge pin was clamped in the chuck. The stand table was slowly moved until the test pin was inserted into the socket a minimum of 0.7L per Figure 5 of AS39029. For the separation test, the minimum diameter gauge was clamped in the chuck, and the test pin was inserted in the socket a minimum of 0.7L. The table was slowly lower to remove the test pin. TP-9 Temperature life. Evaluates mechanical and electrical performance of electrical contacts where temperature conditioning is applied. The sample contact pairs were mated to a depth of 0.7L as specified in Figure 5 of AS39029. The samples were secured in ceramic wire holders and placed the in an oven. The samples were subjected to 1,000 hours of exposure at 200°C (for class B contacts). Following the high temperature exposure, the samples were removed from the chamber and inspected for evidence of base metal exposure (diffusion/migration of the base metal through the contact outer plating) and defects detrimental to mechanical or electrical performance. TP-10 Immersion test sequence: To determine the ability of a sample and the materials from which it is made to withstand exposure to various CPCs and handling conditions without deterioration of physical and electrical properties.
Cut twelve 24-inch sample lengths for each insulation type. Measure diameter of wire and sleeving specimens and calculate percent swell. For each specimen, the area to be measured was straightened and placed between the jaws. The jaws were tightened until the first click so as to not deform the specimen. Measurements were taken in two different axes of the specimens, 90° apart, and on three different areas along the length of each wire specimen. The average of the six measurements was calculated and recorded. For the sleeving, three measurements were also taken on each end to determine the average thickness of the sleeving. Bend stress (static) conditioning. For each specimen, a bend radius, that was 16 ± 2 times the measurement of the outer diameter, was placed on the center portion of the specimen. Sufficient length was left on the ends of each specimen to allow at least 2 inches of wire to remain out of the immersion fluid. Immersion at temperature. Specimens were immersed in one of the CPCs, or water for CPC type 0, at 60C for 20 hours. At least two inches of the specimen remained out of the fluid.
58
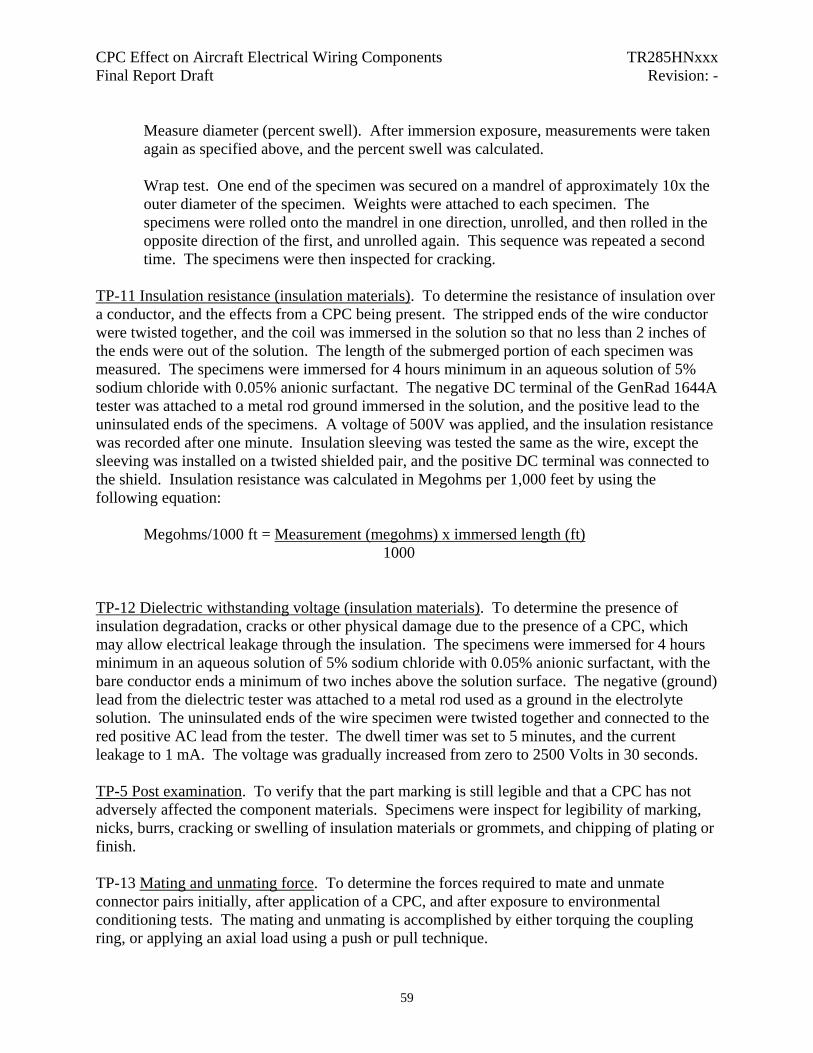
CPC Effect on Aircraft Electrical Wiring Components TR285HNxxx Final Report Draft Revision: -
Measure diameter (percent swell). After immersion exposure, measurements were taken again as specified above, and the percent swell was calculated. Wrap test. One end of the specimen was secured on a mandrel of approximately 10x the outer diameter of the specimen. Weights were attached to each specimen. The specimens were rolled onto the mandrel in one direction, unrolled, and then rolled in the opposite direction of the first, and unrolled again. This sequence was repeated a second time. The specimens were then inspected for cracking.
TP-11 Insulation resistance (insulation materials). To determine the resistance of insulation over a conductor, and the effects from a CPC being present. The stripped ends of the wire conductor were twisted together, and the coil was immersed in the solution so that no less than 2 inches of the ends were out of the solution. The length of the submerged portion of each specimen was measured. The specimens were immersed for 4 hours minimum in an aqueous solution of 5% sodium chloride with 0.05% anionic surfactant. The negative DC terminal of the GenRad 1644A tester was attached to a metal rod ground immersed in the solution, and the positive lead to the uninsulated ends of the specimens. A voltage of 500V was applied, and the insulation resistance was recorded after one minute. Insulation sleeving was tested the same as the wire, except the sleeving was installed on a twisted shielded pair, and the positive DC terminal was connected to the shield. Insulation resistance was calculated in Megohms per 1,000 feet by using the following equation:
Megohms/1000 ft = Measurement (megohms) x immersed length (ft)
1000 TP-12 Dielectric withstanding voltage (insulation materials). To determine the presence of insulation degradation, cracks or other physical damage due to the presence of a CPC, which may allow electrical leakage through the insulation. The specimens were immersed for 4 hours minimum in an aqueous solution of 5% sodium chloride with 0.05% anionic surfactant, with the bare conductor ends a minimum of two inches above the solution surface. The negative (ground) lead from the dielectric tester was attached to a metal rod used as a ground in the electrolyte solution. The uninsulated ends of the wire specimen were twisted together and connected to the red positive AC lead from the tester. The dwell timer was set to 5 minutes, and the current leakage to 1 mA. The voltage was gradually increased from zero to 2500 Volts in 30 seconds. TP-5 Post examination. To verify that the part marking is still legible and that a CPC has not adversely affected the component materials. Specimens were inspect for legibility of marking, nicks, burrs, cracking or swelling of insulation materials or grommets, and chipping of plating or finish. TP-13 Mating and unmating force. To determine the forces required to mate and unmate connector pairs initially, after application of a CPC, and after exposure to environmental conditioning tests. The mating and unmating is accomplished by either torquing the coupling ring, or applying an axial load using a push or pull technique.
59
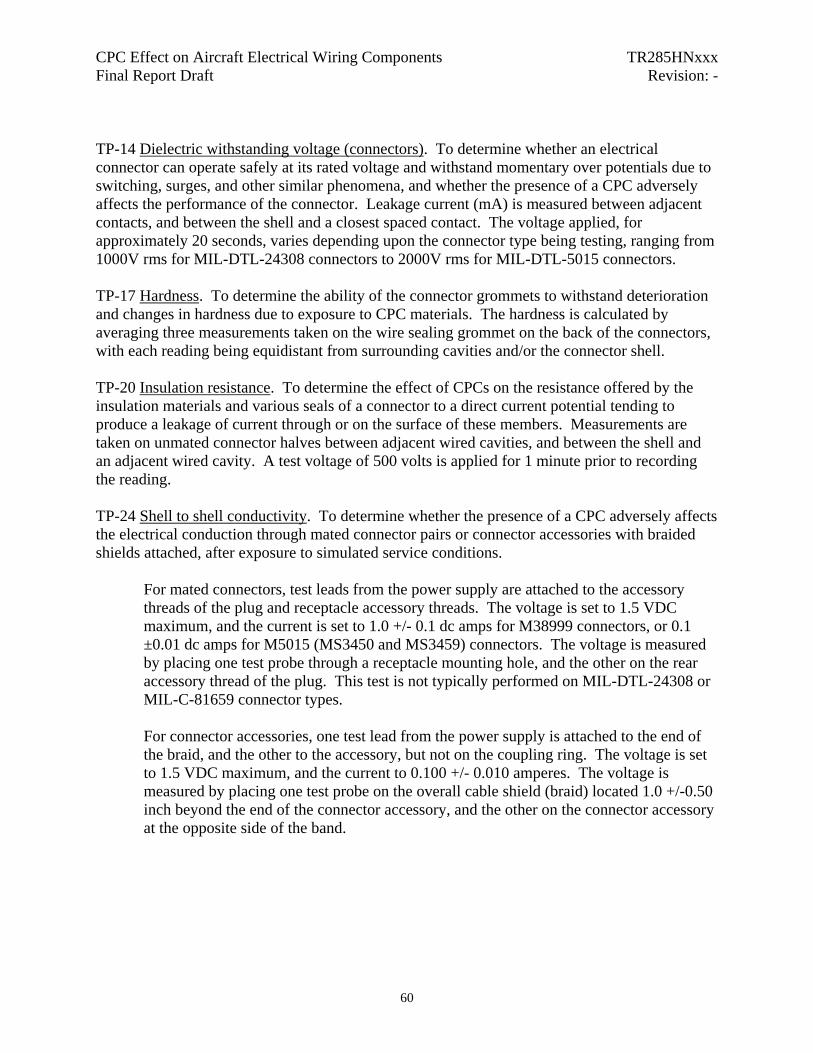
CPC Effect on Aircraft Electrical Wiring Components TR285HNxxx Final Report Draft Revision: -
TP-14 Dielectric withstanding voltage (connectors). To determine whether an electrical connector can operate safely at its rated voltage and withstand momentary over potentials due to switching, surges, and other similar phenomena, and whether the presence of a CPC adversely affects the performance of the connector. Leakage current (mA) is measured between adjacent contacts, and between the shell and a closest spaced contact. The voltage applied, for approximately 20 seconds, varies depending upon the connector type being testing, ranging from 1000V rms for MIL-DTL-24308 connectors to 2000V rms for MIL-DTL-5015 connectors. TP-17 Hardness. To determine the ability of the connector grommets to withstand deterioration and changes in hardness due to exposure to CPC materials. The hardness is calculated by averaging three measurements taken on the wire sealing grommet on the back of the connectors, with each reading being equidistant from surrounding cavities and/or the connector shell. TP-20 Insulation resistance. To determine the effect of CPCs on the resistance offered by the insulation materials and various seals of a connector to a direct current potential tending to produce a leakage of current through or on the surface of these members. Measurements are taken on unmated connector halves between adjacent wired cavities, and between the shell and an adjacent wired cavity. A test voltage of 500 volts is applied for 1 minute prior to recording the reading. TP-24 Shell to shell conductivity. To determine whether the presence of a CPC adversely affects the electrical conduction through mated connector pairs or connector accessories with braided shields attached, after exposure to simulated service conditions.
For mated connectors, test leads from the power supply are attached to the accessory threads of the plug and receptacle accessory threads. The voltage is set to 1.5 VDC maximum, and the current is set to 1.0 +/- 0.1 dc amps for M38999 connectors, or 0.1 ±0.01 dc amps for M5015 (MS3450 and MS3459) connectors. The voltage is measured by placing one test probe through a receptacle mounting hole, and the other on the rear accessory thread of the plug. This test is not typically performed on MIL-DTL-24308 or MIL-C-81659 connector types.
For connector accessories, one test lead from the power supply is attached to the end of the braid, and the other to the accessory, but not on the coupling ring. The voltage is set to 1.5 VDC maximum, and the current to 0.100 +/- 0.010 amperes. The voltage is measured by placing one test probe on the overall cable shield (braid) located 1.0 +/-0.50 inch beyond the end of the connector accessory, and the other on the connector accessory at the opposite side of the band.
60

CPC Effect on Aircraft Electrical Wiring Components TR285HNxxx Final Report Draft Revision: -
Appendix D. Photos
61

CPC Effect on Aircraft Electrical Wiring Components TR285HNxxx Final Report Draft Revision: -
Photos A1a2-3 and A1c2-4, para 4.2.2.2.3. Dried SSG on M38999 class W (left) and class M (right) connectors after high temperature and humidity exposure.
Photo A2d2-1, para 4.2.2.2.3. ACF-50 residue on the threads of an M5015 connector after high temperature and humidity.
62
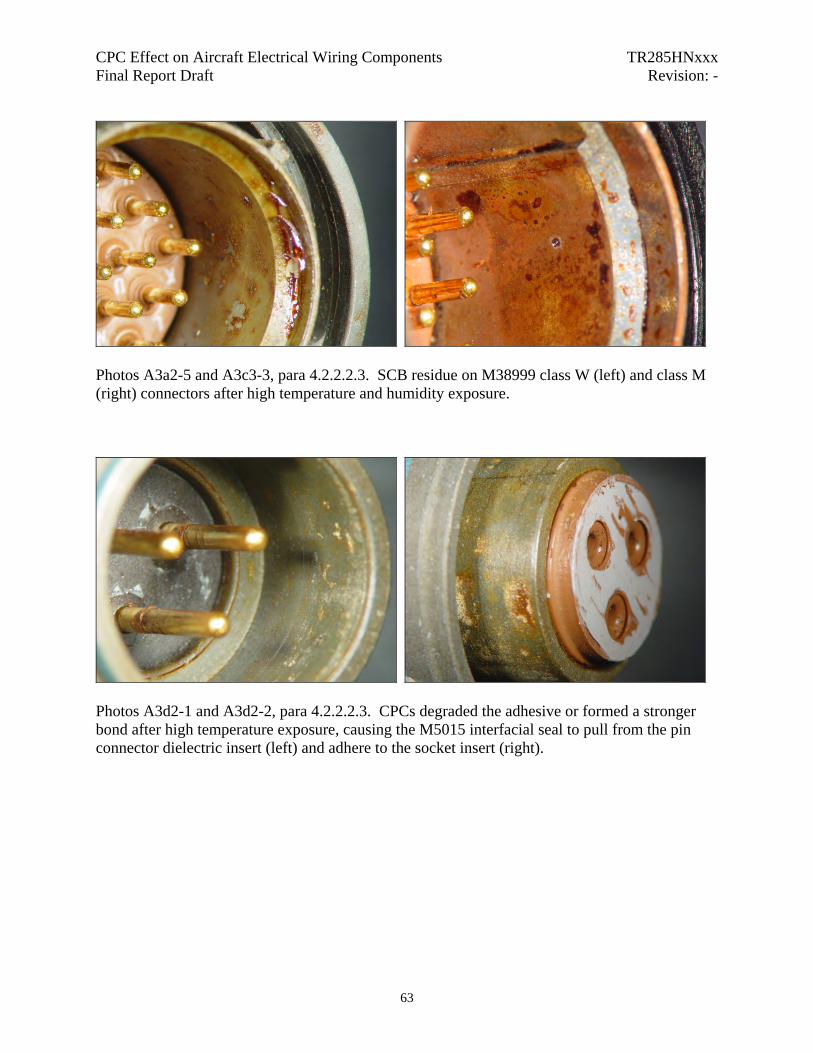
CPC Effect on Aircraft Electrical Wiring Components TR285HNxxx Final Report Draft Revision: -
Photos A3a2-5 and A3c3-3, para 4.2.2.2.3. SCB residue on M38999 class W (left) and class M (right) connectors after high temperature and humidity exposure.
Photos A3d2-1 and A3d2-2, para 4.2.2.2.3. CPCs degraded the adhesive or formed a stronger bond after high temperature exposure, causing the M5015 interfacial seal to pull from the pin connector dielectric insert (left) and adhere to the socket insert (right).
63

CPC Effect on Aircraft Electrical Wiring Components TR285HNxxx Final Report Draft Revision: -
Photos A2a1-2, A2a1-4 para 4.2.2.2.3. Crystallized ACF-50 after high temperature exposure.
Photos A0a1-1, A1a2-1, A2c2-1, and A3a2-1, para 4.2.2.2.3. Sealing towers from interfacial seal of pin connectors adhered to socket inserts after high temperature exposure. (Clockwise from top left: control, SSG, ACF-50, and SCB samples.)
64

CPC Effect on Aircraft Electrical Wiring Components TR285HNxxx Final Report Draft Revision: -
Photos B0a1-4 and B0a1-7. Pitting on the coupling ring flutes and rear accessory threads of an M38999 class W control samples following salt spray.
Photos B1a2-3, B2a1-1. Pitting was observed on the threads and coupling ring of an M38999 class W connector with SSG applied (left). Some discoloration, but no pitting, was noted on the ACF-50 sample (right).
65

CPC Effect on Aircraft Electrical Wiring Components TR285HNxxx Final Report Draft Revision: -
Photos B3a3-7, B3a3-6. M38999 class W sample with SCB applied exhibited flaking plating and pitting of the vase aluminum on the rear accessory threads after salt spray.
Photos B0b1-2, B0b2-1. Pitting of the coupling ring flutes on an M38999 class F control samples after 48 hours of salt spray exposure.
66
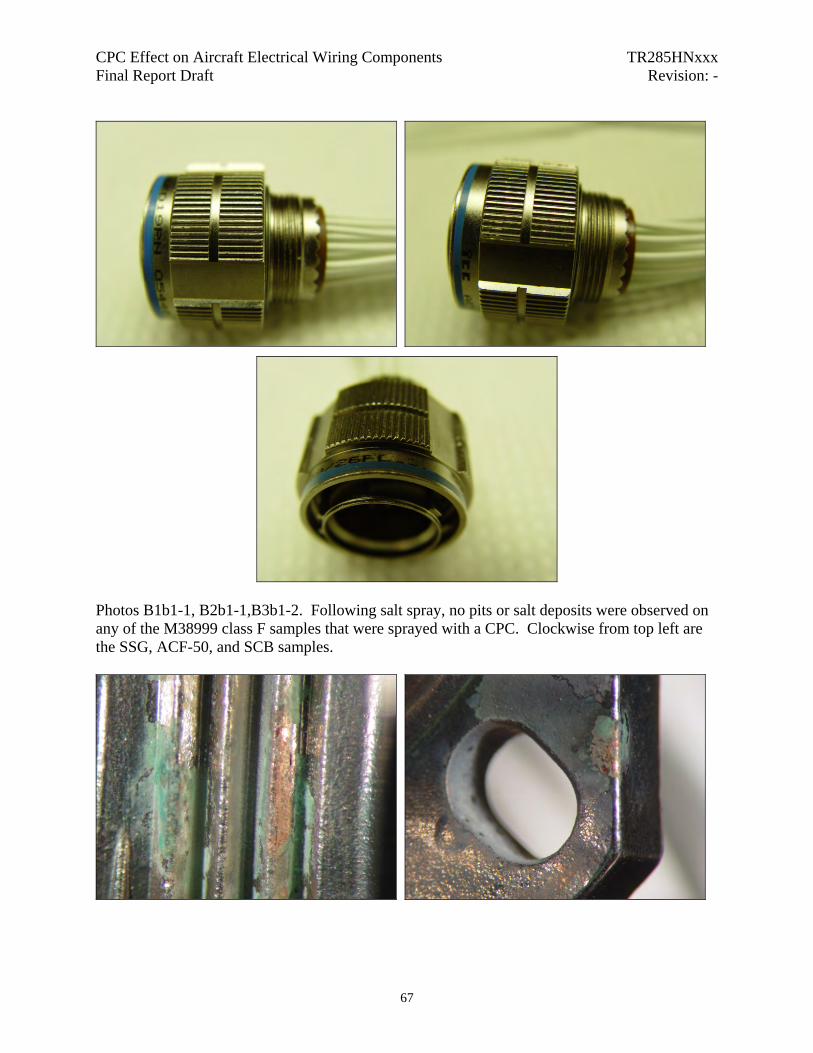
CPC Effect on Aircraft Electrical Wiring Components TR285HNxxx Final Report Draft Revision: -
Photos B1b1-1, B2b1-1,B3b1-2. Following salt spray, no pits or salt deposits were observed on any of the M38999 class F samples that were sprayed with a CPC. Clockwise from top left are the SSG, ACF-50, and SCB samples.
67

CPC Effect on Aircraft Electrical Wiring Components TR285HNxxx Final Report Draft Revision: -
Photos B0c1-3, B0c1-4, B0c1-1. Flaking of plating, and green and white powdery residue was observed on the exterior of the M38999 class M control samples after salt spray exposure.
68
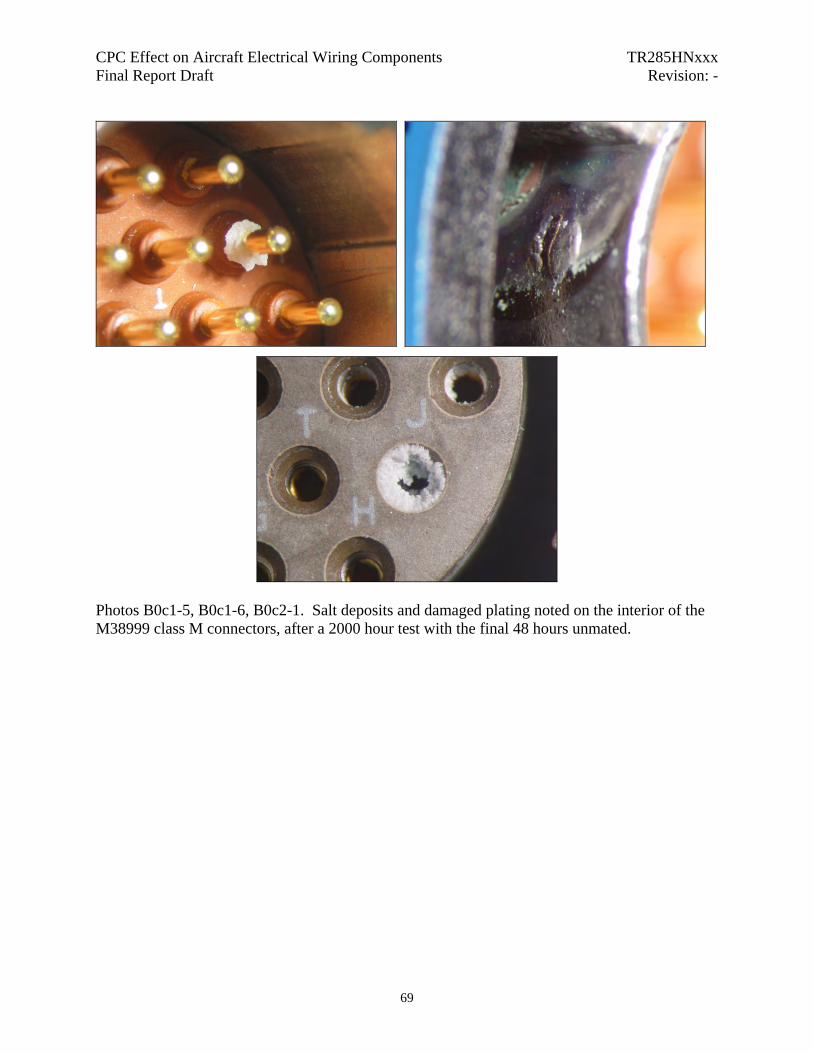
CPC Effect on Aircraft Electrical Wiring Components TR285HNxxx Final Report Draft Revision: -
Photos B0c1-5, B0c1-6, B0c2-1. Salt deposits and damaged plating noted on the interior of the M38999 class M connectors, after a 2000 hour test with the final 48 hours unmated.
69

CPC Effect on Aircraft Electrical Wiring Components TR285HNxxx Final Report Draft Revision: -
Photos B1c1-1, B2c1-1, B3c1-1. The M38999 class M connectors with a CPC applied showed no signs of plating defects or corrosion after 2000 hours of salt spray exposure (clockwise from top left, SSG, ACF-50, and SCB).
70
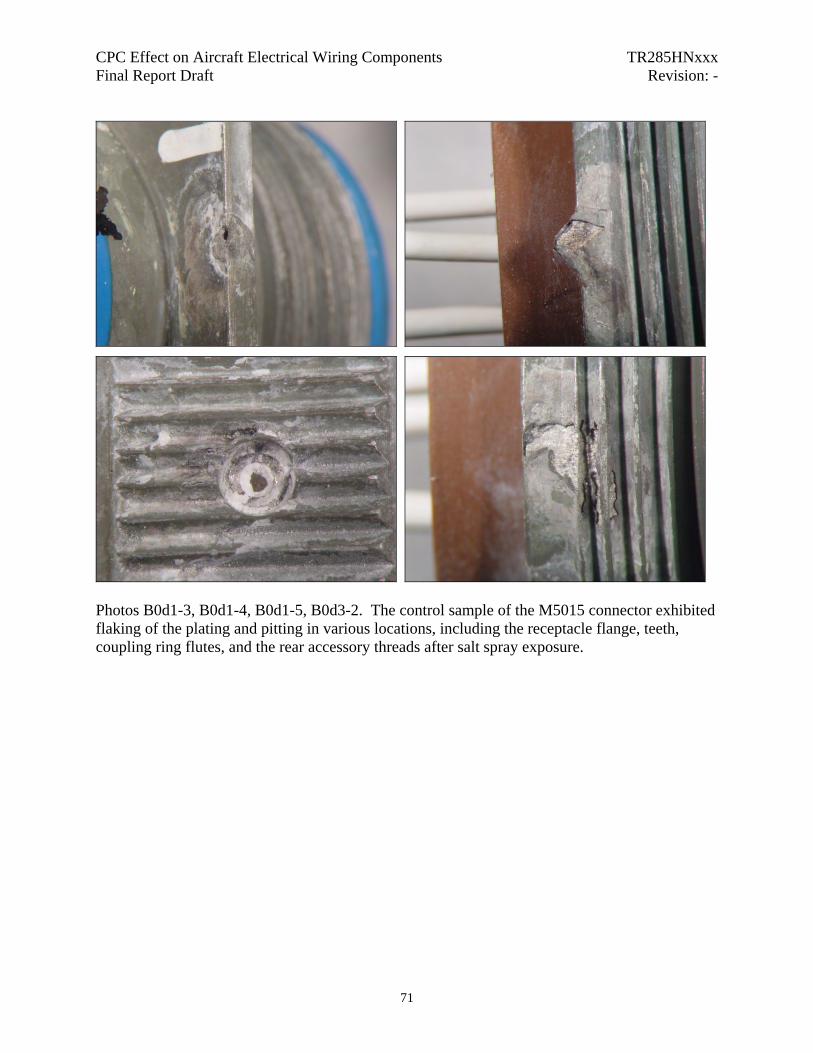
CPC Effect on Aircraft Electrical Wiring Components TR285HNxxx Final Report Draft Revision: -
Photos B0d1-3, B0d1-4, B0d1-5, B0d3-2. The control sample of the M5015 connector exhibited flaking of the plating and pitting in various locations, including the receptacle flange, teeth, coupling ring flutes, and the rear accessory threads after salt spray exposure.
71
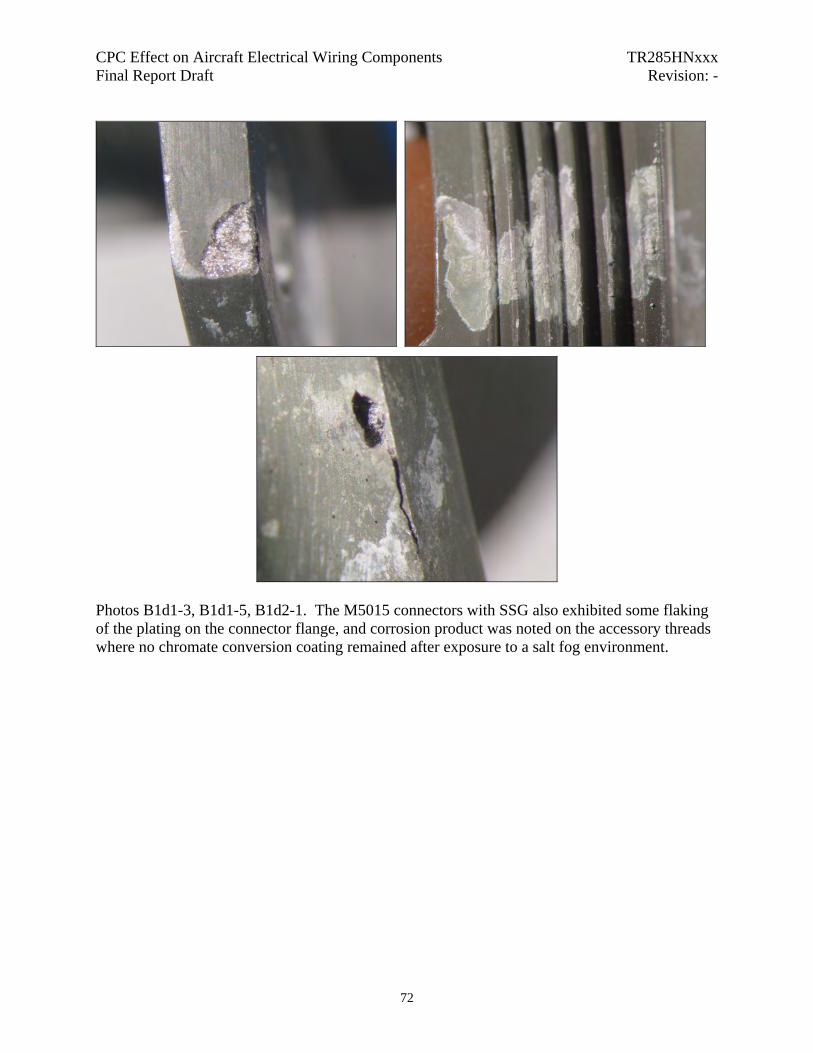
CPC Effect on Aircraft Electrical Wiring Components TR285HNxxx Final Report Draft Revision: -
Photos B1d1-3, B1d1-5, B1d2-1. The M5015 connectors with SSG also exhibited some flaking of the plating on the connector flange, and corrosion product was noted on the accessory threads where no chromate conversion coating remained after exposure to a salt fog environment.
72

CPC Effect on Aircraft Electrical Wiring Components TR285HNxxx Final Report Draft Revision: -
Photo B2d3-1. Following salt spray, the M5015 samples with ACF-50 applied did not exhibit any pitting, but there was no chromate conversion coating remaining in some areas.
Photos B3d1-2, B3d2-3, B3d2-4, B3d3-1. The salt spray test caused the chromate conversion coating to be compromised, and some flaking of plating on the flange of M5015 connectors with SCB applied.
73

CPC Effect on Aircraft Electrical Wiring Components TR285HNxxx Final Report Draft Revision: -
Photo B0e1 ss rev. None of the M24308 samples exhibited any detrimental effects from salt fog exposure. Some small areas of salt deposits or corrosion product was noted on control samples.
Photos B0f1-1, B0f1-2, B0f1-3. The M81659 connector control samples exhibited pitting on the flanges near the polarizing inserts, posts, and mounting strip.
74

CPC Effect on Aircraft Electrical Wiring Components TR285HNxxx Final Report Draft Revision: -
Photos B1f2-1, B1f2-2, B1f2-4. The M81659 samples treated with SSG exhibited pitting on the shell near the polarizing inserts and mounting strip, but not as severely as on the control samples.
75
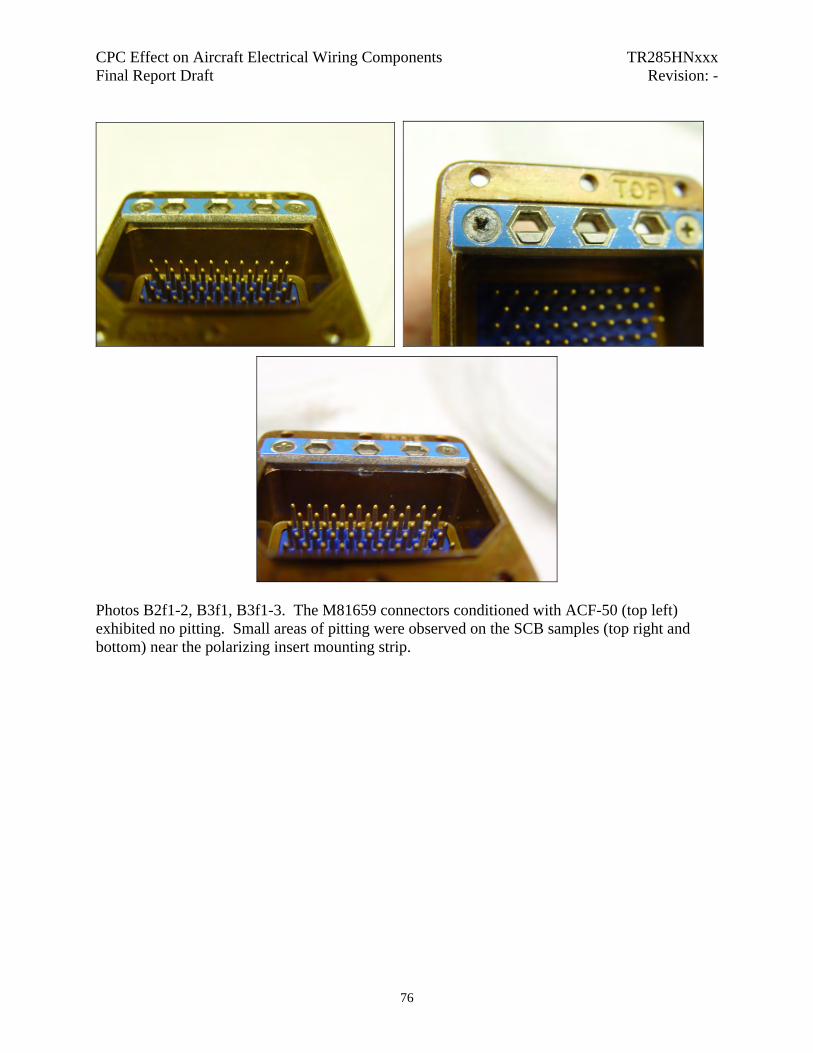
CPC Effect on Aircraft Electrical Wiring Components TR285HNxxx Final Report Draft Revision: -
Photos B2f1-2, B3f1, B3f1-3. The M81659 connectors conditioned with ACF-50 (top left) exhibited no pitting. Small areas of pitting were observed on the SCB samples (top right and bottom) near the polarizing insert mounting strip.
76

CPC Effect on Aircraft Electrical Wiring Components TR285HNxxx Final Report Draft Revision: -
Photos B0g1-4, B0g1-2, B0g1-6. The control samples of the M85049 class W connector accessory assemblies experienced extreme pitting during the salt spray test.
77
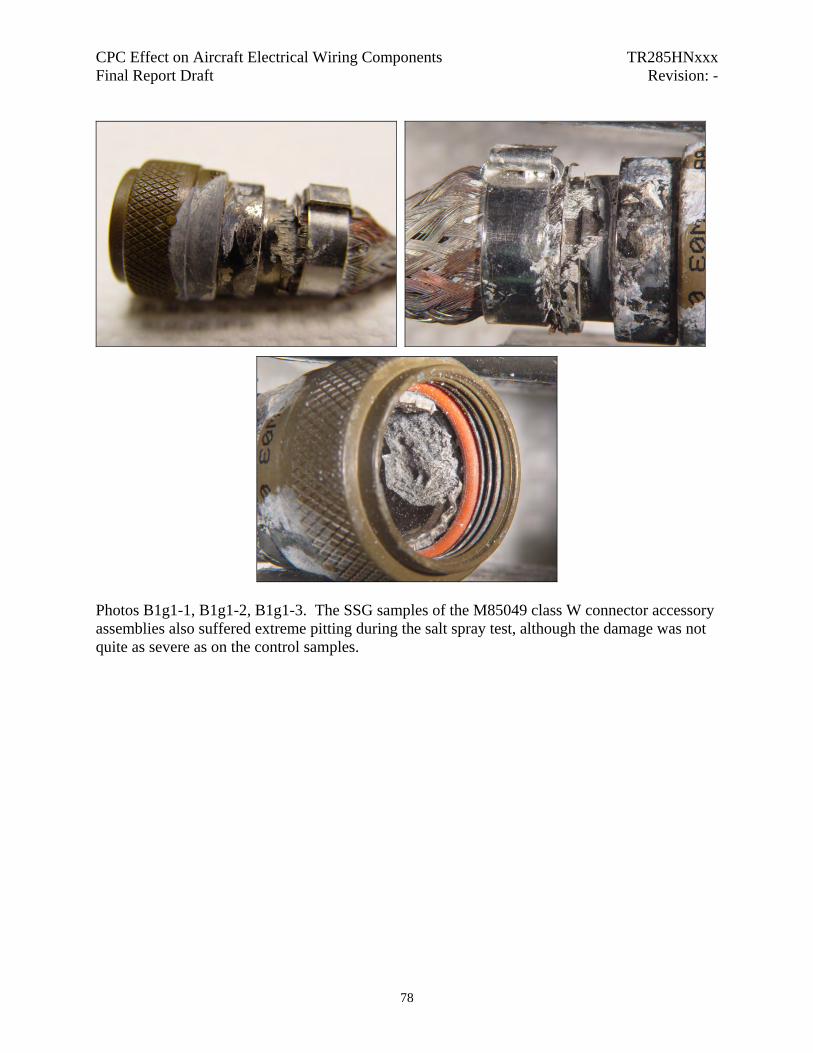
CPC Effect on Aircraft Electrical Wiring Components TR285HNxxx Final Report Draft Revision: -
Photos B1g1-1, B1g1-2, B1g1-3. The SSG samples of the M85049 class W connector accessory assemblies also suffered extreme pitting during the salt spray test, although the damage was not quite as severe as on the control samples.
78
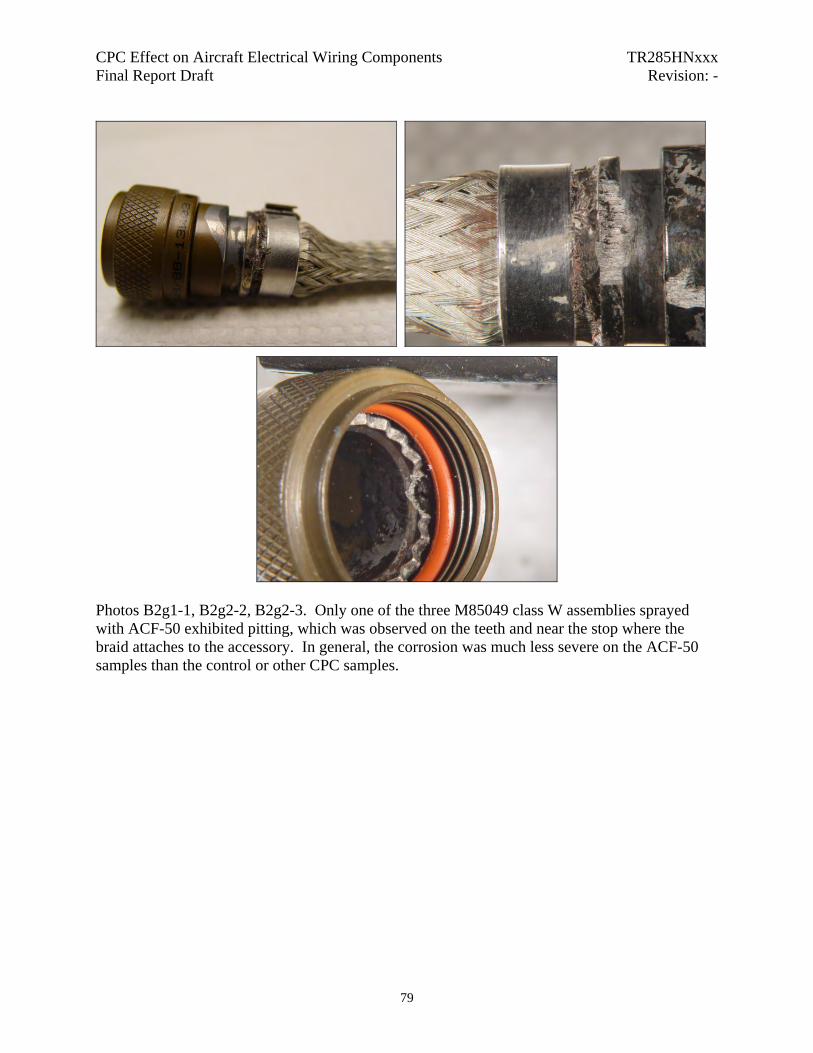
CPC Effect on Aircraft Electrical Wiring Components TR285HNxxx Final Report Draft Revision: -
Photos B2g1-1, B2g2-2, B2g2-3. Only one of the three M85049 class W assemblies sprayed with ACF-50 exhibited pitting, which was observed on the teeth and near the stop where the braid attaches to the accessory. In general, the corrosion was much less severe on the ACF-50 samples than the control or other CPC samples.
79
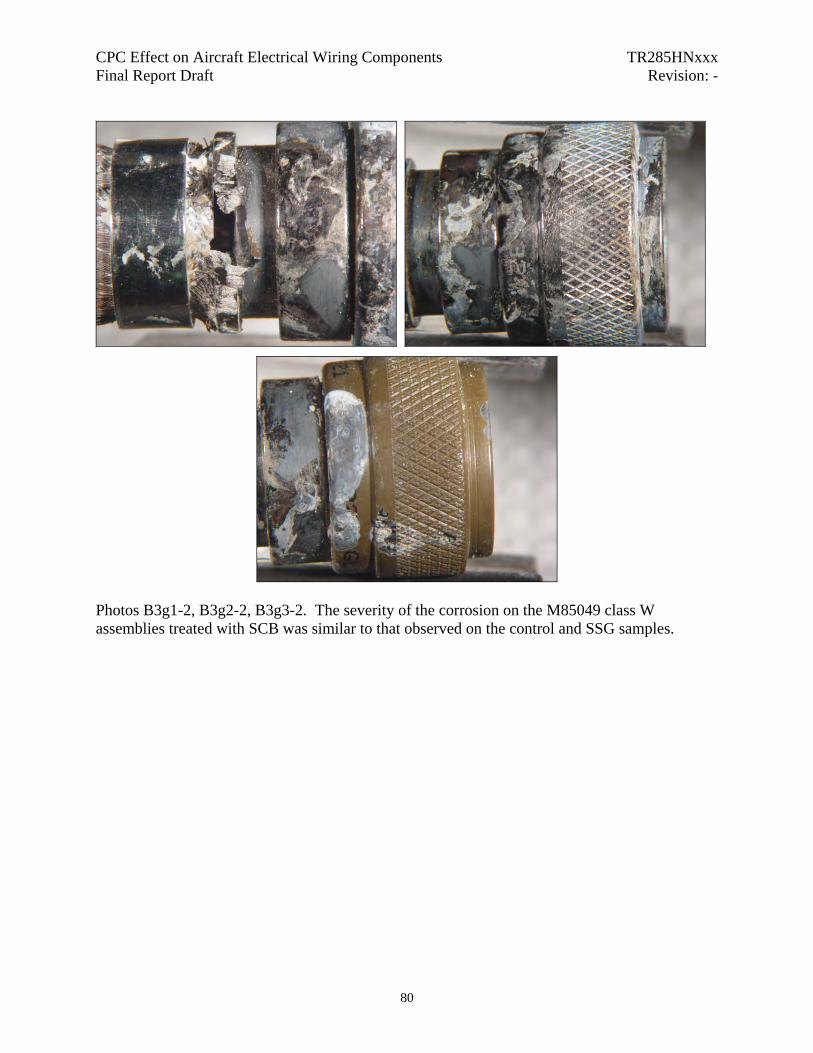
CPC Effect on Aircraft Electrical Wiring Components TR285HNxxx Final Report Draft Revision: -
Photos B3g1-2, B3g2-2, B3g3-2. The severity of the corrosion on the M85049 class W assemblies treated with SCB was similar to that observed on the control and SSG samples.
80

CPC Effect on Aircraft Electrical Wiring Components TR285HNxxx Final Report Draft Revision: -
Photos B0h1-2, B0h1-3. None of the olive drab chromate conversion coating remained on the control samples of the M85049 class J assemblies. The corrosion product or salt deposits could not brushed from the samples.
Photos B1h1-2, B1h1-3. The SSG samples of M85049 assemblies had a similar appearance to the control samples, with no chromate conversion coating remaining, and white corrosion product or salt deposits that were difficult to remove.
81

CPC Effect on Aircraft Electrical Wiring Components TR285HNxxx Final Report Draft Revision: -
Photos B2h1-2, B2h1-4. The M85049 class J samples with ACF-50 applied still had some chromate conversion coating remaining after the salt spray test.
Photos B3h1-2, B3h1-3. Although not as severe as on the control and SSG samples, the M85049 class J samples with SCB also had white corrosion product or salt deposits that were difficult to remove, and no chromate conversion coating remaining on the shells.
82

CPC Effect on Aircraft Electrical Wiring Components TR285HNxxx Final Report Draft Revision: -
Photos A0a1-1, A2a1-2, A3a2-2. Damage to interfacial grommets was noted on samples from all three CPC types, and the control samples (top left). The ACF-50 samples (top right) exhibited the most severe degradation. An example of an SCB sample is also provided (bottom).
83

CPC Effect on Aircraft Electrical Wiring Components TR285HNxxx Final Report Draft Revision: -
Photo A2f2-2, A2f2-1. Partially inverted (left) and torn (right) sealing towers on an M81659 sample treated with ACF-50. The same condition was observed on the control and other CPC samples.
Photo D1. Shows contamination that has collected on the samples sprayed with Super Corr-B after four months of exposure.
84

CPC Effect on Aircraft Electrical Wiring Components TR285HNxxx Final Report Draft Revision: -
Photo D2. Contamination on contact pins sprayed with ACF-50 after 4 months. Photo D3. Some contamination on samples with So Sure Green applied after 4 months of exposure.
85

CPC Effect on Aircraft Electrical Wiring Components TR285HNxxx Final Report Draft Revision: -
Photo D4. No contamination on control samples after four months. Photo D5. Shows accumulation of ACF-50 around contact shoulder after six months.
86
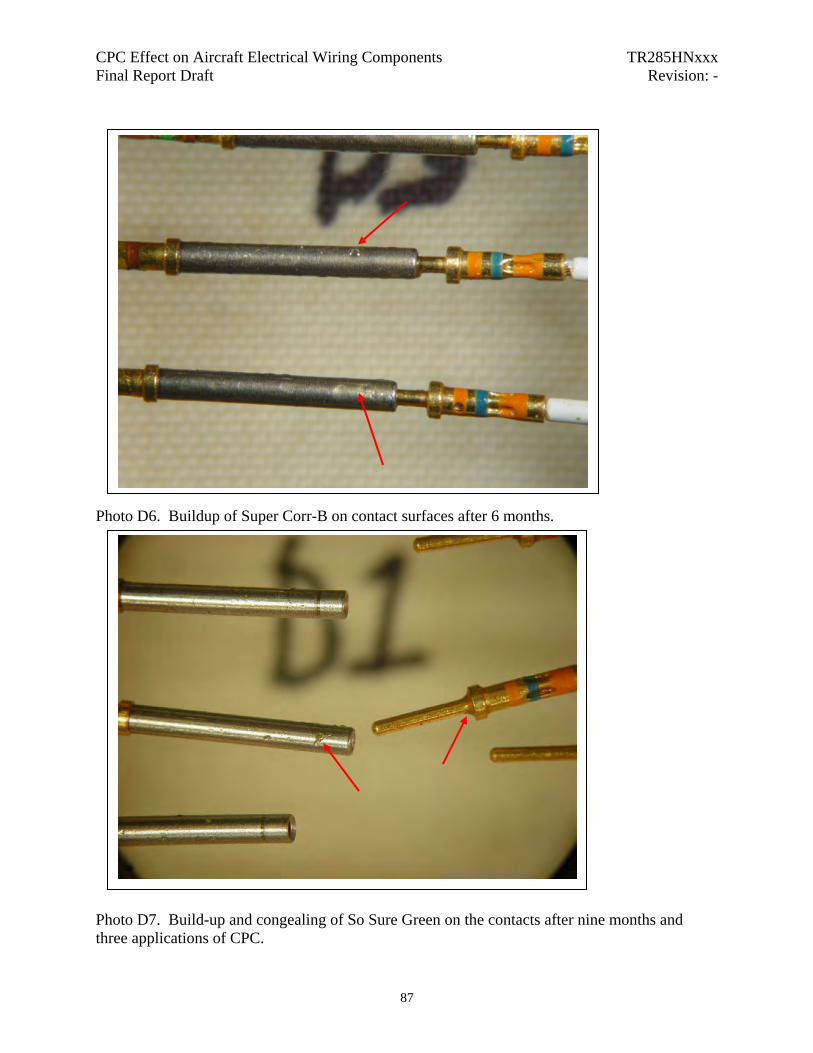
CPC Effect on Aircraft Electrical Wiring Components TR285HNxxx Final Report Draft Revision: -
Photo D6. Buildup of Super Corr-B on contact surfaces after 6 months.
Photo D7. Build-up and congealing of So Sure Green on the contacts after nine months and three applications of CPC.
87
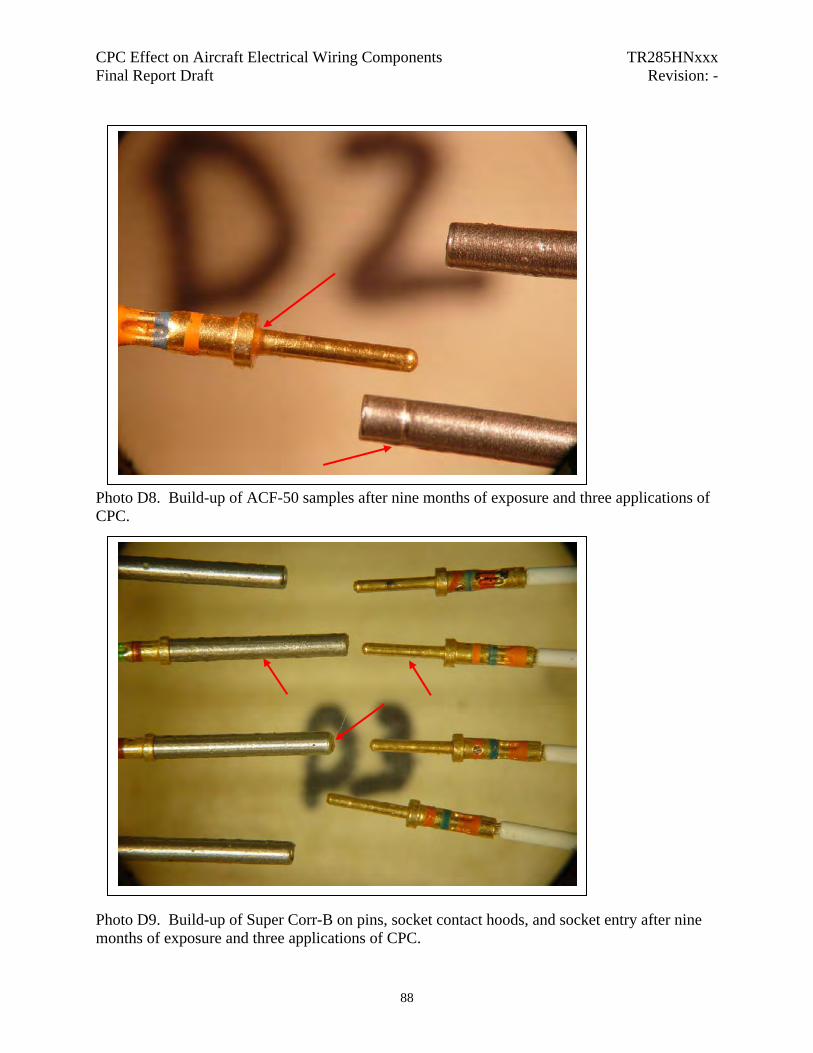
CPC Effect on Aircraft Electrical Wiring Components TR285HNxxx Final Report Draft Revision: -
Photo D8. Build-up of ACF-50 samples after nine months of exposure and three applications of CPC.
Photo D9. Build-up of Super Corr-B on pins, socket contact hoods, and socket entry after nine months of exposure and three applications of CPC.
88
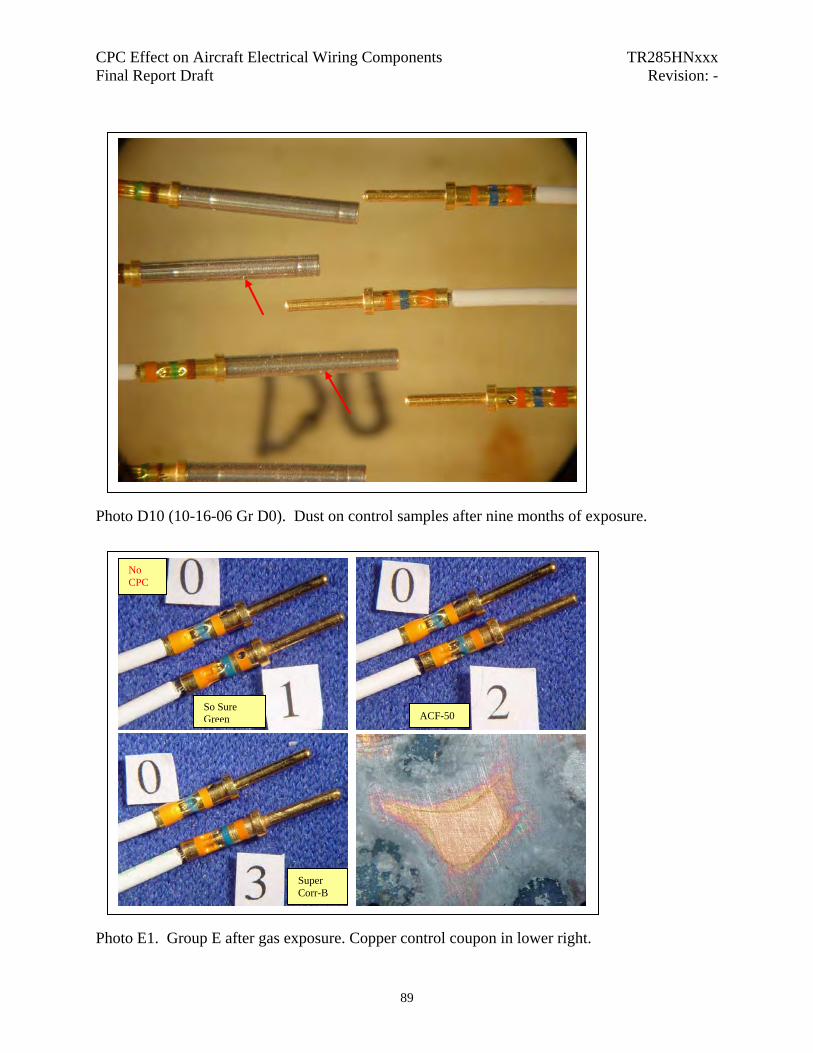
CPC Effect on Aircraft Electrical Wiring Components TR285HNxxx Final Report Draft Revision: -
Photo D10 (10-16-06 Gr D0). Dust on control samples after nine months of exposure.
Super Corr-B
ACF-50 So Sure Green
No CPC
Photo E1. Group E after gas exposure. Copper control coupon in lower right.
89
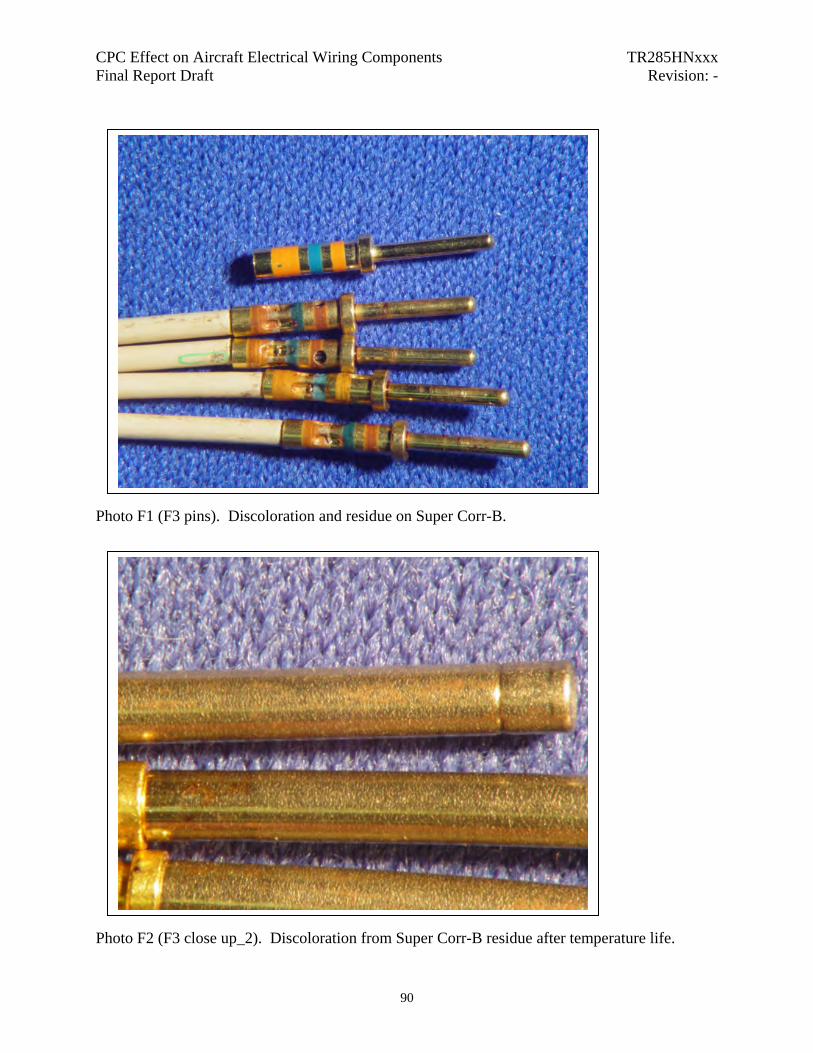
CPC Effect on Aircraft Electrical Wiring Components TR285HNxxx Final Report Draft Revision: -
Photo F1 (F3 pins). Discoloration and residue on Super Corr-B. Photo F2 (F3 close up_2). Discoloration from Super Corr-B residue after temperature life.
90

CPC Effect on Aircraft Electrical Wiring Components TR285HNxxx Final Report Draft Revision: -
Photo F3 (F-0-1-2). So Sure Green samples with untested sample.
Super Corr-B ACF-50
So Sure Green
No CPC Photo G1 (1477). M22759/16 ETFE samples after fluid immersion.
91

CPC Effect on Aircraft Electrical Wiring Components TR285HNxxx Final Report Draft Revision: -
ACF-50
So Sure Green
No CPC
Super Corr-B
Photo G2 (1479). M22759/43 XLETFE samples after fluid immersion.
ACF-50
So Sure Green
No CPC
Super Corr-B
Photo G3 (1482). M5086 PVC/Nylon samples after fluid immersion.
92

CPC Effect on Aircraft Electrical Wiring Components TR285HNxxx Final Report Draft Revision: -
ACF-50
So Sure Green
No CPC
Super Corr-B
Photo G4 (1483a). M81381 polyimide samples after fluid immersion.
ACF-50
So Sure Green
No CPC
Super Corr-B
Photo G5 (1484). M81044/16 Poly-X samples after fluid immersion.
93
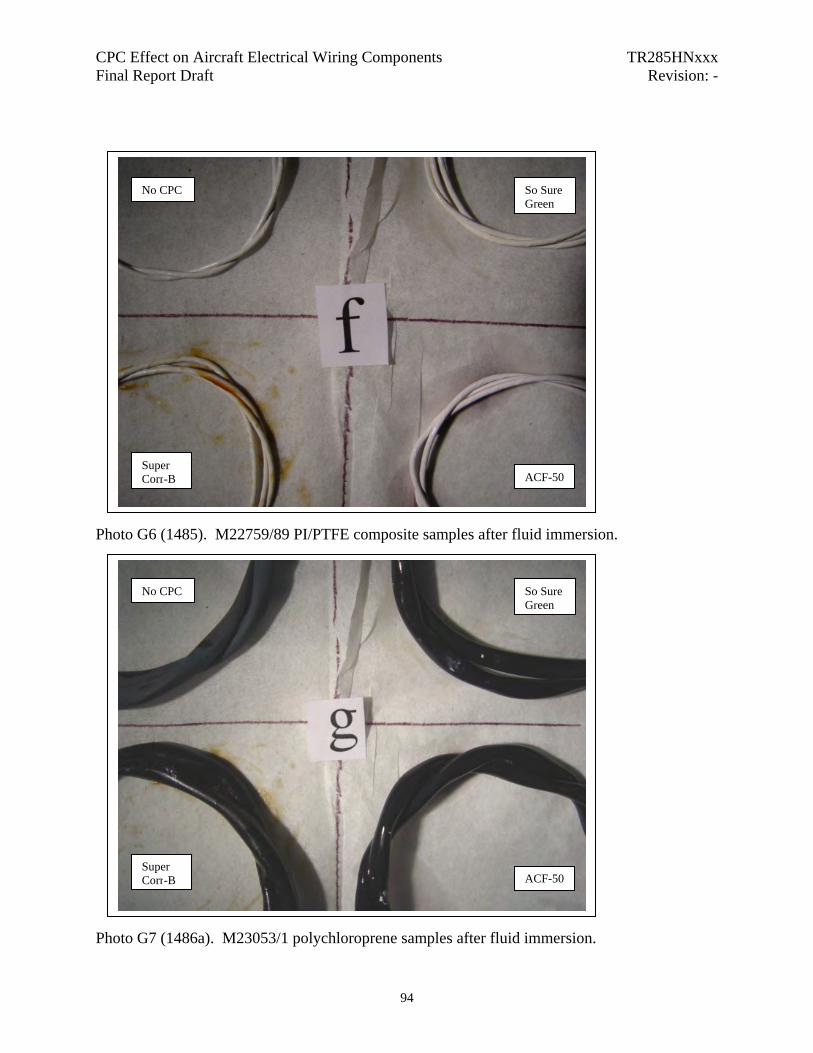
CPC Effect on Aircraft Electrical Wiring Components TR285HNxxx Final Report Draft Revision: -
ACF-50
So Sure Green
No CPC
Super Corr-B
Photo G6 (1485). M22759/89 PI/PTFE composite samples after fluid immersion.
ACF-50
So Sure Green
No CPC
Super Corr-B
Photo G7 (1486a). M23053/1 polychloroprene samples after fluid immersion.
94

CPC Effect on Aircraft Electrical Wiring Components TR285HNxxx Final Report Draft Revision: -
ACF-50
So Sure Green
No CPC
Super Corr-B
Photo G8 (1488). M23053/5 polyolefin samples after fluid immersion.
Photo G9 (1490). M23053/5 polyolefin after exposure to So Sure Green Can
95
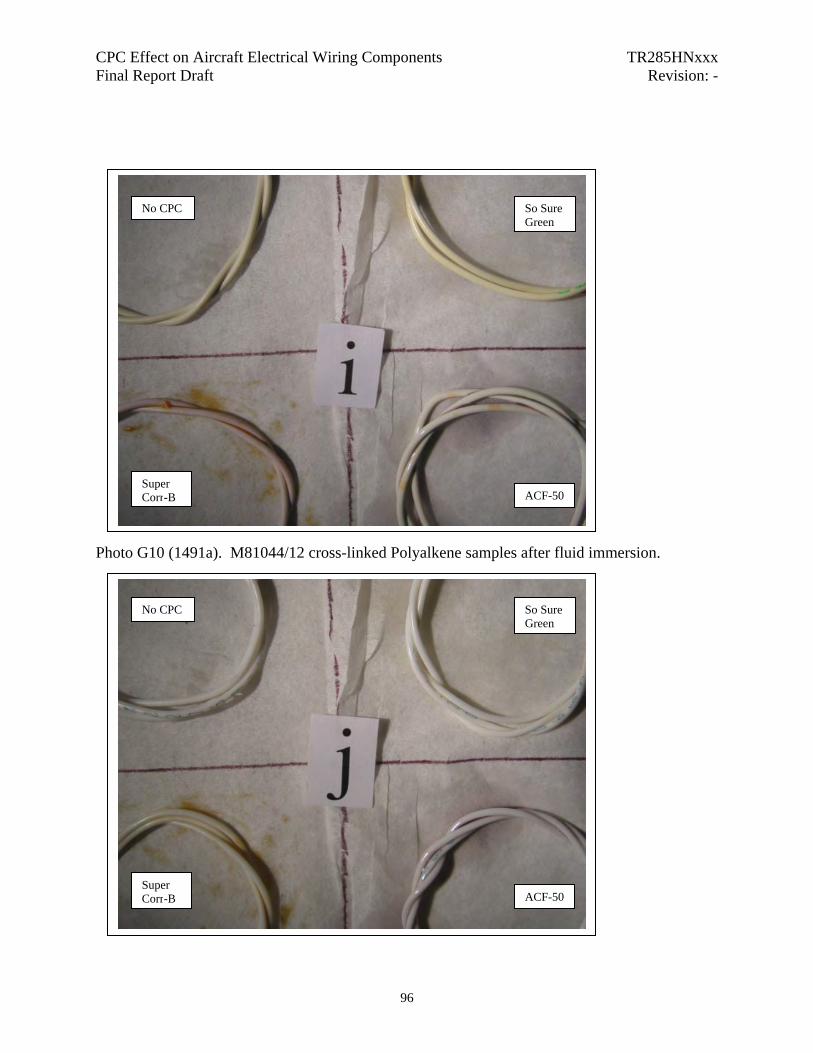
CPC Effect on Aircraft Electrical Wiring Components TR285HNxxx Final Report Draft Revision: -
ACF-50
So Sure Green
No CPC
Super Corr-B
Photo G10 (1491a). M81044/12 cross-linked Polyalkene samples after fluid immersion.
ACF-50
So Sure Green
No CPC
Super Corr-B
96

CPC Effect on Aircraft Electrical Wiring Components TR285HNxxx Final Report Draft Revision: -
Photo G11 (1492a). M22759/11 PTFE samples after fluid immersion.
97
CPC Effect on Aircraft Electrical Wiring Components TR285HNxxx Final Report Draft Revision: -
Appendix E. Figures
98
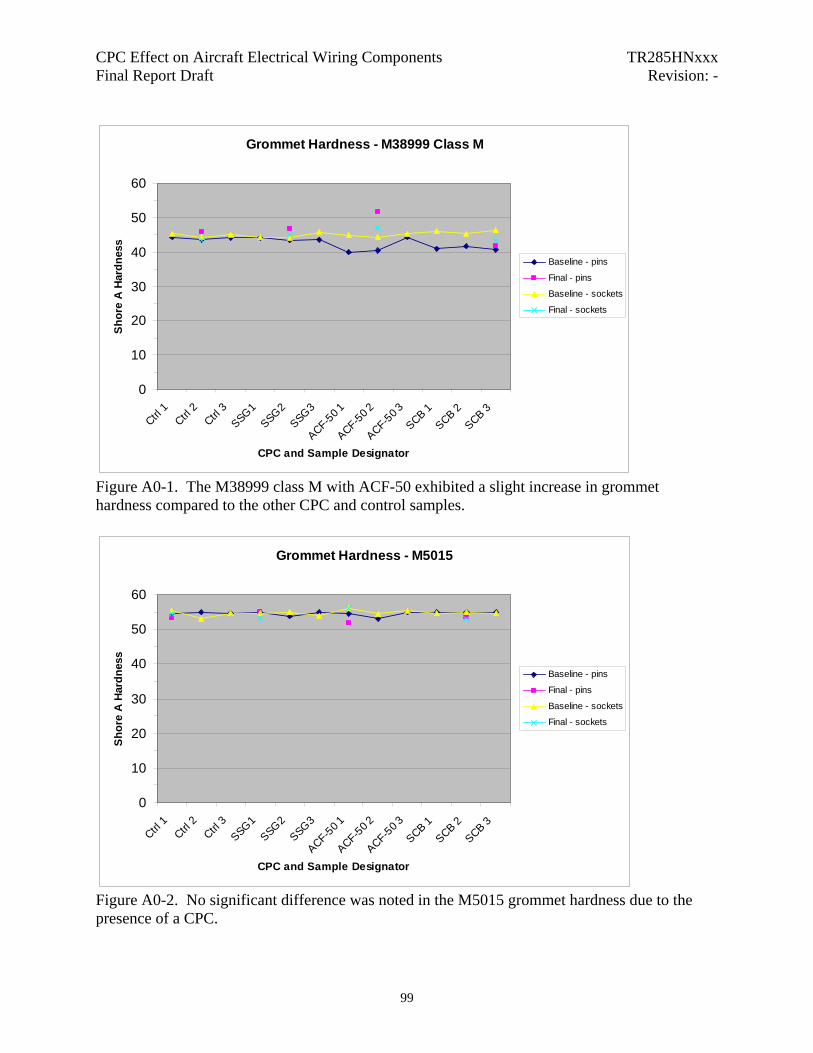
CPC Effect on Aircraft Electrical Wiring Components TR285HNxxx Final Report Draft Revision: -
Grommet Hardness - M38999 Class M
0
10
20
30
40
50
60
Ctrl 1
Ctrl 2
Ctrl 3
SSG1SSG2
SSG3
ACF-50 1
ACF-50 2
ACF-50 3
SCB 1SCB 2
SCB 3
CPC and Sample Designator
Sho
re A
Har
dnes
s
Baseline - pins
Final - pins
Baseline - sockets
Final - sockets
Figure A0-1. The M38999 class M with ACF-50 exhibited a slight increase in grommet hardness compared to the other CPC and control samples.
Grommet Hardness - M5015
0
10
20
30
40
50
60
Ctrl 1
Ctrl 2
Ctrl 3
SSG1SSG2
SSG3
ACF-50 1
ACF-50 2
ACF-50 3
SCB 1SCB 2
SCB 3
CPC and Sample Designator
Shor
e A
Hard
ness
Baseline - pins
Final - pins
Baseline - sockets
Final - sockets
Figure A0-2. No significant difference was noted in the M5015 grommet hardness due to the presence of a CPC.
99
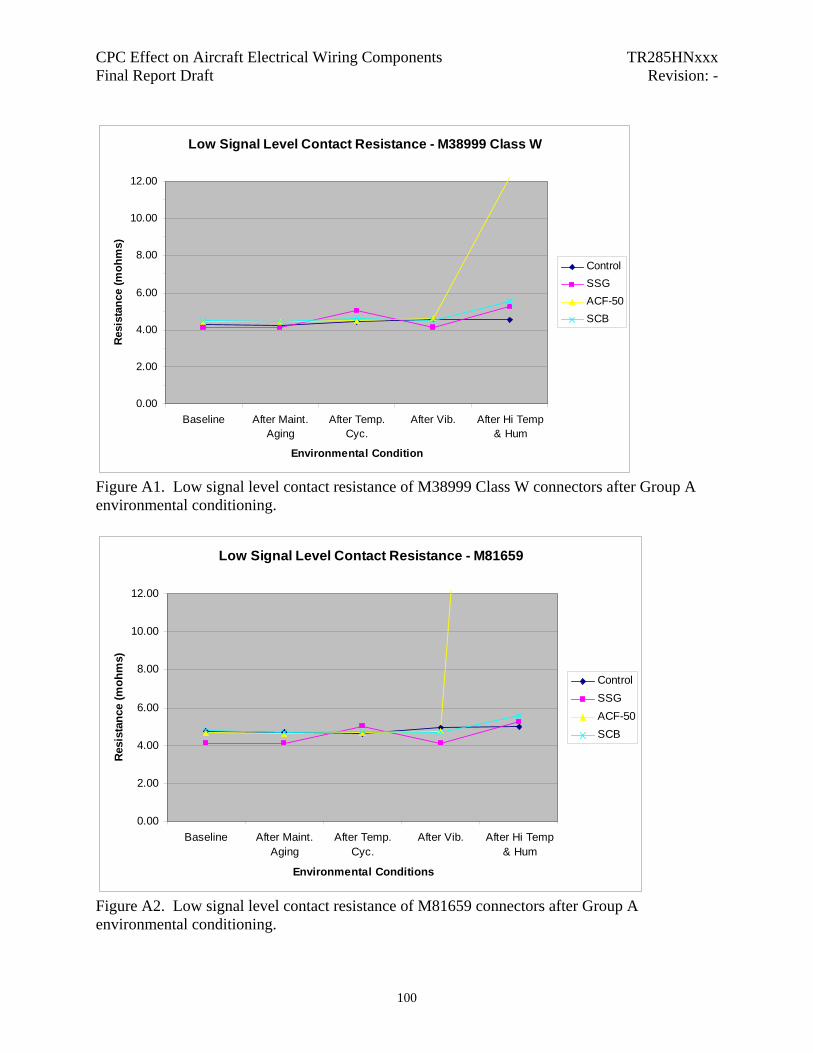
CPC Effect on Aircraft Electrical Wiring Components TR285HNxxx Final Report Draft Revision: -
Low Signal Level Contact Resistance - M38999 Class W
0.00
2.00
4.00
6.00
8.00
10.00
12.00
Baseline After Maint.Aging
After Temp.Cyc.
After Vib. After Hi Temp& Hum
Environmental Condition
Res
ista
nce
(moh
ms)
ControlSSGACF-50SCB
Figure A1. Low signal level contact resistance of M38999 Class W connectors after Group A environmental conditioning.
Low Signal Level Contact Resistance - M81659
0.00
2.00
4.00
6.00
8.00
10.00
12.00
Baseline After Maint.Aging
After Temp.Cyc.
After Vib. After Hi Temp& Hum
Environmental Conditions
Res
ista
nce
(moh
ms)
ControlSSGACF-50SCB
Figure A2. Low signal level contact resistance of M81659 connectors after Group A environmental conditioning.
100
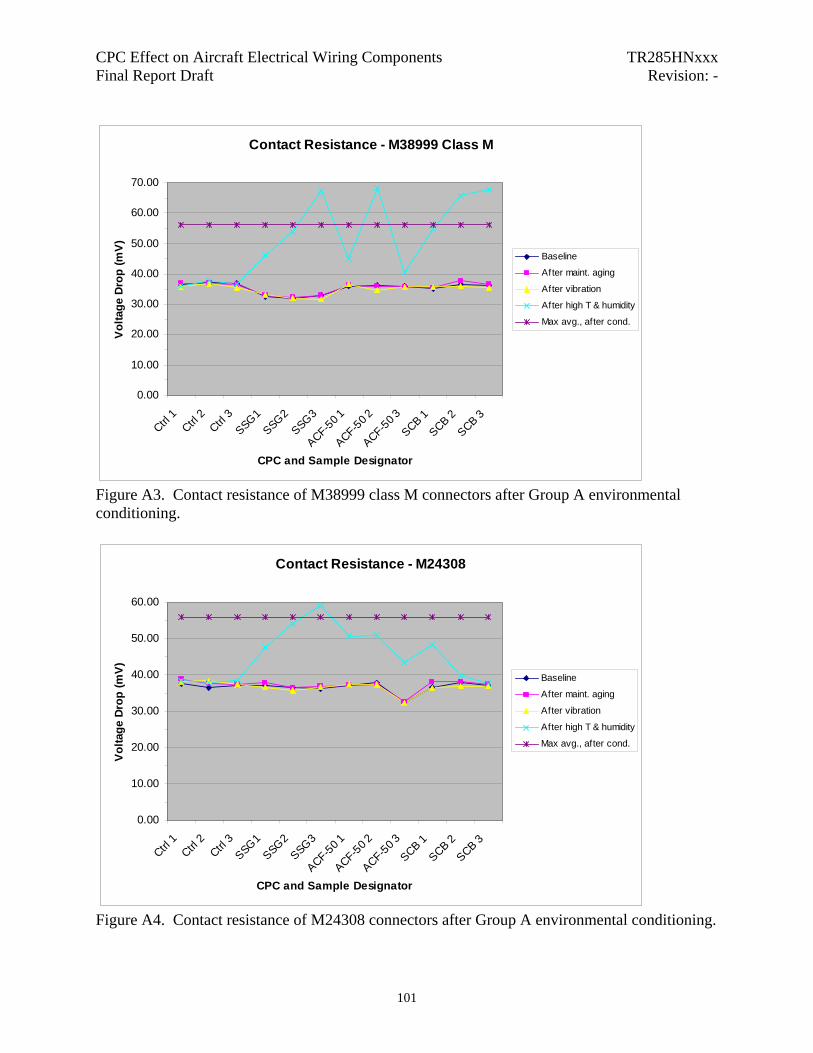
CPC Effect on Aircraft Electrical Wiring Components TR285HNxxx Final Report Draft Revision: -
Contact Resistance - M38999 Class M
0.00
10.00
20.00
30.00
40.00
50.00
60.00
70.00
Ctrl 1
Ctrl 2
Ctrl 3
SSG1SSG2
SSG3
ACF-50 1
ACF-50 2
ACF-50 3
SCB 1SCB 2
SCB 3
CPC and Sample Designator
Vol
tage
Dro
p (m
V)
Baseline
After maint. aging
After vibration
After high T & humidity
Max avg., after cond.
Figure A3. Contact resistance of M38999 class M connectors after Group A environmental conditioning.
Contact Resistance - M24308
0.00
10.00
20.00
30.00
40.00
50.00
60.00
Ctrl 1
Ctrl 2
Ctrl 3
SSG1SSG2
SSG3
ACF-50 1
ACF-50 2
ACF-50 3
SCB 1SCB 2
SCB 3
CPC and Sample Designator
Vol
tage
Dro
p (m
V)
Baseline
After maint. aging
After vibration
After high T & humidity
Max avg., after cond.
Figure A4. Contact resistance of M24308 connectors after Group A environmental conditioning.
101
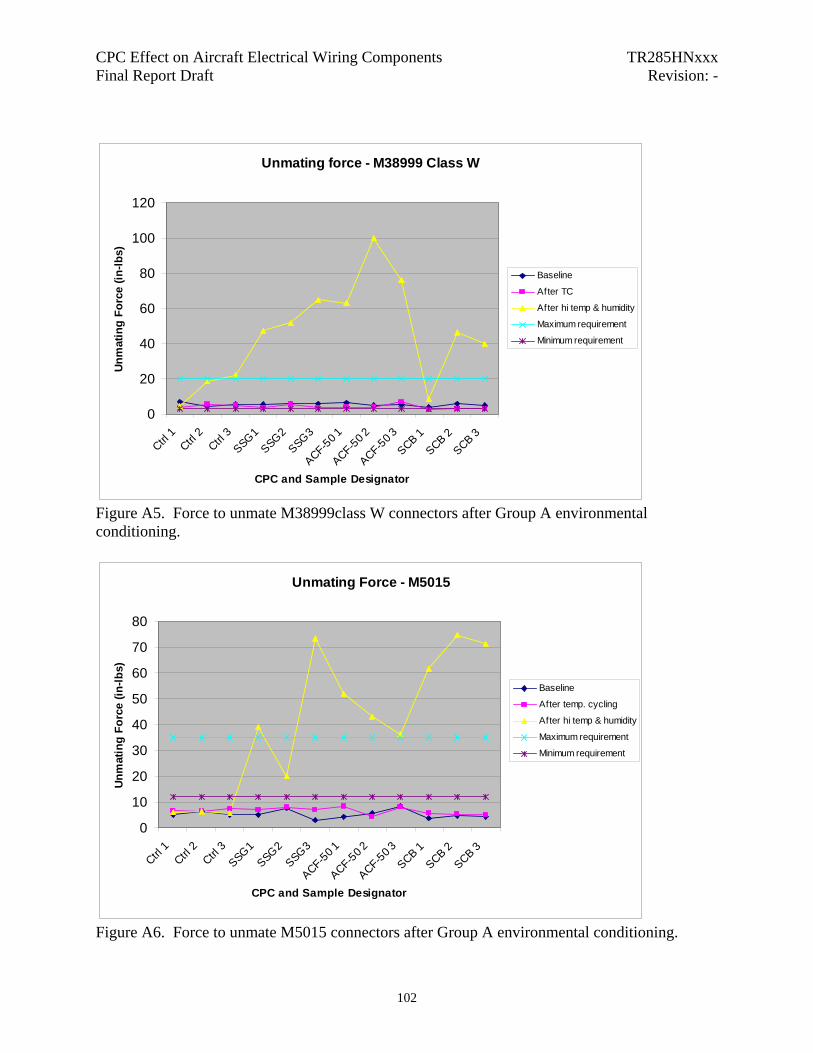
CPC Effect on Aircraft Electrical Wiring Components TR285HNxxx Final Report Draft Revision: -
Unmating force - M38999 Class W
0
20
40
60
80
100
120
Ctrl 1
Ctrl 2
Ctrl 3
SSG1SSG2
SSG3
ACF-50 1
ACF-50 2
ACF-50 3
SCB 1SCB 2
SCB 3
CPC and Sample Designator
Unm
atin
g Fo
rce
(in-lb
s)
Baseline
After TC
After hi temp & humidity
Maximum requirement
Minimum requirement
Figure A5. Force to unmate M38999class W connectors after Group A environmental conditioning.
Unmating Force - M5015
0
10
20
30
40
50
60
70
80
Ctrl 1
Ctrl 2
Ctrl 3
SSG1SSG2
SSG3
ACF-50 1
ACF-50 2
ACF-50 3
SCB 1SCB 2
SCB 3
CPC and Sample Designator
Unm
atin
g Fo
rce
(in-lb
s)
Baseline
After temp. cycling
After hi temp & humidity
Maximum requirement
Minimum requirement
Figure A6. Force to unmate M5015 connectors after Group A environmental conditioning.
102
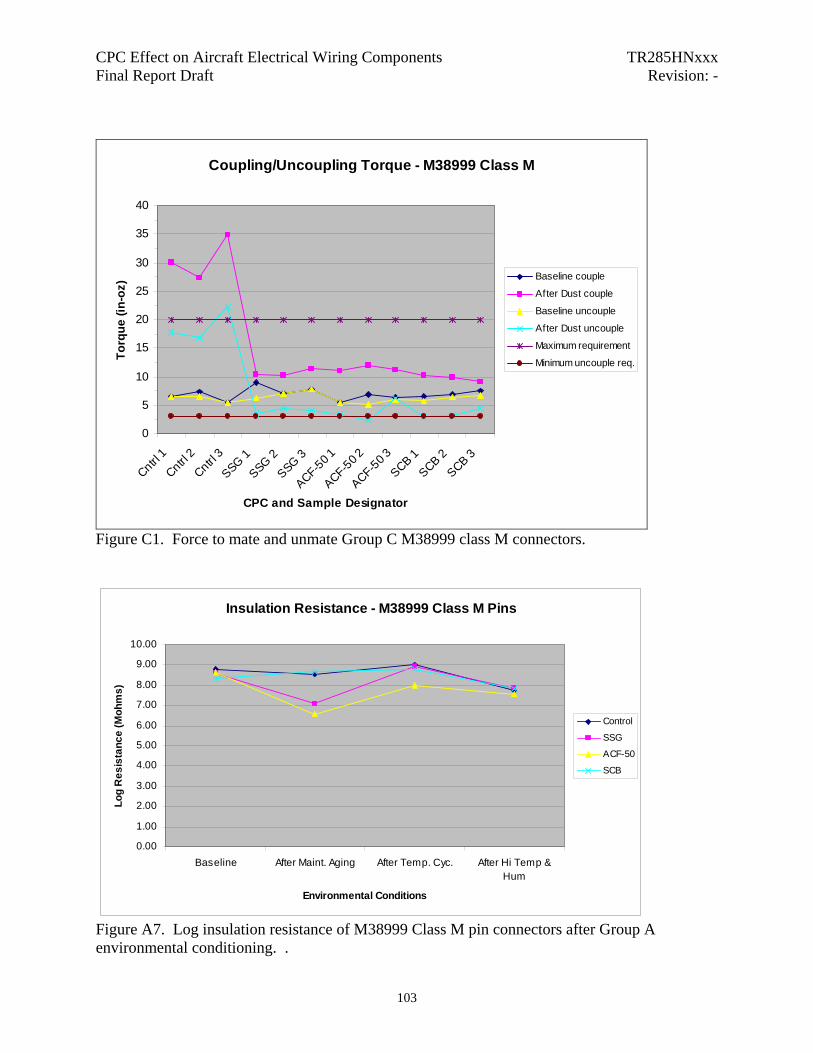
CPC Effect on Aircraft Electrical Wiring Components TR285HNxxx Final Report Draft Revision: -
Coupling/Uncoupling Torque - M38999 Class M
0
5
10
15
20
25
30
35
40
Cntrl 1
Cntrl 2
Cntrl 3
SSG 1
SSG 2
SSG 3
ACF-50 1
ACF-50 2
ACF-50 3
SCB 1SCB 2
SCB 3
CPC and Sample Designator
Torq
ue (i
n-oz
) Baseline couple
After Dust couple
Baseline uncouple
After Dust uncouple
Maximum requirement
Minimum uncouple req.
Figure C1. Force to mate and unmate Group C M38999 class M connectors.
Insulation Resistance - M38999 Class M Pins
0.00
1.00
2.00
3.00
4.00
5.00
6.00
7.00
8.00
9.00
10.00
Baseline After Maint. Aging After Temp. Cyc. After Hi Temp &Hum
Environmental Conditions
Log
Res
ista
nce
(Moh
ms)
Control
SSG
ACF-50
SCB
Figure A7. Log insulation resistance of M38999 Class M pin connectors after Group A environmental conditioning. .
103
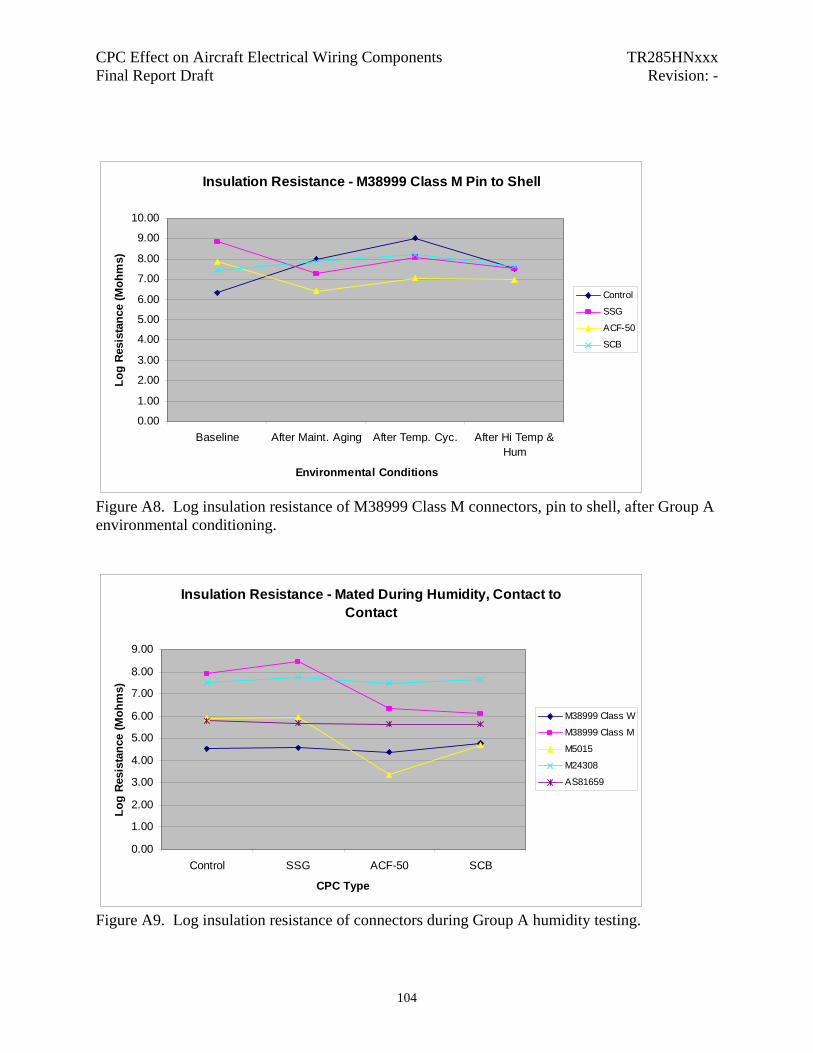
CPC Effect on Aircraft Electrical Wiring Components TR285HNxxx Final Report Draft Revision: -
Insulation Resistance - M38999 Class M Pin to Shell
0.00
1.00
2.00
3.00
4.00
5.00
6.00
7.00
8.00
9.00
10.00
Baseline After Maint. Aging After Temp. Cyc. After Hi Temp &Hum
Environmental Conditions
Log
Resi
stan
ce (M
ohm
s)
Control
SSG
ACF-50
SCB
Figure A8. Log insulation resistance of M38999 Class M connectors, pin to shell, after Group A environmental conditioning.
Insulation Resistance - Mated During Humidity, Contact to Contact
0.00
1.00
2.00
3.00
4.00
5.00
6.00
7.00
8.00
9.00
Control SSG ACF-50 SCB
CPC Type
Log
Resi
stan
ce (M
ohm
s)
M38999 Class W
M38999 Class M
M5015
M24308
AS81659
Figure A9. Log insulation resistance of connectors during Group A humidity testing.
104
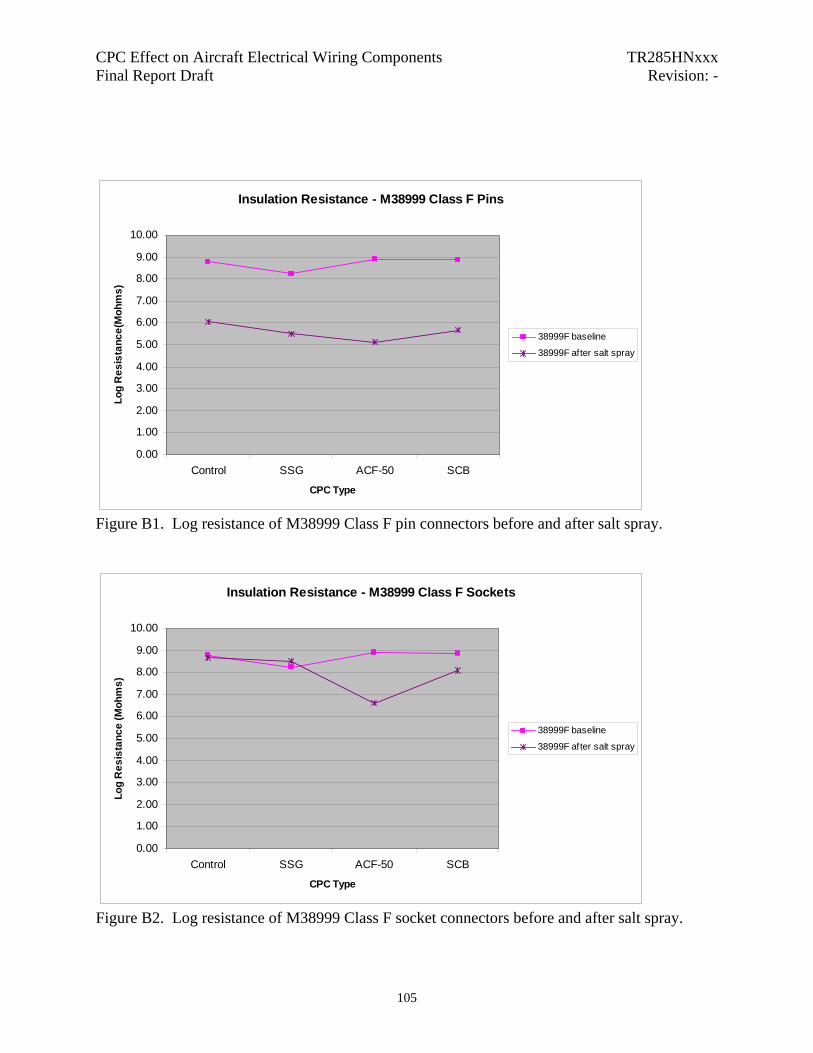
CPC Effect on Aircraft Electrical Wiring Components TR285HNxxx Final Report Draft Revision: -
Insulation Resistance - M38999 Class F Pins
0.00
1.00
2.00
3.00
4.00
5.00
6.00
7.00
8.00
9.00
10.00
Control SSG ACF-50 SCB
CPC Type
Log
Res
ista
nce(
Moh
ms)
38999F baseline
38999F after salt spray
Figure B1. Log resistance of M38999 Class F pin connectors before and after salt spray.
Insulation Resistance - M38999 Class F Sockets
0.00
1.00
2.00
3.00
4.00
5.00
6.00
7.00
8.00
9.00
10.00
Control SSG ACF-50 SCB
CPC Type
Log
Res
ista
nce
(Moh
ms)
38999F baseline
38999F after salt spray
Figure B2. Log resistance of M38999 Class F socket connectors before and after salt spray.
105
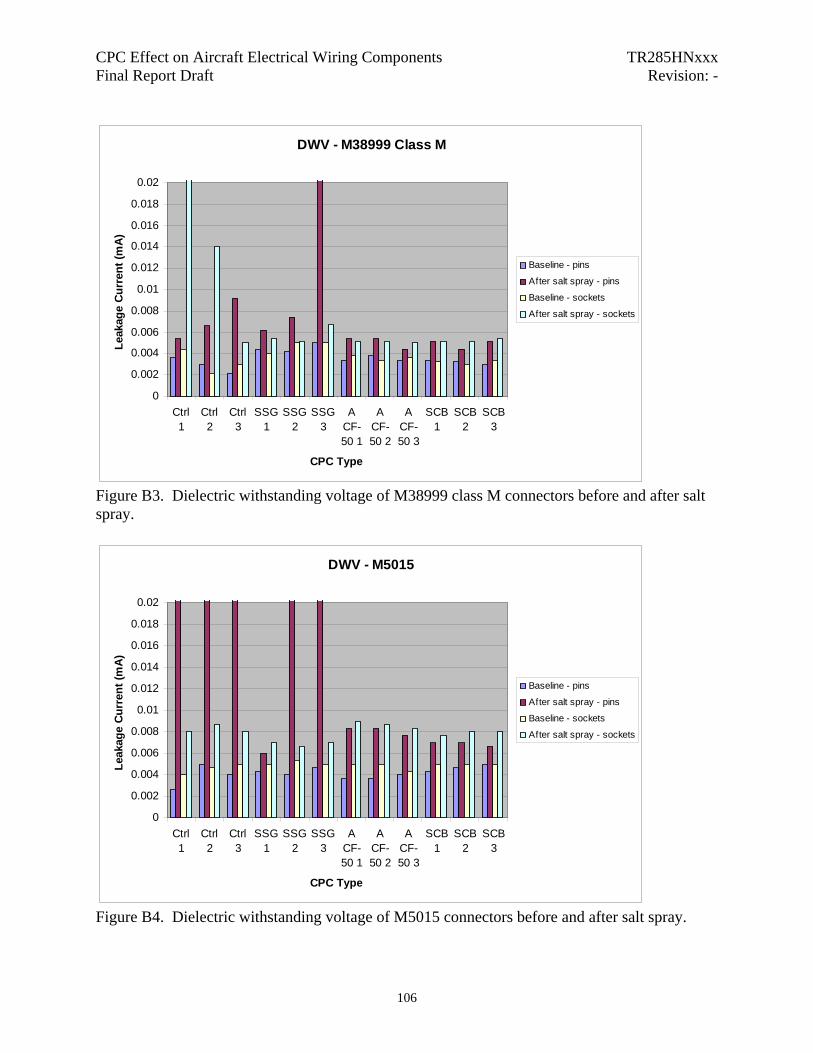
CPC Effect on Aircraft Electrical Wiring Components TR285HNxxx Final Report Draft Revision: -
DWV - M38999 Class M
0
0.002
0.004
0.006
0.008
0.01
0.012
0.014
0.016
0.018
0.02
Ctrl1
Ctrl2
Ctrl3
SSG1
SSG2
SSG3
ACF-50 1
ACF-50 2
ACF-50 3
SCB1
SCB2
SCB3
CPC Type
Leak
age
Curr
ent (
mA)
Baseline - pins
After salt spray - pins
Baseline - sockets
After salt spray - sockets
Figure B3. Dielectric withstanding voltage of M38999 class M connectors before and after salt spray.
DWV - M5015
0
0.002
0.004
0.006
0.008
0.01
0.012
0.014
0.016
0.018
0.02
Ctrl1
Ctrl2
Ctrl3
SSG1
SSG2
SSG3
ACF-50 1
ACF-50 2
ACF-50 3
SCB1
SCB2
SCB3
CPC Type
Leak
age
Curr
ent (
mA)
Baseline - pins
After salt spray - pins
Baseline - sockets
After salt spray - sockets
Figure B4. Dielectric withstanding voltage of M5015 connectors before and after salt spray.
106
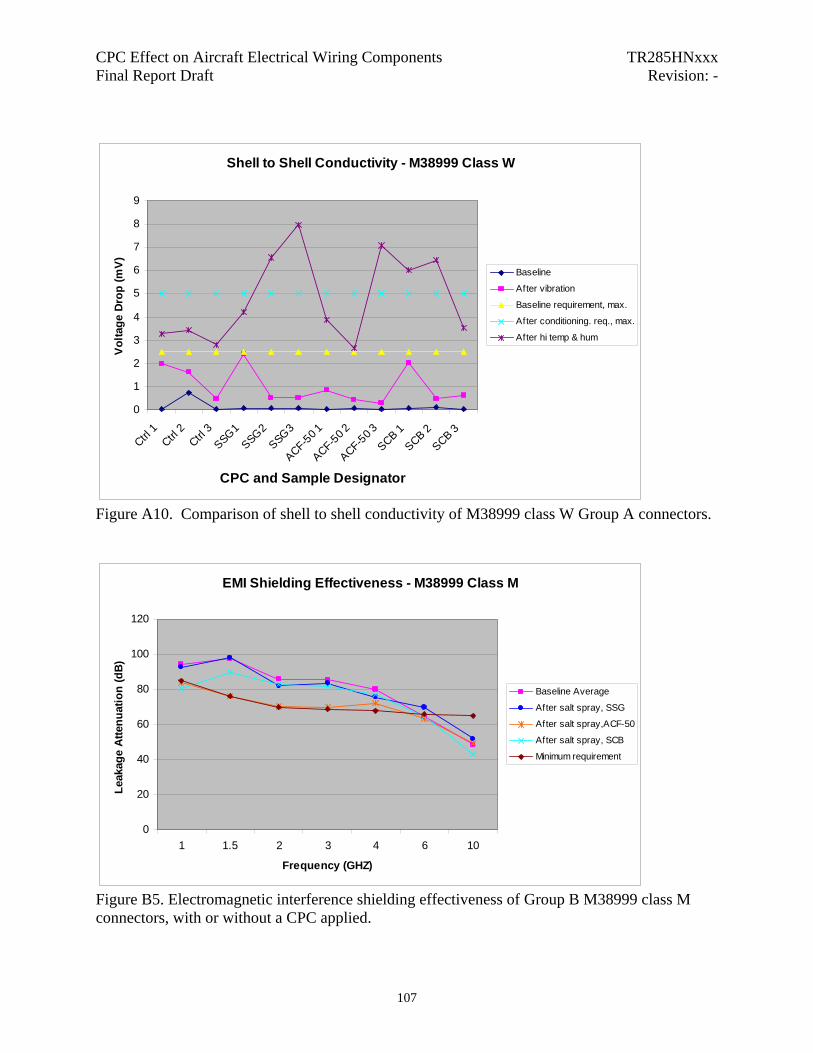
CPC Effect on Aircraft Electrical Wiring Components TR285HNxxx Final Report Draft Revision: -
Shell to Shell Conductivity - M38999 Class W
0
1
2
3
4
5
6
7
8
9
Ctrl 1
Ctrl 2
Ctrl 3
SSG1SSG2
SSG3
ACF-50 1
ACF-50 2
ACF-50 3
SCB 1SCB 2
SCB 3
CPC and Sample Designator
Vol
tage
Dro
p (m
V)
Baseline
After vibration
Baseline requirement, max.
After conditioning. req., max.
After hi temp & hum
Figure A10. Comparison of shell to shell conductivity of M38999 class W Group A connectors.
EMI Shielding Effectiveness - M38999 Class M
0
20
40
60
80
100
120
1 1.5 2 3 4 6 10
Frequency (GHZ)
Leak
age
Atte
nuat
ion
(dB)
Baseline Average
After salt spray, SSG
After salt spray,ACF-50
After salt spray, SCB
Minimum requirement
Figure B5. Electromagnetic interference shielding effectiveness of Group B M38999 class M connectors, with or without a CPC applied.
107
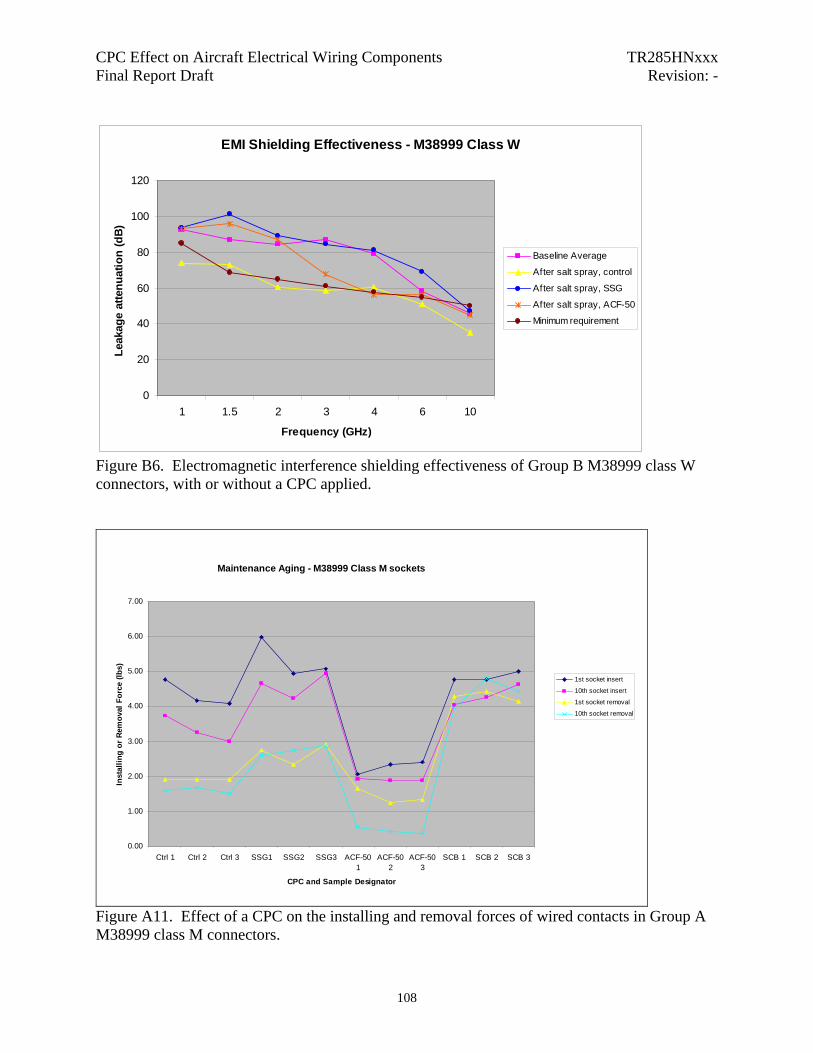
CPC Effect on Aircraft Electrical Wiring Components TR285HNxxx Final Report Draft Revision: -
EMI Shielding Effectiveness - M38999 Class W
0
20
40
60
80
100
120
1 1.5 2 3 4 6 10
Frequency (GHz)
Leak
age
atte
nuat
ion
(dB)
Baseline Average
After salt spray, control
After salt spray, SSG
After salt spray, ACF-50
Minimum requirement
Figure B6. Electromagnetic interference shielding effectiveness of Group B M38999 class W connectors, with or without a CPC applied.
Maintenance Aging - M38999 Class M sockets
0.00
1.00
2.00
3.00
4.00
5.00
6.00
7.00
Ctrl 1 Ctrl 2 Ctrl 3 SSG1 SSG2 SSG3 ACF-501
ACF-502
ACF-503
SCB 1 SCB 2 SCB 3
CPC and Sample Designator
Inst
allin
g or
Rem
oval
For
ce (l
bs)
1st socket insert
10th socket insert
1st socket removal
10th socket removal
Figure A11. Effect of a CPC on the installing and removal forces of wired contacts in Group A M38999 class M connectors.
108
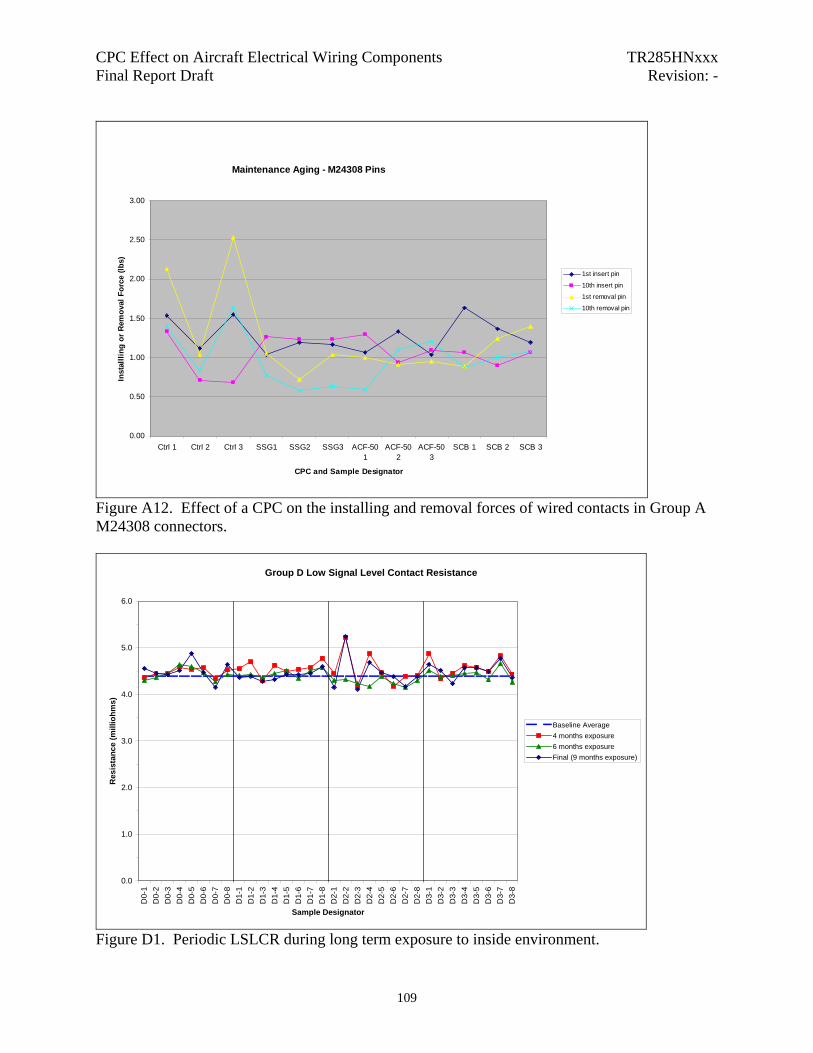
CPC Effect on Aircraft Electrical Wiring Components TR285HNxxx Final Report Draft Revision: -
Maintenance Aging - M24308 Pins
0.00
0.50
1.00
1.50
2.00
2.50
3.00
Ctrl 1 Ctrl 2 Ctrl 3 SSG1 SSG2 SSG3 ACF-501
ACF-502
ACF-503
SCB 1 SCB 2 SCB 3
CPC and Sample Designator
Inst
allli
ng o
r R
emov
al F
orce
(lbs
)
1st insert pin
10th insert pin
1st removal pin
10th removal pin
Figure A12. Effect of a CPC on the installing and removal forces of wired contacts in Group A M24308 connectors.
Group D Low Signal Level Contact Resistance
0.0
1.0
2.0
3.0
4.0
5.0
6.0
D0-
1D
0-2
D0-
3D
0-4
D0-
5D
0-6
D0-
7D
0-8
D1-
1D
1-2
D1-
3D
1-4
D1-
5D
1-6
D1-
7D
1-8
D2-
1D
2-2
D2-
3D
2-4
D2-
5D
2-6
D2-
7D
2-8
D3-
1D
3-2
D3-
3D
3-4
D3-
5D
3-6
D3-
7D
3-8
Sample Designator
Res
ista
nce
(mill
iohm
s)
Baseline Average4 months exposure6 months exposureFinal (9 months exposure)
Figure D1. Periodic LSLCR during long term exposure to inside environment.
109

CPC Effect on Aircraft Electrical Wiring Components TR285HNxxx Final Report Draft Revision: -
Contact Engagement Force Averages
0.00
1.00
2.00
3.00
4.00
5.00
6.00
7.00
8.00
9.00
10.00
0 1 2 3
CPC designator
Enga
gem
ent F
orce
(oz)
Baseline - Group FCPC applied - Group FPost inside exposure - Group B
Figure D2. Engagement forces following long term exposure to inside environment.
Group E Low Signal Level Contact Resistance
0.00
1.00
2.00
3.00
4.00
E0-
1E
0-2
E0-
3E
0-4
E0-
5E
0-6
E0-
7E
0-8
E1-
1E
1-2
E1-
3E
1-4
E1-
5E
1-6
E1-
7E
1-8
E2-
1E
2-2
E2-
3E
2-4
E2-
5E
2-6
E2-
7E
2-8
E3-
1E
3-2
E3-
3E
3-4
E3-
5E
3-6
E3-
7E
3-8
Sample Designator
Res
ista
nce
(mill
iohm
)
baselineafter appl. CPCafter gas exposure
Figure E1. LSLCR for gas exposure test group samples.
110
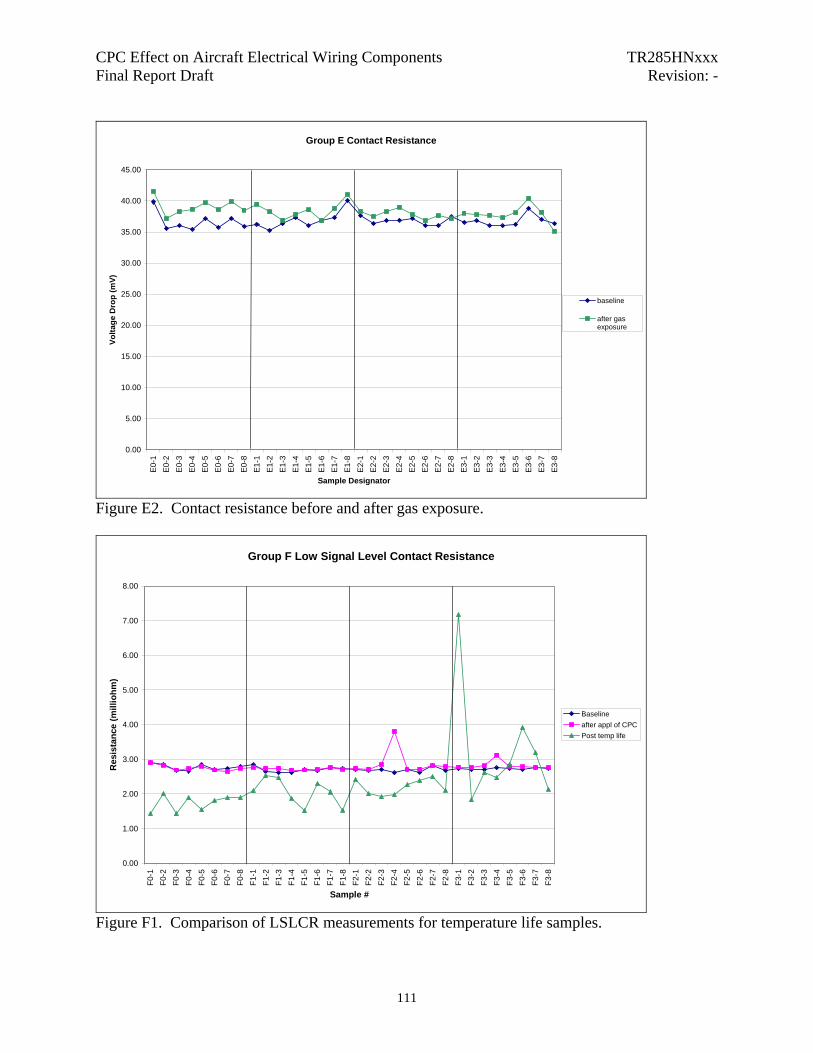
CPC Effect on Aircraft Electrical Wiring Components TR285HNxxx Final Report Draft Revision: -
Group E Contact Resistance
0.00
5.00
10.00
15.00
20.00
25.00
30.00
35.00
40.00
45.00
E0-
1E
0-2
E0-
3E
0-4
E0-
5E
0-6
E0-
7E
0-8
E1-
1E
1-2
E1-
3E
1-4
E1-
5E
1-6
E1-
7E
1-8
E2-
1E
2-2
E2-
3E
2-4
E2-
5E
2-6
E2-
7E
2-8
E3-
1E
3-2
E3-
3E
3-4
E3-
5E
3-6
E3-
7E
3-8
Sample Designator
Volta
ge D
rop
(mV)
baseline
after gasexposure
Figure E2. Contact resistance before and after gas exposure.
Group F Low Signal Level Contact Resistance
0.00
1.00
2.00
3.00
4.00
5.00
6.00
7.00
8.00
F0-1
F0-2
F0-3
F0-4
F0-5
F0-6
F0-7
F0-8
F1-1
F1-2
F1-3
F1-4
F1-5
F1-6
F1-7
F1-8
F2-1
F2-2
F2-3
F2-4
F2-5
F2-6
F2-7
F2-8
F3-1
F3-2
F3-3
F3-4
F3-5
F3-6
F3-7
F3-8
Sample #
Res
ista
nce
(mill
iohm
)
Baselineafter appl of CPCPost temp life
Figure F1. Comparison of LSLCR measurements for temperature life samples.
111
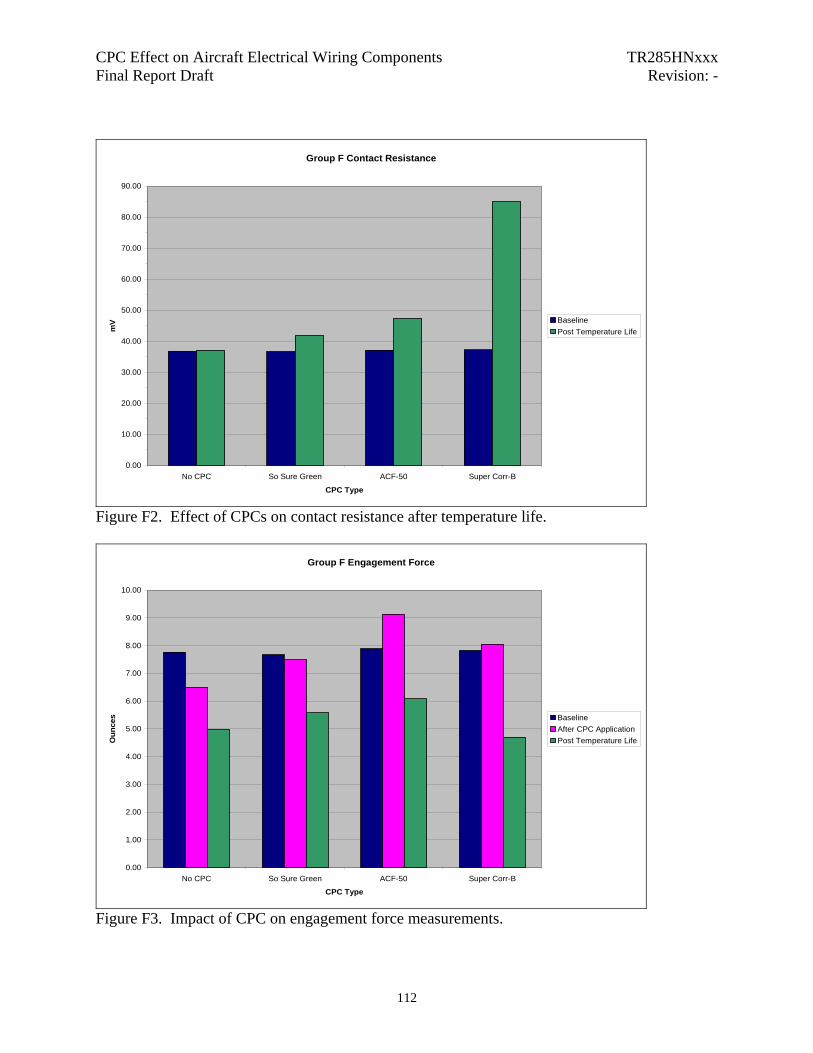
CPC Effect on Aircraft Electrical Wiring Components TR285HNxxx Final Report Draft Revision: -
Group F Contact Resistance
0.00
10.00
20.00
30.00
40.00
50.00
60.00
70.00
80.00
90.00
No CPC So Sure Green ACF-50 Super Corr-B
CPC Type
mV Baseline
Post Temperature Life
Figure F2. Effect of CPCs on contact resistance after temperature life.
Group F Engagement Force
0.00
1.00
2.00
3.00
4.00
5.00
6.00
7.00
8.00
9.00
10.00
No CPC So Sure Green ACF-50 Super Corr-B
CPC Type
Oun
ces Baseline
After CPC ApplicationPost Temperature Life
Figure F3. Impact of CPC on engagement force measurements.
112
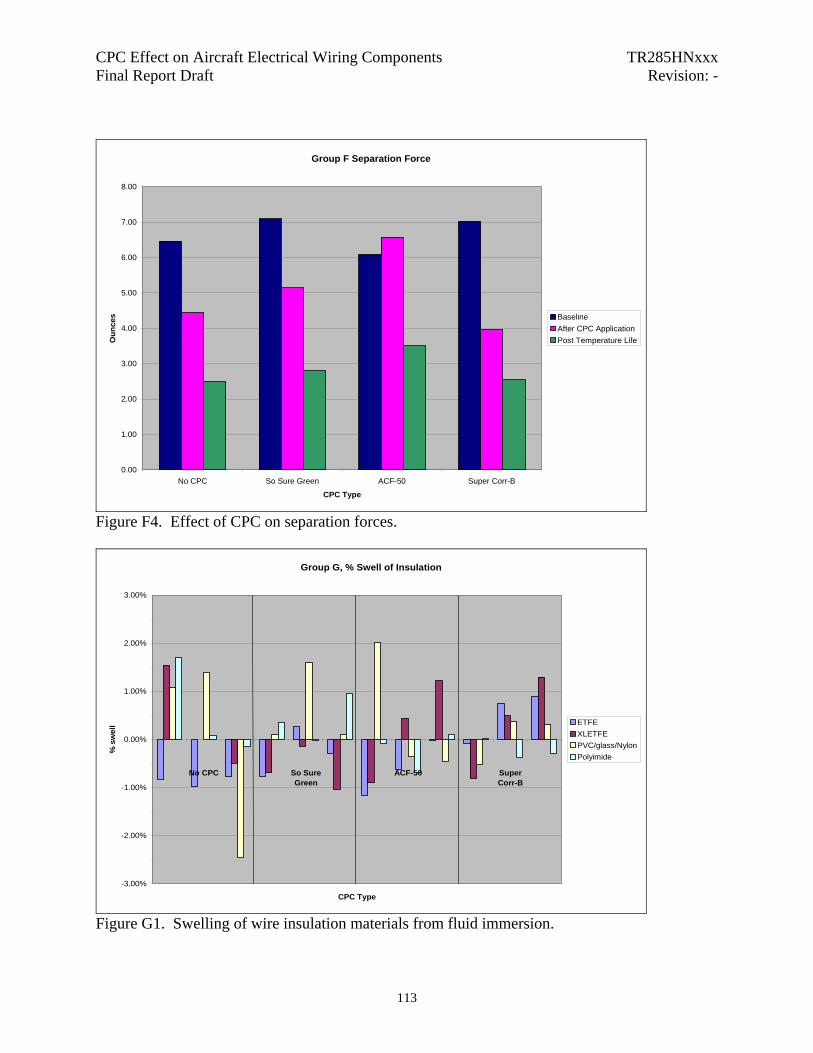
CPC Effect on Aircraft Electrical Wiring Components TR285HNxxx Final Report Draft Revision: -
Group F Separation Force
0.00
1.00
2.00
3.00
4.00
5.00
6.00
7.00
8.00
No CPC So Sure Green ACF-50 Super Corr-B
CPC Type
Oun
ces Baseline
After CPC ApplicationPost Temperature Life
Figure F4. Effect of CPC on separation forces.
Group G, % Swell of Insulation
-3.00%
-2.00%
-1.00%
0.00%
1.00%
2.00%
3.00%
No CPC So SureGreen
ACF-50 SuperCorr-B
CPC Type
% s
wel
l ETFEXLETFEPVC/glass/NylonPolyimide
Figure G1. Swelling of wire insulation materials from fluid immersion.
113

CPC Effect on Aircraft Electrical Wiring Components TR285HNxxx Final Report Draft Revision: -
Group G, % Swell of Insulation
-1.00%
0.00%
1.00%
2.00%
3.00%
4.00%
No CPC So SureGreen
ACF-50 SuperCorr-B
CPC Type
% S
wel
l
CompositeXL PolyalkenePTFEPoly-X
Figure G2. Swelling of wire insulation materials from fluid immersion
Group G, % Swell of Insulation
-10.00%
-7.50%
-5.00%
-2.50%
0.00%
2.50%
5.00%
7.50%
10.00%
No CPC So SureGreen
ACF-50 SuperCorr-B
CPC Type
% S
wel
l
PolychloroprenePolyolefin
Figure G3. Swelling of insulation sleeving from fluid immersion.
114
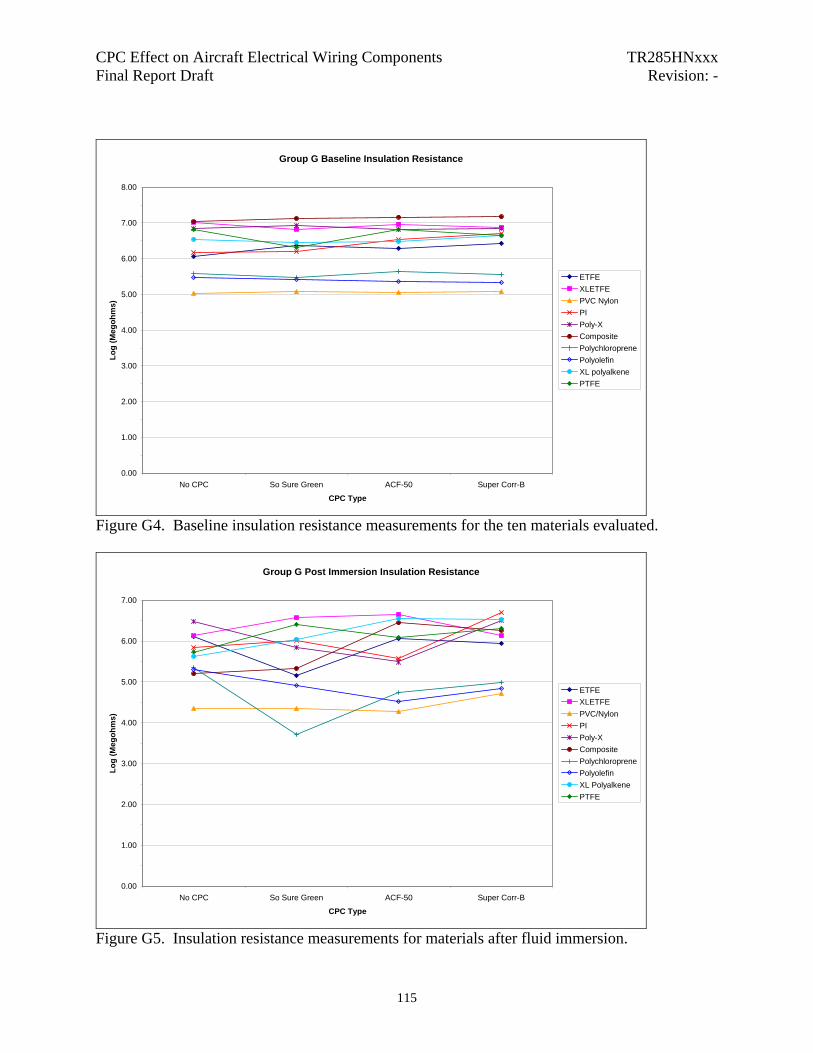
CPC Effect on Aircraft Electrical Wiring Components TR285HNxxx Final Report Draft Revision: -
Group G Baseline Insulation Resistance
0.00
1.00
2.00
3.00
4.00
5.00
6.00
7.00
8.00
No CPC So Sure Green ACF-50 Super Corr-B
CPC Type
Log
(Meg
ohm
s)
ETFEXLETFEPVC NylonPIPoly-XCompositePolychloroprenePolyolefinXL polyalkenePTFE
Figure G4. Baseline insulation resistance measurements for the ten materials evaluated.
Group G Post Immersion Insulation Resistance
0.00
1.00
2.00
3.00
4.00
5.00
6.00
7.00
No CPC So Sure Green ACF-50 Super Corr-B
CPC Type
Log
(Meg
ohm
s)
ETFEXLETFEPVC/NylonPIPoly-XCompositePolychloroprenePolyolefinXL PolyalkenePTFE
Figure G5. Insulation resistance measurements for materials after fluid immersion.
115
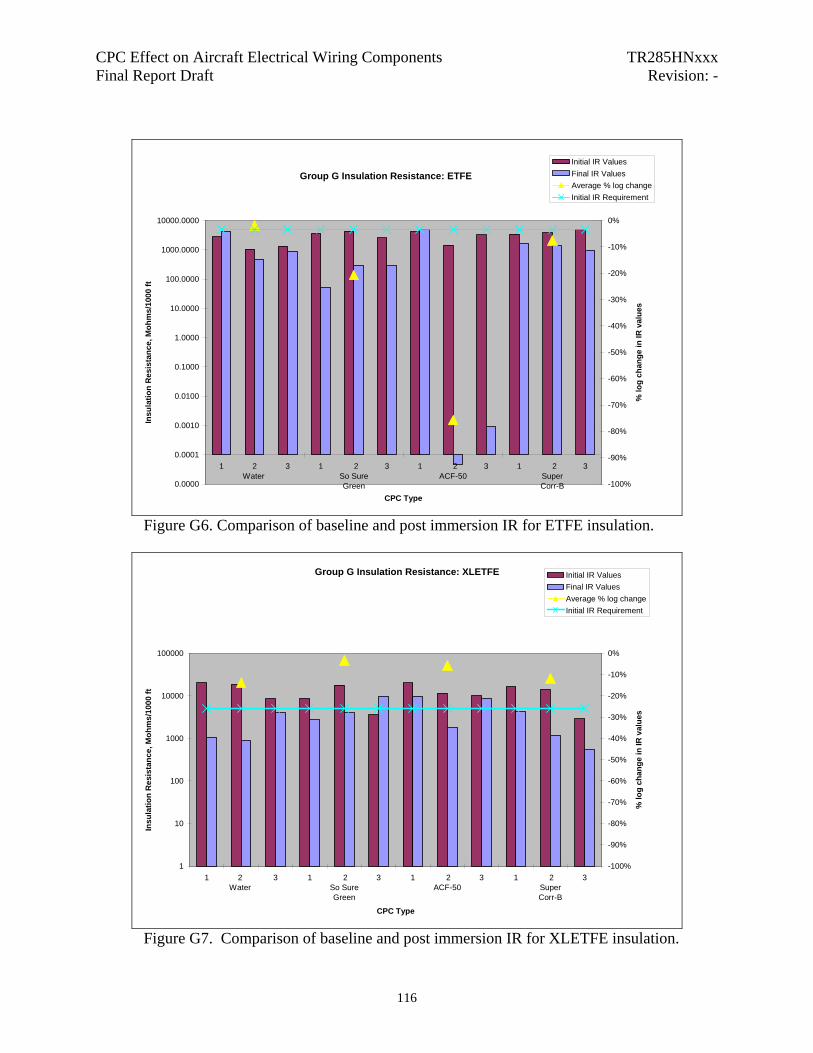
CPC Effect on Aircraft Electrical Wiring Components TR285HNxxx Final Report Draft Revision: -
Group G Insulation Resistance: ETFE
0.0000
0.0001
0.0010
0.0100
0.1000
1.0000
10.0000
100.0000
1000.0000
10000.0000
1 2 Water
3 1 2 So SureGreen
3 1 2 ACF-50
3 1 2 SuperCorr-B
3
CPC Type
Insu
latio
n R
esis
tanc
e, M
ohm
s/10
00 ft
-100%
-90%
-80%
-70%
-60%
-50%
-40%
-30%
-20%
-10%
0%
% lo
g ch
ange
in IR
val
ues
Initial IR ValuesFinal IR ValuesAverage % log changeInitial IR Requirement
Figure G6. Comparison of baseline and post immersion IR for ETFE insulation.
Group G Insulation Resistance: XLETFE
1
10
100
1000
10000
100000
1 2 Water
3 1 2 So SureGreen
3 1 2 ACF-50
3 1 2 SuperCorr-B
3
CPC Type
Insu
latio
n R
esis
tanc
e, M
ohm
s/10
00 ft
-100%
-90%
-80%
-70%
-60%
-50%
-40%
-30%
-20%
-10%
0%
% lo
g ch
ange
in IR
val
ues
Initial IR ValuesFinal IR ValuesAverage % log changeInitial IR Requirement
Figure G7. Comparison of baseline and post immersion IR for XLETFE insulation.
116

CPC Effect on Aircraft Electrical Wiring Components TR285HNxxx Final Report Draft Revision: -
Group G Insulation Resistance: PVC/Glass/Nylon
0.01
0.10
1.00
10.00
100.00
1000.00
1 2 Water
3 1 2 So SureGreen
3 1 2 ACF-50
3 1 2 SuperCorr-B
3
CPC Type
Insu
latio
n R
esis
tanc
e, M
ohm
s/10
00 ft
-100%
-90%
-80%
-70%
-60%
-50%
-40%
-30%
-20%
-10%
0%
% lo
g ch
ange
in IR
val
ues
Initial IR ValuesFinal IR ValuesAverage % log changeInitial IR Requirement
Figure G8. Comparison of baseline and post immersion IR for PVC/Nylon insulation.
Group G Insulation Resistance: Polyimide
1
10
100
1000
10000
100000
1 2 Water
3 1 2 So SureGreen
3 1 2 ACF-50
3 1 2 SuperCorr-B
3
CPC Type
Insu
latio
n R
esis
tanc
e, M
ohm
s/10
00 ft
-100%
-90%
-80%
-70%
-60%
-50%
-40%
-30%
-20%
-10%
0%
% lo
g ch
ange
in IR
val
ues
Initial IR ValuesFinal IR ValuesAverage % log changeInitial IR RequirementPost Hum IR Rqmnt
Figure G9. Comparison of baseline and post immersion IR for polyimide insulation.
117

CPC Effect on Aircraft Electrical Wiring Components TR285HNxxx Final Report Draft Revision: -
Group G Insulation Resistance: Poly-X
1
10
100
1000
10000
100000
1 2 Water
3 1 2 So SureGreen
3 1 2 ACF-50
3 1 2 SuperCorr-B
3
CPC Type
Insu
latio
n R
esis
tanc
e, M
ohm
s/10
00 ft
-100%
-90%
-80%
-70%
-60%
-50%
-40%
-30%
-20%
-10%
0%
% lo
g ch
ange
in IR
val
ues
Initial IR ValuesFinal IR ValuesAverage % log changeInitial IR Requirement
Figure G10. Comparison of baseline and post immersion IR for Poly-X insulation.
Group G Insulation Resistance: PI/PTFE Composite
1
10
100
1000
10000
100000
1 2 Water
3 1 2 So SureGreen
3 1 2 ACF-50
3 1 2 SuperCorr-B
3
CPC Type
Insu
latio
n R
esis
tanc
e, M
ohm
s/10
00 ft
-100%
-90%
-80%
-70%
-60%
-50%
-40%
-30%
-20%
-10%
0%%
log
chan
ge in
IR v
alue
s
Initial IR ValuesFinal IR ValuesAverage % log changeInitial IR Requirement
Figure G11. Comparison of baseline and post immersion IR for PI/PTFE composite insulation.
118

CPC Effect on Aircraft Electrical Wiring Components TR285HNxxx Final Report Draft Revision: -
Group G Insulation Resistance: Polychloroprene
0.000
0.001
0.010
0.100
1.000
10.000
100.000
1000.000
1 2 Water
3 1 2 So SureGreen
3 1 2 ACF-50
3 1 2 SuperCorr-B
3
CPC Type
Insu
latio
n R
esis
tanc
e, M
ohm
s/10
00 ft
-100%
-90%
-80%
-70%
-60%
-50%
-40%
-30%
-20%
-10%
0%
% lo
g ch
ange
in IR
val
ues
Initial IR ValuesFinal IR ValuesAverage % log changeInitial IR Requirement
Figure G12. Comparison of baseline and post immersion IR for polychloroprene insulation.
Group G Insulation Resistance: Polyolefin
0.0000
0.0001
0.0010
0.0100
0.1000
1.0000
10.0000
100.0000
1000.0000
1 2 Water
3 1 2 So SureGreen
3 1 2 ACF-50
3 1 2 SuperCorr-B
3
CPC Type
Insu
latio
n R
esis
tanc
e, M
ohm
s/10
00 ft
-100%
-90%
-80%
-70%
-60%
-50%
-40%
-30%
-20%
-10%
0%
% lo
g ch
ange
in IR
val
ues
Initial IR ValuesFinal IR ValuesAverage % log changeInitial IR Requirement
Figure G13. Comparison of baseline and post immersion IR for polyolefin insulation.
119

CPC Effect on Aircraft Electrical Wiring Components TR285HNxxx Final Report Draft Revision: -
Group G Insulation Resistance: Polyalkene
1
10
100
1000
10000
1 2 Water
3 1 2 So SureGreen
3 1 2 ACF-50
3 1 2 SuperCorr-B
3
CPC Type
Insu
latio
n R
esis
tanc
e, M
ohm
s/10
00 ft
-100%
-90%
-80%
-70%
-60%
-50%
-40%
-30%
-20%
-10%
0%
% lo
g ch
ange
in IR
val
ues
Initial IR ValuesFinal IR ValuesAverage % log changeInitial IR Requirement
Figure G14. Comparison of baseline and post immersion IR for XL polyalkene insulation.
Group G Insulation Resistance: PTFE
1
10
100
1000
10000
100000
1 2 Water
3 1 2 So SureGreen
3 1 2 ACF-50
3 1 2 SuperCorr-B
3
CPC Type
Insu
latio
n R
esis
tanc
e, M
ohm
s/10
00 ft
-100%
-90%
-80%
-70%
-60%
-50%
-40%
-30%
-20%
-10%
0%
% lo
g ch
ange
in IR
val
ues
Initial IR ValuesFinal IR ValuesAverage % log changeInitial IR Requirement
Figure G15. Comparison of baseline and post immersion IR for PTFE insulation.
120
CPC Effect on Aircraft Electrical Wiring Components TR285HNxxx Final Report Draft Revision: -
End of Document
121