CORROSION OF STRUCTURAL MATERIALS IN LIQUID METALS …€¦ · · 2013-03-27corrosion of...
13
CORROSION OF STRUCTURAL MATERIALS IN LIQUID METALS USED AS FAST REACTOR COOLANTS FR’13, Paris, France| 1 F. Balbaud-Célérier, 2 J.L. Courouau, 2 L. Martinelli 1 DEN, DADN, CEA/Saclay, France, [email protected] 2 Laboratoire d’Etude de la Corrosion Non Aqueuse, CEA/Saclay, France | PAGE 1
-
Upload
trinhthuan -
Category
Documents
-
view
217 -
download
3
Transcript of CORROSION OF STRUCTURAL MATERIALS IN LIQUID METALS …€¦ · · 2013-03-27corrosion of...

CORROSION OF STRUCTURAL
MATERIALS IN LIQUID METALS
USED AS FAST REACTOR
COOLANTS
FR’13, Paris, France|1F. Balbaud-Célérier, 2J.L. Courouau, 2L. Martinelli1DEN, DADN, CEA/Saclay, France, [email protected]
2Laboratoire d’Etude de la Corrosion Non Aqueuse, CEA/Saclay, France
| PAGE 1

USE OF LIQUID METALS AS COOLANTS FOR
NUCLEAR SYSTEMS
13 MARS 2013 CEA | FR’13, Paris, March 4-7, 2013 | PAGE 2
Pb-Li eutectic alloy (Pb-15.7 at.%Li): coolant and tritium breeder material of fusion
reactor
�reduced activation ferritic/martensitic steels, austenitic steels, ODS,
composites
Pb-Bi eutectic alloy (Pb-55 at.%Bi):
spallation target of Accelerator Driven Systems (ADS),
coolant of nuclear systems: Megapie, MYRRHA
� F/M steels, austenitic steels, ODS
Pb: coolant of lead fast reactors
� F/M steels, austenitic steels, ODS
Na: coolant of sodium fast reactors
� austenitic steels, F/M steels, ODS
Ga: plasma-facing material in fusion reactor, coolant
� austenitic steels, F/M steels

CEA | FR’13, Paris, March 4-7, 2013 | PAGE 3
THERMODYNAMIC DATA INTERESTING CORROSION
(1/3)
Solubilities of Ni in Pb and Fe in Ga and are few percents at 500°C but formation of intermetallics only in the Fe-Ga system
� Phase diagram permit to identify the stable species and the possible reactions thus the possible modes of corrosion BUT no notion of kinetics
T.B. Massalski (ed), Binary phase diagrams, 2nd edition,
ASM international, Materials Park, Ohio (1984)

-1200
-1100
-1000
-900
-800
-700
-600
-500
-400
-300
-200300 350 400 450 500 550 600 650
RT
lnP
O2
(kJ
.mo
l-1)
T (°C)
PbO
NiO
FeCr2O4
Cr2O3
Fe/Fe3O4Fe/FeO
FeO/Fe3O
Na2O
NaCrO2
Li2O
SiO2
Al2O3
13 MARS 2013 CEA | FR’13, Paris, March 4-7, 2013 | PAGE 4
Reaction between the liquid metal, the solid
material and dissolved impurities in the liquid alloy:
O, CE
Formation of oxides with the liquid metal: risk of
precipitation � process information
Stability of metallic oxides (existence of these
compounds given by phase diagrams) compared
to pure metals depending on T, dissolved impurity
concentration: dissolution or oxidation process
Identification of the constituents of the steels that
can improve the material corrosion behaviour:
Si, Al
� Possibility to form oxides in liquid Pb, Pb-Bi
� Possibility to form ternary oxides in sodium
� Possibility to control the behaviour of the steels
through the chemistry of the coolant
THERMODYNAMIC DATA INTERESTING CORROSION
(2/3)

CEA | FR’13, Paris, March 4-7, 2013 | PAGE 5
THERMODYNAMIC DATA INTERESTING CORROSION
(3/3)
1.E-08
1.E-07
1.E-06
1.E-05
1.E-04
1.E-03
1.E-02
1.E-01
1.E+00
100 200 300 400 500 600 700 800
SF
e(w
t %
)
T (°C)
Fe(Pb)
Fe(Na)
Fe(PbBi)
Fe(PbLi)
Fe(Ga)
Solubility of iron in the liquid metals:
SFe(Ga) >> other liquid metals
Other solubilities in sodium and lead
alloys varying in two orders of magnitude
Tendency: SFe(Na) < SFe (Pb alloys)
� Thermodynamic data give the stable state
of the system BUT no information on the
kinetics of the reactions
Three main corrosion modes:
- Dissolution
- Formation of intermetallics
- Reaction with dissolved impurities in the liquid alloy
� Need for corrosion tests to acquire kinetic data and
identify the corrosion mechanisms

DISSOLUTION OF STEELS IN SODIUM AND LEAD
ALLOYS (1/2)
13 MARS 2013 | PAGE 6CEA | FR’13, Paris, March 4-7, 2013
Determination of empirical laws: engineering
approach, first choice of materials
1.E-03
1.E-02
1.E-01
1.E+00
1.E+01
1.E+02
1.E+03
1.E+04
1.E+05
0.001 0.0011 0.0012 0.0013 0.0014 0.0015 0.0016
Vco
rr (
µm
.yr-1
)
1/T (K-1)
Na high velocity range
Fe-Cr-Ni steels
[O] = 5 wppm
Pb alloys low velocity range
Fe-Cr-Ni steels
Pb alloys high velocity range
Fe-Cr-Ni steels
Pb-Li Fe-9Cr vPb-Li = 1 m.s-1
Pb-Li Fe-9Cr vPb-Li = 5 m.s-1
Na
304, 316FR, Mod Fe-9Cr steels
v = 2-4 m.s-1 T = 400-650 °C
[O] = 5 wppm
Lower dissolution rates in liquid
sodium: at 500 °C, the calculations
give a corrosion rate around 1
µm.yr-1 compared to 500 µm.yr-1 in
the high velocity domain in lead
alloys
BUT very important dispersion in
the results (several orders of
magnitude), the empirical laws are
restrictive to some materials in
specific conditions of [O], TE
No predictive capacity of these
models
� Need for more
fundamental approach to make
appropriate selections of materials and
guarantee their life durationsThermodynamics
CANNOT forecast the
corrosion kinetics even for
comparison between two
LM or two materials

Chopra, Tortorelli, JNM 122-123 (1984) 1201
Immersion of 316 in flowing
Pb-17Li
T = 455°C – t = 1400h
DISSOLUTION OF AUSTENITIC STEELS: Na, Pb-Li, Pb-Bi
Formation of a porous ferritic layer:
• Phase transformation from austenite to
ferrite due to a preferential dissolution of Ni
and Mn (completely depleted)
• Severely depleted in Cr. No [Cr] gradient
in the scale
[Cr] = 10 wt% at 495°C 4000h Barker, JNM 179-
181 (1991) 599-602
[Cr] = 5 wt% at 400°C and 450°C 3000h Broc, JNM 141-143 (1986) 611-616
[Cr] = 8 wt% at 450°C 4200h Coen, Fusion Eng.
Des. 14 (1991) 309-319
Immersion of 316L in Pb-Bi
T = 500°C – t = 3045h
COLIMESTA device – static test
Low oxygen concentrationE. Yamaki et al. Corr Sci 53 (2011) 3075
Formation of a porous ferritic layer:
• Phase transformation from austenite to
ferrite due to a preferential dissolution of Ni
and Mn (completely depleted)
• Severely depleted in Cr. No gradient of [Cr]
in the scale
[Cr] ≈ 5 wt% at 500°C from 200 h to 3000 h
BSE
20µm
Cross section of 304 steel in Na
T = 550 °C – t = 60000h + T =
600 °C – t = 20000h
CREVONA loop (KIT)Ganesan et al., JNM 312 (2003) 174
Formation of a porous ferritic
layer:
• Phase transformation from
austenite to ferrite due to a
preferential dissolution of Ni
and Mn (completely depleted)
• Severely depleted in Cr. No
gradient of [Cr] in the scale
[Cr] ≈ 5 wt% at 500°C from
200 h to 3000 h
Borgstedt, Proceeding of MATGEN-IV,
Cargese, France, September 24 - October
6, 2007
[Ni][Cr]
17
wt%
5w
t%0
wt%
11
wt%
CEA | FR’13, Paris, March 4-7, 2013 | PAGE 7

0
0.5
1
1.5
2
2.5
3
3.5
0 1000 2000
h= 0.0072t
0
10
20
30
40
50
60
70
80
0 1000 2000 3000 4000
this study
Barker 495
Broc 400
Broc 400_2
Tortorelli 430
Tortorelli 450
Simon 500
Deloffre 500
Deloffre JNM_450
DISSOLUTION KINETICS: Na, Pb-Li, Pb-Bi
⇒ The thickness of the ferritic scale increases linearly with time
⇒ At the same temperature (500°C), corrosion rate of 316L in static Pb-Bi is higher
than in static Na (1 order of magnitude)
Time (h)
Thic
kness
of
the f
err
itic
laye
r (µ
m) Yamaki, 500
h
t
Time (h)
Thic
kness
of
the f
err
itic
laye
r (µ
m) 600°C
500°C
h=0.0009t
Pb-Bi, Pb-LiStatic Na
[O] = 1-2 ppm
Yamaki, Corrosion Science 53 (2011) 3075
CEA | FR’13, Paris, March 4-7, 2013 | PAGE 8

SUMMARY OF THE RESULTS AND CORROSION
PROCESS OF AUSTENITIC STEELS
Ferritic
layer
Nis=NidreacJ
rrrr
)( LMDiff NiJr
LM penetrations316L
h
t)(Diff NiJ
Nid
[Ni] = 0 in the ferritic scale ⇒ dissolution occurs at the 316L/ferritic scale interface ⇒diffusion in the ferritic scale occurs via LM penetrations
Linear kinetics of the variation of the ferritic layer thickness as a function of time ⇒corrosion kinetics is not controlled by diffusion in the LM penetrations: diffusion in the
boundary layer or dissolution reaction
Diffusion flux in the boundary layer is much higher than the corrosion rate ⇒ the reaction
rate of Ni dissolution limits the corrosion rate: calculation of kd
Yamaki, Corrosion Science 53 (2011) 3075
CEA | FR’13, Paris, March 4-7, 2013 | PAGE 9
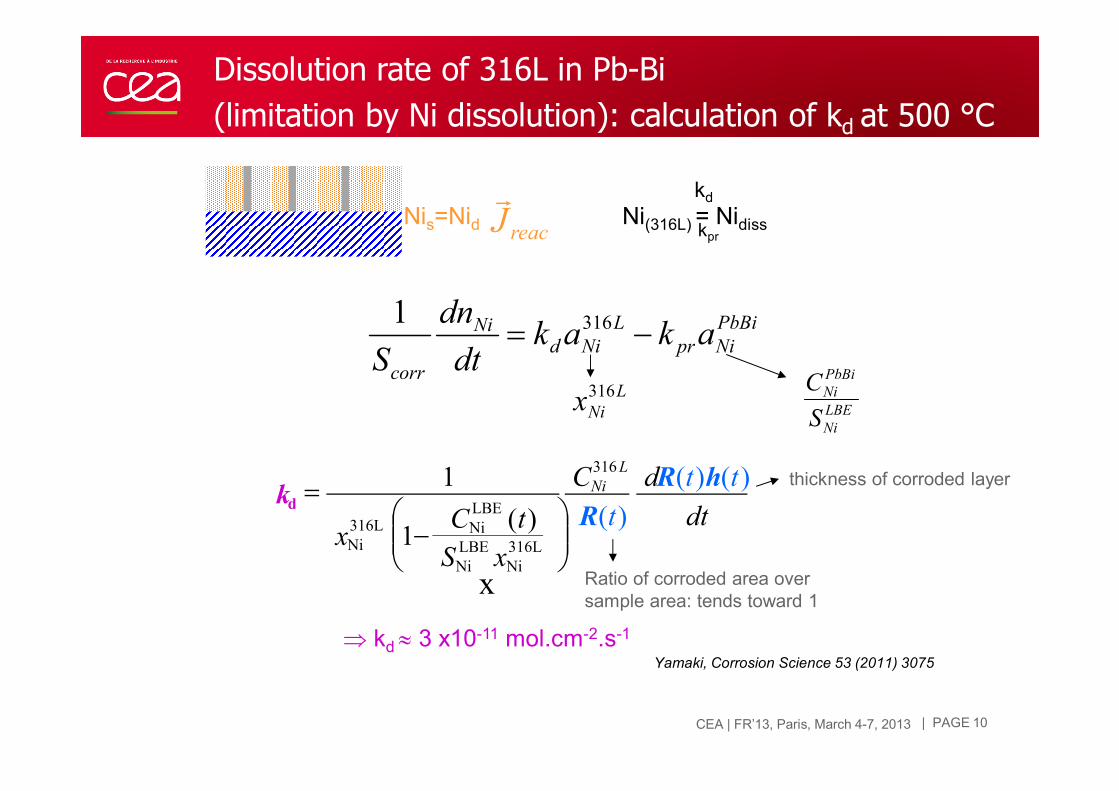
Dissolution rate of 316L in Pb-Bi
(limitation by Ni dissolution): calculation of kd at 500 °C
Ni(316L) = Nidiss
kd
kpr
Nis=Nid reacJr
dt
thtRd
tR
C
xS
tCx
k
L
Ni )()(
)()(1
1316
316L
Ni
LBE
Ni
LBE
Ni316L
Ni
d
−
=
⇒ kd ≈ 3 x10-11 mol.cm-2.s-1
x
PbBi
Nipr
L
NidNi
corr
akakdt
dn
S−= 3161
L
Nix316 LBE
Ni
PbBi
Ni
S
C
Yamaki, Corrosion Science 53 (2011) 3075
Ratio of corroded area over
sample area: tends toward 1
thickness of corroded layer
CEA | FR’13, Paris, March 4-7, 2013 | PAGE 10
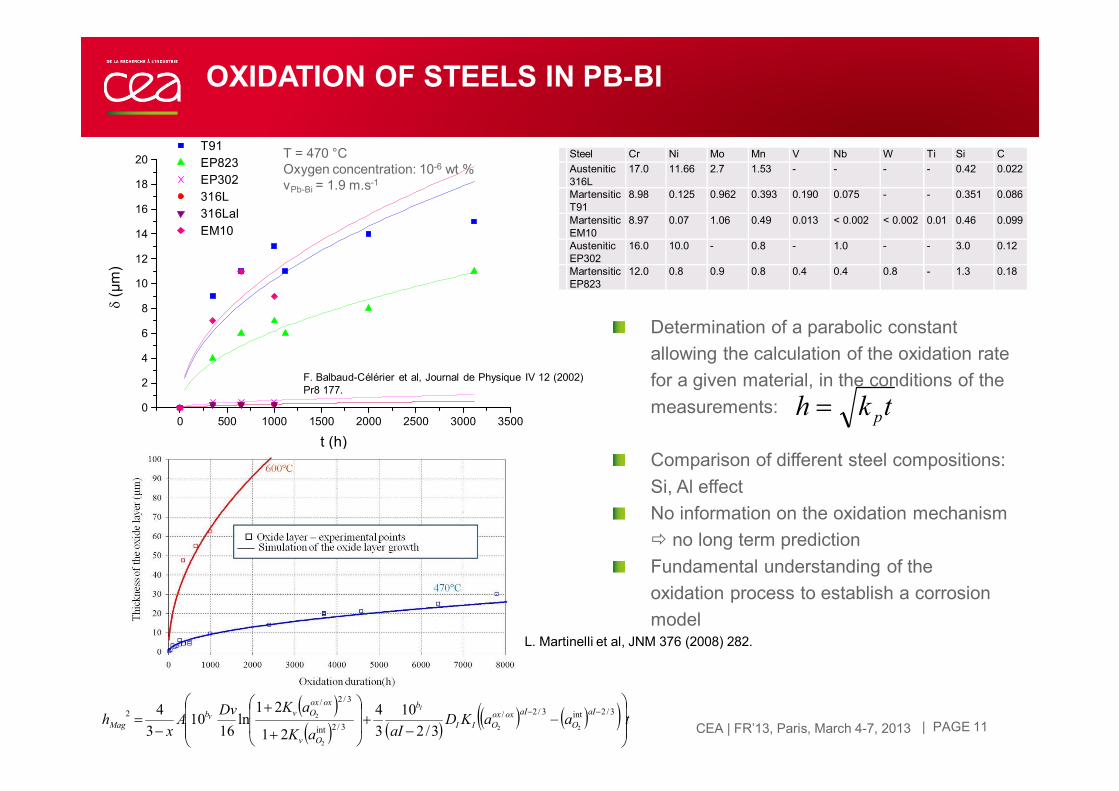
OXIDATION OF STEELS IN PB-BI
0 500 1000 1500 2000 2500 3000 3500
0
2
4
6
8
10
12
14
16
18
20
T91
EP823
EP302
316L
316Lal
EM10
δ (µ
m)
t (h)
Steel Cr Ni Mo Mn V Nb W Ti Si C
Austenitic
316L
17.0 11.66 2.7 1.53 - - - - 0.42 0.022
Martensitic
T91
8.98 0.125 0.962 0.393 0.190 0.075 - - 0.351 0.086
Martensitic
EM10
8.97 0.07 1.06 0.49 0.013 < 0.002 < 0.002 0.01 0.46 0.099
Austenitic
EP302
16.0 10.0 - 0.8 - 1.0 - - 3.0 0.12
Martensitic
EP823
12.0 0.8 0.9 0.8 0.4 0.4 0.8 - 1.3 0.18
T = 470 °C
Oxygen concentration: 10-6 wt %
vPb-Bi = 1.9 m.s-1
F. Balbaud-Célérier et al, Journal de Physique IV 12 (2002)
Pr8 177.
( )( ) ( )
( ) ( )( ) taaKDaIaK
aKDvA
xh
aI
O
aIoxox
OII
b
Ov
oxox
Ovb
Mag
I
V
−
−+
+
+
−=
−− 3/2int3/2/
3/2int
3/2/
2
22
2
2
3/2
10
3
4
21
21ln
1610
3
4
Determination of a parabolic constant
allowing the calculation of the oxidation rate
for a given material, in the conditions of the
measurements:
Comparison of different steel compositions:
Si, Al effect
No information on the oxidation mechanism
� no long term prediction
Fundamental understanding of the
oxidation process to establish a corrosion
model
tkh p=
L. Martinelli et al, JNM 376 (2008) 282.
CEA | FR’13, Paris, March 4-7, 2013 | PAGE 11

13 MARS 2013 | PAGE 12CEA | FR’13, Paris, March 4-7, 2013
CONCLUSIONS
Thermodynamic data give the stable state of the system, thecompounds susceptible to form but no information on the kineticsof the process
Need to perform corrosion tests in controlled conditions oftemperature, chemistry, hydrodynamics
Comparison of the materials behaviour: first selection of materials,optimisation of the composition
Fundamental work on the understanding of the corrosion processto develop corrosion models and predictive laws to guarantee thelong term behaviour

Direction : DENCommissariat à l’énergie atomique et aux énergies alternatives
Centre de Saclay | 91191 Gif-sur-Yvette Cedex
T. +33 (0)1 69 08 16 51| F. +33 (0)1 69 08 15 86
Etablissement public à caractère industriel et commercial | RCS Paris B 775 685 01913 MARS 2013
| PAGE 13
CEA | 10 AVRIL 2012