Corrosion Scienceuhv.cheme.cmu.edu/people/pubs/matt_2.pdfM.A. Payne et al./Corrosion Science 91...
12
High-throughput characterization of early oxidation across Al x Fe y Ni 1xy composition space Matthew A. Payne, James B. Miller, Andrew J. Gellman ⇑ Department of Chemical Engineering, Carnegie Mellon University, Pittsburgh, PA 15213, USA DOE – National Energy Technology Laboratory, P.O. Box 10940, Pittsburgh, PA 15236, USA article info Article history: Received 1 August 2014 Accepted 24 October 2014 Available online 30 October 2014 Keywords: A. Aluminium A. Iron A. Nickel B. Raman spectroscopy B. XPS C. Oxidation abstract Improving our fundamental understanding of the oxidation of multicomponent alumina-forming alloys is crucial to their ongoing development. In this work, high-throughput methods were developed to study oxidation of Al x Fe y Ni 1xy alloys in dry air at 427 °C using composition spread alloy films as combinato- rial libraries (x =0 ? 1, y =0 ? [1x]). The results divide the Al x Fe y Ni 1xy composition space into four regions of phenomenologically distinct oxidation behaviour. The boundary defining the critical Al concentration, N Al (x, y), for establishment of a passivating Al 2 O 3 scale was determined across the entire continuous Al x Fe y Ni 1xy composition space. Ó 2014 Elsevier Ltd. All rights reserved. 1. Introduction 1.1. Internal vs. external oxidation and N Al in alumina-forming alloys Metal alloys are ubiquitous in modern technology, with applica- tions in areas ranging from structural materials to electronics, catalysis, and more. Properly designed alloys can achieve other- wise-unattainable combinations of mechanical, chemical, and eco- nomic characteristics that are superior to those of any of their pure elemental components. An alloy’s functional properties arise from interactions among its component species and with the local oper- ating environment, and can vary drastically with atomic composi- tion (i.e. atomic fraction of each component). When this is the case, composition optimization becomes an integral part of alloy design. Oxidation-resistant alloys are an important example of alloys for which key properties are highly dependent on composition [1,2]. Many next-generation structural applications of alloys require continuing development and improvement of their oxidation resis- tance for use in high-temperature environments. Selection of alloy composition is often critical to achieving the desired combination of mechanical properties and oxidation resistance in thermochem- ically harsh environments [1–3]. ‘‘Alumina formers’’ are a type of metal alloy widely developed for oxidation resistance in high-temperature applications. An alu- mina former is an alloy that, under operating conditions, preferen- tially forms a continuous alumina (Al 2 O 3 ) layer or ‘‘scale’’ at or near its surface, creating a diffusion barrier that ‘‘passivates’’ the under- lying material against further oxidation, greatly retarding bulk oxi- dation [3–7]. Passivation of an alloy surface by oxide scale formation is referred to as ‘‘external oxidation’’, while progressive oxidation of the bulk is known as ‘‘internal oxidation’’ [2,7–12]. Provided that a sufficiently dense and adherent scale is main- tained, Al 2 O 3 can remain stable and protective in oxidizing envi- ronments at temperatures >1280 °C [1–4,6,13]. The a-phase of Al 2 O 3 is the most desirable and protective, but is only formed sig- nificantly at temperatures >950 °C by the conversion of more rap- idly growing, pseudo-stable Al 2 O 3 structures [4,14,15]. A minimum ‘‘critical Al concentration’’, N Al , is required in an alloy for initial establishment of a continuous Al 2 O 3 scale; for sub-critical Al con- centrations, discontinuous Al 2 O 3 is formed, leaving diffusion paths that allow continuing oxidation of the bulk [2,6,8,12,13,16]. The value of N Al is dictated by a balance between the rate of oxygen permeation into the alloy and the diffusion of Al to the alloy sur- face [8]. Design of alumina-forming alloys is complicated by the fact that increasing Al content tends to mechanically compromise alloys by increasing their brittleness [2,9,13,17–19]. For this rea- son, it is desirable in structural applications to use the lowest Al content possible, while still providing adequate oxidation resis- tance. Therefore, rational design of any multicomponent alumina http://dx.doi.org/10.1016/j.corsci.2014.10.034 0010-938X/Ó 2014 Elsevier Ltd. All rights reserved. ⇑ Corresponding author at: Carnegie Mellon University, Department of Chemical Engineering, 5000 Forbes Avenue, Pittsburgh, PA 15213, USA. Tel.: +1 (412) 268 3848. E-mail address: [email protected] (A.J. Gellman). Corrosion Science 91 (2015) 46–57 Contents lists available at ScienceDirect Corrosion Science journal homepage: www.elsevier.com/locate/corsci
Transcript of Corrosion Scienceuhv.cheme.cmu.edu/people/pubs/matt_2.pdfM.A. Payne et al./Corrosion Science 91...
Corrosion Science 91 (2015) 46–57
Contents lists available at ScienceDirect
Corrosion Science
journal homepage: www.elsevier .com/locate /corsc i
High-throughput characterization of early oxidation across AlxFeyNi1�x�y
composition space
http://dx.doi.org/10.1016/j.corsci.2014.10.0340010-938X/� 2014 Elsevier Ltd. All rights reserved.
⇑ Corresponding author at: Carnegie Mellon University, Department of ChemicalEngineering, 5000 Forbes Avenue, Pittsburgh, PA 15213, USA. Tel.: +1 (412) 2683848.
E-mail address: [email protected] (A.J. Gellman).
Matthew A. Payne, James B. Miller, Andrew J. Gellman ⇑Department of Chemical Engineering, Carnegie Mellon University, Pittsburgh, PA 15213, USADOE – National Energy Technology Laboratory, P.O. Box 10940, Pittsburgh, PA 15236, USA
a r t i c l e i n f o a b s t r a c t
Article history:Received 1 August 2014Accepted 24 October 2014Available online 30 October 2014
Keywords:A. AluminiumA. IronA. NickelB. Raman spectroscopyB. XPSC. Oxidation
Improving our fundamental understanding of the oxidation of multicomponent alumina-forming alloys iscrucial to their ongoing development. In this work, high-throughput methods were developed to studyoxidation of AlxFeyNi1�x�y alloys in dry air at 427 �C using composition spread alloy films as combinato-rial libraries (x = 0 ? 1, y = 0 ? [1�x]). The results divide the AlxFeyNi1�x�y composition space into fourregions of phenomenologically distinct oxidation behaviour. The boundary defining the critical Alconcentration, N�Al (x, y), for establishment of a passivating Al2O3 scale was determined across the entirecontinuous AlxFeyNi1�x�y composition space.
� 2014 Elsevier Ltd. All rights reserved.
1. Introduction
1.1. Internal vs. external oxidation and N�Al in alumina-forming alloys
Metal alloys are ubiquitous in modern technology, with applica-tions in areas ranging from structural materials to electronics,catalysis, and more. Properly designed alloys can achieve other-wise-unattainable combinations of mechanical, chemical, and eco-nomic characteristics that are superior to those of any of their pureelemental components. An alloy’s functional properties arise frominteractions among its component species and with the local oper-ating environment, and can vary drastically with atomic composi-tion (i.e. atomic fraction of each component). When this is the case,composition optimization becomes an integral part of alloy design.Oxidation-resistant alloys are an important example of alloys forwhich key properties are highly dependent on composition [1,2].Many next-generation structural applications of alloys requirecontinuing development and improvement of their oxidation resis-tance for use in high-temperature environments. Selection of alloycomposition is often critical to achieving the desired combinationof mechanical properties and oxidation resistance in thermochem-ically harsh environments [1–3].
‘‘Alumina formers’’ are a type of metal alloy widely developedfor oxidation resistance in high-temperature applications. An alu-mina former is an alloy that, under operating conditions, preferen-tially forms a continuous alumina (Al2O3) layer or ‘‘scale’’ at or nearits surface, creating a diffusion barrier that ‘‘passivates’’ the under-lying material against further oxidation, greatly retarding bulk oxi-dation [3–7]. Passivation of an alloy surface by oxide scaleformation is referred to as ‘‘external oxidation’’, while progressiveoxidation of the bulk is known as ‘‘internal oxidation’’ [2,7–12].Provided that a sufficiently dense and adherent scale is main-tained, Al2O3 can remain stable and protective in oxidizing envi-ronments at temperatures >1280 �C [1–4,6,13]. The a-phase ofAl2O3 is the most desirable and protective, but is only formed sig-nificantly at temperatures >950 �C by the conversion of more rap-idly growing, pseudo-stable Al2O3 structures [4,14,15]. A minimum‘‘critical Al concentration’’, N�Al, is required in an alloy for initialestablishment of a continuous Al2O3 scale; for sub-critical Al con-centrations, discontinuous Al2O3 is formed, leaving diffusion pathsthat allow continuing oxidation of the bulk [2,6,8,12,13,16]. Thevalue of N�Al is dictated by a balance between the rate of oxygenpermeation into the alloy and the diffusion of Al to the alloy sur-face [8]. Design of alumina-forming alloys is complicated by thefact that increasing Al content tends to mechanically compromisealloys by increasing their brittleness [2,9,13,17–19]. For this rea-son, it is desirable in structural applications to use the lowest Alcontent possible, while still providing adequate oxidation resis-tance. Therefore, rational design of any multicomponent alumina
AlFeNi
AlFe AlNi
FeNi
Al
Fe Ni
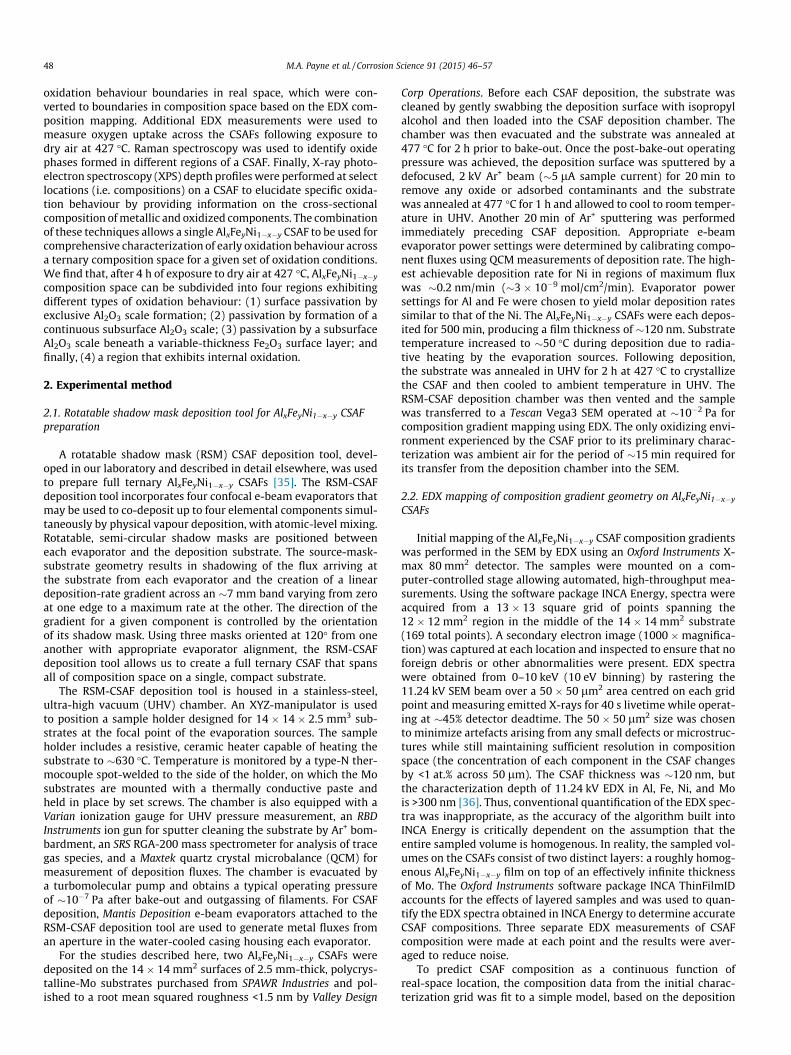
Fig. 1. Targeted spatial distribution of AlxFeyNi1�x�y CSAF compositions on thesubstrate surface. The central triangular region contains all ternary compositionsand is surrounded by full-range binary and pure-component regions.
M.A. Payne et al. / Corrosion Science 91 (2015) 46–57 47
former requires a thorough understanding of how N�Al varies acrossthe viable composition space.
1.2. Development of AlFeNi-based alumina formers
Al, Fe, and Ni are three of the main components in many alu-mina-forming structural superalloys [7,17,20–23]. Cr is oftenincluded as a fourth major component because it lowers the N�Al
needed for establishment of an Al2O3 scale by what is termed a‘‘third-element effect’’ [1–3,6,7,20,21]. In many oxidation-resistantalloys that do not contain Al (such as traditional stainless steels), Cris incorporated to allow protective Cr2O3 scale formation, but thesematerials exhibit oxidation resistance at >900 �C that is inferior tothat of the alumina formers. This is particularly true in environ-ments containing both H2O and O2 due to the formation of volatileCr-oxyhydroxides and the resulting evaporation of the scale[1–3,5,7,17,20,24,25].
AlCrFeNi-based alloys constitute a class of superalloys thatbehave as alumina-forming austenitic stainless steels (AFASSs) invarious environments at temperatures <900 �C [7,17,20,21].Increasing the Fe content of an AlCrFeNi-based AFASS decreasesraw-material cost and increases the melting point. However, Nimust be maintained at a high enough concentration to induce for-mation of a mechanically robust, austenitic (face-centred cubic)matrix structure [7,17,20,21]. Increasing the Fe, Al, and/or Cr con-tent of the AFASS stabilizes a ferritic (body-centred cubic) matrixstructure (observed at <912 �C in pure Fe), which causes brittlenessat low temperatures and poor creep resistance at high tempera-tures [7,17,20,21]. As a consequence, increases in the Al and/orCr content to improve oxidation resistance requires the replace-ment of some fraction of Fe with Ni in order to maintain mechan-ical integrity, which both makes the alloy more expensive andlowers its maximum operating temperature. Thus, as is the casewith most alumina formers, accurate knowledge of the depen-dence of N�Al on composition is central to the design of AFASS alloys.
A significant limitation to determining optimum compositionsof high-temperature AlCrFeNi-based alloys is that experimentalstudies of their properties have focused on single-compositionsamples [7,17,20,21,23]. Understanding of the influence of compo-sition on oxidation behaviour has been achieved by cumbersomemethods using large numbers of samples. Efforts to rigorouslymaximize the potential of these alloys must focus on developmentof materials models for accurate prediction of oxidation behaviouras a function of composition. Such models would be significantlyimproved by comprehensive experimental measurement of oxida-tion behaviour across continuous, multi-dimensional compositionspaces, but this is prohibitively time consuming when using sin-gle-composition alloy samples.
1.3. High-throughput assessment of AlxFeyNi1�x�y oxidation
Experimental study of alloy properties across compositionspace traditionally requires preparation and characterization of alarge set of discrete, single-composition samples. The time invest-ment required for thorough exploration of a composition spacequickly becomes impractical as either the number of componentsor the desired composition resolution increase. Measurement ofproperties in alloys can be greatly expedited through the use ofcomposition spread alloy film (CSAF) sample libraries [26]. CSAFsare substrate-supported alloy films with continuous, lateral com-position gradients. Since a ternary composition is specified bytwo, bounded degrees of freedom, an entire ternary compositionspace can, in principle, be contained on a finite, two-dimensionalsurface. CSAFs with properly positioned gradients can, therefore,serve as libraries containing all possible compositions of a ternaryalloy, as shown in Fig. 1. When coupled with rapid, spatially
resolved characterization techniques, CSAFs allow measurementof composition-property relationships across the entire ternarycomposition space in a single experiment. Such combinatorialmethods have been used increasingly for study of a diverse rangeof problems in materials science [15,19,26–29].
We have used AlxFeyNi1�x�y (subscripts designate atomic frac-tions) CSAF libraries to develop an experimental methodology forhigh-throughput assessment of oxidative passivation across alloycomposition spaces. Basic oxidation behaviour relevant to AFASSalloys and other alumina formers of interest can be observed inthe ternary AlxFeyNi1�x�y system. Of particular interest are theAlxFeyNi1�x�y composition regions that establish a protectiveAl2O3 scale under a given set of oxidation conditions, i.e. theexposure history of an initially clean alloy to various temperaturesand partial pressures of ambient O2 and/or other oxidizingspecies. Spatially resolved characterization of an oxidant-exposedAlxFeyNi1�x�y CSAF can reveal whether or not oxidation of a givencomposition has resulted in the establishment of a continuousAl2O3 passivation layer. Depending on alloy composition andthe environment to which an alumina former is exposed, apassivating Al2O3 scale may develop either at the surface or in thesubsurface beneath one or more layers of other oxides [2–4,6,8–10,12,17,18,22,30–33]. Once a continuous Al2O3 layer is established,further oxidation by scale thickening occurs with a slow parabolicgrowth rate [2,6,15]. Using AlNi alloys, Pettit showed that a secondcritical Al concentration, N��Al , is required for an alloy to supplysufficient Al to maintain this slow parabolic growth and ensurelong-term scale stability, but his findings suggest that N��Al is onlygreater than N�Al at temperatures >630 �C [34].
In this work, AlxFeyNi1�x�y CSAFs spanning all of ternary compo-sition space (x = 0 ? 1, y = 0 ? [1�x]) were deposited across14 � 14 mm2 polycrystalline Mo substrates and used for high-throughput, oxidation-characterization experiments. The targetedcomposition spread geometry is shown in Fig. 1. Our CSAF deposi-tion capabilities limit their thickness to <200 nm. Therefore, wehave focused on the early oxidation mechanisms occurring in CSAFsexposed to dry air for 64 h at 427 �C (relatively mild conditions foralumina formers). The goal was to locate the boundaries betweencomposition regions that exhibit different internal and external oxi-dation behaviour, particularly the boundary defining the critical Alcontent for establishment of a passivating Al2O3 scale, N�Al (x, y).To accomplish this, we developed a novel methodology forhigh-throughput oxidation studies on CSAFs. Characterization ofAlxFeyNi1�x�y CSAF composition gradients was performed in ascanning electron microscope (SEM) by automated compositionmapping using energy-dispersive X-ray spectroscopy (EDX). ForCSAFs exposed to dry air at 427 �C, visual analyses of oxidation-induced colour changes on their surfaces were sufficient to identify
48 M.A. Payne et al. / Corrosion Science 91 (2015) 46–57
oxidation behaviour boundaries in real space, which were con-verted to boundaries in composition space based on the EDX com-position mapping. Additional EDX measurements were used tomeasure oxygen uptake across the CSAFs following exposure todry air at 427 �C. Raman spectroscopy was used to identify oxidephases formed in different regions of a CSAF. Finally, X-ray photo-electron spectroscopy (XPS) depth profiles were performed at selectlocations (i.e. compositions) on a CSAF to elucidate specific oxida-tion behaviour by providing information on the cross-sectionalcomposition of metallic and oxidized components. The combinationof these techniques allows a single AlxFeyNi1�x�y CSAF to be used forcomprehensive characterization of early oxidation behaviour acrossa ternary composition space for a given set of oxidation conditions.We find that, after 4 h of exposure to dry air at 427 �C, AlxFeyNi1�x�y
composition space can be subdivided into four regions exhibitingdifferent types of oxidation behaviour: (1) surface passivation byexclusive Al2O3 scale formation; (2) passivation by formation of acontinuous subsurface Al2O3 scale; (3) passivation by a subsurfaceAl2O3 scale beneath a variable-thickness Fe2O3 surface layer; andfinally, (4) a region that exhibits internal oxidation.
2. Experimental method
2.1. Rotatable shadow mask deposition tool for AlxFeyNi1�x�y CSAFpreparation
A rotatable shadow mask (RSM) CSAF deposition tool, devel-oped in our laboratory and described in detail elsewhere, was usedto prepare full ternary AlxFeyNi1�x�y CSAFs [35]. The RSM-CSAFdeposition tool incorporates four confocal e-beam evaporators thatmay be used to co-deposit up to four elemental components simul-taneously by physical vapour deposition, with atomic-level mixing.Rotatable, semi-circular shadow masks are positioned betweeneach evaporator and the deposition substrate. The source-mask-substrate geometry results in shadowing of the flux arriving atthe substrate from each evaporator and the creation of a lineardeposition-rate gradient across an �7 mm band varying from zeroat one edge to a maximum rate at the other. The direction of thegradient for a given component is controlled by the orientationof its shadow mask. Using three masks oriented at 120� from oneanother with appropriate evaporator alignment, the RSM-CSAFdeposition tool allows us to create a full ternary CSAF that spansall of composition space on a single, compact substrate.
The RSM-CSAF deposition tool is housed in a stainless-steel,ultra-high vacuum (UHV) chamber. An XYZ-manipulator is usedto position a sample holder designed for 14 � 14 � 2.5 mm3 sub-strates at the focal point of the evaporation sources. The sampleholder includes a resistive, ceramic heater capable of heating thesubstrate to �630 �C. Temperature is monitored by a type-N ther-mocouple spot-welded to the side of the holder, on which the Mosubstrates are mounted with a thermally conductive paste andheld in place by set screws. The chamber is also equipped with aVarian ionization gauge for UHV pressure measurement, an RBDInstruments ion gun for sputter cleaning the substrate by Ar+ bom-bardment, an SRS RGA-200 mass spectrometer for analysis of tracegas species, and a Maxtek quartz crystal microbalance (QCM) formeasurement of deposition fluxes. The chamber is evacuated bya turbomolecular pump and obtains a typical operating pressureof �10�7 Pa after bake-out and outgassing of filaments. For CSAFdeposition, Mantis Deposition e-beam evaporators attached to theRSM-CSAF deposition tool are used to generate metal fluxes froman aperture in the water-cooled casing housing each evaporator.
For the studies described here, two AlxFeyNi1�x�y CSAFs weredeposited on the 14 � 14 mm2 surfaces of 2.5 mm-thick, polycrys-talline-Mo substrates purchased from SPAWR Industries and pol-ished to a root mean squared roughness <1.5 nm by Valley Design
Corp Operations. Before each CSAF deposition, the substrate wascleaned by gently swabbing the deposition surface with isopropylalcohol and then loaded into the CSAF deposition chamber. Thechamber was then evacuated and the substrate was annealed at477 �C for 2 h prior to bake-out. Once the post-bake-out operatingpressure was achieved, the deposition surface was sputtered by adefocused, 2 kV Ar+ beam (�5 lA sample current) for 20 min toremove any oxide or adsorbed contaminants and the substratewas annealed at 477 �C for 1 h and allowed to cool to room temper-ature in UHV. Another 20 min of Ar+ sputtering was performedimmediately preceding CSAF deposition. Appropriate e-beamevaporator power settings were determined by calibrating compo-nent fluxes using QCM measurements of deposition rate. The high-est achievable deposition rate for Ni in regions of maximum fluxwas �0.2 nm/min (�3 � 10�9 mol/cm2/min). Evaporator powersettings for Al and Fe were chosen to yield molar deposition ratessimilar to that of the Ni. The AlxFeyNi1�x�y CSAFs were each depos-ited for 500 min, producing a film thickness of �120 nm. Substratetemperature increased to �50 �C during deposition due to radia-tive heating by the evaporation sources. Following deposition,the substrate was annealed in UHV for 2 h at 427 �C to crystallizethe CSAF and then cooled to ambient temperature in UHV. TheRSM-CSAF deposition chamber was then vented and the samplewas transferred to a Tescan Vega3 SEM operated at �10�2 Pa forcomposition gradient mapping using EDX. The only oxidizing envi-ronment experienced by the CSAF prior to its preliminary charac-terization was ambient air for the period of �15 min required forits transfer from the deposition chamber into the SEM.
2.2. EDX mapping of composition gradient geometry on AlxFeyNi1�x�y
CSAFs
Initial mapping of the AlxFeyNi1�x�y CSAF composition gradientswas performed in the SEM by EDX using an Oxford Instruments X-max 80 mm2 detector. The samples were mounted on a com-puter-controlled stage allowing automated, high-throughput mea-surements. Using the software package INCA Energy, spectra wereacquired from a 13 � 13 square grid of points spanning the12 � 12 mm2 region in the middle of the 14 � 14 mm2 substrate(169 total points). A secondary electron image (1000 �magnifica-tion) was captured at each location and inspected to ensure that noforeign debris or other abnormalities were present. EDX spectrawere obtained from 0–10 keV (10 eV binning) by rastering the11.24 kV SEM beam over a 50 � 50 lm2 area centred on each gridpoint and measuring emitted X-rays for 40 s livetime while operat-ing at �45% detector deadtime. The 50 � 50 lm2 size was chosento minimize artefacts arising from any small defects or microstruc-tures while still maintaining sufficient resolution in compositionspace (the concentration of each component in the CSAF changesby <1 at.% across 50 lm). The CSAF thickness was �120 nm, butthe characterization depth of 11.24 kV EDX in Al, Fe, Ni, and Mois >300 nm [36]. Thus, conventional quantification of the EDX spec-tra was inappropriate, as the accuracy of the algorithm built intoINCA Energy is critically dependent on the assumption that theentire sampled volume is homogenous. In reality, the sampled vol-umes on the CSAFs consist of two distinct layers: a roughly homog-enous AlxFeyNi1�x�y film on top of an effectively infinite thicknessof Mo. The Oxford Instruments software package INCA ThinFilmIDaccounts for the effects of layered samples and was used to quan-tify the EDX spectra obtained in INCA Energy to determine accurateCSAF compositions. Three separate EDX measurements of CSAFcomposition were made at each point and the results were aver-aged to reduce noise.
To predict CSAF composition as a continuous function ofreal-space location, the composition data from the initial charac-terization grid was fit to a simple model, based on the deposition
M.A. Payne et al. / Corrosion Science 91 (2015) 46–57 49
geometry of the RSM-CSAF deposition tool [35]. This ‘‘compositiondistribution model’’ (CDM) assumes that each alloy component isdeposited in real space as a ‘‘wedge’’ starting at zero thicknessand increasing linearly across the width of an infinitely long banduntil a plateau value is achieved. Based on this assumption, thecomposition at all real-space locations on a ternary CSAF can bedetermined by specifying a location, orientation, gradient width,and relative maximum molar thickness of each of the three compo-nent wedges. A best-fit CDM was defined by the set of theseparameters which minimized the sum of squared errors betweenthe CDM-predicted composition and EDX-measured compositionover all 169 measurement points. The best-fit CDM describes ter-nary alloy compositions across the entire surface of the CSAF. Amore detailed description and the functional form of the CDM isprovided in Appendix A.
2.3. Oxidation and visual analysis of AlxFeyNi1�x�y CSAFs
Elevated-temperature oxidation of the two AlxFeyNi1�x�y CSAFswas performed by placing the samples in a ceramic boat in the cen-tre of a quartz tube furnace (�60 cm long, 2 cm diameter) with oneend open to atmosphere and the other end connected to a cylinderof lab-grade dry air. A regulator was used to apply a continuousflow of �1 slpm of the dry air through the furnace. The furnaceand boat were preheated to 427 �C with the air flowing. The CSAFsamples were then positioned in the boat such that only the non-CSAF side of the substrate was in contact with the boat. It takes�5 min for the temperature of a loaded CSAF to rise to within20 �C of the furnace temperature. After total exposure times, tox,of 1, 2, and 4 h, the samples were removed from the furnace andthe non-CSAF sides were placed in contact with aluminium foilto quickly dissipate heat, cooling them to near room temperaturein �2 min. The CSAFs were then photographed and loaded intothe SEM for further characterization.
Composition-dependent changes in the surface colouration ofAlxFeyNi1�x�y CSAFs occur during oxidation, and we have usedvisual analysis of this phenomenon as a tool to identify boundariesbetween regions exhibiting different oxidation behaviour. Usingimages of the oxidized CSAF surfaces after tox = 4 h, real-space loca-tions of boundaries between visually distinct regions can be con-verted to composition space boundaries using the best-fit CDMs.Visual analysis, in combination with spectroscopic characterizationtechniques that revealed the phenomenological significance tovisually identifiable regions, was used to determine continuousboundaries between regions of ternary composition space havingdifferent oxidation behaviour.
2.4. EDX, Raman, and XPS characterization of oxidized AlxFeyNi1�x�y
CSAFs
Alloy oxidation kinetics are often studied by measuring weightgain per unit surface area of the alloy as a function of time usingbulk, single-composition alloy samples [6,17,18,22,37]. Becausespatially resolved gravimetric analysis of CSAFs is infeasible, ahigh-throughput, spatially resolved, EDX-based method was devel-oped as an alternative for measuring oxygen uptake across theCSAFs. For an SEM accelerating voltage of 20 kV, the effective prob-ing depths in Al, Fe, Ni, and Mo are all about an order of magnitudegreater than the �120 nm thickness of the CSAFs [36]. As a result,Mo accounts for >85% of the raw signal in the 20 kV EDX spectraobtained from the AlxFeyNi1�x�y CSAFs on Mo substrates. As willbe shown later, the depth of oxygen penetration after tox = 4 h doesnot exceed the thickness of the CSAFs, even in the most heavily oxi-dized regions. Since the thickness of the layer containing Al, Fe, Ni,and oxygen is much smaller than the total sampled thickness, it isreasonable to assume that the oxygen EDX signal will scale linearly
with the amount of oxygen present without significantly affectingthe Mo signal and, therefore, that the total molar oxygen content atany point in the CSAF is proportional to the oxygen signal scaled bythe Mo signal. Thus, the ratio of O-to-Mo EDX signals serves as ametric that is proportional to the total oxygen mass per unit sur-face area traditionally measured using gravimetric analysis of bulkalloy samples. Using this EDX-based method, the local oxygen con-tent, CO (x, y), was measured quantitatively at tox = 0, 1, 2, and 4 hacross the two AlxFeyNi1�x�y CSAFs. The distribution of measure-ment points across each CSAF was chosen with guidance fromthe best-fit CDM to ensure a high-density sampling of most of ter-nary composition space. The CSAF compositions at the selectedpoints were measured using the same EDX/ThinFilmID proceduresas were used for the initial mapping of the CSAF composition gra-dients. After this initial measurement of the CSAF metal-compo-nent composition at each point using EDX at 11.24 kV, CO wasdetermined at each point from additional EDX spectra obtainedwith the SEM accelerating voltage increased to 20 kV, as describedabove. After tox = 0, 1, 2, and 4 h, three independent measurementsof CO were made at each location and averaged to reduce noise. Inthis way, oxygen uptake was determined with high resolutionacross AlxFeyNi1�x�y composition space.
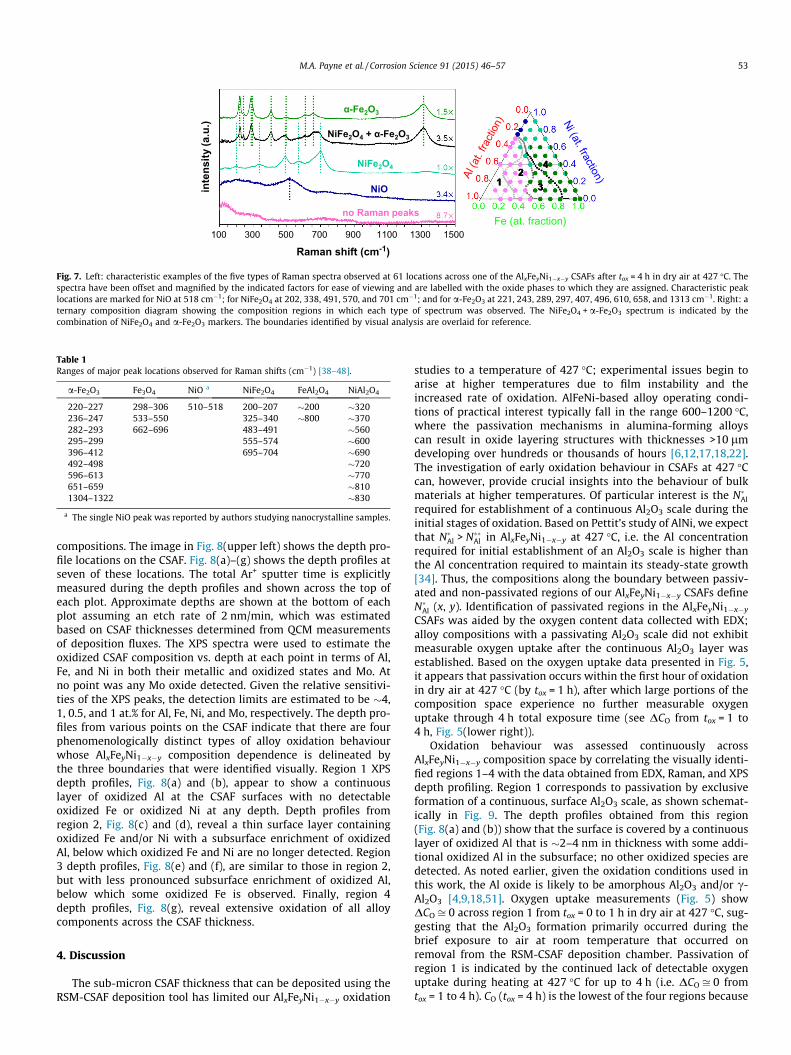
A Raman spectrum was obtained at 61 locations across one ofthe oxidized CSAFs (tox = 4 h) to identify specific oxide phases pres-ent. A Horiba-Jobin Yvon LabRam HR Raman system, equipped witha 200 mW green laser (532 nm wavelength) which was filtered to�50% intensity, was used for the measurements. The aperture sizewas 100 lm and an Olympus BX-30-LWD confocal microscope witha 50x long working distance objective was used for focusing,resulting in a beam diameter of �30 lm at the surface. Initial cal-ibration of the CCD detector was performed using Si. The Raman-shift spectrum in the range 100–1500 cm�1 was obtained at eachlocation on the CSAF by averaging ten consecutive 5 s acquisitions.A de-spike procedure was run on each spectrum using NGSLabSpecsoftware. The resulting spectra indicated the presence of a-Fe2O3,NiO, and NiFe2O4 in various regions across the oxidized CSAF.
XPS depth profiling was used to determine the cross-sectionalcomposition through the CSAF used for the Raman analysis atselect sites of interest. XPS depth profiling is a destructive tech-nique involving alternating cycles of XPS measurements andremoval of surface material from the measurement site by Ar+
etching. This allows the composition of thin (�1 nm) layers to bedetermined as a function of depth into a sample. The XPS studieswere performed using a ThermoFisher ThetaProbe instrument witha hemispherical energy analyser and an X-ray spot size of 200 lm.Survey scans across a binding energy range of 100–1200 eV with a0.25 eV step size, 0.2 s dwell time, and 200 eV pass energy wereused to confirm that no unexpected chemical species were presenton the CSAF. Subsequent scans used for quantification wereobtained over 10–14 eV ranges around the non-overlapping Al2s, Fe 2p1/2, Ni 2p3/2, and Mo 3p3/2 peaks. These scans were per-formed with a 0.05 eV step size, 0.2 s dwell time, and 100 eV passenergy. Between each set of measurements, the CSAF was uni-formly excavated across an �16 mm2 region containing the XPSanalysis site(s) by rastering a focused Ar+ beam operated at 3 kVand 1 lA with a backfilled Ar pressure of �4 � 10�3 Pa. ThermoAdvantageTM processing software was used to subtract XPS back-grounds (using the Thermo ‘‘Smart’’ background), fit peaks (usinga fixed 30% Lorentzian/Gaussian shape), and calculate peak areas.Wagner sensitivity factors were used to adjust peak areas to deter-mine relative atomic composition. Oxidation of the metal speciesincreased their peak binding energies by �2 eV. In cases wherechemical shifts caused peak splitting due to the presence of bothoxidized and metallic states of one of the components, the ratioof oxidized to metallic species was estimated by fitting the spectrausing two peaks with the metallic peak location and FWHM held
50 M.A. Payne et al. / Corrosion Science 91 (2015) 46–57
constant for all spectra from that measurement site. Furtherassignment of the oxide peaks to specific oxidation states wasnot attempted.
3. Results
3.1. Spatial characterization of AlxFeyNi1�x�y composition gradients
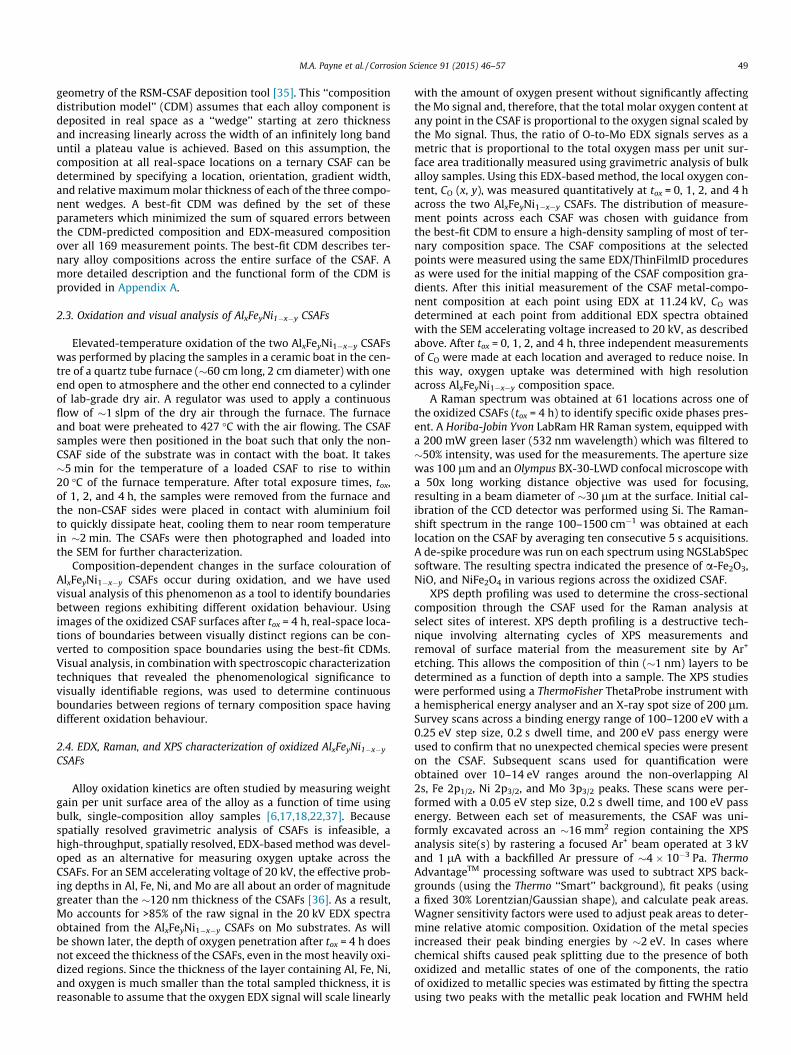
A thorough quantification of the composition distributionacross a CSAF is required for translation of real space analysis loca-tions on the CSAF into composition space. EDX was used to mapAlxFeyNi1�x�y composition across a 12 � 12 mm2 region in the cen-tre of each of the two CSAFs. Fig. 2 shows atomic composition con-tours of Al, Fe, and Ni in real space on one of the CSAFs. Thecontours are fit to spatially resolved EDX measurements of compo-sition taken on a 13 � 13 grid of points. The corresponding set of169 measured AlxFeyNi1�x�y compositions is plotted in the ternarycomposition diagram of Fig. 2. Because CSAFs are comprised ofcontinuous composition gradients, any point in composition spacelocated between any three of the sampled points must be presentat some location on the CSAF. All of AlxFeyNi1�x�y compositionspace with Al content, x < 0.95 was present within the12 � 12 mm2 region analysed. Compositions with x > 0.95 did notfall within this region of the CSAF, but were present closer to theedge of the 14 � 14 mm2 substrate. Despite slightly different gradi-ent geometries, full coverage of composition-space was alsoobtained with the second CSAF.
EDX is most quantitatively accurate when the spectral-process-ing routine is calibrated using a known standard that is as close aspossible in composition to the unknown. Because we measuredAlxFeyNi1�x�y compositions spanning the entire ternary compositionspace, selection of a single-composition standard was impossible.Therefore, EDX spectra were processed without any sample-specific calibration, and indirect comparisons have been used toassess the quantification accuracy. EDX-measured binary composi-tions were found to agree to within 2 at.% with bulk samples ofAl0.05Ni0.95, Al0.10Ni0.90, Fe0.15Ni0.85, and Fe0.30Ni0.70 alloys. Basedon three independent sets of EDX composition measurementstaken at 301 locations on one of the CSAFs, the average measure-ment-to-measurement variability for each component was found
0 2 4 6 8 10 120
2
4
6
8
10
12
y po
sitio
n (m
m)
x position (mm)
0 2 4 6 8 10 120
2
4
6
8
10
12
y po
sitio
n (m
m)
x position (mm)
Al at.% 0
95
Ni at.% 0
100
Fig. 2. Contour plots of the concentrations of Al, Fe, and Ni in one of the CSAFs as obtai12 � 12 mm2 area centred on the 14 � 14 mm2 substrate. The ternary composition diagracomplete coverage of the composition space is demonstrated. Compositions from 95 to 1
to have a standard deviation of r = 1 at.%. Rough estimates of bulkcomposition obtained from XPS depth profiles performed on unox-idized CSAFs (annealed for 2 h after deposition at 427 �C andcooled to room temperature in UHV) agree with EDX-measuredcomposition to ±5 at.% for each component. These depth profilesalso confirmed that the layering assumption used for quantifica-tion in INCA ThinFilmID is reasonable; i.e. that the AlxFeyNi1�x�y
composition is homogenous across the CSAF thickness and no sig-nificant interdiffusion between the CSAF and the Mo substrateoccurs as a result of annealing.
3.2. Visual identification of AlxFeyNi1�x�y oxidation behaviourboundaries
Visually observable changes in the colouration of AlxFeyNi1�x�y
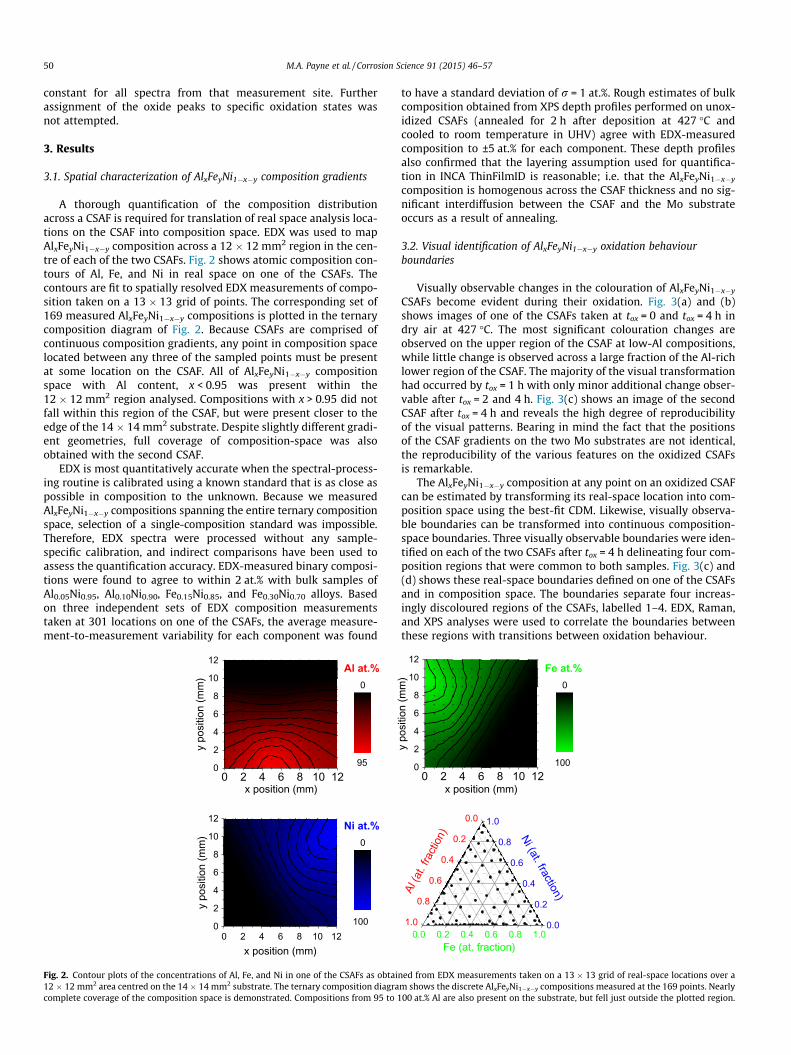
CSAFs become evident during their oxidation. Fig. 3(a) and (b)shows images of one of the CSAFs taken at tox = 0 and tox = 4 h indry air at 427 �C. The most significant colouration changes areobserved on the upper region of the CSAF at low-Al compositions,while little change is observed across a large fraction of the Al-richlower region of the CSAF. The majority of the visual transformationhad occurred by tox = 1 h with only minor additional change obser-vable after tox = 2 and 4 h. Fig. 3(c) shows an image of the secondCSAF after tox = 4 h and reveals the high degree of reproducibilityof the visual patterns. Bearing in mind the fact that the positionsof the CSAF gradients on the two Mo substrates are not identical,the reproducibility of the various features on the oxidized CSAFsis remarkable.
The AlxFeyNi1�x�y composition at any point on an oxidized CSAFcan be estimated by transforming its real-space location into com-position space using the best-fit CDM. Likewise, visually observa-ble boundaries can be transformed into continuous composition-space boundaries. Three visually observable boundaries were iden-tified on each of the two CSAFs after tox = 4 h delineating four com-position regions that were common to both samples. Fig. 3(c) and(d) shows these real-space boundaries defined on one of the CSAFsand in composition space. The boundaries separate four increas-ingly discoloured regions of the CSAFs, labelled 1–4. EDX, Raman,and XPS analyses were used to correlate the boundaries betweenthese regions with transitions between oxidation behaviour.
0 2 4 6 8 10 120
2
4
6
8
10
12
y po
sitio
n (m
m)
x position (mm)
Fe at.% 0
100
0.0 0.2 0.4 0.6 0.8 1.0
0.0
0.2
0.4
0.6
0.8
1.0 0.0
0.2
0.4
0.6
0.8
1.0
Fe (at. fraction)
ned from EDX measurements taken on a 13 � 13 grid of real-space locations over am shows the discrete AlxFeyNi1�x�y compositions measured at the 169 points. Nearly00 at.% Al are also present on the substrate, but fell just outside the plotted region.
0.0 0.2 0.4 0.6 0.8 1.0
0.0
0.2
0.4
0.6
0.8
1.0 0.0
0.2
0.4
0.6
0.8
1.0
Fe (at. fraction) Al
Fe Ni
(a) (b)
(c) (d)
1
2 3
4
1 2
3
4
Fig. 3. (a) Image of one of the AlxFeyNi1�x�y CSAFs after deposition, UHV annealingat 427 �C for 2 h, and brief (�15 min) exposure to atmosphere under ambientconditions. (b) Image of the same CSAF after oxidation in dry air for 4 h at 427 �C. (c)Cropped image (different lighting) of the second, identically oxidized AlxFeyNi1�x�y
CSAF showing boundaries identified in real-space around ‘‘visually distinct’’regions. The estimated location of the ternary triangle based on the best-fit CDMis also shown for reference. (d) Boundaries plotted in composition space via thebest-fit CDM.
0.0 0.2 0.4 0.6 0.8 1.0
0.0
0.2
0.4
0.6
0.8
1.0 0.0
0.2
0.4
0.6
0.8
1.0
0.0 0.2 0.4 0.6 0.8 1.0
0.0
0.2
0.4
0.6
0.8
1.0 0.0
0.2
0.4
0.6
0.8
1.0
Fe (at. fraction) Fe (at. fraction)
1 2
3
4
1 2
3
4
Fig. 4. Left: comparison of composition-space boundaries defining similar, visuallydistinguishable regions on the two oxidized AlxFeyNi1�x�y CSAFs as determined byvisual analysis. Right: average position of the three boundaries.
M.A. Payne et al. / Corrosion Science 91 (2015) 46–57 51
Visual analysis of CSAFs has the potential to allow extremelyrapid, high-throughput, composition-space mapping of phenomenacausing reproducible and distinguishable optical changes in CSAFs,but it is limited by the accuracy of the CDM used to translate fromreal space into composition space. The accuracy of one of the best-fit CDMs was analysed by comparing EDX-measured compositionsat interpolated, real-space locations to the CDM predictions. At220 such locations, the CDM-predicted atomic fractions of eachCSAF component i, nCDM
i , were compared to the EDX-measuredfractions, nmes
i , and the differences, ei = nCDMi � nmes
i , were calculated.The average differences were �eAl = 0.5 at.%, �eFe = �0.2 at.%, and�eNi = �0.3 at.% with standard deviations of rAl = 1.8 at.%, rFe =1.7 at.%, and rNi = 1.6 at.%. We believe that the fit of the CDM tothe real-space composition distribution is the most substantialsource of error in estimating the composition at any location onthe surface. Error arising from determination of the real space coor-dinates of visual features from images is estimated to be ±0.1 mm(corresponding to <2 at.% for each component) and should be com-parable to the CDM error. As illustrated in Fig. 3(b) and (c), the twoAlxFeyNi1�x�y CSAFs developed very similar visual appearances aftertox = 4 h. Fig. 4(left) shows a comparison of the composition-spaceboundaries separating the four regions on the two CSAFs shown inFig. 3(b) and (c). The reproducibility appears to be within theexpected error of the visual analyses. Fig. 4(right) shows an averageof the two sets of boundaries which will be used as the basis for sub-sequent discussion of the composition dependent transitionsbetween different oxidation behaviour.
3.3. EDX-measurement of oxygen uptake during AlxFeyNi1�x�y
oxidation
EDX was used for high-throughput analysis of the oxygenuptake that occurred across the CSAFs during each exposure todry air at 427 �C. Determining an appropriate set of real-spacemeasurement points required the ability to predict compositionsat locations that had not been previously analysed. Therefore, thebest-fit CDM for each CSAF was used to select 301 points thatyielded a high-density coverage of composition space, and thesewere used for oxygen content measurements. EDX/ThinFilmID
analysis at each point was used to determine its precise composi-tion for subsequent plotting of all oxygen content data. SEM imag-ing of the Al-rich (x > 0.85) regions of the CSAFs revealed evidenceof film dewetting upon annealing, so this region was not used foranalysis of oxygen uptake.
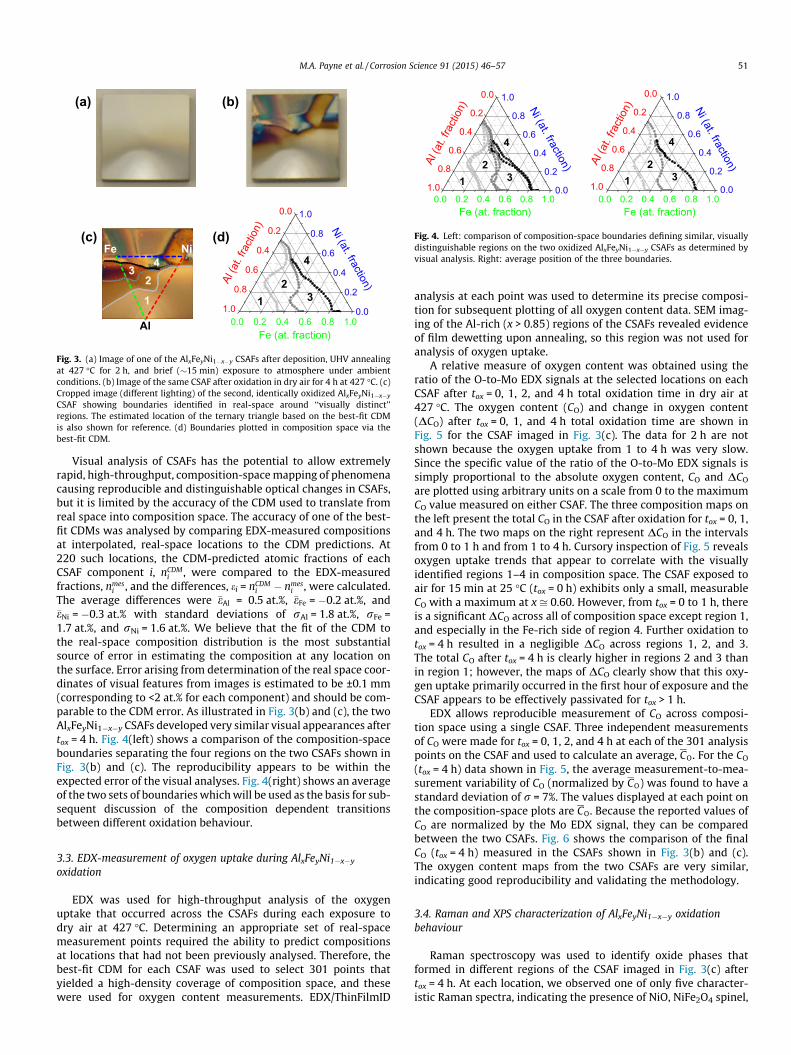
A relative measure of oxygen content was obtained using theratio of the O-to-Mo EDX signals at the selected locations on eachCSAF after tox = 0, 1, 2, and 4 h total oxidation time in dry air at427 �C. The oxygen content (CO) and change in oxygen content(DCO) after tox = 0, 1, and 4 h total oxidation time are shown inFig. 5 for the CSAF imaged in Fig. 3(c). The data for 2 h are notshown because the oxygen uptake from 1 to 4 h was very slow.Since the specific value of the ratio of the O-to-Mo EDX signals issimply proportional to the absolute oxygen content, CO and DCO
are plotted using arbitrary units on a scale from 0 to the maximumCO value measured on either CSAF. The three composition maps onthe left present the total CO in the CSAF after oxidation for tox = 0, 1,and 4 h. The two maps on the right represent DCO in the intervalsfrom 0 to 1 h and from 1 to 4 h. Cursory inspection of Fig. 5 revealsoxygen uptake trends that appear to correlate with the visuallyidentified regions 1–4 in composition space. The CSAF exposed toair for 15 min at 25 �C (tox = 0 h) exhibits only a small, measurableCO with a maximum at x ffi 0.60. However, from tox = 0 to 1 h, thereis a significant DCO across all of composition space except region 1,and especially in the Fe-rich side of region 4. Further oxidation totox = 4 h resulted in a negligible DCO across regions 1, 2, and 3.The total CO after tox = 4 h is clearly higher in regions 2 and 3 thanin region 1; however, the maps of DCO clearly show that this oxy-gen uptake primarily occurred in the first hour of exposure and theCSAF appears to be effectively passivated for tox > 1 h.
EDX allows reproducible measurement of CO across composi-tion space using a single CSAF. Three independent measurementsof CO were made for tox = 0, 1, 2, and 4 h at each of the 301 analysispoints on the CSAF and used to calculate an average, CO. For the CO
(tox = 4 h) data shown in Fig. 5, the average measurement-to-mea-surement variability of CO (normalized by CO) was found to have astandard deviation of r = 7%. The values displayed at each point onthe composition-space plots are CO. Because the reported values ofCO are normalized by the Mo EDX signal, they can be comparedbetween the two CSAFs. Fig. 6 shows the comparison of the finalCO (tox = 4 h) measured in the CSAFs shown in Fig. 3(b) and (c).The oxygen content maps from the two CSAFs are very similar,indicating good reproducibility and validating the methodology.
3.4. Raman and XPS characterization of AlxFeyNi1�x�y oxidationbehaviour
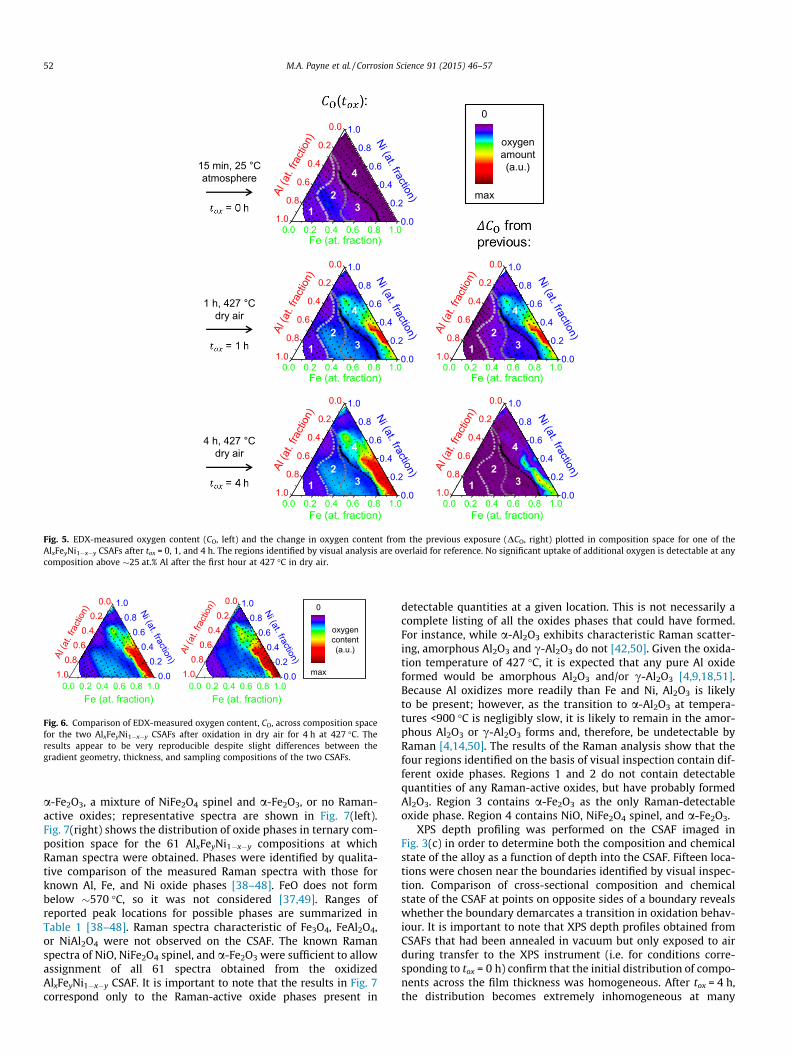
Raman spectroscopy was used to identify oxide phases thatformed in different regions of the CSAF imaged in Fig. 3(c) aftertox = 4 h. At each location, we observed one of only five character-istic Raman spectra, indicating the presence of NiO, NiFe2O4 spinel,
0.0 0.2 0.4 0.6 0.8 1.0
0.0
0.2
0.4
0.6
0.8
1.0 0.0
0.2
0.4
0.6
0.8
1.0
0.0 0.2 0.4 0.6 0.8 1.0
0.0
0.2
0.4
0.6
0.8
1.0 0.0
0.2
0.4
0.6
0.8
1.0
0.0 0.2 0.4 0.6 0.8 1.0
0.0
0.2
0.4
0.6
0.8
1.0 0.0
0.2
0.4
0.6
0.8
1.0
0.0 0.2 0.4 0.6 0.8 1.0
0.0
0.2
0.4
0.6
0.8
1.0 0.0
0.2
0.4
0.6
0.8
1.0
0.0 0.2 0.4 0.6 0.8 1.0
0.0
0.2
0.4
0.6
0.8
1.0 0.0
0.2
0.4
0.6
0.8
1.0
Fe (at. fraction)
Fe (at. fraction) Fe (at. fraction)
Fe (at. fraction) Fe (at. fraction)
oxygen amount (a.u.)
0
max 1
2 3
4
1 2
3
4
1 2
3
4
1 2
3
4
1 2
3
4
15 min, 25 °C atmosphere
1 h, 427 °C dry air
4 h, 427 °C dry air
Fig. 5. EDX-measured oxygen content (CO, left) and the change in oxygen content from the previous exposure (DCO, right) plotted in composition space for one of theAlxFeyNi1�x�y CSAFs after tox = 0, 1, and 4 h. The regions identified by visual analysis are overlaid for reference. No significant uptake of additional oxygen is detectable at anycomposition above �25 at.% Al after the first hour at 427 �C in dry air.
0.0 0.2 0.4 0.6 0.8 1.0
0.00.2
0.40.6
0.81.0 0.0
0.20.4
0.60.8
1.0
0.0 0.2 0.4 0.6 0.8 1.0
0.00.2
0.40.6
0.81.0 0.0
0.20.4
0.60.8
1.0
oxygen content (a.u.)
0
max
Fe (at. fraction) Fe (at. fraction)
Fig. 6. Comparison of EDX-measured oxygen content, CO, across composition spacefor the two AlxFeyNi1�x�y CSAFs after oxidation in dry air for 4 h at 427 �C. Theresults appear to be very reproducible despite slight differences between thegradient geometry, thickness, and sampling compositions of the two CSAFs.
52 M.A. Payne et al. / Corrosion Science 91 (2015) 46–57
a-Fe2O3, a mixture of NiFe2O4 spinel and a-Fe2O3, or no Raman-active oxides; representative spectra are shown in Fig. 7(left).Fig. 7(right) shows the distribution of oxide phases in ternary com-position space for the 61 AlxFeyNi1�x�y compositions at whichRaman spectra were obtained. Phases were identified by qualita-tive comparison of the measured Raman spectra with those forknown Al, Fe, and Ni oxide phases [38–48]. FeO does not formbelow �570 �C, so it was not considered [37,49]. Ranges ofreported peak locations for possible phases are summarized inTable 1 [38–48]. Raman spectra characteristic of Fe3O4, FeAl2O4,or NiAl2O4 were not observed on the CSAF. The known Ramanspectra of NiO, NiFe2O4 spinel, and a-Fe2O3 were sufficient to allowassignment of all 61 spectra obtained from the oxidizedAlxFeyNi1�x�y CSAF. It is important to note that the results in Fig. 7correspond only to the Raman-active oxide phases present in
detectable quantities at a given location. This is not necessarily acomplete listing of all the oxides phases that could have formed.For instance, while a-Al2O3 exhibits characteristic Raman scatter-ing, amorphous Al2O3 and c-Al2O3 do not [42,50]. Given the oxida-tion temperature of 427 �C, it is expected that any pure Al oxideformed would be amorphous Al2O3 and/or c-Al2O3 [4,9,18,51].Because Al oxidizes more readily than Fe and Ni, Al2O3 is likelyto be present; however, as the transition to a-Al2O3 at tempera-tures <900 �C is negligibly slow, it is likely to remain in the amor-phous Al2O3 or c-Al2O3 forms and, therefore, be undetectable byRaman [4,14,50]. The results of the Raman analysis show that thefour regions identified on the basis of visual inspection contain dif-ferent oxide phases. Regions 1 and 2 do not contain detectablequantities of any Raman-active oxides, but have probably formedAl2O3. Region 3 contains a-Fe2O3 as the only Raman-detectableoxide phase. Region 4 contains NiO, NiFe2O4 spinel, and a-Fe2O3.
XPS depth profiling was performed on the CSAF imaged inFig. 3(c) in order to determine both the composition and chemicalstate of the alloy as a function of depth into the CSAF. Fifteen loca-tions were chosen near the boundaries identified by visual inspec-tion. Comparison of cross-sectional composition and chemicalstate of the CSAF at points on opposite sides of a boundary revealswhether the boundary demarcates a transition in oxidation behav-iour. It is important to note that XPS depth profiles obtained fromCSAFs that had been annealed in vacuum but only exposed to airduring transfer to the XPS instrument (i.e. for conditions corre-sponding to tox = 0 h) confirm that the initial distribution of compo-nents across the film thickness was homogeneous. After tox = 4 h,the distribution becomes extremely inhomogeneous at many
100 300 500 700 900 1100 1300 1500
inte
nsity
(a.u
.)
Raman shift (cm-1)
α-Fe2O3
NiFe2O4
NiFe2O4 + α-Fe2O3
NiO
no Raman peaks Fe (at. fraction)
1 2
3
4
Fig. 7. Left: characteristic examples of the five types of Raman spectra observed at 61 locations across one of the AlxFeyNi1�x�y CSAFs after tox = 4 h in dry air at 427 �C. Thespectra have been offset and magnified by the indicated factors for ease of viewing and are labelled with the oxide phases to which they are assigned. Characteristic peaklocations are marked for NiO at 518 cm�1; for NiFe2O4 at 202, 338, 491, 570, and 701 cm�1; and for a-Fe2O3 at 221, 243, 289, 297, 407, 496, 610, 658, and 1313 cm�1. Right: aternary composition diagram showing the composition regions in which each type of spectrum was observed. The NiFe2O4 + a-Fe2O3 spectrum is indicated by thecombination of NiFe2O4 and a-Fe2O3 markers. The boundaries identified by visual analysis are overlaid for reference.
Table 1Ranges of major peak locations observed for Raman shifts (cm�1) [38–48].
a-Fe2O3 Fe3O4 NiO a NiFe2O4 FeAl2O4 NiAl2O4
220–227 298–306 510–518 200–207 �200 �320236–247 533–550 325–340 �800 �370282–293 662–696 483–491 �560295–299 555–574 �600396–412 695–704 �690492–498 �720596–613 �770651–659 �8101304–1322 �830
a The single NiO peak was reported by authors studying nanocrystalline samples.
M.A. Payne et al. / Corrosion Science 91 (2015) 46–57 53
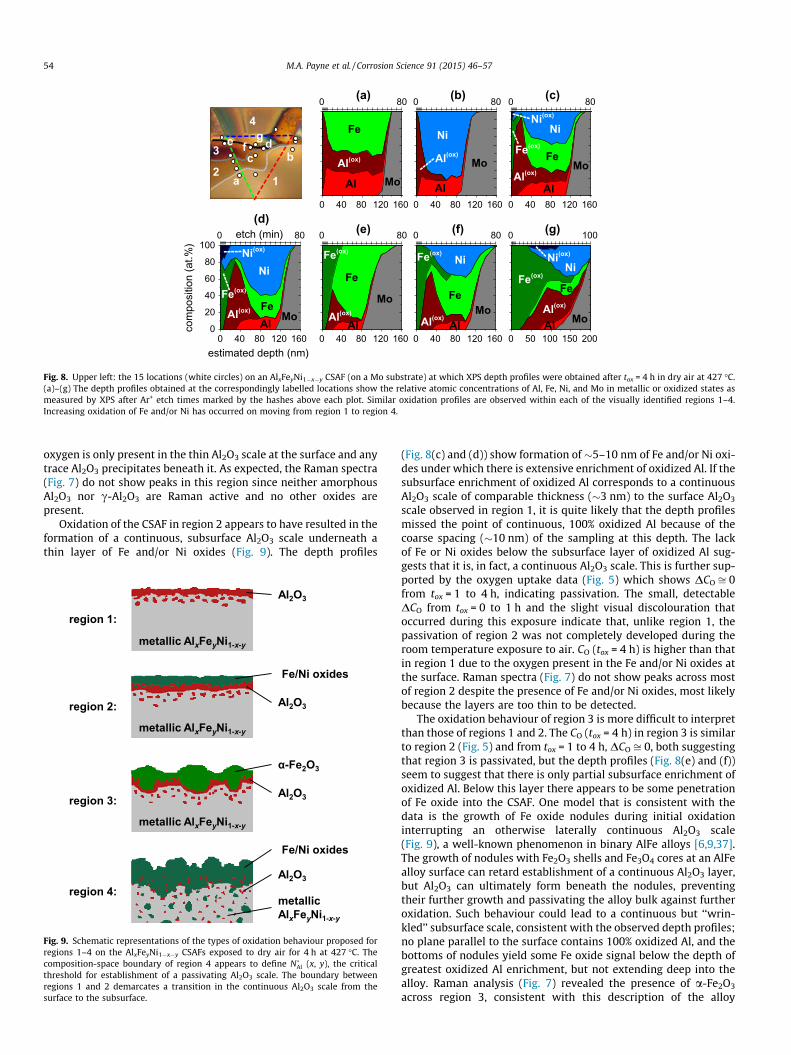
compositions. The image in Fig. 8(upper left) shows the depth pro-file locations on the CSAF. Fig. 8(a)–(g) shows the depth profiles atseven of these locations. The total Ar+ sputter time is explicitlymeasured during the depth profiles and shown across the top ofeach plot. Approximate depths are shown at the bottom of eachplot assuming an etch rate of 2 nm/min, which was estimatedbased on CSAF thicknesses determined from QCM measurementsof deposition fluxes. The XPS spectra were used to estimate theoxidized CSAF composition vs. depth at each point in terms of Al,Fe, and Ni in both their metallic and oxidized states and Mo. Atno point was any Mo oxide detected. Given the relative sensitivi-ties of the XPS peaks, the detection limits are estimated to be �4,1, 0.5, and 1 at.% for Al, Fe, Ni, and Mo, respectively. The depth pro-files from various points on the CSAF indicate that there are fourphenomenologically distinct types of alloy oxidation behaviourwhose AlxFeyNi1�x�y composition dependence is delineated bythe three boundaries that were identified visually. Region 1 XPSdepth profiles, Fig. 8(a) and (b), appear to show a continuouslayer of oxidized Al at the CSAF surfaces with no detectableoxidized Fe or oxidized Ni at any depth. Depth profiles fromregion 2, Fig. 8(c) and (d), reveal a thin surface layer containingoxidized Fe and/or Ni with a subsurface enrichment of oxidizedAl, below which oxidized Fe and Ni are no longer detected. Region3 depth profiles, Fig. 8(e) and (f), are similar to those in region 2,but with less pronounced subsurface enrichment of oxidized Al,below which some oxidized Fe is observed. Finally, region 4depth profiles, Fig. 8(g), reveal extensive oxidation of all alloycomponents across the CSAF thickness.
4. Discussion
The sub-micron CSAF thickness that can be deposited using theRSM-CSAF deposition tool has limited our AlxFeyNi1�x�y oxidation
studies to a temperature of 427 �C; experimental issues begin toarise at higher temperatures due to film instability and theincreased rate of oxidation. AlFeNi-based alloy operating condi-tions of practical interest typically fall in the range 600–1200 �C,where the passivation mechanisms in alumina-forming alloyscan result in oxide layering structures with thicknesses >10 lmdeveloping over hundreds or thousands of hours [6,12,17,18,22].The investigation of early oxidation behaviour in CSAFs at 427 �Ccan, however, provide crucial insights into the behaviour of bulkmaterials at higher temperatures. Of particular interest is the N�Al
required for establishment of a continuous Al2O3 scale during theinitial stages of oxidation. Based on Pettit’s study of AlNi, we expectthat N�Al > N��Al in AlxFeyNi1�x�y at 427 �C, i.e. the Al concentrationrequired for initial establishment of an Al2O3 scale is higher thanthe Al concentration required to maintain its steady-state growth[34]. Thus, the compositions along the boundary between passiv-ated and non-passivated regions of our AlxFeyNi1�x�y CSAFs defineN�Al (x, y). Identification of passivated regions in the AlxFeyNi1�x�y
CSAFs was aided by the oxygen content data collected with EDX;alloy compositions with a passivating Al2O3 scale did not exhibitmeasurable oxygen uptake after the continuous Al2O3 layer wasestablished. Based on the oxygen uptake data presented in Fig. 5,it appears that passivation occurs within the first hour of oxidationin dry air at 427 �C (by tox = 1 h), after which large portions of thecomposition space experience no further measurable oxygenuptake through 4 h total exposure time (see DCO from tox = 1 to4 h, Fig. 5(lower right)).
Oxidation behaviour was assessed continuously acrossAlxFeyNi1�x�y composition space by correlating the visually identi-fied regions 1–4 with the data obtained from EDX, Raman, and XPSdepth profiling. Region 1 corresponds to passivation by exclusiveformation of a continuous, surface Al2O3 scale, as shown schemat-ically in Fig. 9. The depth profiles obtained from this region(Fig. 8(a) and (b)) show that the surface is covered by a continuouslayer of oxidized Al that is �2–4 nm in thickness with some addi-tional oxidized Al in the subsurface; no other oxidized species aredetected. As noted earlier, given the oxidation conditions used inthis work, the Al oxide is likely to be amorphous Al2O3 and/or c-Al2O3 [4,9,18,51]. Oxygen uptake measurements (Fig. 5) showDCO ffi 0 across region 1 from tox = 0 to 1 h in dry air at 427 �C, sug-gesting that the Al2O3 formation primarily occurred during thebrief exposure to air at room temperature that occurred onremoval from the RSM-CSAF deposition chamber. Passivation ofregion 1 is indicated by the continued lack of detectable oxygenuptake during heating at 427 �C for up to 4 h (i.e. DCO ffi 0 fromtox = 1 to 4 h). CO (tox = 4 h) is the lowest of the four regions because
a
e c
f g d
b
1 2
3
4
0 40 80 120 1600
20
40
60
80
100
-----
FeMoAl
-----
Ni(ox)
Fe(ox)
Ni
Al(ox)
0 40 80 120 160
----
FeMo
Al
Ni(ox)-----
Fe(ox)
Ni
Al(ox)
0 40 80 120 160
Fe
MoAl
Al(ox)
0 40 80 120 160
Fe
Mo
Al
Fe(ox)
Al(ox)
0 40 80 120 160
----- Mo
Al
Al(ox)
Ni
0 40 80 120 160
FeMo
Al
Fe(ox)Ni
Al(ox)
0 50 100 150 200
Fe
MoAl
Ni(ox)----
Fe(ox)Ni
Al(ox)
etch (min)0 80
com
posi
tion
(at.%
)
estimated depth (nm)
(d)
0 80(a) 0 80(b) 0
100
(c)
0 80 0 80 0
80
(e) (f) (g)
Fig. 8. Upper left: the 15 locations (white circles) on an AlxFeyNi1�x�y CSAF (on a Mo substrate) at which XPS depth profiles were obtained after tox = 4 h in dry air at 427 �C.(a)–(g) The depth profiles obtained at the correspondingly labelled locations show the relative atomic concentrations of Al, Fe, Ni, and Mo in metallic or oxidized states asmeasured by XPS after Ar+ etch times marked by the hashes above each plot. Similar oxidation profiles are observed within each of the visually identified regions 1–4.Increasing oxidation of Fe and/or Ni has occurred on moving from region 1 to region 4.
54 M.A. Payne et al. / Corrosion Science 91 (2015) 46–57
oxygen is only present in the thin Al2O3 scale at the surface and anytrace Al2O3 precipitates beneath it. As expected, the Raman spectra(Fig. 7) do not show peaks in this region since neither amorphousAl2O3 nor c-Al2O3 are Raman active and no other oxides arepresent.
Oxidation of the CSAF in region 2 appears to have resulted in theformation of a continuous, subsurface Al2O3 scale underneath athin layer of Fe and/or Ni oxides (Fig. 9). The depth profiles
Al2O3
metallic AlxFeyNi1-x-y
α-Fe2O3
Fe/Ni oxides
metallic AlxFeyNi1-x-y
metallic AlxFeyNi1-x-y
metallic AlxFeyNi1-x-y
region 1:
region 2:
region 3:
region 4:
Al2O3
Al2O3
Al2O3
Fe/Ni oxides
Fig. 9. Schematic representations of the types of oxidation behaviour proposed forregions 1–4 on the AlxFeyNi1�x�y CSAFs exposed to dry air for 4 h at 427 �C. Thecomposition-space boundary of region 4 appears to define N�Al (x, y), the criticalthreshold for establishment of a passivating Al2O3 scale. The boundary betweenregions 1 and 2 demarcates a transition in the continuous Al2O3 scale from thesurface to the subsurface.
(Fig. 8(c) and (d)) show formation of �5–10 nm of Fe and/or Ni oxi-des under which there is extensive enrichment of oxidized Al. If thesubsurface enrichment of oxidized Al corresponds to a continuousAl2O3 scale of comparable thickness (�3 nm) to the surface Al2O3
scale observed in region 1, it is quite likely that the depth profilesmissed the point of continuous, 100% oxidized Al because of thecoarse spacing (�10 nm) of the sampling at this depth. The lackof Fe or Ni oxides below the subsurface layer of oxidized Al sug-gests that it is, in fact, a continuous Al2O3 scale. This is further sup-ported by the oxygen uptake data (Fig. 5) which shows DCO ffi 0from tox = 1 to 4 h, indicating passivation. The small, detectableDCO from tox = 0 to 1 h and the slight visual discolouration thatoccurred during this exposure indicate that, unlike region 1, thepassivation of region 2 was not completely developed during theroom temperature exposure to air. CO (tox = 4 h) is higher than thatin region 1 due to the oxygen present in the Fe and/or Ni oxides atthe surface. Raman spectra (Fig. 7) do not show peaks across mostof region 2 despite the presence of Fe and/or Ni oxides, most likelybecause the layers are too thin to be detected.
The oxidation behaviour of region 3 is more difficult to interpretthan those of regions 1 and 2. The CO (tox = 4 h) in region 3 is similarto region 2 (Fig. 5) and from tox = 1 to 4 h, DCO ffi 0, both suggestingthat region 3 is passivated, but the depth profiles (Fig. 8(e) and (f))seem to suggest that there is only partial subsurface enrichment ofoxidized Al. Below this layer there appears to be some penetrationof Fe oxide into the CSAF. One model that is consistent with thedata is the growth of Fe oxide nodules during initial oxidationinterrupting an otherwise laterally continuous Al2O3 scale(Fig. 9), a well-known phenomenon in binary AlFe alloys [6,9,37].The growth of nodules with Fe2O3 shells and Fe3O4 cores at an AlFealloy surface can retard establishment of a continuous Al2O3 layer,but Al2O3 can ultimately form beneath the nodules, preventingtheir further growth and passivating the alloy bulk against furtheroxidation. Such behaviour could lead to a continuous but ‘‘wrin-kled’’ subsurface scale, consistent with the observed depth profiles;no plane parallel to the surface contains 100% oxidized Al, and thebottoms of nodules yield some Fe oxide signal below the depth ofgreatest oxidized Al enrichment, but not extending deep into thealloy. Raman analysis (Fig. 7) revealed the presence of a-Fe2O3
across region 3, consistent with this description of the alloy
0.0 0.2 0.4 0.6 0.8 1.0
0.0
0.2
0.4
0.6
0.8
1.0 0.0
0.2
0.4
0.6
0.8
1.0
Fe (at. fraction)
sub-surface Al2O3 scale w/ α-Fe2O3 nodules
internal oxidation
Sakiyama (1979), 600 °C internal oxidation
γ-Al2O3 scale w/Fe oxide nodules
γ-Al2O3 scale undertrace Fe oxides
Payne (2014), 427 °C
surface Al2O3 scale
sub-surface Al2O3 scale under thin Fe/Ni oxides
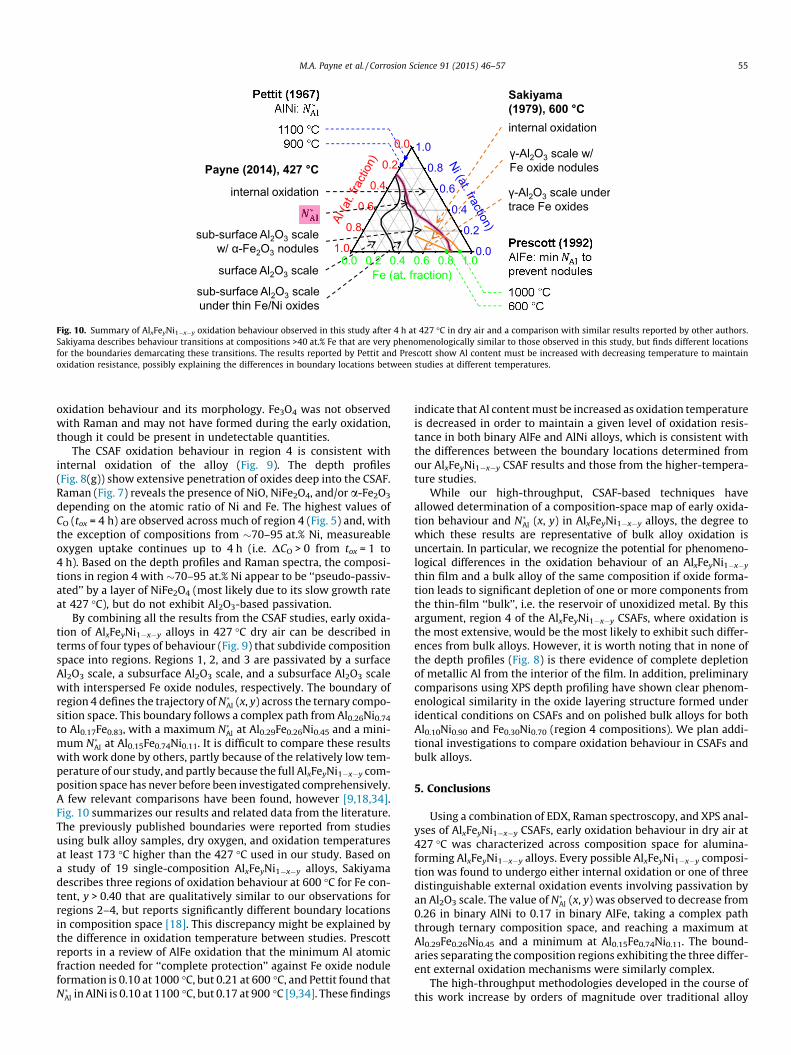
Fig. 10. Summary of AlxFeyNi1�x�y oxidation behaviour observed in this study after 4 h at 427 �C in dry air and a comparison with similar results reported by other authors.Sakiyama describes behaviour transitions at compositions >40 at.% Fe that are very phenomenologically similar to those observed in this study, but finds different locationsfor the boundaries demarcating these transitions. The results reported by Pettit and Prescott show Al content must be increased with decreasing temperature to maintainoxidation resistance, possibly explaining the differences in boundary locations between studies at different temperatures.
M.A. Payne et al. / Corrosion Science 91 (2015) 46–57 55
oxidation behaviour and its morphology. Fe3O4 was not observedwith Raman and may not have formed during the early oxidation,though it could be present in undetectable quantities.
The CSAF oxidation behaviour in region 4 is consistent withinternal oxidation of the alloy (Fig. 9). The depth profiles(Fig. 8(g)) show extensive penetration of oxides deep into the CSAF.Raman (Fig. 7) reveals the presence of NiO, NiFe2O4, and/or a-Fe2O3
depending on the atomic ratio of Ni and Fe. The highest values ofCO (tox = 4 h) are observed across much of region 4 (Fig. 5) and, withthe exception of compositions from �70–95 at.% Ni, measureableoxygen uptake continues up to 4 h (i.e. DCO > 0 from tox = 1 to4 h). Based on the depth profiles and Raman spectra, the composi-tions in region 4 with �70–95 at.% Ni appear to be ‘‘pseudo-passiv-ated’’ by a layer of NiFe2O4 (most likely due to its slow growth rateat 427 �C), but do not exhibit Al2O3-based passivation.
By combining all the results from the CSAF studies, early oxida-tion of AlxFeyNi1�x�y alloys in 427 �C dry air can be described interms of four types of behaviour (Fig. 9) that subdivide compositionspace into regions. Regions 1, 2, and 3 are passivated by a surfaceAl2O3 scale, a subsurface Al2O3 scale, and a subsurface Al2O3 scalewith interspersed Fe oxide nodules, respectively. The boundary ofregion 4 defines the trajectory of N�Al (x, y) across the ternary compo-sition space. This boundary follows a complex path from Al0.26Ni0.74
to Al0.17Fe0.83, with a maximum N�Al at Al0.29Fe0.26Ni0.45 and a mini-mum N�Al at Al0.15Fe0.74Ni0.11. It is difficult to compare these resultswith work done by others, partly because of the relatively low tem-perature of our study, and partly because the full AlxFeyNi1�x�y com-position space has never before been investigated comprehensively.A few relevant comparisons have been found, however [9,18,34].Fig. 10 summarizes our results and related data from the literature.The previously published boundaries were reported from studiesusing bulk alloy samples, dry oxygen, and oxidation temperaturesat least 173 �C higher than the 427 �C used in our study. Based ona study of 19 single-composition AlxFeyNi1�x�y alloys, Sakiyamadescribes three regions of oxidation behaviour at 600 �C for Fe con-tent, y > 0.40 that are qualitatively similar to our observations forregions 2–4, but reports significantly different boundary locationsin composition space [18]. This discrepancy might be explained bythe difference in oxidation temperature between studies. Prescottreports in a review of AlFe oxidation that the minimum Al atomicfraction needed for ‘‘complete protection’’ against Fe oxide noduleformation is 0.10 at 1000 �C, but 0.21 at 600 �C, and Pettit found thatN�Al in AlNi is 0.10 at 1100 �C, but 0.17 at 900 �C [9,34]. These findings
indicate that Al content must be increased as oxidation temperatureis decreased in order to maintain a given level of oxidation resis-tance in both binary AlFe and AlNi alloys, which is consistent withthe differences between the boundary locations determined fromour AlxFeyNi1�x�y CSAF results and those from the higher-tempera-ture studies.
While our high-throughput, CSAF-based techniques haveallowed determination of a composition-space map of early oxida-tion behaviour and N�Al (x, y) in AlxFeyNi1�x�y alloys, the degree towhich these results are representative of bulk alloy oxidation isuncertain. In particular, we recognize the potential for phenomeno-logical differences in the oxidation behaviour of an AlxFeyNi1�x�y
thin film and a bulk alloy of the same composition if oxide forma-tion leads to significant depletion of one or more components fromthe thin-film ‘‘bulk’’, i.e. the reservoir of unoxidized metal. By thisargument, region 4 of the AlxFeyNi1�x�y CSAFs, where oxidation isthe most extensive, would be the most likely to exhibit such differ-ences from bulk alloys. However, it is worth noting that in none ofthe depth profiles (Fig. 8) is there evidence of complete depletionof metallic Al from the interior of the film. In addition, preliminarycomparisons using XPS depth profiling have shown clear phenom-enological similarity in the oxide layering structure formed underidentical conditions on CSAFs and on polished bulk alloys for bothAl0.10Ni0.90 and Fe0.30Ni0.70 (region 4 compositions). We plan addi-tional investigations to compare oxidation behaviour in CSAFs andbulk alloys.
5. Conclusions
Using a combination of EDX, Raman spectroscopy, and XPS anal-yses of AlxFeyNi1�x�y CSAFs, early oxidation behaviour in dry air at427 �C was characterized across composition space for alumina-forming AlxFeyNi1�x�y alloys. Every possible AlxFeyNi1�x�y composi-tion was found to undergo either internal oxidation or one of threedistinguishable external oxidation events involving passivation byan Al2O3 scale. The value of N�Al (x, y) was observed to decrease from0.26 in binary AlNi to 0.17 in binary AlFe, taking a complex paththrough ternary composition space, and reaching a maximum atAl0.29Fe0.26Ni0.45 and a minimum at Al0.15Fe0.74Ni0.11. The bound-aries separating the composition regions exhibiting the three differ-ent external oxidation mechanisms were similarly complex.
The high-throughput methodologies developed in the course ofthis work increase by orders of magnitude over traditional alloy
(0,0)
molar gradient shapes: position on substrate:
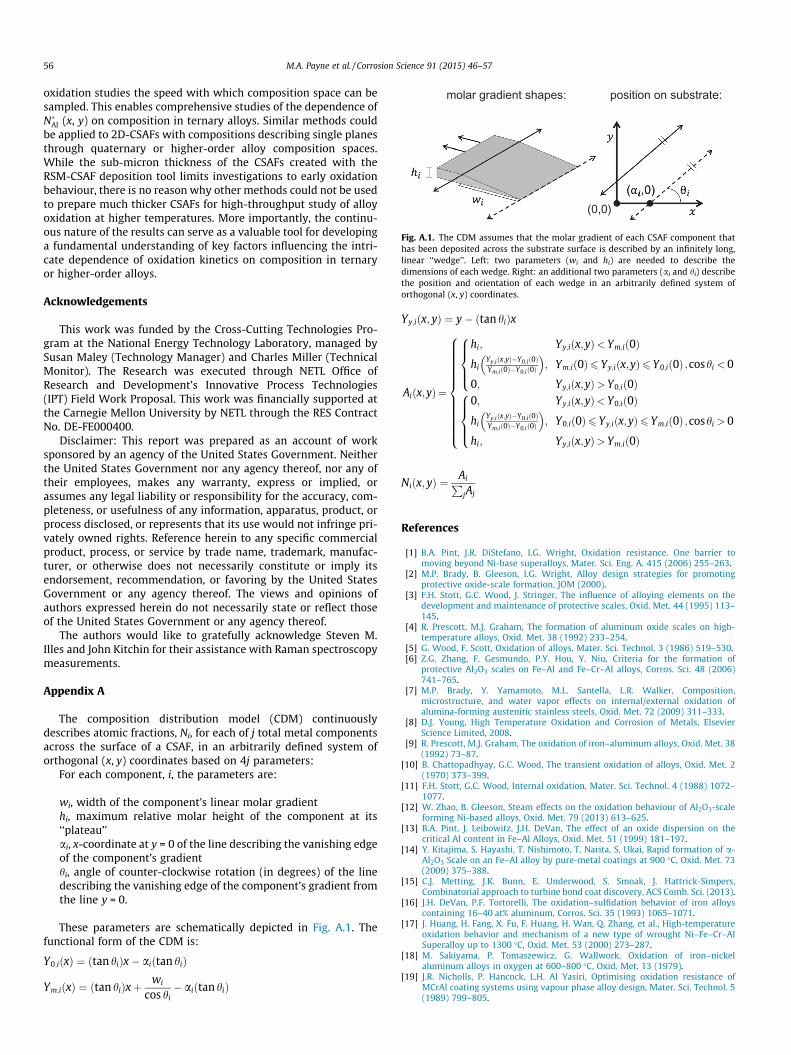
Fig. A.1. The CDM assumes that the molar gradient of each CSAF component thathas been deposited across the substrate surface is described by an infinitely long,linear ‘‘wedge’’. Left: two parameters (wi and hi) are needed to describe thedimensions of each wedge. Right: an additional two parameters (ai and hi) describethe position and orientation of each wedge in an arbitrarily defined system oforthogonal (x, y) coordinates.
56 M.A. Payne et al. / Corrosion Science 91 (2015) 46–57
oxidation studies the speed with which composition space can besampled. This enables comprehensive studies of the dependence ofN�Al (x, y) on composition in ternary alloys. Similar methods couldbe applied to 2D-CSAFs with compositions describing single planesthrough quaternary or higher-order alloy composition spaces.While the sub-micron thickness of the CSAFs created with theRSM-CSAF deposition tool limits investigations to early oxidationbehaviour, there is no reason why other methods could not be usedto prepare much thicker CSAFs for high-throughput study of alloyoxidation at higher temperatures. More importantly, the continu-ous nature of the results can serve as a valuable tool for developinga fundamental understanding of key factors influencing the intri-cate dependence of oxidation kinetics on composition in ternaryor higher-order alloys.
Acknowledgements
This work was funded by the Cross-Cutting Technologies Pro-gram at the National Energy Technology Laboratory, managed bySusan Maley (Technology Manager) and Charles Miller (TechnicalMonitor). The Research was executed through NETL Office ofResearch and Development’s Innovative Process Technologies(IPT) Field Work Proposal. This work was financially supported atthe Carnegie Mellon University by NETL through the RES ContractNo. DE-FE000400.
Disclaimer: This report was prepared as an account of worksponsored by an agency of the United States Government. Neitherthe United States Government nor any agency thereof, nor any oftheir employees, makes any warranty, express or implied, orassumes any legal liability or responsibility for the accuracy, com-pleteness, or usefulness of any information, apparatus, product, orprocess disclosed, or represents that its use would not infringe pri-vately owned rights. Reference herein to any specific commercialproduct, process, or service by trade name, trademark, manufac-turer, or otherwise does not necessarily constitute or imply itsendorsement, recommendation, or favoring by the United StatesGovernment or any agency thereof. The views and opinions ofauthors expressed herein do not necessarily state or reflect thoseof the United States Government or any agency thereof.
The authors would like to gratefully acknowledge Steven M.Illes and John Kitchin for their assistance with Raman spectroscopymeasurements.
Appendix A
The composition distribution model (CDM) continuouslydescribes atomic fractions, Ni, for each of j total metal componentsacross the surface of a CSAF, in an arbitrarily defined system oforthogonal (x, y) coordinates based on 4j parameters:
For each component, i, the parameters are:
wi, width of the component’s linear molar gradienthi, maximum relative molar height of the component at its‘‘plateau’’ai, x-coordinate at y = 0 of the line describing the vanishing edgeof the component’s gradienthi, angle of counter-clockwise rotation (in degrees) of the linedescribing the vanishing edge of the component’s gradient fromthe line y = 0.
These parameters are schematically depicted in Fig. A.1. Thefunctional form of the CDM is:
Y0;iðxÞ ¼ ðtan hiÞx� aiðtan hiÞ
Ym;iðxÞ ¼ ðtan hiÞxþwi
cos hi� aiðtan hiÞ
Yy;iðx; yÞ ¼ y� ðtan hiÞx
Aiðx;yÞ ¼
hi; Yy;iðx;yÞ< Ym;ið0Þ
hiYy;iðx;yÞ�Y0;ið0ÞYm;ið0Þ�Y0;ið0Þ
� �; Ym;ið0Þ6 Yy;iðx;yÞ6 Y0;ið0Þ
0; Yy;iðx;yÞ> Y0;ið0Þ
8>><>>:
;coshi < 0
0; Yy;iðx;yÞ< Y0;ið0Þ
hiYy;iðx;yÞ�Y0;ið0ÞYm;ið0Þ�Y0;ið0Þ
� �; Y0;ið0Þ6 Yy;iðx;yÞ6 Ym;ið0Þ
hi; Yy;iðx;yÞ> Ym;ið0Þ
8>><>>:
;coshi > 0
8>>>>>>>>>>><>>>>>>>>>>>:
Niðx; yÞ ¼AiP
jAj
References
[1] B.A. Pint, J.R. DiStefano, I.G. Wright, Oxidation resistance. One barrier tomoving beyond Ni-base superalloys, Mater. Sci. Eng. A. 415 (2006) 255–263.
[2] M.P. Brady, B. Gleeson, I.G. Wright, Alloy design strategies for promotingprotective oxide-scale formation, JOM (2000).
[3] F.H. Stott, G.C. Wood, J. Stringer, The influence of alloying elements on thedevelopment and maintenance of protective scales, Oxid. Met. 44 (1995) 113–145.
[4] R. Prescott, M.J. Graham, The formation of aluminum oxide scales on high-temperature alloys, Oxid. Met. 38 (1992) 233–254.
[5] G. Wood, F. Scott, Oxidation of alloys, Mater. Sci. Technol. 3 (1986) 519–530.[6] Z.G. Zhang, F. Gesmundo, P.Y. Hou, Y. Niu, Criteria for the formation of
protective Al2O3 scales on Fe–Al and Fe–Cr–Al alloys, Corros. Sci. 48 (2006)741–765.
[7] M.P. Brady, Y. Yamamoto, M.L. Santella, L.R. Walker, Composition,microstructure, and water vapor effects on internal/external oxidation ofalumina-forming austenitic stainless steels, Oxid. Met. 72 (2009) 311–333.
[8] D.J. Young, High Temperature Oxidation and Corrosion of Metals, ElsevierScience Limited, 2008.
[9] R. Prescott, M.J. Graham, The oxidation of iron–aluminum alloys, Oxid. Met. 38(1992) 73–87.
[10] B. Chattopadhyay, G.C. Wood, The transient oxidation of alloys, Oxid. Met. 2(1970) 373–399.
[11] F.H. Stott, G.C. Wood, Internal oxidation, Mater. Sci. Technol. 4 (1988) 1072–1077.
[12] W. Zhao, B. Gleeson, Steam effects on the oxidation behaviour of Al2O3-scaleforming Ni-based alloys, Oxid. Met. 79 (2013) 613–625.
[13] B.A. Pint, J. Leibowitz, J.H. DeVan, The effect of an oxide dispersion on thecritical Al content in Fe–Al Alloys, Oxid. Met. 51 (1999) 181–197.
[14] Y. Kitajima, S. Hayashi, T. Nishimoto, T. Narita, S. Ukai, Rapid formation of a-Al2O3 Scale on an Fe–Al alloy by pure-metal coatings at 900 �C, Oxid. Met. 73(2009) 375–388.
[15] C.J. Metting, J.K. Bunn, E. Underwood, S. Smoak, J. Hattrick-Simpers,Combinatorial approach to turbine bond coat discovery, ACS Comb. Sci. (2013).
[16] J.H. DeVan, P.F. Tortorelli, The oxidation–sulfidation behavior of iron alloyscontaining 16–40 at% aluminum, Corros. Sci. 35 (1993) 1065–1071.
[17] J. Huang, H. Fang, X. Fu, F. Huang, H. Wan, Q. Zhang, et al., High-temperatureoxidation behavior and mechanism of a new type of wrought Ni–Fe–Cr–AlSuperalloy up to 1300 �C, Oxid. Met. 53 (2000) 273–287.
[18] M. Sakiyama, P. Tomaszewicz, G. Wallwork, Oxidation of iron–nickelaluminum alloys in oxygen at 600–800 �C, Oxid. Met. 13 (1979).
[19] J.R. Nicholls, P. Hancock, L.H. Al Yasiri, Optimising oxidation resistance ofMCrAl coating systems using vapour phase alloy design, Mater. Sci. Technol. 5(1989) 799–805.
M.A. Payne et al. / Corrosion Science 91 (2015) 46–57 57
[20] Y. Yamamoto, M.P. Brady, M.L. Santella, H. Bei, P.J. Maziasz, B.A. Pint, Overviewof strategies for high-temperature creep and oxidation resistance of alumina-forming austenitic stainless steels, Metall. Mater. Trans. A 42A (2011) 922–931.
[21] M. Brady, Y. Yamamoto, M. Santella, P. Maziasz, B. Pint, C. Liu, et al., Thedevelopment of alumina-forming austenitic stainless steels for high-temperature structural use, JOM (2008) 12–18.
[22] D. Delaunay, A.M. Huntz, Mechanisms of adherence of alumina scaledeveloped during high-temperature oxidation of Fe–Ni–Cr–Al–Y alloys, J.Mater. Sci. 17 (1982) 2027–2036.
[23] H.M. Tawancy, N. Sridhar, High-temperature oxidation behavior of a Ni–Cr–Al–Fe–Y Alloy, Oxid. Met. 37 (1992) 143–166.
[24] N. Mu, K. Jung, N.M. Yanar, F.S. Pettit, G.R. Holcomb, B.H. Howard, et al., Theeffects of water vapor and hydrogen on the high-temperature oxidation ofalloys, Oxid. Met. 79 (2013) 461–472.
[25] G.R. Wallwork, A.Z. Hed, Some limiting factors in the use of alloys at hightemperatures, Oxid. Met. 3 (1971) 171–184.
[26] T. Gebhardt, D. Music, T. Takahashi, J.M. Schneider, Combinatorial thin filmmaterials science. From alloy discovery and optimization to alloy design, ThinSolid Films 520 (2012) 5491–5499.
[27] J.N. Cawse, Experimental Design for Combinatorial and High ThroughputMaterials Development, Niskayuna, 2002.
[28] A. Hagemeyer, P. Strasser, A.F.J. Volpe (Eds.), High-Throughput Screening inChemical Catalysis, WILEY-VCH Verlag GmbH & Co. KGaA, Weinheim, 2004.
[29] J.B. Gerken, J.Y.C. Chen, R.C. Massé, A.B. Powell, S.S. Stahl, Development of anO2-sensitive fluorescence-quenching assay for the combinatorial discovery ofelectrocatalysts for water oxidation, Angew. Chem. Int. Ed. Engl. 51 (2012)6676–6680.
[30] G.C. Wood, B. Chattopadhyay, Transient oxidation of Ni-base alloys, Corros. Sci.10 (1970) 471–480.
[31] P. Pérez, J. Jiménez, G. Frommeyer, P. Adeva, Oxidation behaviour of a Ti–46Al–1Mo–0.2 Si alloy: the effect of Mo addition and alloy microstructure, Mater.Sci. 284 (2000) 138–147.
[32] J. Jedlinski, A. Glazkov, M. Konopka, G. Borchardt, E. Tscherkasova, M. Bronfin,et al., An XPS/SEM/EDX study of the early oxidation stages of the Fe–19Cr–5Al(+Y) alumina-forming alloys, Appl. Surf. 103 (1996) 205–216.
[33] C. Giggins, F. Pettit, Oxidation of Ni–Cr–Al alloys between 1000� and 1200 �C, J.Electrochem. Soc. (1971) 1782–1790.
[34] F.S. Pettit, Oxidation mechanisms for nickel–aluminum alloys at temperaturesbetween 900� and 1300 �C, Trans. Metall. Soc. AIME 239 (1967) 1296–1305.
[35] B. Fleutot, J.B. Miller, A.J. Gellman, Apparatus for deposition of compositionspread alloy films: the rotatable shadow mask, J. Vac. Sci. Technol. A Vacuum,Surfaces, Film 30 (2012). 061511: 1-10.
[36] J.C. Russ, Fundamentals of Energy Dispersive X-ray Analysis, Butterworth& CoLtd., 1984.
[37] W. Boggs, The oxidation of iron–aluminum alloys from 450� to 900 �C, J.Electrochem. Soc. 242 (1971) 906–913.
[38] N. Dharmaraj, P. Prabu, S. Nagarajan, C.H. Kim, J.H. Park, H.Y. Kim, Synthesis ofnickel oxide nanoparticles using nickel acetate and poly(vinyl acetate)precursor, Mater. Sci. Eng. B 128 (2006) 111–114.
[39] X. Li, A. Dhanabalan, C. Wang, Enhanced electrochemical performance ofporous NiO–Ni nanocomposite anode for lithium ion batteries, J. PowerSources 196 (2011) 9625–9630.
[40] L.-J. Chen, G.-S. Li, P. Qi, L.-P. Li, Thermal decomposition of ammoniumperchlorate activated via addition of NiO nanocrystals, J. Therm. Anal. Calorim.92 (2008) 765–769.
[41] D.L.A. de Faria, S.V. Silva, M.T. de Oliveira, Raman microspectroscopy of someiron oxides and oxyhydroxides, J. Raman Spectrosc. 28 (1997) 873–878.
[42] M. Lübbe, A.M. Gigler, R.W. Stark, W. Moritz, Identification of iron oxide phasesin thin films grown on Al2O3(0001) by Raman spectroscopy and X-raydiffraction, Surf. Sci. 604 (2010) 679–685.
[43] C. Schlueter, M. Lübbe, a.M. Gigler, W. Moritz, Growth of iron oxides onAg(111) – reversible Fe2O3/Fe3O4 transformation, Surf. Sci. 605 (2011) 1986–1993.
[44] J. Landon, E. Demeter, I. Nilay, C. Keturakis, I.E. Wachs, R. Vasic, et al.,Spectroscopic characterization of mixed Fe–Ni oxide electrocatalysts for theoxygen evolution reaction in alkaline electrolytes, ACS Catal. 2 (2012) 1793–1801.
[45] Y. Shi, J. Ding, Z.X. Shen, W.X. Sun, L. Wang, Strong uni-directional anisotropyin disordered NiFe2O4, Solid State Commun. 115 (2000) 237–241.
[46] A. Ahlawat, V.G. Sathe, V.R. Reddy, A. Gupta, Mossbauer, Raman and X-raydiffraction studies of superparamagnetic NiFe2O4 nanoparticles prepared bysol–gel auto-combustion method, J. Magn. Magn. Mater. 323 (2011) 2049–2054.
[47] A.W. Weimer, D. Arifin, X. Liang, V. Aston, P. Lichty, Solar-thermal ALD ferrite-based water splitting cycle, DOE Annu. Prog. Rep. II.E.4 (2012) 64–67.
[48] M.a. Laguna-Bercero, M.L. Sanjuán, R.I. Merino, Raman spectroscopic study ofcation disorder in poly- and single crystals of the nickel aluminate spinel, J.Phys. Condens. Matter. 19 (2007) 186217.
[49] B. Sundman, An assessment of the Fe–O system, J. Phase Equilibria 12 (1991)127–140.
[50] A. Aminzadeh, H. Sarikhani-fard, Raman spectroscopic study of Ni/Al2O3
catalyst, Spectrochim. Acta 55 (1999) 1421–1425.[51] M.a. Trunov, M. Schoenitz, X. Zhu, E.L. Dreizin, Effect of polymorphic phase
transformations in Al2O3 film on oxidation kinetics of aluminum powders,Combust. Flame. 140 (2005) 310–318.