Correlation Coefficients Pearson’s Product Moment Correlation Coefficient interval or ratio data...
29
-
Upload
primrose-bates -
Category
Documents
-
view
229 -
download
0
Transcript of Correlation Coefficients Pearson’s Product Moment Correlation Coefficient interval or ratio data...


Correlation Coefficients
• Pearson’s Product Moment Correlation
Coefficient
interval or ratio data only
• What about ordinal data?
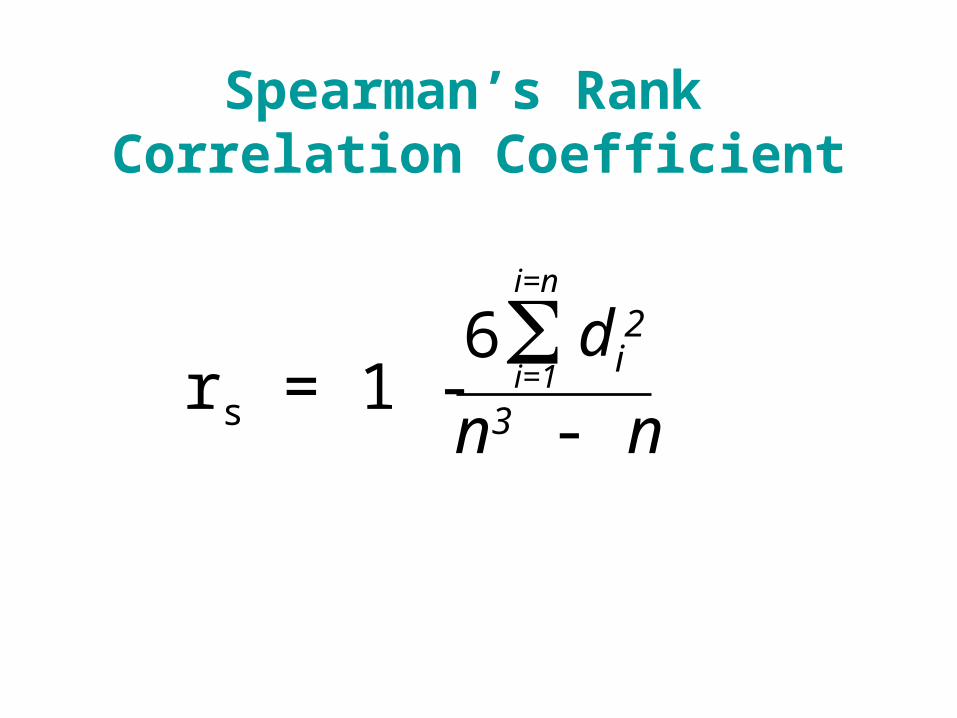
Spearman’s Rank Correlation Coefficient
rs = 1 - di
2i=1
i=n
n3 - n
6
http://www.mnstate.edu/wasson/ed602spearcorr.htm
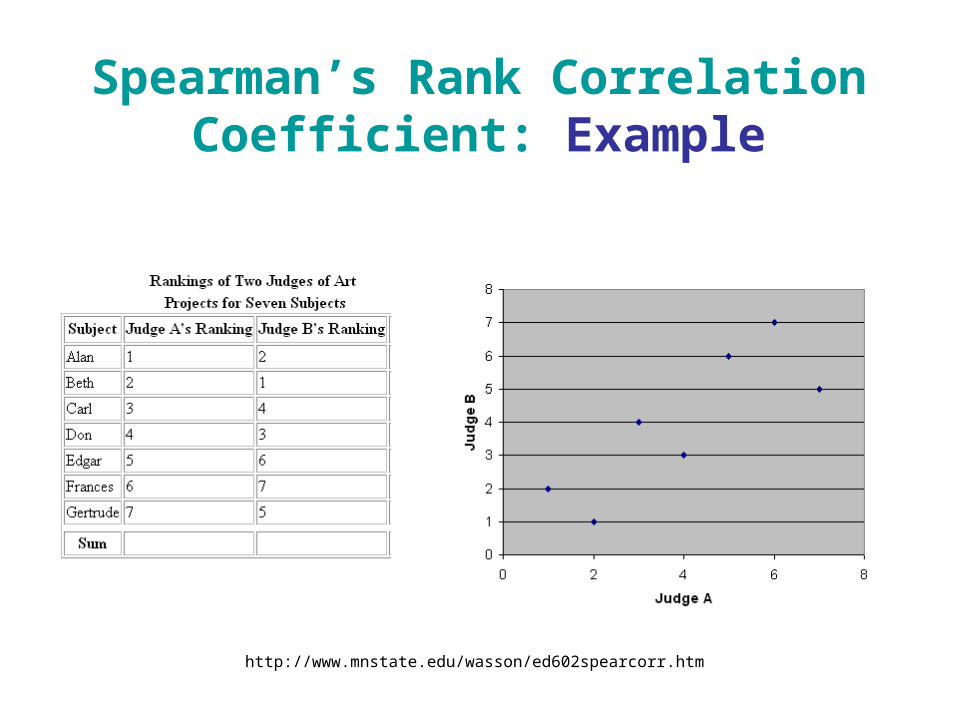
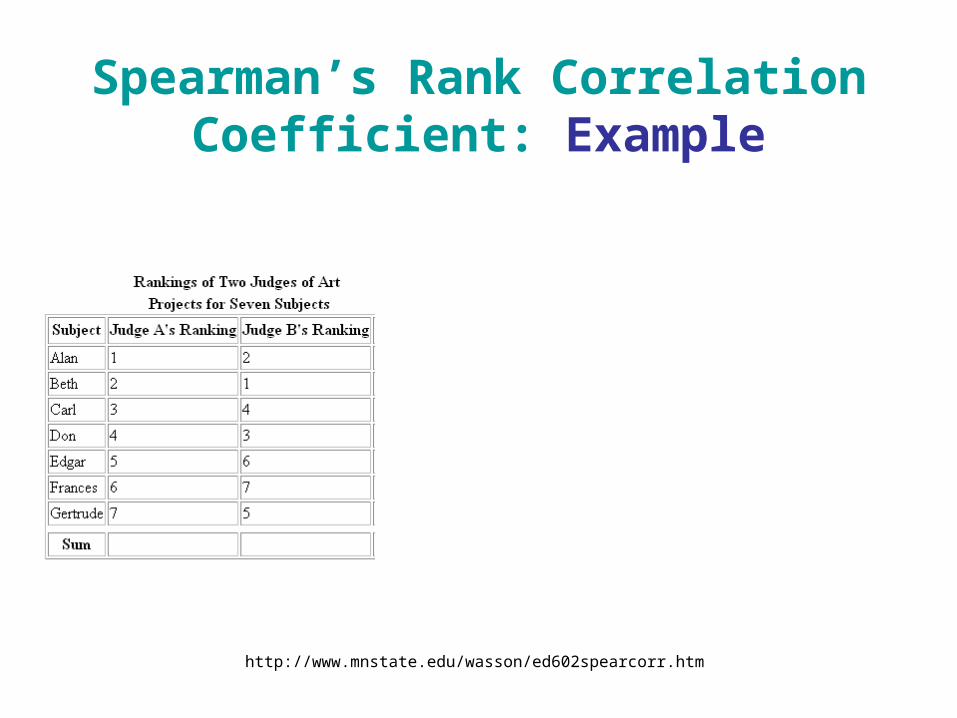
Spearman’s Rank Correlation Coefficient: Example

Spearman’s Rank Correlation Coefficient: Example
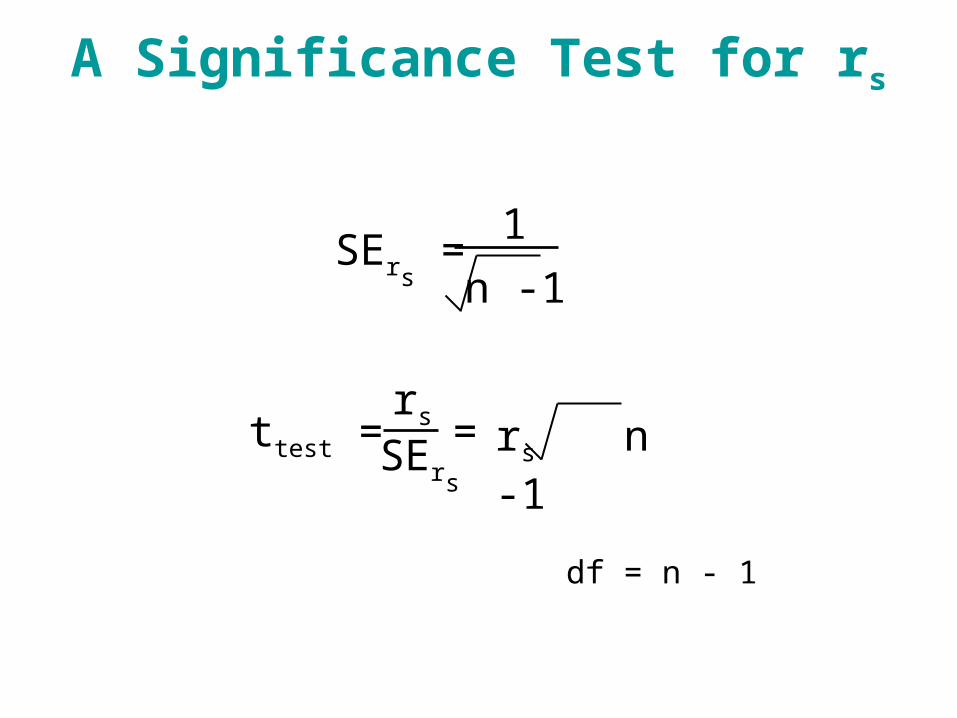
A Significance Test for rs
SErs =
1
n -1
ttest = rs
SErs
= rs n -1
df = n - 1
http://www.mnstate.edu/wasson/ed602spearcorr.htm
Spearman’s Rank Correlation Coefficient: Example

Pearson’s r - Assumptions
1. Interval or ratio scale data
2. Selected randomly
3. Linear
4. Joint bivariate normal distribution
S-Plus (qqnorm)

Spearman’s Rank Correlation Coefficient
• Ordinal data
• already in a ranked form
• Interval or ratio data
• convert it to rankings

Spearman’s Rank Correlation Coefficient
TVDI (x)0.2740.5420.4190.2860.3740.4890.6230.5060.7680.725
Rank (x)17423586
109
Theta (y)0.4140.3590.3960.4580.3500.3570.2550.1890.1710.119
Rank (y)978
10564321
Difference (di)
-80-4-8-2-14388

A Significance Test for rs

S-Plus
http://www.mnstate.edu/wasson/ed602spearcorr.htm

TVDI (x)0.2740.5420.4190.2860.3740.4890.6230.5060.7680.725
Theta (y)0.4140.3590.3960.4580.3500.3570.2550.1890.1710.119

• Correlation Direction & Strength
• We might wish to go a little further
• Rate of change
• Predictability
Correlation Regression

• Deterministic
perfect knowledge
• Probabilistic
estimate
not with absolute accuracy
(or certainty)
Two Sorts of Bivariate Relationships
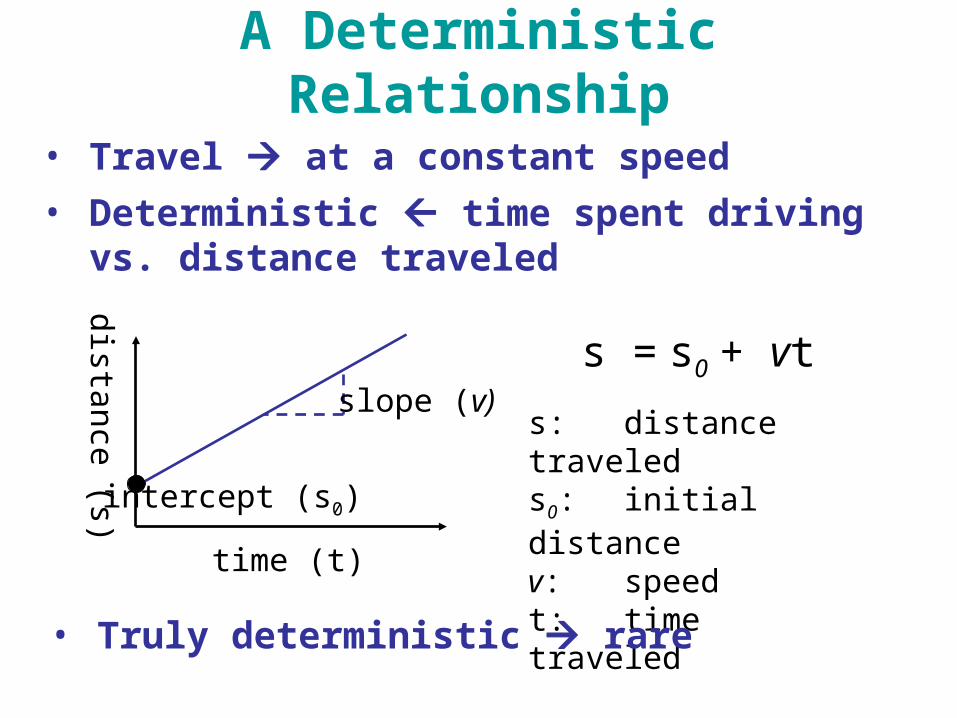
• Travel at a constant speed
• Deterministic time spent driving vs. distance traveled
A Deterministic Relationship
s = s0 + vt
s: distance traveleds0: initial distancev: speedt: time traveledtime (t)
distance (s)
slope (v)
intercept (s0)
• Truly deterministic rare
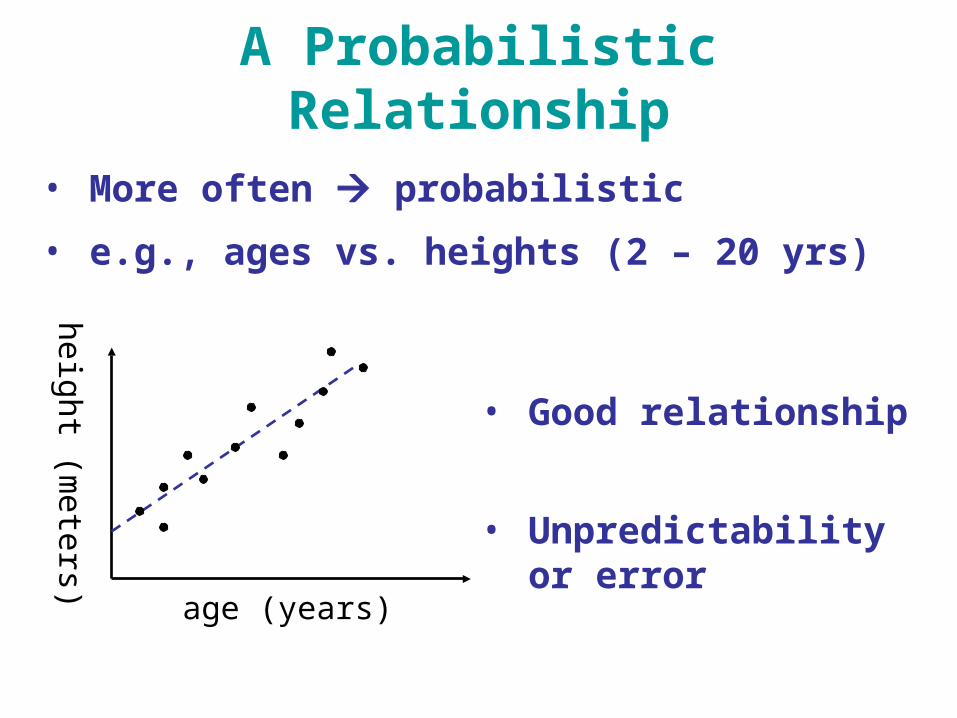
• More often probabilistic
• e.g., ages vs. heights (2 – 20 yrs)
A Probabilistic Relationship
age (years)
height (meters)
• Good relationship
• Unpredictability or error

Sampling and Regression
• Our expectation (less than perfect)
• Collecting data measurement errors
height
• Other factors (not accounted for in the model)
plant growth vs. T

Simple vs. Multiple Regression
• Simple linear regression
y
x
• Multiple linear regression
y
x1, x2, … xn

• Model
y = a + bx + e
Simple Linear Regression
x: independent variable
y: dependent variable
b: slope
a: intercepte: error term
x (independent)
y (dependent)
b
a
error:

• Scatterplot fitting a line
Fitting a Line to a Set of Points
x (independent)
y (dependent)
• Least squares method
• Minimize the error term e

Sampling and Regression
• Sampled data model
y = a + bx + e
• Attempt to estimate a “true” regression line
y = + x +
• Multiple samples several similar regression
lines the population regression line

• Minimize the error term e
• The line of best fit
ŷ = a + b
Least Squares Method
y
ŷ = a + bxŷ
(y - ŷ)
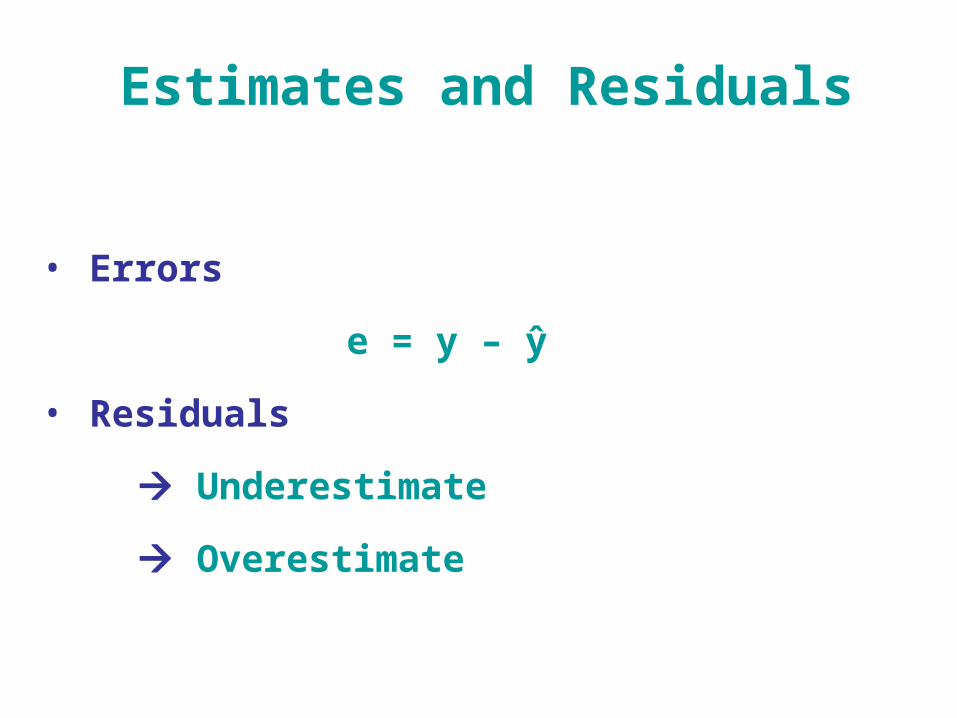
Estimates and Residuals
• Errors
e = y – ŷ
• Residuals
Underestimate
Overestimate
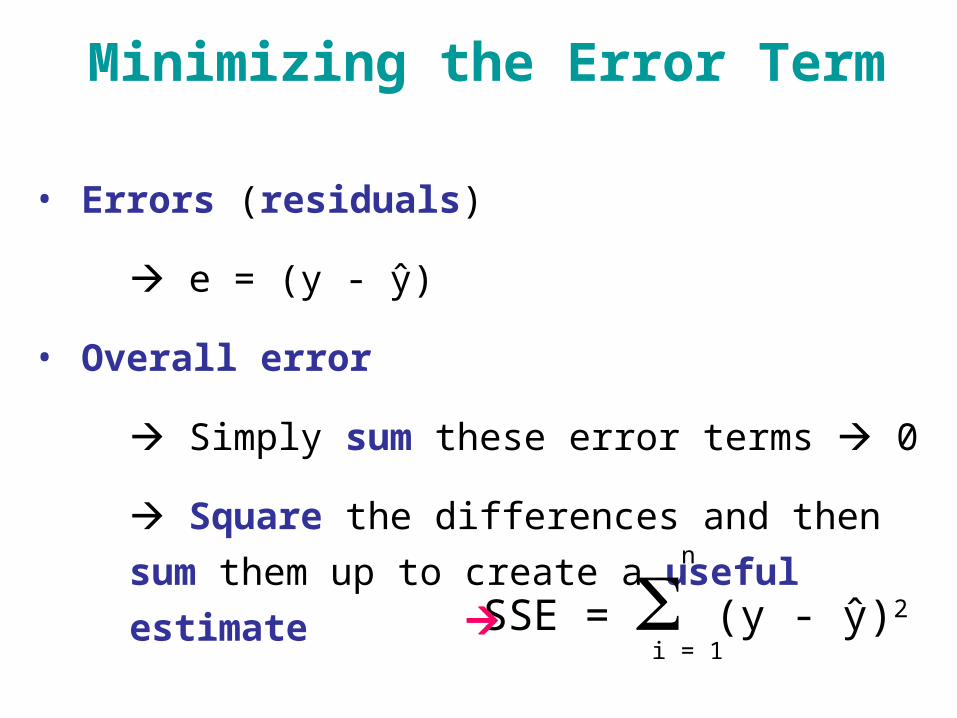
• Errors (residuals)
e = (y - ŷ)
• Overall error
Simply sum these error terms 0
Square the differences and then sum them up to
create a useful estimate
Minimizing the Error Term
SSE = (y - ŷ)2
i = 1
n

Minimizing the SSE
(y - ŷ)2
i = 1
n
mina,b
n
(yi - a - bxi)2
i = 1
mina,b
=

• Least squares method
Finding Regression Coefficients
(xi - x) (yi - y)i = 1
n
b =
(xi - x)2
i = 1
n
a = y - bx
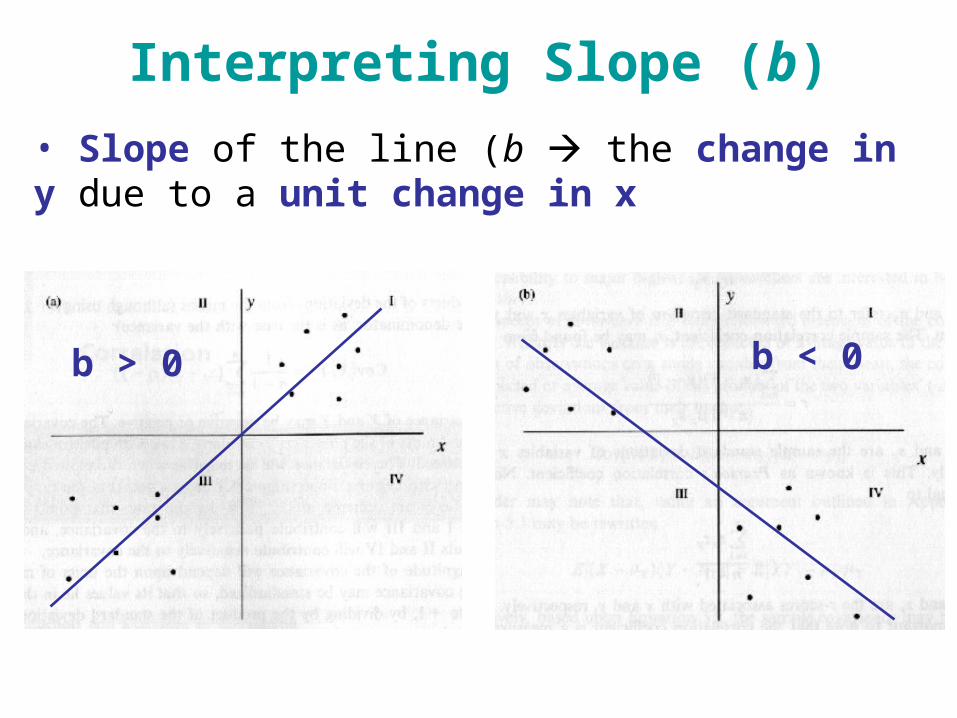
Interpreting Slope (b)
• Slope of the line (b the change in y due to a unit change in x
b > 0 b < 0

Regression Slope and Correlation
(xi - x)(yi - y)i=1
i=n
(n - 1) sXsY
r =(xi - x) (yi - y)i = 1
n
b =
(xi - x)2
i = 1
n
b = rsy
sx