Correlated evolution of substitution rates and ...
34
Coevol Correlated evolution of substitution rates and quantitative traits Nicolas Lartillot, Raphael Poujol [email protected] Version 1.4. April 17, 2014. 1
Transcript of Correlated evolution of substitution rates and ...

Coevol
Correlated evolution of substitution rates
and quantitative traits
Nicolas Lartillot, Raphael Poujol
Version 1.4. April 17, 2014.
1

Contents
1 Introduction 3
2 General features and some practical considerations 5
2.1 Sequence data: codons or nucleotides . . . . . . . . . . . . . . . . . . . . . . . 5
2.2 Fixing or estimating divergence times . . . . . . . . . . . . . . . . . . . . . . 5
2.3 Quantitative traits . . . . . . . . . . . . . . . . . . . . . . . . . . . . . . . . . 6
2.4 How long should it run? . . . . . . . . . . . . . . . . . . . . . . . . . . . . . . 6
3 Input data format 8
3.1 Sequences . . . . . . . . . . . . . . . . . . . . . . . . . . . . . . . . . . . . . . 8
3.2 Trees . . . . . . . . . . . . . . . . . . . . . . . . . . . . . . . . . . . . . . . . . 8
3.3 Matrix of characters . . . . . . . . . . . . . . . . . . . . . . . . . . . . . . . . 8
3.4 Calibrations . . . . . . . . . . . . . . . . . . . . . . . . . . . . . . . . . . . . . 9
3.5 Ancestral quantitative data (for the ancov program) . . . . . . . . . . . . . . 10
4 Running a chain: coevol 11
4.1 A running example . . . . . . . . . . . . . . . . . . . . . . . . . . . . . . . . . 11
4.2 Alternative models . . . . . . . . . . . . . . . . . . . . . . . . . . . . . . . . . 12
4.3 Checking convergence . . . . . . . . . . . . . . . . . . . . . . . . . . . . . . . 13
5 Post-analysis (readcoevol) 17
5.1 Obtaining posterior averages . . . . . . . . . . . . . . . . . . . . . . . . . . . 17
5.2 Correlation analysis: the .cov file . . . . . . . . . . . . . . . . . . . . . . . . 18
5.3 Multiple regression / partial correlations . . . . . . . . . . . . . . . . . . . . . 19
5.4 Reconstructing ancestral traits and divergence times . . . . . . . . . . . . . . 23
6 Detailed options of coevol 26
6.1 Input files and general settings . . . . . . . . . . . . . . . . . . . . . . . . . . 26
6.2 Substitution models . . . . . . . . . . . . . . . . . . . . . . . . . . . . . . . . 26
6.3 Divergence times and branch lengths . . . . . . . . . . . . . . . . . . . . . . . 28
6.4 Covariance matrix . . . . . . . . . . . . . . . . . . . . . . . . . . . . . . . . . 28
6.5 Brownian process . . . . . . . . . . . . . . . . . . . . . . . . . . . . . . . . . . 29
7 Ancov: ancestral covariance and comparative regression 30
2

1 Introduction
DNA sequences evolve at a different rate in different species. More generally, several aspects
of the substitution process may be subject to variation between organisms: the nucleotide
composition (and in particular the GC content), the ratio of non-synonymous over synony-
mous substitution rates (dN/dS), the ratio of transition over transversion rates, etc. Un-
derstanding the causes of such variation is a fundamental question in evolutionary genetics,
still open in many respects.
The comparative method represents a natural approach to investigating these issues.
Correlations between the substitution rate, dN/dS or GC content on one hand, and body
mass, generation time, metabolic rate, or genome size on the other hand, would certainly
help discriminating between alternative hypotheses about the causes of rate and substitution
pattern variation. In all cases, correlations should be corrected for non-independence due to
phylogenetic inertia, as would be done in any other phylogenetic correlation study.
Classical comparative methodologies, however, only apply to characters that can be
directly observed and measured: body-size, life-history traits, or any other morphological or
biological trait. Here in contrast, we need to make correlations between observable traits
(e.g. body size) and parameters of the substitution process (such as the substitution rate,
or the mutation bias, or dN/dS) which manifest themselves only indirectly via the DNA
sequences of the alignment.
The aim of Coevol is to propose an integrated statistical framework for investigating
these kinds of comparative questions, using a combination of DNA sequences, comparative
data and paleontological knowledge.
Coevol: the comparative method applied to molecular data
Coevol is a Bayesian inference program using Markov Chain Monte Carlo methods. It can be
seen as a fusion between classical phylogenetic models for nucleotides or codons (Felsenstein,
1981), autocorrelated relaxed clocks for molecular dating (Thorne et al., 1998) and compar-
ative models based on the idea of Brownian processes and phylogenetically independent
contrasts (Felsenstein, 1985; Martins and Hansen, 1997; Harvey and Pagel, 1991).
In Coevol, the estimation works by conditioning a probabilistic model simultaneously on
a sequence alignment, a matrix of quantitative characters (such as morphological data or life-
history traits) and fossil calibrations. The model assumes correlated evolution of the rate of
substitution, or other parameters of the substitution process such as GC content or dN/dS,
and the quantitative traits, all of which are jointly modeled as a multivariate Brownian
process. The program then estimates the correlation structure between these variables (i.e.
the covariance matrix of the Brownian process) and simultaneously reconstructs divergence
3

times and ancestral traits along the phylogeny.
The most straightforward application of Coevol is probably the identification of quantita-
tive traits correlating with variation in substitution rates or substitution patterns. However,
Coevol can also be used for reconstructing ancestral traits (a bit like BayesTrait, Pagel, 1999),
or for estimating divergence times (like Beast or Multidivtime, Drummond and Rambaut,
2007; Thorne et al., 1998). Thanks to the integrative approach adopted here, estimation of
any of these components of the model (correlations, divergence times, or ancestral traits)
will automatically integrate uncertainty, as well as potentially relevant information, coming
from the other components.
The method has been introduced in Lartillot and Poujol (2011) and has been used,
among other things, for identifying the life-history correlates of dN/dS and GC content in
placental nuclear genomes (Lartillot, 2013) or for estimating divergence times and ancestral
body masses in mammals (Lartillot and Delsuc, 2012).
Ancov: Ancestral state reconstruction by comparative regression
A comparative program independent of Coevol, called ancov (ancestral covariance), was in-
troduced in Lartillot (2014). The aim of this program is to reconstruct ancestral traits based
on a Gaussian regression model implemented using a Kalman filtering algorithm. A possible
application, such as illustrated in the article, is the reconstruction of ancestral growth tem-
peratures in prokaryotes based on inferred ancestral proteome or rRNA composition, both of
which are known to correlate very strongly with growth temperature (Groussin and Gouy,
2011).
Although this question would ideally require a one-step integrative modeling, such as
coevol, the idea of ancov is to proceed in two steps: first estimate ancestral compositions
using a phylogenetic methods, and second, rely on the trait / composition correlation in
extant species, as well as on inferred ancestral compositions, to reconstruct ancestral tem-
peratures. Thus, Ancov can be seen as an approximate method, but one that still corrects
for phylogenetic inertia for reconstructing ancestral traits based on ancestral compositions.
More generally, the program can be used for any type of ancestral reconstruction using
a comparative regression approach, such as already formalized in other previously published
programs and applications (Martins and Hansen, 1997; Pagel, 1999; Organ et al., 2007;
Franks et al., 2012).
Details about the ancov program are given below, in section 7.
4

2 General features and some practical considerations
2.1 Sequence data: codons or nucleotides
Coevol can run on nucleotide and codon alignments. In the case of nucleotides, the model
allows for variation in the overall substitution rate or, using specific options, for variation
in the ratio between transition and transversion rates (κ) or in the equilibrium GC content.
When applied to codon data, the model will also reconstruct phylogenetic variation in syn-
onymous and non-synonymous rates (dS and dN) or in their ratio ω = dN/dS. Finally, it is
possible to apply the program to amino acid recoded sequences, so as to estimate variation
of the radical over conservative amino-acid replacement rates (Nabholz et al, 2013, in prep).
Compared to earlier versions of the program, inference under codon models is now much
faster (a 7-fold increase compared to version 1.2). As a result, nucleotide and codon models
are now comparable in their computational efficiency.
2.2 Fixing or estimating divergence times
Estimation can be conducted under a fixed time-calibrated phylogeny or, alternatively, di-
vergence times can be co-estimated. Fixing divergence times may inflate significance of some
of the correlations (Diaz-Uriarte and Garland, 1998). Conversely, divergence time estimation
can sometimes be a limiting factor for MCMC convergence, in particular for large trees with
a large number of (potentially conflicting) calibrations. Thus, it can sometimes be useful, at
least in a first step, to constrain the time-calibrated phylogeny.
When divergence times are not a priori constrained, fossil calibrations can be specified,
although they are optional. If no calibration is specified, the tree will be dated relative to
the age of the root (by convention, time scale is defined so that the age of the root is equal
to 1). However, one should keep in mind that relative dating without calibration may not
be so reliable, especially for deep phylogenies (e.g. at the level of orders). If your interest
is in correlations between the absolute substitution rate and quantitative traits, relative
dating may give you poor estimates of divergence times, and therefore, correlatively, poor
estimates of ancestral substitution rates (rates and times are two sides of the same coin: only
their product is directly measurable). In such cases, specifying calibrations for constraining
divergence time estimation is probably a good thing, and checking the sensitivity of the
analysis to fossil calibrations is even better (Lartillot and Delsuc, 2012).
On the other hand, if your interest is in correlating intensive substitution variables (ratios
between rates, such as the ratio between transition and transversion rates, or dN/dS, or GC
content) with quantitative traits, then divergence time estimation is less critical. It still has
an influence in principle (because the Brownian motion, as a diffusion process, is defined as
5

a function of evolutionary time) but, on the other hand, the errors on rate estimates directly
induced by the errors on divergence times will cancel out in the ratios of rates.
2.3 Quantitative traits
Quantitative characters will be automatically log-transformed by the program. That is,
the program will assume that the natural logarithm of the characters given as an input
will evolve according to a Brownian motion. The initial justification of this automatic log-
transformation is that, for characters such as body size, life-history traits, or substitution
rates, it is reasonable to assume allometric (log-linear) relations. However, this means that,
if you want to conduct correlation studies with other types of characters, you may need to
apply some transformation to them before giving them to coevol. For instance, characters
which should evolve as Brownian motions on a linear scale should be exponentiated (so as to
offset the log transformation applied by coevol). As another example, for characters such as
fractions, between 0 and 1 (strictly), it is natural to assume a log-it transformation. Thus,
if x is your character, then one would define
y = lnx
1− x
and assume Brownian evolution of y. In that case, what you should give coevol is not y but
z defined as:
z =x
1− x.
Coevol will automatically take the natural logarithm of z, thus effectively working with y.
2.4 How long should it run?
It is generally difficult to know beforehand how long a chain should run. In the case of
coevol, our general experience is that it takes one hundred to a few hundred points to
reach convergence, and a sample of 1 000 points (after burnin) generally gives reasonable
qualitative estimates. High-quality ’publication-grade’ runs, on the other hand, may require
longer runs. With 100 species and 5 000 aligned positions, this means roughly an overnight
analysis for having a good qualitative idea and several days to one or two weeks for high-
quality results. However, these are just orders of magnitude. Different datasets, or different
models, may require different numbers of cycles before reaching convergence and may display
very different mixing behaviors. The best is to rely on more objective measures, such as
effective sample size and reproducibility of the results across independent runs started from
random initial conditions (all of which are explained in section 4).
6

For a faster ’research cycle’, it is often a good idea to first domesticate the problem at
hand with smaller datasets. In particular, if your dataset contains a large number of taxa
(several hundreds), it can be a good thing to first run the program on a subsample of ∼ 100
taxa. Less critically, using fixed time-calibrated phylogenies can help in a first step, before
turning to more ambitious models and analyses. More generally, one should not hesitate
to first capture the essential points using fast qualitative runs (along the lines indicated
above), although always running two independent chains in parallel and always visualizing
the tracefiles to check convergence. Coevol allows you to stop and restart chains at will,
thus it is easy to make quick runs under several conditions, stop them when you get a good
qualitative idea of the outcome, and finally, once the broad lines of an interesting series of
results appear to be within reach, elongate the most interesting chains for final high-quality
results.
7

3 Input data format
3.1 Sequences
The format recognized by Coevol is a generalization of the PHYLIP format:
<number_of_taxa> <number_of_sites>
taxon1 sequence1...
taxon2 sequence2...
...
Taxon names may contain more than 10 characters. Sequences can be interrupted by space
and tab, but not by return characters. Sequences can be interleaved, in which case the taxon
names may or may not be repeated in each block.
The following characters will all be considered equivalent to missing data: “-”, “?”, “$”,
“.”, “*”, “X”, “x”, as well as the degenerate bases of nucleic acid sequences (“B”, “D”, “H”,
“K”, “M”, “N”, “R”, “S”, “V”, “W”, “Y”). Upper or lower case sequences are both recognized,
and the case matters for taxon names (but not for nucleotides). Codon alignments should
be provided as simple nucleotide alignments, with the only constraint that the number of
positions should be a multiple of 3. The <number_of_sites> field should be the number of
aligned nucleotide sequences (not the number of codon positions). Stop codons are allowed,
as well as incomplete codons (e.g. ’CA-’ or ’CA?’), but will be replaced by unknown states.
3.2 Trees
Trees should be in the Newick format, and should be rooted, e.g.:
((taxon1:0.1,(taxon2,taxon3):2.3):1.2,(taxon4:0.5,taxon5:0.2):0.23);
Branch lengths can be specified. If the tree is ultrametric (if it is a time-calibrated
phylogeny), the branch lengths specified in the tree file will be used as initial divergence
times (or, using the -fixbl option, can be fixed as a prior constraint). Trees should always
be followed by a ’;’. Taxon names should correspond to the names specified in the data
matrix (case sensitive). If some names are present in the tree, but not in the matrix, the
corresponding taxa will be pruned out of the tree. That is, the spanning subtree containing
all the taxa mentioned in the data matrix will be considered as the input tree. Conversely,
if some taxa are present in the data matrix, but not in the input tree, the program will exit
with an error message.
3.3 Matrix of characters
The list of continuous characters should be in a separate file, formatted as follows :
8

#TRAITS
<number_of_taxa> <number_of_characters> NAME1 NAME2 ...
taxon1 character_1 character_2 ...
taxon2 character_1 character_2 ...
...
Thus, each trait should be given a name (e.g. NAME1 = longevity, NAME2 = body mass),
names which will be used by coevol in the display of the correlation matrices. All characters
should be strictly positive (as mentioned above, they will be automatically log-transformed).
Missing data can be indicated by setting the character at -1.The #TRAITS keyword is present for historical reasons. In the first version of the program,
no name was indicated and the format (still recognized by this version) was more simply:
<number_of_taxa> <number_of_characters>
taxon1 character_1 character_2 ...
taxon2 character_1 character_2 ...
...
Both formats are recognized, but the important thing is to put the #TRAITS keyword as
a header to the file whenever traits are given explicit names.
3.4 Calibrations
Calibrations should be given in a separate file. The format is such that specific internal
nodes of the phylogeny are indicated by giving the names of two terminal taxa that have
this node as their last common ancestor – as follows:
<ncalib>
<taxon1a> <taxon1b> <upper_limit> <lower_limit>
<taxon2a> <taxon2b> <upper_limit> <lower_limit>
...
Upper or lower limits can be set equal to -1, in which case no limit is enforced. For
example:
taxon1 taxon2 70 50
specifies an upper and a lower constraint, thus the interval [50,70] My,
taxon1 taxon2 -1 50
means that the node of the last commmon ancestor of taxon1 and taxon2 should be older
than 50 Million years (My).
9
taxon1 taxon2 70 -1
only specifies an upper constraint of 70 My, and no lower constraint.
The root can be calibrated by specifying an upper and/or a lower bound for the root
node in the calibration file, exactly like for other nodes. In addition, a gamma prior for the
age of the root can be imposed, by specifying a mean and a standard deviation for the age
of the root in the command for launching the program (see below). The two priors are not
mutually exclusive (in which case the gamma distribution will be truncated according to the
specified hard bounds). The absolute age of the root is often the most challenging parameter
of the model, in terms of MCMC convergence and mixing.
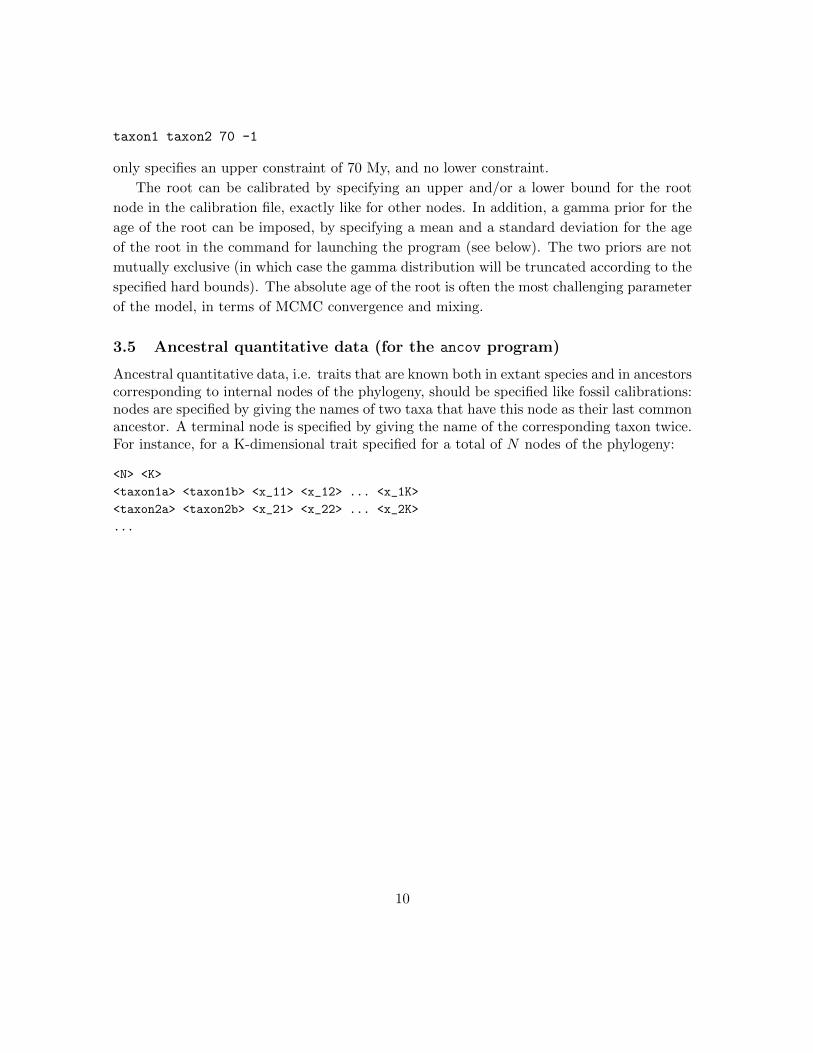
3.5 Ancestral quantitative data (for the ancov program)
Ancestral quantitative data, i.e. traits that are known both in extant species and in ancestorscorresponding to internal nodes of the phylogeny, should be specified like fossil calibrations:nodes are specified by giving the names of two taxa that have this node as their last commonancestor. A terminal node is specified by giving the name of the corresponding taxon twice.For instance, for a K-dimensional trait specified for a total of N nodes of the phylogeny:
<N> <K>
<taxon1a> <taxon1b> <x_11> <x_12> ... <x_1K>
<taxon2a> <taxon2b> <x_21> <x_22> ... <x_2K>
...
10
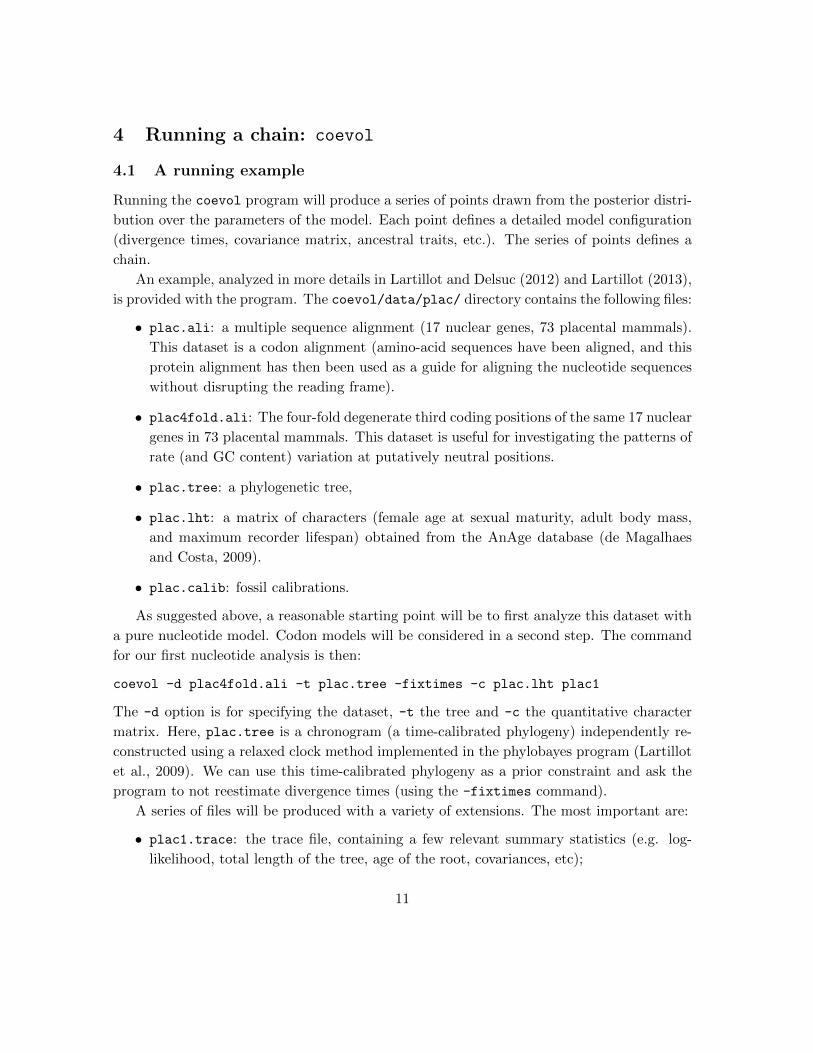
4 Running a chain: coevol
4.1 A running example
Running the coevol program will produce a series of points drawn from the posterior distri-
bution over the parameters of the model. Each point defines a detailed model configuration
(divergence times, covariance matrix, ancestral traits, etc.). The series of points defines a
chain.
An example, analyzed in more details in Lartillot and Delsuc (2012) and Lartillot (2013),
is provided with the program. The coevol/data/plac/ directory contains the following files:
• plac.ali: a multiple sequence alignment (17 nuclear genes, 73 placental mammals).
This dataset is a codon alignment (amino-acid sequences have been aligned, and this
protein alignment has then been used as a guide for aligning the nucleotide sequences
without disrupting the reading frame).
• plac4fold.ali: The four-fold degenerate third coding positions of the same 17 nuclear
genes in 73 placental mammals. This dataset is useful for investigating the patterns of
rate (and GC content) variation at putatively neutral positions.
• plac.tree: a phylogenetic tree,
• plac.lht: a matrix of characters (female age at sexual maturity, adult body mass,
and maximum recorder lifespan) obtained from the AnAge database (de Magalhaes
and Costa, 2009).
• plac.calib: fossil calibrations.
As suggested above, a reasonable starting point will be to first analyze this dataset with
a pure nucleotide model. Codon models will be considered in a second step. The command
for our first nucleotide analysis is then:
coevol -d plac4fold.ali -t plac.tree -fixtimes -c plac.lht plac1
The -d option is for specifying the dataset, -t the tree and -c the quantitative character
matrix. Here, plac.tree is a chronogram (a time-calibrated phylogeny) independently re-
constructed using a relaxed clock method implemented in the phylobayes program (Lartillot
et al., 2009). We can use this time-calibrated phylogeny as a prior constraint and ask the
program to not reestimate divergence times (using the -fixtimes command).
A series of files will be produced with a variety of extensions. The most important are:
• plac1.trace: the trace file, containing a few relevant summary statistics (e.g. log-
likelihood, total length of the tree, age of the root, covariances, etc);
11

• plac1.chain: containing the detailed parameter configurations visited during the run.
This file is used by readcoevol for computing posterior averages.
Chains will run as long as allowed. They can be interrupted at any time, and then
restarted, in which case they will resume from the last check-point (last point saved before
the interruption). To soft-stop a chain, just open the <name>.run file, and replace the 1 in
it by a 0. Under linux, this can be done with the simple following command:
echo 0 > plac1.run
The chain will finish the current cycle before exiting.
To restart a chain:
coevol plac1
Most often, when chains are killed (e.g. because of a time-out on a cluster), they can be
restarted in this way. Be careful, however, not to restart an already running chain.
4.2 Alternative models
Coestimation of divergence times using fossil calibrations
For our first chain above, plac1, we have chosen to fix divergence times. Alternatively, wecan use the fossil calibrations provided in the plac.calib file:
coevol -d plac4fold.ali -t plac.tree -cal plac.calib 100 100 -bd -c plac.lht calplac1
The option is -cal, followed by the name of the file containing the fossil calibrations (see
Input data format), followed by two numbers specifying the mean and the standard deviation
of the prior over the age of the root (which is a gamma distribution). Here, the root is the
last common ancestor of placentals. We opt for a broad prior of mean 100 Myr and standard
deviation 100 Myr. In this particular case, the prior is thus an exponential distribution of
mean 100. We also opt for a birth-death prior on divergence times (-bd option). If no prior
were specified, this would have be a uniform prior on divergence times.
In principle, a birth-death has a better justification than a uniform in terms of the
underlying diversification process (although assuming constant extinction and speciation
rates is probably naive). Uniform priors are paradoxically more informative and will often
tend to make more compact trees, with a more recent root. On the other hand, MCMC
convergence, in particular on the age of the root tends to be faster the uniform prior.
12

GC content
There are interesting questions about GC content variation in placentals. To investigate
them, we can allow for variation in equilibrium GC frequency (GC∗) along the phylogeny
using the -gc command:
coevol -d plac4fold.ali -t plac.tree -fixtimes -c plac.lht -gc placgc1
Codon model: dN/dS
Another interesting option in the present case is the codon model: correlating, not just the
total substitution rate, but separately the synonymous substitution rate dS and the ratio
of the non-synonymous over the synonymous substitution rates ω = dN/dS with body size
and life-history traits. To do this, we use the -dsom (”dS and omega”) option:
coevol -d plac.ali -t plac.tree -fixtimes -c plac.lht -dsom placdsom1
Is is possible to combine dS, dN/dS and GC∗ in the same analysis:
coevol -d plac.ali -t plac.tree -fixtimes -c plac.lht -dsom -gc placdsomgc1
Whichever model configuration is used, runs should be duplicated (calplac2, placgc2,
placdsom2, etc), and should be run for sufficiently long (see above). A good starting point
is to let the chains run overnight before having a first look at what they give.
4.3 Checking convergence
The MCMC sampler saves one point after each cycle. A cycle itself represents a set of
complex and integrated series of updates of the parameters of the model (divergence times,
covariance matrix, ancestral traits and rates, etc).
Convergence can first be visually assessed by plotting the summary statistics recorded
in the trace file as a function of the number of iterations. This can be done using simple
linux utilities, such as gnuplot. Alternatively, the trace file of coevol is compatible with the
Tracer program of the Beast software (Drummond and Rambaut, 2007). You can therefore
use Tracer to check convergence and estimate burn-in and effective sample size (tracecomp,
introduced below, does similar things but has a more primitive interface).
The following statistics, tabulated in the .trace files, are particularly relevant for checking
convergence:
• log prior (column 1)
• log likelihood (column 2; in general, converges relatively quickly)
13

• tree length (column 3; for codon models, this is the synonymous length, i.e. the
expected number of synonymous substitutions per site across the whole tree)
• for codon models, mean dN/dS or total dN over the tree
• at least checking a few entries of the covariance matrix (the Σij in the trace file).
• the age of the root (in those cases where divergence times are also estimated).
Plotting trace files for the placental mammals example
Plotting these statistics for the calplac1 and calplac2 runs, after one night (630 points),
would give something like on figure 1. Convergence appears to be very rapid in the present
case (burn-in of less than 100 points), except for the age of the root, although the main
problem with this root age is not so much convergence than mixing: low frequency oscillations
are visible on the trace plot, suggesting that it may take more cycles for decorrelating this
root age.
After one night, the codon model (with dN/dS and GC∗) has produced 400 points. The
essential qualitative aspects of the correlation structure between dS, dN/dS and GC∗ and
life-history traits (such as estimated using readcoevol, introduced in the next section) can
already be seen based on the last 300 points of the run. High-quality results will be obtained
after running the program for approximately 1 week.
The tracecomp program
In addition to visual checks, a more quantitative assessment of convergence and mixing can
be performed using the tracecomp program:
tracecomp -x 100 calplac1 calplac2
tracecomp will produce an output summarizing the discrepancies and the effective sizes
estimated for each column of the trace file. The discrepancy d is defined as
d = 2|µ1 − µ2|/(σ1 + σ2),
where µ2 and µ2 are the means and σ1 and σ2 the standard deviations associated with a
particular column, for the two chains. The effective size is evaluated using the method of
Geyer (1992). Some guidelines for evaluating the quality of the samples:
• maxdiff < 0.1 and minimum effective size > 300: good run;
14

Figure 1. Traceplots for the placdsgc1 chain showing, as a function the number of pointssaved in the tracefile, the log prior, total tree length, covariance between dS and body mass,and the age of the root
15

• maxdiff < 0.3 and minimum effective size > 50: acceptable run (yielding qualitatively
correct results).
Often, most summary statistics of the trace file will have large effective sample sizes, except
one or two of them (in particular, the age of the root).
tracecomp applied to our placental mammals example
In the present case (calplac1, after one night and 630 points), the output of tracecomp
reads like:
setting upper limit to : 630
burnin : 100
stop : 630
name effsize rel_diff
#logprior 406 0.164942
lnL 449 0.25871
rate 514 0.240122
sigma_0_0_1 530 0.0710222
sigma_0_0_2 530 0.209856
sigma_0_0_3 530 0.19284
...
sigma_0_3_3 530 0.134073
rootage 87 0.0615232
...
suggesting that, already after one night, we get relatively good qualitative results: relative
discrepancies all below 0.26 and estimated effective sample sizes close to true sample size
(530), except for the age of the root. After 4 days, we have a chain of approximately 5200
points, with excellent convergence and mixing diagnostics (effective sample size larger than
500 for the age of the root and 1000 for all other statistics, discrepancies smaller than 0.02).
16

5 Post-analysis (readcoevol)
5.1 Obtaining posterior averages
Once a chain has been obtained, and the burnin has been determined, correlations, diver-gence times and ancestral traits can be estimated using readcoevol:
readcoevol -x <burn-in> [<every> <until>] <chain_name>
By default, <burn-in> is equal to one tenth of the total size of the chain (number ofpoints saved), <every> = 1 and <until> is equal to the size of the chain. However, it ispreferable to always specify the burnin. Thus, for instance:
-x 300
defines a burn-in of 300, computing averages based on all of the remaining points,
-x 300 10
a burn-in of 300, taking one every 10 points, up to the end of the chain, and
-x 300 1 5300
a burn-in of 300, taking one every point, up to the 5300th point of the chain (or less, if
the chain is shorter).
The placental mammal example
Following our example:
readcoevol -x 200 plac1
will discard the first 200 points and will compute posterior estimates based on the 5000
remaining points. It will produce a few additional files, contaning:
• plac1.cov: the estimated covariance matrix, and associated correlation coefficients
and posterior probabilities.
• plac1.postmeandates.tre: posterior means and confidence intervals for divergence
times
• plac1.postmean1.tre: ancestral reconstruction for quantitative trait 1 (same thing
for trait 2, etc)
17

5.2 Correlation analysis: the .cov file
As a more interesting example, we could now look at the correlations obtained under the
model allowing for simultaneous variation in substitution rate and in GC∗. After running
readcoevol on placgc1, the resulting placgc1.cov file would read as:
entries are in the following order:
dS
gc
maturity
mass
longevity
covariances
0.492 0.166 -0.454 -1.38 -0.364
0.166 1.39 -0.127 -1.1 -0.0636
-0.454 -0.127 1.7 2.66 0.668
-1.38 -1.1 2.66 12.6 1.96
-0.364 -0.0636 0.668 1.96 0.588
correlation coefficients
1 0.202 -0.496 -0.553 -0.675
0.202 1 -0.0796 -0.26 -0.0688
-0.496 -0.0796 1 0.573 0.666
-0.553 -0.26 0.573 1 0.719
-0.675 -0.0688 0.666 0.719 1
posterior probs
- 0.9 0.0019 0 0
0.9 - 0.34 0.036 0.31
0.0019 0.34 - 1 1
0 0.036 1 - 1
0 0.31 1 1 -
The entries of the 5x5 matrices are in the order specified in the header. The posterior
probabilities of a positive correlation (pp) are particularly important. A pp close to 1 means
a strong statistical support for a positive correlation, and a pp close to 0 a supported negative
correlation (the posterior probabilities for a negative correlation are given by 1− pp).In this example, The first most obvious (albeit not surprising) result is the strong corre-
lation between the three life-history traits (all pp indistinguishable from 1). In this respect,
18

coevol can be seen as a Bayesian equivalent of classical methods based on phylogenetically
independent contrast for estimating correlations between quantitative traits.
As for the correlation between substitution variables (rates) and quantitative traits, we
can see that dS displays statistically supported negative correlations with all life-history
traits (pp close to 0). In addition, GC∗ is negatively correlated with body mass (pp = 0.036).
The correlation of GC∗ with body mass could be due either to a systematic variation in
mutation bias as a function of body size (more AT biased mutation process in large-bodied
mammals). Alternatively, as further discussed in Lartillot (2013), this could be the result of
modulations of the intensity of GC-biased gene conversion as a function of population size,
itself correlated with body size.
The other potentially interesting information is the correlation coefficient (r): we see
that the negative correlation between dS and longevity is strong (r = −0.67). In other
words, longevity explains r2 = 45% of the variation in dS. This is nearly as strong as the
correlation between body mass and longevity in absolute value (r = 0.72). The correlation
between GC∗ and body mass, on the other hand, is relatively weak (r = −0.26).
5.3 Multiple regression / partial correlations
The covariances, correlations and posterior probabilities discussed in the last subsection
are marginal, in the sense that each pairwise correlation (say, between dS and body mass)
potentially includes indirect and simultaneous correlation of the two variables with a third
one (say, longevity). In contrast, we may be interested in the partial correlations. There are
several ways of defining and computing partial correlations: using the precision matrix, or
explicitly controlling for one or a few traits or rates.
Precision matrix and maximally controlled correlations
The precision matrix is the inverse of the covariance matrix: Ω = Σ−1 (Dempster, 1972).
For each i, j, i 6= j, −Ωij is equal to the partial covariance between variables i and j, that
is, controlling for all other variables represented in the multivariate process. The partial
correlation coefficients are given by (Wong et al., 2003):
rij = − Ωij√ΩiiΩjj
.
Because all other variables are being controlled, we may call these correlations maximally
controlled correlations.The maximally controlled correlations are given after the marginal correlations in the
cov file. In our example:
19

precisions
4.99 -0.421 0.187 0.0597 2.63
-0.421 1.01 -0.0287 0.139 -0.6
0.187 -0.0287 1.28 -0.0892 -1.04
0.0597 0.139 -0.0892 0.218 -0.584
2.63 -0.6 -1.04 -0.584 6.64
partial correlation coefficients
-1 0.18 -0.0684 -0.056 -0.448
0.18 -1 0.0223 -0.289 0.224
-0.0684 0.0223 -1 0.168 0.356
-0.056 -0.289 0.168 -1 0.48
-0.448 0.224 0.356 0.48 -1
posterior probs
- 0.85 0.34 0.39 0.0094
0.85 - 0.54 0.032 0.91
0.34 0.54 - 0.9 0.99
0.39 0.032 0.9 - 1
0.0094 0.91 0.99 1 -
Here, we see that the only partial correlation coefficient between dS and life-history traits
that has some statistical support is the one between dS and longevity (pp = 0.0094, r =
−0.448). The marginal correlation we have seen between dS and body mass or maturity is
therefore most probably indirect, mediated by the correlation of longevity with both dS and
body mass. The correlation between GC∗ and body mass is robust to controlling for other
traits and for dS (pp = 0.032).
Custom partial correlations: the -partial option and the .controlcov file
Partial correlation coefficients obtained using the precision matrix represent a very conve-
nient approach to multiple regression. However, in some cases, this method may not be
optimal. Controlling for too many parameters sometimes results in a loss of power. In ad-
dition, from a logical point of view, exactly what needs to be controlled for depends on the
specific question being asked.
Here, for instance, we may want to more specifically test whether the correlation between
dS and body mass is entirely mediated by the indirect correlation of both variables with
longevity. Thus, we would like to control only for longevity. Such customized multiple
regressions can be done with the help of the -partial option. After the -partial keyword,
20

one should specify, among all the variables of the analysis, which should be included in the
correlation (1) and which should be controlled for (0). In our example, the entries of the
process are dS, GC∗, maturity, body mass and longevity. If we want to control only for
longevity, which is entry number 5, this would be encoded by 11110.
readcoevol -x 200 1 -partial 11110 placdsgc1
This will produce a .controlcov file containing the correlations controlled for longevity andthe associated posterior probabilities. The matrix is now 4x4, since the entry correspondingto longevity is now missing:
entries are in the following order:
dS
gc
maturity
mass
reduced correl
covariances
0.217 0.0453 -0.027 -0.181
0.0453 0.987 0.0271 -0.737
-0.027 0.0271 0.852 0.348
-0.181 -0.737 0.348 5.34
correlation coefficients
1 0.102 -0.0637 -0.164
0.102 1 0.0308 -0.318
-0.0637 0.0308 1 0.161
-0.164 -0.318 0.161 1
posterior probs
- 0.69 0.35 0.2
0.69 - 0.57 0.025
0.35 0.57 - 0.89
0.2 0.025 0.89 -
From this .controlcov file, we can see that controlling only for longevity indeed results in
a complete loss of significance of the correlation between dS and body mass (pp = 0.2).
It is possible to control for several variables. In the present case, we can check that,
conversely, controlling for body mass and maturity does not compromise the strength and
the statistical support of the correlation observed beween dS and longevity:
21

readcoevol -x 300 1 -partial 11001 placdsgc1
Here, the command will result in a placdsgc1.controlcov file containing a 3x3 matrix:
entries are in the following order:
dS
gc
longevity
reduced correl
covariances
0.252 -0.003 -0.0987
-0.0031 0.854 0.0451
-0.0987 0.0451 0.199
correlation coefficients
1 -0.0012 -0.441
-0.0012 1 0.109
-0.441 0.109 1
posterior probs
- 0.49 0.0075
0.49 - 0.72
0.0075 0.72 -
The correlation between dS and longevity indeed remains statistically supported upon con-
trolling for maturity and body mass (pp = 0.0075). Which we already knew, since we
have already seen above that the maximally controlled correlation between dS and longevity
(thus, also controlled for GC∗ in addition to maturity and body mass) is supported.
The .marginalcov file
The -partial option produces yet another file, with the .marginalcov extension. This file
contains information about the marginal covariance matrix obtained by deleting the entries
marked 0. Thus, for instance:
readcoevol -x 200 1 -partial 10111 placdsgc1
will result, in addition to what we have just seen (i.e. in a placdsgc1.controlcov file in
which all correlations will be controlled for GC∗) in a file named placdsgc1.marginalcov
and contaning the 4x4 matrix of the marginal correlations between dS, maturity, body mass
and longevity (not shown here). These latter correlations are not controlled for variation
22

in GC∗. Therefore, this 4x4 matrix is exactly the submatrix obtained from the initial 5x5
matrix Σ by deleting the second raw and second column (which you can check by comparing
this .marginalcov file and the original .cov file). On the other hand, the ensuing precisions
and partial correlation coefficients are now partial only among dS and the three quantitative
traits. In other words, the partial correlation matrix of dS and longevity displayed in this
.marginalcov file controls for maturity and body mass, but does not control for GC∗.
General rules for partial correlations / multiple regressions
To summarize, the general rules are as follows:
• the marginal correlations in the .cov file do not control for anything;
• the partial correlations in the .cov file control for all other traits and rates;
• the entries marked by 0 are the only one controlled for in the .controlcov file;
• the entries marked by 0 are the only one not controlled for in the .marginalcov file.
At first, it may take some thinking to determine exactly what control should be made,
depending on the question of interest. In addition, there are obviously redundant ways of
obtaining the exact same controlled correlation coefficients here. Altogether, it is perhaps
easiest to consider the precision matrix as the most straightforward approach, although it
may sometimes result in low power. The .controlcov approach is ideal for controlling for
a specific set of traits. Finally, the marginalcov approach is useful, e.g., for analyzing each
aspect of the substitution process (dS, GC∗, dN/dS, etc) in isolation and, in each case,
performing a complete multiple regression of the selected variable against all quantitative
traits.
5.4 Reconstructing ancestral traits and divergence times
The readcoevol program will also produce a series of files containing trees and tabulated
lists of ancestral rates, dates and traits. In all case, the posterior summaries can be of
several types: mean, standard deviation, or 95% credibility interval, and can be computed
on a logarithmic or on a linear scale. Posterior means and standard deviations are perhaps
more adequate when computed on the log of the values of interest, whereas the 95% CI can
more safely be computed either on a logarithmic or on a linear scale.
By default, the program outputs the 95 % CI on a linear scale, but this can be tuned by
using the following options, for activating or deactivating means, standard deviations, CI,
using a logarithmic or a linear scale, or printing the estimated trait values asociated to leaf
and/or internal nodes:
23

• +mean / -mean
• +stdev / -stdev
• +ci / -ci
• +log / -log
• +leaf / -leaf
• +internal / -internal
All these options can be freely combined with each other.
Two types of files will be produced, trees (extension .tre) or tabulated files (extension
.tab). The tree files will represent all this information in the newick format. The .tab files
will tabulate the values for each node of the tree. In the tabulated files, each node of the
tree is referred to by specifying two terminal taxa that have this node as their last common
ancestor.
For example, assuming that we have obtained 95 % CI on a linear scale, for a data
set with 3 taxa, and that the reconstruction of the first quantitative trait included in the
character matrix would be something like:
|--------- Taxon1 (40,150)
|-----------| (56,80)
| |--------- Taxon2 (35,200)
|(30,50)
|--------------------- Taxon3 (20,100)
Then, the file with .postmean1.tre extension would encode the ancestral reconstruction as
follows:
((Taxon1_40_150:0.4,Taxon2_35_200:0.4)56_80:0.6,Taxon3_20_100:1.0)_30_50;
and the file with the .postmean1.tab extension would read as:
Taxon1 Taxon1 0.4 40 150
Taxon2 Taxon2 0.4 35 200
Taxon1 Taxon2 0.6 56 80
Taxon3 Taxon3 1.0 20 100
Taxon1 Taxon3 0.0 30 50
24

Note that both files contain information about branch lengths. The tree is a time-calibrated
phylogeny (in relative time), and the third column in the tabulated file corresponds to the
length (in relative time) of the branch immediately upstream the last common ancestor of
the two taxa (and 0 for the root).
The absolute time-calibrated phylogeny (with credibility intervals associated to internal
nodes) is in the postmeandates.tre file.
We have also developed custom latex programs to draw chronograms, color trees and
bubble trees out of these newick files (see our articles for examples). These are available
upon request. However, compiling these programs, and compiling the resulting Latex files,
requires special C++ and Tex libraries.
25

6 Detailed options of coevol
6.1 Input files and general settings
-d <datafile>
specifies a file containing aligned sequences (see: Input Data Format).
-t <treefile>
specifies the tree topology (see Input Data Format).
-f
forces the program to overwrite an already existing chain with same name.
-x <every> [<until>]
specifies the saving frequency, and (optional) the number of points after which the chain
should stop. If this number is not specified, the chain runs “forever”.
6.2 Substitution models
-gc
allows for variation in equilibrium gc frequencies of the substitution process between lineages.
-tstv
allows for variation in the ratio of transition over transversion rates between lineages.
-dsom
activates the codon model. The two a priori independent variables are dS and ω = dN/dS
(see Lartillot and Poujol, 2011, for more details)
-dsdn
activates the codon model. The two a priori independent variables are dS and dN (see
Lartillot and Poujol, 2011, for more details)
-dsom2
26

activates a codon model in which variation in dS and dN/dS are separately reconstructed
for transitions and transversions.
-dsom3
activates a codon model in which variation in dS and dN/dS are separately reconstructed for
transitions, GC-conservative and non GC-conservative transversions (see Lartillot, 2013).
This model and the previous one (-dsom2) are computationally challenging and may require
relatively large datasets to be correctly fitted.
-mtvert
selects the vertebrate mitochondrial genetic code
-mtinv
selects the ’invertebrate’ mitochondrial genetic code
-univ
selects the universal genetic code
-pol
activates the amino-acid Kr/Kc (radical versus conservative) model. Amino-acid substitu-
tions that do not conserve polarity are considered as radical (Nabholz et al, 2013, in prep).
-vol
activates the amino-acid Kr/Kc (radical versus conservative) model. Amino-acid substitu-
tions that do not conserve volume are considered as radical (Nabholz et al, 2013, in prep).
-polvol
activates the amino-acid Kr/Kc (radical versus conservative) model. Substitutions that
change the polarity and/or the volume of the amino-acid are considered as radical (Nabholz
et al, 2013, in prep).
-charge
activates the amino-acid Kr/Kc (radical versus conservative) model. Substitutions that
change the charge of the amino-acid are considered as radical (Nabholz et al, 2013, in prep).
27

6.3 Divergence times and branch lengths
-cal <calibration_file> <mean> <stdev>
specifies the calibrations, jointly with the mean and standard deviation for the prior on the
age of the root.
-bd
selects the birth death prior on divergence times.
-unif
selects the uniform prior on divergence times
6.4 Covariance matrix
-diag
constrains the covariance matrix to be a diagnoal matrix (all covariances between rates
and traits equal to 0). Thus, all substitution parameters and quantitative characters now
evolve along the tree in an uncorrelated fashion (for an example application, see Lartillot
and Delsuc, 2012).
-priorsigma <kappa>
the prior on the covariance matrix is an Inverse Wishart distribution parameterized by a
diagonal matrix Σ0 and with q degrees of freedom. If κ > 0, Σ0 = κIM . If κ = −1 (default
option), each entry along the diagonal of the matrix Σ0 is different, and all are estimated
from the data (each being endowed with a truncated log-uniform prior between 10−3 and
103). This latter solution is better, as different traits or rates may have a very different rate
of variation. Typically, log body size has a high rate of variation whereas lnω = dN/dS
evolves within a very narrow range.
-df <q>
specifies the number of degrees of freedom q of the Inverse Wishart distribution (Lartillot
and Poujol, 2011). In the current version, the default value is the number of entries of the
multivariate process M . A properly defined Wishart distribution requires that q > M − 1.
28

6.5 Brownian process
-arith
uses the arithmetic averaging method (see Lartillot and Poujol, 2011, for more details) for
computing branch-specific mean values of the substitution parameters.
-geod
uses the geodesic averaging method (see Lartillot and Poujol, 2011, for more details) for
computing branch-specific mean values of the substitution parameters.
-root <rootfile>
specifies the prior for the values of the quantitative traits at the root of the tree. By
default, the model assumes a truncated uniform prior over [−100, 100] for the logarithm
of the value of quantitative traits (and of substitution parameters) at the root (Lartillot
and Poujol, 2011). However, in some cases, we may have independent information about
ancestral traits. For instance, the distribution of the logarithm of body mass (in grams)
of fossil mammals of the cretaceous in North America has a mean of 4.5 and a standard
deviation of 1.5 (Alroy, 1999). In the context of our analysis of placental mammals above,
this information could be used to derive a prior for the body mass at the root, that is, for the
last common ancestor of placentals (although doing this amounts to ignoring the possibility
that body-mass dependent diversification rates may result in this last common ancestor not
being a random sample from cretaceous mammals, in terms of its body size).
Using the -root option, it is possible to enforce normal distributions for the log of the
traits at the root, and to specify the means and variances of these normal distributions. The
file should be specified as follows:
<Ntrait>
<mean1> <stdev1>
<mean2> <stdev2>
...
the means and standard deviations should be given trait by trait. Specifying a mean and a
standard deviation of 0 will be equivalent to selecting a uniform distribution over [−100, 100]
for the corresponding trait.
29

7 Ancov: ancestral covariance and comparative regression
The ancov program takes as an input:
• a tree with branch lengths (that may or may not represent explicit time).
• a trait: a matrix of quantitative traits in extant taxa
• a predictor: a matrix of quantitative variables specified at both terminal and internal
nodes of the phylogeny
The trait and the predictor can both be multivariate. The program then assumes that the
joint evolution of the trait and the predictor is multivariate Brownian along the phylogeny.
It relies on the joint knowledge of the trait and the predictor at the tips of the tree to
estimate the covariance matrix of the process and the ancestral values of the trait along the
phylogeny.
An example is given in the package. The coevol/data/archaea/ directory contains the
following files:
• prot.tree: a phylogenetic tree,
• archaea.exptemp: a matrix of exponentiated growth temperatures (remember that
traits are log-transformed by default; here, however, we want to make a correlation
with temperatures on a linear scale),
• rna.itgc: the inferred GC composition of rRNA stems along the tree. GC composi-
tions (x) have been transformed as y = x1−x ,
• prot.comp: the inferred amino-acid composition of an amino-acid recoded multiple
sequence alignment from Groussin and Gouy (2011).
As explained in Lartillot (2014), the GC and amino-acid compositions were inferred using
the phylobayes program, under a non-homogeneous model of sequence evolution.
The following command:
ancov -t prot.tree -c archaea.exptemp -anc rrna.itgc rnatemp1
will run a MCMC under the model correlating the (logit-transformed) GC composition of
rRNA stems with growth temperature (the latter, on a linear scale).
MCMC is much faster with ancov than with coevol (mostly because ancov does not
involve any explicit likelihood computation under a model of sequence evolution, which is
the rate-limiting aspect of any phylogenetic program). Thus, it is probably a good idea to
subsample:
30

ancov -t prot.tree -c archaea.exptemp -anc rrna.itgc -x 10 -1 rnatemp2
Similar analyses can be conducted using protein composition. Here, however we have
to be cautious concerning the exact parameterization. In Lartillot, 2014, the amino-acid
compositions (such as given in prot.comp) were log-transformed and projected on the 19-
dimensional hyperplane defined by∑
i xi = 0.
This transformation can be done automatically by ancov, using the -ancfreq (ancestral
frequencies) command:
ancov -t prot.tree -c archaea.exptemp -anc prot.comp -ancfreq -x 10 -1 prottemp1
It works for any K-dimensional trait that sums to 1 over the K entries (thus with K − 1
degrees of freedom, really).
Alternatively, the transformation can be done using a separate program, called redcomp,
which is provided in the package. The command is:
redcomp <infile> <outfile>
so, here:
redcomp prot.comp prot.redcomp
will produce a redcomp file containing the 19-dimensional trait resulting from the log-
transformation followed by the projection, which can then be used to run ancov:
ancov -t prot.tree -c archaea.exptemp -anc prot.redcomp -x 10 -1 prottemp1
This alternative way to proceed is less convenient that the automatic one in general, al-
though it can be practical in specific situations, in particular if you want to combine several
traits. For instance, in the present case, if you want to jointly reconstruct the evolution of
temperature, ribosomal GC content and proteome composition along the archaeal tree, then
the only reasonable approach is to first log-transform and reduce the proteome composition
data, and then paste them with the rRNA GC data, thus producing a 20-dimensional trait
that can then be used as an input to coevol.
All these analyses can be read using readancov:
readancov -x 100 -1 +log prottemp1
This command will produce a file named prottemp1.postmean1.tre, displaying the inferred
ancestral growth temperatures along the tree. Here, a +log option is used, in order to obtain
a reconstruction of temperatures (and not of their exponential).
31

Note that, in addition to the usual covariance and precision matrices, the .cov file pro-
duced by ancov will also contain an estimate of the proportion of the variance of each trait
explained by all other traits. Thus, for instance, when correlating proteome composition
and temperature:
proportion of variance of each trait explained by all other traits:
trait 0 : 0.85
trait 1 : 0.57
...
which means that no less than 85% of the variance of temperature among archaeal species
is explained by proteome composition (and this is corrected for phylogenetic inertia).
32

References
Alroy, J. 1999. The fossil record of North American mammals: evidence for a Paleocene evolutionary
radiation. Syst Biol 48:107–118.
Dempster, AP. 1972. Covariance selection. Biometrics 28:157–175.
Diaz-Uriarte, R, and T Garland. 1998. Effects of branch length errors on the performance of phylo-
genetically independent contrasts. Syst. Biol. 47:654–672.
Drummond, Alexei J, and Andrew Rambaut. 2007. BEAST: Bayesian evolutionary analysis by
sampling trees. BMC Evol Biol 7:214.
Felsenstein, J. 1981. Evolutionary trees from DNA sequences: a maximum likelihood approach. J
Mol Evol 17:368–376.
Felsenstein, J. 1985. Phylogenies and the comparative method. Am Nat 125:1–15.
Franks, Peter J, Rob P Freckleton, Jeremy M Beaulieu, Ilia J Leitch, and David J Beerling. 2012.
Megacycles of atmospheric carbon dioxide concentration correlate with fossil plant genome size.
Philos Trans R Soc Lond B Biol Sci 367:556–564.
Geyer, C. 1992. Practical Markov Chain Monte Carlo. Stat. Sci. 7:473–483.
Groussin, Mathieu, and Manolo Gouy. 2011. Adaptation to environmental temperature is a major
determinant of molecular evolutionary rates in archaea. Mol Biol Evol 28:2661–2674.
Harvey, P, and Mark Pagel. 1991. The comparative method in evolutionary biology .
Lartillot, Nicolas. 2013. Interaction between Selection and Biased Gene Conversion in Mammalian
Protein-Coding Sequence Evolution Revealed by a Phylogenetic Covariance Analysis. Mol Biol
Evol 30:356–368.
Lartillot, Nicolas. 2014. A phylogenetic Kalman filter for ancestral trait reconstruction using molec-
ular data. Bioinformatics .
Lartillot, Nicolas, and Frederic Delsuc. 2012. Joint reconstruction of divergence times and life-history
evolution in placental mammals using a phylogenetic covariance model. Evolution 66:1773–1787.
Lartillot, Nicolas, Thomas Lepage, and Samuel Blanquart. 2009. PhyloBayes 3: a Bayesian software
package for phylogenetic reconstruction and molecular dating. Bioinformatics 25:2286–2288.
Lartillot, Nicolas, and Raphael Poujol. 2011. A phylogenetic model for investigating correlated
evolution of substitution rates and continuous phenotypic characters. Mol Biol Evol 28:729–744.
de Magalhaes, J, and J Costa. 2009. A database of vertebrate longevity records and their relation to
other life-history traits. J Evol Biol 22:1770–1774.
33

Martins, E, and T Hansen. 1997. Phylogenies and the comparative method: a general approach to
incorporating phylogenetic information into the analysis of interspecific data. Am Nat 149:646–667.
Organ, Chris L, Andrew M Shedlock, Andrew Meade, Mark Pagel, and Scott V Edwards. 2007.
Origin of avian genome size and structure in non-avian dinosaurs. Nature 446:180–184.
Pagel, M. 1999. Inferring the historical patterns of biological evolution. Nature 401:877–884.
Thorne, J L, H Kishino, and I S Painter. 1998. Estimating the rate of evolution of the rate of
molecular evolution. Mol Biol Evol 15:1647–1657.
Wong, Frederick, Christopher K Carter, and Robert Kohn. 2003. Efficient estimation of covariance
selection models 90:809.
34