Correctional Industries Preparing Inmates for Re-entry … · Correctional Industries preparing...
88
The author(s) shown below used Federal funds provided by the U.S. Department of Justice and prepared the following final report: Document Title: Correctional Industries Preparing Inmates for Re-entry: Recidivism & Post-release Employment Author(s): Cindy J. Smith ; Jennifer Bechtel ; Angie Patrick ; Richard R. Smith ; Laura Wilson-Gentry Document No.: 214608 Date Received: June 2006 Award Number: 2004-DD-BX-1001 This report has not been published by the U.S. Department of Justice. To provide better customer service, NCJRS has made this Federally- funded grant final report available electronically in addition to traditional paper copies. Opinions or points of view expressed are those of the author(s) and do not necessarily reflect the official position or policies of the U.S. Department of Justice.
Transcript of Correctional Industries Preparing Inmates for Re-entry … · Correctional Industries preparing...

The author(s) shown below used Federal funds provided by the U.S. Department of Justice and prepared the following final report: Document Title: Correctional Industries Preparing Inmates for
Re-entry: Recidivism & Post-release Employment
Author(s): Cindy J. Smith ; Jennifer Bechtel ; Angie Patrick
; Richard R. Smith ; Laura Wilson-Gentry Document No.: 214608 Date Received: June 2006 Award Number: 2004-DD-BX-1001 This report has not been published by the U.S. Department of Justice. To provide better customer service, NCJRS has made this Federally-funded grant final report available electronically in addition to traditional paper copies.
Opinions or points of view expressed are those
of the author(s) and do not necessarily reflect the official position or policies of the U.S.
Department of Justice.

Correctional Industries
preparing inmates for re-entry:
Recidivism & post-release employment
Final report
May 10, 2006
Cindy J. Smith, Ph.D.
Jennifer Bechtel, M.S.
Angie Patrick, M.S.
Richard R. Smith
Laura Wilson-Gentry, D.P.A.
This document is a research report submitted to the U.S. Department of Justice. This report has not been published by the Department. Opinions or points of view expressed are those of the author(s)
and do not necessarily reflect the official position or policies of the U.S. Department of Justice.

This project was supported by Grant No. 2004-DD-BX-1001 awarded by the National
Institute of Justice, Office of Justice Programs, U.S. Department of Justice. Points of
view in this document are those of the author and do not necessarily represent the
official position or policies of the US Department of Justice.
1
This document is a research report submitted to the U.S. Department of Justice. This report has not been published by the Department. Opinions or points of view expressed are those of the author(s)
and do not necessarily reflect the official position or policies of the U.S. Department of Justice.

Acknowledgements
This project began in 2000 as a potential solution to the dearth of policy research
needed by the advocates for and against correctional industries. The seeds were
planted at the National Correctional Industries Association (NCIA) headquarters under
the direction of Gwyn Smith-Ingley, Executive Director. Our gratitude extends to her
and her staff for the tireless support and advocacy for this research. Additionally, the
NCIA's Research Advisory Board was instrumental in the design and strategy of the
research. Although each member contributed significantly, Derral Cheatwood, Ph.D.
was particularly instrumental in developing the ideas of the Board into a draft research
plan. This plan was supported and advanced in the respective disciplines by each of the
Board members; Patrick Henry, Ph.D., Representative Ray Allen (R-Tx), Jeffrey Merrill,
Jeri Houchins, Thomas Petersik, Ph.D., and Tim Mann, Ph.D. In addition, Barbara
Auerbach provided wisdom based on her many years of consulting in the field of
correctional industries.
Particularly critical to the study were the directors of the various departments of
correction, correctional industries and research departments, who provided literally
reams of data and automated data files. They opened their offices to the research team
for months and donated countless hours to the project. Without their support, this
project could not have been accomplished. Although we would like to personally thank
each of these devoted employees, it was determined best to allow the states to remain
anonymous. In addition to the state employees and private industry personnel, we
would like to thank Fevzi Altun, M.S. and Ozgur Nikbay, M.S. for their research
2
This document is a research report submitted to the U.S. Department of Justice. This report has not been published by the Department. Opinions or points of view expressed are those of the author(s)
and do not necessarily reflect the official position or policies of the U.S. Department of Justice.

assistance in coding data. A special thanks to Kimberly S. Craig, M.A., who worked on
all of the preliminary stages of this research.
In addition to the research team, this study benefited from the wisdom of two
advisory groups. First, the research offices within the participating states offered their
advice and expertise on the practical implementation and appropriate use of the data.
Again, we would like to thank them personally, but confidentiality prevents this. Second,
a multidisciplinary team was created to benefit the research by providing a wide array of
input into the process and findings. A special thank you to the following individuals who
represented their disciplines in the design, analysis, and interpretation of the data; Gerry
Gaes, Corrections, Edward Little, Re-entry, Jean Marie Lyon, Psychology, Thomas
Petersik, Economics, David Stevens, Labor Economics, and Laura Wilson-Gentry,
Public Policy.
Finally, this project could not have been possible without the support of the
National Institute of Justice (Grant No. 2004-DD-BX-1001) and their coordination with
the Bureau of Justice Assistance (Grant No. 2001-RE-CS-001). We are particularly
indebted to Christopher Innes, Ph.D. and Edward Zedlewsky, Ph.D. for taking a
personal interest in this project. Additionally, Marilyn Moses, our grant monitor, has
spent considerable time advocating for the project.
While this report could not have happened without everyone's support, the
authors take full responsibility for its contents.
3
This document is a research report submitted to the U.S. Department of Justice. This report has not been published by the Department. Opinions or points of view expressed are those of the author(s)
and do not necessarily reflect the official position or policies of the U.S. Department of Justice.

Table of Contents
Executive Summary ...................................................................................................... 6
Abstract........................................................................................................................ 20
Introduction ................................................................................................................. 22
Background ............................................................................................................... 22 Statement of the problem .......................................................................................... 25 Definition of terms...................................................................................................... 28 Limitations ................................................................................................................. 32 Significance of the study............................................................................................ 34
Methods ....................................................................................................................... 35
Introduction................................................................................................................ 35 Research questions and hypotheses......................................................................... 35 Research design........................................................................................................ 36 Site and sample selection.......................................................................................... 37 Matching criteria ........................................................................................................ 40 Sample identification.................................................................................................. 42 Data Collection Procedures ....................................................................................... 43 Sample Characteristics: Matching variables ............................................................. 46 Sample Characteristics: Industry groupings employed by the sample...................... 47 Sample characteristics: Descriptive statistics ............................................................ 48 Analysis technique..................................................................................................... 50
Key findings and discussion...................................................................................... 53
Research Question 1: Does PIECP participation increase post release employment as compared to TI work and OTW?.................................................. 54 1) Proportion of time post release the releasee worked............................................. 54 2) Length of time to employment ............................................................................... 57 3) Duration of employment ........................................................................................ 60 4) Wage rate.............................................................................................................. 65 5) Industry groupings (NAICS) in prison versus free world ........................................ 66 Research Question 2: Does PIECP participation reduce recidivism as compared to TI work or OTW?.................................................................................................. 67 Arrest ......................................................................................................................... 68 Conviction.................................................................................................................. 71 Incarceration.............................................................................................................. 75 Summary ................................................................................................................... 77
Policy Recommendations........................................................................................... 79
4
This document is a research report submitted to the U.S. Department of Justice. This report has not been published by the Department. Opinions or points of view expressed are those of the author(s)
and do not necessarily reflect the official position or policies of the U.S. Department of Justice.

Future Research .......................................................................................................... 80
References ................................................................................................................... 84
Table of Tables
Table 1: Matching characteristics statistical significance n=6464................................. 42 Table 2: Sample characteristics (n=6464).................................................................... 46 Table 3: Industry groupings of sample ......................................................................... 48 Table 4: Sample profile ................................................................................................ 49 Table 5: Post release employment descriptive measures (n=6464)............................. 55 Table 6: Case processing summary - release to employment...................................... 57 Table 7: Overall comparisons - release to employment ............................................... 58 Table 8: Comparison of TI & OTW only........................................................................ 58 Table 9: Post-release employment duration descriptive measures (n=6464)............... 61 Table 10: Case processing summary - employment duration ...................................... 63 Table 11: Overall comparisons - employment duration ................................................ 63 Table 12: Comparison of TI & OTW only - employment duration ................................. 63 Table 13: Wages earned post-release ......................................................................... 66 Table 14: Release to arrest descriptive measures ....................................................... 68 Table 15: Case processing summary - arrest............................................................... 69 Table 16: Overall comparisons - arrest ........................................................................ 69 Table 17: Comparison of TI & OTW only - arrest ......................................................... 70 Table 18: Case processing summary - conviction........................................................ 72 Table 19: Overall comparisons - conviction.................................................................. 73 Table 20: Comparison of TI & OTW only - conviction................................................... 73 Table 21: Case processing summary - incarceration ................................................... 75 Table 22: Overall comparisons - incarceration ............................................................. 75 Table 23: Comparison of TI & OTW only - incarceration.............................................. 76 Table 24: Success........................................................................................................ 78
Table of Figures
Figure 1: Timeline ........................................................................................................ 27 Figure 2: Visual model of analysis................................................................................ 50 Figure 3: Single shot or cross sectional analysis.......................................................... 51 Figure 4: KM survival analysis example ....................................................................... 52 Figure 5: Survival function - release to employment..................................................... 59 Figure 6: Employment duration .................................................................................... 62 Figure 7: Survival function - employment duration ....................................................... 64 Figure 8: Survival function - arrest ............................................................................... 70 Figure 9: Survival function - conviction......................................................................... 74 Figure 10: Survival function - incarceration .................................................................. 76
5
This document is a research report submitted to the U.S. Department of Justice. This report has not been published by the Department. Opinions or points of view expressed are those of the author(s)
and do not necessarily reflect the official position or policies of the U.S. Department of Justice.

Executive Summary1{ TC "Executive Summary" \f C \l "1" }{ TC "Executive
Summary" \f C \l "1" }
Introduction
This report summarizes the first national review of the recidivism and post-
release employment effects of the Prison Industries Enhancement Certification Program
(PIECP) engaging state prison inmates in private sector jobs since 1979. With the
exception of the PIECP program, US jail and prison inmates are prohibited by law from
producing goods for sale in open markets based on the Ashurst-Sumners Act of 1935.
The original legislation authorizing PIECP in 1979 expected it to result in work
experience and training in marketable job skills, while more recent interest not targeted
in the original legislation emphasizes income and work experience in order to reduce
recidivism.
Since 1979, the Bureau of Justice Assistance has funded various agencies to
ensure state compliance with the legislative mandate of the Ashurst-Summers Act
without the benefit of a national evaluation. Since 1995, funding to the National
Correctional Industries Association, the grant recipient to provide training, technical
assistance and monitor the PIECP program, has grown from a few hundred thousand to
$1.6 million per year, while the program has grown from 1,724 inmates employed in
more than 80 industries to 5,103 inmates employed in over 200 industries across 36
states, and the inmates earned approximately $276.5 million and returned $162.3
million to the economy in the form of room and board, taxes, family support and victims'
compensation.
1 References are intentionally deleted from the executive summary and may be found in the full report.
6
This document is a research report submitted to the U.S. Department of Justice. This report has not been published by the Department. Opinions or points of view expressed are those of the author(s)
and do not necessarily reflect the official position or policies of the U.S. Department of Justice.

It has been hypothesized that joint venture industries between
inmates/Departments of Correction and the private sector are a promising type of re-
entry preparedness in the work experience area and reduces idleness during the prison
stay according to the legislation. According to the Bureau of Justice Statistics, PIECP
enjoys benefits to a wide variety of stakeholders, including corrections administrators,
victims, inmates, private sector, and the public.
Methods
The research design for this study is a quasi-experimental design using matched
samples with a test group of PIECP participants and two control groups of those who
work in traditional industries (TI) and those involved in other than work (OTW) activities
using quantitative analysis of data collected from agency records. The inmates were
matched using six criteria. Exact matches were made on race: minority and white;
gender: male and female; crime type: person and all other; and category matches on
age: 5 criteria categories; time served: 7 criteria categories; and number of disciplinary
reports: 10 criteria categories. Other characteristics that prior research has indicated
may impact the outcomes (i.e., individual effects, family effects) were examined briefly.
A cluster sampling strategy was used for site selection. This strategy insures a
sufficiently large sample by selecting states that have large numbers of PIECP workers
within the confines of other criteria. The selection process included all major U.S.
geographic regions, rural and urban populations, gender representation to ensure
results can be determined based on gender, and each of the models of PIECP
(discussed later in this report). Additionally, each state had PIECP certification prior to
1996. This strategy resulted in a selection of five states.
7
This document is a research report submitted to the U.S. Department of Justice. This report has not been published by the Department. Opinions or points of view expressed are those of the author(s)
and do not necessarily reflect the official position or policies of the U.S. Department of Justice.

The data were collected from record reviews of outcomes for three matched
samples, each of approximately 2200 inmates (n=6464), released from 46 prisons
across 5 PIECP states between 1996 and 2001. It examines whether sampled inmates
participating in PIECP return to prison less frequently (e.g., recidivism effects) or enter
more successful employment (e.g., employment effects) than otherwise similar inmates
who either participated only in traditional prison industries (TI) or were involved in other
than work (OTW) activities while in prison.
The research responds to the following two questions:
1. Does PIECP participation increase post release employment as compared to
traditional industries (TI) work or other than work (OTW) activities?
2. Does PIECP participation reduce recidivism as compared to traditional
industries work or other than work?
Both of the research questions are most appropriately answered using survival
analysis. The key to both questions is to accurately measure the follow-up time period.
Employment effects will be measured by time to obtaining employment (i.e., reported
earnings in a given quarter) and the time to loss of employment (i.e., no earnings
reported for a quarter). Recidivism will be measured by the time it takes from release to
first recidivism (i.e., arrest, conviction, and incarceration).
Key Findings
The primary findings of this research are that inmates who worked in open-
market jobs in PIECP were found to be significantly more successful in post-release
employment. That is to say, they became tax-paying citizens quicker and remain in that
status longer than TI and OTW releasees. Additionally, TI releasees were more
8
This document is a research report submitted to the U.S. Department of Justice. This report has not been published by the Department. Opinions or points of view expressed are those of the author(s)
and do not necessarily reflect the official position or policies of the U.S. Department of Justice.

successful post-release in obtaining employment more quickly than OTW releasees.
Finally, PIECP releasees had slower and reduced recidivism, as measured by arrest,
conviction and incarceration, than TI and OTW releasees. Success was defined using
seven criteria found in the following table. A brief discussion of each of these seven
follows the table.
Table 1: Success
Measure of success Finding
1) proportion of time employed
during the follow-up period
Average proportion of time is 50%
2) time to first employment after
release
PIECP participants obtain employment
significantly faster than TI & OTW. TI
participants obtain employment significantly
faster than OTW.
3) duration of first employment PIECP participants retain the 1st employment
significantly longer
4) wage rate during the follow-
up period
PIECP participants earn more wages and
higher wages
5) time from release to first
arrest
PIECP participants are arrested at a slower
rate than other groups.
6) Time from release to first
conviction
PIECP participants are convicted at a slower
rate than other groups.
7) time from release to first
incarceration
PIECP participants are incarcerated at a
slower rate than other groups
9
This document is a research report submitted to the U.S. Department of Justice. This report has not been published by the Department. Opinions or points of view expressed are those of the author(s)
and do not necessarily reflect the official position or policies of the U.S. Department of Justice.

1) Proportion of time post release the releasee worked Approximately 26 percent (n=1695) of the total sample (n=6464) had no reported
earnings during the follow-up period (e.g., the time from release from prison until the
end of data collection). The reasons for no reported earnings are unknown, but could
include failure to report or record earnings, work in industries in which wages may
traditionally not be reported (i.e., agriculture or illegal employment), or employment in
other states. And, of course, the data include those who did not work and had no
earnings. There is no way of knowing what proportion of this 26 percent is explained by
each of these without an individual follow-up. The range of the follow-up period for this
measure is a minimum of 6 calendar quarters to a maximum of 31 quarters for the
sample. Overall, the average follow-up period for the entire sample is 16.1 quarters
(standard deviation 6.4 quarters). Those who had no employment during the follow-up
period had an average of 15.7 quarters (standard deviation 6.4 quarters), while those
with employment during the follow-up period had an average of 16.3 quarters (standard
deviation 6.4 quarters, which is statistically significantly different (t=3.0, p=.003). This
means the group who did not have reported earnings post release were released later
in the release window and had less follow-up time. If additional follow-up were
conducted at a later time, it is possible this difference would disappear. It is also
possible that more recent releasees are less likely to obtain employment. On average,
the releasees worked 50 percent of the total time available post release.
10
This document is a research report submitted to the U.S. Department of Justice. This report has not been published by the Department. Opinions or points of view expressed are those of the author(s)
and do not necessarily reflect the official position or policies of the U.S. Department of Justice.

2) Length of time to employment
The amount of time that lapsed between release and employment included a
comparison of PIECP, TI and OTW to each other to determine who obtained
employment faster. Based on the survival analysis, PIECP participants obtained post
release employment significantly faster than either TI or OTW and TI releasees
obtained employment faster than OTW releasees. The steepest slope indicates that
comparably more releasees than other groups have found employment. Approximately
24 and 25 percent of the TI and OTW releasees did not have reported earnings,
whereas less than 17 percent of the PIECP's did not have earnings over the course of
follow-up.
Figure 1: Survival function - release to employment
11
This document is a research report submitted to the U.S. Department of Justice. This report has not been published by the Department. Opinions or points of view expressed are those of the author(s)
and do not necessarily reflect the official position or policies of the U.S. Department of Justice.

302520151050
Release to Employment - # QTRS
1.0
0.8
0.6
0.4
0.2
0.0
Cum
Sur
viva
l
TI-censoredPIE-censoredOTW-censoredTIPIEOTW
PIECP / TI / OTW
Survival Functions
First, approximately 55 percent of the PIECP and 40 percent of the TI and OTW
obtained employment within the first quarter upon release. Conversely, approximately
45 percent PIECP and 60 percent of the TI and OTW releasees ended the first quarter
without experiencing the terminal event (i.e., not obtaining employment). Once the
releasee obtains employment, he or she is dropped from further analysis shown in the
survival curve. Second, survival analysis provides the amount of time that passes
before the curve associated with change in status becomes flattened. By the end of the
12
This document is a research report submitted to the U.S. Department of Justice. This report has not been published by the Department. Opinions or points of view expressed are those of the author(s)
and do not necessarily reflect the official position or policies of the U.S. Department of Justice.

fifth quarter approximately 20 percent PIECP and 30 percent TI and OTW releasees
have not become employed. An additional five percentage point decline occurs over
the next six years indicating that few releasees obtain employment after the first five
quarters. Finally, this analysis shows which group obtained employment faster. TI and
OTW survival curves, while they appear similar in this graph, are significantly different,
indicating that it took OTW releasees longer to obtain employment than TI releasees.
The PIECP line drops faster and remains below the other two, which shows that
releasees participating in PIECP obtained employment faster than those who do not
have the PIECP experience.
3) Duration of employment
Post-release employment is the length of the time between first employment and
the first full quarter without reported earnings or employment. A sequence of jobs or
multiple jobs in one quarter (i.e., changing employment, working two jobs), is not
counted as a loss of employment. Unemployment within a quarter remains counted as
employment so long as there are reported earning within the quarter, and the releasee
may be unemployed for large parts of the quarter. Hypothetically, a person only needs
to work some part of one day in a quarter to be considered employed for that quarter.
Among those in the sample with one year or more of follow-up (n=6464) and
three years or more of follow-up (n=4530), PIECP releasees are more likely to be
continuously employed than either TI or OTW. Of the 2333 available PIECP
participants, 48.6 percent of them were employed for one year or more continuously
and 13.7 percent of them were employed for three years or more continuously, whereas
40.4 percent and 38.5 percent of the TI and OTW releasees respectively were
13
This document is a research report submitted to the U.S. Department of Justice. This report has not been published by the Department. Opinions or points of view expressed are those of the author(s)
and do not necessarily reflect the official position or policies of the U.S. Department of Justice.

continuously employed for one year and approximately 10 percent of both TI and OTW
groups were continuously employed for over three years. Because the follow-up period
varies across the 5.5 years of post-release, some releasees were released less than 2
years. Therefore, the survival analysis provides a better description of the findings than
the periodic time series analysis. Based on the survival analysis, PIECP participants
retained employment significantly longer. The least steep slope is best because it
indicates that comparably more releasees have retained employment. Between 3.8 and
5.3 percent of the releasees remained employed at the end of the follow-up period.
Figure 2: Survival function - employment duration
302520151050
Employed to Job Loss - # QTRS
1.0
0.8
0.6
0.4
0.2
0.0
Cum
Sur
viva
l
TI-censoredPIE-censoredOTW-censoredTIPIEOTW
PIECP / TI / OTW
Survival Functions
14
This document is a research report submitted to the U.S. Department of Justice. This report has not been published by the Department. Opinions or points of view expressed are those of the author(s)
and do not necessarily reflect the official position or policies of the U.S. Department of Justice.

First, PIECP releasees retain employment longer than TI or OTW releasees for the first
five years of follow-up where the line merges at approximately 20 quarters. TI and
OTW releasees exhibit little difference. Nevertheless, over 50 percent of all three
groups had a full quarter of unemployment by the end of the third quarter after release.
4) Wage rate Approximately 55% of the releasees earned at an hourly rate less than the
Federal minimum wage during the post release follow-up period based on a calculation
that assumes full time work during each quarter in which wages are reported. It is
possible that the sample were either under-employed (i.e., working part time or working
intermittent) or under-paid. PIECP releasees earn significantly more than OTW
releasees and are employed significantly more quarters post-release than TI and OTW.
5) Industry groupings (NAICS) in prison versus free world
One measure of whether the programs administered provide inmates with usable
employment hard skills is to determine if the releasee obtains employment in the same
or similar position held during incarceration. NAICS groupings, albeit general, are the
best available measure. Of the 6464 releasees, 18,035 NAIC codes were collected, of
which approximately 10% (n=1719) had a post release employment in the same NAICS
grouping as he or she held while in prison. PIECP and TI workers held the same
grouping position approximately 12 percent and 8 percent respectively of the reported
NAICS grouping positions.
6) Arrest
This matched sample of releasees have relatively low recidivism rates. The
average amount of time from release to first arrest is approximately 993 days,
15
This document is a research report submitted to the U.S. Department of Justice. This report has not been published by the Department. Opinions or points of view expressed are those of the author(s)
and do not necessarily reflect the official position or policies of the U.S. Department of Justice.

suggesting that many (80 percent) of the releasees were arrest free at the end of the
first year. The range of time between the time released and the time arrested is 1-2,519
days. Almost 59 percent of those in PIECP successfully reentered society, whereas
approximately 53 percent of the TI & OTW were not arrested during the follow-up
period. The rate of success at the end of the first year is high for all three groups, 82.5
percent of PIECP, and 76.8 percent of TI and 76.2 percent OTW did not get arrested in
the first year post release.
Based on the survival analysis, PIECP participants stayed crime free significantly
longer than TI and OTW participants. However, TI participants were not significantly
different than OTW participants. The slowest dropping survival curve is best because it
indicates that comparably more releasees have remained arrest free. Between 52.6
and 59.7 percent of the releasees remained arrest free at the end of the follow-up
period.
16
This document is a research report submitted to the U.S. Department of Justice. This report has not been published by the Department. Opinions or points of view expressed are those of the author(s)
and do not necessarily reflect the official position or policies of the U.S. Department of Justice.

Figure 3: Survival function - arrest
300025002000150010005000
time from release to arrest
1.0
0.8
0.6
0.4
0.2
0.0
Cum
Sur
viva
l
TI-censoredPIE-censoredOTW-censoredTIPIEOTW
PIECP / TI / OTW
Survival Functions
First, PIECP releasees stay arrest free longer than TI or OTW releasees during
the follow-up period. TI and OTW releasees exhibit little difference. Nevertheless,
approximately 70 to 80 percent of the releasees were arrest free at the end of the first
year. The percent of those who are arrest free post-release continues to decline until
about the fourth year. This indicates that this sample of inmates is slightly different than
the general prison population.
6) Conviction
Between 73.6 and 77.9 percent of the releasees remained conviction free at the end of
the follow-up period. The survival analysis describes a significant difference between
17
This document is a research report submitted to the U.S. Department of Justice. This report has not been published by the Department. Opinions or points of view expressed are those of the author(s)
and do not necessarily reflect the official position or policies of the U.S. Department of Justice.

PIECP and TI, and between PIECP and OTW, but not between TI and OTW. PIECP
releasees stay conviction free longer than TI or OTW releasees during the follow-up
period. TI and OTW releasees exhibit little difference. Nevertheless, approximately 90
percent of the releasees were conviction free at the end of the first year. The percent of
those who are conviction free post-release also continues to decline until about the
fourth year, following the similar trend to arrests. Finally, the survival curve mirrors
arrests except with fewer convictions.
7) Incarceration
Between 89 and 93 percent of the releasees remained incarceration free at the
end of the follow-up period. Mirroring arrests and convictions, PIECP participants are
incarceration free for significantly longer periods of time post release.
Policy Recommendations & Future Research
The research results found in this report suggest that work plays an integral part
in successful re-entry upon release in terms of employment and recidivism. Based on
the employment survival analysis, employment assistance should be focused during the
first year after release to assist those who obtain work more readily and additional
research should be focused on the 20 to 30 percent who do not obtain employment for
the remaining follow-up period to determine the causes.
Additionally, the state and federal coiffeurs benefited from the taxes paid and the
room and board collected. This suggests that increased efforts should be expended to
increase private industry partnerships and PIECP jobs. This increase should be
carefully monitored to ensure the program continues to enjoy success as a wider pool of
inmates is included.
18
This document is a research report submitted to the U.S. Department of Justice. This report has not been published by the Department. Opinions or points of view expressed are those of the author(s)
and do not necessarily reflect the official position or policies of the U.S. Department of Justice.

Additionally, because this research is the first national level study of this topic, it
opens a plethora of ideas for future research and the topic of industry within the prison
walls has been the focus of many legislatures recently. To prepare a more focused
approach, the two most urgent issues are offered. First, the research should examine
similar questions related to the various subpopulations within these data, such as
custody level, gender, and various subcategories of those who were employed and not
employed at varying points of time. Second, it is important to know the percent of the
general prison population that matches PIECP participants. The sample is based on
those who are selected to work in PIECP and those who are most likely to be selected if
positions were available. Even in the preliminary stages of reporting results, this raised
concerns about the generalizability of the findings. As discussed within the report, the
findings are generalizable to all PIECP releasees, but to a more limited number of TI
and OTW releasees. Further investigation should be made to determine an
approximate proportion of inmates to which this sample represents. For example, are
50 percent of the current inmates similar to those who are selected for PIECP?
19
This document is a research report submitted to the U.S. Department of Justice. This report has not been published by the Department. Opinions or points of view expressed are those of the author(s)
and do not necessarily reflect the official position or policies of the U.S. Department of Justice.

Abstract{ TC "Abstract" \f C \l "1" }
This project conducted the first national empirical assessment of post release
employment and recidivism effects based on legislative intent for inmates participating
in Prison Industries Enhancement Certification Program (PIECP) as compared to
participants in traditional industries (TI) and those involved in other than work (OTW)
activities. Since 1979, the Bureau of Justice Assistance has funded various agencies to
ensure state compliance with the legislative mandate of the Ashurst-Summers Act
without the benefit of a national evaluation. Since 1995, funding to the National
Correctional Industries Association, the grant recipient to provide training, technical
assistance and monitor the PIECP program, has grown from a few hundred thousand to
$1.6 million per year, while the program has grown from 1,724 inmates employed in
more than 80 industries to 5,103 inmates employed in over 200 industries across 36
states, and the inmates earned approximately $276.5 million and returned $162.3
million to the economy in the form of room and board, taxes, family support and victims'
compensation. It is hypothesized that joint venture industries between
inmates/Departments of Correction and the private sector are a promising type of re-
entry preparedness in the work experience area and reduces idleness during the prison
stay according to the legislation.
A records review of outcomes for three matched samples, each of approximately
2200 inmates (n=6464), released from 46 prisons across 5 PIECP states between 1996
and 2001 examines whether PIECP participants return to prison less frequently or enter
more successful employment than otherwise similar inmates participating in traditional
prison industries (TI) or other than work (OTW) activities while in prison.
20
This document is a research report submitted to the U.S. Department of Justice. This report has not been published by the Department. Opinions or points of view expressed are those of the author(s)
and do not necessarily reflect the official position or policies of the U.S. Department of Justice.

The primary findings of this research are that inmates who worked in open-
market jobs in PIECP were found to be significantly more successful in post-release
employment. That is to say, they became tax-paying citizens quicker and remain in that
status longer than TI and OTW releasees. Additionally, TI releasees were more
successful post-release in obtaining employment more quickly than TI releasees.
Finally, PIECP releasees had slower and reduced recidivism, as measured by arrest,
conviction and incarceration, than TI and OTW releasees.
The research results found in this report suggest that work plays an integral part
in successful re-entry upon release in terms of employment and recidivism. Additionally,
the state and federal coiffeurs benefited from the taxes paid and the room and board
collected. This suggests that increased efforts should be expended to increase private
industry partnerships and PIECP jobs. This increase should be carefully monitored to be
sure the program continues to enjoy success as a wider pool of inmates is included.
21
This document is a research report submitted to the U.S. Department of Justice. This report has not been published by the Department. Opinions or points of view expressed are those of the author(s)
and do not necessarily reflect the official position or policies of the U.S. Department of Justice.

Introduction{ TC "Introduction" \f C \l "1" }2
This report summarizes the first national review of the recidivism and post-
release employment effects of the Prison Industries Enhancement Certification Program
(PIECP) engaging state prison inmates in private sector jobs since 1979. The report is
based on results from a records review of outcomes for three matched samples, each of
approximately 2200 inmates (n=6464), released from 46 prisons across 5 PIECP states
between 1996 and 2001. It examines whether sampled inmates participating in PIECP
return to the criminal justice system less frequently (e.g., recidivism effects) or enter
more successful employment (e.g., employment effects) than otherwise similar inmates
who either participated only in traditional prison industries (TI) or were involved in other
than work (OTW) activities while in prison. The results suggest that PIECP participants
who worked in open-market jobs in PIECP were found to be significantly more
successful in post-release employment. That is to say, they became tax-paying citizens
quicker and remain in that status longer than TI and OTW releasees. Additionally, TI
releasees were more successful post-release in obtaining employment more quickly
than TI releasees. Finally, PIECP releasees had slower and reduced recidivism, as
measured by arrest, conviction and incarceration, than TI and OTW releasees.
Background{ TC "Background" \f C \l "2" }
Wages. With the exception of the PIECP program, US jail and prison inmates
are prohibited by law from producing goods for sale in open markets ("Ashurst-Sumners
Act," 1935). As a result, the vast majority of US jail and prison inmates either work in
2 Some of the introduction and much of the methods sections were quoted from the feasibility study where the purpose was to develop the methods for the current study. The relevant sections were quoted without quotation marks or citation for the ease of the reader. For a full review of the feasibility study, see Smith, 2002.
22
This document is a research report submitted to the U.S. Department of Justice. This report has not been published by the Department. Opinions or points of view expressed are those of the author(s)
and do not necessarily reflect the official position or policies of the U.S. Department of Justice.
traditional prison industries or in institutional maintenance, earning usually less than $1
per hour (TI), or are involved in education, vocational education, training, counseling, or
other preparatory programs, or are idle (OTW). Since 1979, however, the PIECP
program has utilized about 65,000 thousand inmates working in open-market production
(Petersik, 2003).
Local and state inmates voluntarily participating in federally approved PIECP
programs earn locally prevailing market wages (e.g., currently $5.15 per hour or more)
and incur deductions for taxes, board and room, crime victims’ compensation, and
family support, with the sum of such deductions not to exceed 80 percent of gross
wages. According to the PIECP legislation, inmates must certify that they are voluntary
participants in PIECP. Therefore, the first criterion for program participation is to
volunteer. Next, the eligibility criteria vary by state, institution, and industry. While there
are general criteria that seem to fit most of the sites and industries, it is not consistent.
The following is a general summary across the Departments of Correction criteria:
• Disciplinary report free for 6 months
• Minimum and medium security levels
• Enrolled in a high school or GED program or completion
• Sentence of at least 6 months remaining
• No major medical problems prohibiting work
Again, the criteria for hiring an inmate vary across industries. The following is a
general summary of the industry criteria:
• Submit an application and be interviewed
23
This document is a research report submitted to the U.S. Department of Justice. This report has not been published by the Department. Opinions or points of view expressed are those of the author(s)
and do not necessarily reflect the official position or policies of the U.S. Department of Justice.

• Prefer prior work experience, but some employers prefer to hire those who
have never worked before
• “Fit” with the current work force
The criteria vary across sites. For example, screening tests are conducted to
determine if the inmate possesses or can develop necessary skills. Others rely on
vocational education teacher recommendations. Some employers take into account
other inmate recommendations, while others take a very cautious view of these
recommendations. Some employers seek correctional staff and education personnel
recommendations, while others prefer not to have this input. One employer maintains a
file of applications in date order and takes the next applicant when a vacancy occurs.
These hiring criteria are similar to those found in the free world of business.
Models. Federally sanctioned PIECP programs may be approved for state-level
correctional systems or for local correction programs. PIECP programs may be
employer model establishments, in which private sector firms, often but not always, are
located inside correctional institutions, manage the PIECP inmate population and
produce goods for sale in open markets; or the PIECP customer model may be used, in
which departments of correction operate the PIECP production facilities and manage
PIECP workers, and deliver resultant output to private firms for sale in open markets; or
the PIECP program may be manpower model, in which the inmates are supervised by
the private company but they are considered to be employed by the department of
correction. Federal inmates are not current participants in PIECP.
In the original legislation, PIECP was expected to result in work experience and
training in marketable job skills; more recent interest not targeted in the original
24
This document is a research report submitted to the U.S. Department of Justice. This report has not been published by the Department. Opinions or points of view expressed are those of the author(s)
and do not necessarily reflect the official position or policies of the U.S. Department of Justice.

legislation emphasizes income and work experience in order to reduce recidivism
(Atkinson, 2002; Macguire, Flanagan, & Thornberry, 1988; Saylor & Gaes, 1997).
Statement of the problem{ TC "Statement of the problem" \f C \l "2" }
PIECP has been operational since 1979 to the present with growth in the number
of inmates employed at any given time, the number of free world business partnerships,
the number of states participating, and the amount of funds returned to state coiffeurs
without the benefit of an evaluation to determine its effectiveness. During this time, the
Bureau of Justice Assistance has been funding various agencies to monitor the states
to ensure compliance with the legislative mandate of the Ashurst-Summers Act. Since
1995, the Bureau of Justice Assistance has funded the National Correctional Industries
Association (NCIA) to provide training and technical assistance and to monitor the
PIECP program. During this time, the funding available to monitor the program has
grown from a few hundred thousand to $1.6 million per year (National Correctional
Industries Association, 2005). Over the same time period, the program has grown from
1,724 inmates employed in 86 cost accounting centers to 5,103 inmates employed in
201 cost accounting centers in the PIECP program across 36 states at the end of the
first quarter in 2005 (National Correctional Industries Association, 2005). Over the same
10 year span, the inmates, having earned approximately $276.5 million have returned
$162.3 million to the economy. During 8 of these 10 years, the wages earned by PIECP
participants were examined. PIECP employees earned $231.6 million in gross wages
with $126.9 million returned to the economy in the form of $21.5 million invested in
victim programs; $60.5 million returned to the states for prison room and board costs;
25
This document is a research report submitted to the U.S. Department of Justice. This report has not been published by the Department. Opinions or points of view expressed are those of the author(s)
and do not necessarily reflect the official position or policies of the U.S. Department of Justice.

$13.5 million spent on family support; and $31.4 million paid in taxes (National
Correctional Industries Association, 2002).
Yet, no national evaluation has been conducted. One reason the program has
continued to be funded is because it is hypothesized that joint venture industries
between inmates/Departments of Correction and the private sector are a promising type
of re-entry preparedness in the work experience area and reduce idleness during the
prison stay in accordance with the legislation. This project will address this void in
evaluation results and in the general literature. The purpose of this study is to test the
effects of PIECP according to its legislative intent and related research questions. 3
Over the life course of this research project, re-entry gained momentum based
on a visible increase in the number of publications available on the National Criminal
Justice Reference Service website (See Figure 1: Timeline). While this study can
address some re-entry issues, different data are needed to measure some of the more
important concepts, such as the time and type of services offered to individuals upon
reentry.
3 This project addresses a small part of the 1st subsection of the guidelines. Dr. Petersik and his colleagues completed a study examining the economic impact identified in subsection 2 (Petersik, Nayak, & Foreman, 2003). Future research should address the additional subsections. Legislative intent taken from current guidelines is as follows: (1) To provide a cost-efficient means to address inmate idleness and to provide inmates with work experience and training in marketable job skills. (2) Through inmate wage deductions, to increase advantages to the public by providing the departments of correction with a means of collecting taxes and partially recovering inmate room and board cost, by providing crime victims with a greater opportunity to obtain compensation, as well as promoting inmate family support. (3) Through PIECP participation, to prevent unfair competition between prisoner-made goods and private sector goods. (4) To prevent the exploitation of prisoner labor.
26
This document is a research report submitted to the U.S. Department of Justice. This report has not been published by the Department. Opinions or points of view expressed are those of the author(s)
and do not necessarily reflect the official position or policies of the U.S. Department of Justice.

Figure 1: Timeline
The research re
1. Does P
traditional indus
The legis
in marketable jo
skills include bo
time everyday).
obtained emplo
they remain em
employment aft
4 Originally there wstudy we discoveredisciplinary reportsclosely matched sa
This document is a research report submitted to the U.S. Department of Justice. This report has not been published by the Department. Opinions or points of view expressed are those of the author(s)
and do not necessarily reflect the official position or policies of the U.S. Department of Justice.
1979 – PIECP legislation passed 1999 – First Research Advisory Board Meeting 1999/2000 – Current research project outlined 2000 – Prisoner reentry gained momentum 2001 – Annotated bibliography about prison work published 2002 – Feasibility study published 2005 – First results released at ACA conference
sponds to the following questions4:
IECP participation increase post release employment as compared to
tries (TI) work or other than work (OTW) activities?
lative intent states “to provide inmates with work experience and training
b skills.” (Federal Register, 1999, April 17, p. 17007). Marketable job
th hard (i.e., sheet metal welding) and soft skills (i.e., arriving at work on
Therefore, the soft skill outcome measures include whether a person
yment after release and, once they found employment, how long did
ployed. The hard skills outcome measure includes did they obtain
er release that used the similar skills they learned while participating in
ere three research questions. However, during the interview process of the feasibility d that disciplinary reports are a criteria to be hired (Smith, 2002). Therefore, should be used in the matching process rather than as an outcome to ensure a more mple.
27

PIECP. In other words, did working in PIECP increase post-release employment over
the two control groups?
2. Does PIECP participation reduce recidivism as compared to traditional
industries work (TI) or other than work (OTW)?
The legislative intent does not address recidivism. However, unemployment is
directly linked and a predictor of criminal activity (Saylor & Gaes, 1997). And, the U.S.
Congress conceded as early as 1930 that the hope for rehabilitation of inmates is found
in learning the soft and hard skills of work (Congressional Record, Report No. 529. 71st
Congress, 2d session, April 21, 1930. as cited in Saylor & Gaes, 1997). Additionally,
this research question is included to better understand the rehabilitative effects of
PIECP. An ultimate desire of those involved in criminal justice is that the offending stop.
If PIECP offers that effect on all or a segment of its participants, this information should
be known.
Definition of terms{ TC "Definition of terms" \f C \l "2" }
Cost Accounting Center – Each private industry partnership under one
certificate holder is called a cost accounting center. Usually the state is the certificate
holder; however, a county might hold the certificate.
Other than work (OTW) – Those in the other than work group may be involved
in other prison activities, just not industry work. For example, they may be enrolled in
education programs or drug treatment. It is important to remember that people in the
OTW group are not necessarily sitting idle in their cells, although that may be the case.
Also, OTW tasks (i.e., laundry) may be the same task being performed by the TI people.
28
This document is a research report submitted to the U.S. Department of Justice. This report has not been published by the Department. Opinions or points of view expressed are those of the author(s)
and do not necessarily reflect the official position or policies of the U.S. Department of Justice.
The difference being that the task is classified by one state as TI and by the other state
as OTW.
OTW is further divided into two categories; 1) those who choose not to work
while in prison, and 2) those who are in mandatory work states that choose the jobs with
the least requirement of effort and time (i.e., two hours of mopping in the dorm area vs.
an eight hour work day). Mandatory work states require an inmate to work or attend
school. Inmates who are unable to work, due to physical, mental, or behavioral
limitations are not included in this study (i.e., gang segregation inmates are not eligible
for participation in programming). This control group isolates most of the PIECP effects.
The hard and soft skills learned in this situation are limited. Some of the inmates do
earn a minimal wage similar to TI (i.e., $.25/hour).
Prison Industry Enhancement Certification Program (PIECP) – The test
group includes those inmates who participated in PIECP and were released during the
release window. Inmates who participated in PIECP during previous incarcerations to
this release window would not be considered PIECP for this study unless they were also
in PIECP in this window. The records were insufficient to determine participation in
PIECP during prior incarcerations. It is possible that the inmate may have participated in
TI or OTW during this incarceration, but not necessarily. The PIECP includes a
relationship of one or more private sector companies where inmates produce a product
or provide a service for the company at the prevailing wage (i.e., minimum wage or
above). The work ranges from labor intensive routine tasks (i.e., assembly line) to highly
skilled craftsmanship (i.e., sheet metal welding).
29
This document is a research report submitted to the U.S. Department of Justice. This report has not been published by the Department. Opinions or points of view expressed are those of the author(s)
and do not necessarily reflect the official position or policies of the U.S. Department of Justice.

The causal characteristics of PIECP are (at a minimum5) three-fold. First, the
inmate who works in PIECP will have experienced the soft skills (i.e., going to work
regularly, getting to work on time, positive attitude at work) and hard skills (i.e., learning
a trade or skill, such as welding). Additionally, it includes the benefits of reduced
idleness and also of prevailing wage (minimum wage or higher). Under the employer
and manpower models, the inmate has regular contact and is supervised by a free
world worker which may change the environment from a correctional environment to an
employment environment during the workday.
Release Window – Inmates who were released between January 1, 1996 and
June 30, 2001 are the sample for this study. An inmate may have been released prior
or post this window, but to be included in the sample, they must have been released
during this time frame also. In other words, all PIECP participants who were released
during the release window are the test group of this study.
Traditional Industries (TI) – Traditional Industries is divided into two inmate
worker categories. The first is similar to PIECP in terms of work, except the inmate is
not paid a prevailing wage and the production is not sold in open markets. For example,
he or she may be paid nothing or a minimal amount such as $.25/hour up to
approximately $1.25/ hour. Traditional Industries include various types of work (i.e.,
sewing prison uniforms, making mattresses) and, in fact, the work may be exactly the
same as PIECP, but is sold within the state to government entities or other limited
5 This is a simplistic characteristic of PIECP. Future studies should include data collection and analysis of the more complex characteristics. For example, PIECP may include an array of soft skills, such as greater urgency in work, less wasted time, and increased customer responsiveness. Additionally, PIECP may include less tolerance of error, higher quality craftsmanship, and better raw material controls. Finally, free world employers may perceive PIECP employment to be prior employment/work experience which allows the inmate to develop a continuous employment history.
30
This document is a research report submitted to the U.S. Department of Justice. This report has not been published by the Department. Opinions or points of view expressed are those of the author(s)
and do not necessarily reflect the official position or policies of the U.S. Department of Justice.

markets. The second type of work is classified as institutional maintenance (i.e., semi-
skilled maintenance, office support staff). TI includes whatever the host state considers
a traditional industry within that state. For example, in one state laundry may be
considered traditional industries where as in another state laundry may be considered
other than work. This lack of distinction in actual labor makes these groups very similar
and confounds the analysis. (See limitations for more details).
This control group isolates part of the PIECP effect. TI includes learning soft
skills and hard skills (although some skills may be substantially less helpful for
employment upon release), as well as some of the benefits. In fact, the main differences
between PIECP and TI are the substantial amount of money and all the benefits that
follow (i.e., the increased ability to pay child support and restitution prior to release) and
for many the opportunity to work in a free world employment environment. An inmate on
the waiting list for a PIECP job may be working in a TI, learning similar employment soft
and hard skills. In addition, some PIECP and TI jobs are split. For example, in an optical
factory making eye glass lenses an inmate may work in PIECP half the day and in TI
the other half of the day. In that case a person will be considered a PIECP person even
though they are working in TI at the same time. When comparing the outcomes of those
in PIECP to those in TI, there may not be a detectable difference if the rehabilitating
factor is the soft and hard skills.
In addition, some correctional industries in prisons may have service operations.
Federal law does not require these operations to be classified as PIECP, although some
institutions choose to designate them as such. In these non-PIECP service operations,
inmates may provide a service for the private sector in interstate commercial markets
31
This document is a research report submitted to the U.S. Department of Justice. This report has not been published by the Department. Opinions or points of view expressed are those of the author(s)
and do not necessarily reflect the official position or policies of the U.S. Department of Justice.

(i.e., furniture refurbishing), but no products are manufactured. Salaries can be set at
below Federal minimum wage because the operations are not statutorily mandated to
comply with such requirements.
Limitations{ TC "Limitations" \f C \l "2" }
As a result of the similarities that exist between PIECP and TI work, as well as TI
and OTW activities, the strength of the analysis may be blurred. Some of the tasks
performed by TI and OTW employees may be exactly the same (i.e., laundry). The only
difference being that the TI group completes their task in an industry setting where
making a profit is emphasized. In the same respect, those in PIECP and TI may be
completing similar tasks (i.e., split wage industries), the difference being that PIECP
people are earning the prevailing wage during the time they are working in PIECP. The
result of the similarities among the groups holds the research results to a much higher
standard, requiring a much larger outcome difference between the groups to achieve
statistical significance.
In addition to the blurring of the work or training experienced by the workers,
there is the possibility and often the reality that PIECP releasees have the benefit of an
additive effect. For example, some industries require that inmates complete a
vocational education program where the skills necessary for the PIECP job are taught
and mastered. These OTW workers have the benefit of the training and the benefit of
the PIECP experience when they are released. Additionally, some PIECP employers
hire from an eligible pool of workers who are employed in TI. This philosophy provides
an additive effect for the worker upon release. Based on the data available, it was not
possible to determine which inmates experienced this additive effect. Therefore, the
32
This document is a research report submitted to the U.S. Department of Justice. This report has not been published by the Department. Opinions or points of view expressed are those of the author(s)
and do not necessarily reflect the official position or policies of the U.S. Department of Justice.

findings that PIECP releasees are more successful may be a result of the additive
effect.
Further, because the research relies on matched samples of inmates sharing
specific characteristics, findings can be generalized only to inmates sharing those
characteristics. Therefore, the sample is certainly generalizable to the PIECP
population. The findings for the TI and OTW groups are not representative of all TIs or
OTWs in prison. In other words, the findings are only generalizable to those inmates in
the general population who are most likely to be hired to work in PIECP. This study will
provide some limited insight into the characteristics of who is included in this group.
"Creaming" may be an issue in the study. PIECP has been accused of choosing
only the “best” inmates, those most likely to succeed regardless of in-prison
programming. This issue is directly addressed by deliberately choosing matched
samples so that both PIECP participants, TI and OTW share similar characteristics.
Because the goal of this study is to evaluate the legislative intent of PIECP, the
comparison groups of TI and OTW that were selected represent those that are most
likely to be hired by PIECP. Caution is urged not to generalize this study to all TIs or
OTWs because the pool of TIs and OTWs that match PIECP are not representative of
the entire prison population. It excludes those who are not eligible to be chosen to
work, including those with severe medical conditions, moderate to severe disciplinary
problems, and those who are unavailable due to protective custody or other separation
policies. However, samples were selected from all security level facilities because
industries exist in all levels. The exact comparison population is unknown.
33
This document is a research report submitted to the U.S. Department of Justice. This report has not been published by the Department. Opinions or points of view expressed are those of the author(s)
and do not necessarily reflect the official position or policies of the U.S. Department of Justice.

Significance of the study{ TC "Significance of the study" \f C \l "2" }
This study is the first national evaluation since the program began in 1979 that
has a sizeable sample that allows examination of the issues globally. In many states,
industries are one of the few government agencies that is self funding. In particular,
PIECP returns a large sum of money to the state. A Bureau of Justice Assistance
Program Brief lists a variety of stakeholders that benefit from the PIECP program
(Bureau of Justice Assistance, 2004).
“The corrections administrator. The program is a cost effective way to
occupy a portion of the ever growing prison population” (Bureau of
Justice Assistance, 2004, p. 3).
“The crime victim. The program provides a means of partial repayment
for harm sustained” (Bureau of Justice Assistance, 2004, p. 3).
“The inmate. The program offers a chance to work, meet financial
obligations, increase job skills and increase the likelihood of meaningful
employment upon release from incarceration” (Bureau of Justice
Assistance, 2004, p. 3).
“The private sector. The program provides a stable and readily available
workforce. In addition, many correctional agencies provide
manufacturing space to private-sector companies involved in the
program” (Bureau of Justice Assistance, 2004. p. 3).
“The public. Because of inmate worker contributions to room and board,
family support, victim compensation and taxes, the program provides a
34
This document is a research report submitted to the U.S. Department of Justice. This report has not been published by the Department. Opinions or points of view expressed are those of the author(s)
and do not necessarily reflect the official position or policies of the U.S. Department of Justice.

way to reduce the escalating costs of crime” (Bureau of Justice
Assistance, 2004, p. 3).
The remainder of this report will outline the methods used and the results
obtained from the research. Policy recommendations are offered for practitioner
implementation and recommendations for future research are offered to guide the next
steps in the research process.
Methods{ TC "Methods" \f C \l "1" }
Introduction{ TC "Introduction" \f C \l "2" }
The goal of this project was to empirically assess post release employment and
recidivism outcomes for inmates participating in PIECP. The research constitutes a first
step in measuring the legislative intent of PIECP and the post-legislation interest of
various stakeholders wanting to know if PIECP is an effective re-entry tool. These two
concepts motivate this research and, as a result, dictate the research methods and the
following two questions asked.
Research questions and hypotheses{ TC "Research questions and hypotheses"
\f C \l "2" }
1. Does PIECP participation increase post release employment as
compared to TI and activities of OTW?
Hypothesis: PIECP participation increases post release employment significantly more
than TI and OTW. The difference between PIECP and TI experiences, which includes
the amount of pay, may be quite small and found only with sufficient sample sizes
35
This document is a research report submitted to the U.S. Department of Justice. This report has not been published by the Department. Opinions or points of view expressed are those of the author(s)
and do not necessarily reflect the official position or policies of the U.S. Department of Justice.

(Saylor & Gaes, 1997). However, the difference between PIECP and OTW includes
pay, soft and hard skills and should be more easily detectable.
2. Does PIECP participation reduce recidivism as compared to TI and
OTW?
Hypothesis: PIECP participation reduces recidivism significantly more than TI and OTW.
Some inmates in each of the groups (PIECP, TI, OTW) may share some
characteristics, a feature which is expected to blur or weaken the statistical differences.
First, there are confounding issues when comparing the differences between the inmate
groups. The criteria for selection into the PIECP sample group include those who were
paid a PIECP wage regardless of how long. Inmates who worked for a short time may
not acquire some of the soft and hard skills associated with having worked, thereby
masking the differences between the groups of PIECP, TI, and OTW. Second, some
inmates participate in vocational education programs and also learn some hard skills
and some soft skills. This will mask the differences between the groups as well.
Therefore, we must expect some smaller differences in this early effort of PIECP
evaluation. (See limitations for further discussion of these blurring factors).
Research design{ TC "Research design" \f C \l "2" }
The research design for this study is a quasi-experimental design using matched
samples6 with a test group of PIECP participants and two control groups of TI and OTW
using quantitative analysis of data collected from agency records. Other characteristics
that prior research has indicated may impact the outcomes (i.e., individual effects,
family effects) will be examined briefly.
6 This design is found extensively in the literature over a period of years (Petersilia & Turner, 1986; Turner & Smith, 1994).
36
This document is a research report submitted to the U.S. Department of Justice. This report has not been published by the Department. Opinions or points of view expressed are those of the author(s)
and do not necessarily reflect the official position or policies of the U.S. Department of Justice.

Site and sample selection{ TC "Site and sample selection" \f C \l "2" }
A cluster sampling strategy was used for site selection. This strategy insures a
sufficiently large sample by selecting states that have large numbers of PIECP workers
within the confines of other criteria.7 A ranking according to the number of PIECP
workers was created. The selection process from the top ranking states included all
major U.S. geographic regions, rural and urban populations, gender representation to
ensure results can be determined based on gender, and each of the models of PIECP
(discussed previously in this report). Additionally, each state had PIECP certification
prior to 1996. This strategy excluded states with low numbers of industry workers. This
strategy resulted in a selection of five states.8
Sample selection included the following steps:
• A survey was administered to all PIECP certificate holders eligible for the
study (n=36), those with certification prior to 1996, to determine the
willingness and availability of data with an affirmative response.
• To ensure a sufficient sample size to detect the differences and to be as
nationally representative as possible, a list of relevant factors was
developed to ensure sufficient numbers of inmates that worked in PIECP
have been released, including number of workers, certification date,
region, PIECP model and rural versus urban characteristics.
7 A sixth state was selected to ensure a large enough sample size. However, after the study began the state was forced to drop out as a result of budget cuts in that state. A different state was not selected to replace them because there was already a sufficient sample size and other matching criteria were represented. 8 The five states are not identified in this study. Aside from providing anonymity to those who participated, it prevents comparison between states because this is a national program. Instead, comparisons are made across groupings of individuals. The authors recognize that state, regional, and institutional differences exist and, where appropriate, control variables can be used.
37
This document is a research report submitted to the U.S. Department of Justice. This report has not been published by the Department. Opinions or points of view expressed are those of the author(s)
and do not necessarily reflect the official position or policies of the U.S. Department of Justice.

• The states were ranked according to the number of workers employed
during a mid year between the years under examination. (This year is
withheld to prevent identification of the states involved in the study.
• States were selected beginning with the largest number of PIECP
workers. For example, state one was selected. It represented the eastern
and rural portion of the U.S. State two was selected from the next in the
list, representing west and urban. If state three was also western and
urban, it was skipped and the next state was selected.
Generalizability is limited by this research design. The first two options of sample
selection allow generalizability of the results to all PIECP workers and the respective
control groups. However, using a purposive cluster sample of states and a matched
sample for the test and control groups results in less than perfect confidence in the
generalizability to the national PIECP program. In the strictest definition of research
methods, we are able to generalize only to the five states involved and then only to the
participants in the sample. However, realistically, the generalizability falls somewhere
between these two opposites. This study informs the stakeholders of the impacts of
PIECP on a much larger scale than is currently known.
Models of industries. There are three models of operating a PIECP program, 1)
employer, 2) manpower, and 3) customer. The sample includes all three models. Each
model possesses its own set of risks and rewards. It has been suggested that the
customer model poses the least risk for the company and the greatest risk for the
departments of correction; whereas the manpower and employer model present equal
risk for both parties (Sexton, 1995). The various models pose different challenges in
38
This document is a research report submitted to the U.S. Department of Justice. This report has not been published by the Department. Opinions or points of view expressed are those of the author(s)
and do not necessarily reflect the official position or policies of the U.S. Department of Justice.

data collection for the future. For example, to examine the length of service, it would be
necessary to obtain the cooperation of the employer (i.e., private industry, correctional
institution).
The Sample. The resultant sample selection included all inmates in the five
states who worked in PIECP (n=2333) and were released between January 1996 and
June 2001, which permits at least 2 year follow-up and a maximum of 7.5 years. The
next step was to answer the question: To whom should we compare? There are two
options. First, a random sample of all inmates could be selected and compared to
PIECP participants. But, surely PIECP participants would do better because they
represent a specific type of inmate as discussed in the creaming section of this report.
The selection criteria to be eligible for PIECP separate these inmates from others. For
example, a typical PIECP participant would be disciplinary report free for six months
prior to obtaining a PIECP job and remain report free during employment.
The second option was to use matched samples from those eligible to work in
PIECP. Matching occurs in at least two ways (e.g., propensity scoring, variable by
variable). This study used a variable by variable matching, but retrospectively
calculated a sub-sample of propensity scoring, finding that the results were similar. The
selected control groups (e.g., TI, OTW) are comparable or matched to PIECP
participants. Therefore, the PIECP sample is representative of PIECP. The TI and
OTW control groups are NOT representative of all TIs or all OTWs. They are
representative of those who match inmates who were hired into the PIECP program.
What does this mean in practice? The study results do not address overall TI or
OTW success or failure. It only discusses success or failure for the type of inmate who
39
This document is a research report submitted to the U.S. Department of Justice. This report has not been published by the Department. Opinions or points of view expressed are those of the author(s)
and do not necessarily reflect the official position or policies of the U.S. Department of Justice.

is matched to PIECP workers. We cannot compare TI or OTW results to the general
population of all TI or all OTW results found in the literature. We do not know at this
time the percent of the general prison population that matches PIECP participants (See
Future research section later in this report).
Matching criteria{ TC "Matching criteria" \f C \l "2" }
The inmates were matched using six criteria. Of course, ideally stratification on
the PIECP eligibility criteria and the industry’s final selection criteria would be used to
develop the matches. However, the previously discussed variation in these criteria
makes it impossible to measure in a retrospective study where data were not gathered
on these measures. Exact matches were made on race: minority and white; gender:
male and female; crime type: person and all other; and category matches on age: 5
criteria categories; time served: 7 criteria categories; and number of disciplinary reports:
10 criteria categories).9
The term, criteria category, means that the categories are created and defined by
the criteria for that grouping. For example, inmates age 26 are matched with inmates 3
years older or 3 years younger than the PIECP subject, while inmates 34 are matched
with inmates 5 years older or younger. A 26-year-old subject is matched to someone
between the ages of 23 and 29, while a 34-year-old inmate is matched with inmates
between the ages of 29 and 39. A similar technique of grouping the individuals into
three or four categories and matching by category is frequently used. However, this may
9 Female category criteria have a slightly broader tolerance than male criteria because of the limited number of females in the system in the TI and OTW categories compared to the high percentage of females in PIECP. This disproportionate number of females working in PIECP to total females incarcerated compared males working in PIECP to the total males incarcerated is similar in all the states.
40
This document is a research report submitted to the U.S. Department of Justice. This report has not been published by the Department. Opinions or points of view expressed are those of the author(s)
and do not necessarily reflect the official position or policies of the U.S. Department of Justice.

result in a person 35 being matched to a person 27 when there is a person 36 that is a
closer match.
Following a variation of the propensity score process (Rosenbaum and Rubin,
1985 as cited in Saylor & Gaes 1997), a multinomial regression indicated that some
categories of age, time served, and disciplinary reports predicted the category
membership (PIECP, TI, OTW). These results were used to guide matching criteria
categories.
The matching process began by dividing the three groups of PIECP, TI, and
OTW by the strata into a grid of cells (eight stationary strata and an undetermined
number of criteria strata because each age, time served and discipline ranges by a plus
or minus score). Next, for each cell containing a PIECP participant, one TI and one
OTW participant was randomly selected from the inmates in that cell. (Any cell void of a
PIECP participant will not be represented in the study. Any cell void of a TI or OTW
resulted in a twin match instead of a triplet. This is particularly pronounced in states
where there exist more PIECP industries than TI. As a result of these twin sets and
triplets, the n's vary across the report). This process was used in each of the states.
The matching results are as follows and are displayed in Table 1: Matching
characteristics. The matching characteristics were analyzed based on the twin sets.
The matching process was successful for most variables; age at intake, age at release,
crime type, gender, and race. However, disciplinary reports and time incarcerated were
statistically different between PIECP and TI and PIECP and OTW. Further analysis
indicates that the PIECP inmates had fewer releasees who had 30 or more disciplinary
actions during their incarceration than TI or OTW, skewing the data. In other words,
41
This document is a research report submitted to the U.S. Department of Justice. This report has not been published by the Department. Opinions or points of view expressed are those of the author(s)
and do not necessarily reflect the official position or policies of the U.S. Department of Justice.
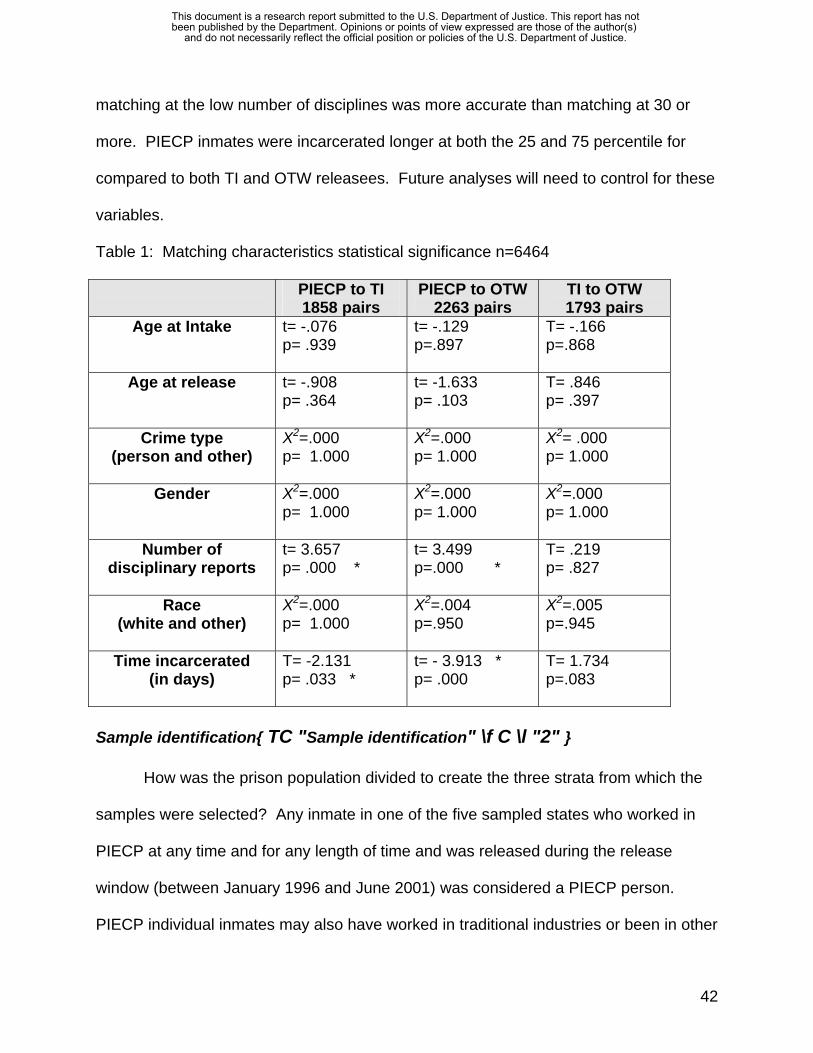
matching at the low number of disciplines was more accurate than matching at 30 or
more. PIECP inmates were incarcerated longer at both the 25 and 75 percentile for
compared to both TI and OTW releasees. Future analyses will need to control for these
variables.
Table 1: Matching characteristics statistical significance n=6464 PIECP to TI
1858 pairs PIECP to OTW
2263 pairs TI to OTW 1793 pairs
Age at Intake t= -.076 p= .939
t= -.129 p=.897
T= -.166 p=.868
Age at release t= -.908 p= .364
t= -1.633 p= .103
T= .846 p= .397
Crime type (person and other)
X2=.000 p= 1.000
X2=.000 p= 1.000
X2= .000 p= 1.000
Gender X2=.000 p= 1.000
X2=.000 p= 1.000
X2=.000 p= 1.000
Number of disciplinary reports
t= 3.657 p= .000 *
t= 3.499 p=.000 *
T= .219 p= .827
Race (white and other)
X2=.000 p= 1.000
X2=.004 p=.950
X2=.005 p=.945
Time incarcerated (in days)
T= -2.131 p= .033 *
t= - 3.913 * p= .000
T= 1.734 p=.083
Sample identification{ TC "Sample identification" \f C \l "2" }
How was the prison population divided to create the three strata from which the
samples were selected? Any inmate in one of the five sampled states who worked in
PIECP at any time and for any length of time and was released during the release
window (between January 1996 and June 2001) was considered a PIECP person.
PIECP individual inmates may also have worked in traditional industries or been in other
42
This document is a research report submitted to the U.S. Department of Justice. This report has not been published by the Department. Opinions or points of view expressed are those of the author(s)
and do not necessarily reflect the official position or policies of the U.S. Department of Justice.

programming, but if he or she worked in PIECP even one day (which, based on review
of salaries was not the case) during the release window related incarceration, he or she
was considered a PIECP participant for this research.
One hypothesis is that the longer an inmate remains in a job, the more likely one
is to develop positive employment skills. Unfortunately, the records determining the
start date of employment were not available at the facilities and employer maintained
data were unavailable. Inmates who worked in split wage facilities, a situation where
the PIECP worker produces goods for a PIECP project part of the time and the same
goods for traditional industries the remainder of the time were considered PIECP
participants.
The division between TI workers and inmates in other than work activities is also
complicated. Work defined as traditional industries varied from state to state, such that
a traditional industry in one sampled state could be considered an activity other than
work in another state. TI workers are often, but not always, paid for their labors, but at a
very low rate, ranging from $.25 to $1.25 an hour. In addition, TI may include service
industries. (See limitations for further discussion.)
Data Collection Procedures{ TC "Data Collection Procedures" \f C \l "2" }
Once selected, the prison population of a selected state was parceled among
four possible groups, (1) those inmates with the defined matching characteristics who
participated in PIECP at least one day and were released between January of 1996 and
June of 2001, (2) those also with the defined matching characteristics not defined as
PIECP participants but defined as TI participants during the same period, (3) inmates
during the defined time period and with the appropriate matching characteristics who
43
This document is a research report submitted to the U.S. Department of Justice. This report has not been published by the Department. Opinions or points of view expressed are those of the author(s)
and do not necessarily reflect the official position or policies of the U.S. Department of Justice.

were neither PIECP nor TI and not excluded from consideration because of
administrative segregation, illness or incapacity, and (4) all other inmates not meeting
the matching characteristics.
First, research staff requested PIECP automated records and established the
PIECP participant sample. All PIECP workers released during the release window were
identified. This was a challenge because most states do not maintain records in an
automated format of who is employed and when they began or ended that employment.
For example, in one state, the inmate automated records indicated the inmate was
working in a particular program, but the note was in a text field that was not searchable.
Therefore, the PIECP participants were identified through the accounting office where
deductions were collected from their checks. Then the records could be manually
verified by examining the text field.
After setting the PIECP sample, matching TI and OTW samples were selected in
each state on six matching criteria. All TI workers were identified. Additionally, eligible
OTW unemployed individuals were identified. Individuals in administrative segregation
or so ill that they were unable to work were eliminated from the potential matches.
Next, 100 matched triplets from each state (n=1500) were randomly selected.
The purpose of this sub-sample of randomly selected files was two-fold. First, some
variables were not available in an automated format; differences varied by state.
Additionally, corrections data are frequently incomplete. Therefore, a review of the files
provided a more complete list of variables and more complete data.
The research team requested from the five sample states a total of 1500 hard
copy files. This task was handled differently depending on the policy of the various
44
This document is a research report submitted to the U.S. Department of Justice. This report has not been published by the Department. Opinions or points of view expressed are those of the author(s)
and do not necessarily reflect the official position or policies of the U.S. Department of Justice.

locations. Some records are housed in the institution where the inmate resides. Others
are housed in a central repository. When the inmate is released, sometimes it is
forwarded to a central location and other times it is not.
These data collection efforts met with some challenges, but were ultimately
successful. The challenges are listed here with the intent of documenting them for
future researchers' benefit.
1. In some states, the first round of data did not have the admission and release
dates.
2. In some states, the first round of data did not have admission and release dates
appropriate for this study. For example, an inmate who is released and then
reincarcerated on a technical violation may continue with an unchanged
admission date of incarceration. This means that he or she may have been in a
released status for an extended period of time, reincarcerated under the same
automated record and the released time does not appear. It appears that the
inmate was incarcerated longer than actually occurred and admissions and
release dates misstated from a research perspective.
3. Some states could not readily identify who was participating in PIECP or TI from
their automated records, necessitating manual or alternative identification
methods.
4. The number of disciplinary reports listed in the automated files was not accurate.
This was important because it was one of the most important matching criteria
and because disciplinary reports are touted to be a criterion for PIECP
participation selection.
45
This document is a research report submitted to the U.S. Department of Justice. This report has not been published by the Department. Opinions or points of view expressed are those of the author(s)
and do not necessarily reflect the official position or policies of the U.S. Department of Justice.

Sample Characteristics: Matching variables{ TC "Sample Characteristics:
Matching variables" \f C \l "2" }
Table 2 presents a summary of the matching characteristics of the entire sample.
This profile suggests that the majority of the sample is male, but a sufficient number of
females are included for meaningful analysis. The sample is almost evenly split
between white and minority groups. The majority of the sample entered prison for this
incarceration between 18 and 40 and are released between 26 and 50, spending 1 to 5
years in prison, with zero or one disciplinary action.
Table 2: Sample characteristics (n=6464) N percent Mode Median Mean
Age at Intake
17 & under 18-25 26-30 31-35 36-40 41-50 51 & older
381454145614031160 788 165
0.6%22.5%22.5%21.7%17.9%12.2%2.6%
28 years 31 years 32 years
Age at release
18-25 26-30 31-35 36-40 41-50 51 & older
5451097137515531525369
8.4%17.0%21.3%24.0%23.6%5.7%
37 years 36 years 37 years
Crime type
Person Property Drug Other
304214001882140
47.1%21.7%29.1%2.2%
Person crime
- - - - - -
Gender Male Female
52021262
80.5%19.5%
Male - - - - - -
Number of disciplinary
reports
0 1 2 3 4 5 6 – 10 11 – 20 21 – 30
25241412564353285202549334126
39.0%21.8%8.7%5.5%4.4%3.1%8.5%5.2%1.9%
0 reports 1 report 3 reports
46
This document is a research report submitted to the U.S. Department of Justice. This report has not been published by the Department. Opinions or points of view expressed are those of the author(s)
and do not necessarily reflect the official position or policies of the U.S. Department of Justice.

31 or more 115 1.8%
Race
White Black Hispanic Other
37382048528149
57.8%31.7%8.2%2.3%
White - - - - - -
Time incarcerated
(in days)
0 – 365 days 366 – 730 days 731 – 1095 days 1096 – 1460 days 1461 – 1825 days 1826 – 2190 days 2191 – 2555 days 2556 or more days
4911196880856854670476
1041
7.6%18.5%13.6%13.2%13.2%10.4%7.4%
16.1%
405 days
1386 days
(3+ yrs)
1609 days
(4+ yrs)
Sample Characteristics: Industry groupings employed by the sample{ TC
"Sample Characteristics: Industry groupings employed by the sample" \f C \l
"2" }
During the available pre-, during-, and post-incarceration, the types of
occupations held by the sample include a wide variety of positions (See Table 3:
Industry groupings of sample). Many sample members held multiple jobs (n=30,278).
Based on the North American Industry Classification System, the modal industry
category is professional, scientific and technical services (n=5822, 19.2% of all jobs
held). This includes occupations such as janitorial services, waste management and
telemarketing. The manufacturing category includes a variety of manufacturing
occupations such as textile, chemical and food manufacturing (n=4892, 16.2%). The
miscellaneous category includes occupations such as automotive repair and private
household services (n= 2003, 6.6%)
47
This document is a research report submitted to the U.S. Department of Justice. This report has not been published by the Department. Opinions or points of view expressed are those of the author(s)
and do not necessarily reflect the official position or policies of the U.S. Department of Justice.
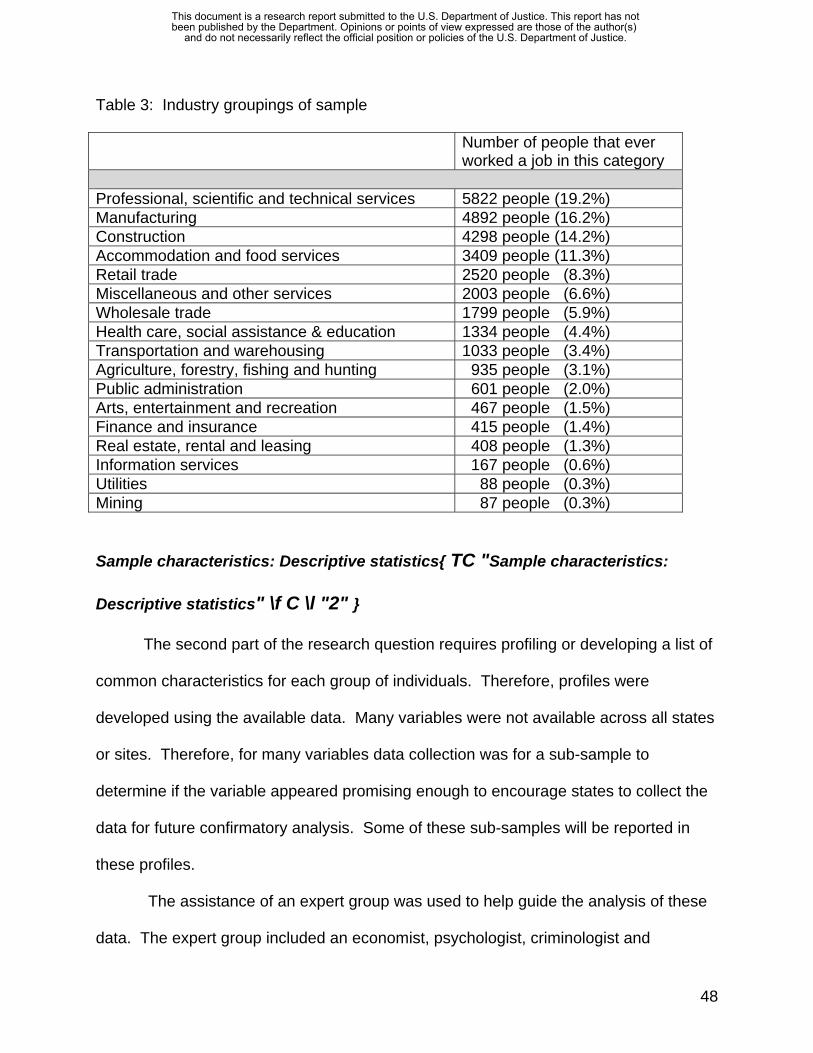
Table 3: Industry groupings of sample Number of people that ever
worked a job in this category Professional, scientific and technical services 5822 people (19.2%) Manufacturing 4892 people (16.2%) Construction 4298 people (14.2%) Accommodation and food services 3409 people (11.3%) Retail trade 2520 people (8.3%) Miscellaneous and other services 2003 people (6.6%) Wholesale trade 1799 people (5.9%) Health care, social assistance & education 1334 people (4.4%) Transportation and warehousing 1033 people (3.4%) Agriculture, forestry, fishing and hunting 935 people (3.1%) Public administration 601 people (2.0%) Arts, entertainment and recreation 467 people (1.5%) Finance and insurance 415 people (1.4%) Real estate, rental and leasing 408 people (1.3%) Information services 167 people (0.6%) Utilities 88 people (0.3%) Mining 87 people (0.3%)
Sample characteristics: Descriptive statistics{ TC "Sample characteristics:
Descriptive statistics" \f C \l "2" }
The second part of the research question requires profiling or developing a list of
common characteristics for each group of individuals. Therefore, profiles were
developed using the available data. Many variables were not available across all states
or sites. Therefore, for many variables data collection was for a sub-sample to
determine if the variable appeared promising enough to encourage states to collect the
data for future confirmatory analysis. Some of these sub-samples will be reported in
these profiles.
The assistance of an expert group was used to help guide the analysis of these
data. The expert group included an economist, psychologist, criminologist and
48
This document is a research report submitted to the U.S. Department of Justice. This report has not been published by the Department. Opinions or points of view expressed are those of the author(s)
and do not necessarily reflect the official position or policies of the U.S. Department of Justice.

specialists in re-entry, labor, public policy, and prison industries. Based on the literature
and their expertise, it was decided to develop the profiles based on the following
categories; 1) prior work experience, 2) prior criminal history, 3) family differences, and
4) individual differences (See Table 4).
Table 4: Sample profile PIECP TI OTW % n* % n % n Prior work experience Employed before the
current incarceration (n=6464 people)
44.7% 1044 46.3% 862 44.8% 1015
Total pre incarceration wages are less than $20234
(n=6464 people)
87.1% 2032
88.1% 1642 90.4% 2051
Prior criminal history Arrested as a juvenile
(n= 6372 people) 12.2% 280 14.5% 268 13.1% 294
6 or fewer prior arrests (n=6372 people)
75.0% 1718 67.3% 1241 70.5% 1577
4 or fewer prior convictions
(n=6372 people)
71.9% 1648 63.8% 1177 64.2% 1437
1 or fewer prior incarcerations
(n=6372 people)
79.8% 1830 67.7% 1248 72.0% 1613
Family differences Marital status is single
(n=6464 people) 24.0% 560 29.0% 541 33.6% 762
Emergency contact is parents
(n=4924 people)
44.2% 794 41.5% 573 41.9% 734
Individual differences Birth state is the same as
incarceration state (n= 6464 people)
45.3% 1057 53.3% 993 56.0% 1271
Release type is a conditional release
(n=5082 people)
83.0% 1445 80.3% 1301 82.2% 1416
* The n value is different for some variables as a result of missing values and missing variables across states.
49
This document is a research report submitted to the U.S. Department of Justice. This report has not been published by the Department. Opinions or points of view expressed are those of the author(s)
and do not necessarily reflect the official position or policies of the U.S. Department of Justice.

Analysis technique{ TC "Analysis technique" \f C \l "2" }
Both of the research questions are most appropriately answered using similar
analysis techniques. The key to both questions is to accurately measure the follow-up
time period (See Figure 2: Visual model of analysis). Employment effects will be
measured by time to obtaining employment (i.e., reported earnings in a given quarter)
and the time to loss of employment (i.e., no earnings reported for a quarter). Recidivism
will be measured by the time it takes from release to first recidivism (i.e., arrest,
conviction, and incarceration). Therefore, the analysis techniques are discussed in
detail under the first research question and only the changes in terminology are
mentioned under the second research question.
Figure 2: Visual model of analysis
Time to success Time to failure - obtaining employment loss of employment
Release from Obtain employment Lost employment Recidivism prison
Time to failure – recidivism
Traditionally recidivism research is analyzed with a single shot or cross-sectional
analysis (See Figure 3). In the single shot or cross sectional analysis a follow-up is
identified at six months, one year, or three years (Maltz, 1984). For example, as of
February of 2003, 88.3 percent had jobs previously but only 21.9 percent were working
50
This document is a research report submitted to the U.S. Department of Justice. This report has not been published by the Department. Opinions or points of view expressed are those of the author(s)
and do not necessarily reflect the official position or policies of the U.S. Department of Justice.

on that date. Therefore, it appears that only 21.9 percent were successful. It ignores
the fact that 88.3 percent had jobs but had lost them for unknown reasons. The release
window for these data is 5.5 years long. Therefore, individuals have the possibility of
being followed-up from release until early 2003 or a range of approximately 2 to 7.5
years.
Figure 3: Single shot or cross sectional analysis
1/96 2/01 2/03
Single shot evaluation:
•X% have recidivated
•Y% had jobs, but Z% are working
•Everything is on one time line
Release window
Follow-up window
A more appropriate analysis technique to answer the research questions on
recidivism success is survival analysis. Survival analysis is used to compare groups
who receive different treatment and where some of each group do not demonstrate a
reoccurrence of the original problem while others do (Illinois Criminal Justice
Information Authority, 1986b; Statistical Package for Social Sciences, 1999; Stollmack &
Harris, 1974). For example, inmates are provided the opportunity to learn hard and soft
employment skills (e.g., TI or PIECP) or not (e.g., OTW) while incarcerated. Some
recidivate, while others do not. Some obtain post release employment, while others do
not. Survival analysis measures failure rates between groups receiving different
treatments by measuring the time between release and employment or recidivism and
51
This document is a research report submitted to the U.S. Department of Justice. This report has not been published by the Department. Opinions or points of view expressed are those of the author(s)
and do not necessarily reflect the official position or policies of the U.S. Department of Justice.

comparing the groups. Survival analysis is advantageous over fixed period analysis
because it provides details (proportion) about failure at any given point of analysis
compared to a proportion at the end of a given point. The follow-up period for the
subjects can vary without affecting the findings. Survival analysis was borrowed from
medical research and has been used in recidivism research since the mid 1970’s
(Illinois Criminal Justice Information Authority, 1986a, 1986b; Stollmack & Harris, 1974)
(See Figure 4: KM survival analysis example).
Figure 4: KM survival analysis example
Released Employed Job Loss Recidivism
Case 1
Notice that each case in survival analysis is tracked from the time of release until
the event occurs. In Figure 4, the first case is released in January of 1999, whereas the
second case is released in February of 1999 and the third case is released in February
of 1999. Notice that they obtained employment during different months also and lost
their jobs in different months. In survival analysis, it is not important the month of the
year that the event occurs or does not occur. Each case begins on the date of release
2/99 4/99 2/00 4/00
2/99 4/99 2/00 4/00
1/99 3/99 1/00 3/00
2 Quarters 2 Quarters 2 Quarters
Case 2
Case 3
No recidivism
52
This document is a research report submitted to the U.S. Department of Justice. This report has not been published by the Department. Opinions or points of view expressed are those of the author(s)
and do not necessarily reflect the official position or policies of the U.S. Department of Justice.

and is followed in each unit of follow-up time period. In this way, we can calculate the
number of quarters an individual takes from release to any event for all releasees,
regardless of the date of release and compare the number who have experienced the
event to the total number of those who have not yet experienced the event. In addition
survival analysis takes into account those individuals who never experienced the event
(i.e. censored). Once an individual experiences the event, he or she is dropped from
further analysis.
Key findings and discussion{ TC "Key findings and discussion" \f C \l "1" }
The primary findings of this research are that state prison inmates who worked in
open-market jobs in the PIECP were found to be significantly more successful in post-
release employment and in reducing recidivism than either inmates working in TI or
involved in OTW. Results for TI and OTW, while significantly different than PIECP
inmates by most measures, did not significantly differ from each other. However, TI did
differ significantly from OTW in obtaining employment more quickly upon release.
Throughout the analysis TI and OTW releasees had very similar results. On the
contrary, the findings for the PIECP releasees stood alone. Based on quarterly survival
rates the slope of the survival curve indicated that the PIECP releasees were employed
significantly more quickly after release from prison than either TI or OTW and remained
employed significantly longer. In addition, the slope of the survival curve for recidivism
indicated that the PIECP participants recidivated significantly more slowly and less
frequently as measured by any of the three measures; arrest, conviction or
incarceration. The details of these findings follow.
53
This document is a research report submitted to the U.S. Department of Justice. This report has not been published by the Department. Opinions or points of view expressed are those of the author(s)
and do not necessarily reflect the official position or policies of the U.S. Department of Justice.

Research Question 1: Does PIECP participation increase post release employment
as compared to TI work and OTW?{ TC "Research Question 1: Does PIECP
participation increase post release employment as compared to TI work and
OTW?" \f C \l "2" }
This research question is answered through a variety of measures. Based on a
panel of experts' and states' guidance, measures for success include the following
criteria: 1) proportion of time employed during the follow-up period (e.g., the time from
release from prison until the end of data collection)10, 2) time to first employment after
release, 3) duration of first employment, 4) wage rate during the follow-up period, and 5)
occupations within prisons versus free world occupations. Details of each analysis are
described in the following section.
1) Proportion of time post release the releasee worked{ TC "1) Proportion of time post release the releasee worked" \f C \l "2" } The general descriptive data relative to the post-release employment measures
are presented in Table 5: Post-release employment descriptive measures.
Approximately 26 percent (n=1695) of the total sample (n=6464) had no reported
earnings during the follow-up period (e.g., the time from release from prison until the
end of data collection). The reasons for no reported earnings are unknown, but could
include failure to report or record earnings, work in industries in which wages may
traditionally not be reported (i.e., agriculture or illegal employment), or employment in
other states. And, of course, the data include those who did not work and had no
earnings. There is no way of knowing what proportion of this 26 percent is explained by
10 Ideally, this variable would first calculate the available "street time" and then determine the proportion of available time. However, the data were not available at this time to calculate the amount of time each individual may have been unavailable for work (i.e., incarcerated).
54
This document is a research report submitted to the U.S. Department of Justice. This report has not been published by the Department. Opinions or points of view expressed are those of the author(s)
and do not necessarily reflect the official position or policies of the U.S. Department of Justice.

each of these without an individual follow-up. The range of the follow-up period for this
measure is a minimum of 6 calendar quarters to a maximum of 31 quarters for the
sample. Overall, the average follow-up period for the entire sample is 16.1 quarters
(standard deviation 6.4 quarters). Those who had no employment during the follow-up
period had an average of 15.7 quarters (standard deviation 6.4 quarters), while those
with employment during the follow-up period had an average of 16.3 quarters (standard
deviation 6.4 quarters, which is statistically significantly different (t=3.0, p=.003). This
means the group who did not have reported earnings post release were released later
in the release window and had less follow-up time. If additional follow-up were
conducted at a later time, it is possible this difference would disappear. It is also
possible that more recent releasees are less likely to obtain employment. This should
be examined in future research. Also, notice that more than half (58.0%) of those who
did not have reported earnings post release had no reported earnings at any time during
the study timeframe.
Table 5: Post release employment descriptive measures (n=6464) Characteristic n or mean % or s.d. No reported earnings pre-, during-, post- incarceration
812 12.6%
No reported earnings during follow-up 1695 21.9% Range of follow-up period 6-31 quarters Average follow-up period 16.1 quarters (6.4) Average follow-up period - with reported earnings (n=5064)
16.3 quarters (6.4)
Average follow-up period - no reported earnings (n=1400)
15.7 quarters (6.4)
Average proportion of time post release the releasee worked
.5 (. 3)
55
This document is a research report submitted to the U.S. Department of Justice. This report has not been published by the Department. Opinions or points of view expressed are those of the author(s)
and do not necessarily reflect the official position or policies of the U.S. Department of Justice.

On average, the releasees worked 50 percent of the total time available post
release. Holzer, Raphael and Stoll (2003) found that ex-offenders face significant
barriers in the labor market, such as lack of skills, limited work experience, substance
abuse issues, and other health-related problems. Additionally, many states limit
employment for ex-offenders in certain areas: professional fields, public employment
and in health care fields (Hirsch et al., 2001; Western, Kling, & Weiman, 2001).
However, the lack of ability for many former prisoners to maintain employment for
significant lengths of time may not be a unique attribute to that population. Hard-to-
place welfare recipients share many characteristics with prisoners seeking re-entry.11
One researcher noted that hard-to-place welfare recipients were characterized by low
basic skills, substance abuse issues, domestic violence, chronic health problems and
developmental delay concerns (Kramer, 1998). Interestingly, Kramer (1998) also
includes criminal history as one of the conditions that defines a welfare recipient as
hard-to-place.
Another reason for the lack of labor market engagement for ex-offenders is that
ex-offenders spatially concentrate in inner-cities, generally poor employment markets
with stiff competition and a ready alternative labor supply (Holzer & Stoll, 2002; Western
et al., 2001). Baltimore “accounts for more than half of the prison population in
Maryland” (Western, Kling & Weiman, 2001, pg. 6). Similarly, Baltimore accounts for
more than half the TANF recipients in that state as well. In the end, welfare recipients
without criminal histories compete with ex-offenders seeking re-entry for the limited
supply of low-skill, low wage employment in the immediate area.
11 Welfare is defined as recipient of Temporary Assistance to Needy Families (TANF)—the main cash assistance program.
56
This document is a research report submitted to the U.S. Department of Justice. This report has not been published by the Department. Opinions or points of view expressed are those of the author(s)
and do not necessarily reflect the official position or policies of the U.S. Department of Justice.

2) Length of time to employment{ TC "2) Length of time to employment" \f C \l
"2" }
The second measure of success for releasees was the amount of time that
lapsed between release and employment. This included a comparison of PIECP, TI
and OTW to each other to determine who obtained employment faster. Based on the
survival analysis, PIECP participants obtained post release employment significantly
faster than either TI or OTW (See Tables 6-8 and Figure 5). The survival rate is equal
to the proportion of those who begin the quarter to those who remain at the end of the
quarter without experiencing employment. The steepest slope indicates that
comparably more releasees than other groups have found employment (See Figure 5 –
Notice that the PIECP line drops more quickly than the other two lines). Approximately
24 and 25 percent of the TI and OTW releasees did not have reported earnings,
whereas less than 17 percent of the PIECP's did not have earnings over the course of
follow-up (See Table 6: Case processing summary – release to employment). (In
survival analysis, the total N is the sample size, the N of events is the portion of the
sample who experienced the event – employment, and the censored cases are the
number of cases who did not experience the event during the follow-up period).
Table 6: Case processing summary - release to employment{ TC "Table 6: Case processing summary - release to employment" \f D \l "1" }
Censored Prefix Total N N of Events N Percent OTW 2268 1705 563 24.8%TI 1863 1415 448 24.0%PIE 2333 1944 389 16.7%Overall 6464 5064 1400 21.7%
57
This document is a research report submitted to the U.S. Department of Justice. This report has not been published by the Department. Opinions or points of view expressed are those of the author(s)
and do not necessarily reflect the official position or policies of the U.S. Department of Justice.

Additionally, there is a significant difference12 between the three groups (See Table 7:
Overall comparisons – release to employment).
Table 7: Overall comparisons - release to employment{ TC "Table 7: Overall comparisons - release to employment" \f D \l "1" } Chi-Square df Sig. Log Rank (Mantel-Cox) 102.720 2 .000Breslow (Generalized Wilcoxon) 134.455 2 .000
Tarone-Ware 124.300 2 .000 Further analysis determined that this difference is between PIECP and TI, and PIECP
and OTW, and there is a difference between TI and OTW as well. (See Table 8:
Comparison of TI & OTW only).
Table 8: Comparison of TI & OTW only{ TC "Table 8: Comparison of TI & OTW only" \f D \l "1" } Chi-Square df Sig. Log Rank (Mantel-Cox) 5.884 1 .015Breslow (Generalized Wilcoxon) 6.745 1 .009
Tarone-Ware 6.560 1 .010
Finally, examining the survival curve provides insight into several issues relative
to the time it takes for a releasee to obtain employment (See Figure 5: Survival function
- Release to employment).
12 Three tests of equality across the groups are available for KM survival analysis. "Log Rank. A test for comparing the equality of survival distributions. All time points are weighted equally in this test. Breslow. A test for comparing the equality of survival distributions. Time points are weighted by the number of cases at risk at each time point. Tarone-Ware. A test for comparing the equality of survival distributions. Time points are weighted by the square root of the number of cases at risk at each time point." (Statistical Package for Social Sciences, 2005)
58
This document is a research report submitted to the U.S. Department of Justice. This report has not been published by the Department. Opinions or points of view expressed are those of the author(s)
and do not necessarily reflect the official position or policies of the U.S. Department of Justice.
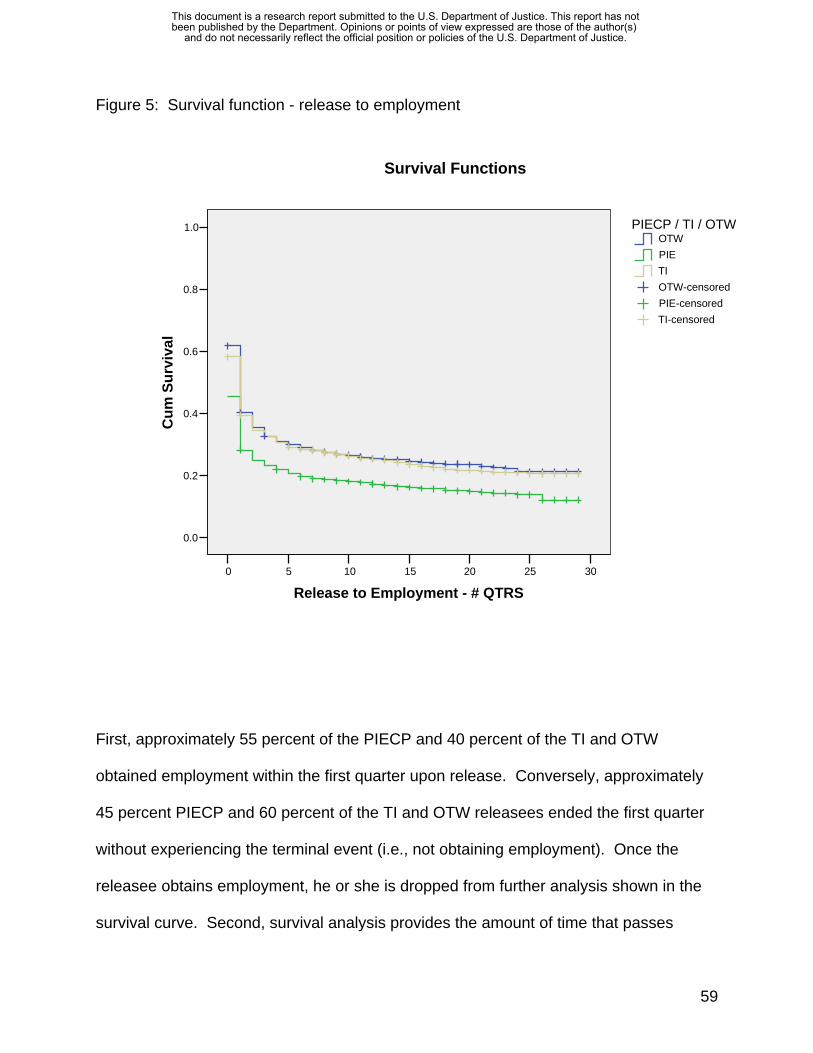
Figure 5: Survival function - release to employment
302520151050
Release to Employment - # QTRS
1.0
0.8
0.6
0.4
0.2
0.0
Cum
Sur
viva
l
TI-censoredPIE-censoredOTW-censoredTIPIEOTW
PIECP / TI / OTW
Survival Functions
First, approximately 55 percent of the PIECP and 40 percent of the TI and OTW
obtained employment within the first quarter upon release. Conversely, approximately
45 percent PIECP and 60 percent of the TI and OTW releasees ended the first quarter
without experiencing the terminal event (i.e., not obtaining employment). Once the
releasee obtains employment, he or she is dropped from further analysis shown in the
survival curve. Second, survival analysis provides the amount of time that passes
59
This document is a research report submitted to the U.S. Department of Justice. This report has not been published by the Department. Opinions or points of view expressed are those of the author(s)
and do not necessarily reflect the official position or policies of the U.S. Department of Justice.

before the curve associated with change in status becomes flattened. By the end of the
fifth quarter approximately 20 percent PIECP and 30 percent TI and OTW releasees
have not become employed. An additional five percentage point decline occurs over
the next six years indicating that few releasees obtain employment after the first five
quarters. This would suggest that employment assistance should be focused during the
first year after release to assist those who obtain work more readily and focused
differently for the 20 to 30 percent who do not obtain employment for the remaining
follow-up period. Finally, this analysis shows which group obtained employment faster.
TI and OTW survival curves, while they appear similar in this graph, are significantly
different, indicating that it took OTW releasees longer to obtain employment than TI
releasees. The PIECP line drops faster and remains below the other two, which shows
that releasees participating in PIECP obtained employment faster than those who do
not have the PIECP experience.
3) Duration of employment{ TC "3) Duration of employment" \f C \l "2" }
The third measure of success relative to post-release employment is the length
of the time between first employment and the first full quarter without reported earnings
or employment (See Figure 2: Visual model of analysis). A sequence of jobs or
multiple jobs in one quarter (i.e., changing employment, working two jobs), is not
counted as a loss of employment. Unemployment within a quarter remains counted as
employment so long as there are reported earning within the quarter, and the releasee
may be unemployed for large parts of the quarter. Hypothetically, a person only needs
to work some part of one day in a quarter to be considered employed for that quarter.
60
This document is a research report submitted to the U.S. Department of Justice. This report has not been published by the Department. Opinions or points of view expressed are those of the author(s)
and do not necessarily reflect the official position or policies of the U.S. Department of Justice.
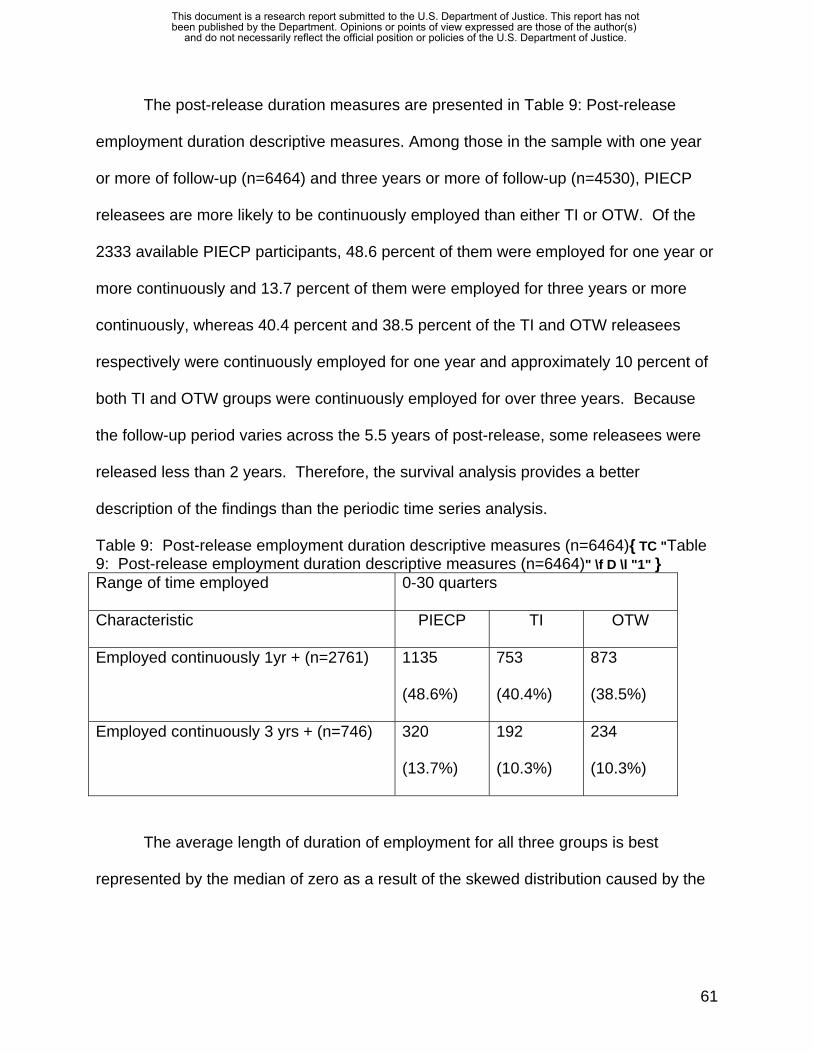
The post-release duration measures are presented in Table 9: Post-release
employment duration descriptive measures. Among those in the sample with one year
or more of follow-up (n=6464) and three years or more of follow-up (n=4530), PIECP
releasees are more likely to be continuously employed than either TI or OTW. Of the
2333 available PIECP participants, 48.6 percent of them were employed for one year or
more continuously and 13.7 percent of them were employed for three years or more
continuously, whereas 40.4 percent and 38.5 percent of the TI and OTW releasees
respectively were continuously employed for one year and approximately 10 percent of
both TI and OTW groups were continuously employed for over three years. Because
the follow-up period varies across the 5.5 years of post-release, some releasees were
released less than 2 years. Therefore, the survival analysis provides a better
description of the findings than the periodic time series analysis.
Table 9: Post-release employment duration descriptive measures (n=6464){ TC "Table 9: Post-release employment duration descriptive measures (n=6464)" \f D \l "1" } Range of time employed 0-30 quarters
Characteristic PIECP TI OTW
Employed continuously 1yr + (n=2761) 1135
(48.6%)
753
(40.4%)
873
(38.5%)
Employed continuously 3 yrs + (n=746) 320
(13.7%)
192
(10.3%)
234
(10.3%)
The average length of duration of employment for all three groups is best
represented by the median of zero as a result of the skewed distribution caused by the
61
This document is a research report submitted to the U.S. Department of Justice. This report has not been published by the Department. Opinions or points of view expressed are those of the author(s)
and do not necessarily reflect the official position or policies of the U.S. Department of Justice.

large number of releasees who do not obtain employment during the follow-up period or
are employed for only one or two quarters (See Figure 6: Employment duration).
Figure 6: Employment duration
3029282726252423222120191817161514131211109876543210
Employed to Job Loss - # QTRS
1,400
1,200
1,000
800
600
400
200
0
Coun
t
Measuring employment duration included a comparison of PIECP, TI and OTW
to each other to determine who retained employment longer. Based on the survival
analysis, PIECP participants retained employment significantly longer. The survival rate
is equal to the proportion of those who begin the quarter employed and remain to the
end of the quarter employed. The least steep slope is best because it indicates that
comparably more releasees have retained employment. Between 3.8 and 5.3 percent
of the releasees remained employed at the end of the follow-up period (See Table 10:
Case processing summary – employment duration). In other words, the releasees did
not lose employment during the follow-up period, so they were censored from the
analysis during the quarter in which the individual's follow-up period ended.
62
This document is a research report submitted to the U.S. Department of Justice. This report has not been published by the Department. Opinions or points of view expressed are those of the author(s)
and do not necessarily reflect the official position or policies of the U.S. Department of Justice.

Table 10: Case processing summary - employment duration{ TC "Table 10: Case processing summary - employment duration" \f D \l "1" }
Censored prefix Total N N of Events N Percent OTW 2268 2148 120 5.3%TI 1863 1792 71 3.8%PIE 2333 2230 103 4.4%Overall 6464 6170 294 4.5%
Additionally, there is a significant difference between the three groups (See Table 12:
Overall comparisons – employment duration).
Table 11: Overall comparisons - employment duration{ TC "Table 11: Overall comparisons - employment duration" \f D \l "1" } Chi-Square df Sig. Log Rank (Mantel-Cox) 45.845 2 .000Breslow (Generalized Wilcoxon) 67.983 2 .000
Tarone-Ware 62.955 2 .000Test of equality of survival distributions for the different levels of PIECP / TI / OTW. Further analysis demonstrates the significant difference is between PIECP and TI, and
between PIECP and OTW, but not between TI and OTW (See Table 12: Comparison of
TI & OTW only – employment duration).
Table 12: Comparison of TI & OTW only - employment duration{ TC "Table 12: Comparison of TI & OTW only - employment duration" \f D \l "1" } Chi-Square df Sig. Log Rank (Mantel-Cox) .728 1 .394Breslow (Generalized Wilcoxon) 3.454 1 .063
Tarone-Ware 2.187 1 .139Test of equality of survival distributions for the different levels of PIECP / TI / OTW. Finally, examining the survival curve provides insight into employment duration (See
Figure 7: Survival function - employment duration).
63
This document is a research report submitted to the U.S. Department of Justice. This report has not been published by the Department. Opinions or points of view expressed are those of the author(s)
and do not necessarily reflect the official position or policies of the U.S. Department of Justice.

Figure 7: Survival function - employment duration
302520151050
Employed to Job Loss - # QTRS
1.0
0.8
0.6
0.4
0.2
0.0
Cum
Sur
viva
l
TI-censoredPIE-censoredOTW-censoredTIPIEOTW
PIECP / TI / OTW
Survival Functions
First, PIECP releasees retain employment longer than TI or OTW releasees for the first
five years of follow-up (See Figure 7: Survival function – employment duration, where
the lines merge at approximately 20 quarters). TI and OTW releasees exhibit little
difference. Nevertheless, over 50 percent of all three groups had a full quarter of
unemployment by the end of the third quarter after release.
64
This document is a research report submitted to the U.S. Department of Justice. This report has not been published by the Department. Opinions or points of view expressed are those of the author(s)
and do not necessarily reflect the official position or policies of the U.S. Department of Justice.

Even if one gets a job, it does not mean that one will keep that job. Holzer and
Wissoker’s (2001) study of job retention among welfare recipients found that in 8
months, 25 percent of newly employed welfare recipients had left employment.
Fourteen percent quit voluntarily; eight percent were discharged and three percent were
laid off (Holzer & Wissoker, 2001). In Holzer and Wissoker’s (2001) study, job loss was
less related to cognitive or basic skills and more related to absenteeism, attitudes
towards work in general and relationships with other workers/supervisors.
While certain skills are needed to find employment (i.e., cognitive and job search
skills) very different skill sets are needed for job retention (Loprest, 2002). Calling these
the “soft skills”, job retention skills focus on peer mentoring, post-employment
counseling, intervention with employers, and general job support (Holzer & Wissoker,
2001). Additionally, the newly employed also need support with such services as
transportation and child care (Holzer & Wissoker, 2001).
4) Wage rate{ TC "4) Wage rate" \f C \l "2" } Wages earned by the sample were examined. Approximately 55% of the
releasees earned at an hourly rate less than the Federal minimum wage during the post
release follow-up period based on a calculation that assumes full time work during each
quarter in which wages are reported. It is possible that the sample were either under-
employed (i.e., working part time or working intermittent) or under-paid.
PIECP releasees earn significantly more than OTW releasees and are employed
significantly more quarters post-release than TI and OTW. There is a significant
difference between PIECP and OTW based on the t test on the average amount of
wages earned during follow-up (See Table 13: Wages earned post-release). PIECP
65
This document is a research report submitted to the U.S. Department of Justice. This report has not been published by the Department. Opinions or points of view expressed are those of the author(s)
and do not necessarily reflect the official position or policies of the U.S. Department of Justice.
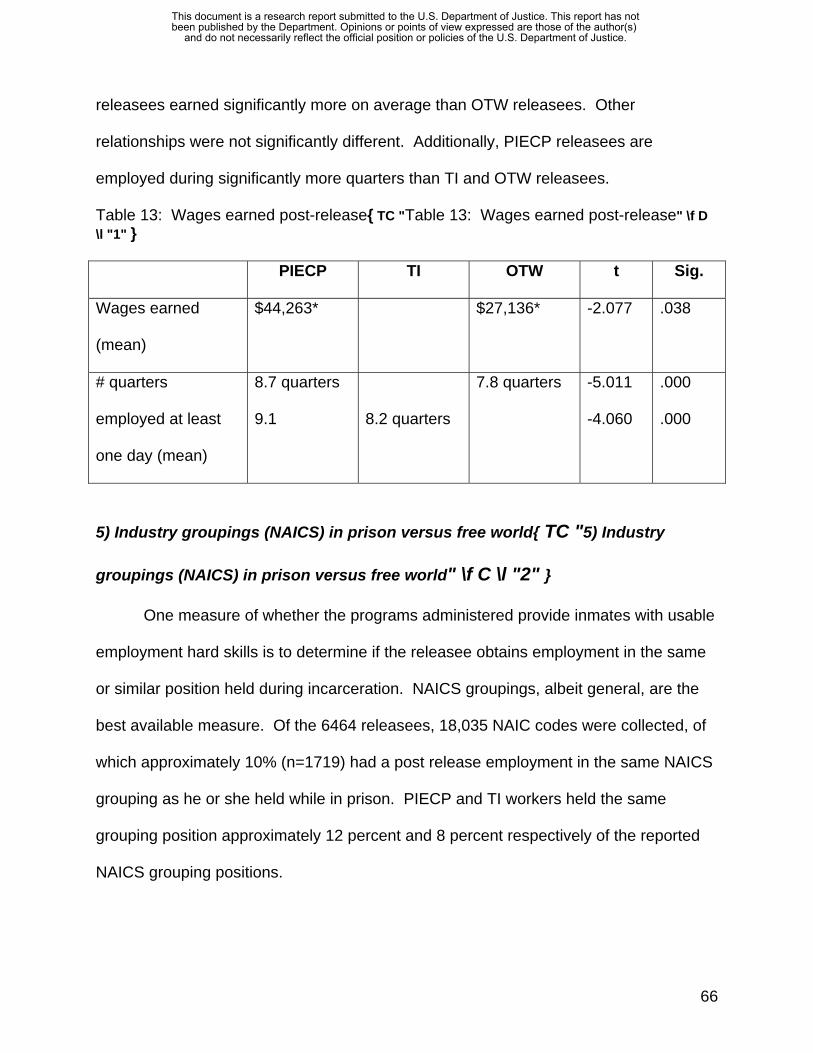
releasees earned significantly more on average than OTW releasees. Other
relationships were not significantly different. Additionally, PIECP releasees are
employed during significantly more quarters than TI and OTW releasees.
Table 13: Wages earned post-release{ TC "Table 13: Wages earned post-release" \f D \l "1" }
PIECP TI OTW t Sig.
Wages earned
(mean)
$44,263* $27,136* -2.077 .038
# quarters
employed at least
one day (mean)
8.7 quarters
9.1
8.2 quarters
7.8 quarters -5.011
-4.060
.000
.000
5) Industry groupings (NAICS) in prison versus free world{ TC "5) Industry
groupings (NAICS) in prison versus free world" \f C \l "2" }
One measure of whether the programs administered provide inmates with usable
employment hard skills is to determine if the releasee obtains employment in the same
or similar position held during incarceration. NAICS groupings, albeit general, are the
best available measure. Of the 6464 releasees, 18,035 NAIC codes were collected, of
which approximately 10% (n=1719) had a post release employment in the same NAICS
grouping as he or she held while in prison. PIECP and TI workers held the same
grouping position approximately 12 percent and 8 percent respectively of the reported
NAICS grouping positions.
66
This document is a research report submitted to the U.S. Department of Justice. This report has not been published by the Department. Opinions or points of view expressed are those of the author(s)
and do not necessarily reflect the official position or policies of the U.S. Department of Justice.

Research Question 2: Does PIECP participation reduce recidivism as compared to
TI work or OTW?{ TC "Research Question 2: Does PIECP participation reduce
recidivism as compared to TI work or OTW?" \f C \l "2" }
The analysis for recidivism is similar to post release employment. Recidivism is
measured in the three traditional ways; new arrest, conviction, and incarceration.
Technical violations were not measured as a new arrest. Survival analysis measures
how long a releasee is in the free world community until he or she recidivates. The
terminal event for the analysis may be an arrest, conviction or incarceration. At that
time, the individual is removed from further analysis. Therefore, this measure does not
take into account future free world time or additional recidivism measures. This analysis
technique allows the survival curve to measure the percent of those who are still in the
free world at the end of each interval for the first recidivism event. Recidivism is
measured in units of days. Once again, the timeline model of analysis (See Figure 2)
provides a visual model of the time from when the individual was released from prison
to the time in which he or she was first arrested, convicted or incarcerated.
The three measurements are based on the recidivism definition debates over the
years. One school of thought is that the number of arrests over count crime. Others
think that convictions are only incidents that can be proven in court, thereby
undercounting crime. And, finally, others think that measuring re-incarceration is best
because prison rehabilitation efforts should be responsible for reducing prison stays.
The follow-up period began on the date of release into the community (e.g., any
day between January 1, 1996 and June 30, 2001) until mid 2003. This results in a
follow-up period of slightly less than two years and up to seven and one-half years.
67
This document is a research report submitted to the U.S. Department of Justice. This report has not been published by the Department. Opinions or points of view expressed are those of the author(s)
and do not necessarily reflect the official position or policies of the U.S. Department of Justice.

Arrest{ TC "Arrest" \f C \l "2" }
This matched sample of releasees has relatively low recidivism rates. The
average amount of time from release to first arrest is approximately 993 days,
suggesting that many (80 percent) of the releasees were arrest free at the end of the
first year. The range of time between the time released and the time arrested is 1-2,519
days. Almost 59 percent of those in PIECP successfully reentered society, whereas
approximately 53 percent of the TI & OTW were not arrested during the follow-up
period. The rate of success at the end of the first year is high for all three groups, 82.5
percent of PIECP, and 76.8 percent of TI and 76.2 percent OTW did not get arrested in
the first year post release.
Table 14: Release to arrest descriptive measures{ TC "Table 14: Release to arrest descriptive measures" \f D \l "1" } Total sample size 6464
No post-release arrests 3526 (55.1%)
Range from release to arrest 1-2519 days
PIECP TI OTW
No post-release arrest 1359 (59.0%) 972 (52.6%) 1176 (52.3%)
Success rate for one year (no
post-release arrest during 1st
year)
1900 (82.5%) 1424 (76.8%) 1714 (76.2%)
Measuring recidivism included a comparison of PIECP, TI and OTW twin
matched sets to determine who stayed crime free longer. Based on the survival
analysis, PIECP participants stayed crime free significantly longer than TI and OTW
68
This document is a research report submitted to the U.S. Department of Justice. This report has not been published by the Department. Opinions or points of view expressed are those of the author(s)
and do not necessarily reflect the official position or policies of the U.S. Department of Justice.

participants. However, TI participants were not significantly different than OTW
participants. The survival rate is equal to the proportion of those who begin the quarter
arrest free post release and remain to the end of the quarter arrest free. The slowest
dropping survival curve is best because it indicates that comparably more releasees
have remained arrest free.
Between 52.7 and 59.6 percent of the releasees remained arrest free at the end
of the follow-up period (See Table 15: Case processing summary – arrest). In other
words, the releasees did not get arrested for a new crime during the follow-up period, so
they were censored from the analysis during the quarter in which the individual's follow-
up period ended.
Table 15: Case processing summary - arrest{ TC "Table 15: Case processing summary - arrest" \f D \l "1" }
Censored prefix Total N N of Events N Percent OTW 2232 1056 1176 52.7%TI 1841 869 972 52.8%PIE 2280 921 1359 59.6%Overall 6353 2846 3507 55.2%
Additionally, there is a significant difference between the three groups (See Table 16:
Overall comparisons – arrest).
Table 16: Overall comparisons - arrest{ TC "Table 16: Overall comparisons - arrest" \f D \l "1" } Chi-Square Df Sig. Log Rank (Mantel-Cox) 29.066 2 .000Breslow (Generalized Wilcoxon) 34.240 2 .000
Tarone-Ware 32.609 2 .000Test of equality of survival distributions for the different levels of PIECP / TI / OTW.
69
This document is a research report submitted to the U.S. Department of Justice. This report has not been published by the Department. Opinions or points of view expressed are those of the author(s)
and do not necessarily reflect the official position or policies of the U.S. Department of Justice.

Further analysis indicates that the significant difference is between PIECP and
TI, and between PIECP and OTW, but not between TI and OTW (See Table 17:
Comparison of TI & OTW only – arrest).
Table 17: Comparison of TI & OTW only - arrest{ TC "Table 17: Comparison of TI & OTW only - arrest" \f D \l "1" }
(
F
This document is a research report submitted to the U.S. Department of Justice. This report has not been published by the Department. Opinions or points of view expressed are those of the author(s)
and do not necessarily reflect the official position or policies of the U.S. Department of Justice.
Chi-Square df Sig. Log Rank (Mantel-Cox) .212 1 .645Breslow (Generalized Wilcoxon) .005 1 .946
Tarone-Ware .031 1 .861Test of equality of survival distributions for the different levels of PIECP / TI / OTW.
Finally, examining the survival curve provides insight into post release arrests
See Figure 8: Survival function – arrest)
igure 8: Survival function - arrest
70

300025002000150010005000
time from release to arrest
1.0
0.8
0.6
0.4
0.2
0.0
Cum
Sur
viva
l
TI-censoredPIE-censoredOTW-censoredTIPIEOTW
PIECP / TI / OTW
Survival Functions
First, PIECP releasees stay arrest free longer than TI or OTW releasees during the
follow-up period. TI and OTW releasees exhibit little difference. Nevertheless,
approximately 70 to 80 percent of the releasees were arrest free at the end of the first
year. The percent of those who are arrest free post-release continues to decline until
about the fourth year. This indicates that this sample of inmates is slightly different than
the general prison population. Maltz (1984) found that the ideal follow-up for inmates
was three years to capture the majority of the recidivism.
Conviction{ TC "Conviction" \f C \l "2" }
Between 73.6 and 77.9 percent of the releasees remained conviction free at the
end of the follow-up period (See Table 18: Case processing summary – conviction). In
71
This document is a research report submitted to the U.S. Department of Justice. This report has not been published by the Department. Opinions or points of view expressed are those of the author(s)
and do not necessarily reflect the official position or policies of the U.S. Department of Justice.

other words, the releasees did not get convicted for a new crime during the follow-up
period, so they were censored from the analysis during the quarter in which the
individual's follow-up period ended.
Table 18: Case processing summary - conviction{ TC "Table 18: Case processing summary - conviction" \f D \l "1" }
Censored prefix Total N N of Events N Percent OTW 2241 591 1650 73.6%TI 1846 458 1388 75.2%PIE 2291 506 1785 77.9%Overall 6378 1555 4823 75.6%
Additionally, there is a significant difference between the three groups (See Table
19: Overall comparisons – conviction).
72
This document is a research report submitted to the U.S. Department of Justice. This report has not been published by the Department. Opinions or points of view expressed are those of the author(s)
and do not necessarily reflect the official position or policies of the U.S. Department of Justice.
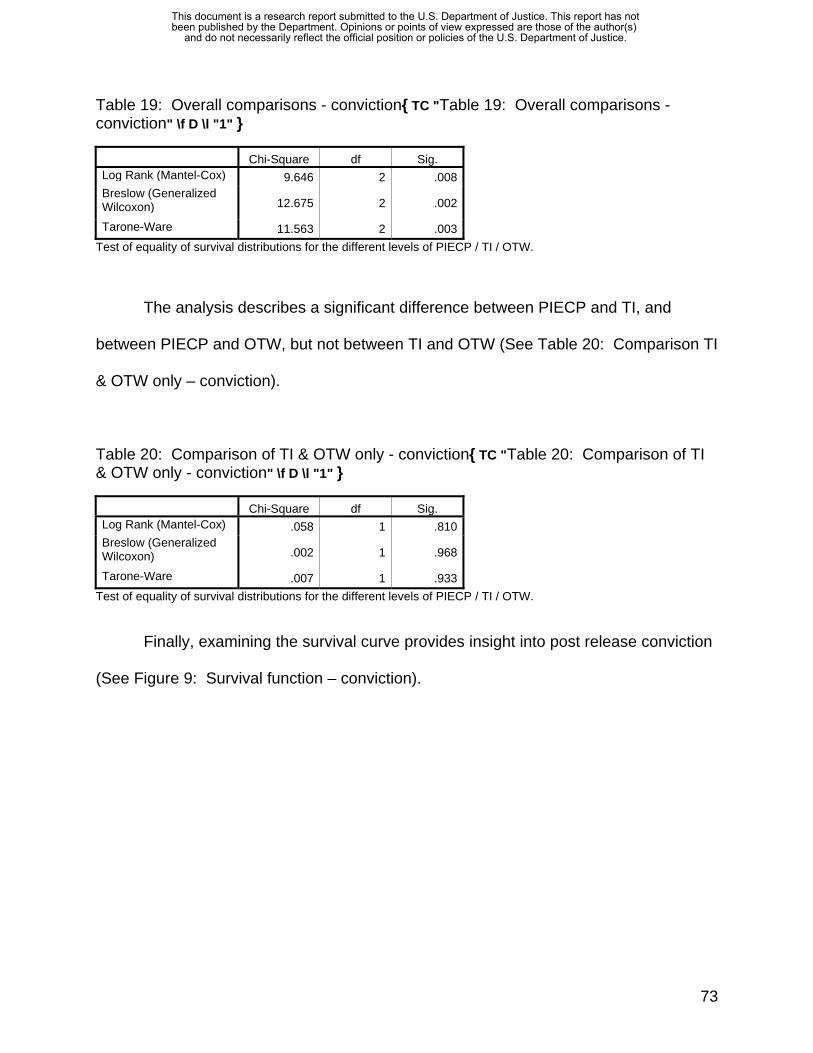
Table 19: Overall comparisons - conviction{ TC "Table 19: Overall comparisons - conviction" \f D \l "1" } Chi-Square df Sig. Log Rank (Mantel-Cox) 9.646 2 .008Breslow (Generalized Wilcoxon) 12.675 2 .002
Tarone-Ware 11.563 2 .003Test of equality of survival distributions for the different levels of PIECP / TI / OTW.
The analysis describes a significant difference between PIECP and TI, and
between PIECP and OTW, but not between TI and OTW (See Table 20: Comparison TI
& OTW only – conviction).
Table 20: Comparison of TI & OTW only - conviction{ TC "Table 20: Comparison of TI & OTW only - conviction" \f D \l "1" } Chi-Square df Sig. Log Rank (Mantel-Cox) .058 1 .810Breslow (Generalized Wilcoxon) .002 1 .968
Tarone-Ware .007 1 .933Test of equality of survival distributions for the different levels of PIECP / TI / OTW.
Finally, examining the survival curve provides insight into post release conviction
(See Figure 9: Survival function – conviction).
73
This document is a research report submitted to the U.S. Department of Justice. This report has not been published by the Department. Opinions or points of view expressed are those of the author(s)
and do not necessarily reflect the official position or policies of the U.S. Department of Justice.

Figure 9: Survival function - conviction
300025002000150010005000
time from release to conviction
1.0
0.8
0.6
0.4
0.2
0.0
Cum
Sur
viva
l
TI-censoredPIE-censoredOTW-censoredTIPIEOTW
PIECP / TI / OTW
Survival Functions
First, PIECP releasees stay conviction free longer than TI or OTW releasees during the
follow-up period. TI and OTW releasees exhibit little difference. Nevertheless,
approximately 90 percent of the releasees were conviction free at the end of the first
year. The percent of those who are conviction free post-release also continues to
decline until about the fourth year, following the similar trend to arrests.
74
This document is a research report submitted to the U.S. Department of Justice. This report has not been published by the Department. Opinions or points of view expressed are those of the author(s)
and do not necessarily reflect the official position or policies of the U.S. Department of Justice.

Incarceration{ TC "Incarceration" \f C \l "2" }
Between 89 and 93 percent of the releasees remained incarceration free at the
end of the follow-up period (See Table 21: Case processing summary – incarceration).
In other words, the releasees did not get incarcerated for a new crime during the follow-
up period, so they were censored from the analysis during the quarter in which the
individual's follow-up period ended.
Table 21: Case processing summary - incarceration{ TC "Table 21: Case processing summary - incarceration" \f D \l "1" }
Censored prefix Total N N of Events N Percent OTW 2246 247 1999 89.0%TI 1849 178 1671 90.4%PIE 2301 161 2140 93.0%Overall 6396 586 5810 90.8%
Additionally, there is a significant difference between the three groups (See Table
22: Overall comparisons – incarceration).
Table22: Overall comparisons - incarceration{ TC "Table22: Overall comparisons - incarceration" \f D \l "1" } Chi-Square df Sig. Log Rank (Mantel-Cox) 19.349 2 .000Breslow (Generalized Wilcoxon) 22.143 2 .000
Tarone-Ware 21.441 2 .000Test of equality of survival distributions for the different levels of PIECP / TI / OTW.
Further analysis indicates a significant difference between PIECP and TI, and
between PIECP and OTW, but not between TI and OTW (See Table 23: Comparison of
TI & OTW only – incarceration).
75
This document is a research report submitted to the U.S. Department of Justice. This report has not been published by the Department. Opinions or points of view expressed are those of the author(s)
and do not necessarily reflect the official position or policies of the U.S. Department of Justice.
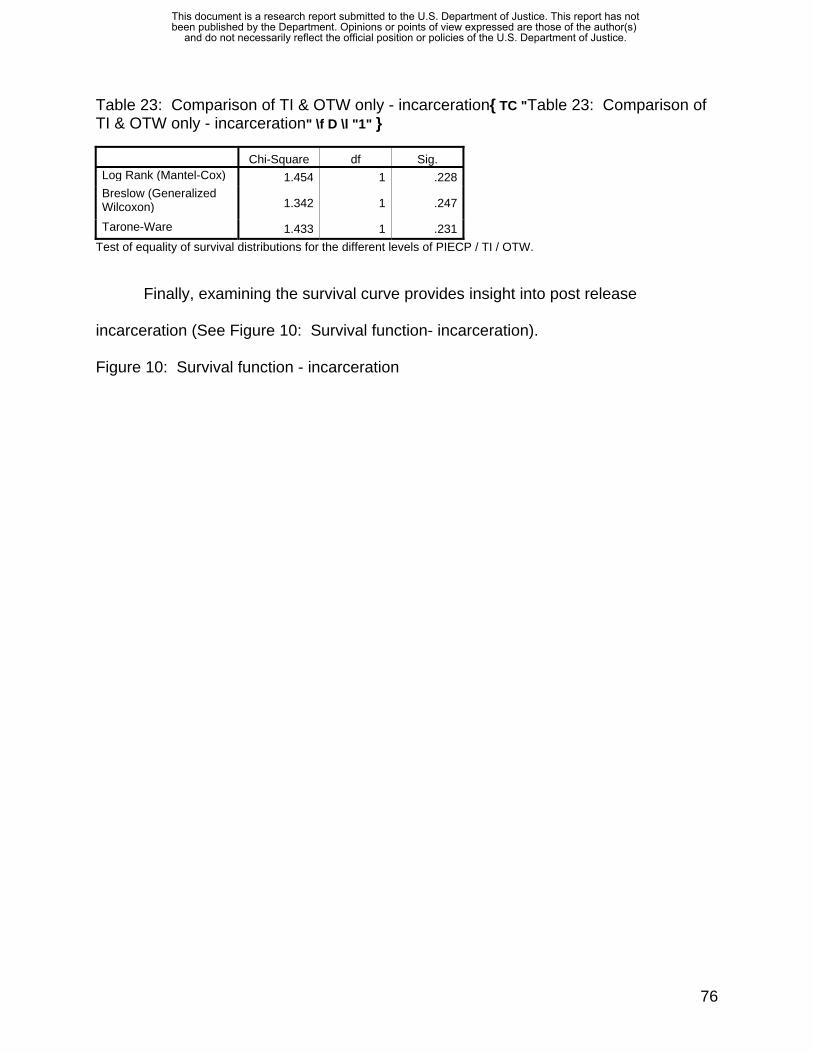
Table 23: Comparison of TI & OTW only - incarceration{ TC "Table 23: Comparison of TI & OTW only - incarceration" \f D \l "1" } Chi-Square df Sig. Log Rank (Mantel-Cox) 1.454 1 .228Breslow (Generalized Wilcoxon) 1.342 1 .247
Tarone-Ware 1.433 1 .231Test of equality of survival distributions for the different levels of PIECP / TI / OTW.
Finally, examining the survival curve provides insight into post release
incarceration (See Figure 10: Survival function- incarceration).
Figure 10: Survival function - incarceration
76
This document is a research report submitted to the U.S. Department of Justice. This report has not been published by the Department. Opinions or points of view expressed are those of the author(s)
and do not necessarily reflect the official position or policies of the U.S. Department of Justice.

300025002000150010005000
time from release to incarceration
1.0
0.8
0.6
0.4
0.2
0.0
Cum
Sur
viva
l
TI-censoredPIE-censoredOTW-censoredTIPIEOTW
PIECP / TI / OTW
Survival Functions
Mirroring arrests and convictions, PIECP participants are incarceration free for
significantly longer periods of time post release.
Summary{ TC "Summary" \f C \l "2" }
Based on the cluster sampling across five states and 46 prisons, with a matched
sample of 6464 releasees between January 1, 1996 and June 30, 2001, PIECP
participants re-enter society more successfully than TI or OTW releasees. The primary
77
This document is a research report submitted to the U.S. Department of Justice. This report has not been published by the Department. Opinions or points of view expressed are those of the author(s)
and do not necessarily reflect the official position or policies of the U.S. Department of Justice.
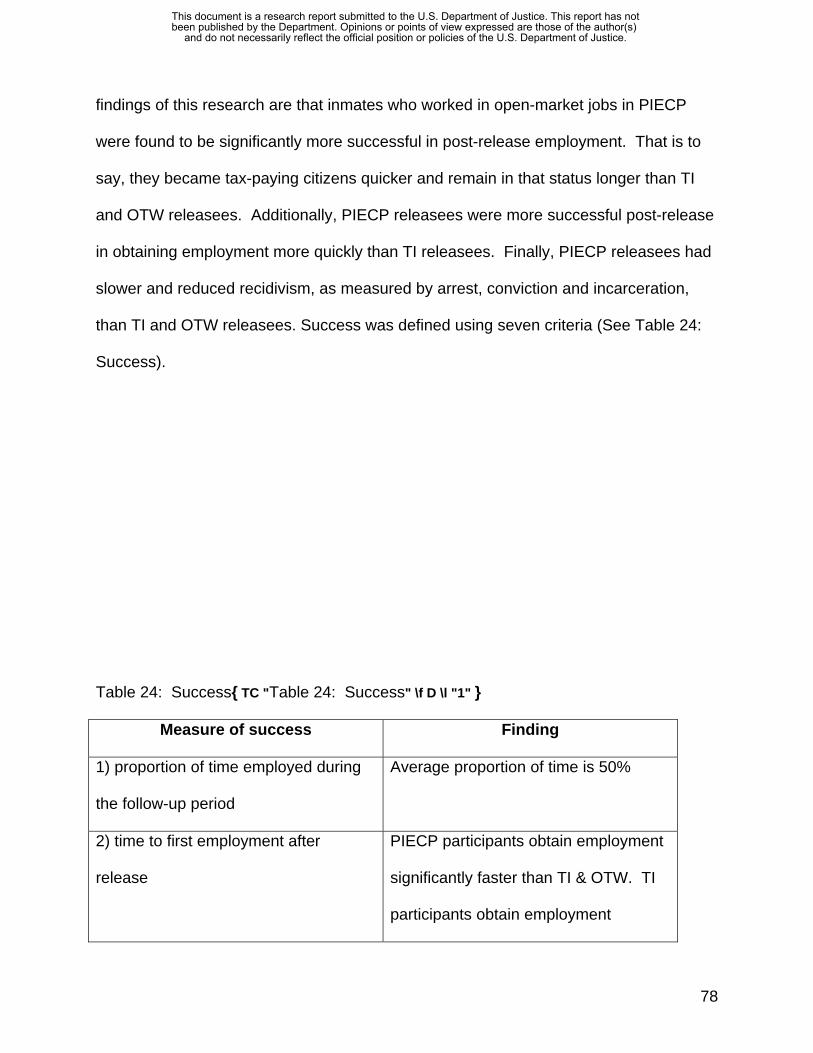
findings of this research are that inmates who worked in open-market jobs in PIECP
were found to be significantly more successful in post-release employment. That is to
say, they became tax-paying citizens quicker and remain in that status longer than TI
and OTW releasees. Additionally, PIECP releasees were more successful post-release
in obtaining employment more quickly than TI releasees. Finally, PIECP releasees had
slower and reduced recidivism, as measured by arrest, conviction and incarceration,
than TI and OTW releasees. Success was defined using seven criteria (See Table 24:
Success).
Table 24: Success{ TC "Table 24: Success" \f D \l "1" }
Measure of success Finding
1) proportion of time employed during
the follow-up period
Average proportion of time is 50%
2) time to first employment after
release
PIECP participants obtain employment
significantly faster than TI & OTW. TI
participants obtain employment
78
This document is a research report submitted to the U.S. Department of Justice. This report has not been published by the Department. Opinions or points of view expressed are those of the author(s)
and do not necessarily reflect the official position or policies of the U.S. Department of Justice.

significantly faster than OTW.
3) duration of first employment PIECP participants retain the 1st
employment significantly longer
4) wage rate during the follow-up
period
PIECP participants earn more wages
and higher wages
5) time from release to first arrest PIECP participants are arrested at a
slower rate than other groups.
6) Time from release to first conviction PIECP participants are convicted at a
slower rate than other groups.
7) time from release to first
incarceration
PIECP participants are incarcerated at
a slower rate than other groups
Policy Recommendations{ TC "Policy Recommendations" \f C \l "1" }
The research results found in this report suggest that work plays an integral part
in successful re-entry upon release. Those who worked in PIECP, gaining exposure to
employment hard and soft skills, financial benefits, and the aesthetics of a work
environment did significantly better in terms of post-release employment effects and
recidivism effects than otherwise similar releasees. Additionally, the state and federal
coiffeurs benefited from the taxes paid and the room and board collected (Petersik,
Nayak & Foreman, 2003). This would suggest that increased efforts should be
expended to increase the number of private industry partnerships with the appropriate
program monitoring and continued evaluation.
79
This document is a research report submitted to the U.S. Department of Justice. This report has not been published by the Department. Opinions or points of view expressed are those of the author(s)
and do not necessarily reflect the official position or policies of the U.S. Department of Justice.

However, there are some indicators and cautions that should be applied to these
recommendations. First, the sample is not perfectly matched (i.e., time incarcerated)
and control variables in future research should be included to fine tune the results.
Additionally, there are other factors that may play a role in the success of the program
that are not yet included in the analysis. However, with the appropriate on-going
monitoring and continued research, these factors could be targeted.
Future Research{ TC "Future Research" \f C \l "1" }
Because this research is the first national level study of this topic, it opens a
plethora of ideas for future research. Additionally, the topic of industry within the prison
walls has been the focus of many legislatures recently. In fact, one state found the
PIECP to be unconstitutional during the course of this research. As a result, this section
could continue for many pages. To prepare a more focused approach, the following
discusses the most urgent two issues. This is followed by a list of research topics
generated without any particular order of urgency based on questions asked at a
presentation of preliminary results. Finally, a brief list of future topics is included that
resulted from review of this report.
First, the original research questions included a sub-question, Under what
conditions and for which inmates is PIECP more effective than TI and OTW? While this
report presents some brief descriptive information about the sample characteristics,
there is considerable more that could be done to enhance this information. In the
report, we point out three such issues:
80
This document is a research report submitted to the U.S. Department of Justice. This report has not been published by the Department. Opinions or points of view expressed are those of the author(s)
and do not necessarily reflect the official position or policies of the U.S. Department of Justice.

• Most are minimum custody, but a sufficient sample size of those in more secure
environments is included to enable separate analysis in the future. Is PIECP
equally effective for inmates who are classified at different security levels?
• An intentional over sampling was part of the research design to ensure results
can be determined based on gender. Are the effects of PIECP the same for
males and females?
• Approximately 20 to 30 percent of the sample did not obtain employment during
the follow-up. Is this group at a higher risk of recidivism?
Second, we do not know at this time the percent of the general prison population
that matches PIECP participants. The sample is based on those who are selected to
work in PIECP and those who are most likely to be selected if positions were available.
Even in the preliminary stages of reporting results, this raised concerns about the
generalizability of the findings. As discussed within the report, the findings are
generalizable to all PIECP releasees, but to a more limited number of TI and OTW
releasees. Further investigation should be made to determine an approximate
proportion of inmates to which this sample represents. For example, are 50 percent of
the current inmates similar to those who are selected for PIECP?
Next, the following list offers insight into what is important to those who work in
the prisons:
• What is the impact of the following on success of the sample?
- facility involvement
- education
- family involvement
81
This document is a research report submitted to the U.S. Department of Justice. This report has not been published by the Department. Opinions or points of view expressed are those of the author(s)
and do not necessarily reflect the official position or policies of the U.S. Department of Justice.

- post release employment, when it is a condition of parole
- absorption capacity of industry (last hired, first fired)
- James Bonta's 7 criteria for re-entry: employment, family, attitude,
community involvement, drugs, personal/emotional orientation, associate
interactions
- mental health
- gender (i.e., women perform childcare rather then outside employment)
- type of model (employer, manpower, customer)
- TABE scores rather then education level
- # of prior recidivism
- crime type
- sex offenders
- job status at time of recidivism
• In addition, those working in the field wanted to know:
- For which crimes were they reincarcerated?
- Does Maslow's hierarchy of basic needs apply?
- What are the PIECP program best practices for the most effective PIECP
programming?
- How do states with PIECP compare to states without PIECP?
Finally, the following list of questions was generated from academic review of this
publication:
- How do PIECP operations differ from TI operations? Should PIECP be
the dominant work or is there a place for each?
82
This document is a research report submitted to the U.S. Department of Justice. This report has not been published by the Department. Opinions or points of view expressed are those of the author(s)
and do not necessarily reflect the official position or policies of the U.S. Department of Justice.

- What is it about PIECP that lead to the results in this study? For example,
was it the amount of money earned? The quality of work performed? The
supervision provided? Or the type of work performed?
- What model of industry performed best?
- What implementation factors insure favorable outcomes?
- Conduct a prospective study with control groups that tracks tasks, length
of time involved in each programming area and reasons for ending
programming. Compare mixed group effects to pure group effects.
- Include control variables in the survival analysis.
83
This document is a research report submitted to the U.S. Department of Justice. This report has not been published by the Department. Opinions or points of view expressed are those of the author(s)
and do not necessarily reflect the official position or policies of the U.S. Department of Justice.

References{ TC "References" \f C \l "1" }
Ashurst-Sumners Act, (1935).
Atkinson, R. (2002). Prison labor It's more than breaking rocks: Progressive Policy
Institute.
Bureau of Justice Assistance. (2004). Prison Industry Enhancement Certification
Program. Retrieved 2005, August 16, from
http://www.ncjrs.org/pdffiles1/bja/203483.pdf
Federal Register. (1999, April 17). Prison Industry Enhancement Certification Program
Guideline (Vol. 64, pp. 17000-17014).
Hirsch, A., Dietrich, S., Landau, R., Schneider, P., Ackelsberg, I., Bernstein-Baker, J., et
al. (2001). Every door closed: Barriers facing parents with criminal records:
Center for Law and Social Policy.
Holzer, H. J., Raphael, S., & Stoll, M. (2003). Employment Barriers Facing Ex-
Offenders. Retrieved August 25, 2005, from
www.urban.org/UploadedPDF/410855_holzer.pdf
Holzer, H. J., & Stoll, M. (2002). Employer demand for welfare recipients by race.
Retrieved August 25, 2005, from
http://www.urban.org/Template.cfm?Section=ByAuthor&NavMenuID=63&templat
e=/TaggedContent/ViewPublication.cfm&PublicationID=7528
Holzer, H. J., & Wissoker, D. (2001). How can we encourage job retention and
advancement for welfare recipients. Retrieved August 25, 2005, from
http://www.urban.org/Template.cfm?Section=ByAuthor&NavMenuID=63&templat
e=/TaggedContent/ViewPublication.cfm&PublicationID=7443
84
This document is a research report submitted to the U.S. Department of Justice. This report has not been published by the Department. Opinions or points of view expressed are those of the author(s)
and do not necessarily reflect the official position or policies of the U.S. Department of Justice.

Illinois Criminal Justice Information Authority. (1986a). The impact of prior criminal
history on recidivism in Illinois. Chicago, IL: Illinois Criminal Justice Information
Authority.
Illinois Criminal Justice Information Authority. (1986b). The pace of recidivism in Illinois.
Chicago, IL: Illinois Criminal Justice Information Authority.
Kramer, F. (1998). The hard to place: Understanding the population and strategies to
serve them. Welfare Information Network Issue Notes, 2(5).
Loprest, P. (2002). Who returns to welfare? : The Urban Institute.
Macguire, K. E., Flanagan, T. J., & Thornberry, T. P. (1988). Prison labor and
recidivism. Journal of Quantitative Criminology, 4(1), 3-18.
Maltz, M. D. (1984). Recidivism. New York: Academic Press.
National Correctional Industries Association. (2002). Piece of the PIE. Retrieved August
16, 2005, from http://www.nationalcia.org/vol1nov2002.pdf
National Correctional Industries Association (personal communication, August 30,
2005).
Petersik, T. W., Nayak, T. K., & Foreman, M. K. (2003). Identifying beneficiaries of PIE
inmate incomes: Who benefits from wage earnings of inmates working in the
Prison Industry Enhancement (PIE) program. Retrieved August 16, 2005, from
http://www.nationalcia.org/researchfullrpt.pdf
Petersilia, J., & Turner, S. (1986). Prison versus probation in California: Implications for
crime and offender recidivism. Santa Monica, CA: RAND.
85
This document is a research report submitted to the U.S. Department of Justice. This report has not been published by the Department. Opinions or points of view expressed are those of the author(s)
and do not necessarily reflect the official position or policies of the U.S. Department of Justice.

Saylor, W. G., & Gaes, G. G. (1997). Training inmates through industrial work
participation and vocational and apprenticeship instruction. Corrections
Management Quarterly, 1(2), 32-43.
Sexton, G. E. (1995). Work in America's prisons: Joint ventures with the private sector.
National Institute of Justice Program Focus, 24.
Smith, C. J. (2002). A national evaluation of the effects of the Prison Industries
Enhancement Certification Program (PIECP): Results of a feasibility study.
Retrieved August 16, 2005, from http://www.nationalcia.org/feasibility
Statistical Package for Social Sciences. (1999). SPSS Advanced Models 10.0. Chicago,
IL: SPSS, Inc.
Statistical Package for Social Sciences. (2005). SPSS advanced models 14.0.
Retrieved August 15, 2005, from http://www.spss.com/pdfs/SAM14SPClr.pdf
Stollmack, S., & Harris, C. M. (1974). Failure rate analysis applied to recidivism data.
Operations Research, 22, 1192-1205.
Turner, S., & Smith, C. J. (1994). California civil addict program: An analysis of program
components, offender performance, and judicial perceptions. Santa Monica, CA:
RAND.
Western, B., Kling, J., & Weiman, D. (2001). The labor market consequences of
incarceration.
86
This document is a research report submitted to the U.S. Department of Justice. This report has not been published by the Department. Opinions or points of view expressed are those of the author(s)
and do not necessarily reflect the official position or policies of the U.S. Department of Justice.