
Corrected Volume 2 - One to Use
27
Anno Domini 2000 Pty Ltd 91 The Crescent, Helensburgh, NSW, 2508 Phone: (02) 4294 8452 Fax: (02) 4294 3963 Email: [email protected] ABN: 93 091 261 684 Engineering Studies Volume 2 - 3 rd Edition Corrections. On this disk you will find the corrected pages for this copy of your Engineering Studies – The Definitive Guide – Volume 2 – 3 rd Edition. This edition was printed by a new printing company and it was drawn to our attention that a number of the symbols in the mathematical equations were replaced by meaningless squares. Chapters involved were Chapter 1, 2 and 3. This disk enclosed has these errors corrected. We apologise for this inconvenience.
-
Upload
dimitar-gligz -
Category
Documents
-
view
9 -
download
1
description
Corrected Volume 2 - One to Use
Transcript of Corrected Volume 2 - One to Use

Anno Domini 2000 Pty Ltd 91 The Crescent, Helensburgh, NSW, 2508
Phone: (02) 4294 8452 Fax: (02) 4294 3963 Email: [email protected]
ABN: 93 091 261 684
Engineering Studies Volume 2 - 3rd Edition Corrections.
On this disk you will find the corrected pages for this copy of your
Engineering Studies – The Definitive Guide – Volume 2 – 3rd
Edition.
This edition was printed by a new printing company and it was drawn
to our attention that a number of the symbols in the mathematical
equations were replaced by meaningless squares.
Chapters involved were Chapter 1, 2 and 3.
This disk enclosed has these errors corrected.
We apologise for this inconvenience.

CHAPTER 1 Page 25
Shear Force At Point 1
Shear Force At Point 2
Now find the bending moment at the points shown on the diagram.
Bending Moment At Point 1
Bending Moment At Point 2
Now we have determined the bending moments at the same points as we did for the shear force.
However these are not necessarily the maximum values. Engineers are concerned to find the
maximum shear force and bending moment, because that is where the stresses will be the greatest. In
this beam the maximum bending moment occurs at the 40kN force.
The positive SF value means
our assumption that the SF is
acting downward was correct.
The positive SF value means our
assumption that the SF is acting
upward is correct. Therefore, by our
sign convention it is a negative SF.
20 kN
SF
40 kN
20 kN 2 m 1 m
1 m
20 kN
BM
40 kN
20 kN
2 m 1 m
1 m
SF
BM
40 kN
20 kN 2 m
BM
+
+
+
SF) (positive kN 20
200
SF
SFFV
SF) (negative kN 20
40200
SF
SFFV
kNm 20
12001
BM
BMM
kNm 20
14032002
BM
BMM
SMcentre = 0 = 20 ´2 - 40´ 0 -BM
BM = 40 kNm
+
+

Page 26
So the bending moment rises from zero at one end of the beam up to 40 kNm at the centre then back
to zero at the other end, while the SF is 20 kN between the left end and the centre and –20 kN from
the centre to the right end.
It is better to make bending moment calculations at points where there are applied forces, particularly
when there is more than one.
Shear Force and Bending Moment Diagrams
It is often useful to place the shear force and bending moment values onto a graph to show the nature
of these values across the length of the beam. It is here that sign convention plays an important part.
Shear Force Diagrams
This is a graphical representation of the distribution of shear forces across a beam. There are two
ways of determining the shear force diagram, the long way and the short way. The long way never
fails, while the short way works best with point loads, which is what we are considering at the
moment. Example 1.10 outlines both methods.
Example 1.7
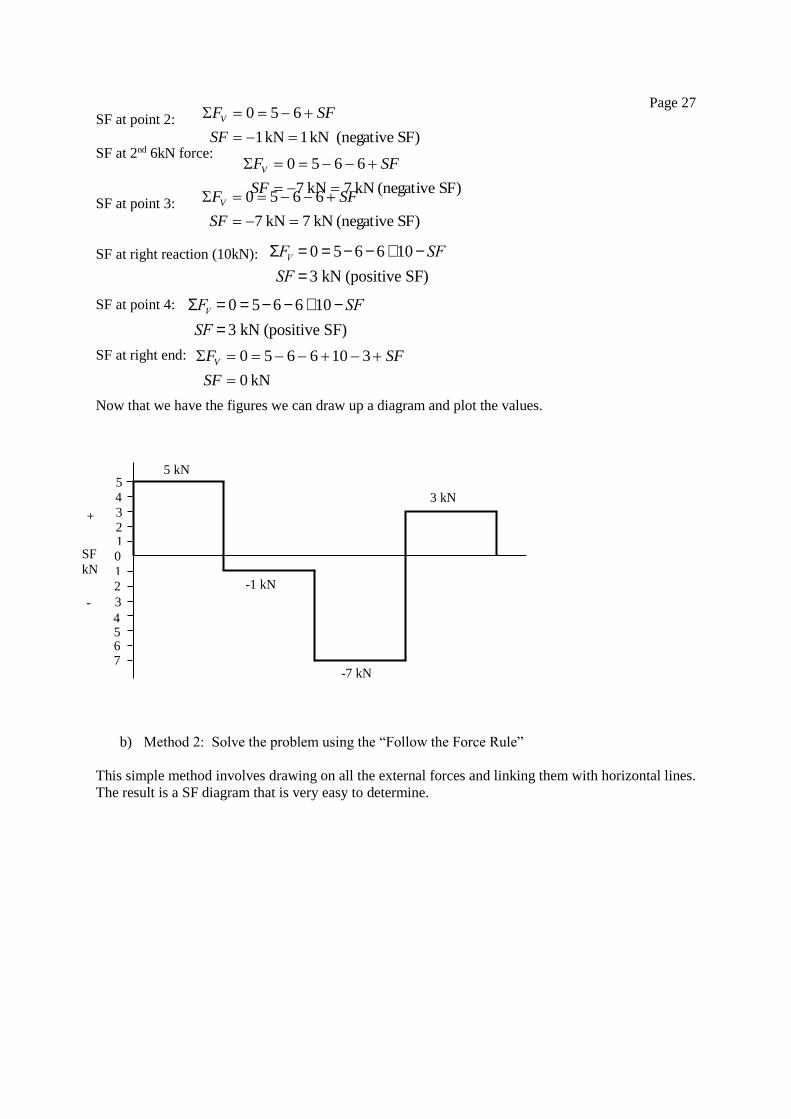
Determine the shear force diagram for the beam shown below.
a) Method 1: Start at the left and add the forces at the numbered points and at the point loads.
(Note upward forces are assumed positive)
SF at left reaction (5 kN):
SF at point 1:
SF at 6kN force:
6 kN 6 kN 3 kN
1 m 1 m 1 m 1 m
10 kN 5 kN
SFV = 0 = 5- SF
SF = 5 kN (positive SF)
SF) (negative kN 1kN 1
650
SF
SFFV
SFV = 0 = 5- SF
SF = 5 kN (positive SF)
1 2 3 4
Page 27
SF at point 2:
SF at 2nd 6kN force:
SF at point 3:
SF at right reaction (10kN):
SF at point 4:
SF at right end:
Now that we have the figures we can draw up a diagram and plot the values.
b) Method 2: Solve the problem using the “Follow the Force Rule”
This simple method involves drawing on all the external forces and linking them with horizontal lines.
The result is a SF diagram that is very easy to determine.
1 2 3 4 5
1 2
3
4 5 6 7
0
+
-
5 kN
-1 kN
-7 kN
3 kN
SF
kN
SF) (negative kN 1kN 1
650
SF
SFFV
SF) (negative kN 7kN 7
6650
SF
SFFV
SF) (negative kN 7kN 7
6650
SF
SFFV
SFV = 0 = 5- 6 - 6 +10 - SF
SF = 3 kN (positive SF)
SFV = 0 = 5- 6 - 6 +10 - SF
SF = 3 kN (positive SF)
kN 0
3106650
SF
SFFV
Page 29
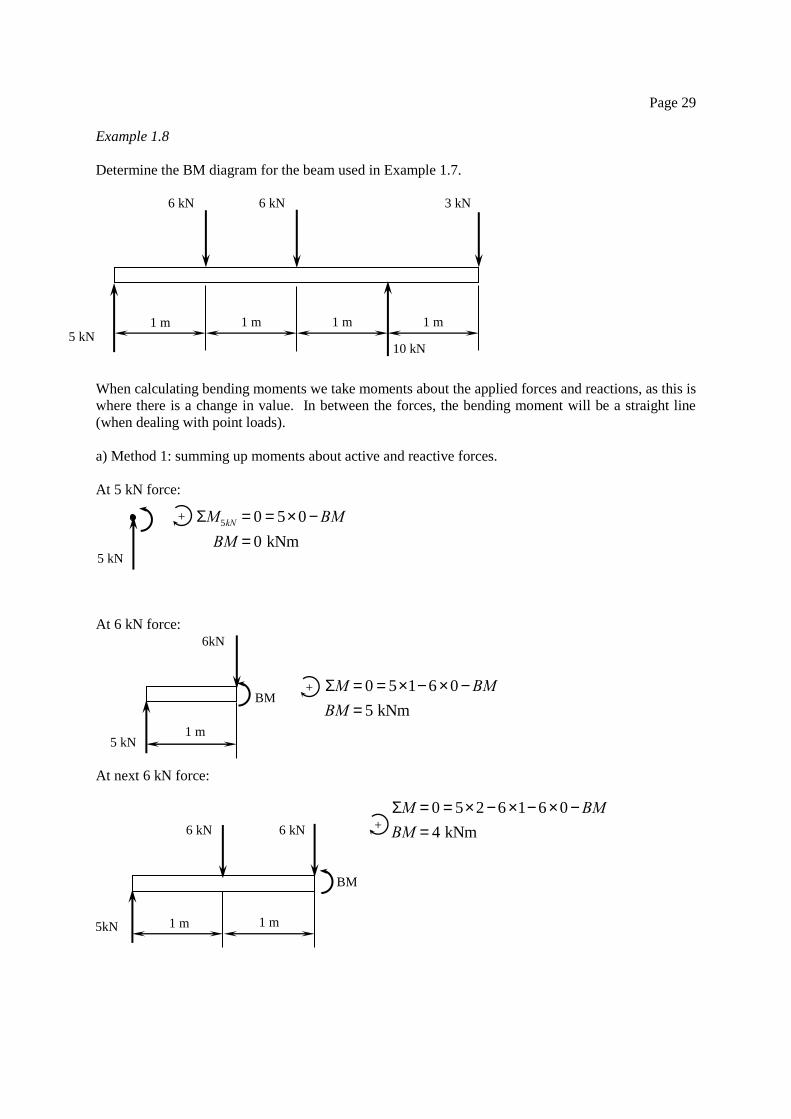
Example 1.8
Determine the BM diagram for the beam used in Example 1.7.
When calculating bending moments we take moments about the applied forces and reactions, as this is
where there is a change in value. In between the forces, the bending moment will be a straight line
(when dealing with point loads).
a) Method 1: summing up moments about active and reactive forces.
At 5 kN force:
At 6 kN force:
At next 6 kN force:
6 kN 6 kN 3 kN
1 m 1 m 1 m 1 m
10 kN 5 kN
5 kN
BM
1 m
BM
5 kN
+
+
6kN
6 kN 6 kN
1 m 1 m
+
5kN
SM5kN = 0 = 5´ 0 -BM
BM = 0 kNm
SM = 0 = 5´1- 6´ 0 -BM
BM = 5 kNm
SM = 0 = 5´ 2 - 6´1- 6´ 0 -BM
BM = 4 kNm
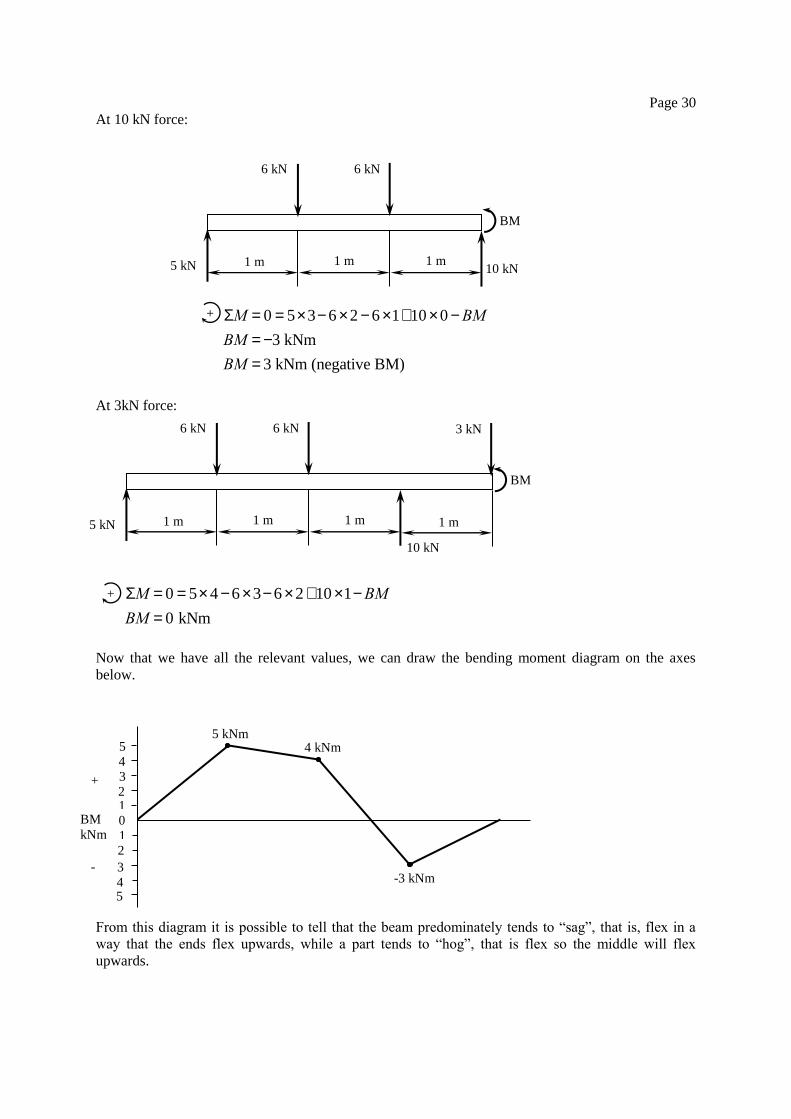
Page 30
At 10 kN force:
At 3kN force:
Now that we have all the relevant values, we can draw the bending moment diagram on the axes
below.
From this diagram it is possible to tell that the beam predominately tends to “sag”, that is, flex in a
way that the ends flex upwards, while a part tends to “hog”, that is flex so the middle will flex
upwards.
BM
6 kN 6 kN
1 m 1 m
+
5 kN 1 m 10 kN
BM
6 kN 6 kN
1 m 1 m
+
5 kN 1 m
10 kN
1 m
3 kN
1 2 3 4 5
1 2
3
4 5
BM
kNm 0
+
-
5 kNm 4 kNm
-3 kNm
SM = 0 = 5´3- 6 ´ 2 - 6 ´1+10 ´ 0 -BM
BM = -3 kNm
BM = 3 kNm (negative BM)
SM = 0 = 5´ 4 - 6´3- 6´ 2 +10´1-BM
BM = 0 kNm
Page 32
2 Draw a FBD (Free Body Diagram) of the beam showing all known loads (watch for the weight of
the beam). Calculate the reactions and show them on the FBD.
3 Draw the S.F. diagram, with reference to the FBD, by starting at the left hand end, plot upwards
for upward forces and downwards for downward forces. This is called the Follow the Force rule.
4 Find the positions of zero S.F., for these will be the positions where the BM is a maximum i.e. SF
= 0, BM = maximum).
5 Forces going down produce positive bending moments (sag); forces going up produce negative
bending moments (hog).
6 Bending moments are always zero at the ends of a beam (unless a couple acts at the end e.g. a
cantilever beam).
7 Calculate the B.M. either by adding moments or adding areas at the following significant
positions:
at the supports;
at each point load;
at points where the SF is zero (this point is where the maximum BM should be).
8 Between the significant positions listed in 7, draw suitable lines according to the following: if the
beam is unloaded the B.M. varies linearly (i.e. it forms straight lines)
9 Point loads produce sharp changes in the S.F. diagram, but merely slope changes in the B.M.
diagram.
Point 4 is a useful check. If you refer to our example you will note that at the maximum BM the SF
diagram travels across the zero axis; this is a useful thing to remember as a check when drawing BM
diagrams.
We will do one more example to reinforce our knowledge.
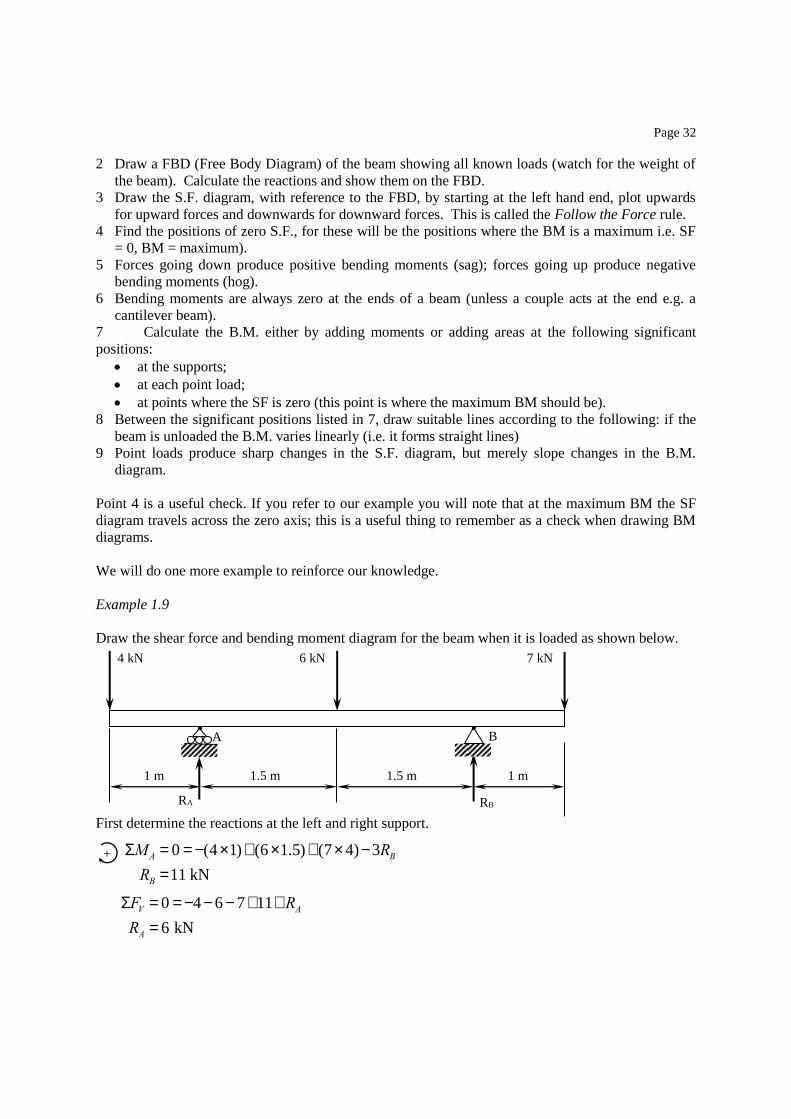
Example 1.9
Draw the shear force and bending moment diagram for the beam when it is loaded as shown below.
First determine the reactions at the left and right support.
4 kN 6 kN 7 kN
1 m 1 m 1.5 m 1.5 m
RA RB
+
A B
SMA = 0 = -(4´1)+ (6´1.5)+ (7´ 4)-3RB
RB =11 kN
SFV = 0 = -4 - 6 - 7+11+RA
RA = 6 kN

Page 34
sum of all couples but have the opposite direction. Let us now draw a free-body diagram (FBD) and
determine the reactions.
Now for the couple. It would be simple to just take moments about this point and have the couple
reacting in the opposite direction. Although this works out, it is conceptually incorrect (as outlined in
Volume 1 p. 62: a couple can only be balanced by another couple). Since the vertical reaction is in
essence two vertical forces together (2 kN and a 3.5 kN), we must add two couples together; one
couple is 2 kN times 0.2m the other is 3.5 kN times 0.3m.
Therefore:
Now that we have the reactions we can produce the SF and BM diagrams. The FBD has been
reproduced above the SF and BM to clarify the method.
Cantilever beams do not lend themselves as well as simply supported beams to the quicker methods
for solution. With this cantilever we are dealing with the right section where the SF is positive if
going up (see p. 24).
RW
MCW
2 kN 3.5 kN
5.5 kN
1.45 kNm
200 mm 100 mm
1
2
3 4
5
1 2
SF
kN 0
+
-
5.5 kN
3.5 kN
6
7
2 kN 3.5 kN
200 mm 100 mm
SMW = 0 = 2´0.2 +3.5´ 0.3-MCW
MCW =1.45 kNm

Page 38
This cross section differs from the previous I beam as it is not symmetrical about two axes. As a
result the neutral axis (NA) is not halfway between top and bottom.
Let us solve part a):
First we must find the bending moment that exists at the load. Since the load is midway between the
reactions then each reaction must be half of the load. Therefore both reactions are 28 kN vertically
up.
So the BM is:
For the upper surface For the lower surface
The stress in the lower surface will be twice the amount of the stress in the upper surface, as the lower
surface is double the distance away from the neutral axis. If this was a material weak in tension, such
as concrete, there would need to be reinforcing done on the lower surface, or the section of the beam
would be changed.
Now we shall solve part b).
BM +
56 kN
28 kN
NA
20
0
10
0
Cross-section
56 kN
5 m 5 m
SM = 0 = 28´ 5- 56´ 0 -BM
BM =140 kNm
MPa 43.30
Pa 61.30434782
106.4
1.01400004
b
b
b
bI
My
MPa 87.60
Pa 22.60869565
106.4
2.01400004
b
b
b
bI
My
GPa 70
Pa 107
106.4
230140000
10
4
E
E
E
I
MrE
I
M
r
E

Page 43
Example 1.15
A bolt is used to hold a coupling together. If the coupling takes a load of 10 kN and the maximum
allowable shear stress of the bolt is 30 MPa, determine the minimum diameter of the bolt.
This situation is a classic shear stress problem, for it illustrates the concept of double shear. The
arrangement of the coupling means the bolt will try to shear in two places. This means that the area is
doubled in the calculations.
This means that the minimum size for the bolt must be 14.57 mm. As no such bolt is readily available
the engineer will choose a commercially available size larger than this, such as 16 mm.
Engineering and Working Stress
In Module 3 in Year 11 we discussed stress/strain diagrams. Examples are shown in Fig. 1.16
(stress/strain diagrams are covered in greater detail in this chapter on page 46).
One thing that puzzles most students is why the stress falls away at the end of the diagram for ductile
materials. This is because engineers tend to cheat a little with these diagrams; they show engineering
stress. Engineering stress is calculated with the load always divided by the original cross sectional
area, even though the cross section actually reduces just before failure. So this type of engineering
does not take
10 kN 5 kN
5 kN
s s =P
A
s s =P
2A
pd 2
2=P
s s
pd 2 =2P
s s
d =2P
ps s
d =2 ´10, 000
p ´30 ´106
d = 0.014567 m
d =14.57 mm
CHAPTER 2 Page 93
Example 2.1
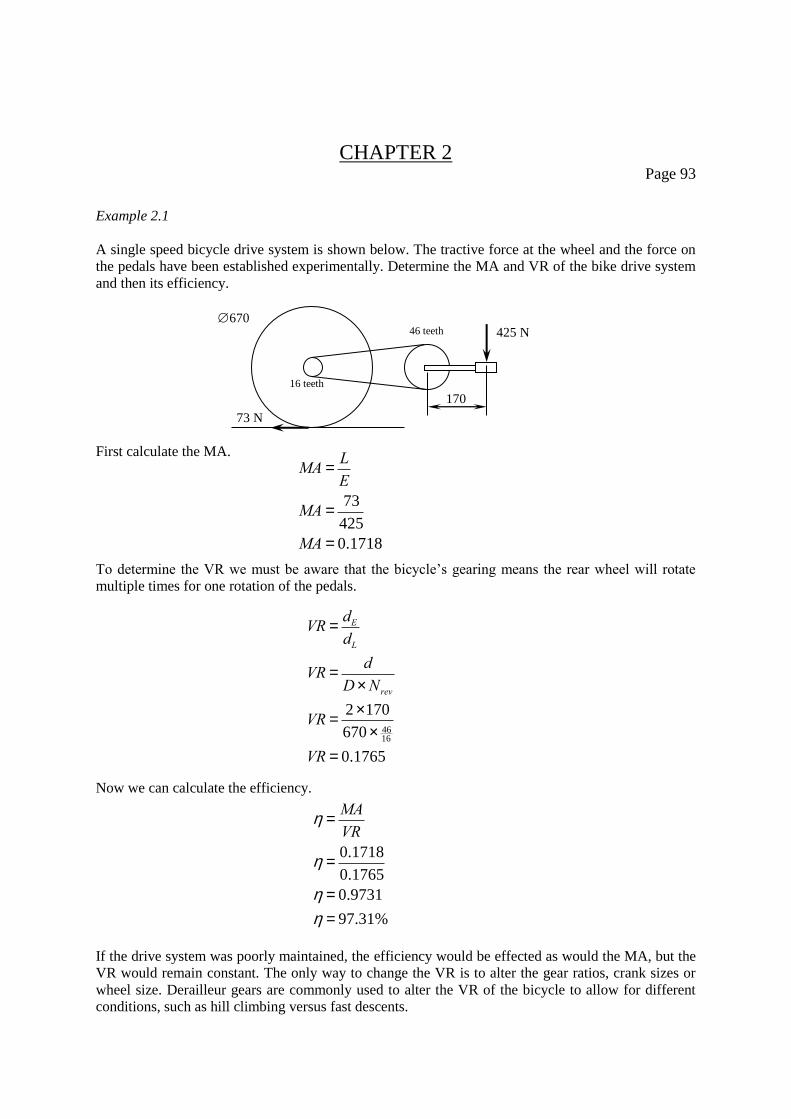
A single speed bicycle drive system is shown below. The tractive force at the wheel and the force on
the pedals have been established experimentally. Determine the MA and VR of the bike drive system
and then its efficiency.
First calculate the MA.
To determine the VR we must be aware that the bicycle’s gearing means the rear wheel will rotate
multiple times for one rotation of the pedals.
Now we can calculate the efficiency.
If the drive system was poorly maintained, the efficiency would be effected as would the MA, but the
VR would remain constant. The only way to change the VR is to alter the gear ratios, crank sizes or
wheel size. Derailleur gears are commonly used to alter the VR of the bicycle to allow for different
conditions, such as hill climbing versus fast descents.
425 N 46 teeth
16 teeth
670
170
73 N
MA =L
E
MA =73
425
MA = 0.1718
VR =dE
dL
VR =d
D´Nrev
VR =2 ´170
670 ´ 4616
VR = 0.1765
h =MA
VR
h =0.1718
0.1765
h = 0.9731
h = 97.31%

Page 94
Example 2.2
A simple screw jack is being temporarily used to raise cars for tyre changes. The thread has a pitch of
4 mm and the handle has a radius of 200 mm. If the jack has an efficiency of 50%, determine the
effort required to lift the front corner of a car, which requires a load of 6 kN.
Solution
The pitch is important here because one rotation of the handle moves the scissor arms in the pitch,
which is 4 mm, so each rotation of the handle moves the arms inwards by 4 mm. Therefore the pitch
is the distance the load moves, and the circle described by the handle is the distance the effort moves.
Now we can calculate the MA using the efficiency and the VR.
Finally calculate the effort using the MA formula
We can see the jack is the complete opposite to the bicycle drive, very large MA and hence very large
VR, which means your hands will move a long way operating the jack. But you are able to lift a very
large object. The low efficiency is caused by friction in the mechanism, which is why the jack stays
up and doesn’t unwind.
Modern cars are usually provided with a scissor action jack, which is a form of screw jack, but the VR
varies as the angle of the arms changes, making calculation much more challenging.
VR =dE
dL
VR =2pr
Pitch
VR =2p ´ 200
4
VR = 314.16
h =MA
VR
MA =VR´h
MA = 314.16 ´ 0.5
MA =157.08
MA =L
E
E =L
MA
E =6000
157.08
E = 38.2 N
Page 96
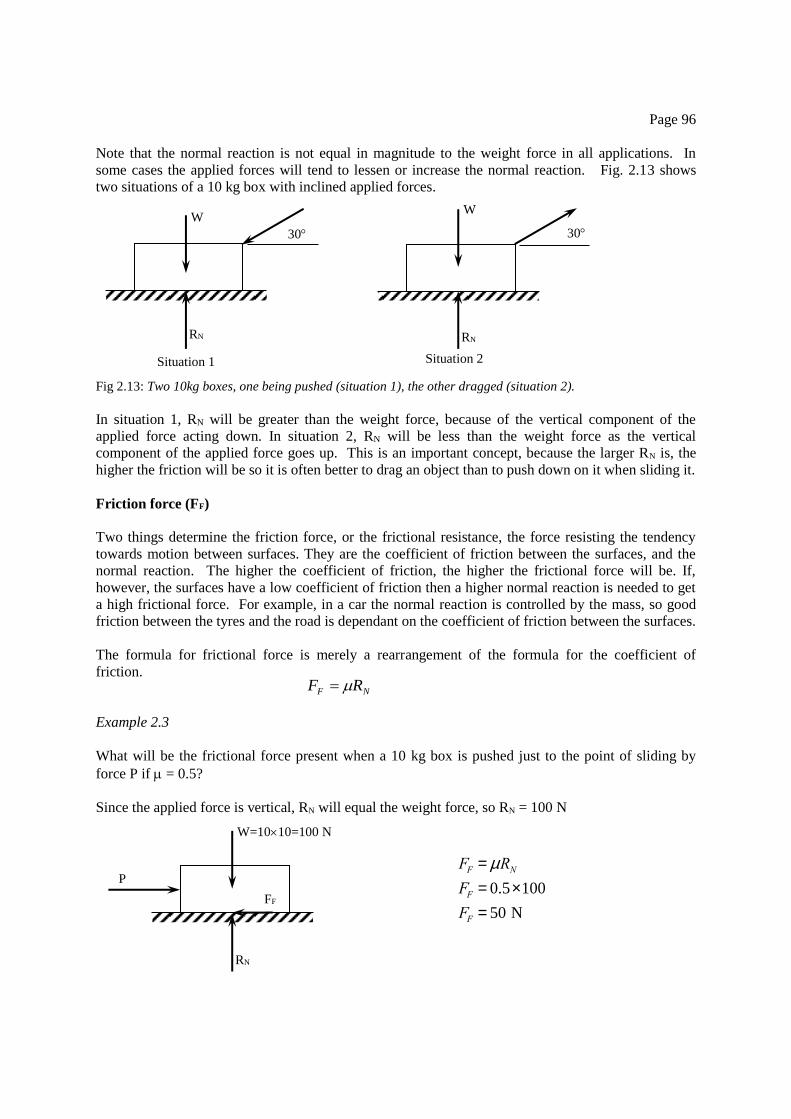
Note that the normal reaction is not equal in magnitude to the weight force in all applications. In
some cases the applied forces will tend to lessen or increase the normal reaction. Fig. 2.13 shows
two situations of a 10 kg box with inclined applied forces.
Fig 2.13: Two 10kg boxes, one being pushed (situation 1), the other dragged (situation 2).
In situation 1, RN will be greater than the weight force, because of the vertical component of the
applied force acting down. In situation 2, RN will be less than the weight force as the vertical
component of the applied force goes up. This is an important concept, because the larger RN is, the
higher the friction will be so it is often better to drag an object than to push down on it when sliding it.
Friction force (FF)
Two things determine the friction force, or the frictional resistance, the force resisting the tendency
towards motion between surfaces. They are the coefficient of friction between the surfaces, and the
normal reaction. The higher the coefficient of friction, the higher the frictional force will be. If,
however, the surfaces have a low coefficient of friction then a higher normal reaction is needed to get
a high frictional force. For example, in a car the normal reaction is controlled by the mass, so good
friction between the tyres and the road is dependant on the coefficient of friction between the surfaces.
The formula for frictional force is merely a rearrangement of the formula for the coefficient of
friction.
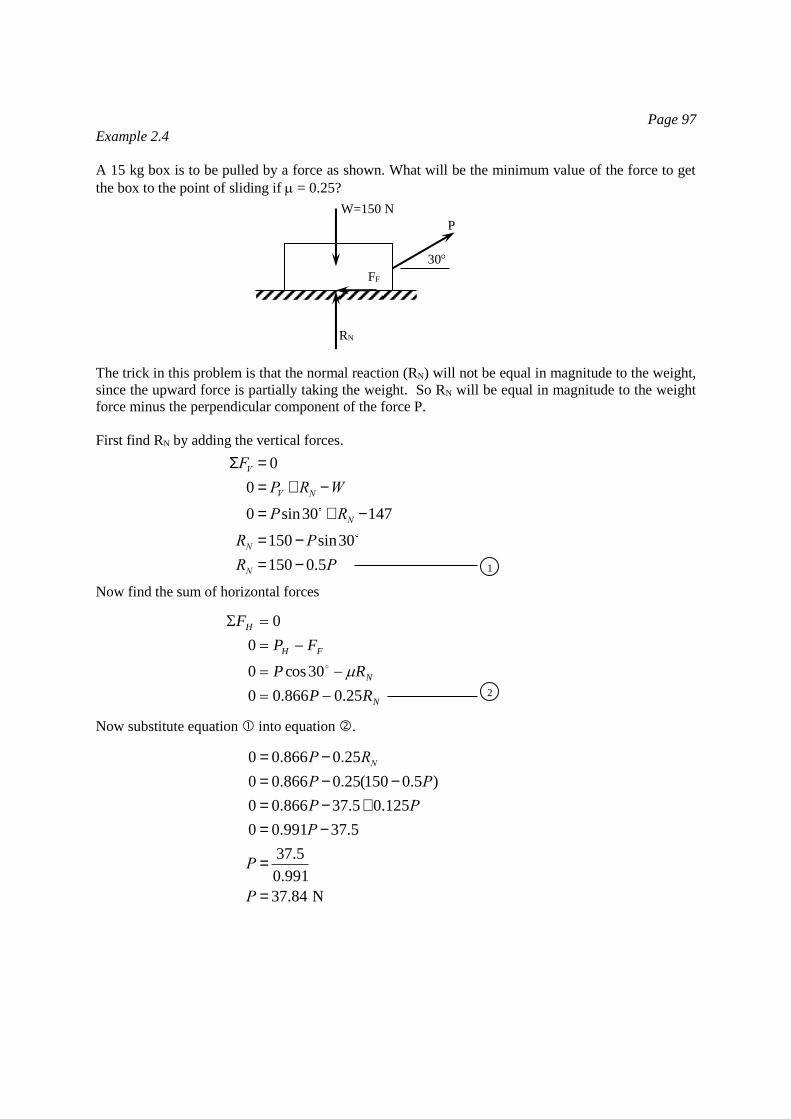
Example 2.3
What will be the frictional force present when a 10 kg box is pushed just to the point of sliding by
force P if = 0.5?
Since the applied force is vertical, RN will equal the weight force, so RN = 100 N
RN
30
W
RN
30
W
Situation 1 Situation 2
NF RF
P
W=1010=100 N
FF
RN
FF = mRN
FF = 0.5´100
FF = 50 N
Page 97
Example 2.4
A 15 kg box is to be pulled by a force as shown. What will be the minimum value of the force to get
the box to the point of sliding if = 0.25?
The trick in this problem is that the normal reaction (RN) will not be equal in magnitude to the weight,
since the upward force is partially taking the weight. So RN will be equal in magnitude to the weight
force minus the perpendicular component of the force P.
First find RN by adding the vertical forces.
Now find the sum of horizontal forces
Now substitute equation into equation .
P
W=150 N
FF
RN
30
SFV = 0
0 = PV + RN -W
0 = Psin30 + RN -147
RN =150 -Psin30
RN =150 - 0.5P
N
N
FH
H
RP
RP
FP
F
25.0866.00
30cos0
0
0
0 = 0.866P - 0.25RN
0 = 0.866P - 0.25(150 - 0.5P)
0 = 0.866P -37.5+ 0.125P
0 = 0.991P -37.5
P =37.5
0.991
P = 37.84 N
1
2
Page 99
Since tans= then s = tan-1, therefore s = tan-10.35=19.29
Now draw a force polygon of the three forces on the box. Since it is not yet moving the system must
be in equilibrium. Then use the sine rule to find R.
Therefore the force required to put the box at the point of sliding is 65.90 N. This problem could also
be solved graphically by drawing the force diagram to scale.
The mathematics involved in this method is far shorter than the mathematics required for Example
2.4. For this reason, many prefer to solve frictional problems using the angle of static friction.
Inclined planes
Frictional problems are well demonstrated by inclined planes and the angle of static friction is also
relevant. Below is an example of the effect of friction on a box on an inclined plane.
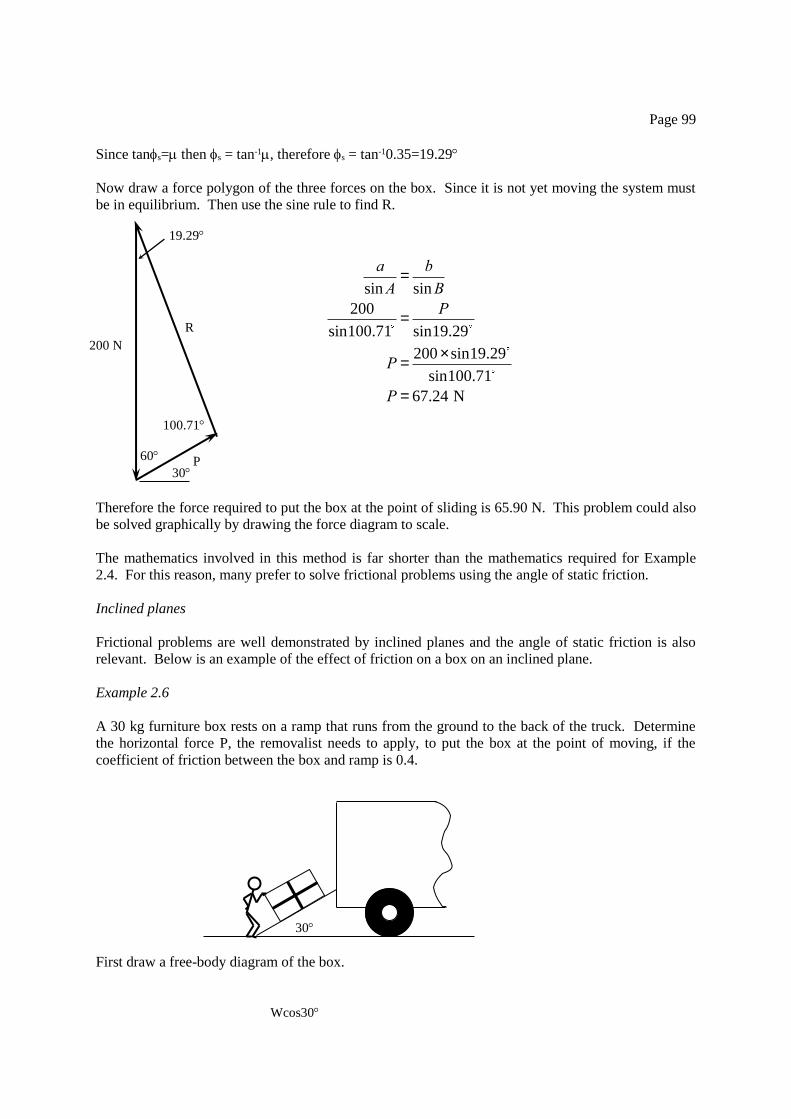
Example 2.6
A 30 kg furniture box rests on a ramp that runs from the ground to the back of the truck. Determine
the horizontal force P, the removalist needs to apply, to put the box at the point of moving, if the
coefficient of friction between the box and ramp is 0.4.
First draw a free-body diagram of the box.
30
60
19.29
200 N
P
R
a
sinA=b
sinB
200
sin100.71=
P
sin19.29
P =200 ´ sin19.29
sin100.71
P = 67.24 N
100.71
30
Wcos30
1
Page 100
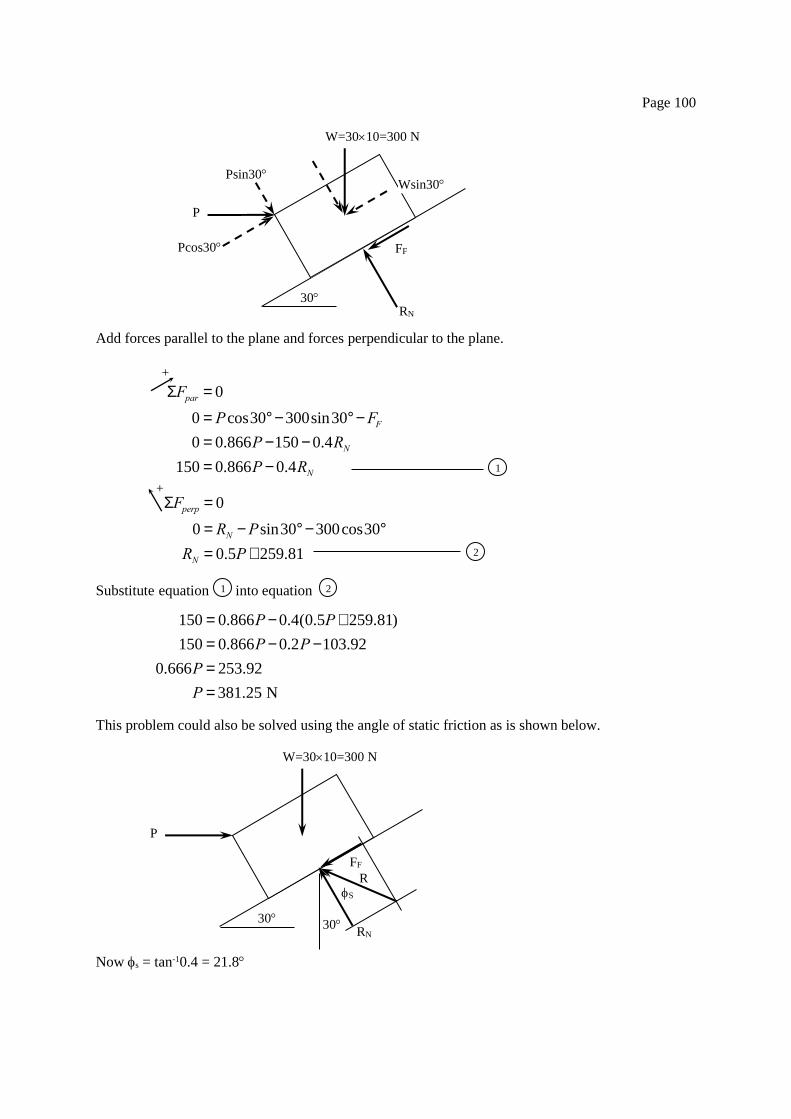
Add forces parallel to the plane and forces perpendicular to the plane.
Substitute equation into equation
This problem could also be solved using the angle of static friction as is shown below.
Now s = tan-10.4 = 21.8
30
W=3010=300 N
Wsin30
P
Psin30
Pcos30
RN
FF
SFpar = 0
0 = Pcos30°- 300sin30°-FF
0 = 0.866P -150 - 0.4RN
150 = 0.866P - 0.4RN
SFperp = 0
0 = RN -Psin30°-300cos30°
RN = 0.5P+ 259.81
150 = 0.866P- 0.4(0.5P+ 259.81)
150 = 0.866P- 0.2P -103.92
0.666P = 253.92
P = 381.25 N
+
+
30
W=3010=300 N
P
RN
FF
S
R
30
1
2
2
Page 101
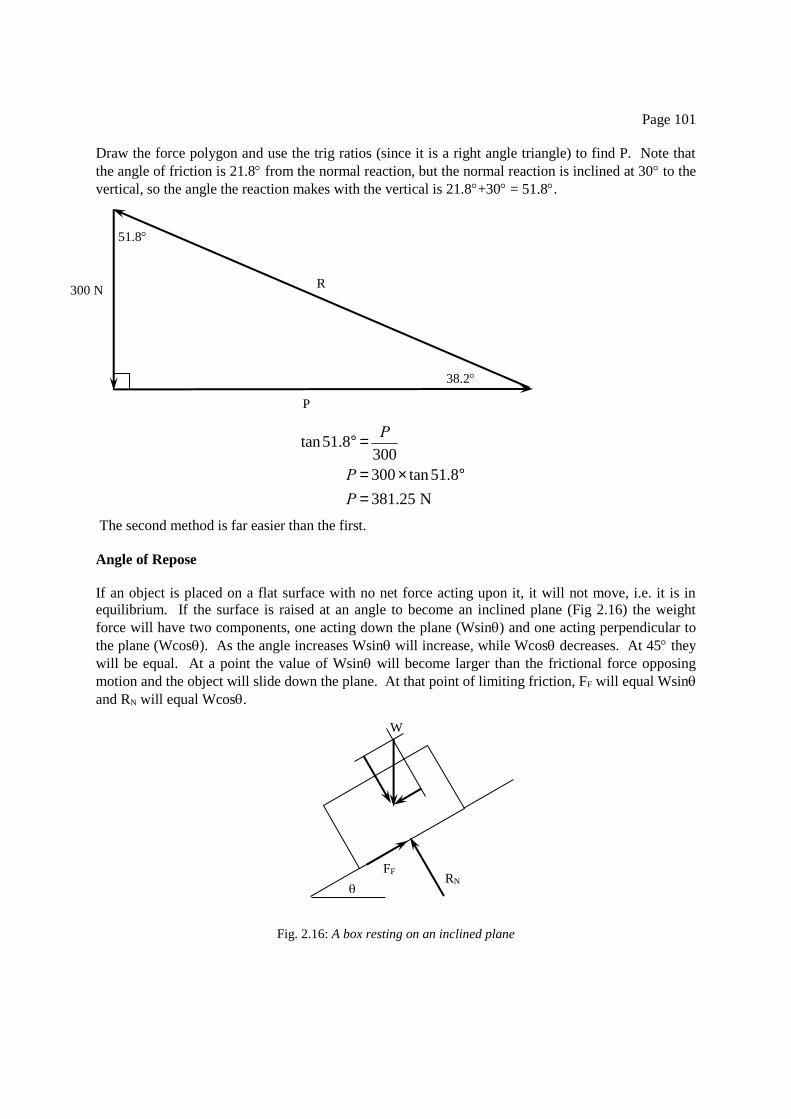
Draw the force polygon and use the trig ratios (since it is a right angle triangle) to find P. Note that
the angle of friction is 21.8 from the normal reaction, but the normal reaction is inclined at 30 to the
vertical, so the angle the reaction makes with the vertical is 21.8+30 = 51.8.
The second method is far easier than the first.
Angle of Repose
If an object is placed on a flat surface with no net force acting upon it, it will not move, i.e. it is in
equilibrium. If the surface is raised at an angle to become an inclined plane (Fig 2.16) the weight
force will have two components, one acting down the plane (Wsin) and one acting perpendicular to
the plane (Wcos). As the angle increases Wsin will increase, while Wcos decreases. At 45 they
will be equal. At a point the value of Wsin will become larger than the frictional force opposing
motion and the object will slide down the plane. At that point of limiting friction, FF will equal Wsin
and RN will equal Wcos.
Fig. 2.16: A box resting on an inclined plane
300 N
P
R
51.8
38.2
tan51.8° =P
300
P = 300 ´ tan51.8°
P = 381.25 N
W
RN FF
Page 103
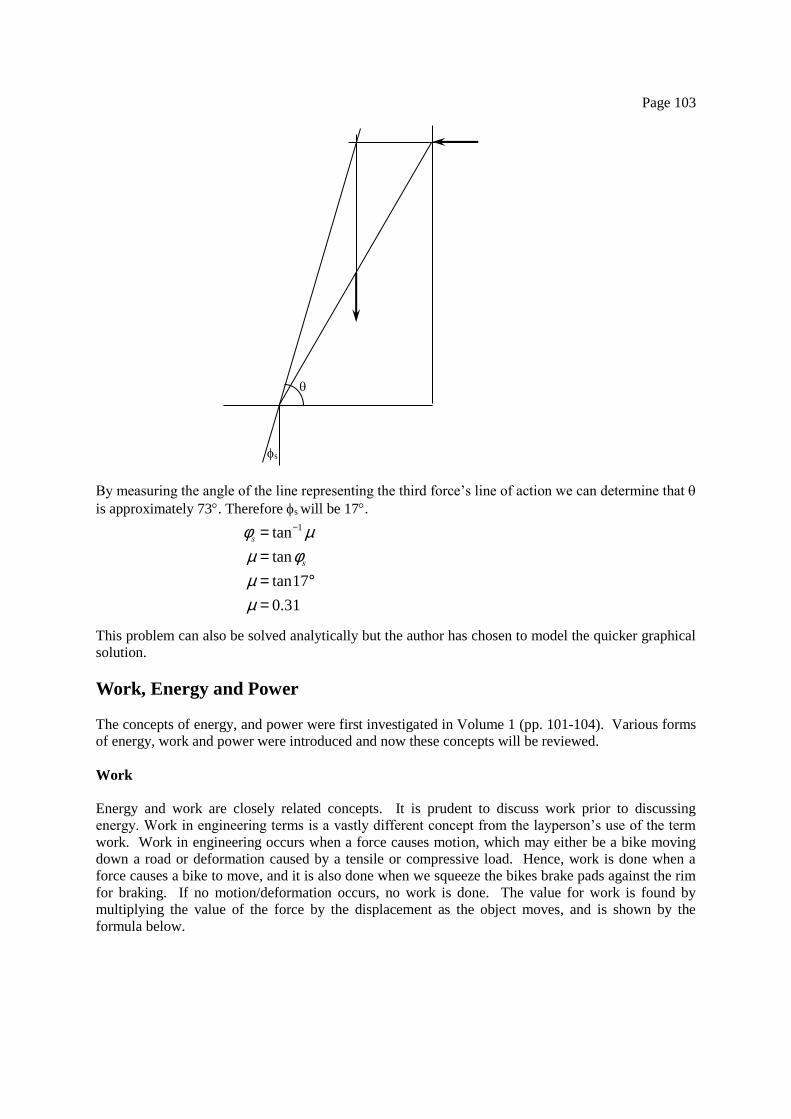
By measuring the angle of the line representing the third force’s line of action we can determine that
is approximately 73. Therefore s will be 17.
This problem can also be solved analytically but the author has chosen to model the quicker graphical
solution.
Work, Energy and Power
The concepts of energy, and power were first investigated in Volume 1 (pp. 101-104). Various forms
of energy, work and power were introduced and now these concepts will be reviewed.
Work
Energy and work are closely related concepts. It is prudent to discuss work prior to discussing
energy. Work in engineering terms is a vastly different concept from the layperson’s use of the term
work. Work in engineering occurs when a force causes motion, which may either be a bike moving
down a road or deformation caused by a tensile or compressive load. Hence, work is done when a
force causes a bike to move, and it is also done when we squeeze the bikes brake pads against the rim
for braking. If no motion/deformation occurs, no work is done. The value for work is found by
multiplying the value of the force by the displacement as the object moves, and is shown by the
formula below.
s
fs = tan-1 m
m = tanfs
m = tan17°
m = 0.31
Page 104
W = work (J)
F = force (N)
s = displacement of the object (m)
The unit for work is the Joule (J). One Joule is equivalent to one Newton moved one metre. Since
force and displacement are vector quantities, so is work. As a vector there can be negative and
positive work. Positive work occurs when work is done in the direction of the applied force and
negative work occurs when the work is done in the opposite direction to the applied force.
If the force doing work is at an angle to the horizontal, and the object is moving horizontally, the only
part of the force doing work is the horizontal component. Hence we need to multiply the horizontal
component of the force by its displacement. Another form of work may be done on the box when the
vertical component causes small deformations. This work is usually very small and therefore ignored.
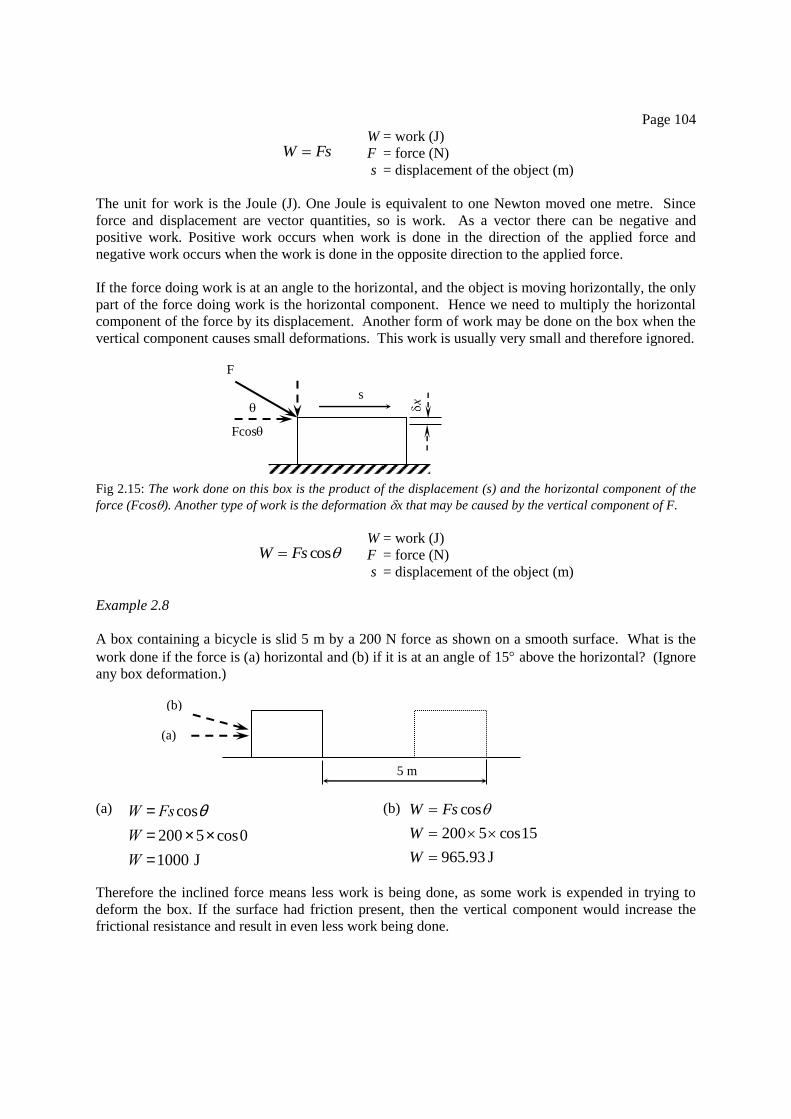
Fig 2.15: The work done on this box is the product of the displacement (s) and the horizontal component of the
force (Fcos). Another type of work is the deformation x that may be caused by the vertical component of F.
W = work (J)
F = force (N)
s = displacement of the object (m)
Example 2.8
A box containing a bicycle is slid 5 m by a 200 N force as shown on a smooth surface. What is the
work done if the force is (a) horizontal and (b) if it is at an angle of 15 above the horizontal? (Ignore
any box deformation.)
(a) (b)
Therefore the inclined force means less work is being done, as some work is expended in trying to
deform the box. If the surface had friction present, then the vertical component would increase the
frictional resistance and result in even less work being done.
FsW
cosFsW
W = Fscosq
W = 200 ´ 5´ cos0
W =1000 J
(b)
(a)
5 m
J 93.965
15cos5200
cos
W
W
FsW
F
s
Fcos
x

Page 106
In reality the loss in PE and the gain in KE is never exactly the same. The reason is that frictional
resistance and air resistance do negative work that opposes motion. A small amount of noise energy
would also be given off.
Fig. 2.16: A folding bicycle and rider is on a road at the top of a hill. They possess potential energy because of
the height above the lower portion of the road. This potential energy is lost as they coast down the hill, until at
the bottom all the potential energy has become kinetic energy.
For any object, the initial PE and KE, combined with any positive or negative work will be equal to
the final PE and KE combined. Mathematically this may be written as:
Consider the tricycle example in relation to numbers in Example 2.6.
Example 2.9
The folding bicycle in Fig 2.16 has a mass of 12 kg and the rider weighs 80 kg. What will be the
velocity of the bicycle after it coasts to the bottom the hill, if h = 20m and friction and air resistance is
ignored?
There are two ways to solve this problem.
Method 1 involves calculating the PE and then determining the velocity.
h
PE =mgh
PE = 92 ´10 ´ 20
PE =18400 N
ffii KEPEWKEPE
Page 107
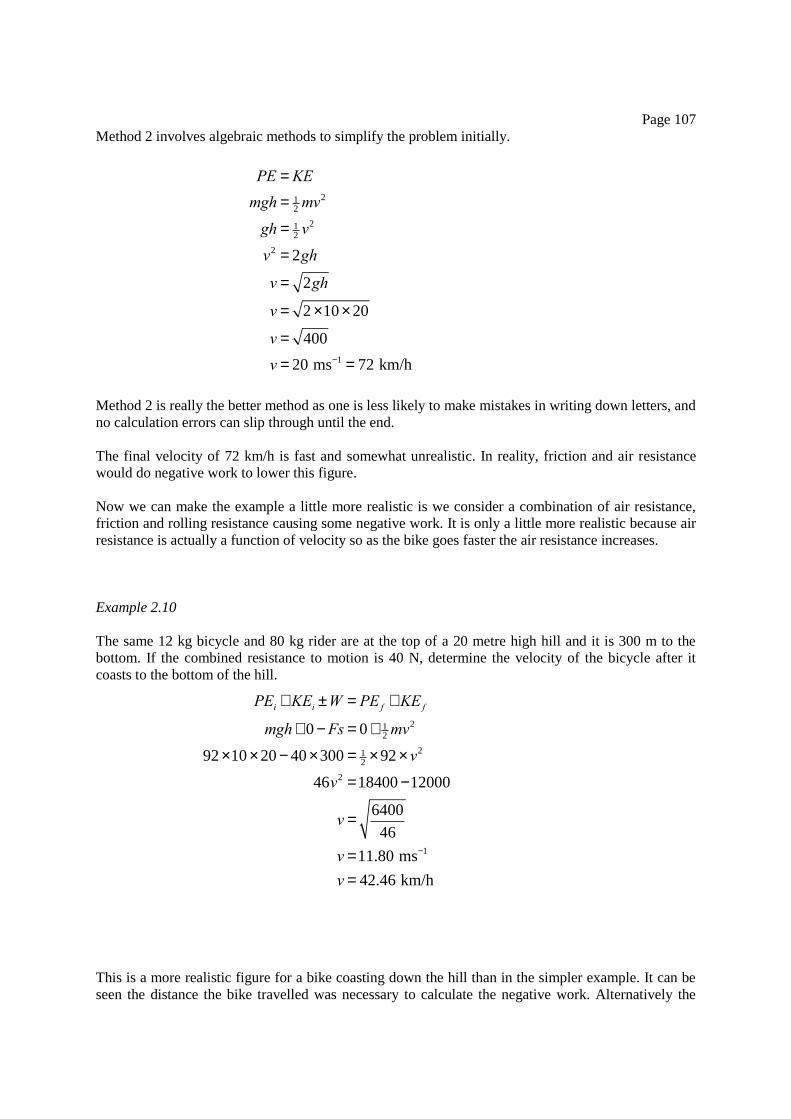
Method 2 involves algebraic methods to simplify the problem initially.
Method 2 is really the better method as one is less likely to make mistakes in writing down letters, and
no calculation errors can slip through until the end.
The final velocity of 72 km/h is fast and somewhat unrealistic. In reality, friction and air resistance
would do negative work to lower this figure.
Now we can make the example a little more realistic is we consider a combination of air resistance,
friction and rolling resistance causing some negative work. It is only a little more realistic because air
resistance is actually a function of velocity so as the bike goes faster the air resistance increases.
Example 2.10
The same 12 kg bicycle and 80 kg rider are at the top of a 20 metre high hill and it is 300 m to the
bottom. If the combined resistance to motion is 40 N, determine the velocity of the bicycle after it
coasts to the bottom of the hill.
This is a more realistic figure for a bike coasting down the hill than in the simpler example. It can be
seen the distance the bike travelled was necessary to calculate the negative work. Alternatively the
PE = KE
mgh = 12mv2
gh = 12v2
v2 = 2gh
v = 2gh
v = 2 ´10 ´ 20
v = 400
v = 20 ms-1 = 72 km/h
PEi +KEi ±W = PE f +KE f
mgh+ 0 -Fs = 0 + 12mv2
92 ´10 ´ 20 - 40 ´300 = 12´ 92 ´ v2
46v2 =18400 -12000
v =6400
46
v =11.80 ms-1
v = 42.46 km/h

problem could have given the angle of the hill and the distance travelled. The height is then found
using trigonometry.
Page 109
Power and Torque Figures – or, “Wow that car must be fast!”
Power figures are regularly quoted in transportation publications as an indicator of how effective a
motor is. This figure is only one indicator of how a motor performs. Another is the torque figure
which indicates the turning moment of the motor.
The power alone does not decide how fast a vehicle will be. A lighter, less powerful car may have a
better ratio of power to weight than a heavy car and hence perform better. Gearing also has an impact
on performance with the different gear ratios important determinants. A high torque figure means that
the vehicle climbs and pulls loads well.
Finally the power figure given for a motor is the power at the crankshaft. After the gearbox,
differential and drive shafts are taken into account, the power figure is considerably lower, so power
at the wheels may be 50% less than that at the crankshaft. This is because no engineered device is
ever 100% efficient and devices like gearboxes often sap considerable power with friction.
Example 2.11
A car is travelling at 110 km/h on a level section of freeway. If the total resistance to motion is 1.1
kN, determine the power the motor must expend to keep the car travelling at this velocity.
Remember we must convert the 110 km/h velocity into 30.56 ms-1.
Example 2.12
A bicycle and rider (total mass 92 kg) are ascending a hill of grade 1 in 30. Determine the power the
rider needs to expend to maintain a velocity of 20 km/h if the total resistance to motion is 30 N.
We must determine the force the rider must provide to overcome both the resistance to motion and the
force of his/her mass down the hill, which is mgsin.
P = Fv
P =1100 ´30.56
P = 33611.11 W
P » 33.6 kW
30
1
30 N

Page 110
The force provided by rider, FT, against weight and resistance is found by summing forces parallel to
the incline.
Now determine the power needed with a velocity of 20 km/h, which is 5.56 ms-1.
Engineering Materials
Testing of Materials
Hardness Tests
Table 2.1:
Hardness
Tests
Impact Tests
Impact tests are carried out to determine the notch toughness of a material. This is done by subjecting
the material to a concentrated shock load. Tough materials will not break as easily as a brittle
material.
Hardness Test Operation
Brinell A hardened steel ball is forced into an object under specified load
conditions. The diameter of the ball is dependent on the test piece’s
thickness. The hardness number is determined by measuring the depth and
surface area of the impression and using a formula, which also incorporates
the applied load.
Vickers
Here a small square pyramid is forced into a test piece under specified load
conditions; the hardness number is derived from a formula that contains the
load and area of the indentation. More useful for thin metals than the
Brinell test as the loads are lower and the indentor smaller.
Rockwell
This is a simple test that dispenses with the use of a formula. A diamond
cone (or sphere) is forced into a test piece under specified load conditions
and a reading is displayed on the dial. There are different scales for
different loads depending on the material tested. Rockwell hardness testers
are the most common hardness testers in schools as they sued to be provided
to NSW high schools.
Shore
Scleroscope
This test involves a small striker in a tube. The tube is placed over an item
and the striker is dropped, the height the striker rebounds from the item is a
measure of the hardness. Soft items will absorb more of the energy of the
falling striker giving a lower rebound than hard materials
SF = 0
0 = FT -mgsinq -FR
FT =mgsinq +FR
FT = 92 ´10 ´ sin1.91°+30
FT = 60.65 N
P = Fv
P = 60.65´ 5.56
P = 336.94 W
+

Page 139
For efficient smoothing of the DC output it is best if the product of the capacitance and the resistance
is 5 times the AC cycle time.
Example 2.13
What will be the required capacitor value for an AC (cycle = 0.02 s) rectifier if the resistor used has a
value of 390 ?
Therefore the capacitor required for this rectifier would be 256 F.
In rectifier circuits the smoothing capacitor is usually an electrolytic capacitor and the value lies in the
range from 470 F to 2200 F.
Electric Motors used in Transport Systems
Many years ago only DC motors were used in trains, partially because it was difficult to control AC
motors when the generator driven by the diesel engine produced DC. Nowadays, however, there are
AC induction motors used in diesel electric trains. In NSW older electric trains still run using DC
power, while newer electric trains now use AC motors. See Volume 1, pp 77-79 to review how
electric motors work.
DC Motors
Shunt wound motors are rarely used in locomotives. They have constant speed but low starting torque
and therefore not suitable if there is a lot of stopping and starting.
Series wound motors offer excellent torque at slow speeds and will operate at high speed under light
load. This makes them excellent for use in trains, and is a reason why they are widely used.
Compound motors combine the best features of the other two. Good starting torque and will not run
away under no-load conditions.
AC Motors
The AC motors used in trains are generally induction motors. Their great advantage is a lack of
commutator and brushes, which wear out over time. They rely on the frequency of the electricity and
magnetic induction for their power and. Their function is helped by generators being replaced by
alternators on diesel electric trains. Alternators produce AC so one would assume the use of an AC
motor would be easier.
02.011 RC
C1R1 = 5(0.02)
C1 =5(0.02)
R1
C1 =0.1
390
C1 = 2.56 ´10-4
C1 = 256 mF
CHAPTER 3
Page 170
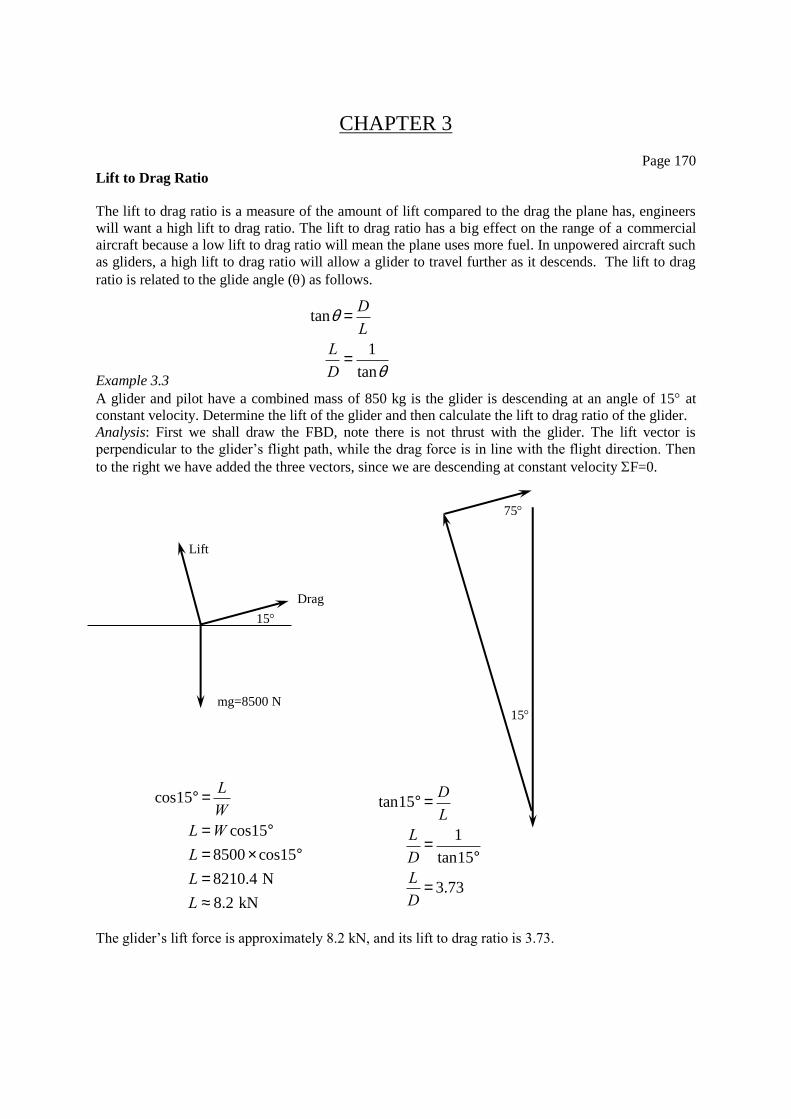
Lift to Drag Ratio
The lift to drag ratio is a measure of the amount of lift compared to the drag the plane has, engineers
will want a high lift to drag ratio. The lift to drag ratio has a big effect on the range of a commercial
aircraft because a low lift to drag ratio will mean the plane uses more fuel. In unpowered aircraft such
as gliders, a high lift to drag ratio will allow a glider to travel further as it descends. The lift to drag
ratio is related to the glide angle () as follows.
Example 3.3
A glider and pilot have a combined mass of 850 kg is the glider is descending at an angle of 15 at
constant velocity. Determine the lift of the glider and then calculate the lift to drag ratio of the glider.
Analysis: First we shall draw the FBD, note there is not thrust with the glider. The lift vector is
perpendicular to the glider’s flight path, while the drag force is in line with the flight direction. Then
to the right we have added the three vectors, since we are descending at constant velocity F=0.
The glider’s lift force is approximately 8.2 kN, and its lift to drag ratio is 3.73.
tanq =D
L
L
D=
1
tanq
15
Lift
Drag
mg=8500 N 15
75
cos15° =L
W
L =W cos15°
L = 8500 ´ cos15°
L = 8210.4 N
L » 8.2 kN
tan15° =D
L
L
D=
1
tan15°
L
D= 3.73
Page 174
Bending Stress (Airframes)
Bending stress as a concept was first visited in Chapter 1 in relation to beams. This type of bending
also occurs when an aircraft is in flight. To see this, consider the wing in Example 3.4.
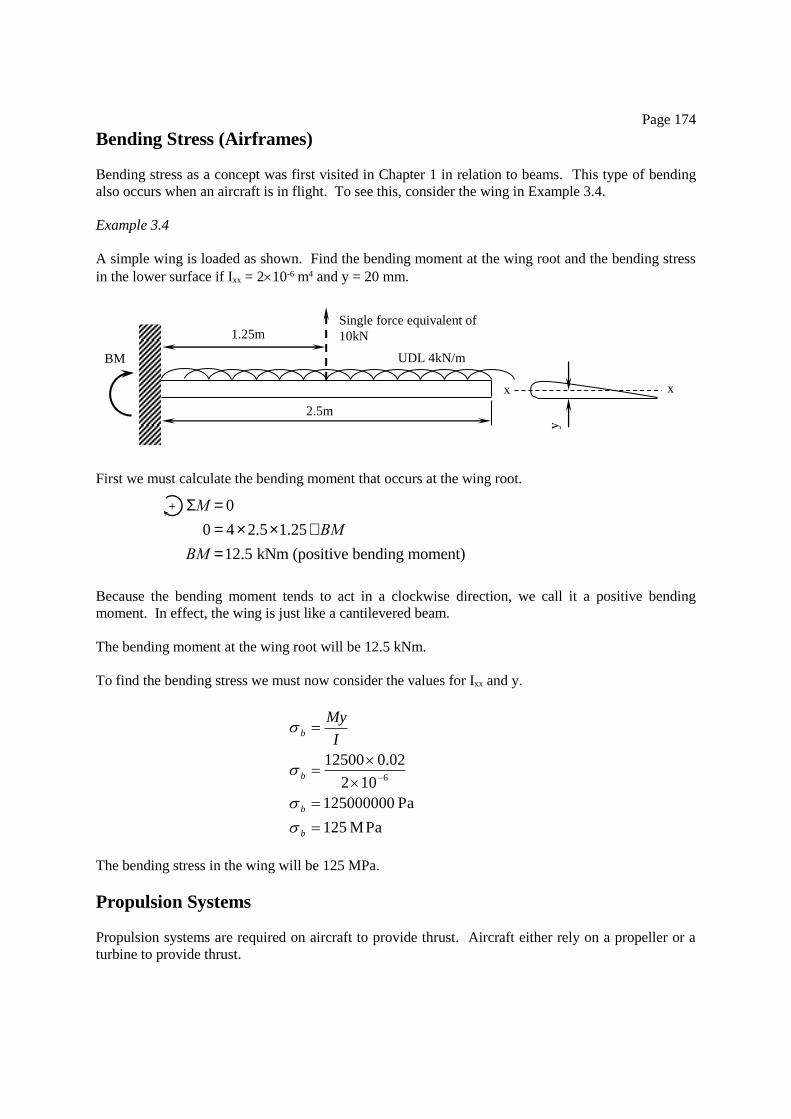
Example 3.4
A simple wing is loaded as shown. Find the bending moment at the wing root and the bending stress
in the lower surface if Ixx = 210-6 m4 and y = 20 mm.
First we must calculate the bending moment that occurs at the wing root.
Because the bending moment tends to act in a clockwise direction, we call it a positive bending
moment. In effect, the wing is just like a cantilevered beam.
The bending moment at the wing root will be 12.5 kNm.
To find the bending stress we must now consider the values for Ixx and y.
The bending stress in the wing will be 125 MPa.
Propulsion Systems
Propulsion systems are required on aircraft to provide thrust. Aircraft either rely on a propeller or a
turbine to provide thrust.
2.5m
x x
y
1.25m
Single force equivalent of
10kN
SM = 0
0 = 4´ 2.5´1.25+BM
BM =12.5 kNm (positive bending moment)
+
MPa 125
Pa 125000000
102
02.0125006
b
b
b
bI
My
UDL 4kN/m BM
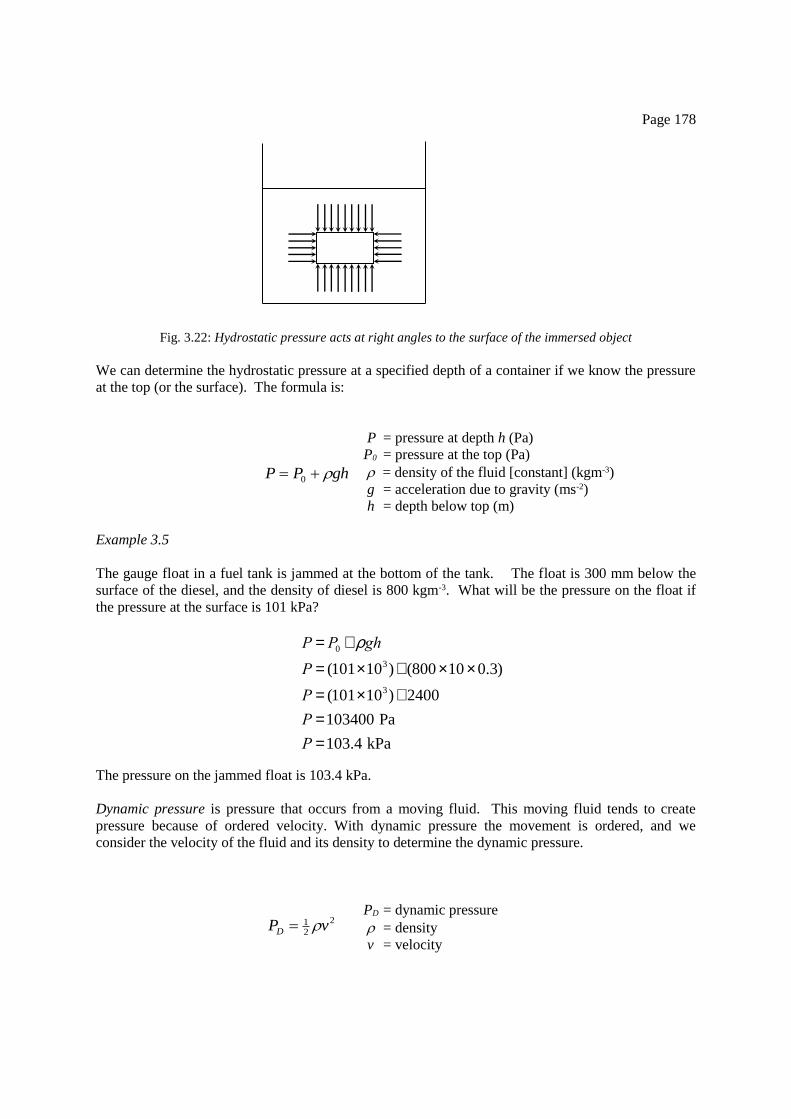
Page 178
Fig. 3.22: Hydrostatic pressure acts at right angles to the surface of the immersed object
We can determine the hydrostatic pressure at a specified depth of a container if we know the pressure
at the top (or the surface). The formula is:
P = pressure at depth h (Pa)
P0 = pressure at the top (Pa)
= density of the fluid [constant] (kgm-3)
g = acceleration due to gravity (ms-2)
h = depth below top (m)
Example 3.5
The gauge float in a fuel tank is jammed at the bottom of the tank. The float is 300 mm below the
surface of the diesel, and the density of diesel is 800 kgm-3. What will be the pressure on the float if
the pressure at the surface is 101 kPa?
The pressure on the jammed float is 103.4 kPa.
Dynamic pressure is pressure that occurs from a moving fluid. This moving fluid tends to create
pressure because of ordered velocity. With dynamic pressure the movement is ordered, and we
consider the velocity of the fluid and its density to determine the dynamic pressure.
PD = dynamic pressure
= density
v = velocity
2
21 vPD
P = P0 + rgh
P = (101´103)+ (800 ´10 ´ 0.3)
P = (101´103)+ 2400
P =103400 Pa
P =103.4 kPa
ghPP 0