Corporation of the Township ofTownship of Chapleau · Corporation of the Township ofTownship of...
142
Corporation of the Township of Township of Chapleau Municipal Asset Municipal Asset Management Plan December 31 st , 2013
Transcript of Corporation of the Township ofTownship of Chapleau · Corporation of the Township ofTownship of...
Corporation of the Township ofTownship of ChapleauMunicipal AssetMunicipal Asset Management Plan
December 31st, 2013
Asset Management Planning for the Township of ChapleauTable of Contents
Executive Summary
Chapter I – Introduction
Chapter II – State of Local Infrastructure
Chapter III – Desired Level of Servicep
Chapter IV – Asset Management Strategy
Chapter V – Financing Strategy
Chapter VI – Asset Management Plan Cross Reference
A diAppendices
Appendix A – Infrastructure Profile – Roads
Appendix B – Infrastructure Profile – Water
Appendix C – Infrastructure Profile – Wastewater and wastewater
Appendix D – Infrastructure Profile – Bridges and Structures
Appendix E – Infrastructure Profile – Buildings and Facilities
Appendix F – Infrastructure Profile – Vehicles
Appendix G – Life Cycle Profiles for Linear Assets
Appendix H – Costing Estimates for Life Cycle Activities
Appendix I Infrastructure Priority ClassificationsAppendix I – Infrastructure Priority Classifications
Appendix J – Financial Projections (Scenario 1)
Appendix K – Financial Projections (Scenario 2)
Appendix L – Financial Projections (Scenario 3)
Appendix M – Suggested Capital Financing Policy
© 2013 KPMG LLP, a Canadian limited liability partnership and a member firm of the KPMG network of independent member firms affiliated with KPMG International Cooperative (“KPMG International”), a Swiss entity. All rights reserved. KPMG CONFIDENTIAL.
1
Appendix N – Suggested Borrowing Policy
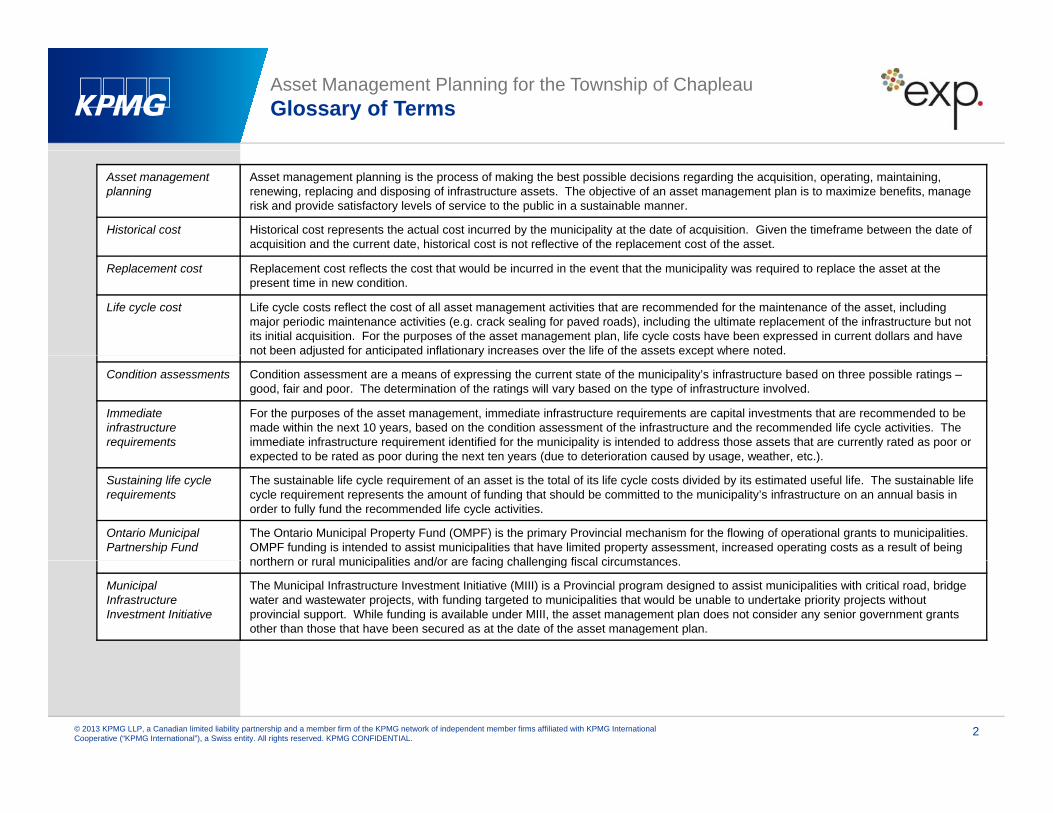
Asset Management Planning for the Township of ChapleauGlossary of Terms
Asset managementplanning
Asset management planning is the process of making the best possible decisions regarding the acquisition, operating, maintaining, renewing, replacing and disposing of infrastructure assets. The objective of an asset management plan is to maximize benefits, manage risk and provide satisfactory levels of service to the public in a sustainable manner.
Historical cost Historical cost represents the actual cost incurred by the municipality at the date of acquisition. Given the timeframe between the date of acquisition and the current date, historical cost is not reflective of the replacement cost of the asset.
Replacement cost Replacement cost reflects the cost that would be incurred in the event that the municipality was required to replace the asset at the present time in new condition.
Life cycle cost Life cycle costs reflect the cost of all asset management activities that are recommended for the maintenance of the asset, including major periodic maintenance activities (e.g. crack sealing for paved roads), including the ultimate replacement of the infrastructure but not its initial acquisition. For the purposes of the asset management plan, life cycle costs have been expressed in current dollars and have not been adjusted for anticipated inflationary increases over the life of the assets except where noted.j p y p
Condition assessments Condition assessment are a means of expressing the current state of the municipality’s infrastructure based on three possible ratings –good, fair and poor. The determination of the ratings will vary based on the type of infrastructure involved.
Immediateinfrastructure requirements
For the purposes of the asset management, immediate infrastructure requirements are capital investments that are recommended to be made within the next 10 years, based on the condition assessment of the infrastructure and the recommended life cycle activities. The immediate infrastructure requirement identified for the municipality is intended to address those assets that are currently rated as poor or expected to be rated as poor during the next ten years (due to deterioration caused by usage weather etc )expected to be rated as poor during the next ten years (due to deterioration caused by usage, weather, etc.).
Sustaining life cycle requirements
The sustainable life cycle requirement of an asset is the total of its life cycle costs divided by its estimated useful life. The sustainable life cycle requirement represents the amount of funding that should be committed to the municipality’s infrastructure on an annual basis in order to fully fund the recommended life cycle activities.
Ontario Municipal Partnership Fund
The Ontario Municipal Property Fund (OMPF) is the primary Provincial mechanism for the flowing of operational grants to municipalities. OMPF funding is intended to assist municipalities that have limited property assessment, increased operating costs as a result of being northern or rural municipalities and/or are facing challenging fiscal circumstancesnorthern or rural municipalities and/or are facing challenging fiscal circumstances.
Municipal InfrastructureInvestment Initiative
The Municipal Infrastructure Investment Initiative (MIII) is a Provincial program designed to assist municipalities with critical road, bridge water and wastewater projects, with funding targeted to municipalities that would be unable to undertake priority projects without provincial support. While funding is available under MIII, the asset management plan does not consider any senior government grants other than those that have been secured as at the date of the asset management plan.
© 2013 KPMG LLP, a Canadian limited liability partnership and a member firm of the KPMG network of independent member firms affiliated with KPMG International Cooperative (“KPMG International”), a Swiss entity. All rights reserved. KPMG CONFIDENTIAL.
2

Asset Management Planning for the Township of ChapleauGlossary of Terms
Anticipated asset life cycle
The anticipated asset life cycle is the estimated productive useful life of an asset or infrastructure component. At the end of the anticipate asset life cycle, the municipality will be required to replace the asset in question, either through acquisition or reconstruction.
Integrationopportunities
Integration opportunities represent potential groupings of different assets into a single project. For example, roads capital projects areoften integrated with water, wastewater and storm sewer replacements given that these systems are underneath (and accessed through) municipal roads.p
Rehabilitation and replacement criteria
Rehabilitation and replacement criteria are the factors considered by the municipality when consider when to undertake certain asset management activities.
Rehabilitation and replacement strategies
Rehabilitation and replacement strategies represent activities that are intended to maintain the condition and performance of the municipality’s infrastructure. Rehabilitation and replacement strategies are synonymous with asset management activities.
Life cycle consequences represent the expected outcomes in the event that the municipality does not undertake the recommended asset
Life cycle consequences
Life cycle consequences represent the expected outcomes in the event that the municipality does not undertake the recommended asset management activities during the recommended timeframes. Life cycle consequences can included but are not limited to deterioration of the physical condition of the asset, a reduction in the outputs and service potential of the assets, increased operating costs, higher costs for subsequent asset management activities than would otherwise have been incurred had the municipality undertaken the recommended asset management activities and/or a reduction in the estimated useful life of the asset.
Integratedt i iti
Where different assets can be integrated into capital projects, the integrated asset priorities determine the basis for selecting and prioritizing capital projects. For example, a municipality with a water and wastewater system that is in poor condition may prioritize road asset priorities p g p p j p , p y y p y pconstruction projects based on the condition of the underlying water and wastewater system.
© 2013 KPMG LLP, a Canadian limited liability partnership and a member firm of the KPMG network of independent member firms affiliated with KPMG International Cooperative (“KPMG International”), a Swiss entity. All rights reserved. KPMG CONFIDENTIAL.
3
Asset Management Planning for the Township of ChapleauExecutive Summary
The development of an asset management plan has been identified as a pre-requisite for the receipt of funding from the Province of Ontario (the ‘Province’) under the Municipal Infrastructure Investment Initiative (‘MIII’) and as such, represents an important first step in obtaining financing for necessary infrastructure investments. That said, planning for capital reinvestment is essential with or without the incentive provided under MIII, particularly given that a number of municipalities are now approaching end of useful life for significant components of their infrastructure.
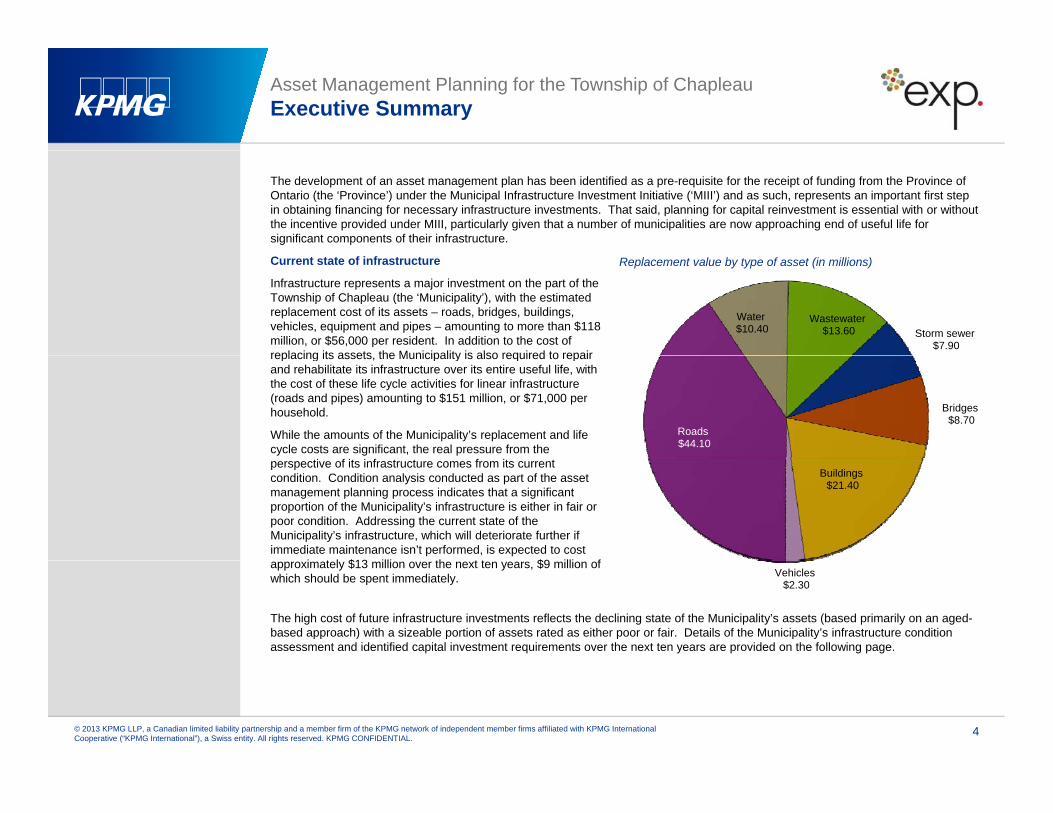
Replacement value by type of asset (in millions)
Water$10.40
Wastewater$13.60 Storm sewer
$7.90
Current state of infrastructure
Infrastructure represents a major investment on the part of the Township of Chapleau (the ‘Municipality’), with the estimated replacement cost of its assets – roads, bridges, buildings, vehicles, equipment and pipes – amounting to more than $118 million, or $56,000 per resident. In addition to the cost of replacing its assets the Municipality is also required to repair
Roads$44.10
Bridges$8.70
replacing its assets, the Municipality is also required to repair and rehabilitate its infrastructure over its entire useful life, with the cost of these life cycle activities for linear infrastructure (roads and pipes) amounting to $151 million, or $71,000 per household.
While the amounts of the Municipality’s replacement and life cycle costs are significant, the real pressure from the
Buildings$21.40
perspective of its infrastructure comes from its current condition. Condition analysis conducted as part of the asset management planning process indicates that a significant proportion of the Municipality’s infrastructure is either in fair or poor condition. Addressing the current state of the Municipality’s infrastructure, which will deteriorate further if immediate maintenance isn’t performed, is expected to cost
i t l $13 illi th t t $9 illi f
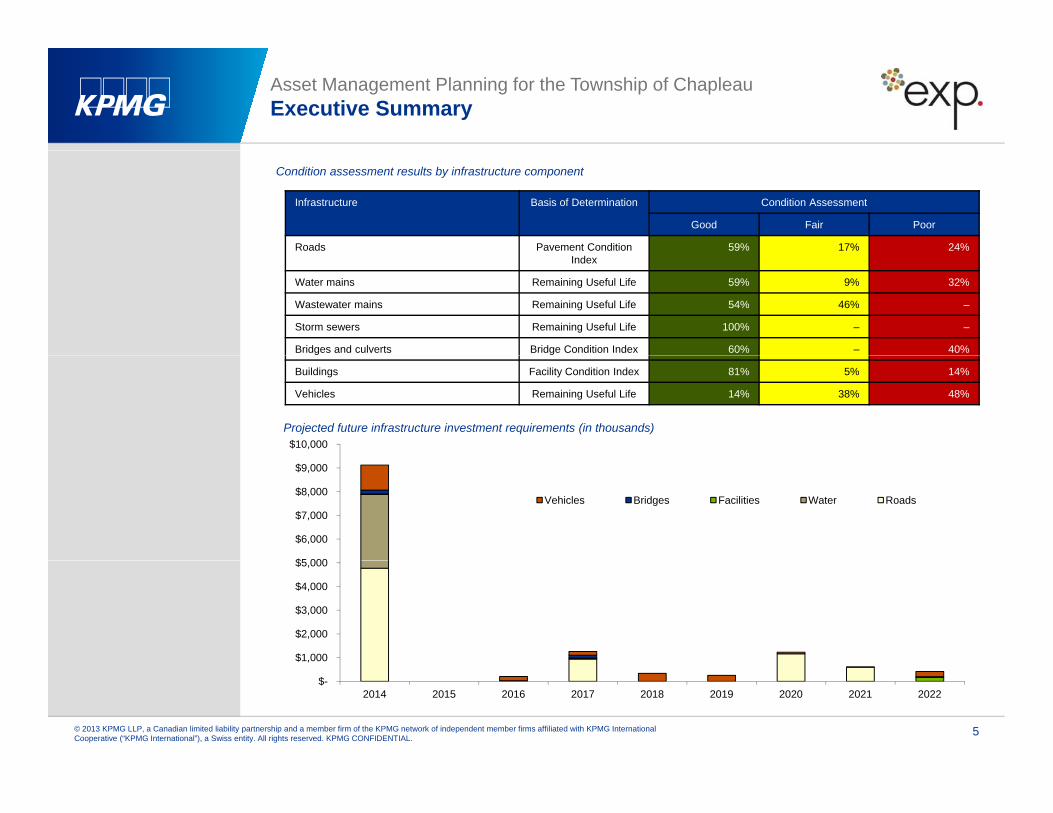
The high cost of future infrastructure investments reflects the declining state of the Municipality’s assets (based primarily on an aged-based approach) with a sizeable portion of assets rated as either poor or fair. Details of the Municipality’s infrastructure condition assessment and identified capital investment requirements over the next ten years are provided on the following page.
Vehicles$2.30
approximately $13 million over the next ten years, $9 million of which should be spent immediately.
© 2013 KPMG LLP, a Canadian limited liability partnership and a member firm of the KPMG network of independent member firms affiliated with KPMG International Cooperative (“KPMG International”), a Swiss entity. All rights reserved. KPMG CONFIDENTIAL.
4
Asset Management Planning for the Township of ChapleauExecutive Summary
Condition assessment results by infrastructure component
Infrastructure Basis of Determination Condition Assessment
Good Fair Poor
Roads Pavement Condition 59% 17% 24%Index
Water mains Remaining Useful Life 59% 9% 32%
Wastewater mains Remaining Useful Life 54% 46% ‒
Storm sewers Remaining Useful Life 100% ‒ ‒
Bridges and culverts Bridge Condition Index 60% ‒ 40%
Projected future infrastructure investment requirements (in thousands)
Buildings Facility Condition Index 81% 5% 14%
Vehicles Remaining Useful Life 14% 38% 48%
$10,000
$5 000
$6,000
$7,000
$8,000
$9,000
Vehicles Bridges Facilities Water Roads
$1,000
$2,000
$3,000
$4,000
$5,000
© 2013 KPMG LLP, a Canadian limited liability partnership and a member firm of the KPMG network of independent member firms affiliated with KPMG International Cooperative (“KPMG International”), a Swiss entity. All rights reserved. KPMG CONFIDENTIAL.
5
$-2014 2015 2016 2017 2018 2019 2020 2021 2022
Asset Management Planning for the Township of ChapleauExecutive Summary
Asset management strategies
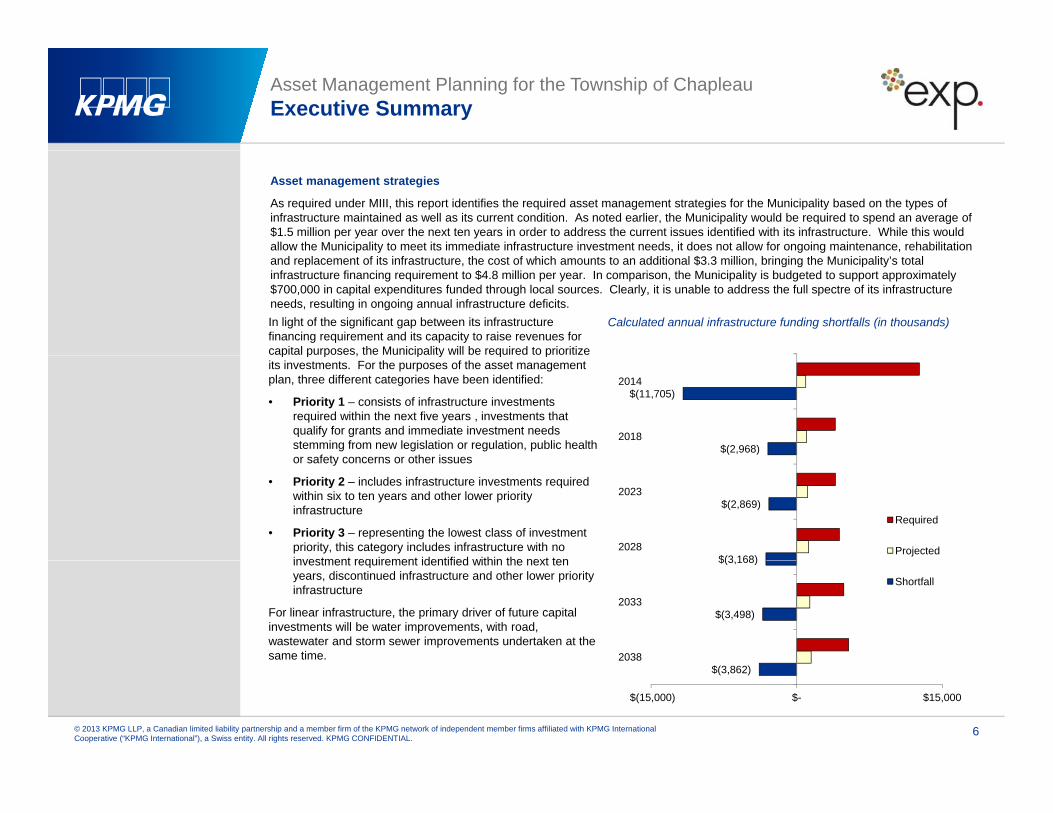
As required under MIII, this report identifies the required asset management strategies for the Municipality based on the types of infrastructure maintained as well as its current condition. As noted earlier, the Municipality would be required to spend an average of $1.5 million per year over the next ten years in order to address the current issues identified with its infrastructure. While this would allow the Municipality to meet its immediate infrastructure investment needs, it does not allow for ongoing maintenance, rehabilitation and replacement of its infrastructure, the cost of which amounts to an additional $3.3 million, bringing the Municipality’s total infrastructure financing requirement to $4.8 million per year. In comparison, the Municipality is budgeted to support approximately $700,000 in capital expenditures funded through local sources. Clearly, it is unable to address the full spectre of its infrastructure needs, resulting in ongoing annual infrastructure deficits.In light of the significant gap between its infrastructure financing requirement and its capacity to raise revenues for capital purposes, the Municipality will be required to prioritize
Calculated annual infrastructure funding shortfalls (in thousands)
p p p , p y q pits investments. For the purposes of the asset management plan, three different categories have been identified:
• Priority 1 – consists of infrastructure investments required within the next five years , investments that qualify for grants and immediate investment needs stemming from new legislation or regulation, public health or safety concerns or other issues
$(2,968)
$(11,705)
2018
2014
or safety concerns or other issues
• Priority 2 – includes infrastructure investments required within six to ten years and other lower priority infrastructure
• Priority 3 – representing the lowest class of investment priority, this category includes infrastructure with no investment requirement identified within the next ten $(3 168)
$(2,869)
2028
2023
Required
Projectedinvestment requirement identified within the next ten years, discontinued infrastructure and other lower priority infrastructure
For linear infrastructure, the primary driver of future capital investments will be water improvements, with road, wastewater and storm sewer improvements undertaken at the same time.
$(3,498)
$(3,168)
2038
2033
Shortfall
© 2013 KPMG LLP, a Canadian limited liability partnership and a member firm of the KPMG network of independent member firms affiliated with KPMG International Cooperative (“KPMG International”), a Swiss entity. All rights reserved. KPMG CONFIDENTIAL.
6
$(3,862)
$(15,000) $- $15,000
Asset Management Planning for the Township of ChapleauExecutive Summary
Financing strategy
While the Municipality is unable to unilaterally address its infrastructure-related financial requirement, it recognizes the need to begin to address the challenge. As part of its financing strategy, the Municipality is proposing the following measures intended to increase funding for capital requirements:
• Permanently protecting the current level of capital expenditures so as to provide a consistent stream of funding into the future;• Permanently protecting the current level of capital expenditures so as to provide a consistent stream of funding into the future;
• Introducing a five year capital levy that would see the total levy increase by 2%, with the new revenue allocated to capital purposes (i.e. not for operations). The capital levy would add approximately $40,000 per year to existing capital funding, representing a 31% increase in capital spending.
• Exploring the continued use of debt as a means of funding infrastructure requirements, including the adoption of a program whereby a fixed percentage of capital expenditures are financed through debt; and
• Upon the repayment of existing indebtedness, redirecting debt servicing costs to capital expenditures, capital reserves or new debt for capital projects so as to preserve existing funding for capital purposes; and
• Continuing to pursue grant programs provided by senior levels of government.
The issue of affordability
When considering the Municipality’s ability to fund its capital requirements and its entitlement for grants, there needs to be arecognition of the limited ability of the Municipality to finance its capital needs due to issues surrounding affordability. In addition to the affordability considerations developed by the Province under the revised OMPF model, it is also important to remember that:
• The Municipality’s population has decreased at a significantly faster rate than other communities and the Province as a whole. While the Province’s total population increased by 19.5% between 1996 and 2011, the Municipality’s population fell by 27.9% over the same period. The consequence of this trend is clear – fewer people in the community translates into fewer people able to fund municipal operationsto fund municipal operations.
• The Municipality’s residents have a higher degree of reliance on pension income (i.e. fixed income) as opposed to other communities. Overall, 17% of total reported personal income in the Municipality is derived from pensions, as opposed to the Provincial average of 14%. Additionally, the proportions of employment and pension income earned by the Municipality’s residents has changed significantly over the last decade, with employment income falling from 74% of reported personal incometo 68%, while pension income has increased from 16% to 17%. The consequences of this trend are also clear – those residents that remain within the Municipality are increasingly limited in their ability to afford ongoing taxation increases given the higher
© 2013 KPMG LLP, a Canadian limited liability partnership and a member firm of the KPMG network of independent member firms affiliated with KPMG International Cooperative (“KPMG International”), a Swiss entity. All rights reserved. KPMG CONFIDENTIAL.
7
reliance on fixed income sources.
Asset Management Planning for the Township of ChapleauExecutive Summary
About this plan
The Municipality’s asset management plan has been developed based on the guidance provided by the Province in Building Together – Guide for Municipal Asset Management Plans, which has been tailored to reflect the small size of the Municipality and the nature of its operations and infrastructure. Preparation of the plan involved Municipal staff as well as external financial and engineering advisors paid for through the MIII.
In completing the asset management plan for the Municipality:
• Accepted industry best practices were used for the development of the plan components, including the condition assessments, identification of life cycle requirements and estimated costs;
• The asset management plan was reviewed by Municipal council prior to adoption;
• The asset management plan was compared to the requirements under MIII to ensure compliance; andg p p q p ;
• Expressions of interest submitted to date have been based on the priorities identified in the asset management plan.
We would like to acknowledge the cooperation of Municipal staff in the preparation of this report.
© 2013 KPMG LLP, a Canadian limited liability partnership and a member firm of the KPMG network of independent member firms affiliated with KPMG International Cooperative (“KPMG International”), a Swiss entity. All rights reserved. KPMG CONFIDENTIAL.
8

Asset Management PlanningAsset Management Planning for the Township of Chapleau
Chapter IChapter IIntroduction
IntroductionOverview of the Asset Management Plan
Asset management planning defined
Asset management planning is the process of making the best possible decisions regarding the acquisition, operating, maintaining, renewing, replacing and disposing of infrastructure assets. The objective of an asset management plan is to maximize benefits, manage risk and provide satisfactory levels of service to the public in a sustainable manner. In order to be effective, an asset management plan needs to be based on a thorough understanding of the characteristics and condition of infrastructure assets, as well as the service levels expected from them. Recognizing that funding for infrastructure acquisition and maintenance is oftenlimited, a key element of an asset management plan is the setting of strategic priorities to optimize decision-making as to when and how to proceed with investments. The ultimate success or failure of an asset management plan is dependent on the associated financing strategy, which will identify and secure the funds necessary for asset management activities and allow the Municipality to move from planning to execution.
The purpose of the asset management
The asset management plan outlines the Municipality’s planned approach for the acquisition and maintenance of its infrastructure, which in turn allows the Municipality to meet its stated mission and mandate by supporting the delivery of services to its residents. In achieving this objective, the asset management plan:
• Provides elected officials, Municipal staff, funding agencies, community stakeholders and residents with an indication of theMunicipality’s investment in infrastructure and its current condition;
• Outlines the total financial requirement associated with the management of this infrastructure investment, based on recommended asset management practices that encompass the total life cycle of the assets;
• Prioritizes the Municipality’s infrastructure needs, recognizing that the scope of the financial requirement is beyond the capabilities of the Municipality and that some form of prioritization is required; and
• Presents a financial strategy that outlines how the Municipality intends to meet its infrastructure requirements.
It is important to recognize that the asset management plan is just that – a plan. The asset management plan (which has been prepared for the purposes of meeting the requirements of the Municipal Infrastructure Investment Initiative) does not represent a formal, multi-year budget for the Municipality. The approval of operating and capital budgets is undertaken as part of the Municipality’s overall annual budget process. Accordingly, the financial performance and priorities outlined in the asset management plan are subject to change based on future decisions of Council with respect to operating and capital costs, taxation levels andchanges to regulatory requirements or the condition of the Municipality’s infrastructure.
© 2013 KPMG LLP, a Canadian limited liability partnership and a member firm of the KPMG network of independent member firms affiliated with KPMG International Cooperative (“KPMG International”), a Swiss entity. All rights reserved. KPMG CONFIDENTIAL.
10
IntroductionScope of the Asset Management Plan
The asset management plan encompasses the following components of the Municipality’s infrastructure:
Transportation Infrastructure Water and Wastewater Infrastructure Other Infrastructure
• Roads• Bridges and culverts
• Treatment facilities• Water distribution system
• Vehicles• Facilities
For the purposes of developing the asset management plan, a 25-year planning horizon was considered, although the analysis includes a discussion of required activities over the entire life cycle of the Municipality’s infrastructure. It is expected that the Municipality will update its asset management plan every four years (to coincide with Council elections) or earlier in the event of a
j h i i t hi h ld i l d
Bridges and culverts• Streetlights• Storm sewers
Water distribution system• Wastewater collection system
Facilities• Airport (submitted under separate
cover)
major change in circumstances, which could include:
• New funding programs for infrastructure
• Unforeseen failure of a significantinfrastructure component
• Regulatory changes that have a significant impact on infrastructure requirements
• Changes to the Municipality’s economic or demographic profile (positive or negative), which would impact on the nature and i l l f it i f t tservice level of its infrastructure
© 2013 KPMG LLP, a Canadian limited liability partnership and a member firm of the KPMG network of independent member firms affiliated with KPMG International Cooperative (“KPMG International”), a Swiss entity. All rights reserved. KPMG CONFIDENTIAL.
11
IntroductionMethodology
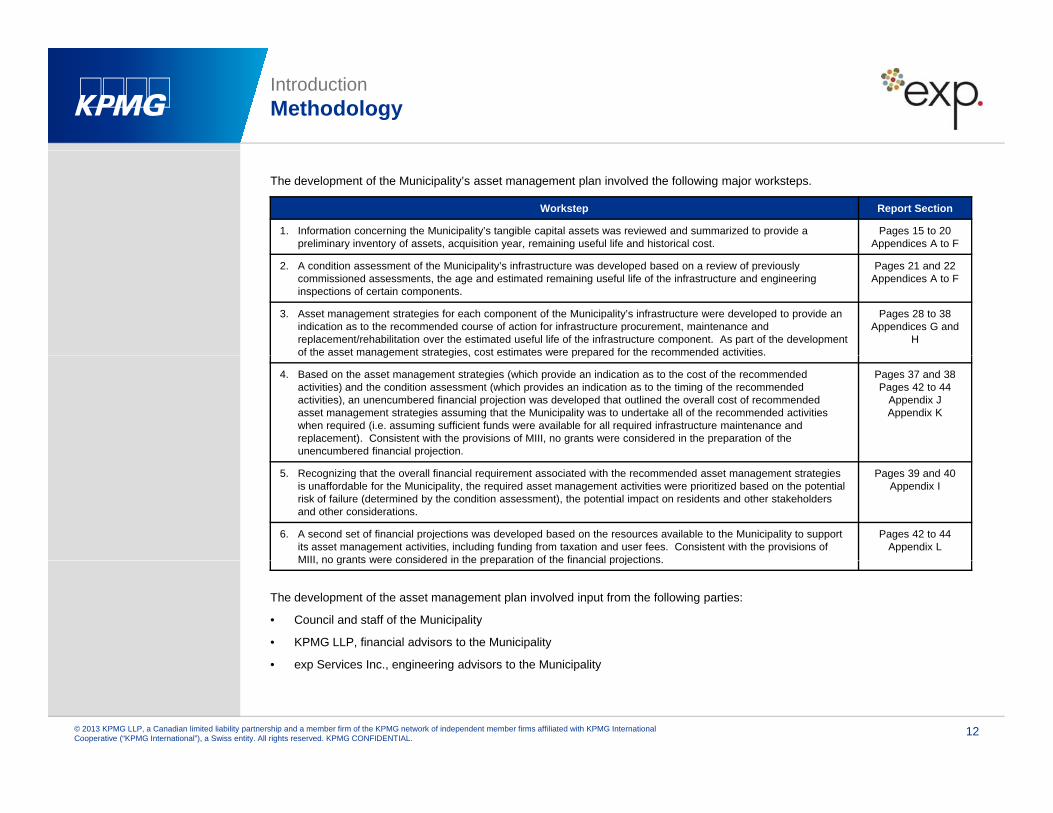
The development of the Municipality’s asset management plan involved the following major worksteps.
Workstep Report Section
1. Information concerning the Municipality’s tangible capital assets was reviewed and summarized to provide a preliminary inventory of assets, acquisition year, remaining useful life and historical cost.
Pages 15 to 20Appendices A to F
2. A condition assessment of the Municipality’s infrastructure was developed based on a review of previously commissioned assessments, the age and estimated remaining useful life of the infrastructure and engineering inspections of certain components.
Pages 21 and 22Appendices A to F
3. Asset management strategies for each component of the Municipality’s infrastructure were developed to provide an indication as to the recommended course of action for infrastructure procurement, maintenance and replacement/rehabilitation over the estimated useful life of the infrastructure component. As part of the development of the asset management strategies, cost estimates were prepared for the recommended activities.
Pages 28 to 38Appendices G and
Hof the asset management strategies, cost estimates were prepared for the recommended activities.
4. Based on the asset management strategies (which provide an indication as to the cost of the recommended activities) and the condition assessment (which provides an indication as to the timing of the recommended activities), an unencumbered financial projection was developed that outlined the overall cost of recommended asset management strategies assuming that the Municipality was to undertake all of the recommended activities when required (i.e. assuming sufficient funds were available for all required infrastructure maintenance and replacement). Consistent with the provisions of MIII, no grants were considered in the preparation of the unencumbered financial projection.
Pages 37 and 38Pages 42 to 44
Appendix JAppendix K
5. Recognizing that the overall financial requirement associated with the recommended asset management strategies is unaffordable for the Municipality, the required asset management activities were prioritized based on the potential risk of failure (determined by the condition assessment), the potential impact on residents and other stakeholders and other considerations.
Pages 39 and 40Appendix I
6. A second set of financial projections was developed based on the resources available to the Municipality to support its asset management activities, including funding from taxation and user fees. Consistent with the provisions of MIII no grants were considered in the preparation of the financial projections
Pages 42 to 44Appendix L
The development of the asset management plan involved input from the following parties:
• Council and staff of the Municipality
• KPMG LLP, financial advisors to the Municipality
• exp Services Inc engineering advisors to the Municipality
MIII, no grants were considered in the preparation of the financial projections.
© 2013 KPMG LLP, a Canadian limited liability partnership and a member firm of the KPMG network of independent member firms affiliated with KPMG International Cooperative (“KPMG International”), a Swiss entity. All rights reserved. KPMG CONFIDENTIAL.
12
• exp Services Inc., engineering advisors to the Municipality
IntroductionEvaluating and Improving the Asset Management Plan
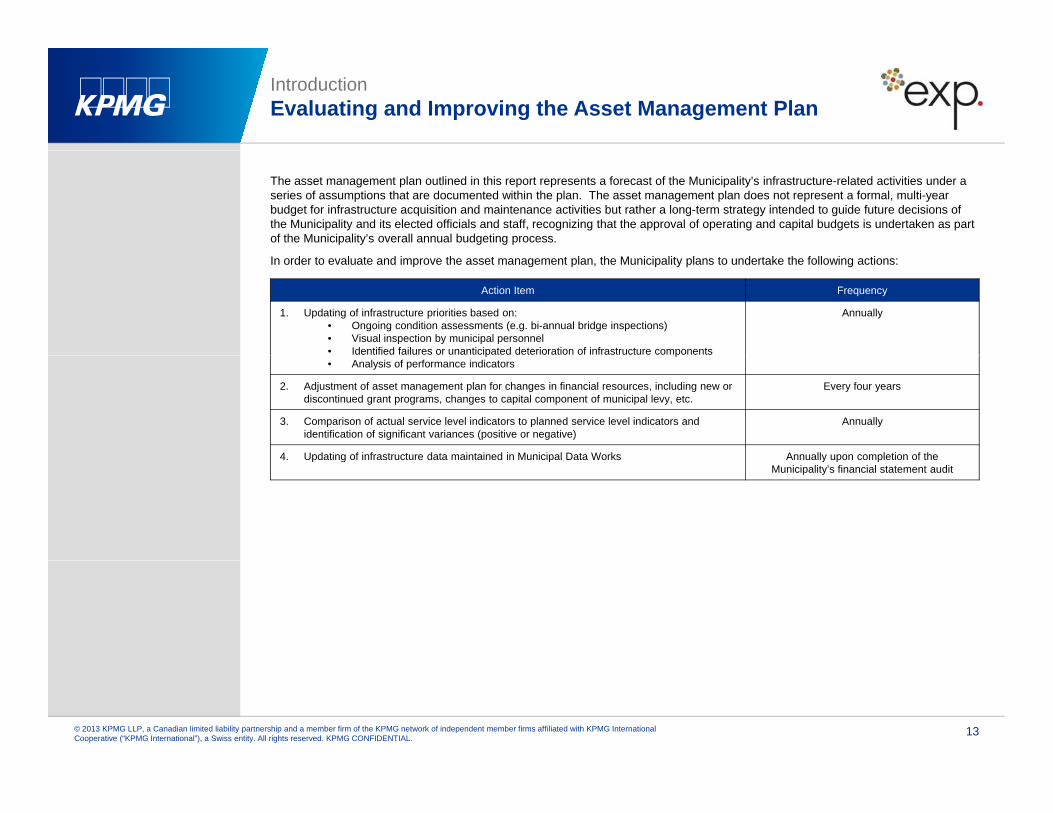
The asset management plan outlined in this report represents a forecast of the Municipality’s infrastructure-related activities under a series of assumptions that are documented within the plan. The asset management plan does not represent a formal, multi-year budget for infrastructure acquisition and maintenance activities but rather a long-term strategy intended to guide future decisions of the Municipality and its elected officials and staff, recognizing that the approval of operating and capital budgets is undertaken as part of the Municipality’s overall annual budgeting process.
In order to evaluate and improve the asset management plan, the Municipality plans to undertake the following actions:
Action Item Frequency
1. Updating of infrastructure priorities based on:• Ongoing condition assessments (e.g. bi-annual bridge inspections)• Visual inspection by municipal personnel• Identified failures or unanticipated deterioration of infrastructure components
Annually
p p• Analysis of performance indicators
2. Adjustment of asset management plan for changes in financial resources, including new or discontinued grant programs, changes to capital component of municipal levy, etc.
Every four years
3. Comparison of actual service level indicators to planned service level indicators and identification of significant variances (positive or negative)
Annually
4 Updating of infrastructure data maintained in Municipal Data Works Annually upon completion of the4. Updating of infrastructure data maintained in Municipal Data Works Annually upon completion of the Municipality’s financial statement audit
© 2013 KPMG LLP, a Canadian limited liability partnership and a member firm of the KPMG network of independent member firms affiliated with KPMG International Cooperative (“KPMG International”), a Swiss entity. All rights reserved. KPMG CONFIDENTIAL.
13
IntroductionRestrictions
This report is based on information and documentation that was made available to KPMG at the date of this report. KPMG has not audited nor otherwise attempted to independently verify the information provided unless otherwise indicated. Should additional information be provided to KPMG after the issuance of this report, KPMG reserves the right (but will be under no obligation) to review this information and adjust its comments accordingly.
Pursuant to the terms of our engagement, it is understood and agreed that all decisions in connection with the implementation ofadvice and recommendations as provided by KPMG during the course of this engagement shall be the responsibility of, and made by,the Township of Chapleau. KPMG has not and will not perform management functions or make management decisions for the Township of Chapleau.
This report includes or makes reference to future oriented financial information. Readers are cautioned that since these financial projections are based on assumptions regarding future events, actual results will vary from the information presented even if the hypotheses occur, and the variations may be material.
Comments in this report are not intended, nor should they be interpreted to be, legal advice or opinion.
KPMG has no present or contemplated interest in the Township of Chapleau nor are we an insider or associate of the Township of Chapleau or its management team. Our fees for this engagement are not contingent upon our findings or any other event. Accordingly, we believe we are independent of the Township of Chapleau and are acting objectively.
© 2013 KPMG LLP, a Canadian limited liability partnership and a member firm of the KPMG network of independent member firms affiliated with KPMG International Cooperative (“KPMG International”), a Swiss entity. All rights reserved. KPMG CONFIDENTIAL.
14
Asset Management PlanningAsset Management Planning for the Township of Chapleau
Chapter IIChapter IIState of Local Infrastructure
State of Local InfrastructureOverview of the Municipality’s Infrastructure
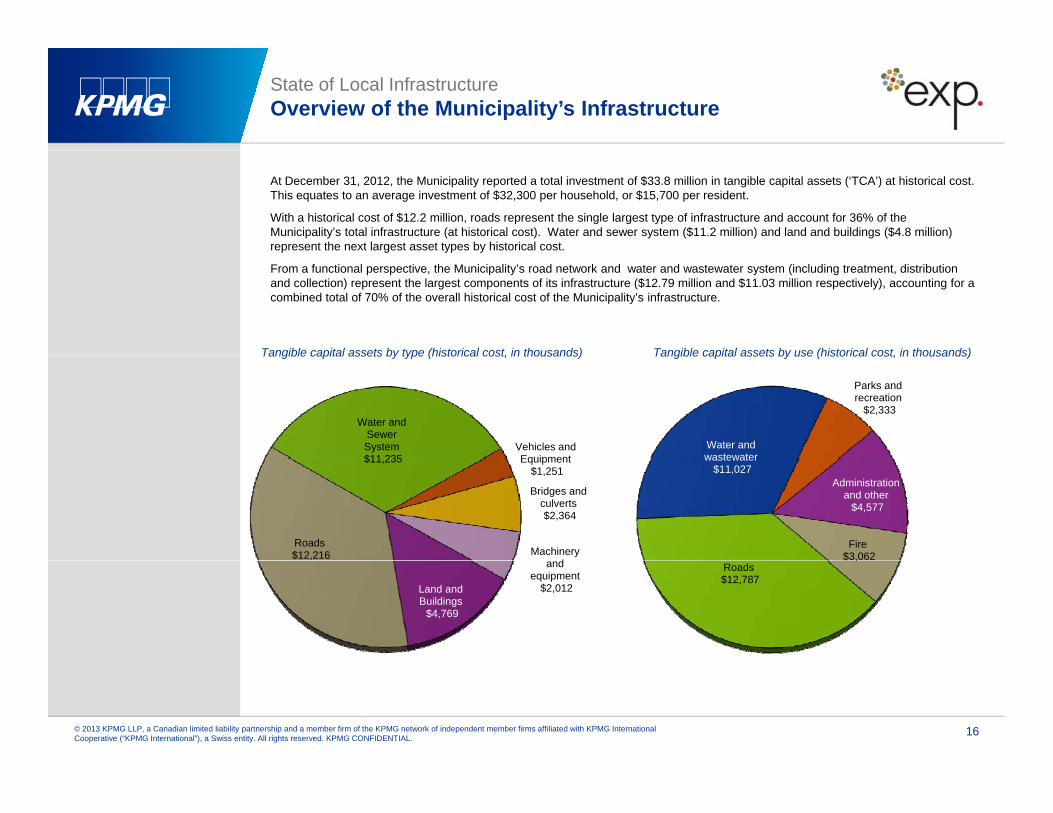
At December 31, 2012, the Municipality reported a total investment of $33.8 million in tangible capital assets (‘TCA’) at historical cost. This equates to an average investment of $32,300 per household, or $15,700 per resident.
With a historical cost of $12.2 million, roads represent the single largest type of infrastructure and account for 36% of theMunicipality’s total infrastructure (at historical cost). Water and sewer system ($11.2 million) and land and buildings ($4.8 million) represent the next largest asset types by historical cost.
From a functional perspective, the Municipality’s road network and water and wastewater system (including treatment, distribution and collection) represent the largest components of its infrastructure ($12.79 million and $11.03 million respectively), accounting for a combined total of 70% of the overall historical cost of the Municipality’s infrastructure.
Tangible capital assets by type (historical cost, in thousands) Tangible capital assets by use (historical cost, in thousands)
Water and Sewer System$11 235
Vehicles and Equipment
Tangible capital assets by type (historical cost, in thousands)
Water and wastewater
Parks and recreation
$2,333
Tangible capital assets by use (historical cost, in thousands)
Roads$12,216
$11,235 Equipment$1,251
Bridges and culverts$2,364
Machinery d
Administration and other
$4,577
Fire$3,062
wastewater$11,027
Land and Buildings
$4,769
and equipment
$2,012
$ ,Roads$12,787
© 2013 KPMG LLP, a Canadian limited liability partnership and a member firm of the KPMG network of independent member firms affiliated with KPMG International Cooperative (“KPMG International”), a Swiss entity. All rights reserved. KPMG CONFIDENTIAL.
16
State of Local InfrastructureOverview of the Municipality’s Infrastructure
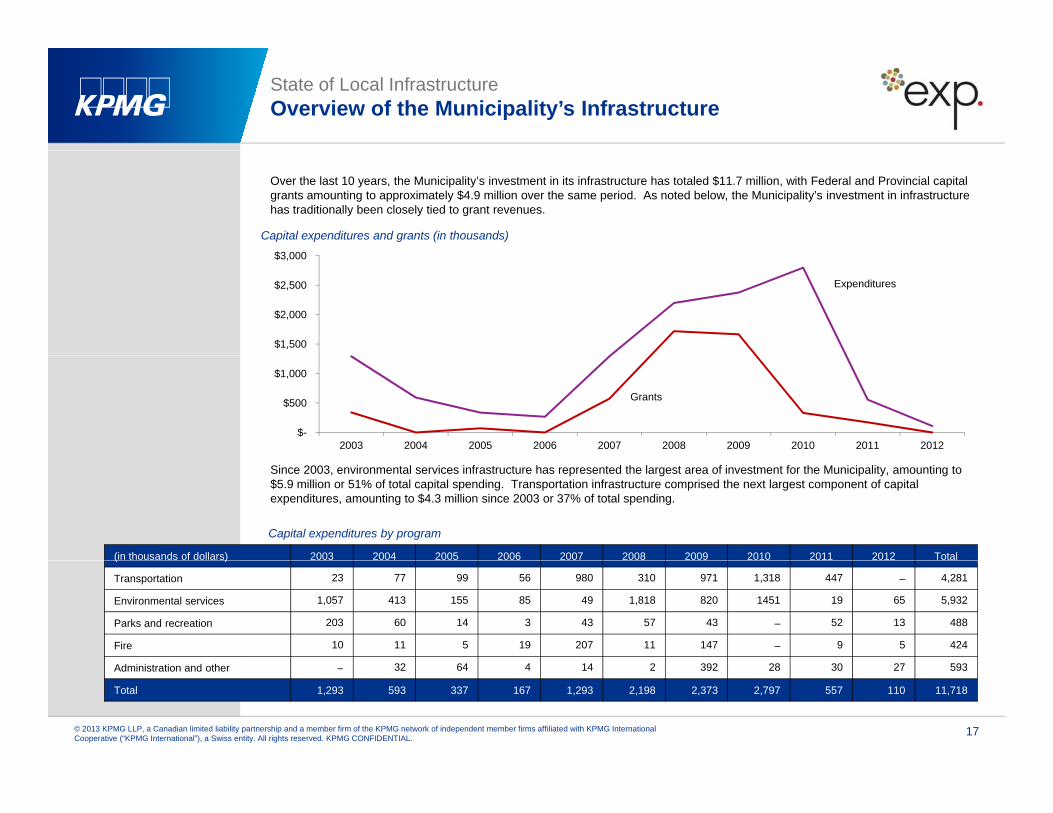
Over the last 10 years, the Municipality’s investment in its infrastructure has totaled $11.7 million, with Federal and Provincial capital grants amounting to approximately $4.9 million over the same period. As noted below, the Municipality’s investment in infrastructure has traditionally been closely tied to grant revenues.
$3 000
Capital expenditures and grants (in thousands)
$1,500
$2,000
$2,500
$3,000
Expenditures
$-
$500
$1,000
2003 2004 2005 2006 2007 2008 2009 2010 2011 2012
Grants
Since 2003, environmental services infrastructure has represented the largest area of investment for the Municipality, amounting to $5.9 million or 51% of total capital spending. Transportation infrastructure comprised the next largest component of capitalexpenditures, amounting to $4.3 million since 2003 or 37% of total spending.
(in thousands of dollars) 2003 2004 2005 2006 2007 2008 2009 2010 2011 2012 Total
Capital expenditures by program
( )
Transportation 23 77 99 56 980 310 971 1,318 447 ‒ 4,281
Environmental services 1,057 413 155 85 49 1,818 820 1451 19 65 5,932
Parks and recreation 203 60 14 3 43 57 43 ‒ 52 13 488
Fire 10 11 5 19 207 11 147 ‒ 9 5 424
32 64 4 14 2 392 28 30 2 93
© 2013 KPMG LLP, a Canadian limited liability partnership and a member firm of the KPMG network of independent member firms affiliated with KPMG International Cooperative (“KPMG International”), a Swiss entity. All rights reserved. KPMG CONFIDENTIAL.
17
Administration and other ‒ 32 64 4 14 2 392 28 30 27 593
Total 1,293 593 337 167 1,293 2,198 2,373 2,797 557 110 11,718
State of Local InfrastructureOverview of the Municipality’s Infrastructure
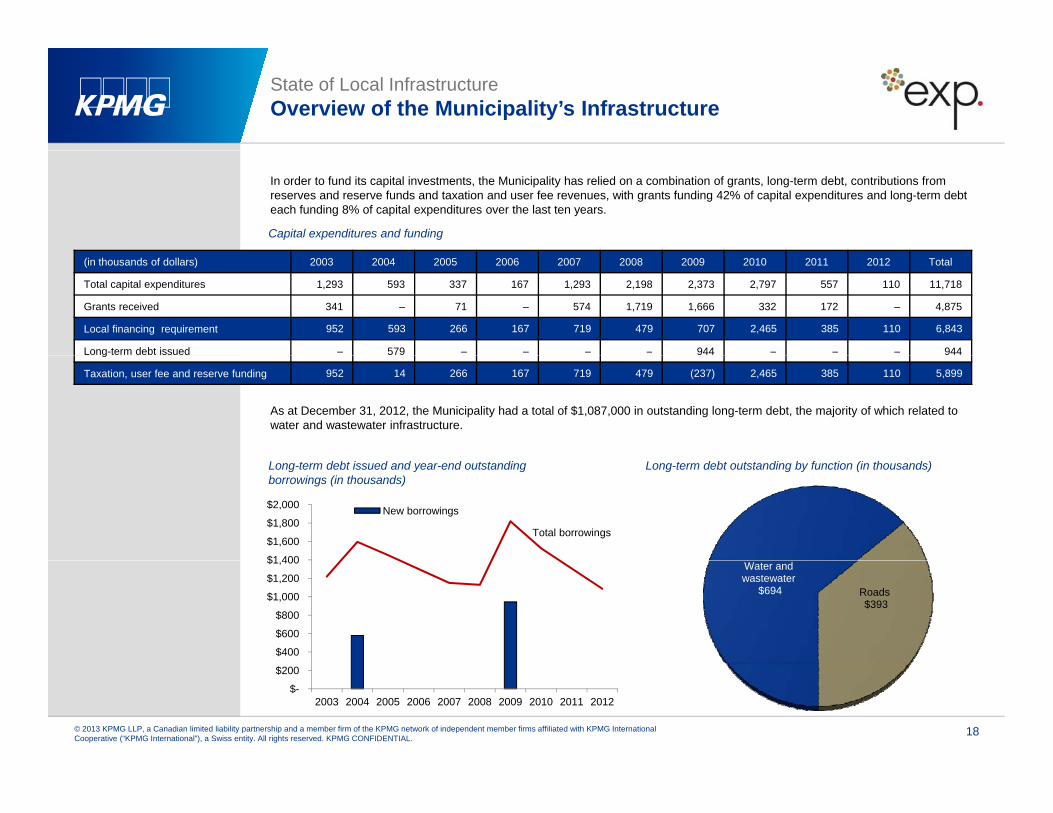
In order to fund its capital investments, the Municipality has relied on a combination of grants, long-term debt, contributions from reserves and reserve funds and taxation and user fee revenues, with grants funding 42% of capital expenditures and long-term debt each funding 8% of capital expenditures over the last ten years.
Capital expenditures and funding
(in thousands of dollars) 2003 2004 2005 2006 2007 2008 2009 2010 2011 2012 Total
Total capital expenditures 1,293 593 337 167 1,293 2,198 2,373 2,797 557 110 11,718
Grants received 341 ‒ 71 ‒ 574 1,719 1,666 332 172 ‒ 4,875
Local financing requirement 952 593 266 167 719 479 707 2,465 385 110 6,843
Long-term debt issued ‒ 579 ‒ ‒ ‒ ‒ 944 ‒ ‒ ‒ 944
As at December 31, 2012, the Municipality had a total of $1,087,000 in outstanding long-term debt, the majority of which related to water and wastewater infrastructure.
g
Taxation, user fee and reserve funding 952 14 266 167 719 479 (237) 2,465 385 110 5,899
Long-term debt issued and year-end outstanding borrowings (in thousands)
$1 400
$1,600
$1,800
$2,000 New borrowings
Long-term debt outstanding by function (in thousands)
Total borrowings
$400
$600
$800
$1,000
$1,200
$1,400 Water and wastewater
$694 Roads$393
© 2013 KPMG LLP, a Canadian limited liability partnership and a member firm of the KPMG network of independent member firms affiliated with KPMG International Cooperative (“KPMG International”), a Swiss entity. All rights reserved. KPMG CONFIDENTIAL.
18
$-
$200
2003 2004 2005 2006 2007 2008 2009 2010 2011 2012
State of Local InfrastructureHistorical, Replacement and Life Cycle Cost
For asset management purposes, the historical cost of the Municipality’s infrastructure is arguably of limited value in that it reflects the cost at the date that the infrastructure investment was incurred, as opposed to what it would cost the Municipality to replace the infrastructure at the present time. While the use of replacement value is a more meaningful measure of the financial requirement associated with the Municipality’s infrastructure (and is a required component for asset management plans under MIII), it is also of limited value in that it only considers the replacement cost at the end of the infrastructure’s useful life and does not contemplate:
• The fact that certain components of the Municipality’s infrastructure, such as roads, will not be fully replaced at the end of useful life but rather will be reconstructed; and
• Asset management activities that are required (by best practice) to be incurred prior to the end of the useful life of the Municipality’s infrastructure.
Accordingly, for the purposes of the Municipality’s asset management plan, we have provided the following for each component of the Municipality’s infrastructure:
• Historical cost, based on the Municipality’s TCA data as reported in its 2012 financial information return
• Replacement cost, based on cost estimates prepared by the Municipality’s engineering advisors. For the purposes of the asset management plan, replacement cost is defined as follows:
• Roads – road reconstruction costs at the end of useful life, including necessary curbs, sidewalks, drainage (as appropriate based on the type of road)
• Bridges and culverts – estimated reconstruction cost
• Water and wastewater pipes – replacement costs at the end of useful life, including hydrants, valves, road reinstatement and service to the property line
• Vehicles – estimated purchase price
• Buildings – estimated reconstruction cost
• Life cycle costs, based on cost estimates prepared by the Municipality’s engineering advisors. Life cycle costs encompass the cost of all recommended maintenance activities associated with a component of the Municipality’s infrastructure prior to the endof useful life. The nature of life cycle costs will vary depending on the type of infrastructure in question, with certain assets requiring little life cycle activities prior to the end of useful life while others require regularly scheduled maintenance activities. For the purpose of the Municipality’s asset management plan, life cycle costs have been provided for linear infrastructure (roads, water and wastewater mains).
We have included on the following page a depiction of the life cycle requirements associated with one type of road including the
© 2013 KPMG LLP, a Canadian limited liability partnership and a member firm of the KPMG network of independent member firms affiliated with KPMG International Cooperative (“KPMG International”), a Swiss entity. All rights reserved. KPMG CONFIDENTIAL.
19
We have included on the following page a depiction of the life cycle requirements associated with one type of road, including the difference between replacement cost and life cycle cost.

State of Local InfrastructureHistorical, Replacement and Life Cycle Cost
$4,000
Life cycle costing profile – paved rural collector road (7.0m lane) (in thousands)
Life cycle cost$3,731
$3,000
$3,500 Recommended life cycle activities
Crack sealing ($25 per km)
Crack sealing and ditching ($35 per km)
Resurfacing ($415 per km)
1
2
3
$2,000
$2,500
Replacement cost
Resurfacing ($415 per km)
Rehabilitation ($1,196 per km)
Reconstruction ($1,459 per km)
3
4
5
$1,000
$1,500
Annual Cost Cumulative Cost
$1,459
4
5
$-
$500
1 1 1 12 222
33
© 2013 KPMG LLP, a Canadian limited liability partnership and a member firm of the KPMG network of independent member firms affiliated with KPMG International Cooperative (“KPMG International”), a Swiss entity. All rights reserved. KPMG CONFIDENTIAL.
20
$1 2 3 4 5 6 7 8 9 10 11 12 13 14 15 16 17 18 19 20 21 22 23 24 25 26 27 28 29 30 31 32 33 34 35 36 37 38 39 40 41 42 43 44 45 46 47 48 49 50 51 52 53 54 55 56 57 58 59 60
Year
State of Local InfrastructureHistorical, Replacement and Life Cycle Cost
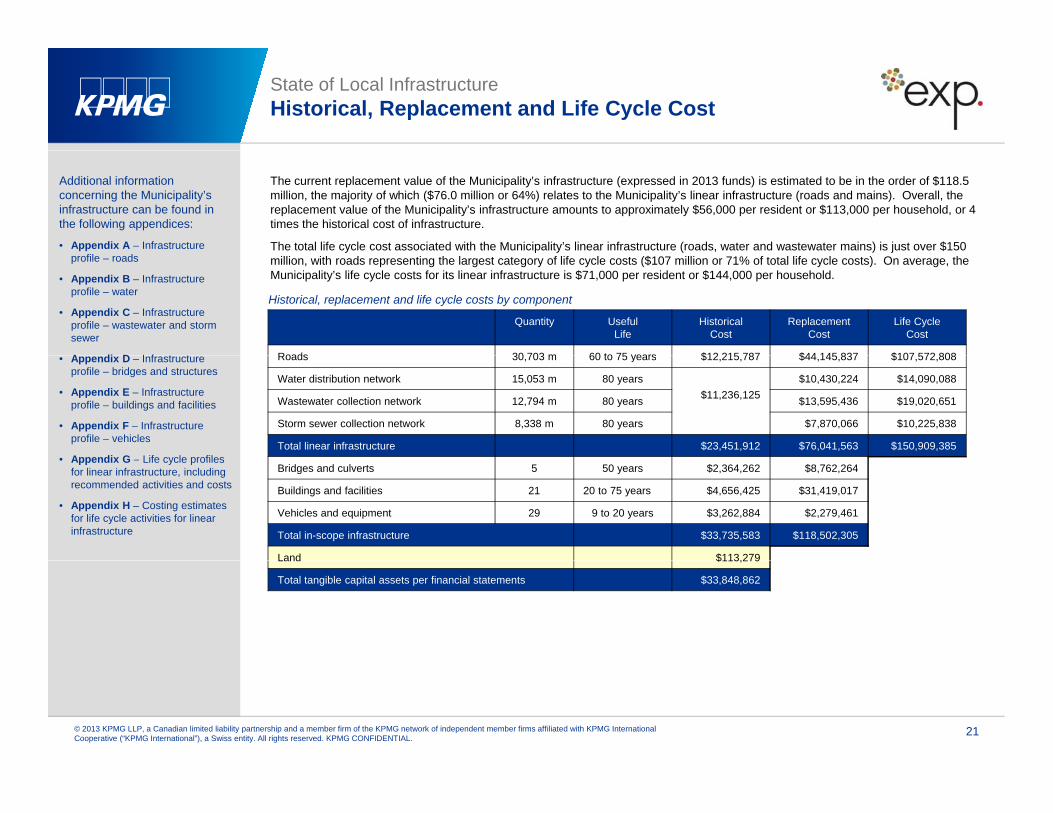
The current replacement value of the Municipality’s infrastructure (expressed in 2013 funds) is estimated to be in the order of $118.5 million, the majority of which ($76.0 million or 64%) relates to the Municipality’s linear infrastructure (roads and mains). Overall, the replacement value of the Municipality’s infrastructure amounts to approximately $56,000 per resident or $113,000 per household, or 4 times the historical cost of infrastructure.
The total life cycle cost associated with the Municipality’s linear infrastructure (roads, water and wastewater mains) is just over $150
Additional information concerning the Municipality’s infrastructure can be found in the following appendices:
• Appendix A – Infrastructure
Quantity Useful Life
Historical Cost
Replacement Cost
Life Cycle Cost
Roads 30 703 m 60 to 75 years $12 215 787 $44 145 837 $107 572 808
million, with roads representing the largest category of life cycle costs ($107 million or 71% of total life cycle costs). On average, the Municipality’s life cycle costs for its linear infrastructure is $71,000 per resident or $144,000 per household.
Historical, replacement and life cycle costs by component
profile – roads
• Appendix B – Infrastructure profile – water
• Appendix C – Infrastructure profile – wastewater and storm sewer
A di D I f t t Roads 30,703 m 60 to 75 years $12,215,787 $44,145,837 $107,572,808
Water distribution network 15,053 m 80 years$11,236,125
$10,430,224 $14,090,088
Wastewater collection network 12,794 m 80 years $13,595,436 $19,020,651
Storm sewer collection network 8,338 m 80 years $7,870,066 $10,225,838
Total linear infrastructure $23,451,912 $76,041,563 $150,909,385
• Appendix D – Infrastructure profile – bridges and structures
• Appendix E – Infrastructure profile – buildings and facilities
• Appendix F – Infrastructure profile – vehicles
• Appendix G Life cycle profilesBridges and culverts 5 50 years $2,364,262 $8,762,264
Buildings and facilities 21 20 to 75 years $4,656,425 $31,419,017
Vehicles and equipment 29 9 to 20 years $3,262,884 $2,279,461
Total in-scope infrastructure $33,735,583 $118,502,305
Land $113,279
• Appendix G – Life cycle profiles for linear infrastructure, including recommended activities and costs
• Appendix H – Costing estimates for life cycle activities for linear infrastructure
Land $113,279
Total tangible capital assets per financial statements $33,848,862
© 2013 KPMG LLP, a Canadian limited liability partnership and a member firm of the KPMG network of independent member firms affiliated with KPMG International Cooperative (“KPMG International”), a Swiss entity. All rights reserved. KPMG CONFIDENTIAL.
21
State of Local InfrastructureCondition Assessment
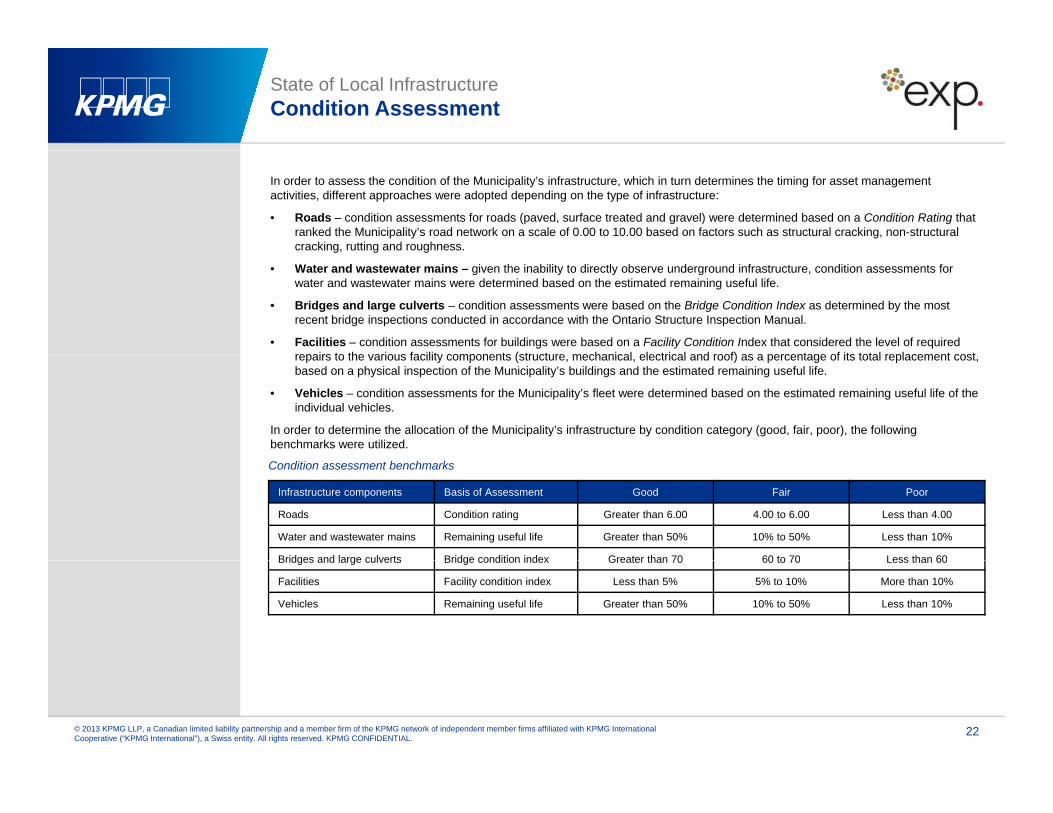
In order to assess the condition of the Municipality’s infrastructure, which in turn determines the timing for asset management activities, different approaches were adopted depending on the type of infrastructure:
• Roads – condition assessments for roads (paved, surface treated and gravel) were determined based on a Condition Rating that ranked the Municipality’s road network on a scale of 0.00 to 10.00 based on factors such as structural cracking, non-structural cracking, rutting and roughness.
• Water and wastewater mains – given the inability to directly observe underground infrastructure, condition assessments for water and wastewater mains were determined based on the estimated remaining useful life.
• Bridges and large culverts – condition assessments were based on the Bridge Condition Index as determined by the most recent bridge inspections conducted in accordance with the Ontario Structure Inspection Manual.
• Facilities – condition assessments for buildings were based on a Facility Condition Index that considered the level of required repairs to the various facility components (structure mechanical electrical and roof) as a percentage of its total replacement costrepairs to the various facility components (structure, mechanical, electrical and roof) as a percentage of its total replacement cost, based on a physical inspection of the Municipality’s buildings and the estimated remaining useful life.
• Vehicles – condition assessments for the Municipality’s fleet were determined based on the estimated remaining useful life of the individual vehicles.
In order to determine the allocation of the Municipality’s infrastructure by condition category (good, fair, poor), the following benchmarks were utilized.
Infrastructure components Basis of Assessment Good Fair Poor
Roads Condition rating Greater than 6.00 4.00 to 6.00 Less than 4.00
Water and wastewater mains Remaining useful life Greater than 50% 10% to 50% Less than 10%
Bridges and large culverts Bridge condition index Greater than 70 60 to 70 Less than 60
Condition assessment benchmarks
Bridges and large culverts Bridge condition index Greater than 70 60 to 70 Less than 60
Facilities Facility condition index Less than 5% 5% to 10% More than 10%
Vehicles Remaining useful life Greater than 50% 10% to 50% Less than 10%
© 2013 KPMG LLP, a Canadian limited liability partnership and a member firm of the KPMG network of independent member firms affiliated with KPMG International Cooperative (“KPMG International”), a Swiss entity. All rights reserved. KPMG CONFIDENTIAL.
22
State of Local InfrastructureCondition Assessment
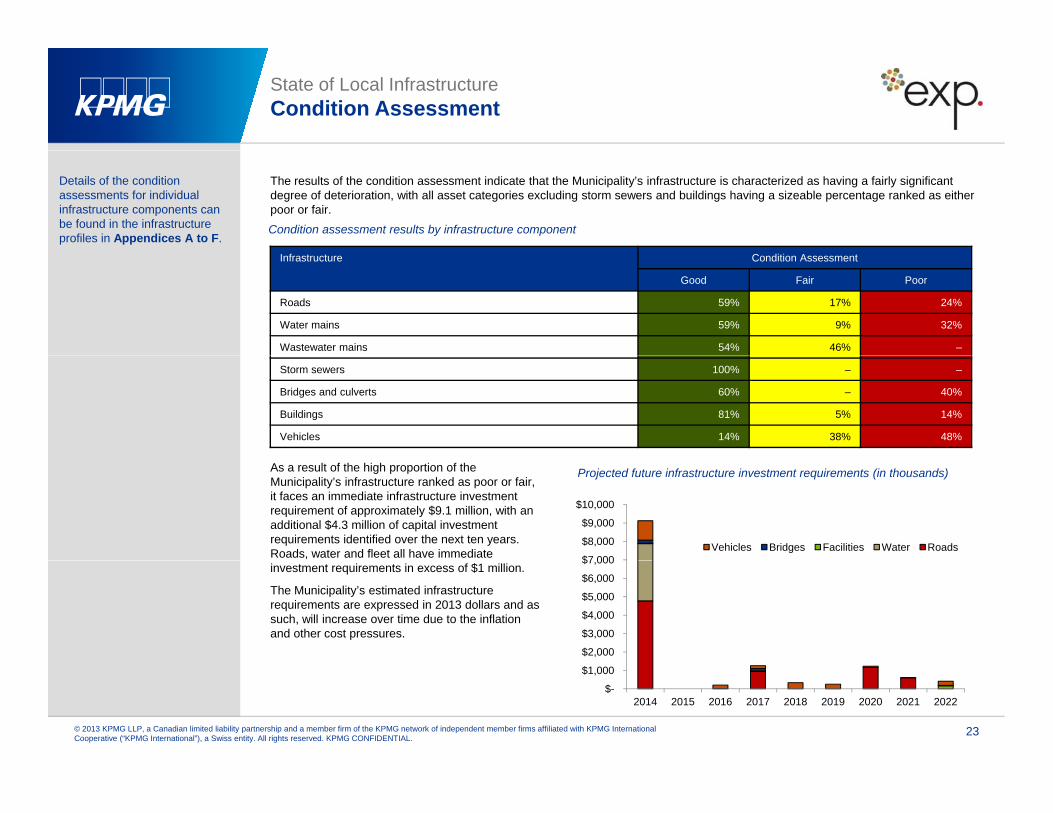
The results of the condition assessment indicate that the Municipality’s infrastructure is characterized as having a fairly significant degree of deterioration, with all asset categories excluding storm sewers and buildings having a sizeable percentage ranked as either poor or fair.Condition assessment results by infrastructure component
Details of the condition assessments for individual infrastructure components can be found in the infrastructure profiles in Appendices A to F.
Infrastructure Condition Assessment
Good Fair Poor
Roads 59% 17% 24%
Water mains 59% 9% 32%
Wastewater mains 54% 46% ‒
Storm sewers 100% ‒ ‒
Bridges and culverts 60% ‒ 40%
Buildings 81% 5% 14%
Vehicles 14% 38% 48%
$7 000
$8,000
$9,000
$10,000
Vehicles Bridges Facilities Water Roads
Projected future infrastructure investment requirements (in thousands)As a result of the high proportion of the Municipality’s infrastructure ranked as poor or fair, it faces an immediate infrastructure investment requirement of approximately $9.1 million, with an additional $4.3 million of capital investment requirements identified over the next ten years. Roads, water and fleet all have immediate
$2,000
$3,000
$4,000
$5,000
$6,000
$7,000 investment requirements in excess of $1 million.
The Municipality’s estimated infrastructure requirements are expressed in 2013 dollars and as such, will increase over time due to the inflation and other cost pressures.
© 2013 KPMG LLP, a Canadian limited liability partnership and a member firm of the KPMG network of independent member firms affiliated with KPMG International Cooperative (“KPMG International”), a Swiss entity. All rights reserved. KPMG CONFIDENTIAL.
23
$-
$1,000
2014 2015 2016 2017 2018 2019 2020 2021 2022
State of Local InfrastructureData Verification and Condition Assessment Policies
On a go-forward basis, the following policies will govern the updating and verification of the condition assessment:
• Condition assessments for bridges will be conducted every two years in accordance with Provincial regulations, with the assetmanagement plan updated accordingly
• Condition assessments for wastewater mains should be assessed every five years through the use of camera inspections
• Condition assessments for facilities should be assessed through an engineering/architectural inspection of the facilities every five years
• Condition assessments for other assets should be based on the percentage of remaining useful life in the absence of a third-party assessment of the assets. On an annual basis, the Town should review the useful lives and condition assessment criteria (good, fair, poor based on percentage of remaining life) and will adjust the asset management plan accordingly
© 2013 KPMG LLP, a Canadian limited liability partnership and a member firm of the KPMG network of independent member firms affiliated with KPMG International Cooperative (“KPMG International”), a Swiss entity. All rights reserved. KPMG CONFIDENTIAL.
24

Asset Management PlanningAsset Management Planning for the Township of Chapleau
Chapter IIIChapter IIIDesired Levels of Service
Desired Levels of Service Performance Measures
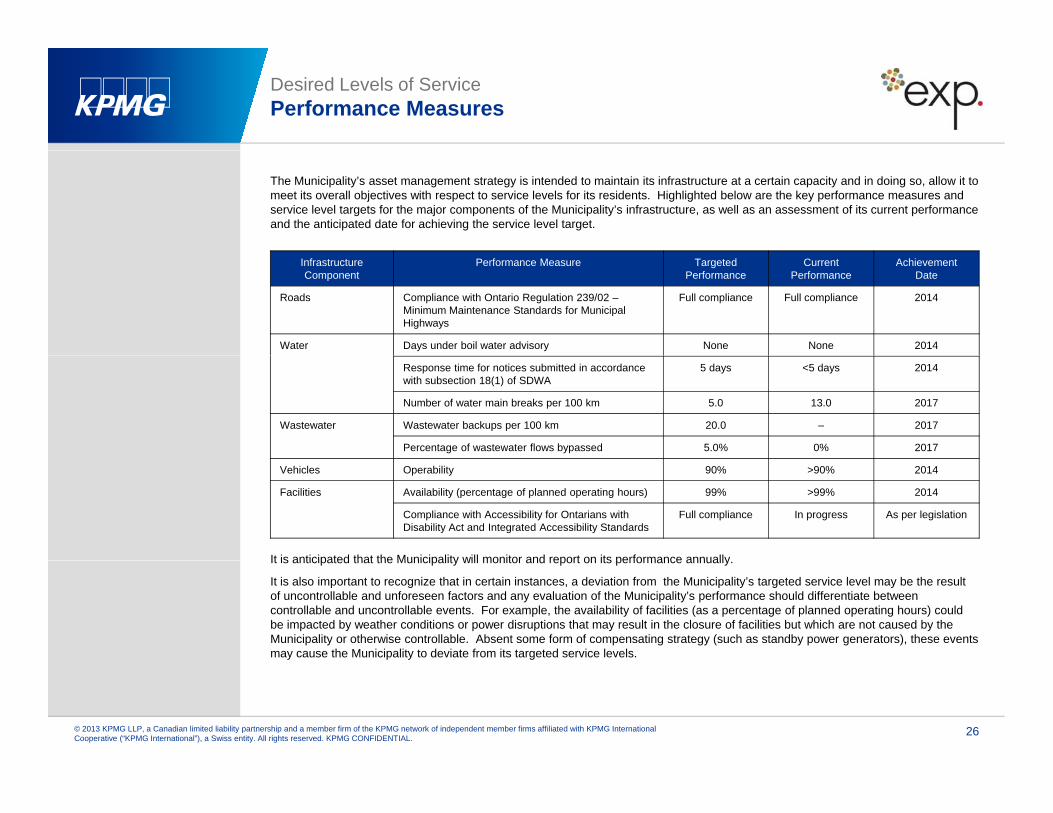
The Municipality’s asset management strategy is intended to maintain its infrastructure at a certain capacity and in doing so, allow it to meet its overall objectives with respect to service levels for its residents. Highlighted below are the key performance measures and service level targets for the major components of the Municipality’s infrastructure, as well as an assessment of its current performance and the anticipated date for achieving the service level target.
Infrastructure Component
Performance Measure TargetedPerformance
Current Performance
AchievementDate
Roads Compliance with Ontario Regulation 239/02 –Minimum Maintenance Standards for Municipal Highways
Full compliance Full compliance 2014
Water Days under boil water advisory None None 2014
Response time for notices submitted in accordance with subsection 18(1) of SDWA
5 days <5 days 2014
Number of water main breaks per 100 km 5.0 13.0 2017
Wastewater Wastewater backups per 100 km 20.0 ‒ 2017
Percentage of wastewater flows bypassed 5.0% 0% 2017
It is anticipated that the Municipality will monitor and report on its performance annually
Vehicles Operability 90% >90% 2014
Facilities Availability (percentage of planned operating hours) 99% >99% 2014
Compliance with Accessibility for Ontarians with Disability Act and Integrated Accessibility Standards
Full compliance In progress As per legislation
It is anticipated that the Municipality will monitor and report on its performance annually.
It is also important to recognize that in certain instances, a deviation from the Municipality’s targeted service level may be the result of uncontrollable and unforeseen factors and any evaluation of the Municipality’s performance should differentiate between controllable and uncontrollable events. For example, the availability of facilities (as a percentage of planned operating hours) could be impacted by weather conditions or power disruptions that may result in the closure of facilities but which are not caused by the Municipality or otherwise controllable. Absent some form of compensating strategy (such as standby power generators), these events may cause the Municipality to deviate from its targeted service levels.
© 2013 KPMG LLP, a Canadian limited liability partnership and a member firm of the KPMG network of independent member firms affiliated with KPMG International Cooperative (“KPMG International”), a Swiss entity. All rights reserved. KPMG CONFIDENTIAL.
26
Desired Levels of Service The Impact of New Legislation and Regulation
From time to time, new legislation or regulations will be enacted that change minimum performance requirements for municipal infrastructure and by extension the performance measures outlined in the Municipality’s asset management plan. At the present time, three major items of legislation and regulation have been identified as having the potential to impact on the Municipality’s desired service levels and asset management plan:
• The Accessibility for Ontarians with Disability Act and the accompanying Integration Accessibility Standards may require the Municipality to alter components of its infrastructure to ensure accessibility for individuals with disabilities. The timeframe for compliance with the Act depends on both the nature of the requirement and the size of the municipality, with smaller communitiesgenerally provided with an extended period for compliance as compared to the Province or larger municipalities.
• The Province of Ontario has recently enacted revisions to Ontario Regulation 239/02 – Minimum Maintenance Standards for Municipal Highways. While the majority of these changes deal with winter maintenance activities (which are not included in the scope of the asset management plan), revisions have been made to inspection requirements for certain components of a municipal road network which will impact on the Municipality’s asset management activities in the futuremunicipal road network, which will impact on the Municipality s asset management activities in the future.
• It is anticipated that the Province of Ontario will introduce new legislation relating to wastewater treatment activities that are expected to increase the minimum performance standards, which may in turn require the Municipality to amend its existing performance measurement targets and/or introduce new targets.
On an annual basis, the Municipality will evaluate the impact of enacted legislation or regulation on its desired levels of service and will adjust its performance measures accordingly.
© 2013 KPMG LLP, a Canadian limited liability partnership and a member firm of the KPMG network of independent member firms affiliated with KPMG International Cooperative (“KPMG International”), a Swiss entity. All rights reserved. KPMG CONFIDENTIAL.
27

Asset Management PlanningAsset Management Planning for the Township of Chapleau
Chapter IVChapter IVAsset Management Strategy
Asset Management Strategy Overview
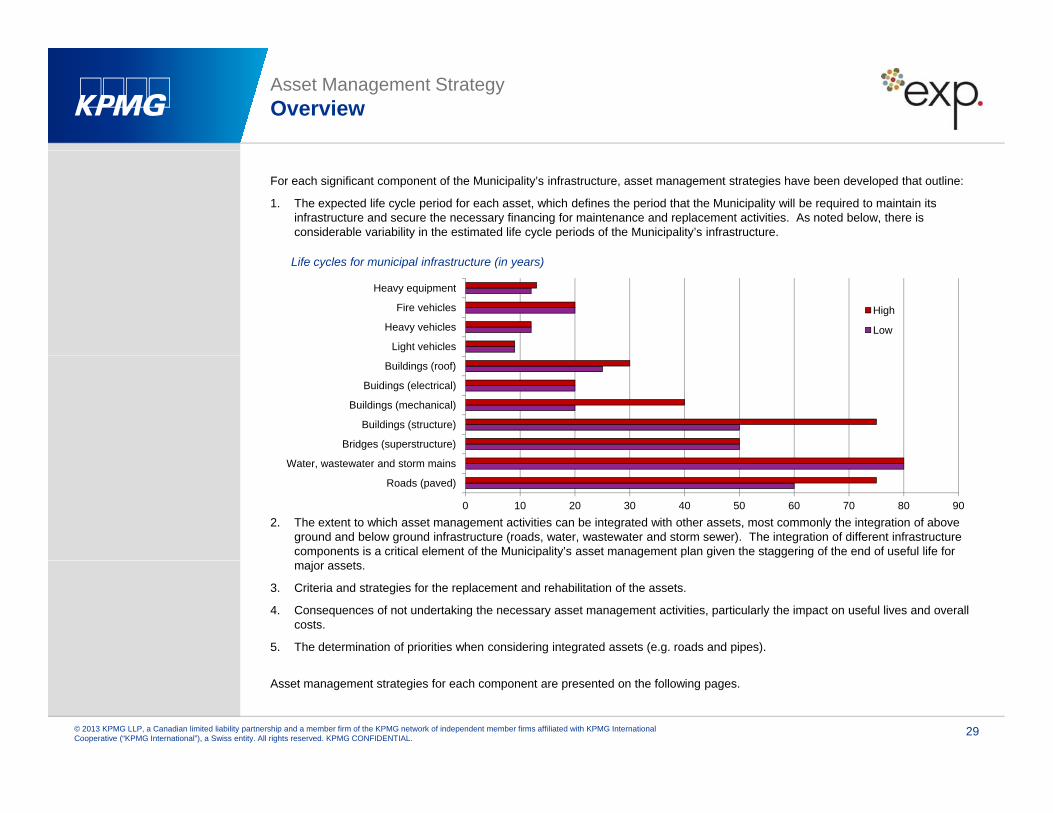
For each significant component of the Municipality’s infrastructure, asset management strategies have been developed that outline:
1. The expected life cycle period for each asset, which defines the period that the Municipality will be required to maintain its infrastructure and secure the necessary financing for maintenance and replacement activities. As noted below, there is considerable variability in the estimated life cycle periods of the Municipality’s infrastructure.
Light vehicles
Heavy vehicles
Fire vehicles
Heavy equipment
High
Low
Life cycles for municipal infrastructure (in years)
Bridges (superstructure)
Buildings (structure)
Buildings (mechanical)
Buidings (electrical)
Buildings (roof)
2. The extent to which asset management activities can be integrated with other assets, most commonly the integration of above ground and below ground infrastructure (roads, water, wastewater and storm sewer). The integration of different infrastructure components is a critical element of the Municipality’s asset management plan given the staggering of the end of useful life for
0 10 20 30 40 50 60 70 80 90
Roads (paved)
Water, wastewater and storm mains
major assets.
3. Criteria and strategies for the replacement and rehabilitation of the assets.
4. Consequences of not undertaking the necessary asset management activities, particularly the impact on useful lives and overall costs.
5. The determination of priorities when considering integrated assets (e.g. roads and pipes).
© 2013 KPMG LLP, a Canadian limited liability partnership and a member firm of the KPMG network of independent member firms affiliated with KPMG International Cooperative (“KPMG International”), a Swiss entity. All rights reserved. KPMG CONFIDENTIAL.
29
Asset management strategies for each component are presented on the following pages.
Asset Management Strategy Municipal Paved Road Systems
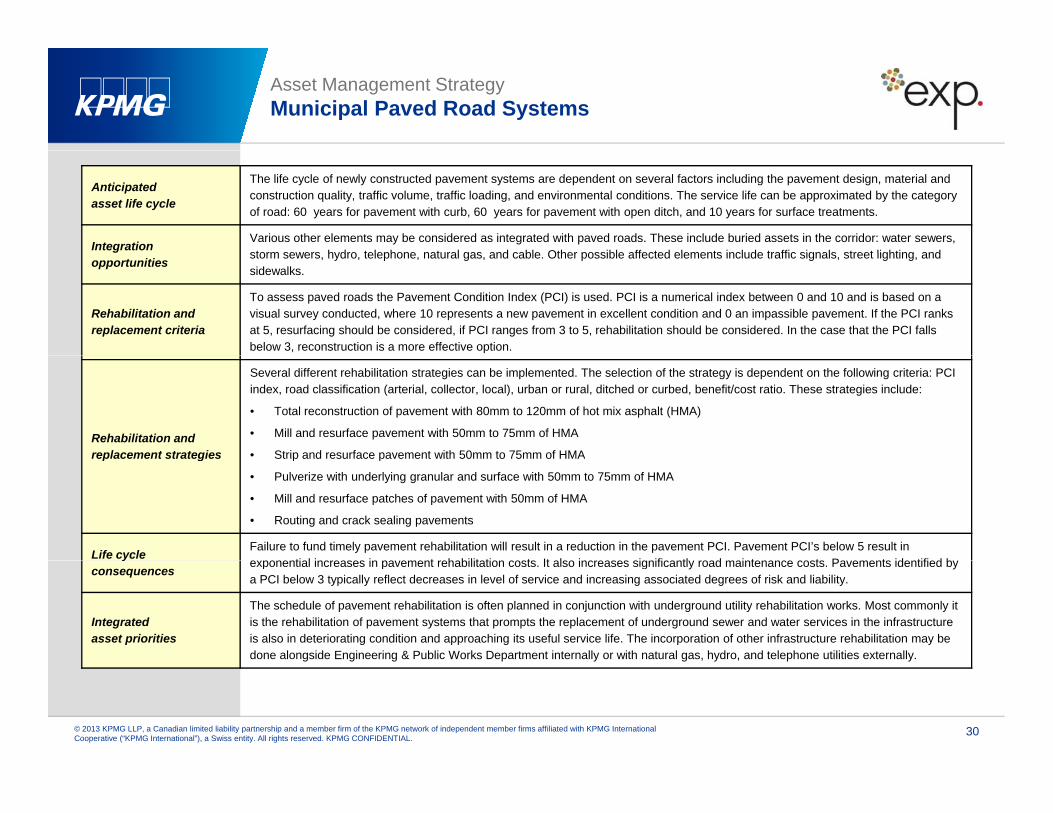
Anticipated asset life cycle
The life cycle of newly constructed pavement systems are dependent on several factors including the pavement design, material and construction quality, traffic volume, traffic loading, and environmental conditions. The service life can be approximated by the category of road: 60 years for pavement with curb, 60 years for pavement with open ditch, and 10 years for surface treatments.
Integration Various other elements may be considered as integrated with paved roads. These include buried assets in the corridor: water sewers, storm sewers hydro telephone natural gas and cable Other possible affected elements include traffic signals street lighting andopportunities storm sewers, hydro, telephone, natural gas, and cable. Other possible affected elements include traffic signals, street lighting, and sidewalks.
Rehabilitation and replacement criteria
To assess paved roads the Pavement Condition Index (PCI) is used. PCI is a numerical index between 0 and 10 and is based on avisual survey conducted, where 10 represents a new pavement in excellent condition and 0 an impassible pavement. If the PCI ranks at 5, resurfacing should be considered, if PCI ranges from 3 to 5, rehabilitation should be considered. In the case that the PCI falls below 3, reconstruction is a more effective option.
Rehabilitation and replacement strategies
Several different rehabilitation strategies can be implemented. The selection of the strategy is dependent on the following criteria: PCI index, road classification (arterial, collector, local), urban or rural, ditched or curbed, benefit/cost ratio. These strategies include:
• Total reconstruction of pavement with 80mm to 120mm of hot mix asphalt (HMA)
• Mill and resurface pavement with 50mm to 75mm of HMA
• Strip and resurface pavement with 50mm to 75mm of HMAreplacement strategies Strip and resurface pavement with 50mm to 75mm of HMA
• Pulverize with underlying granular and surface with 50mm to 75mm of HMA
• Mill and resurface patches of pavement with 50mm of HMA
• Routing and crack sealing pavements
Life cycle Failure to fund timely pavement rehabilitation will result in a reduction in the pavement PCI. Pavement PCI’s below 5 result in e ponential increases in pa ement rehabilitation costs It also increases significantl road maintenance costs Pa ements identified b
yconsequences exponential increases in pavement rehabilitation costs. It also increases significantly road maintenance costs. Pavements identified by
a PCI below 3 typically reflect decreases in level of service and increasing associated degrees of risk and liability.
Integratedasset priorities
The schedule of pavement rehabilitation is often planned in conjunction with underground utility rehabilitation works. Most commonly it is the rehabilitation of pavement systems that prompts the replacement of underground sewer and water services in the infrastructure is also in deteriorating condition and approaching its useful service life. The incorporation of other infrastructure rehabilitation may be done alongside Engineering & Public Works Department internally or with natural gas, hydro, and telephone utilities externally.
© 2013 KPMG LLP, a Canadian limited liability partnership and a member firm of the KPMG network of independent member firms affiliated with KPMG International Cooperative (“KPMG International”), a Swiss entity. All rights reserved. KPMG CONFIDENTIAL.
30
Asset Management Strategy Municipal Granular Road Systems
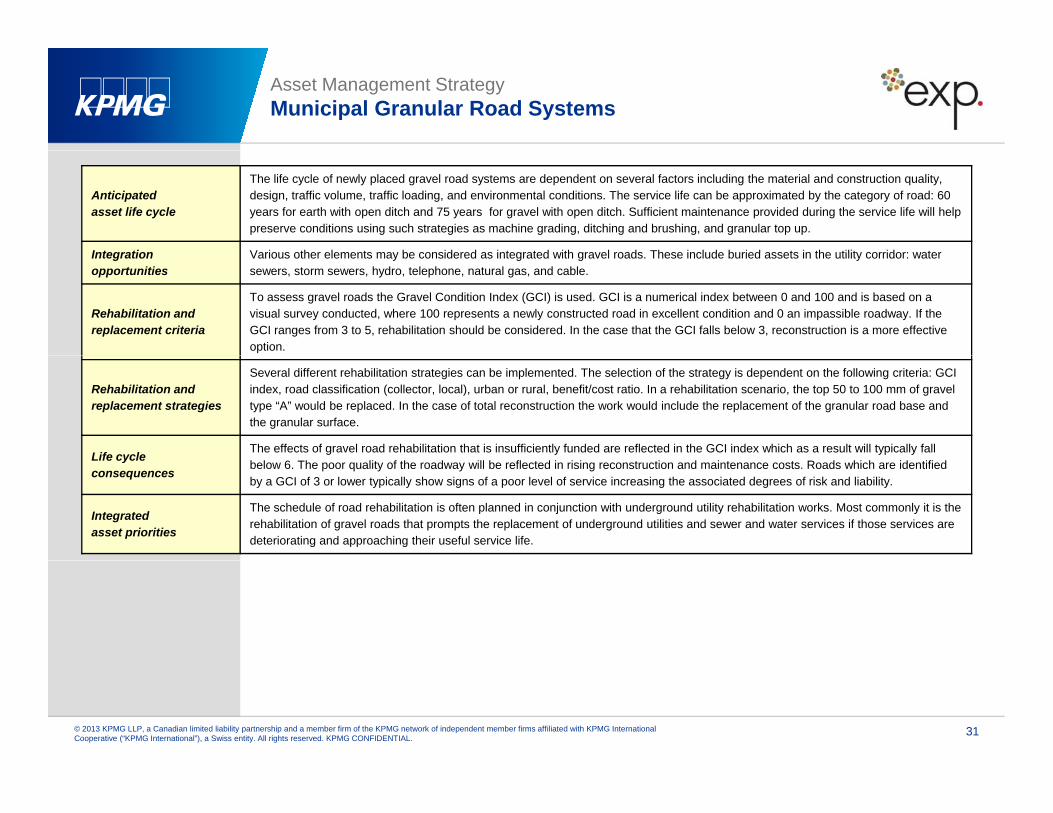
Anticipated asset life cycle
The life cycle of newly placed gravel road systems are dependent on several factors including the material and construction quality, design, traffic volume, traffic loading, and environmental conditions. The service life can be approximated by the category of road: 60 years for earth with open ditch and 75 years for gravel with open ditch. Sufficient maintenance provided during the service life will help preserve conditions using such strategies as machine grading, ditching and brushing, and granular top up.
Integration Various other elements may be considered as integrated with gravel roads These include buried assets in the utility corridor: waterIntegrationopportunities
Various other elements may be considered as integrated with gravel roads. These include buried assets in the utility corridor: water sewers, storm sewers, hydro, telephone, natural gas, and cable.
Rehabilitation and replacement criteria
To assess gravel roads the Gravel Condition Index (GCI) is used. GCI is a numerical index between 0 and 100 and is based on avisual survey conducted, where 100 represents a newly constructed road in excellent condition and 0 an impassible roadway. If the GCI ranges from 3 to 5, rehabilitation should be considered. In the case that the GCI falls below 3, reconstruction is a more effective option.
Rehabilitation and replacement strategies
Several different rehabilitation strategies can be implemented. The selection of the strategy is dependent on the following criteria: GCI index, road classification (collector, local), urban or rural, benefit/cost ratio. In a rehabilitation scenario, the top 50 to 100 mm of gravel type “A” would be replaced. In the case of total reconstruction the work would include the replacement of the granular road base and the granular surface.
Life cycle The effects of gravel road rehabilitation that is insufficiently funded are reflected in the GCI index which as a result will typically fall Life cycle consequences below 6. The poor quality of the roadway will be reflected in rising reconstruction and maintenance costs. Roads which are identified
by a GCI of 3 or lower typically show signs of a poor level of service increasing the associated degrees of risk and liability.
Integratedasset priorities
The schedule of road rehabilitation is often planned in conjunction with underground utility rehabilitation works. Most commonly it is the rehabilitation of gravel roads that prompts the replacement of underground utilities and sewer and water services if those services are deteriorating and approaching their useful service life.
© 2013 KPMG LLP, a Canadian limited liability partnership and a member firm of the KPMG network of independent member firms affiliated with KPMG International Cooperative (“KPMG International”), a Swiss entity. All rights reserved. KPMG CONFIDENTIAL.
31
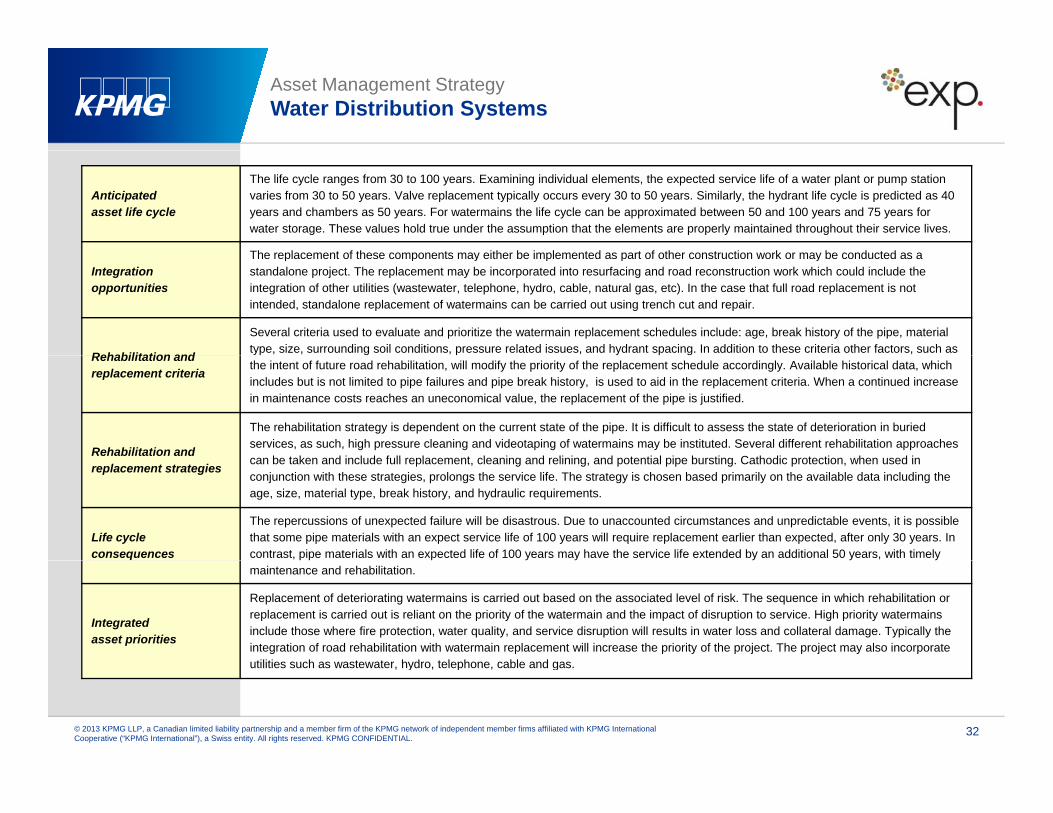
Asset Management Strategy Water Distribution Systems
Anticipated asset life cycle
The life cycle ranges from 30 to 100 years. Examining individual elements, the expected service life of a water plant or pump station varies from 30 to 50 years. Valve replacement typically occurs every 30 to 50 years. Similarly, the hydrant life cycle is predicted as 40 years and chambers as 50 years. For watermains the life cycle can be approximated between 50 and 100 years and 75 years for water storage. These values hold true under the assumption that the elements are properly maintained throughout their service lives.
The replacement of these components may either be implemented as part of other construction work or may be conducted as aIntegrationopportunities
The replacement of these components may either be implemented as part of other construction work or may be conducted as a standalone project. The replacement may be incorporated into resurfacing and road reconstruction work which could include theintegration of other utilities (wastewater, telephone, hydro, cable, natural gas, etc). In the case that full road replacement is not intended, standalone replacement of watermains can be carried out using trench cut and repair.
Rehabilitation and
Several criteria used to evaluate and prioritize the watermain replacement schedules include: age, break history of the pipe, material type, size, surrounding soil conditions, pressure related issues, and hydrant spacing. In addition to these criteria other factors, such as Rehabilitation and
replacement criteria the intent of future road rehabilitation, will modify the priority of the replacement schedule accordingly. Available historical data, which includes but is not limited to pipe failures and pipe break history, is used to aid in the replacement criteria. When a continued increase in maintenance costs reaches an uneconomical value, the replacement of the pipe is justified.
Rehabilitation and
The rehabilitation strategy is dependent on the current state of the pipe. It is difficult to assess the state of deterioration in buried services, as such, high pressure cleaning and videotaping of watermains may be instituted. Several different rehabilitation approaches can be taken and include full replacement cleaning and relining and potential pipe bursting Cathodic protection when used inreplacement strategies can be taken and include full replacement, cleaning and relining, and potential pipe bursting. Cathodic protection, when used inconjunction with these strategies, prolongs the service life. The strategy is chosen based primarily on the available data including the age, size, material type, break history, and hydraulic requirements.
Life cycle consequences
The repercussions of unexpected failure will be disastrous. Due to unaccounted circumstances and unpredictable events, it is possible that some pipe materials with an expect service life of 100 years will require replacement earlier than expected, after only 30 years. In contrast, pipe materials with an expected life of 100 years may have the service life extended by an additional 50 years, with timely maintenance and rehabilitation.
Integratedasset priorities
Replacement of deteriorating watermains is carried out based on the associated level of risk. The sequence in which rehabilitation or replacement is carried out is reliant on the priority of the watermain and the impact of disruption to service. High priority watermains include those where fire protection, water quality, and service disruption will results in water loss and collateral damage. Typically the integration of road rehabilitation with watermain replacement will increase the priority of the project. The project may also incorporate utilities such as wastewater hydro telephone cable and gas
© 2013 KPMG LLP, a Canadian limited liability partnership and a member firm of the KPMG network of independent member firms affiliated with KPMG International Cooperative (“KPMG International”), a Swiss entity. All rights reserved. KPMG CONFIDENTIAL.
32
utilities such as wastewater, hydro, telephone, cable and gas.
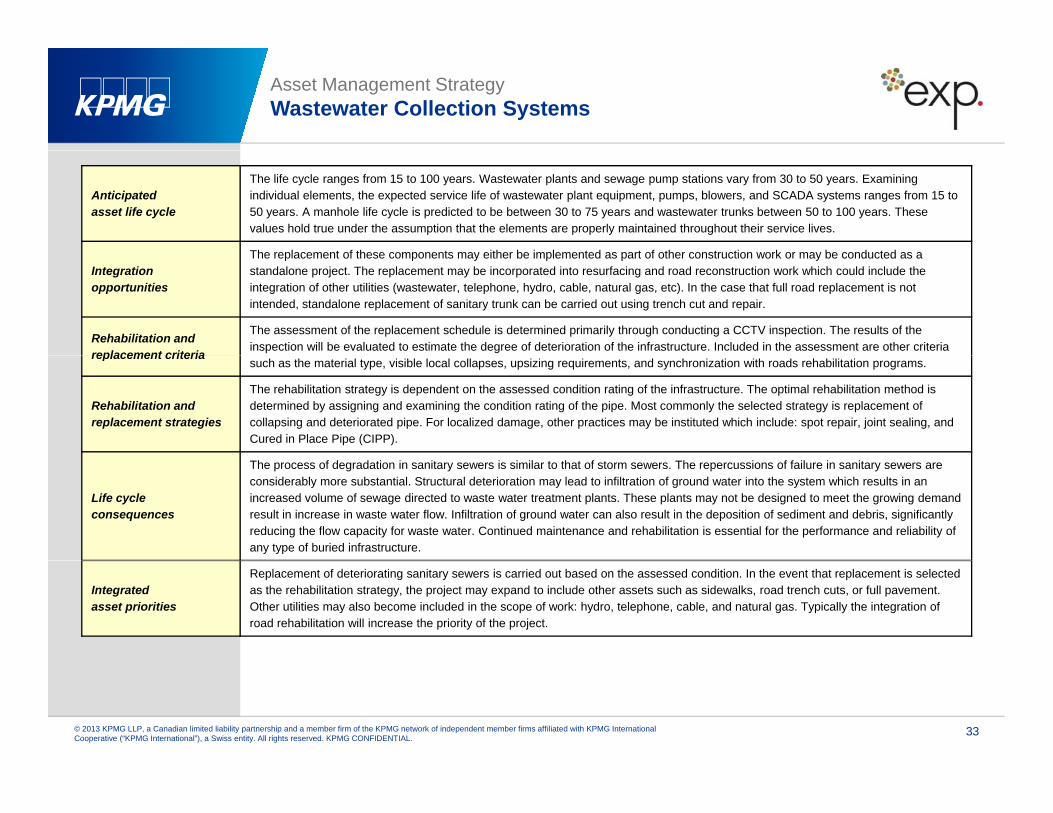
Asset Management Strategy Wastewater Collection Systems
Anticipated asset life cycle
The life cycle ranges from 15 to 100 years. Wastewater plants and sewage pump stations vary from 30 to 50 years. Examining individual elements, the expected service life of wastewater plant equipment, pumps, blowers, and SCADA systems ranges from 15 to 50 years. A manhole life cycle is predicted to be between 30 to 75 years and wastewater trunks between 50 to 100 years. Thesevalues hold true under the assumption that the elements are properly maintained throughout their service lives.
The replacement of these components may either be implemented as part of other construction work or may be conducted as aIntegrationopportunities
The replacement of these components may either be implemented as part of other construction work or may be conducted as a standalone project. The replacement may be incorporated into resurfacing and road reconstruction work which could include theintegration of other utilities (wastewater, telephone, hydro, cable, natural gas, etc). In the case that full road replacement is not intended, standalone replacement of sanitary trunk can be carried out using trench cut and repair.
Rehabilitation and replacement criteria
The assessment of the replacement schedule is determined primarily through conducting a CCTV inspection. The results of the inspection will be evaluated to estimate the degree of deterioration of the infrastructure. Included in the assessment are other criteria replacement criteriasuch as the material type, visible local collapses, upsizing requirements, and synchronization with roads rehabilitation programs.
Rehabilitation and replacement strategies
The rehabilitation strategy is dependent on the assessed condition rating of the infrastructure. The optimal rehabilitation method is determined by assigning and examining the condition rating of the pipe. Most commonly the selected strategy is replacement ofcollapsing and deteriorated pipe. For localized damage, other practices may be instituted which include: spot repair, joint sealing, and Cured in Place Pipe (CIPP).
Life cycle consequences
The process of degradation in sanitary sewers is similar to that of storm sewers. The repercussions of failure in sanitary sewers are considerably more substantial. Structural deterioration may lead to infiltration of ground water into the system which results in an increased volume of sewage directed to waste water treatment plants. These plants may not be designed to meet the growing demandresult in increase in waste water flow. Infiltration of ground water can also result in the deposition of sediment and debris, significantly reducing the flow capacity for waste water. Continued maintenance and rehabilitation is essential for the performance and reliability of any type of buried infrastructure.
Integratedasset priorities
Replacement of deteriorating sanitary sewers is carried out based on the assessed condition. In the event that replacement is selected as the rehabilitation strategy, the project may expand to include other assets such as sidewalks, road trench cuts, or full pavement. Other utilities may also become included in the scope of work: hydro, telephone, cable, and natural gas. Typically the integration of road rehabilitation will increase the priority of the project.
© 2013 KPMG LLP, a Canadian limited liability partnership and a member firm of the KPMG network of independent member firms affiliated with KPMG International Cooperative (“KPMG International”), a Swiss entity. All rights reserved. KPMG CONFIDENTIAL.
33
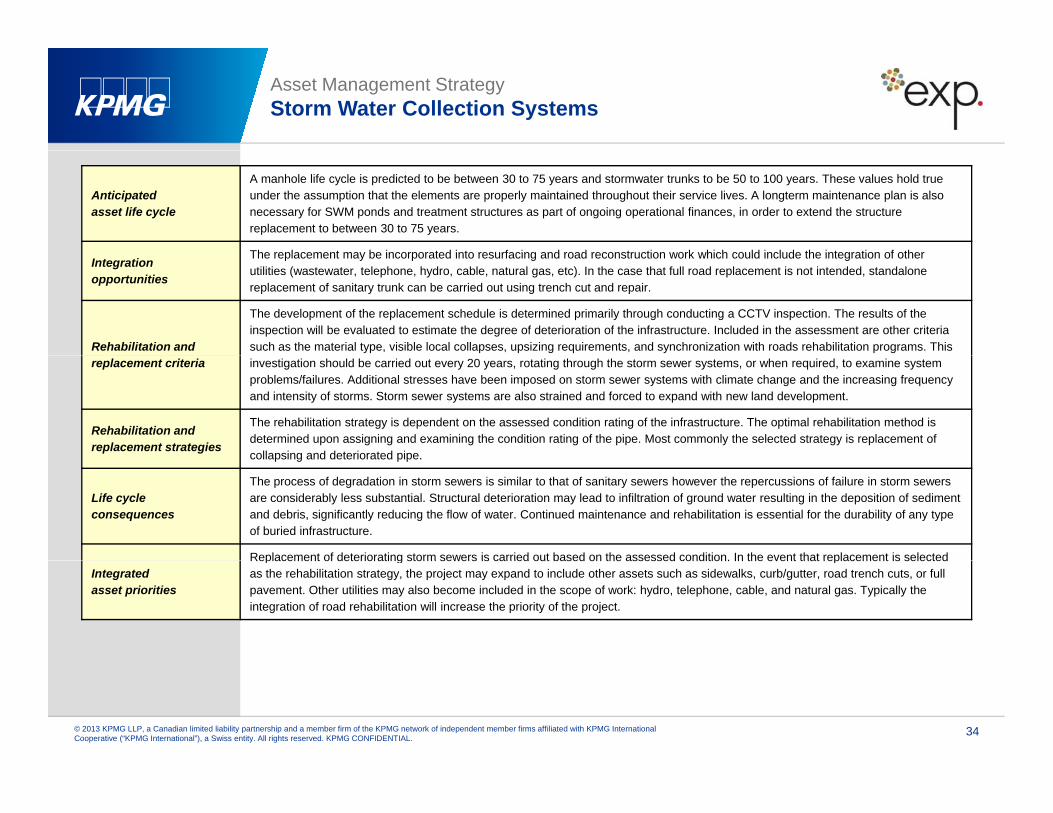
Asset Management Strategy Storm Water Collection Systems
Anticipated asset life cycle
A manhole life cycle is predicted to be between 30 to 75 years and stormwater trunks to be 50 to 100 years. These values hold true under the assumption that the elements are properly maintained throughout their service lives. A longterm maintenance plan is also necessary for SWM ponds and treatment structures as part of ongoing operational finances, in order to extend the structure replacement to between 30 to 75 years.
The replacement may be incorporated into resurfacing and road reconstruction work which could include the integration of otherIntegrationopportunities
The replacement may be incorporated into resurfacing and road reconstruction work which could include the integration of other utilities (wastewater, telephone, hydro, cable, natural gas, etc). In the case that full road replacement is not intended, standalone replacement of sanitary trunk can be carried out using trench cut and repair.
Rehabilitation and
The development of the replacement schedule is determined primarily through conducting a CCTV inspection. The results of the inspection will be evaluated to estimate the degree of deterioration of the infrastructure. Included in the assessment are other criteria such as the material type, visible local collapses, upsizing requirements, and synchronization with roads rehabilitation programs. This
replacement criteria investigation should be carried out every 20 years, rotating through the storm sewer systems, or when required, to examine system problems/failures. Additional stresses have been imposed on storm sewer systems with climate change and the increasing frequencyand intensity of storms. Storm sewer systems are also strained and forced to expand with new land development.
Rehabilitation and replacement strategies
The rehabilitation strategy is dependent on the assessed condition rating of the infrastructure. The optimal rehabilitation method is determined upon assigning and examining the condition rating of the pipe. Most commonly the selected strategy is replacement of collapsing and deteriorated pipecollapsing and deteriorated pipe.
Life cycle consequences
The process of degradation in storm sewers is similar to that of sanitary sewers however the repercussions of failure in storm sewers are considerably less substantial. Structural deterioration may lead to infiltration of ground water resulting in the deposition of sediment and debris, significantly reducing the flow of water. Continued maintenance and rehabilitation is essential for the durability of any type of buried infrastructure.
Replacement of deteriorating storm sewers is carried out based on the assessed condition. In the event that replacement is selectedIntegratedasset priorities
Replacement of deteriorating storm sewers is carried out based on the assessed condition. In the event that replacement is selected as the rehabilitation strategy, the project may expand to include other assets such as sidewalks, curb/gutter, road trench cuts, or full pavement. Other utilities may also become included in the scope of work: hydro, telephone, cable, and natural gas. Typically theintegration of road rehabilitation will increase the priority of the project.
© 2013 KPMG LLP, a Canadian limited liability partnership and a member firm of the KPMG network of independent member firms affiliated with KPMG International Cooperative (“KPMG International”), a Swiss entity. All rights reserved. KPMG CONFIDENTIAL.
34
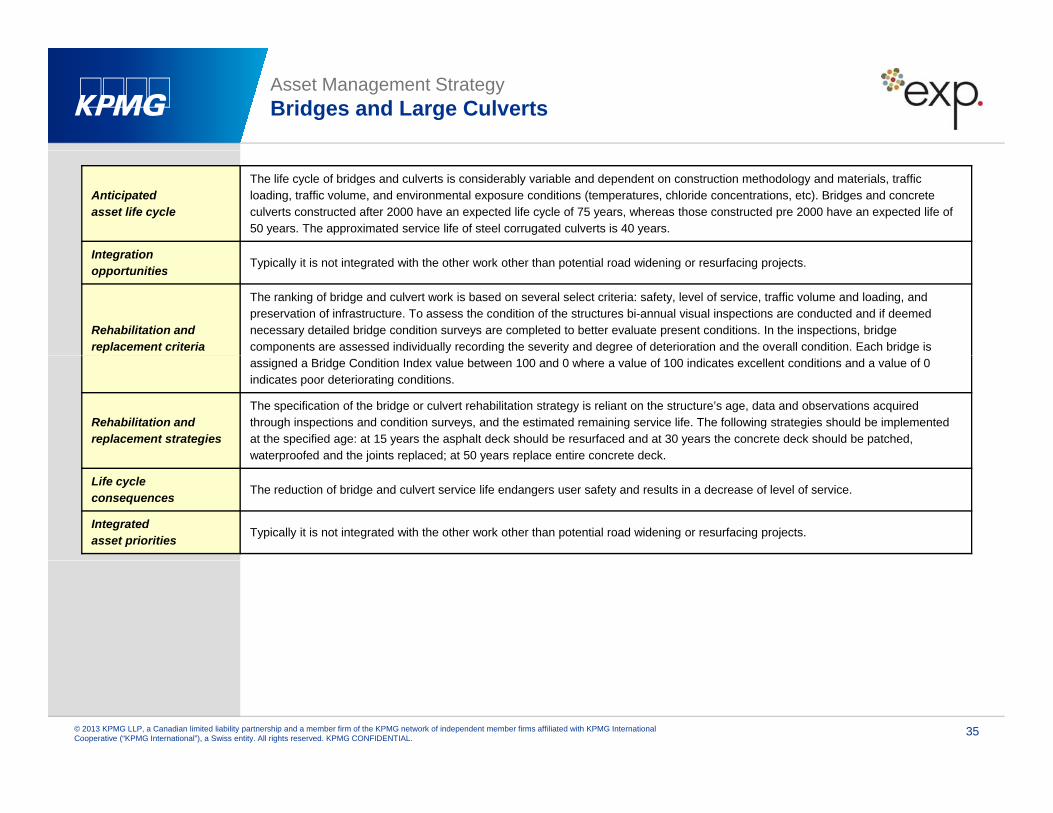
Asset Management Strategy Bridges and Large Culverts
Anticipated asset life cycle
The life cycle of bridges and culverts is considerably variable and dependent on construction methodology and materials, trafficloading, traffic volume, and environmental exposure conditions (temperatures, chloride concentrations, etc). Bridges and concrete culverts constructed after 2000 have an expected life cycle of 75 years, whereas those constructed pre 2000 have an expected life of 50 years. The approximated service life of steel corrugated culverts is 40 years.
IntegrationIntegrationopportunities Typically it is not integrated with the other work other than potential road widening or resurfacing projects.
Rehabilitation and replacement criteria
The ranking of bridge and culvert work is based on several select criteria: safety, level of service, traffic volume and loading, and preservation of infrastructure. To assess the condition of the structures bi-annual visual inspections are conducted and if deemed necessary detailed bridge condition surveys are completed to better evaluate present conditions. In the inspections, bridge components are assessed individually recording the severity and degree of deterioration and the overall condition. Each bridge is assigned a Bridge Condition Index value between 100 and 0 where a value of 100 indicates excellent conditions and a value of 0 indicates poor deteriorating conditions.
Rehabilitation and replacement strategies
The specification of the bridge or culvert rehabilitation strategy is reliant on the structure’s age, data and observations acquired through inspections and condition surveys, and the estimated remaining service life. The following strategies should be implemented at the specified age: at 15 years the asphalt deck should be resurfaced and at 30 years the concrete deck should be patched, waterproofed and the joints replaced; at 50 years replace entire concrete deckwaterproofed and the joints replaced; at 50 years replace entire concrete deck.
Life cycle consequences The reduction of bridge and culvert service life endangers user safety and results in a decrease of level of service.
Integratedasset priorities Typically it is not integrated with the other work other than potential road widening or resurfacing projects.
© 2013 KPMG LLP, a Canadian limited liability partnership and a member firm of the KPMG network of independent member firms affiliated with KPMG International Cooperative (“KPMG International”), a Swiss entity. All rights reserved. KPMG CONFIDENTIAL.
35
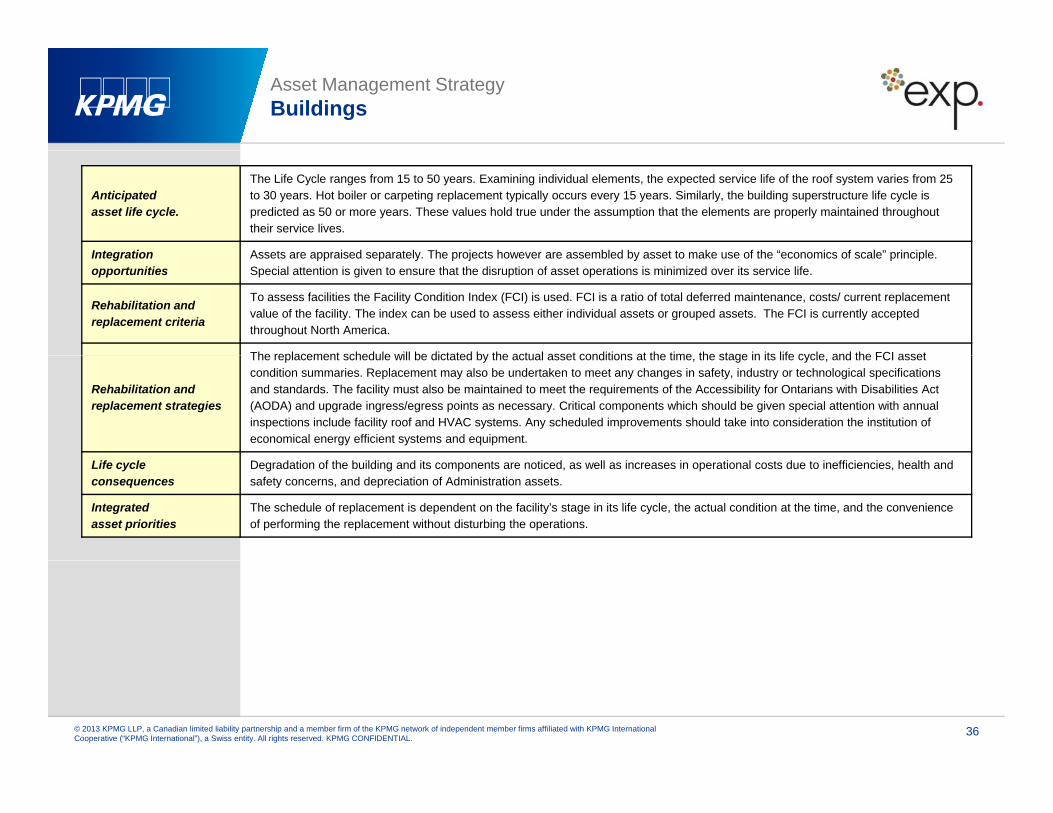
Asset Management Strategy Buildings
Anticipated asset life cycle.
The Life Cycle ranges from 15 to 50 years. Examining individual elements, the expected service life of the roof system varies from 25 to 30 years. Hot boiler or carpeting replacement typically occurs every 15 years. Similarly, the building superstructure life cycle is predicted as 50 or more years. These values hold true under the assumption that the elements are properly maintained throughout their service lives.
Integration Assets are appraised separately The projects however are assembled by asset to make use of the “economics of scale” principleIntegrationopportunities
Assets are appraised separately. The projects however are assembled by asset to make use of the economics of scale principle. Special attention is given to ensure that the disruption of asset operations is minimized over its service life.
Rehabilitation and replacement criteria
To assess facilities the Facility Condition Index (FCI) is used. FCI is a ratio of total deferred maintenance, costs/ current replacement value of the facility. The index can be used to assess either individual assets or grouped assets. The FCI is currently accepted throughout North America.
The replacement schedule will be dictated by the actual asset conditions at the time the stage in its life cycle and the FCI asset
Rehabilitation and replacement strategies
The replacement schedule will be dictated by the actual asset conditions at the time, the stage in its life cycle, and the FCI asset condition summaries. Replacement may also be undertaken to meet any changes in safety, industry or technological specifications and standards. The facility must also be maintained to meet the requirements of the Accessibility for Ontarians with Disabilities Act (AODA) and upgrade ingress/egress points as necessary. Critical components which should be given special attention with annual inspections include facility roof and HVAC systems. Any scheduled improvements should take into consideration the institution ofeconomical energy efficient systems and equipment.
Life cycle consequences
Degradation of the building and its components are noticed, as well as increases in operational costs due to inefficiencies, health and safety concerns, and depreciation of Administration assets.
Integratedasset priorities
The schedule of replacement is dependent on the facility’s stage in its life cycle, the actual condition at the time, and the convenience of performing the replacement without disturbing the operations.
© 2013 KPMG LLP, a Canadian limited liability partnership and a member firm of the KPMG network of independent member firms affiliated with KPMG International Cooperative (“KPMG International”), a Swiss entity. All rights reserved. KPMG CONFIDENTIAL.
36
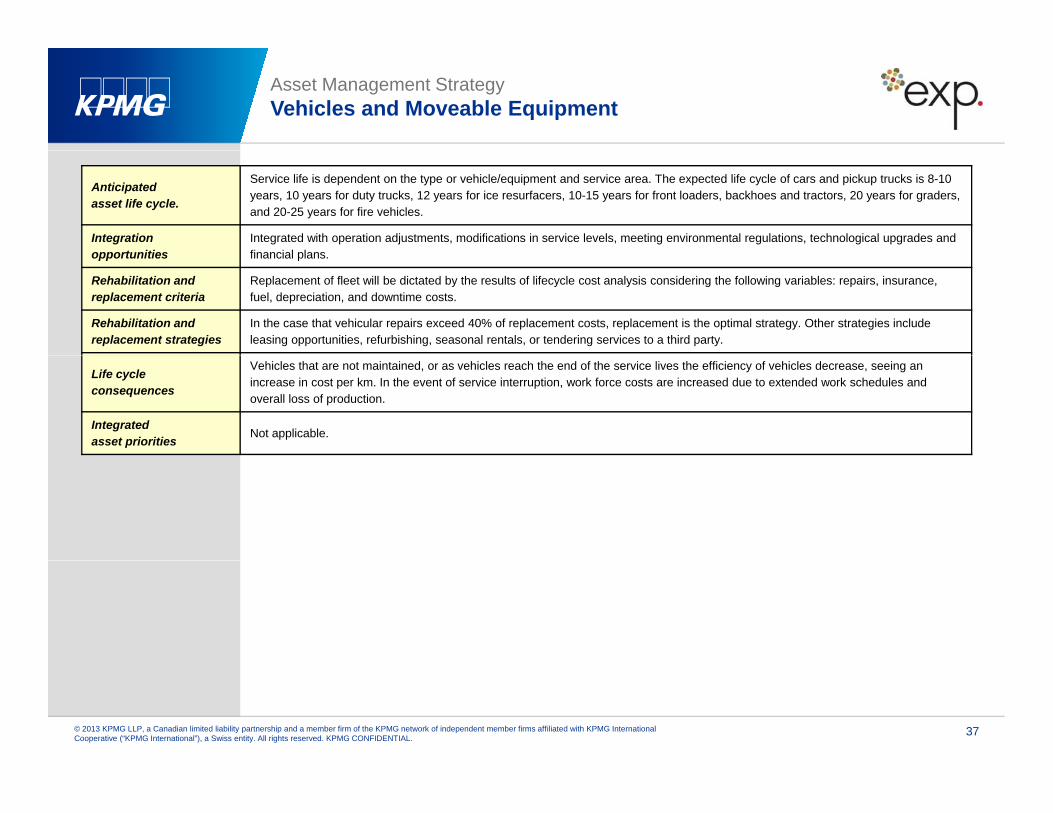
Asset Management Strategy Vehicles and Moveable Equipment
Anticipated asset life cycle.
Service life is dependent on the type or vehicle/equipment and service area. The expected life cycle of cars and pickup trucks is 8-10 years, 10 years for duty trucks, 12 years for ice resurfacers, 10-15 years for front loaders, backhoes and tractors, 20 years for graders, and 20-25 years for fire vehicles.
Integrationopportunities
Integrated with operation adjustments, modifications in service levels, meeting environmental regulations, technological upgrades and financial plansopportunities financial plans.
Rehabilitation and replacement criteria
Replacement of fleet will be dictated by the results of lifecycle cost analysis considering the following variables: repairs, insurance, fuel, depreciation, and downtime costs.
Rehabilitation and replacement strategies
In the case that vehicular repairs exceed 40% of replacement costs, replacement is the optimal strategy. Other strategies include leasing opportunities, refurbishing, seasonal rentals, or tendering services to a third party.
Life cycle consequences
Vehicles that are not maintained, or as vehicles reach the end of the service lives the efficiency of vehicles decrease, seeing an increase in cost per km. In the event of service interruption, work force costs are increased due to extended work schedules andoverall loss of production.
Integratedasset priorities Not applicable.
© 2013 KPMG LLP, a Canadian limited liability partnership and a member firm of the KPMG network of independent member firms affiliated with KPMG International Cooperative (“KPMG International”), a Swiss entity. All rights reserved. KPMG CONFIDENTIAL.
37
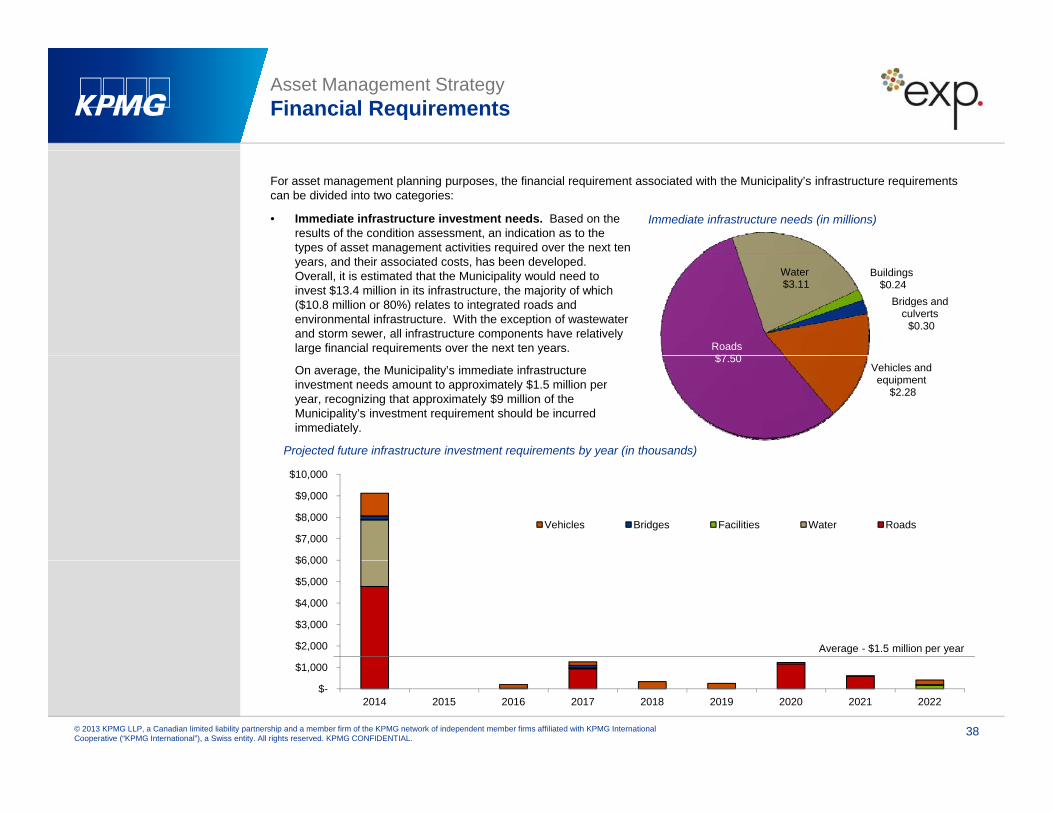
Asset Management Strategy Financial Requirements
For asset management planning purposes, the financial requirement associated with the Municipality’s infrastructure requirementscan be divided into two categories:
• Immediate infrastructure investment needs. Based on the results of the condition assessment, an indication as to the types of asset management activities required over the next ten
Immediate infrastructure needs (in millions)
yp g qyears, and their associated costs, has been developed. Overall, it is estimated that the Municipality would need to invest $13.4 million in its infrastructure, the majority of which ($10.8 million or 80%) relates to integrated roads and environmental infrastructure. With the exception of wastewater and storm sewer, all infrastructure components have relatively large financial requirements over the next ten years. Roads
$7 50
Water$3.11
Buildings$0.24
Bridges and culverts
$0.30
On average, the Municipality’s immediate infrastructure investment needs amount to approximately $1.5 million per year, recognizing that approximately $9 million of the Municipality’s investment requirement should be incurred immediately.
$7.50 Vehicles and equipment
$2.28
Projected future infrastructure investment requirements by year (in thousands)
$6 000
$7,000
$8,000
$9,000
$10,000
Vehicles Bridges Facilities Water Roads
$
$2,000
$3,000
$4,000
$5,000
$6,000
Average - $1.5 million per year
© 2013 KPMG LLP, a Canadian limited liability partnership and a member firm of the KPMG network of independent member firms affiliated with KPMG International Cooperative (“KPMG International”), a Swiss entity. All rights reserved. KPMG CONFIDENTIAL.
38
$-
$1,000
2014 2015 2016 2017 2018 2019 2020 2021 2022
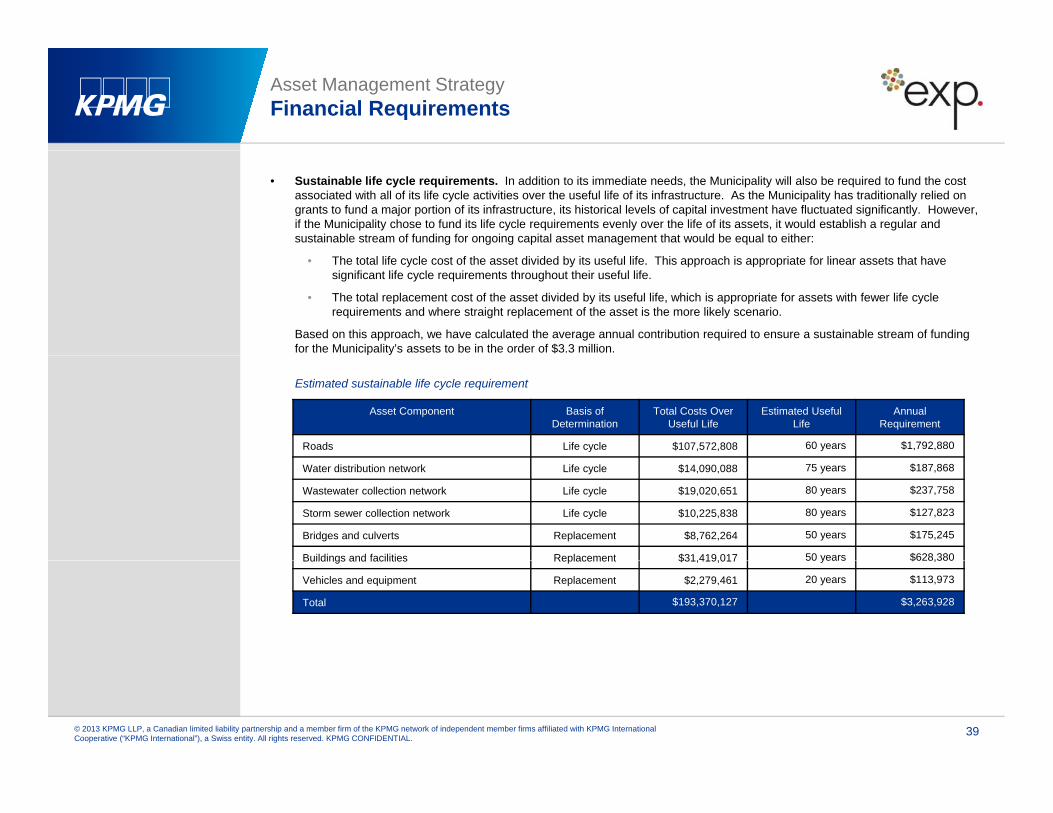
Asset Management Strategy Financial Requirements
• Sustainable life cycle requirements. In addition to its immediate needs, the Municipality will also be required to fund the cost associated with all of its life cycle activities over the useful life of its infrastructure. As the Municipality has traditionally relied on grants to fund a major portion of its infrastructure, its historical levels of capital investment have fluctuated significantly. However, if the Municipality chose to fund its life cycle requirements evenly over the life of its assets, it would establish a regular and sustainable stream of funding for ongoing capital asset management that would be equal to either:
• The total life cycle cost of the asset divided by its useful life. This approach is appropriate for linear assets that have significant life cycle requirements throughout their useful life.
• The total replacement cost of the asset divided by its useful life, which is appropriate for assets with fewer life cycle requirements and where straight replacement of the asset is the more likely scenario.
Based on this approach, we have calculated the average annual contribution required to ensure a sustainable stream of fundingfor the Municipality’s assets to be in the order of $3.3 million.
Asset Component Basis of Determination
Total Costs Over Useful Life
Estimated UsefulLife
Annual Requirement
Roads Life cycle $107,572,808 60 years $1,792,880
Estimated sustainable life cycle requirement
Water distribution network Life cycle $14,090,088 75 years $187,868
Wastewater collection network Life cycle $19,020,651 80 years $237,758
Storm sewer collection network Life cycle $10,225,838 80 years $127,823
Bridges and culverts Replacement $8,762,264 50 years $175,245
Buildings and facilities Replacement $31,419,017 50 years $628,380Buildings and facilities Replacement $31,419,017 50 years $628,380
Vehicles and equipment Replacement $2,279,461 20 years $113,973
Total $193,370,127 $3,263,928
© 2013 KPMG LLP, a Canadian limited liability partnership and a member firm of the KPMG network of independent member firms affiliated with KPMG International Cooperative (“KPMG International”), a Swiss entity. All rights reserved. KPMG CONFIDENTIAL.
39
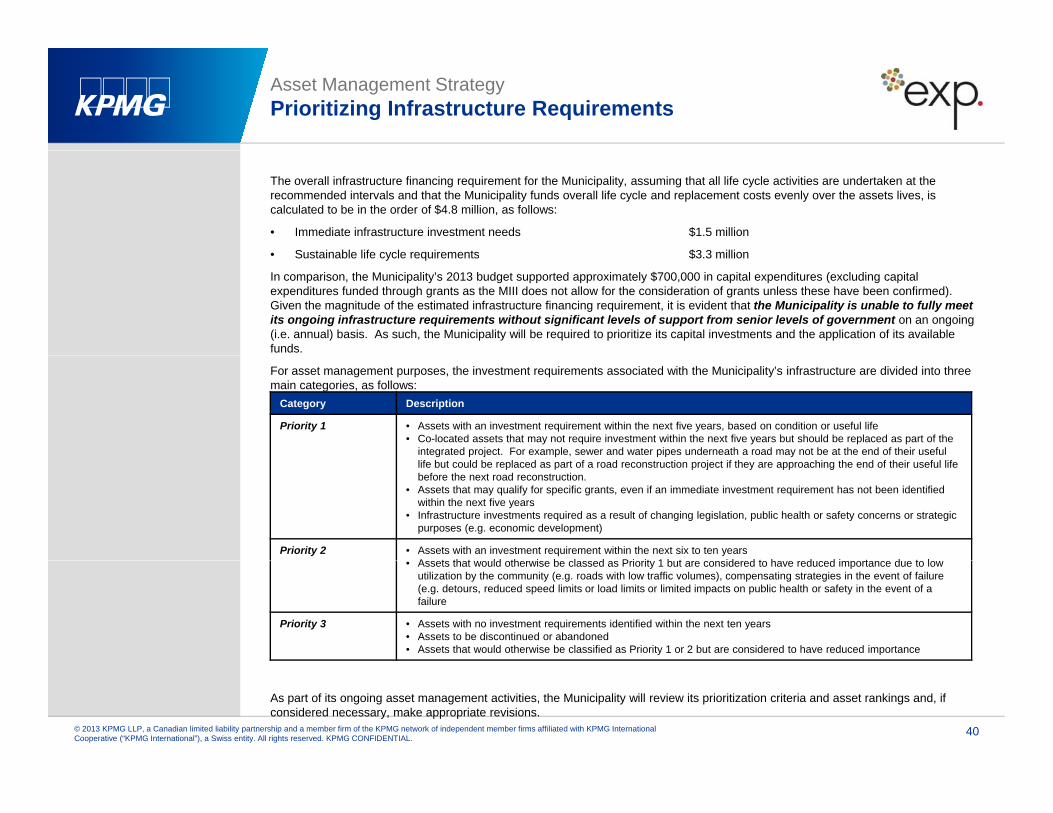
Asset Management Strategy Prioritizing Infrastructure Requirements
The overall infrastructure financing requirement for the Municipality, assuming that all life cycle activities are undertaken at the recommended intervals and that the Municipality funds overall life cycle and replacement costs evenly over the assets lives, is calculated to be in the order of $4.8 million, as follows:
• Immediate infrastructure investment needs $1.5 million
• Sustainable life cycle requirements $3 3 million• Sustainable life cycle requirements $3.3 million
In comparison, the Municipality’s 2013 budget supported approximately $700,000 in capital expenditures (excluding capital expenditures funded through grants as the MIII does not allow for the consideration of grants unless these have been confirmed).Given the magnitude of the estimated infrastructure financing requirement, it is evident that the Municipality is unable to fully meet its ongoing infrastructure requirements without significant levels of support from senior levels of government on an ongoing (i.e. annual) basis. As such, the Municipality will be required to prioritize its capital investments and the application of its available funds.
For asset management purposes, the investment requirements associated with the Municipality’s infrastructure are divided into three main categories, as follows:
Category Description
Priority 1 • Assets with an investment requirement within the next five years, based on condition or useful life• Co-located assets that may not require investment within the next five years but should be replaced as part of the
integrated project. For example, sewer and water pipes underneath a road may not be at the end of their useful life but could be replaced as part of a road reconstruction project if they are approaching the end of their useful life before the next road reconstruction.
• Assets that may qualify for specific grants, even if an immediate investment requirement has not been identified within the next five years
• Infrastructure investments required as a result of changing legislation, public health or safety concerns or strategic purposes (e.g. economic development)
Priority 2 • Assets with an investment requirement within the next six to ten yearsA t th t ld th i b l d P i it 1 b t id d t h d d i t d t l• Assets that would otherwise be classed as Priority 1 but are considered to have reduced importance due to low utilization by the community (e.g. roads with low traffic volumes), compensating strategies in the event of failure (e.g. detours, reduced speed limits or load limits or limited impacts on public health or safety in the event of a failure
Priority 3 • Assets with no investment requirements identified within the next ten years• Assets to be discontinued or abandoned• Assets that would otherwise be classified as Priority 1 or 2 but are considered to have reduced importance
© 2013 KPMG LLP, a Canadian limited liability partnership and a member firm of the KPMG network of independent member firms affiliated with KPMG International Cooperative (“KPMG International”), a Swiss entity. All rights reserved. KPMG CONFIDENTIAL.
40
As part of its ongoing asset management activities, the Municipality will review its prioritization criteria and asset rankings and, if considered necessary, make appropriate revisions.
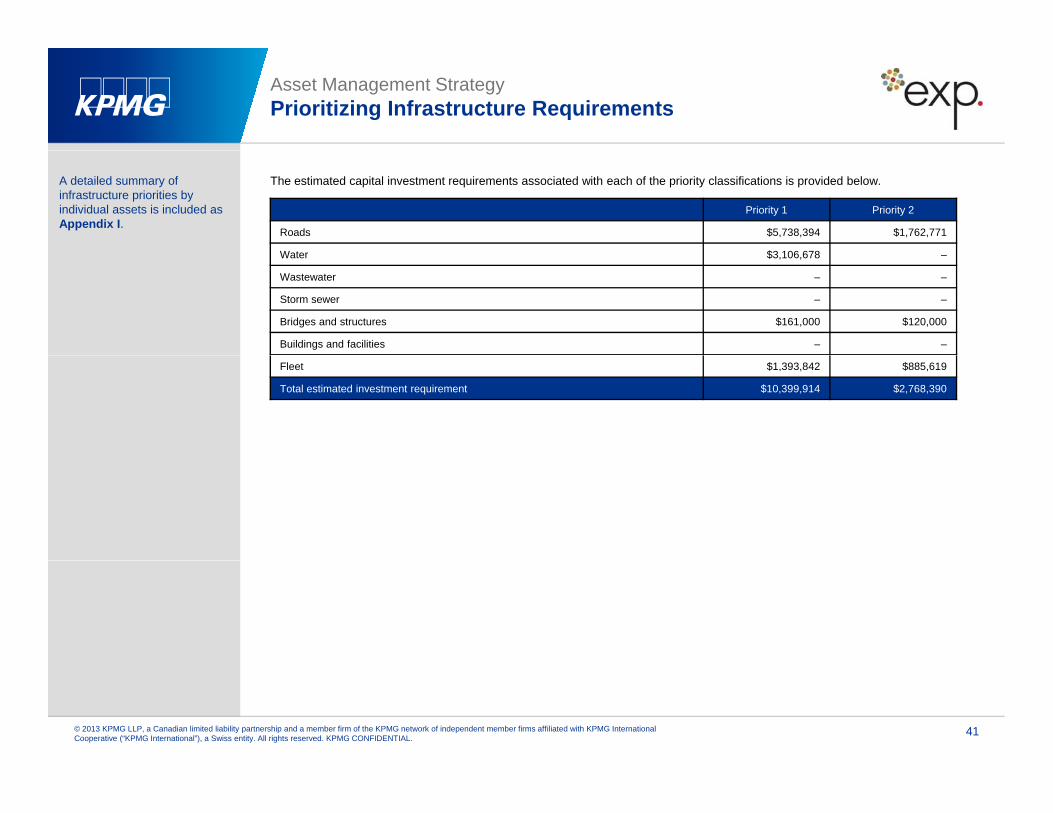
Asset Management Strategy Prioritizing Infrastructure Requirements
The estimated capital investment requirements associated with each of the priority classifications is provided below.A detailed summary of infrastructure priorities by individual assets is included as Appendix I.
Priority 1 Priority 2
Roads $5,738,394 $1,762,771
Water $3 106 678Water $3,106,678 ‒
Wastewater ‒ ‒
Storm sewer ‒ ‒
Bridges and structures $161,000 $120,000
Buildings and facilities ‒ ‒
Fleet $1,393,842 $885,619
Total estimated investment requirement $10,399,914 $2,768,390
© 2013 KPMG LLP, a Canadian limited liability partnership and a member firm of the KPMG network of independent member firms affiliated with KPMG International Cooperative (“KPMG International”), a Swiss entity. All rights reserved. KPMG CONFIDENTIAL.
41

Asset Management PlanningAsset Management Planning for the Township of Chapleau
Chapter VChapter VFinancing Strategy
Financing StrategyBasis of Analysis
The development of the Municipality’s financing strategy for its asset management plan reflects the guidance outlined by the Province of Ontario in Building Together – Guide for Municipal Asset Management Plans. Specifically, the development of the financing strategy (and in particular the extent of the Municipality’s financing shortfall) is based on the following parameters:
• Presents annual revenues and expenditures for the planning period (25 years), as well as comparative information;
• Does not consider grants from senior governments to be a confirmed source of revenue unless an agreement has been• Does not consider grants from senior governments to be a confirmed source of revenue unless an agreement has been executed. Accordingly, only Federal Gas Tax and the Municipality’s allocation for capacity funding under the Municipal Infrastructure Investment Initiative have been included in the projections; and
• Identifies the potential funding shortfall and how it will be managed.
In developing the financial strategy, three alternative scenarios were considered:
• Scenario 1 – Representing the base case scenario, this scenario reflects the assumption that all identified asset management p g , p grequirements (immediate and long-term contributions) will be incurred by the Municipality. This represents the worst case scenario as it involves the highest level of capital financing requirement and ultimately is not practical due to the increase in municipal revenues necessary to support the required level of capital investment.
• Scenario 2 – Under this scenario, the Municipality’s capital expenditures are projected to be as follows:
• During the first 10 years of the planning period, the Municipality will make capital investments based on the identified priority infrastructure investment requirements (i.e. $1.5 million per year).p y q ( p y )
• During the remainder of the planning period, the Municipality will make capital investments equal to the amount of the sustainable life cycle contribution requirements (i.e. $3.8 million per year).
• Scenario 3 – Under this scenario, it is assumed that the Municipality will continue to make capital investments based on the amount of funding budgeted in 2013 for capital expenditures (i.e. $700,000 per year).
© 2013 KPMG LLP, a Canadian limited liability partnership and a member firm of the KPMG network of independent member firms affiliated with KPMG International Cooperative (“KPMG International”), a Swiss entity. All rights reserved. KPMG CONFIDENTIAL.
43
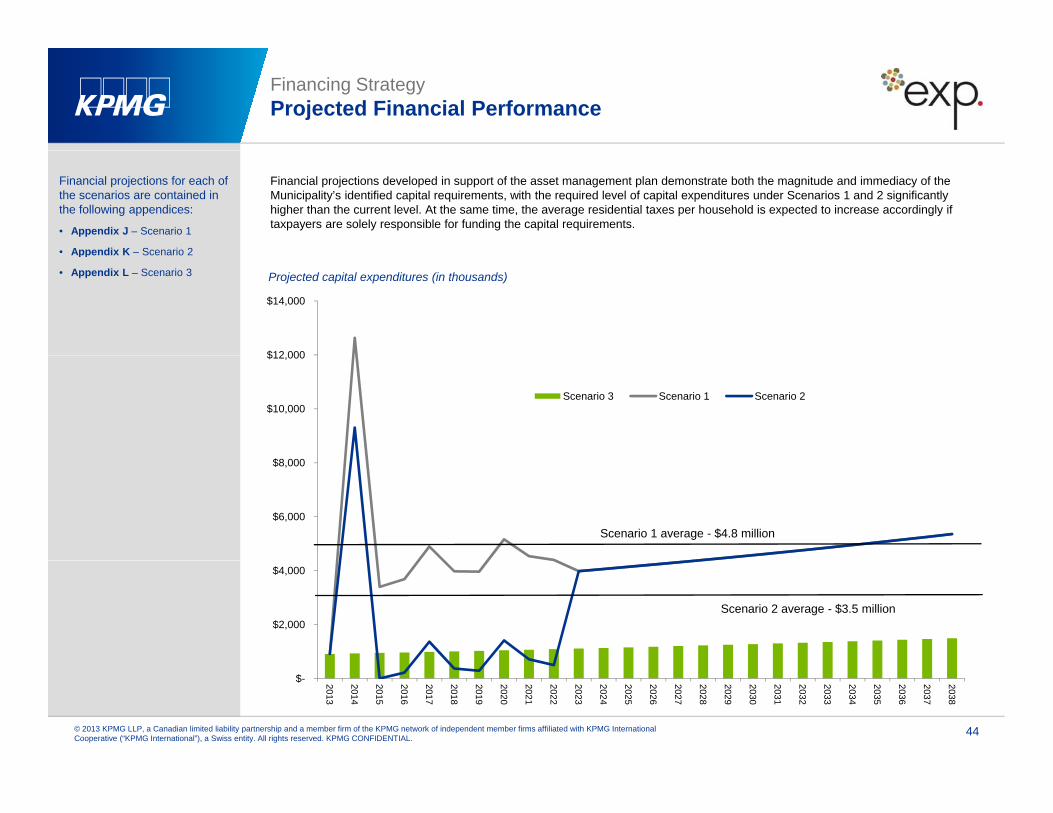
Financing StrategyProjected Financial Performance
Financial projections developed in support of the asset management plan demonstrate both the magnitude and immediacy of the Municipality’s identified capital requirements, with the required level of capital expenditures under Scenarios 1 and 2 significantly higher than the current level. At the same time, the average residential taxes per household is expected to increase accordingly if taxpayers are solely responsible for funding the capital requirements.
Financial projections for each of the scenarios are contained in the following appendices:
• Appendix J – Scenario 1
• Appendix K – Scenario 2
$12 000
$14,000
Projected capital expenditures (in thousands)
Appendix K Scenario 2
• Appendix L – Scenario 3
$
$10,000
$12,000
Scenario 3 Scenario 1 Scenario 2
$6,000
$8,000
Scenario 1 average - $4.8 million
$2,000
$4,000
Scenario 2 average - $3.5 million
© 2013 KPMG LLP, a Canadian limited liability partnership and a member firm of the KPMG network of independent member firms affiliated with KPMG International Cooperative (“KPMG International”), a Swiss entity. All rights reserved. KPMG CONFIDENTIAL.
44
$- 2013
2014
2015
2016
2017
2018
2019
2020
2021
2022
2023
2024
2025
2026
2027
2028
2029
2030
2031
2032
2033
2034
2035
2036
2037
2038
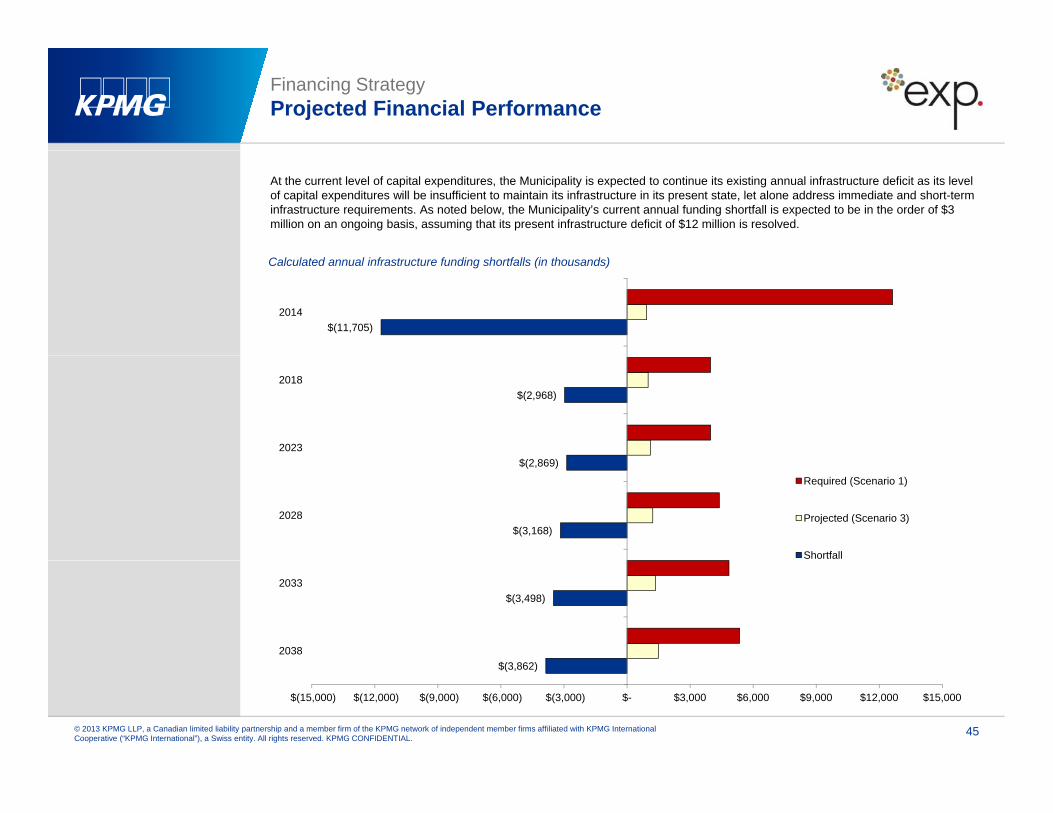
Financing StrategyProjected Financial Performance
At the current level of capital expenditures, the Municipality is expected to continue its existing annual infrastructure deficit as its level of capital expenditures will be insufficient to maintain its infrastructure in its present state, let alone address immediate and short-term infrastructure requirements. As noted below, the Municipality’s current annual funding shortfall is expected to be in the order of $3 million on an ongoing basis, assuming that its present infrastructure deficit of $12 million is resolved.
Calculated annual infrastructure funding shortfalls (in thousands)
$(11,705)2014
$(2,968)
2023
2018
$(3,168)
$(2,869)
2028
Required (Scenario 1)
Projected (Scenario 3)
Shortfall
$(3 862)
$(3,498)
2038
2033
© 2013 KPMG LLP, a Canadian limited liability partnership and a member firm of the KPMG network of independent member firms affiliated with KPMG International Cooperative (“KPMG International”), a Swiss entity. All rights reserved. KPMG CONFIDENTIAL.
45
$(3,862)
$(15,000) $(12,000) $(9,000) $(6,000) $(3,000) $- $3,000 $6,000 $9,000 $12,000 $15,000
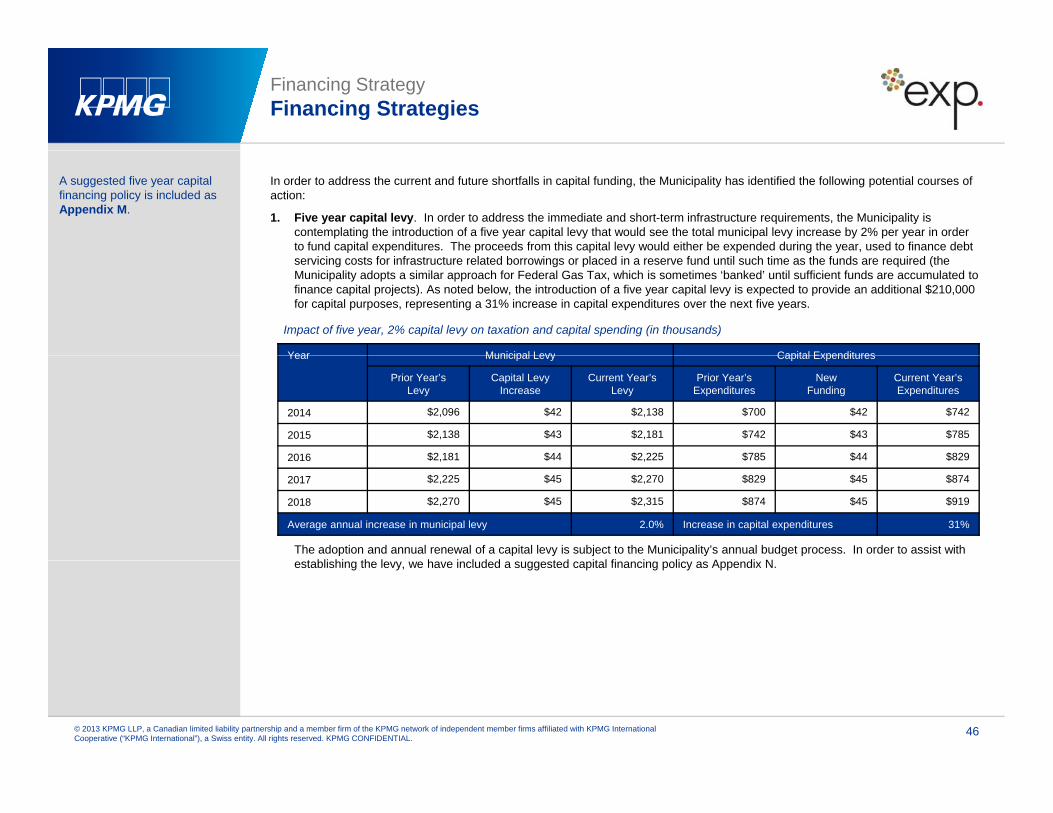
Financing StrategyFinancing Strategies
In order to address the current and future shortfalls in capital funding, the Municipality has identified the following potential courses of action:
1. Five year capital levy. In order to address the immediate and short-term infrastructure requirements, the Municipality is contemplating the introduction of a five year capital levy that would see the total municipal levy increase by 2% per year in order to fund capital expenditures. The proceeds from this capital levy would either be expended during the year, used to finance debt
A suggested five year capital financing policy is included as Appendix M.
servicing costs for infrastructure related borrowings or placed in a reserve fund until such time as the funds are required (theMunicipality adopts a similar approach for Federal Gas Tax, which is sometimes ‘banked’ until sufficient funds are accumulated to finance capital projects). As noted below, the introduction of a five year capital levy is expected to provide an additional $210,000 for capital purposes, representing a 31% increase in capital expenditures over the next five years.
Year Municipal Levy Capital Expenditures
Impact of five year, 2% capital levy on taxation and capital spending (in thousands)
Year Municipal Levy Capital Expenditures
Prior Year’s Levy
Capital Levy Increase
Current Year’s Levy
Prior Year’s Expenditures
New Funding
Current Year’s Expenditures
2014 $2,096 $42 $2,138 $700 $42 $742
2015 $2,138 $43 $2,181 $742 $43 $785
2016 $2 181 $44 $2 225 $785 $44 $829
The adoption and annual renewal of a capital levy is subject to the Municipality’s annual budget process. In order to assist with t bli hi th l h i l d d t d it l fi i li A di N
2016 $2,181 $44 $2,225 $785 $44 $829
2017 $2,225 $45 $2,270 $829 $45 $874
2018 $2,270 $45 $2,315 $874 $45 $919
Average annual increase in municipal levy 2.0% Increase in capital expenditures 31%
establishing the levy, we have included a suggested capital financing policy as Appendix N.
© 2013 KPMG LLP, a Canadian limited liability partnership and a member firm of the KPMG network of independent member firms affiliated with KPMG International Cooperative (“KPMG International”), a Swiss entity. All rights reserved. KPMG CONFIDENTIAL.
46
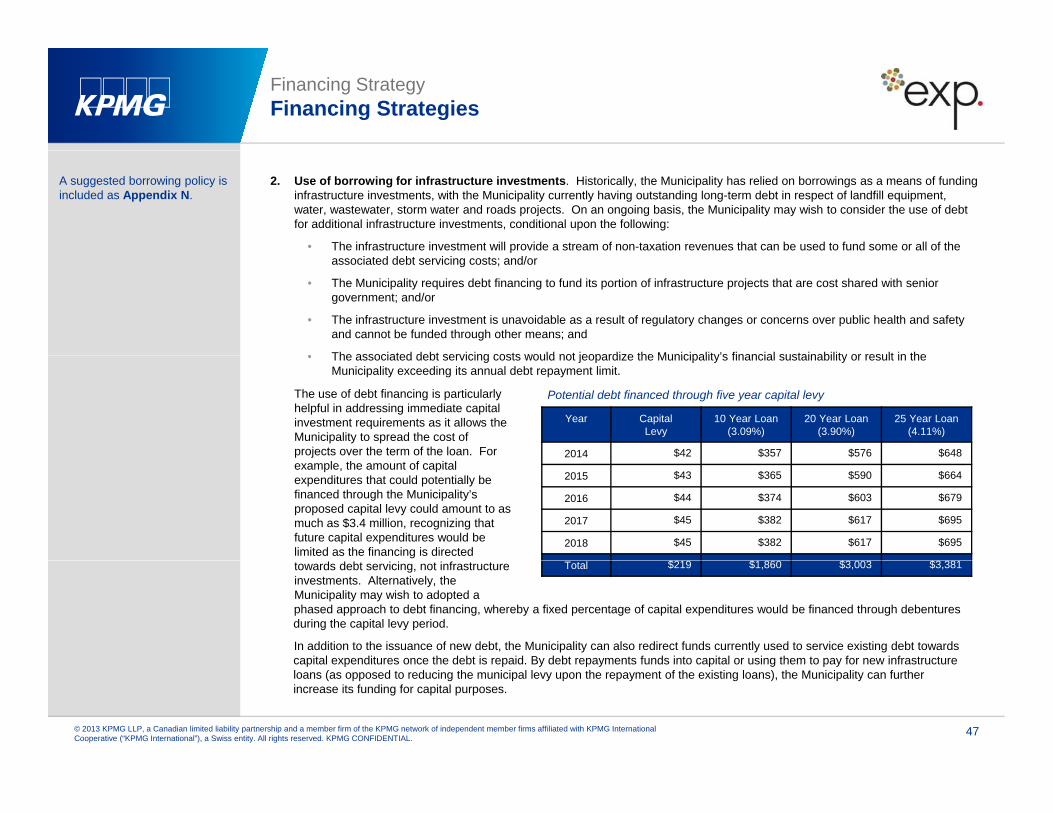
Financing StrategyFinancing Strategies
2. Use of borrowing for infrastructure investments. Historically, the Municipality has relied on borrowings as a means of funding infrastructure investments, with the Municipality currently having outstanding long-term debt in respect of landfill equipment, water, wastewater, storm water and roads projects. On an ongoing basis, the Municipality may wish to consider the use of debt for additional infrastructure investments, conditional upon the following:
• The infrastructure investment will provide a stream of non-taxation revenues that can be used to fund some or all of the
A suggested borrowing policy is included as Appendix N.
associated debt servicing costs; and/or
• The Municipality requires debt financing to fund its portion of infrastructure projects that are cost shared with senior government; and/or
• The infrastructure investment is unavoidable as a result of regulatory changes or concerns over public health and safety and cannot be funded through other means; and
• The associated debt servicing costs would not jeopardize the Municipality’s financial sustainability or result in the
The use of debt financing is particularly helpful in addressing immediate capital investment requirements as it allows the Municipality to spread the cost of projects over the term of the loan. For
• The associated debt servicing costs would not jeopardize the Municipality s financial sustainability or result in the Municipality exceeding its annual debt repayment limit.
Potential debt financed through five year capital levy
Year CapitalLevy
10 Year Loan(3.09%)
20 Year Loan(3.90%)
25 Year Loan (4.11%)
2014 $42 $357 $576 $648 example, the amount of capital expenditures that could potentially be financed through the Municipality’s proposed capital levy could amount to as much as $3.4 million, recognizing that future capital expenditures would be limited as the financing is directed
2015 $43 $365 $590 $664
2016 $44 $374 $603 $679
2017 $45 $382 $617 $695
2018 $45 $382 $617 $695
$219 $1 860 $3 003 $3 381towards debt servicing, not infrastructure investments. Alternatively, the Municipality may wish to adopted a
Total $219 $1,860 $3,003 $3,381
phased approach to debt financing, whereby a fixed percentage of capital expenditures would be financed through debentures during the capital levy period.
In addition to the issuance of new debt, the Municipality can also redirect funds currently used to service existing debt towards capital expenditures once the debt is repaid. By debt repayments funds into capital or using them to pay for new infrastructure
© 2013 KPMG LLP, a Canadian limited liability partnership and a member firm of the KPMG network of independent member firms affiliated with KPMG International Cooperative (“KPMG International”), a Swiss entity. All rights reserved. KPMG CONFIDENTIAL.
47
capital expenditures once the debt is repaid. By debt repayments funds into capital or using them to pay for new infrastructure loans (as opposed to reducing the municipal levy upon the repayment of the existing loans), the Municipality can further increase its funding for capital purposes.
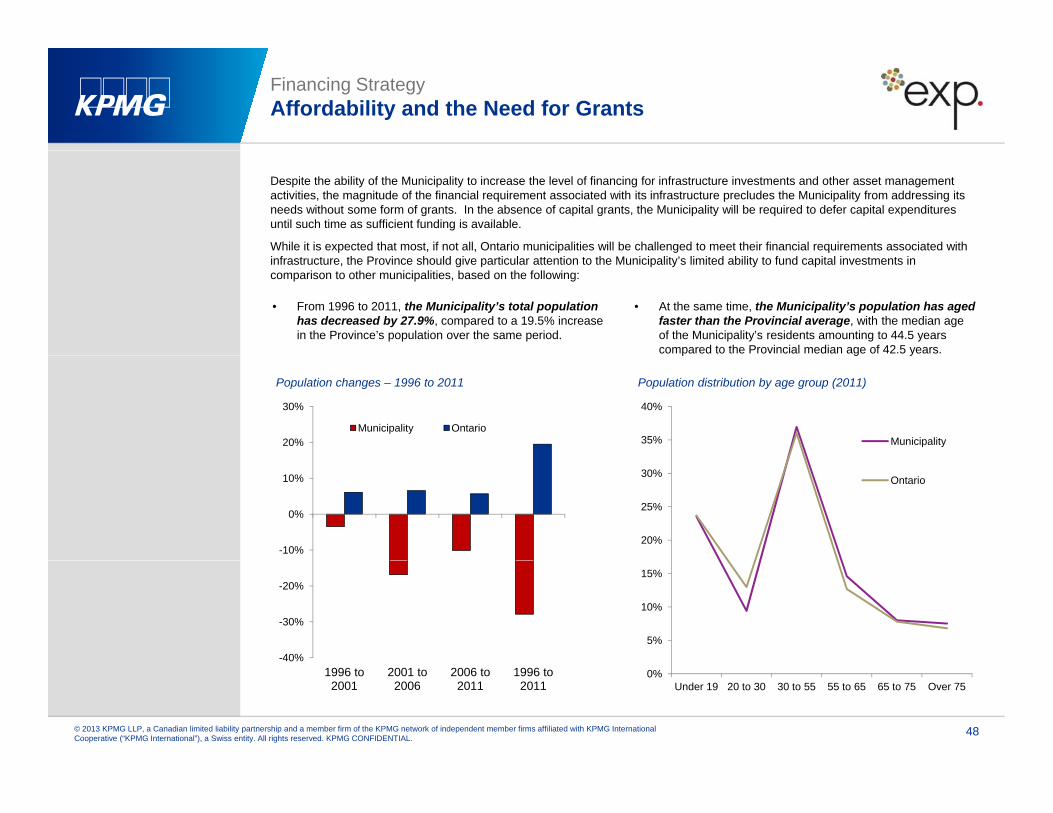
Financing StrategyAffordability and the Need for Grants
Despite the ability of the Municipality to increase the level of financing for infrastructure investments and other asset management activities, the magnitude of the financial requirement associated with its infrastructure precludes the Municipality from addressing its needs without some form of grants. In the absence of capital grants, the Municipality will be required to defer capital expenditures until such time as sufficient funding is available.
While it is expected that most, if not all, Ontario municipalities will be challenged to meet their financial requirements associated with infrastructure, the Province should give particular attention to the Municipality’s limited ability to fund capital investments in comparison to other municipalities, based on the following:
• From 1996 to 2011, the Municipality’s total population has decreased by 27.9%, compared to a 19.5% increase in the Province’s population over the same period.
• At the same time, the Municipality’s population has aged faster than the Provincial average, with the median age of the Municipality’s residents amounting to 44.5 years compared to the Provincial median age of 42.5 years.
35%
40%
Municipality
p g y
20%
30%
Municipality Ontario
Population changes – 1996 to 2011 Population distribution by age group (2011)
20%
25%
30% Ontario
-10%
0%
10%
5%
10%
15%
-40%
-30%
-20%
© 2013 KPMG LLP, a Canadian limited liability partnership and a member firm of the KPMG network of independent member firms affiliated with KPMG International Cooperative (“KPMG International”), a Swiss entity. All rights reserved. KPMG CONFIDENTIAL.
48
0%Under 19 20 to 30 30 to 55 55 to 65 65 to 75 Over 75
1996 to 2001
2001 to 2006
2006 to 2011
1996 to 2011
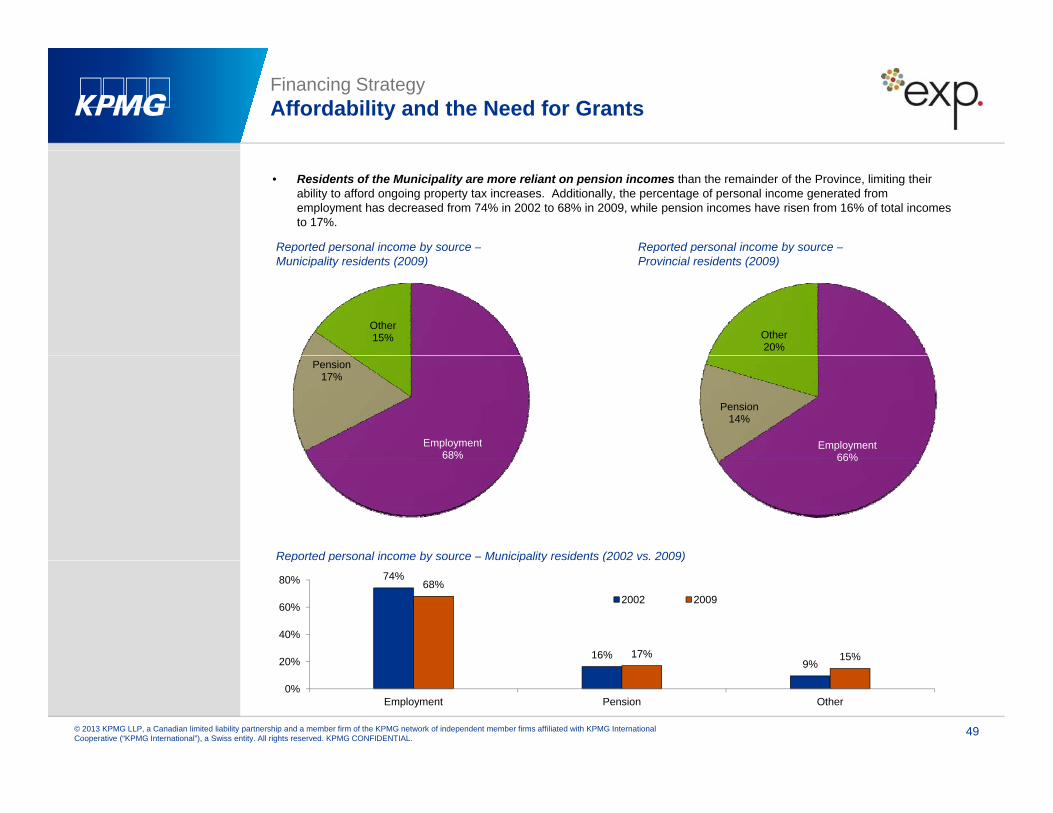
Financing StrategyAffordability and the Need for Grants
• Residents of the Municipality are more reliant on pension incomes than the remainder of the Province, limiting their ability to afford ongoing property tax increases. Additionally, the percentage of personal income generated from employment has decreased from 74% in 2002 to 68% in 2009, while pension incomes have risen from 16% of total incomes to 17%.
Reported personal income by source – Reported personal income by source –
Other15% Other
20%
p p yMunicipality residents (2009)
p p yProvincial residents (2009)
Employment68%
Pension17%
Employment66%
Pension14%
68% 66%
Reported personal income by source – Municipality residents (2002 vs. 2009)p p y p y ( )74%
16%9%
68%
17% 15%20%
40%
60%
80%
2002 2009
© 2013 KPMG LLP, a Canadian limited liability partnership and a member firm of the KPMG network of independent member firms affiliated with KPMG International Cooperative (“KPMG International”), a Swiss entity. All rights reserved. KPMG CONFIDENTIAL.
49
9%
0%
20%
Employment Pension Other
Financing StrategyAffordability and the Need for Grants
In addition to the challenges posed by the changing nature of its demographics, the Municipality is facing additional financial pressures from an operational perspective, including:
• The continuing impacts of inflation, including wage settlements and higher benefit costs, which increase the Municipality’s operating expenditures
• Announced reductions in government funding programs including planned reductions in OMPF funding and decreases in Federal• Announced reductions in government funding programs, including planned reductions in OMPF funding and decreases in Federal Gas Tax funding
In light of its affordability constraints, the Municipality recognizes and appreciates the importance of programs such as the Municipal Infrastructure Investment Initiative and the Small, Rural and Northern Municipal Infrastructure Fund. That said, the current approach to allocating funding to municipalities is extremely problematic from a planning perspective:
• Unlike Federal Gas Tax, which is provided to municipalities as a recurring stream of known funding, the current Provincial infrastructure programs are based on applications with no guarantee of funding success. Accordingly, municipalities are unable to ‘bank’ Provincial infrastructure funding to finance larger capital projects, use proceeds as a source of funding for borrowing costs incurred in connection with infrastructure investments, or plan beyond the current funding submissions.
• The requirement for municipalities to apply for funding through the completion of expressions of interest can be a challenge,particularly for smaller municipalities with limited resources. In a number of instances, smaller municipalities are required to divert staff from other priorities or incur costs for outside consultants in order to complete the required expressions of interestdivert staff from other priorities or incur costs for outside consultants in order to complete the required expressions of interest, with no certainty that they will actually obtain funding.
As a means of maximizing the effectiveness of its capital financing programs, the Municipality requests that the Province consider the following:
• Replacing the current competitive, application based funding process with a committed stream of funding to eligible p g p pp g p g gmunicipalities, thereby supporting long-term planning for infrastructure needs;
• Review the basis for allocating funding to communities, with increased emphasis placed on smaller communities that are challenged to meet their infrastructure needs due to limited assessment growth, higher than average population decreases and lower than average non-residential assessment, all of which pose challenges from an affordability perspective.
• Extending the eligibility requirement for funding programs to include other components of municipal infrastructure that are critical to a community’s success, including airports, vehicles, recreational and cultural assets.
© 2013 KPMG LLP, a Canadian limited liability partnership and a member firm of the KPMG network of independent member firms affiliated with KPMG International Cooperative (“KPMG International”), a Swiss entity. All rights reserved. KPMG CONFIDENTIAL.
50

Asset Management PlanningAsset Management Planning for the Township of Chapleau
Chapter VIChapter VIAsset Management Plan Cross Reference
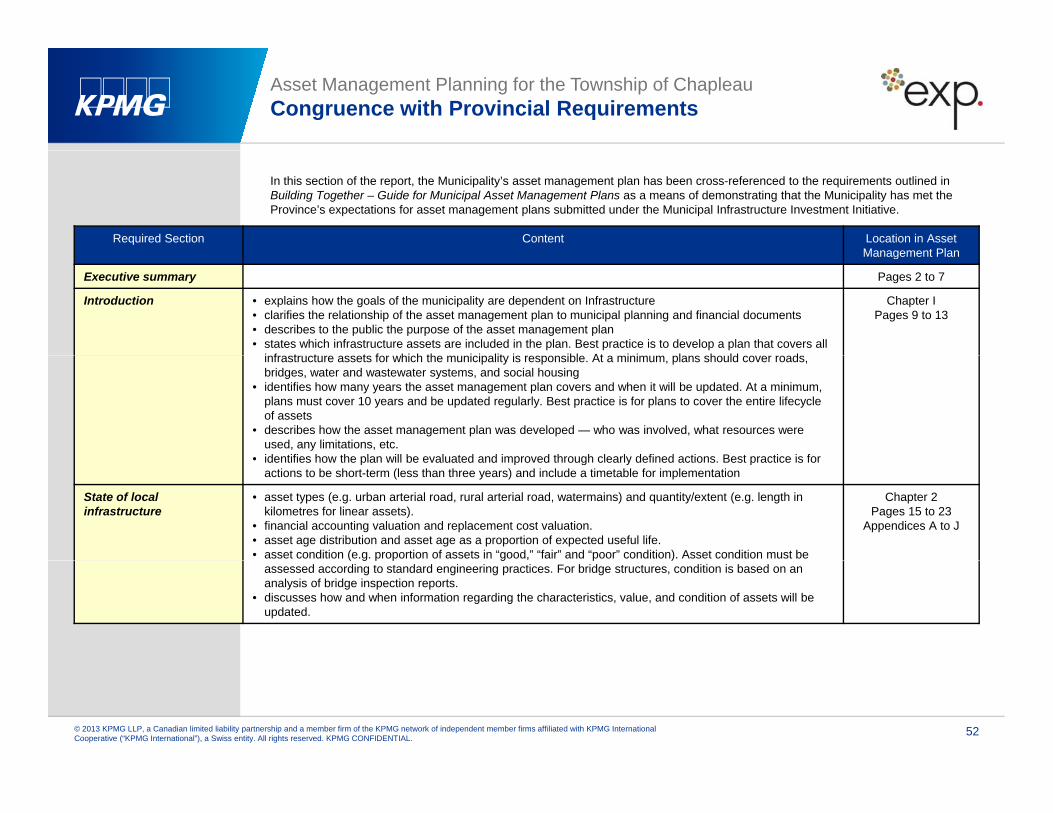
Asset Management Planning for the Township of Chapleau Congruence with Provincial Requirements
In this section of the report, the Municipality’s asset management plan has been cross-referenced to the requirements outlined in Building Together – Guide for Municipal Asset Management Plans as a means of demonstrating that the Municipality has met the Province’s expectations for asset management plans submitted under the Municipal Infrastructure Investment Initiative.
Required Section Content Location in AssetManagement PlanManagement Plan
Executive summary Pages 2 to 7
Introduction • explains how the goals of the municipality are dependent on Infrastructure• clarifies the relationship of the asset management plan to municipal planning and financial documents• describes to the public the purpose of the asset management plan• states which infrastructure assets are included in the plan. Best practice is to develop a plan that covers all
i f t t t f hi h th i i lit i ibl At i i l h ld d
Chapter IPages 9 to 13
infrastructure assets for which the municipality is responsible. At a minimum, plans should cover roads, bridges, water and wastewater systems, and social housing
• identifies how many years the asset management plan covers and when it will be updated. At a minimum, plans must cover 10 years and be updated regularly. Best practice is for plans to cover the entire lifecycle of assets
• describes how the asset management plan was developed — who was involved, what resources were used, any limitations, etc.
• identifies how the plan will be evaluated and improved through clearly defined actions Best practice is for• identifies how the plan will be evaluated and improved through clearly defined actions. Best practice is for actions to be short-term (less than three years) and include a timetable for implementation
State of local infrastructure
• asset types (e.g. urban arterial road, rural arterial road, watermains) and quantity/extent (e.g. length in kilometres for linear assets).
• financial accounting valuation and replacement cost valuation.• asset age distribution and asset age as a proportion of expected useful life.• asset condition (e.g. proportion of assets in “good,” “fair” and “poor” condition). Asset condition must be
Chapter 2Pages 15 to 23
Appendices A to J
( g p p g p )assessed according to standard engineering practices. For bridge structures, condition is based on an analysis of bridge inspection reports.
• discusses how and when information regarding the characteristics, value, and condition of assets will be updated.
© 2013 KPMG LLP, a Canadian limited liability partnership and a member firm of the KPMG network of independent member firms affiliated with KPMG International Cooperative (“KPMG International”), a Swiss entity. All rights reserved. KPMG CONFIDENTIAL.
52
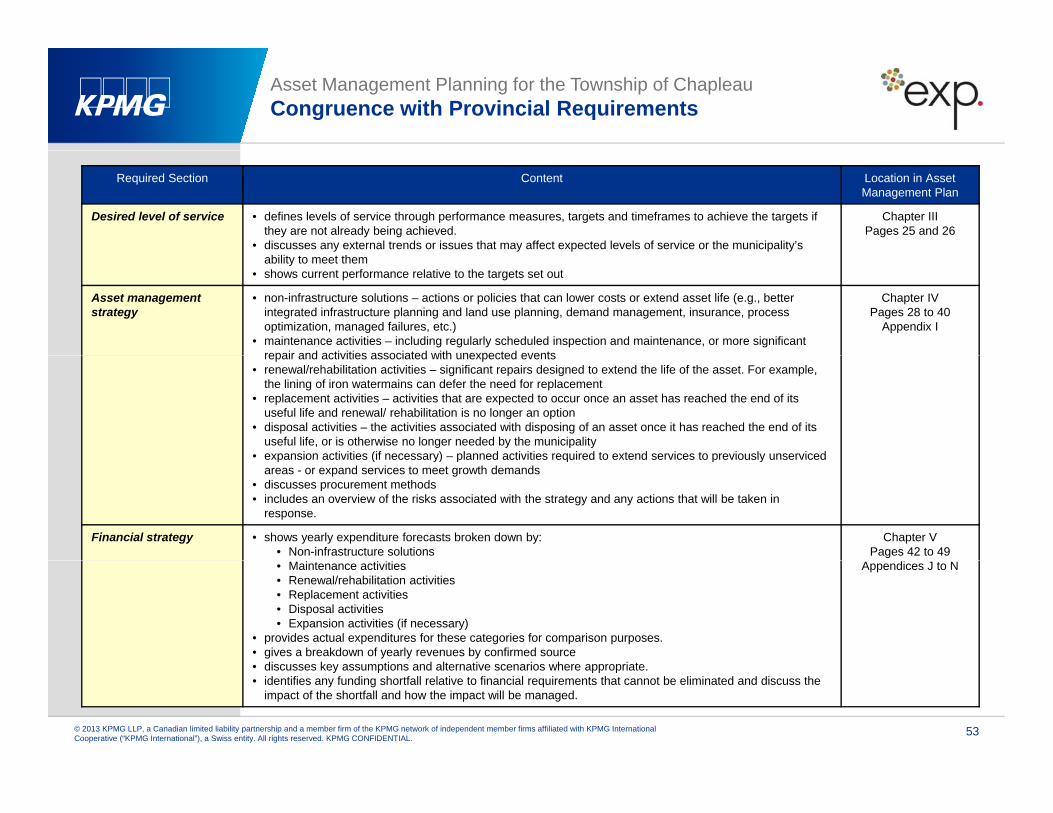
Asset Management Planning for the Township of Chapleau Congruence with Provincial Requirements
Required Section Content Location in AssetManagement Plan
Desired level of service • defines levels of service through performance measures, targets and timeframes to achieve the targets if they are not already being achieved.
• discusses any external trends or issues that may affect expected levels of service or the municipality’s
Chapter IIIPages 25 and 26
ability to meet them• shows current performance relative to the targets set out
Asset managementstrategy
• non-infrastructure solutions – actions or policies that can lower costs or extend asset life (e.g., better integrated infrastructure planning and land use planning, demand management, insurance, process optimization, managed failures, etc.)
• maintenance activities – including regularly scheduled inspection and maintenance, or more significant repair and activities associated with unexpected events
Chapter IVPages 28 to 40
Appendix I
repair and activities associated with unexpected events• renewal/rehabilitation activities – significant repairs designed to extend the life of the asset. For example,
the lining of iron watermains can defer the need for replacement• replacement activities – activities that are expected to occur once an asset has reached the end of its
useful life and renewal/ rehabilitation is no longer an option• disposal activities – the activities associated with disposing of an asset once it has reached the end of its
useful life, or is otherwise no longer needed by the municipality• expansion activities (if necessary) – planned activities required to extend services to previously unservicedexpansion activities (if necessary) planned activities required to extend services to previously unserviced
areas - or expand services to meet growth demands• discusses procurement methods • includes an overview of the risks associated with the strategy and any actions that will be taken in
response.
Financial strategy • shows yearly expenditure forecasts broken down by:• Non-infrastructure solutions
Chapter VPages 42 to 49
• Maintenance activities• Renewal/rehabilitation activities• Replacement activities• Disposal activities• Expansion activities (if necessary)
• provides actual expenditures for these categories for comparison purposes.• gives a breakdown of yearly revenues by confirmed source
di k ti d lt ti i h i t
Appendices J to N
© 2013 KPMG LLP, a Canadian limited liability partnership and a member firm of the KPMG network of independent member firms affiliated with KPMG International Cooperative (“KPMG International”), a Swiss entity. All rights reserved. KPMG CONFIDENTIAL.
53
• discusses key assumptions and alternative scenarios where appropriate. • identifies any funding shortfall relative to financial requirements that cannot be eliminated and discuss the
impact of the shortfall and how the impact will be managed.

Asset Management PlanningAsset Management Planning for the Township of Chapleau
Appendix AAppendix AInfrastructure ProfileRoads
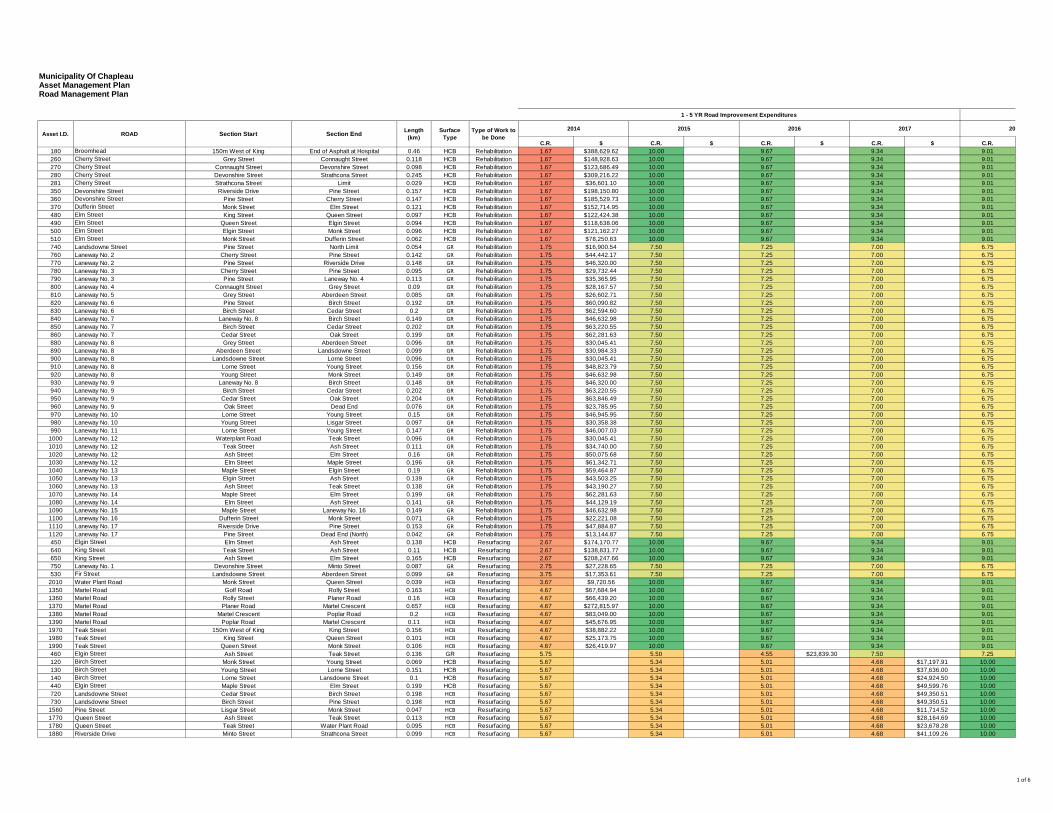
Municipality Of ChapleauAsset Management PlanRoad Management Plan
C.R. $ C.R. $ C.R. $ C.R. $ C.R.180 Broomhead 150m West of King End of Asphalt at Hospital 0.46 HCB Rehabilitation 1.67 $388,629.62 10.00 9.67 9.34 9.01260 Cherry Street Grey Street Connaught Street 0.118 HCB Rehabilitation 1.67 $148,928.63 10.00 9.67 9.34 9.01270 Cherry Street Connaught Street Devonshire Street 0.098 HCB Rehabilitation 1.67 $123,686.49 10.00 9.67 9.34 9.01280 Cherry Street Devonshire Street Strathcona Street 0.245 HCB Rehabilitation 1.67 $309,216.22 10.00 9.67 9.34 9.01281 Cherry Street Strathcona Street Limit 0.029 HCB Rehabilitation 1.67 $36,601.10 10.00 9.67 9.34 9.01350 Devonshire Street Riverside Drive Pine Street 0.157 HCB Rehabilitation 1.67 $198,150.80 10.00 9.67 9.34 9.01360 Devonshire Street Pine Street Cherry Street 0.147 HCB Rehabilitation 1.67 $185,529.73 10.00 9.67 9.34 9.01370 Dufferin Street Monk Street Elm Street 0.121 HCB Rehabilitation 1.67 $152,714.95 10.00 9.67 9.34 9.01480 Elm Street King Street Queen Street 0.097 HCB Rehabilitation 1.67 $122,424.38 10.00 9.67 9.34 9.01490 Elm Street Queen Street Elgin Street 0.094 HCB Rehabilitation 1.67 $118,638.06 10.00 9.67 9.34 9.01500 Elm Street Elgin Street Monk Street 0.096 HCB Rehabilitation 1.67 $121,162.27 10.00 9.67 9.34 9.01510 Elm Street Monk Street Dufferin Street 0.062 HCB Rehabilitation 1.67 $78,250.63 10.00 9.67 9.34 9.01740 Landsdowne Street Pine Street North Limit 0.054 GR Rehabilitation 1.75 $16,900.54 7.50 7.25 7.00 6.75760 Laneway No. 2 Cherry Street Pine Street 0.142 GR Rehabilitation 1.75 $44,442.17 7.50 7.25 7.00 6.75770 Laneway No. 2 Pine Street Riverside Drive 0.148 GR Rehabilitation 1.75 $46,320.00 7.50 7.25 7.00 6.75780 Laneway No. 3 Cherry Street Pine Street 0.095 GR Rehabilitation 1.75 $29,732.44 7.50 7.25 7.00 6.75790 Laneway No. 3 Pine Street Laneway No. 4 0.113 GR Rehabilitation 1.75 $35,365.95 7.50 7.25 7.00 6.75800 Laneway No. 4 Connaught Street Grey Street 0.09 GR Rehabilitation 1.75 $28,167.57 7.50 7.25 7.00 6.75810 Laneway No. 5 Grey Street Aberdeen Street 0.085 GR Rehabilitation 1.75 $26,602.71 7.50 7.25 7.00 6.75820 Laneway No. 6 Pine Street Birch Street 0.192 GR Rehabilitation 1.75 $60,090.82 7.50 7.25 7.00 6.75830 Laneway No. 6 Birch Street Cedar Street 0.2 GR Rehabilitation 1.75 $62,594.60 7.50 7.25 7.00 6.75840 Laneway No. 7 Laneway No. 8 Birch Street 0.149 GR Rehabilitation 1.75 $46,632.98 7.50 7.25 7.00 6.75850 Laneway No. 7 Birch Street Cedar Street 0.202 GR Rehabilitation 1.75 $63,220.55 7.50 7.25 7.00 6.75860 Laneway No. 7 Cedar Street Oak Street 0.199 GR Rehabilitation 1.75 $62,281.63 7.50 7.25 7.00 6.75880 Laneway No. 8 Grey Street Aberdeen Street 0.096 GR Rehabilitation 1.75 $30,045.41 7.50 7.25 7.00 6.75890 Laneway No. 8 Aberdeen Street Landsdowne Street 0.099 GR Rehabilitation 1.75 $30,984.33 7.50 7.25 7.00 6.75900 Laneway No. 8 Landsdowne Street Lorne Street 0.096 GR Rehabilitation 1.75 $30,045.41 7.50 7.25 7.00 6.75910 Laneway No. 8 Lorne Street Young Street 0.156 GR Rehabilitation 1.75 $48,823.79 7.50 7.25 7.00 6.75920 Laneway No. 8 Young Street Monk Street 0.149 GR Rehabilitation 1.75 $46,632.98 7.50 7.25 7.00 6.75930 Laneway No. 9 Laneway No. 8 Birch Street 0.148 GR Rehabilitation 1.75 $46,320.00 7.50 7.25 7.00 6.75940 Laneway No. 9 Birch Street Cedar Street 0.202 GR Rehabilitation 1.75 $63,220.55 7.50 7.25 7.00 6.75950 Laneway No. 9 Cedar Street Oak Street 0.204 GR Rehabilitation 1.75 $63,846.49 7.50 7.25 7.00 6.75960 Laneway No. 9 Oak Street Dead End 0.076 GR Rehabilitation 1.75 $23,785.95 7.50 7.25 7.00 6.75970 Laneway No. 10 Lorne Street Young Street 0.15 GR Rehabilitation 1.75 $46,945.95 7.50 7.25 7.00 6.75980 Laneway No. 10 Young Street Lisgar Street 0.097 GR Rehabilitation 1.75 $30,358.38 7.50 7.25 7.00 6.75990 Laneway No. 11 Lorne Street Young Street 0.147 GR Rehabilitation 1.75 $46,007.03 7.50 7.25 7.00 6.75
1000 Laneway No. 12 Waterplant Road Teak Street 0.096 GR Rehabilitation 1.75 $30,045.41 7.50 7.25 7.00 6.751010 Laneway No. 12 Teak Street Ash Street 0.111 GR Rehabilitation 1.75 $34,740.00 7.50 7.25 7.00 6.751020 Laneway No. 12 Ash Street Elm Street 0.16 GR Rehabilitation 1.75 $50,075.68 7.50 7.25 7.00 6.751030 Laneway No. 12 Elm Street Maple Street 0.196 GR Rehabilitation 1.75 $61,342.71 7.50 7.25 7.00 6.751040 Laneway No. 13 Maple Street Elgin Street 0.19 GR Rehabilitation 1.75 $59,464.87 7.50 7.25 7.00 6.751050 Laneway No. 13 Elgin Street Ash Street 0.139 GR Rehabilitation 1.75 $43,503.25 7.50 7.25 7.00 6.751060 Laneway No. 13 Ash Street Teak Street 0.138 GR Rehabilitation 1.75 $43,190.27 7.50 7.25 7.00 6.751070 Laneway No. 14 Maple Street Elm Street 0.199 GR Rehabilitation 1.75 $62,281.63 7.50 7.25 7.00 6.751080 Laneway No. 14 Elm Street Ash Street 0.141 GR Rehabilitation 1.75 $44,129.19 7.50 7.25 7.00 6.751090 Laneway No. 15 Maple Street Laneway No. 16 0.149 GR Rehabilitation 1.75 $46,632.98 7.50 7.25 7.00 6.751100 Laneway No. 16 Dufferin Street Monk Street 0.071 GR Rehabilitation 1.75 $22,221.08 7.50 7.25 7.00 6.751110 Laneway No. 17 Riverside Drive Pine Street 0.153 GR Rehabilitation 1.75 $47,884.87 7.50 7.25 7.00 6.751120 Laneway No. 17 Pine Street Dead End (North) 0.042 GR Rehabilitation 1.75 $13,144.87 7.50 7.25 7.00 6.75450 Elgin Street Elm Street Ash Street 0.138 HCB Resurfacing 2.67 $174,170.77 10.00 9.67 9.34 9.01640 King Street Teak Street Ash Street 0.11 HCB Resurfacing 2.67 $138,831.77 10.00 9.67 9.34 9.01650 King Street Ash Street Elm Street 0.165 HCB Resurfacing 2.67 $208,247.66 10.00 9.67 9.34 9.01750 Laneway No. 1 Devonshire Street Minto Street 0.087 GR Resurfacing 2.75 $27,228.65 7.50 7.25 7.00 6.75530 Fir Street Landsdowne Street Aberdeen Street 0.099 GR Resurfacing 3.75 $17,353.61 7.50 7.25 7.00 6.75
2010 Water Plant Road Monk Street Queen Street 0.039 HCB Resurfacing 3.67 $9,720.56 10.00 9.67 9.34 9.011350 Martel Road Golf Road Rolly Street 0.163 HCB Resurfacing 4.67 $67,684.94 10.00 9.67 9.34 9.011360 Martel Road Rolly Street Planer Road 0.16 HCB Resurfacing 4.67 $66,439.20 10.00 9.67 9.34 9.011370 Martel Road Planer Road Martel Crescent 0.657 HCB Resurfacing 4.67 $272,815.97 10.00 9.67 9.34 9.011380 Martel Road Martel Crescent Poplar Road 0.2 HCB Resurfacing 4.67 $83,049.00 10.00 9.67 9.34 9.011390 Martel Road Poplar Road Martel Crescent 0.11 HCB Resurfacing 4.67 $45,676.95 10.00 9.67 9.34 9.011970 Teak Street 150m West of King King Street 0.156 HCB Resurfacing 4.67 $38,882.22 10.00 9.67 9.34 9.011980 Teak Street King Street Queen Street 0.101 HCB Resurfacing 4.67 $25,173.75 10.00 9.67 9.34 9.011990 Teak Street Queen Street Monk Street 0.106 HCB Resurfacing 4.67 $26,419.97 10.00 9.67 9.34 9.01460 Elgin Street Ash Street Teak Street 0.136 GR Resurfacing 5.75 5.50 4.55 $23,839.30 7.50 7.25120 Birch Street Monk Street Young Street 0.069 HCB Resurfacing 5.67 5.34 5.01 4.68 $17,197.91 10.00130 Birch Street Young Street Lorne Street 0.151 HCB Resurfacing 5.67 5.34 5.01 4.68 $37,636.00 10.00140 Birch Street Lorne Street Lansdowne Street 0.1 HCB Resurfacing 5.67 5.34 5.01 4.68 $24,924.50 10.00440 Elgin Street Maple Street Elm Street 0.199 HCB Resurfacing 5.67 5.34 5.01 4.68 $49,599.76 10.00720 Landsdowne Street Cedar Street Birch Street 0.198 HCB Resurfacing 5.67 5.34 5.01 4.68 $49,350.51 10.00730 Landsdowne Street Birch Street Pine Street 0.198 HCB Resurfacing 5.67 5.34 5.01 4.68 $49,350.51 10.00
1560 Pine Street Lisgar Street Monk Street 0.047 HCB Resurfacing 5.67 5.34 5.01 4.68 $11,714.52 10.001770 Queen Street Ash Street Teak Street 0.113 HCB Resurfacing 5.67 5.34 5.01 4.68 $28,164.69 10.001780 Queen Street Teak Street Water Plant Road 0.095 HCB Resurfacing 5.67 5.34 5.01 4.68 $23,678.28 10.001880 Riverside Drive Minto Street Strathcona Street 0.099 HCB Resurfacing 5.67 5.34 5.01 4.68 $41,109.26 10.00
1 - 5 YR Road Improvement Expenditures
ROAD Section Start Section End Length (km)
2016 2017 202014Asset I.D.
2015Surface Type
Type of Work to be Done
1 of 6
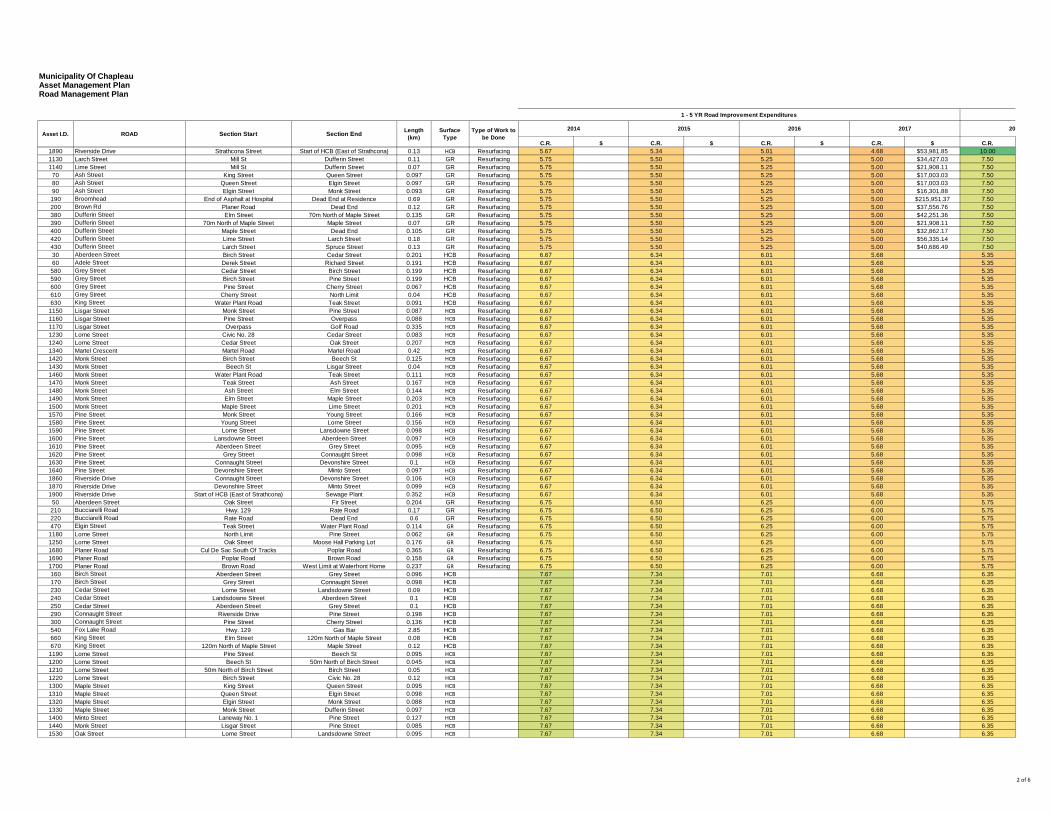
Municipality Of ChapleauAsset Management PlanRoad Management Plan
C.R. $ C.R. $ C.R. $ C.R. $ C.R.
1 - 5 YR Road Improvement Expenditures
ROAD Section Start Section End Length (km)
2016 2017 202014Asset I.D.
2015Surface Type
Type of Work to be Done
1890 Riverside Drive Strathcona Street Start of HCB (East of Strathcona) 0.13 HCB Resurfacing 5.67 5.34 5.01 4.68 $53,981.85 10.001130 Larch Street Mill St Dufferin Street 0.11 GR Resurfacing 5.75 5.50 5.25 5.00 $34,427.03 7.501140 Lime Street Mill St Dufferin Street 0.07 GR Resurfacing 5.75 5.50 5.25 5.00 $21,908.11 7.50
70 Ash Street King Street Queen Street 0.097 GR Resurfacing 5.75 5.50 5.25 5.00 $17,003.03 7.5080 Ash Street Queen Street Elgin Street 0.097 GR Resurfacing 5.75 5.50 5.25 5.00 $17,003.03 7.5090 Ash Street Elgin Street Monk Street 0.093 GR Resurfacing 5.75 5.50 5.25 5.00 $16,301.88 7.50190 Broomhead End of Asphalt at Hospital Dead End at Residence 0.69 GR Resurfacing 5.75 5.50 5.25 5.00 $215,951.37 7.50200 Brown Rd Planer Road Dead End 0.12 GR Resurfacing 5.75 5.50 5.25 5.00 $37,556.76 7.50380 Dufferin Street Elm Street 70m North of Maple Street 0.135 GR Resurfacing 5.75 5.50 5.25 5.00 $42,251.36 7.50390 Dufferin Street 70m North of Maple Street Maple Street 0.07 GR Resurfacing 5.75 5.50 5.25 5.00 $21,908.11 7.50400 Dufferin Street Maple Street Dead End 0.105 GR Resurfacing 5.75 5.50 5.25 5.00 $32,862.17 7.50420 Dufferin Street Lime Street Larch Street 0.18 GR Resurfacing 5.75 5.50 5.25 5.00 $56,335.14 7.50430 Dufferin Street Larch Street Spruce Street 0.13 GR Resurfacing 5.75 5.50 5.25 5.00 $40,686.49 7.5030 Aberdeen Street Birch Street Cedar Street 0.201 HCB Resurfacing 6.67 6.34 6.01 5.68 5.3560 Adele Street Derek Street Richard Street 0.191 HCB Resurfacing 6.67 6.34 6.01 5.68 5.35580 Grey Street Cedar Street Birch Street 0.199 HCB Resurfacing 6.67 6.34 6.01 5.68 5.35590 Grey Street Birch Street Pine Street 0.199 HCB Resurfacing 6.67 6.34 6.01 5.68 5.35600 Grey Street Pine Street Cherry Street 0.067 HCB Resurfacing 6.67 6.34 6.01 5.68 5.35610 Grey Street Cherry Street North Limit 0.04 HCB Resurfacing 6.67 6.34 6.01 5.68 5.35630 King Street Water Plant Road Teak Street 0.091 HCB Resurfacing 6.67 6.34 6.01 5.68 5.35
1150 Lisgar Street Monk Street Pine Street 0.087 HCB Resurfacing 6.67 6.34 6.01 5.68 5.351160 Lisgar Street Pine Street Overpass 0.088 HCB Resurfacing 6.67 6.34 6.01 5.68 5.351170 Lisgar Street Overpass Golf Road 0.335 HCB Resurfacing 6.67 6.34 6.01 5.68 5.351230 Lorne Street Civic No. 28 Cedar Street 0.083 HCB Resurfacing 6.67 6.34 6.01 5.68 5.351240 Lorne Street Cedar Street Oak Street 0.207 HCB Resurfacing 6.67 6.34 6.01 5.68 5.351340 Martel Crescent Martel Road Martel Road 0.42 HCB Resurfacing 6.67 6.34 6.01 5.68 5.351420 Monk Street Birch Street Beech St 0.125 HCB Resurfacing 6.67 6.34 6.01 5.68 5.351430 Monk Street Beech St Lisgar Street 0.04 HCB Resurfacing 6.67 6.34 6.01 5.68 5.351460 Monk Street Water Plant Road Teak Street 0.111 HCB Resurfacing 6.67 6.34 6.01 5.68 5.351470 Monk Street Teak Street Ash Street 0.167 HCB Resurfacing 6.67 6.34 6.01 5.68 5.351480 Monk Street Ash Street Elm Street 0.144 HCB Resurfacing 6.67 6.34 6.01 5.68 5.351490 Monk Street Elm Street Maple Street 0.203 HCB Resurfacing 6.67 6.34 6.01 5.68 5.351500 Monk Street Maple Street Lime Street 0.201 HCB Resurfacing 6.67 6.34 6.01 5.68 5.351570 Pine Street Monk Street Young Street 0.166 HCB Resurfacing 6.67 6.34 6.01 5.68 5.351580 Pine Street Young Street Lorne Street 0.156 HCB Resurfacing 6.67 6.34 6.01 5.68 5.351590 Pine Street Lorne Street Lansdowne Street 0.098 HCB Resurfacing 6.67 6.34 6.01 5.68 5.351600 Pine Street Lansdowne Street Aberdeen Street 0.097 HCB Resurfacing 6.67 6.34 6.01 5.68 5.351610 Pine Street Aberdeen Street Grey Street 0.095 HCB Resurfacing 6.67 6.34 6.01 5.68 5.351620 Pine Street Grey Street Connaught Street 0.098 HCB Resurfacing 6.67 6.34 6.01 5.68 5.351630 Pine Street Connaught Street Devonshire Street 0.1 HCB Resurfacing 6.67 6.34 6.01 5.68 5.351640 Pine Street Devonshire Street Minto Street 0.097 HCB Resurfacing 6.67 6.34 6.01 5.68 5.351860 Riverside Drive Connaught Street Devonshire Street 0.106 HCB Resurfacing 6.67 6.34 6.01 5.68 5.351870 Riverside Drive Devonshire Street Minto Street 0.099 HCB Resurfacing 6.67 6.34 6.01 5.68 5.351900 Riverside Drive Start of HCB (East of Strathcona) Sewage Plant 0.352 HCB Resurfacing 6.67 6.34 6.01 5.68 5.35
50 Aberdeen Street Oak Street Fir Street 0.204 GR Resurfacing 6.75 6.50 6.25 6.00 5.75210 Bucciarelli Road Hwy. 129 Rate Road 0.17 GR Resurfacing 6.75 6.50 6.25 6.00 5.75220 Bucciarelli Road Rate Road Dead End 0.6 GR Resurfacing 6.75 6.50 6.25 6.00 5.75470 Elgin Street Teak Street Water Plant Road 0.114 GR Resurfacing 6.75 6.50 6.25 6.00 5.75
1180 Lorne Street North Limit Pine Street 0.062 GR Resurfacing 6.75 6.50 6.25 6.00 5.751250 Lorne Street Oak Street Moose Hall Parking Lot 0.176 GR Resurfacing 6.75 6.50 6.25 6.00 5.751680 Planer Road Cul De Sac South Of Tracks Poplar Road 0.365 GR Resurfacing 6.75 6.50 6.25 6.00 5.751690 Planer Road Poplar Road Brown Road 0.158 GR Resurfacing 6.75 6.50 6.25 6.00 5.751700 Planer Road Brown Road West Limit at Waterfront Home 0.237 GR Resurfacing 6.75 6.50 6.25 6.00 5.75160 Birch Street Aberdeen Street Grey Street 0.096 HCB 7.67 7.34 7.01 6.68 6.35170 Birch Street Grey Street Connaught Street 0.098 HCB 7.67 7.34 7.01 6.68 6.35230 Cedar Street Lorne Street Landsdowne Street 0.09 HCB 7.67 7.34 7.01 6.68 6.35240 Cedar Street Landsdowne Street Aberdeen Street 0.1 HCB 7.67 7.34 7.01 6.68 6.35250 Cedar Street Aberdeen Street Grey Street 0.1 HCB 7.67 7.34 7.01 6.68 6.35290 Connaught Street Riverside Drive Pine Street 0.198 HCB 7.67 7.34 7.01 6.68 6.35300 Connaught Street Pine Street Cherry Street 0.136 HCB 7.67 7.34 7.01 6.68 6.35540 Fox Lake Road Hwy. 129 Gas Bar 2.85 HCB 7.67 7.34 7.01 6.68 6.35660 King Street Elm Street 120m North of Maple Street 0.08 HCB 7.67 7.34 7.01 6.68 6.35670 King Street 120m North of Maple Street Maple Street 0.12 HCB 7.67 7.34 7.01 6.68 6.35
1190 Lorne Street Pine Street Beech St 0.095 HCB 7.67 7.34 7.01 6.68 6.351200 Lorne Street Beech St 50m North of Birch Street 0.045 HCB 7.67 7.34 7.01 6.68 6.351210 Lorne Street 50m North of Birch Street Birch Street 0.05 HCB 7.67 7.34 7.01 6.68 6.351220 Lorne Street Birch Street Civic No. 28 0.12 HCB 7.67 7.34 7.01 6.68 6.351300 Maple Street King Street Queen Street 0.095 HCB 7.67 7.34 7.01 6.68 6.351310 Maple Street Queen Street Elgin Street 0.098 HCB 7.67 7.34 7.01 6.68 6.351320 Maple Street Elgin Street Monk Street 0.088 HCB 7.67 7.34 7.01 6.68 6.351330 Maple Street Monk Street Dufferin Street 0.097 HCB 7.67 7.34 7.01 6.68 6.351400 Minto Street Laneway No. 1 Pine Street 0.127 HCB 7.67 7.34 7.01 6.68 6.351440 Monk Street Lisgar Street Pine Street 0.085 HCB 7.67 7.34 7.01 6.68 6.351530 Oak Street Lorne Street Landsdowne Street 0.095 HCB 7.67 7.34 7.01 6.68 6.35
2 of 6
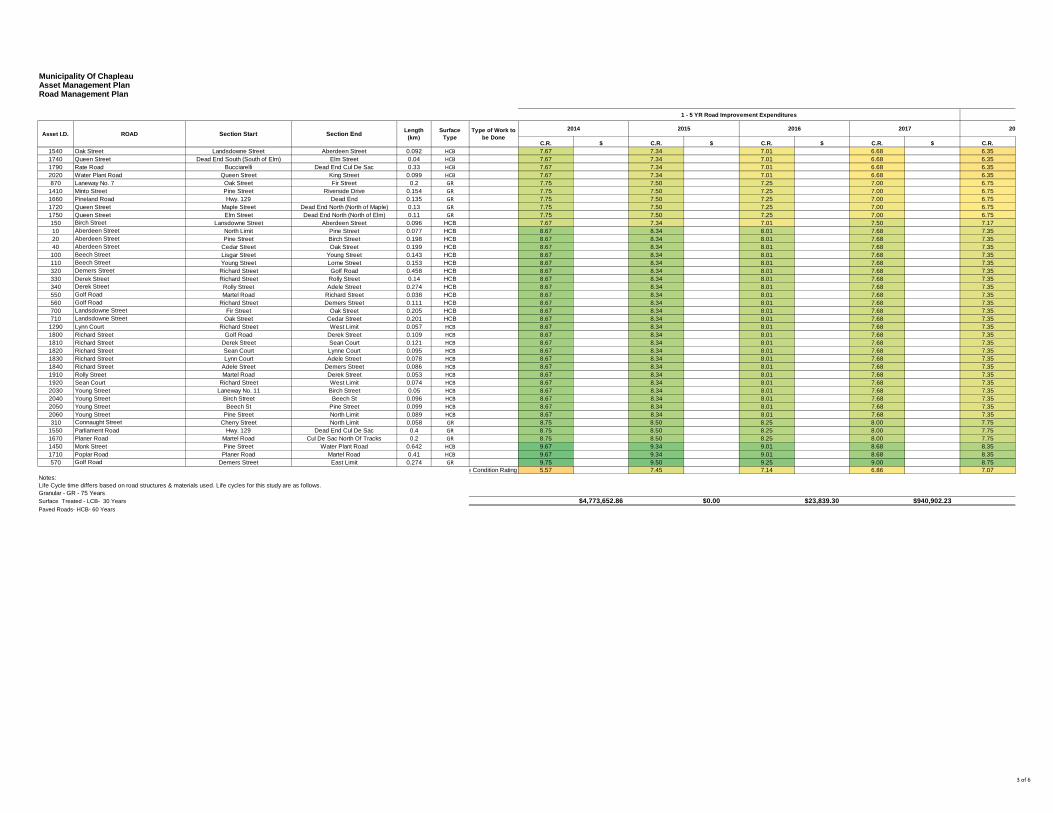
Municipality Of ChapleauAsset Management PlanRoad Management Plan
C.R. $ C.R. $ C.R. $ C.R. $ C.R.
1 - 5 YR Road Improvement Expenditures
ROAD Section Start Section End Length (km)
2016 2017 202014Asset I.D.
2015Surface Type
Type of Work to be Done
1540 Oak Street Landsdowne Street Aberdeen Street 0.092 HCB 7.67 7.34 7.01 6.68 6.351740 Queen Street Dead End South (South of Elm) Elm Street 0.04 HCB 7.67 7.34 7.01 6.68 6.351790 Rate Road Bucciarelli Dead End Cul De Sac 0.33 HCB 7.67 7.34 7.01 6.68 6.352020 Water Plant Road Queen Street King Street 0.099 HCB 7.67 7.34 7.01 6.68 6.35870 Laneway No. 7 Oak Street Fir Street 0.2 GR 7.75 7.50 7.25 7.00 6.75
1410 Minto Street Pine Street Riverside Drive 0.154 GR 7.75 7.50 7.25 7.00 6.751660 Pineland Road Hwy. 129 Dead End 0.135 GR 7.75 7.50 7.25 7.00 6.751720 Queen Street Maple Street Dead End North (North of Maple) 0.13 GR 7.75 7.50 7.25 7.00 6.751750 Queen Street Elm Street Dead End North (North of Elm) 0.11 GR 7.75 7.50 7.25 7.00 6.75150 Birch Street Lansdowne Street Aberdeen Street 0.096 HCB 7.67 7.34 7.01 7.50 7.1710 Aberdeen Street North Limit Pine Street 0.077 HCB 8.67 8.34 8.01 7.68 7.3520 Aberdeen Street Pine Street Birch Street 0.198 HCB 8.67 8.34 8.01 7.68 7.3540 Aberdeen Street Cedar Street Oak Street 0.199 HCB 8.67 8.34 8.01 7.68 7.35100 Beech Street Lisgar Street Young Street 0.143 HCB 8.67 8.34 8.01 7.68 7.35110 Beech Street Young Street Lorne Street 0.153 HCB 8.67 8.34 8.01 7.68 7.35320 Demers Street Richard Street Golf Road 0.458 HCB 8.67 8.34 8.01 7.68 7.35330 Derek Street Richard Street Rolly Street 0.14 HCB 8.67 8.34 8.01 7.68 7.35340 Derek Street Rolly Street Adele Street 0.274 HCB 8.67 8.34 8.01 7.68 7.35550 Golf Road Martel Road Richard Street 0.038 HCB 8.67 8.34 8.01 7.68 7.35560 Golf Road Richard Street Demers Street 0.111 HCB 8.67 8.34 8.01 7.68 7.35700 Landsdowne Street Fir Street Oak Street 0.205 HCB 8.67 8.34 8.01 7.68 7.35710 Landsdowne Street Oak Street Cedar Street 0.201 HCB 8.67 8.34 8.01 7.68 7.35
1290 Lynn Court Richard Street West Limit 0.057 HCB 8.67 8.34 8.01 7.68 7.351800 Richard Street Golf Road Derek Street 0.109 HCB 8.67 8.34 8.01 7.68 7.351810 Richard Street Derek Street Sean Court 0.121 HCB 8.67 8.34 8.01 7.68 7.351820 Richard Street Sean Court Lynne Court 0.095 HCB 8.67 8.34 8.01 7.68 7.351830 Richard Street Lynn Court Adele Street 0.078 HCB 8.67 8.34 8.01 7.68 7.351840 Richard Street Adele Street Demers Street 0.086 HCB 8.67 8.34 8.01 7.68 7.351910 Rolly Street Martel Road Derek Street 0.053 HCB 8.67 8.34 8.01 7.68 7.351920 Sean Court Richard Street West Limit 0.074 HCB 8.67 8.34 8.01 7.68 7.352030 Young Street Laneway No. 11 Birch Street 0.05 HCB 8.67 8.34 8.01 7.68 7.352040 Young Street Birch Street Beech St 0.096 HCB 8.67 8.34 8.01 7.68 7.352050 Young Street Beech St Pine Street 0.099 HCB 8.67 8.34 8.01 7.68 7.352060 Young Street Pine Street North Limit 0.089 HCB 8.67 8.34 8.01 7.68 7.35310 Connaught Street Cherry Street North Limit 0.058 GR 8.75 8.50 8.25 8.00 7.75
1550 Parliament Road Hwy. 129 Dead End Cul De Sac 0.4 GR 8.75 8.50 8.25 8.00 7.751670 Planer Road Martel Road Cul De Sac North Of Tracks 0.2 GR 8.75 8.50 8.25 8.00 7.751450 Monk Street Pine Street Water Plant Road 0.642 HCB 9.67 9.34 9.01 8.68 8.351710 Poplar Road Planer Road Martel Road 0.41 HCB 9.67 9.34 9.01 8.68 8.35570 Golf Road Demers Street East Limit 0.274 GR 9.75 9.50 9.25 9.00 8.75
5.57 7.45 7.14 6.86 7.07Notes:Life Cycle time differs based on road structures & materials used. Life cycles for this study are as follows.Granular - GR - 75 YearsSurface Treated - LCB- 30 Years $4,773,652.86 $0.00 $23,839.30 $940,902.23Paved Roads- HCB- 60 Years
e Condition Rating
3 of 6
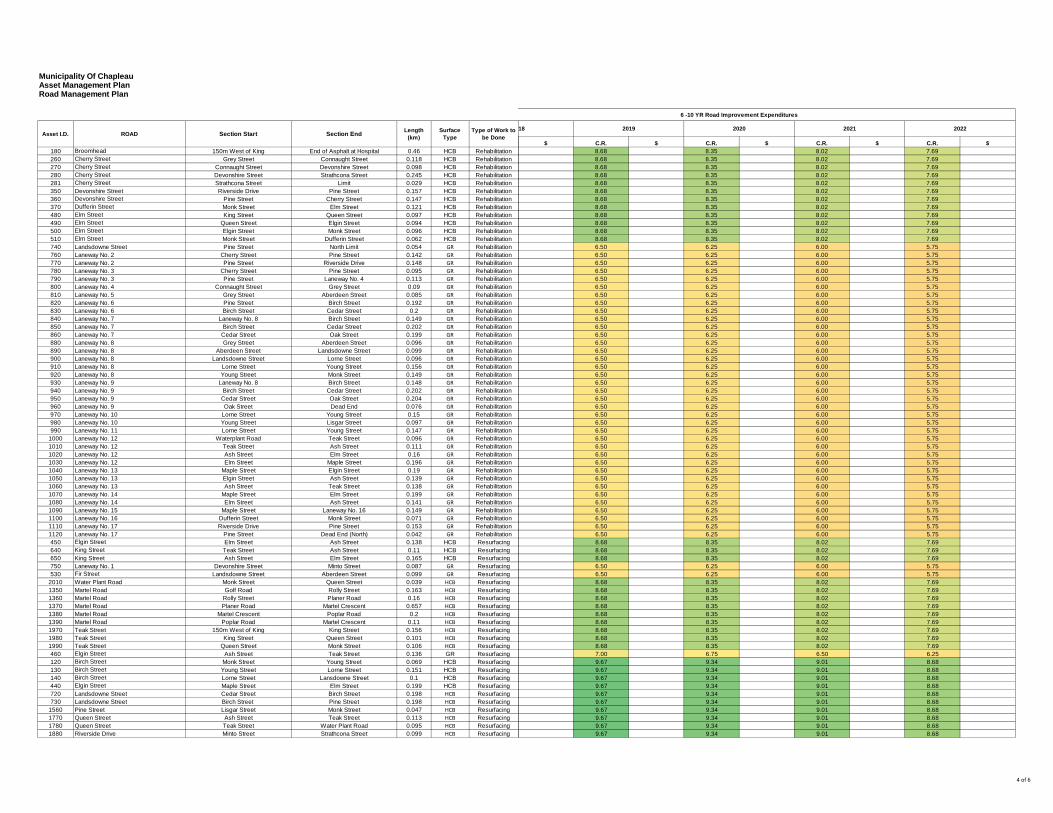
Municipality Of ChapleauAsset Management PlanRoad Management Plan
180 Broomhead 150m West of King End of Asphalt at Hospital 0.46 HCB Rehabilitation260 Cherry Street Grey Street Connaught Street 0.118 HCB Rehabilitation270 Cherry Street Connaught Street Devonshire Street 0.098 HCB Rehabilitation280 Cherry Street Devonshire Street Strathcona Street 0.245 HCB Rehabilitation281 Cherry Street Strathcona Street Limit 0.029 HCB Rehabilitation350 Devonshire Street Riverside Drive Pine Street 0.157 HCB Rehabilitation360 Devonshire Street Pine Street Cherry Street 0.147 HCB Rehabilitation370 Dufferin Street Monk Street Elm Street 0.121 HCB Rehabilitation480 Elm Street King Street Queen Street 0.097 HCB Rehabilitation490 Elm Street Queen Street Elgin Street 0.094 HCB Rehabilitation500 Elm Street Elgin Street Monk Street 0.096 HCB Rehabilitation510 Elm Street Monk Street Dufferin Street 0.062 HCB Rehabilitation740 Landsdowne Street Pine Street North Limit 0.054 GR Rehabilitation760 Laneway No. 2 Cherry Street Pine Street 0.142 GR Rehabilitation770 Laneway No. 2 Pine Street Riverside Drive 0.148 GR Rehabilitation780 Laneway No. 3 Cherry Street Pine Street 0.095 GR Rehabilitation790 Laneway No. 3 Pine Street Laneway No. 4 0.113 GR Rehabilitation800 Laneway No. 4 Connaught Street Grey Street 0.09 GR Rehabilitation810 Laneway No. 5 Grey Street Aberdeen Street 0.085 GR Rehabilitation820 Laneway No. 6 Pine Street Birch Street 0.192 GR Rehabilitation830 Laneway No. 6 Birch Street Cedar Street 0.2 GR Rehabilitation840 Laneway No. 7 Laneway No. 8 Birch Street 0.149 GR Rehabilitation850 Laneway No. 7 Birch Street Cedar Street 0.202 GR Rehabilitation860 Laneway No. 7 Cedar Street Oak Street 0.199 GR Rehabilitation880 Laneway No. 8 Grey Street Aberdeen Street 0.096 GR Rehabilitation890 Laneway No. 8 Aberdeen Street Landsdowne Street 0.099 GR Rehabilitation900 Laneway No. 8 Landsdowne Street Lorne Street 0.096 GR Rehabilitation910 Laneway No. 8 Lorne Street Young Street 0.156 GR Rehabilitation920 Laneway No. 8 Young Street Monk Street 0.149 GR Rehabilitation930 Laneway No. 9 Laneway No. 8 Birch Street 0.148 GR Rehabilitation940 Laneway No. 9 Birch Street Cedar Street 0.202 GR Rehabilitation950 Laneway No. 9 Cedar Street Oak Street 0.204 GR Rehabilitation960 Laneway No. 9 Oak Street Dead End 0.076 GR Rehabilitation970 Laneway No. 10 Lorne Street Young Street 0.15 GR Rehabilitation980 Laneway No. 10 Young Street Lisgar Street 0.097 GR Rehabilitation990 Laneway No. 11 Lorne Street Young Street 0.147 GR Rehabilitation
1000 Laneway No. 12 Waterplant Road Teak Street 0.096 GR Rehabilitation1010 Laneway No. 12 Teak Street Ash Street 0.111 GR Rehabilitation1020 Laneway No. 12 Ash Street Elm Street 0.16 GR Rehabilitation1030 Laneway No. 12 Elm Street Maple Street 0.196 GR Rehabilitation1040 Laneway No. 13 Maple Street Elgin Street 0.19 GR Rehabilitation1050 Laneway No. 13 Elgin Street Ash Street 0.139 GR Rehabilitation1060 Laneway No. 13 Ash Street Teak Street 0.138 GR Rehabilitation1070 Laneway No. 14 Maple Street Elm Street 0.199 GR Rehabilitation1080 Laneway No. 14 Elm Street Ash Street 0.141 GR Rehabilitation1090 Laneway No. 15 Maple Street Laneway No. 16 0.149 GR Rehabilitation1100 Laneway No. 16 Dufferin Street Monk Street 0.071 GR Rehabilitation1110 Laneway No. 17 Riverside Drive Pine Street 0.153 GR Rehabilitation1120 Laneway No. 17 Pine Street Dead End (North) 0.042 GR Rehabilitation450 Elgin Street Elm Street Ash Street 0.138 HCB Resurfacing640 King Street Teak Street Ash Street 0.11 HCB Resurfacing650 King Street Ash Street Elm Street 0.165 HCB Resurfacing750 Laneway No. 1 Devonshire Street Minto Street 0.087 GR Resurfacing530 Fir Street Landsdowne Street Aberdeen Street 0.099 GR Resurfacing
2010 Water Plant Road Monk Street Queen Street 0.039 HCB Resurfacing1350 Martel Road Golf Road Rolly Street 0.163 HCB Resurfacing1360 Martel Road Rolly Street Planer Road 0.16 HCB Resurfacing1370 Martel Road Planer Road Martel Crescent 0.657 HCB Resurfacing1380 Martel Road Martel Crescent Poplar Road 0.2 HCB Resurfacing1390 Martel Road Poplar Road Martel Crescent 0.11 HCB Resurfacing1970 Teak Street 150m West of King King Street 0.156 HCB Resurfacing1980 Teak Street King Street Queen Street 0.101 HCB Resurfacing1990 Teak Street Queen Street Monk Street 0.106 HCB Resurfacing460 Elgin Street Ash Street Teak Street 0.136 GR Resurfacing120 Birch Street Monk Street Young Street 0.069 HCB Resurfacing130 Birch Street Young Street Lorne Street 0.151 HCB Resurfacing140 Birch Street Lorne Street Lansdowne Street 0.1 HCB Resurfacing440 Elgin Street Maple Street Elm Street 0.199 HCB Resurfacing720 Landsdowne Street Cedar Street Birch Street 0.198 HCB Resurfacing730 Landsdowne Street Birch Street Pine Street 0.198 HCB Resurfacing
1560 Pine Street Lisgar Street Monk Street 0.047 HCB Resurfacing1770 Queen Street Ash Street Teak Street 0.113 HCB Resurfacing1780 Queen Street Teak Street Water Plant Road 0.095 HCB Resurfacing1880 Riverside Drive Minto Street Strathcona Street 0.099 HCB Resurfacing
ROAD Section Start Section End Length (km)Asset I.D. Surface
TypeType of Work to
be Done$ C.R. $ C.R. $ C.R. $ C.R. $
8.68 8.35 8.02 7.698.68 8.35 8.02 7.698.68 8.35 8.02 7.698.68 8.35 8.02 7.698.68 8.35 8.02 7.698.68 8.35 8.02 7.698.68 8.35 8.02 7.698.68 8.35 8.02 7.698.68 8.35 8.02 7.698.68 8.35 8.02 7.698.68 8.35 8.02 7.698.68 8.35 8.02 7.696.50 6.25 6.00 5.756.50 6.25 6.00 5.756.50 6.25 6.00 5.756.50 6.25 6.00 5.756.50 6.25 6.00 5.756.50 6.25 6.00 5.756.50 6.25 6.00 5.756.50 6.25 6.00 5.756.50 6.25 6.00 5.756.50 6.25 6.00 5.756.50 6.25 6.00 5.756.50 6.25 6.00 5.756.50 6.25 6.00 5.756.50 6.25 6.00 5.756.50 6.25 6.00 5.756.50 6.25 6.00 5.756.50 6.25 6.00 5.756.50 6.25 6.00 5.756.50 6.25 6.00 5.756.50 6.25 6.00 5.756.50 6.25 6.00 5.756.50 6.25 6.00 5.756.50 6.25 6.00 5.756.50 6.25 6.00 5.756.50 6.25 6.00 5.756.50 6.25 6.00 5.756.50 6.25 6.00 5.756.50 6.25 6.00 5.756.50 6.25 6.00 5.756.50 6.25 6.00 5.756.50 6.25 6.00 5.756.50 6.25 6.00 5.756.50 6.25 6.00 5.756.50 6.25 6.00 5.756.50 6.25 6.00 5.756.50 6.25 6.00 5.756.50 6.25 6.00 5.758.68 8.35 8.02 7.698.68 8.35 8.02 7.698.68 8.35 8.02 7.696.50 6.25 6.00 5.756.50 6.25 6.00 5.758.68 8.35 8.02 7.698.68 8.35 8.02 7.698.68 8.35 8.02 7.698.68 8.35 8.02 7.698.68 8.35 8.02 7.698.68 8.35 8.02 7.698.68 8.35 8.02 7.698.68 8.35 8.02 7.698.68 8.35 8.02 7.697.00 6.75 6.50 6.259.67 9.34 9.01 8.689.67 9.34 9.01 8.689.67 9.34 9.01 8.689.67 9.34 9.01 8.689.67 9.34 9.01 8.689.67 9.34 9.01 8.689.67 9.34 9.01 8.689.67 9.34 9.01 8.689.67 9.34 9.01 8.689.67 9.34 9.01 8.68
6 -10 YR Road Improvement Expenditures
2021 202218 2019 2020
4 of 6
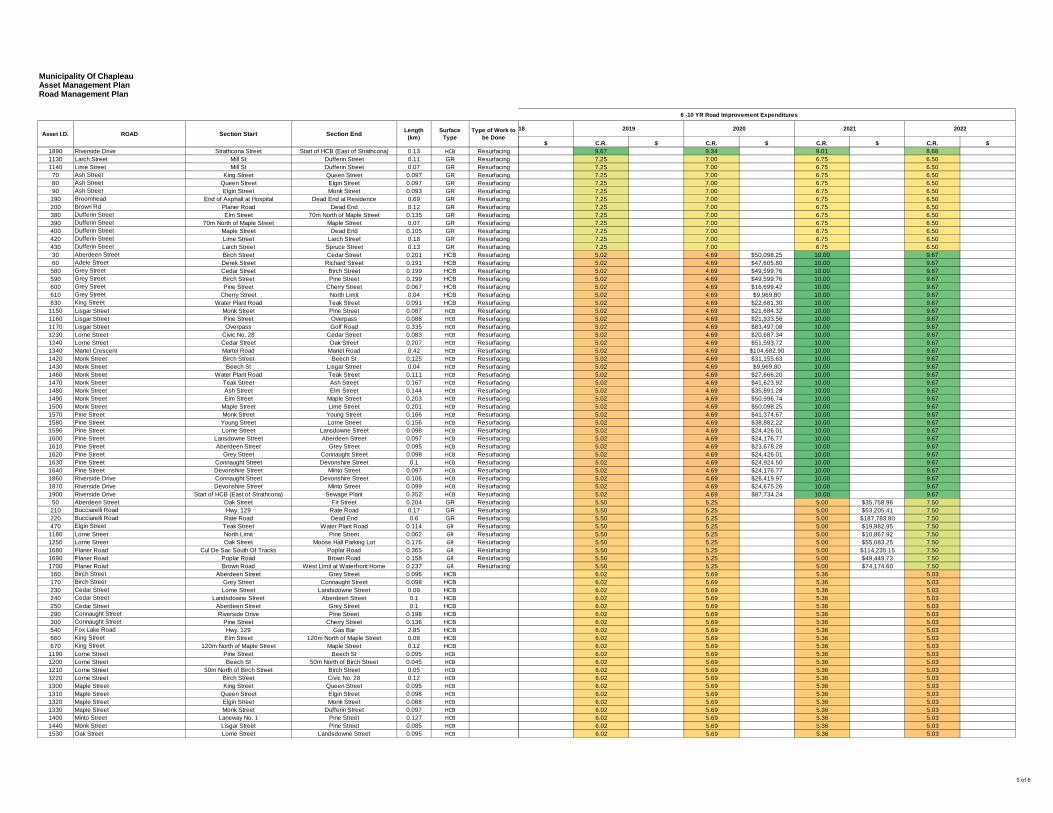
Municipality Of ChapleauAsset Management PlanRoad Management Plan
ROAD Section Start Section End Length (km)Asset I.D. Surface
TypeType of Work to
be Done
1890 Riverside Drive Strathcona Street Start of HCB (East of Strathcona) 0.13 HCB Resurfacing1130 Larch Street Mill St Dufferin Street 0.11 GR Resurfacing1140 Lime Street Mill St Dufferin Street 0.07 GR Resurfacing
70 Ash Street King Street Queen Street 0.097 GR Resurfacing80 Ash Street Queen Street Elgin Street 0.097 GR Resurfacing90 Ash Street Elgin Street Monk Street 0.093 GR Resurfacing190 Broomhead End of Asphalt at Hospital Dead End at Residence 0.69 GR Resurfacing200 Brown Rd Planer Road Dead End 0.12 GR Resurfacing380 Dufferin Street Elm Street 70m North of Maple Street 0.135 GR Resurfacing390 Dufferin Street 70m North of Maple Street Maple Street 0.07 GR Resurfacing400 Dufferin Street Maple Street Dead End 0.105 GR Resurfacing420 Dufferin Street Lime Street Larch Street 0.18 GR Resurfacing430 Dufferin Street Larch Street Spruce Street 0.13 GR Resurfacing30 Aberdeen Street Birch Street Cedar Street 0.201 HCB Resurfacing60 Adele Street Derek Street Richard Street 0.191 HCB Resurfacing580 Grey Street Cedar Street Birch Street 0.199 HCB Resurfacing590 Grey Street Birch Street Pine Street 0.199 HCB Resurfacing600 Grey Street Pine Street Cherry Street 0.067 HCB Resurfacing610 Grey Street Cherry Street North Limit 0.04 HCB Resurfacing630 King Street Water Plant Road Teak Street 0.091 HCB Resurfacing
1150 Lisgar Street Monk Street Pine Street 0.087 HCB Resurfacing1160 Lisgar Street Pine Street Overpass 0.088 HCB Resurfacing1170 Lisgar Street Overpass Golf Road 0.335 HCB Resurfacing1230 Lorne Street Civic No. 28 Cedar Street 0.083 HCB Resurfacing1240 Lorne Street Cedar Street Oak Street 0.207 HCB Resurfacing1340 Martel Crescent Martel Road Martel Road 0.42 HCB Resurfacing1420 Monk Street Birch Street Beech St 0.125 HCB Resurfacing1430 Monk Street Beech St Lisgar Street 0.04 HCB Resurfacing1460 Monk Street Water Plant Road Teak Street 0.111 HCB Resurfacing1470 Monk Street Teak Street Ash Street 0.167 HCB Resurfacing1480 Monk Street Ash Street Elm Street 0.144 HCB Resurfacing1490 Monk Street Elm Street Maple Street 0.203 HCB Resurfacing1500 Monk Street Maple Street Lime Street 0.201 HCB Resurfacing1570 Pine Street Monk Street Young Street 0.166 HCB Resurfacing1580 Pine Street Young Street Lorne Street 0.156 HCB Resurfacing1590 Pine Street Lorne Street Lansdowne Street 0.098 HCB Resurfacing1600 Pine Street Lansdowne Street Aberdeen Street 0.097 HCB Resurfacing1610 Pine Street Aberdeen Street Grey Street 0.095 HCB Resurfacing1620 Pine Street Grey Street Connaught Street 0.098 HCB Resurfacing1630 Pine Street Connaught Street Devonshire Street 0.1 HCB Resurfacing1640 Pine Street Devonshire Street Minto Street 0.097 HCB Resurfacing1860 Riverside Drive Connaught Street Devonshire Street 0.106 HCB Resurfacing1870 Riverside Drive Devonshire Street Minto Street 0.099 HCB Resurfacing1900 Riverside Drive Start of HCB (East of Strathcona) Sewage Plant 0.352 HCB Resurfacing
50 Aberdeen Street Oak Street Fir Street 0.204 GR Resurfacing210 Bucciarelli Road Hwy. 129 Rate Road 0.17 GR Resurfacing220 Bucciarelli Road Rate Road Dead End 0.6 GR Resurfacing470 Elgin Street Teak Street Water Plant Road 0.114 GR Resurfacing
1180 Lorne Street North Limit Pine Street 0.062 GR Resurfacing1250 Lorne Street Oak Street Moose Hall Parking Lot 0.176 GR Resurfacing1680 Planer Road Cul De Sac South Of Tracks Poplar Road 0.365 GR Resurfacing1690 Planer Road Poplar Road Brown Road 0.158 GR Resurfacing1700 Planer Road Brown Road West Limit at Waterfront Home 0.237 GR Resurfacing160 Birch Street Aberdeen Street Grey Street 0.096 HCB170 Birch Street Grey Street Connaught Street 0.098 HCB230 Cedar Street Lorne Street Landsdowne Street 0.09 HCB240 Cedar Street Landsdowne Street Aberdeen Street 0.1 HCB250 Cedar Street Aberdeen Street Grey Street 0.1 HCB290 Connaught Street Riverside Drive Pine Street 0.198 HCB300 Connaught Street Pine Street Cherry Street 0.136 HCB540 Fox Lake Road Hwy. 129 Gas Bar 2.85 HCB660 King Street Elm Street 120m North of Maple Street 0.08 HCB670 King Street 120m North of Maple Street Maple Street 0.12 HCB
1190 Lorne Street Pine Street Beech St 0.095 HCB1200 Lorne Street Beech St 50m North of Birch Street 0.045 HCB1210 Lorne Street 50m North of Birch Street Birch Street 0.05 HCB1220 Lorne Street Birch Street Civic No. 28 0.12 HCB1300 Maple Street King Street Queen Street 0.095 HCB1310 Maple Street Queen Street Elgin Street 0.098 HCB1320 Maple Street Elgin Street Monk Street 0.088 HCB1330 Maple Street Monk Street Dufferin Street 0.097 HCB1400 Minto Street Laneway No. 1 Pine Street 0.127 HCB1440 Monk Street Lisgar Street Pine Street 0.085 HCB1530 Oak Street Lorne Street Landsdowne Street 0.095 HCB
$ C.R. $ C.R. $ C.R. $ C.R. $
6 -10 YR Road Improvement Expenditures
2021 202218 2019 2020
9.67 9.34 9.01 8.687.25 7.00 6.75 6.507.25 7.00 6.75 6.507.25 7.00 6.75 6.507.25 7.00 6.75 6.507.25 7.00 6.75 6.507.25 7.00 6.75 6.507.25 7.00 6.75 6.507.25 7.00 6.75 6.507.25 7.00 6.75 6.507.25 7.00 6.75 6.507.25 7.00 6.75 6.507.25 7.00 6.75 6.505.02 4.69 $50,098.25 10.00 9.675.02 4.69 $47,605.80 10.00 9.675.02 4.69 $49,599.76 10.00 9.675.02 4.69 $49,599.76 10.00 9.675.02 4.69 $16,699.42 10.00 9.675.02 4.69 $9,969.80 10.00 9.675.02 4.69 $22,681.30 10.00 9.675.02 4.69 $21,684.32 10.00 9.675.02 4.69 $21,933.56 10.00 9.675.02 4.69 $83,497.08 10.00 9.675.02 4.69 $20,687.34 10.00 9.675.02 4.69 $51,593.72 10.00 9.675.02 4.69 $104,682.90 10.00 9.675.02 4.69 $31,155.63 10.00 9.675.02 4.69 $9,969.80 10.00 9.675.02 4.69 $27,666.20 10.00 9.675.02 4.69 $41,623.92 10.00 9.675.02 4.69 $35,891.28 10.00 9.675.02 4.69 $50,596.74 10.00 9.675.02 4.69 $50,098.25 10.00 9.675.02 4.69 $41,374.67 10.00 9.675.02 4.69 $38,882.22 10.00 9.675.02 4.69 $24,426.01 10.00 9.675.02 4.69 $24,176.77 10.00 9.675.02 4.69 $23,678.28 10.00 9.675.02 4.69 $24,426.01 10.00 9.675.02 4.69 $24,924.50 10.00 9.675.02 4.69 $24,176.77 10.00 9.675.02 4.69 $26,419.97 10.00 9.675.02 4.69 $24,675.26 10.00 9.675.02 4.69 $87,734.24 10.00 9.675.50 5.25 5.00 $35,758.96 7.505.50 5.25 5.00 $53,205.41 7.505.50 5.25 5.00 $187,783.80 7.505.50 5.25 5.00 $19,982.95 7.505.50 5.25 5.00 $10,867.92 7.505.50 5.25 5.00 $55,083.25 7.505.50 5.25 5.00 $114,235.15 7.505.50 5.25 5.00 $49,449.73 7.505.50 5.25 5.00 $74,174.60 7.506.02 5.69 5.36 5.036.02 5.69 5.36 5.036.02 5.69 5.36 5.036.02 5.69 5.36 5.036.02 5.69 5.36 5.036.02 5.69 5.36 5.036.02 5.69 5.36 5.036.02 5.69 5.36 5.036.02 5.69 5.36 5.036.02 5.69 5.36 5.036.02 5.69 5.36 5.036.02 5.69 5.36 5.036.02 5.69 5.36 5.036.02 5.69 5.36 5.036.02 5.69 5.36 5.036.02 5.69 5.36 5.036.02 5.69 5.36 5.036.02 5.69 5.36 5.036.02 5.69 5.36 5.036.02 5.69 5.36 5.036.02 5.69 5.36 5.03
5 of 6
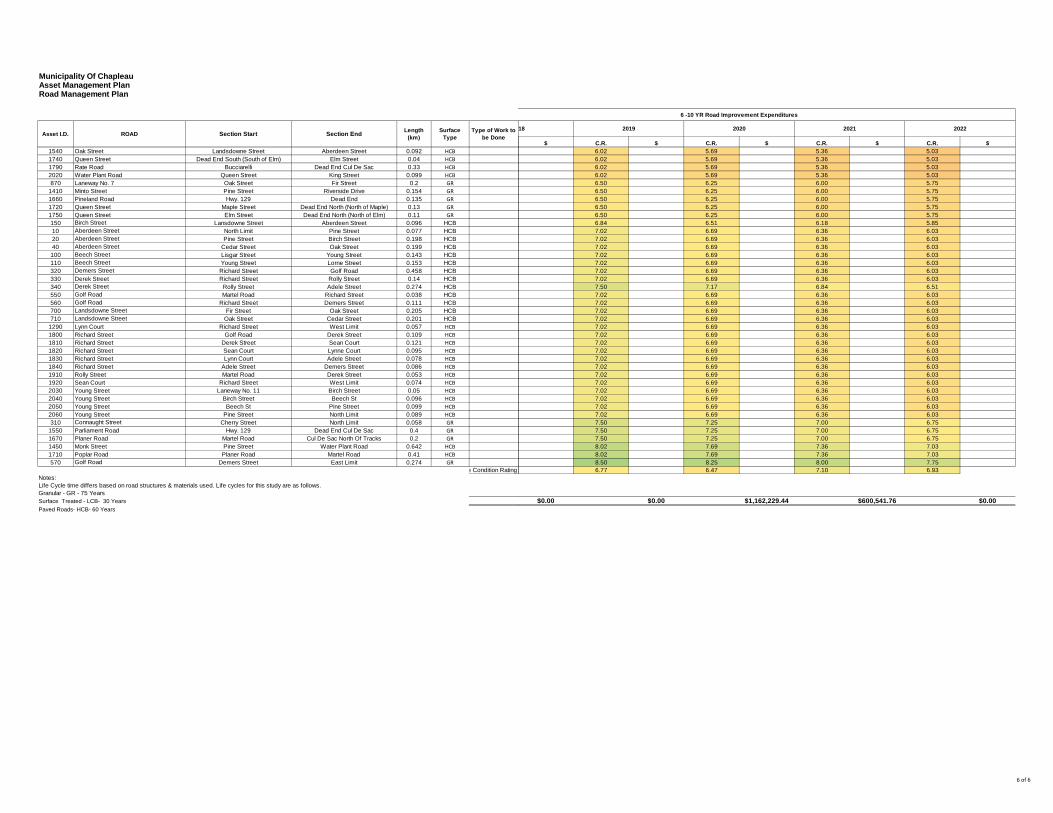
Municipality Of ChapleauAsset Management PlanRoad Management Plan
ROAD Section Start Section End Length (km)Asset I.D. Surface
TypeType of Work to
be Done
1540 Oak Street Landsdowne Street Aberdeen Street 0.092 HCB1740 Queen Street Dead End South (South of Elm) Elm Street 0.04 HCB1790 Rate Road Bucciarelli Dead End Cul De Sac 0.33 HCB2020 Water Plant Road Queen Street King Street 0.099 HCB870 Laneway No. 7 Oak Street Fir Street 0.2 GR
1410 Minto Street Pine Street Riverside Drive 0.154 GR1660 Pineland Road Hwy. 129 Dead End 0.135 GR1720 Queen Street Maple Street Dead End North (North of Maple) 0.13 GR1750 Queen Street Elm Street Dead End North (North of Elm) 0.11 GR150 Birch Street Lansdowne Street Aberdeen Street 0.096 HCB10 Aberdeen Street North Limit Pine Street 0.077 HCB20 Aberdeen Street Pine Street Birch Street 0.198 HCB40 Aberdeen Street Cedar Street Oak Street 0.199 HCB100 Beech Street Lisgar Street Young Street 0.143 HCB110 Beech Street Young Street Lorne Street 0.153 HCB320 Demers Street Richard Street Golf Road 0.458 HCB330 Derek Street Richard Street Rolly Street 0.14 HCB340 Derek Street Rolly Street Adele Street 0.274 HCB550 Golf Road Martel Road Richard Street 0.038 HCB560 Golf Road Richard Street Demers Street 0.111 HCB700 Landsdowne Street Fir Street Oak Street 0.205 HCB710 Landsdowne Street Oak Street Cedar Street 0.201 HCB
1290 Lynn Court Richard Street West Limit 0.057 HCB1800 Richard Street Golf Road Derek Street 0.109 HCB1810 Richard Street Derek Street Sean Court 0.121 HCB1820 Richard Street Sean Court Lynne Court 0.095 HCB1830 Richard Street Lynn Court Adele Street 0.078 HCB1840 Richard Street Adele Street Demers Street 0.086 HCB1910 Rolly Street Martel Road Derek Street 0.053 HCB1920 Sean Court Richard Street West Limit 0.074 HCB2030 Young Street Laneway No. 11 Birch Street 0.05 HCB2040 Young Street Birch Street Beech St 0.096 HCB2050 Young Street Beech St Pine Street 0.099 HCB2060 Young Street Pine Street North Limit 0.089 HCB310 Connaught Street Cherry Street North Limit 0.058 GR
1550 Parliament Road Hwy. 129 Dead End Cul De Sac 0.4 GR1670 Planer Road Martel Road Cul De Sac North Of Tracks 0.2 GR1450 Monk Street Pine Street Water Plant Road 0.642 HCB1710 Poplar Road Planer Road Martel Road 0.41 HCB570 Golf Road Demers Street East Limit 0.274 GR
Notes:Life Cycle time differs based on road structures & materials used. Life cycles for this study are as follows.Granular - GR - 75 YearsSurface Treated - LCB- 30 YearsPaved Roads- HCB- 60 Years
e Condition Rating
$ C.R. $ C.R. $ C.R. $ C.R. $
6 -10 YR Road Improvement Expenditures
2021 202218 2019 2020
6.02 5.69 5.36 5.036.02 5.69 5.36 5.036.02 5.69 5.36 5.036.02 5.69 5.36 5.036.50 6.25 6.00 5.756.50 6.25 6.00 5.756.50 6.25 6.00 5.756.50 6.25 6.00 5.756.50 6.25 6.00 5.756.84 6.51 6.18 5.857.02 6.69 6.36 6.037.02 6.69 6.36 6.037.02 6.69 6.36 6.037.02 6.69 6.36 6.037.02 6.69 6.36 6.037.02 6.69 6.36 6.037.02 6.69 6.36 6.037.50 7.17 6.84 6.517.02 6.69 6.36 6.037.02 6.69 6.36 6.037.02 6.69 6.36 6.037.02 6.69 6.36 6.037.02 6.69 6.36 6.037.02 6.69 6.36 6.037.02 6.69 6.36 6.037.02 6.69 6.36 6.037.02 6.69 6.36 6.037.02 6.69 6.36 6.037.02 6.69 6.36 6.037.02 6.69 6.36 6.037.02 6.69 6.36 6.037.02 6.69 6.36 6.037.02 6.69 6.36 6.037.02 6.69 6.36 6.037.50 7.25 7.00 6.757.50 7.25 7.00 6.757.50 7.25 7.00 6.758.02 7.69 7.36 7.038.02 7.69 7.36 7.038.50 8.25 8.00 7.756.77 6.47 7.10 6.93
$0.00 $0.00 $1,162,229.44 $600,541.76 $0.00
6 of 6
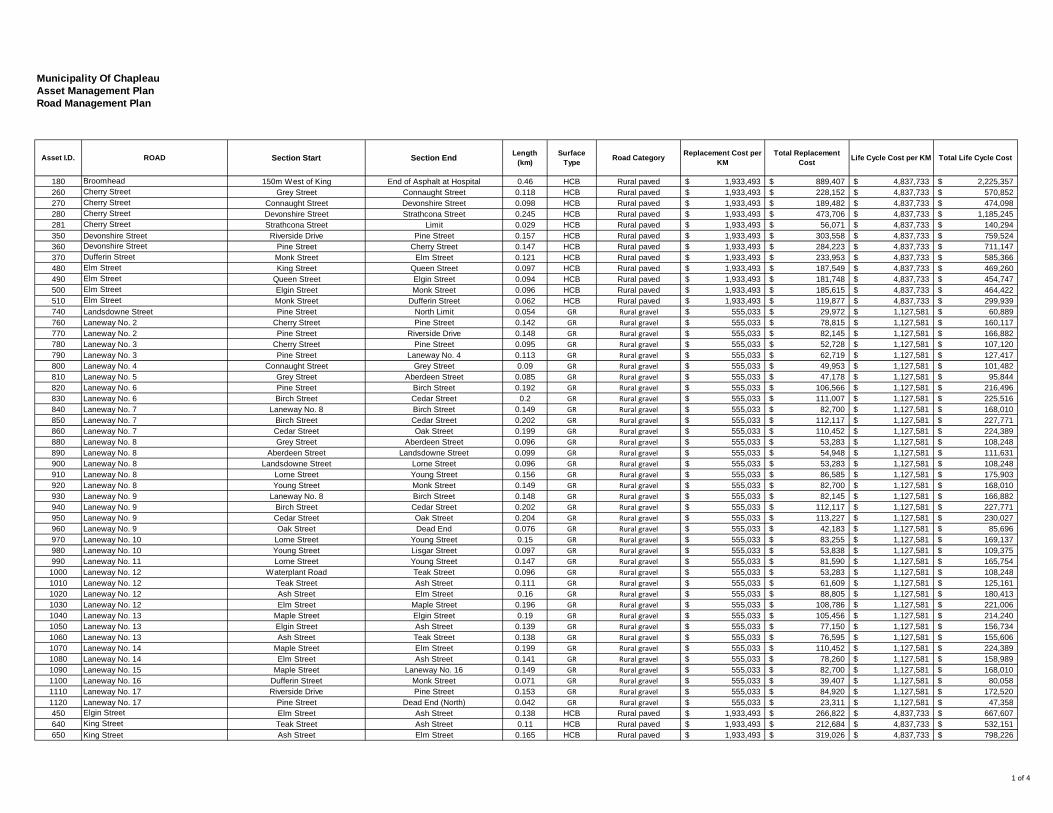
Municipality Of ChapleauAsset Management PlanRoad Management Plan
180 Broomhead 150m West of King End of Asphalt at Hospital 0.46 HCB Rural paved 1,933,493$ 889,407$ 4,837,733$ 2,225,357$ 260 Cherry Street Grey Street Connaught Street 0.118 HCB Rural paved 1,933,493$ 228,152$ 4,837,733$ 570,852$ 270 Cherry Street Connaught Street Devonshire Street 0.098 HCB Rural paved 1,933,493$ 189,482$ 4,837,733$ 474,098$ 280 Cherry Street Devonshire Street Strathcona Street 0.245 HCB Rural paved 1,933,493$ 473,706$ 4,837,733$ 1,185,245$ 281 Cherry Street Strathcona Street Limit 0.029 HCB Rural paved 1,933,493$ 56,071$ 4,837,733$ 140,294$ 350 Devonshire Street Riverside Drive Pine Street 0.157 HCB Rural paved 1,933,493$ 303,558$ 4,837,733$ 759,524$ 360 Devonshire Street Pine Street Cherry Street 0.147 HCB Rural paved 1,933,493$ 284,223$ 4,837,733$ 711,147$ 370 Dufferin Street Monk Street Elm Street 0.121 HCB Rural paved 1,933,493$ 233,953$ 4,837,733$ 585,366$ 480 Elm Street King Street Queen Street 0.097 HCB Rural paved 1,933,493$ 187,549$ 4,837,733$ 469,260$ 490 Elm Street Queen Street Elgin Street 0.094 HCB Rural paved 1,933,493$ 181,748$ 4,837,733$ 454,747$ 500 Elm Street Elgin Street Monk Street 0.096 HCB Rural paved 1,933,493$ 185,615$ 4,837,733$ 464,422$ 510 Elm Street Monk Street Dufferin Street 0.062 HCB Rural paved 1,933,493$ 119,877$ 4,837,733$ 299,939$ 740 Landsdowne Street Pine Street North Limit 0.054 GR Rural gravel 555,033$ 29,972$ 1,127,581$ 60,889$ 760 Laneway No. 2 Cherry Street Pine Street 0.142 GR Rural gravel 555,033$ 78,815$ 1,127,581$ 160,117$ 770 Laneway No. 2 Pine Street Riverside Drive 0.148 GR Rural gravel 555,033$ 82,145$ 1,127,581$ 166,882$ 780 Laneway No. 3 Cherry Street Pine Street 0.095 GR Rural gravel 555,033$ 52,728$ 1,127,581$ 107,120$ 790 Laneway No. 3 Pine Street Laneway No. 4 0.113 GR Rural gravel 555,033$ 62,719$ 1,127,581$ 127,417$ 800 Laneway No. 4 Connaught Street Grey Street 0.09 GR Rural gravel 555,033$ 49,953$ 1,127,581$ 101,482$ 810 Laneway No. 5 Grey Street Aberdeen Street 0.085 GR Rural gravel 555,033$ 47,178$ 1,127,581$ 95,844$ 820 Laneway No. 6 Pine Street Birch Street 0.192 GR Rural gravel 555,033$ 106,566$ 1,127,581$ 216,496$ 830 Laneway No. 6 Birch Street Cedar Street 0.2 GR Rural gravel 555,033$ 111,007$ 1,127,581$ 225,516$ 840 Laneway No. 7 Laneway No. 8 Birch Street 0.149 GR Rural gravel 555,033$ 82,700$ 1,127,581$ 168,010$ 850 Laneway No. 7 Birch Street Cedar Street 0.202 GR Rural gravel 555,033$ 112,117$ 1,127,581$ 227,771$ 860 Laneway No. 7 Cedar Street Oak Street 0.199 GR Rural gravel 555,033$ 110,452$ 1,127,581$ 224,389$ 880 Laneway No. 8 Grey Street Aberdeen Street 0.096 GR Rural gravel 555,033$ 53,283$ 1,127,581$ 108,248$ 890 Laneway No. 8 Aberdeen Street Landsdowne Street 0.099 GR Rural gravel 555,033$ 54,948$ 1,127,581$ 111,631$ 900 Laneway No. 8 Landsdowne Street Lorne Street 0.096 GR Rural gravel 555,033$ 53,283$ 1,127,581$ 108,248$ 910 Laneway No. 8 Lorne Street Young Street 0.156 GR Rural gravel 555,033$ 86,585$ 1,127,581$ 175,903$ 920 Laneway No. 8 Young Street Monk Street 0.149 GR Rural gravel 555,033$ 82,700$ 1,127,581$ 168,010$ 930 Laneway No. 9 Laneway No. 8 Birch Street 0.148 GR Rural gravel 555,033$ 82,145$ 1,127,581$ 166,882$ 940 Laneway No. 9 Birch Street Cedar Street 0.202 GR Rural gravel 555,033$ 112,117$ 1,127,581$ 227,771$ 950 Laneway No. 9 Cedar Street Oak Street 0.204 GR Rural gravel 555,033$ 113,227$ 1,127,581$ 230,027$ 960 Laneway No. 9 Oak Street Dead End 0.076 GR Rural gravel 555,033$ 42,183$ 1,127,581$ 85,696$ 970 Laneway No. 10 Lorne Street Young Street 0.15 GR Rural gravel 555,033$ 83,255$ 1,127,581$ 169,137$ 980 Laneway No. 10 Young Street Lisgar Street 0.097 GR Rural gravel 555,033$ 53,838$ 1,127,581$ 109,375$ 990 Laneway No. 11 Lorne Street Young Street 0.147 GR Rural gravel 555,033$ 81,590$ 1,127,581$ 165,754$
1000 Laneway No. 12 Waterplant Road Teak Street 0.096 GR Rural gravel 555,033$ 53,283$ 1,127,581$ 108,248$ 1010 Laneway No. 12 Teak Street Ash Street 0.111 GR Rural gravel 555,033$ 61,609$ 1,127,581$ 125,161$ 1020 Laneway No. 12 Ash Street Elm Street 0.16 GR Rural gravel 555,033$ 88,805$ 1,127,581$ 180,413$ 1030 Laneway No. 12 Elm Street Maple Street 0.196 GR Rural gravel 555,033$ 108,786$ 1,127,581$ 221,006$ 1040 Laneway No. 13 Maple Street Elgin Street 0.19 GR Rural gravel 555,033$ 105,456$ 1,127,581$ 214,240$ 1050 Laneway No. 13 Elgin Street Ash Street 0.139 GR Rural gravel 555,033$ 77,150$ 1,127,581$ 156,734$ 1060 Laneway No. 13 Ash Street Teak Street 0.138 GR Rural gravel 555,033$ 76,595$ 1,127,581$ 155,606$ 1070 Laneway No. 14 Maple Street Elm Street 0.199 GR Rural gravel 555,033$ 110,452$ 1,127,581$ 224,389$ 1080 Laneway No. 14 Elm Street Ash Street 0.141 GR Rural gravel 555,033$ 78,260$ 1,127,581$ 158,989$ 1090 Laneway No. 15 Maple Street Laneway No. 16 0.149 GR Rural gravel 555,033$ 82,700$ 1,127,581$ 168,010$ 1100 Laneway No. 16 Dufferin Street Monk Street 0.071 GR Rural gravel 555,033$ 39,407$ 1,127,581$ 80,058$ 1110 Laneway No. 17 Riverside Drive Pine Street 0.153 GR Rural gravel 555,033$ 84,920$ 1,127,581$ 172,520$ 1120 Laneway No. 17 Pine Street Dead End (North) 0.042 GR Rural gravel 555,033$ 23,311$ 1,127,581$ 47,358$ 450 Elgin Street Elm Street Ash Street 0.138 HCB Rural paved 1,933,493$ 266,822$ 4,837,733$ 667,607$ 640 King Street Teak Street Ash Street 0.11 HCB Rural paved 1,933,493$ 212,684$ 4,837,733$ 532,151$ 650 King Street Ash Street Elm Street 0.165 HCB Rural paved 1,933,493$ 319,026$ 4,837,733$ 798,226$
Road Category Replacement Cost per KM
Total Replacement Cost Total Life Cycle CostLife Cycle Cost per KMROAD Section Start Section End Length
(km)Asset I.D. Surface Type
1 of 4
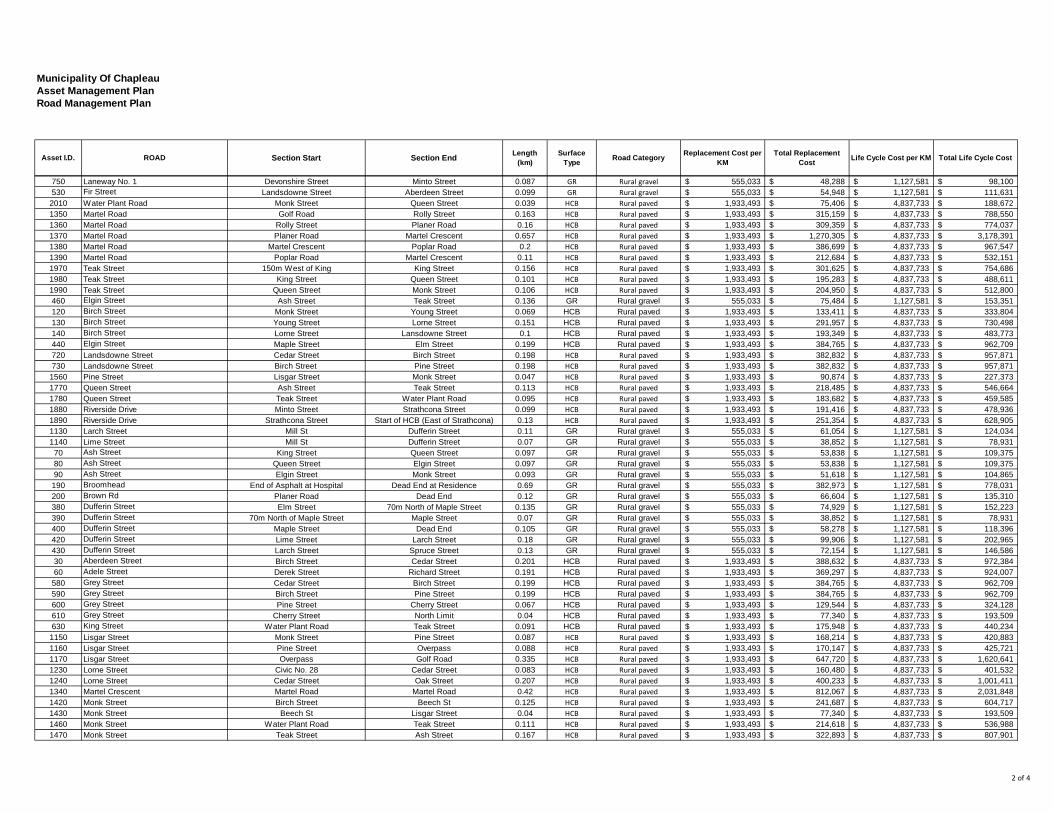
Municipality Of ChapleauAsset Management PlanRoad Management Plan
Road Category Replacement Cost per KM
Total Replacement Cost Total Life Cycle CostLife Cycle Cost per KMROAD Section Start Section End Length
(km)Asset I.D. Surface Type
750 Laneway No. 1 Devonshire Street Minto Street 0.087 GR Rural gravel 555,033$ 48,288$ 1,127,581$ 98,100$ 530 Fir Street Landsdowne Street Aberdeen Street 0.099 GR Rural gravel 555,033$ 54,948$ 1,127,581$ 111,631$
2010 Water Plant Road Monk Street Queen Street 0.039 HCB Rural paved 1,933,493$ 75,406$ 4,837,733$ 188,672$ 1350 Martel Road Golf Road Rolly Street 0.163 HCB Rural paved 1,933,493$ 315,159$ 4,837,733$ 788,550$ 1360 Martel Road Rolly Street Planer Road 0.16 HCB Rural paved 1,933,493$ 309,359$ 4,837,733$ 774,037$ 1370 Martel Road Planer Road Martel Crescent 0.657 HCB Rural paved 1,933,493$ 1,270,305$ 4,837,733$ 3,178,391$ 1380 Martel Road Martel Crescent Poplar Road 0.2 HCB Rural paved 1,933,493$ 386,699$ 4,837,733$ 967,547$ 1390 Martel Road Poplar Road Martel Crescent 0.11 HCB Rural paved 1,933,493$ 212,684$ 4,837,733$ 532,151$ 1970 Teak Street 150m West of King King Street 0.156 HCB Rural paved 1,933,493$ 301,625$ 4,837,733$ 754,686$ 1980 Teak Street King Street Queen Street 0.101 HCB Rural paved 1,933,493$ 195,283$ 4,837,733$ 488,611$ 1990 Teak Street Queen Street Monk Street 0.106 HCB Rural paved 1,933,493$ 204,950$ 4,837,733$ 512,800$ 460 Elgin Street Ash Street Teak Street 0.136 GR Rural gravel 555,033$ 75,484$ 1,127,581$ 153,351$ 120 Birch Street Monk Street Young Street 0.069 HCB Rural paved 1,933,493$ 133,411$ 4,837,733$ 333,804$ 130 Birch Street Young Street Lorne Street 0.151 HCB Rural paved 1,933,493$ 291,957$ 4,837,733$ 730,498$ 140 Birch Street Lorne Street Lansdowne Street 0.1 HCB Rural paved 1,933,493$ 193,349$ 4,837,733$ 483,773$ 440 Elgin Street Maple Street Elm Street 0.199 HCB Rural paved 1,933,493$ 384,765$ 4,837,733$ 962,709$ 720 Landsdowne Street Cedar Street Birch Street 0.198 HCB Rural paved 1,933,493$ 382,832$ 4,837,733$ 957,871$ 730 Landsdowne Street Birch Street Pine Street 0.198 HCB Rural paved 1,933,493$ 382,832$ 4,837,733$ 957,871$
1560 Pine Street Lisgar Street Monk Street 0.047 HCB Rural paved 1,933,493$ 90,874$ 4,837,733$ 227,373$ 1770 Queen Street Ash Street Teak Street 0.113 HCB Rural paved 1,933,493$ 218,485$ 4,837,733$ 546,664$ 1780 Queen Street Teak Street Water Plant Road 0.095 HCB Rural paved 1,933,493$ 183,682$ 4,837,733$ 459,585$ 1880 Riverside Drive Minto Street Strathcona Street 0.099 HCB Rural paved 1,933,493$ 191,416$ 4,837,733$ 478,936$ 1890 Riverside Drive Strathcona Street Start of HCB (East of Strathcona) 0.13 HCB Rural paved 1,933,493$ 251,354$ 4,837,733$ 628,905$ 1130 Larch Street Mill St Dufferin Street 0.11 GR Rural gravel 555,033$ 61,054$ 1,127,581$ 124,034$ 1140 Lime Street Mill St Dufferin Street 0.07 GR Rural gravel 555,033$ 38,852$ 1,127,581$ 78,931$
70 Ash Street King Street Queen Street 0.097 GR Rural gravel 555,033$ 53,838$ 1,127,581$ 109,375$ 80 Ash Street Queen Street Elgin Street 0.097 GR Rural gravel 555,033$ 53,838$ 1,127,581$ 109,375$ 90 Ash Street Elgin Street Monk Street 0.093 GR Rural gravel 555,033$ 51,618$ 1,127,581$ 104,865$
190 Broomhead End of Asphalt at Hospital Dead End at Residence 0.69 GR Rural gravel 555,033$ 382,973$ 1,127,581$ 778,031$ 200 Brown Rd Planer Road Dead End 0.12 GR Rural gravel 555,033$ 66,604$ 1,127,581$ 135,310$ 380 Dufferin Street Elm Street 70m North of Maple Street 0.135 GR Rural gravel 555,033$ 74,929$ 1,127,581$ 152,223$ 390 Dufferin Street 70m North of Maple Street Maple Street 0.07 GR Rural gravel 555,033$ 38,852$ 1,127,581$ 78,931$ 400 Dufferin Street Maple Street Dead End 0.105 GR Rural gravel 555,033$ 58,278$ 1,127,581$ 118,396$ 420 Dufferin Street Lime Street Larch Street 0.18 GR Rural gravel 555,033$ 99,906$ 1,127,581$ 202,965$ 430 Dufferin Street Larch Street Spruce Street 0.13 GR Rural gravel 555,033$ 72,154$ 1,127,581$ 146,586$ 30 Aberdeen Street Birch Street Cedar Street 0.201 HCB Rural paved 1,933,493$ 388,632$ 4,837,733$ 972,384$ 60 Adele Street Derek Street Richard Street 0.191 HCB Rural paved 1,933,493$ 369,297$ 4,837,733$ 924,007$
580 Grey Street Cedar Street Birch Street 0.199 HCB Rural paved 1,933,493$ 384,765$ 4,837,733$ 962,709$ 590 Grey Street Birch Street Pine Street 0.199 HCB Rural paved 1,933,493$ 384,765$ 4,837,733$ 962,709$ 600 Grey Street Pine Street Cherry Street 0.067 HCB Rural paved 1,933,493$ 129,544$ 4,837,733$ 324,128$ 610 Grey Street Cherry Street North Limit 0.04 HCB Rural paved 1,933,493$ 77,340$ 4,837,733$ 193,509$ 630 King Street Water Plant Road Teak Street 0.091 HCB Rural paved 1,933,493$ 175,948$ 4,837,733$ 440,234$
1150 Lisgar Street Monk Street Pine Street 0.087 HCB Rural paved 1,933,493$ 168,214$ 4,837,733$ 420,883$ 1160 Lisgar Street Pine Street Overpass 0.088 HCB Rural paved 1,933,493$ 170,147$ 4,837,733$ 425,721$ 1170 Lisgar Street Overpass Golf Road 0.335 HCB Rural paved 1,933,493$ 647,720$ 4,837,733$ 1,620,641$ 1230 Lorne Street Civic No. 28 Cedar Street 0.083 HCB Rural paved 1,933,493$ 160,480$ 4,837,733$ 401,532$ 1240 Lorne Street Cedar Street Oak Street 0.207 HCB Rural paved 1,933,493$ 400,233$ 4,837,733$ 1,001,411$ 1340 Martel Crescent Martel Road Martel Road 0.42 HCB Rural paved 1,933,493$ 812,067$ 4,837,733$ 2,031,848$ 1420 Monk Street Birch Street Beech St 0.125 HCB Rural paved 1,933,493$ 241,687$ 4,837,733$ 604,717$ 1430 Monk Street Beech St Lisgar Street 0.04 HCB Rural paved 1,933,493$ 77,340$ 4,837,733$ 193,509$ 1460 Monk Street Water Plant Road Teak Street 0.111 HCB Rural paved 1,933,493$ 214,618$ 4,837,733$ 536,988$ 1470 Monk Street Teak Street Ash Street 0.167 HCB Rural paved 1,933,493$ 322,893$ 4,837,733$ 807,901$
2 of 4
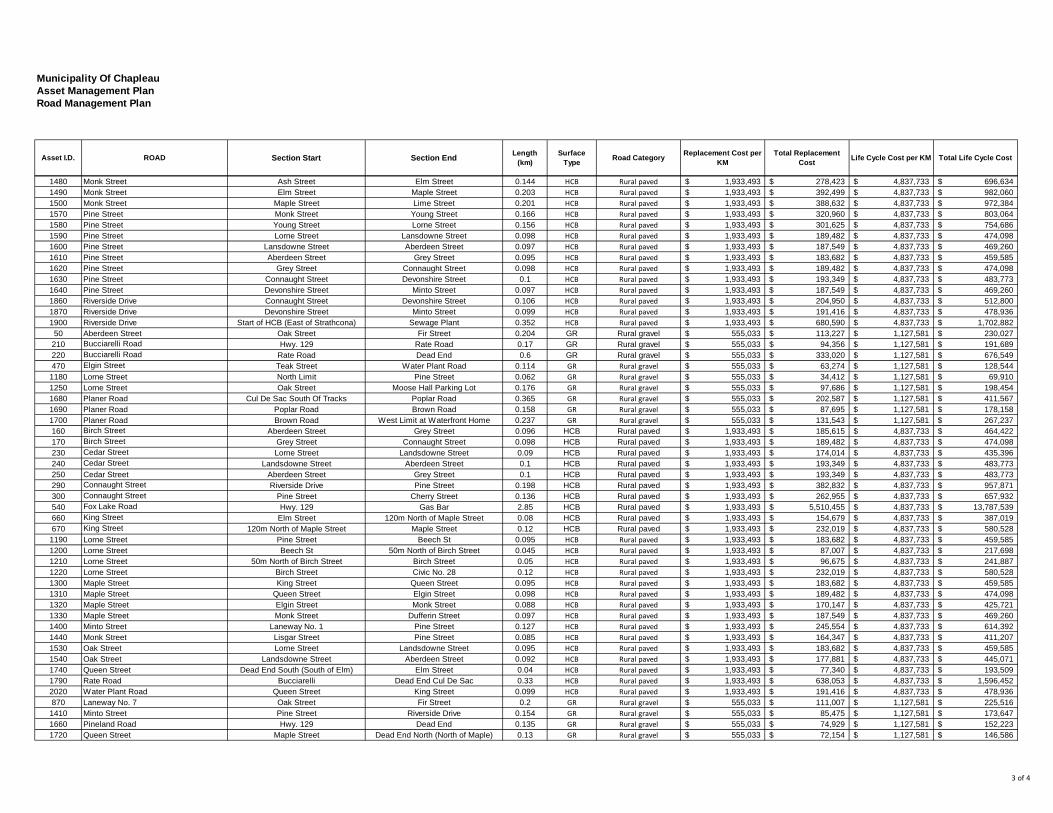
Municipality Of ChapleauAsset Management PlanRoad Management Plan
Road Category Replacement Cost per KM
Total Replacement Cost Total Life Cycle CostLife Cycle Cost per KMROAD Section Start Section End Length
(km)Asset I.D. Surface Type
1480 Monk Street Ash Street Elm Street 0.144 HCB Rural paved 1,933,493$ 278,423$ 4,837,733$ 696,634$ 1490 Monk Street Elm Street Maple Street 0.203 HCB Rural paved 1,933,493$ 392,499$ 4,837,733$ 982,060$ 1500 Monk Street Maple Street Lime Street 0.201 HCB Rural paved 1,933,493$ 388,632$ 4,837,733$ 972,384$ 1570 Pine Street Monk Street Young Street 0.166 HCB Rural paved 1,933,493$ 320,960$ 4,837,733$ 803,064$ 1580 Pine Street Young Street Lorne Street 0.156 HCB Rural paved 1,933,493$ 301,625$ 4,837,733$ 754,686$ 1590 Pine Street Lorne Street Lansdowne Street 0.098 HCB Rural paved 1,933,493$ 189,482$ 4,837,733$ 474,098$ 1600 Pine Street Lansdowne Street Aberdeen Street 0.097 HCB Rural paved 1,933,493$ 187,549$ 4,837,733$ 469,260$ 1610 Pine Street Aberdeen Street Grey Street 0.095 HCB Rural paved 1,933,493$ 183,682$ 4,837,733$ 459,585$ 1620 Pine Street Grey Street Connaught Street 0.098 HCB Rural paved 1,933,493$ 189,482$ 4,837,733$ 474,098$ 1630 Pine Street Connaught Street Devonshire Street 0.1 HCB Rural paved 1,933,493$ 193,349$ 4,837,733$ 483,773$ 1640 Pine Street Devonshire Street Minto Street 0.097 HCB Rural paved 1,933,493$ 187,549$ 4,837,733$ 469,260$ 1860 Riverside Drive Connaught Street Devonshire Street 0.106 HCB Rural paved 1,933,493$ 204,950$ 4,837,733$ 512,800$ 1870 Riverside Drive Devonshire Street Minto Street 0.099 HCB Rural paved 1,933,493$ 191,416$ 4,837,733$ 478,936$ 1900 Riverside Drive Start of HCB (East of Strathcona) Sewage Plant 0.352 HCB Rural paved 1,933,493$ 680,590$ 4,837,733$ 1,702,882$
50 Aberdeen Street Oak Street Fir Street 0.204 GR Rural gravel 555,033$ 113,227$ 1,127,581$ 230,027$ 210 Bucciarelli Road Hwy. 129 Rate Road 0.17 GR Rural gravel 555,033$ 94,356$ 1,127,581$ 191,689$ 220 Bucciarelli Road Rate Road Dead End 0.6 GR Rural gravel 555,033$ 333,020$ 1,127,581$ 676,549$ 470 Elgin Street Teak Street Water Plant Road 0.114 GR Rural gravel 555,033$ 63,274$ 1,127,581$ 128,544$
1180 Lorne Street North Limit Pine Street 0.062 GR Rural gravel 555,033$ 34,412$ 1,127,581$ 69,910$ 1250 Lorne Street Oak Street Moose Hall Parking Lot 0.176 GR Rural gravel 555,033$ 97,686$ 1,127,581$ 198,454$ 1680 Planer Road Cul De Sac South Of Tracks Poplar Road 0.365 GR Rural gravel 555,033$ 202,587$ 1,127,581$ 411,567$ 1690 Planer Road Poplar Road Brown Road 0.158 GR Rural gravel 555,033$ 87,695$ 1,127,581$ 178,158$ 1700 Planer Road Brown Road West Limit at Waterfront Home 0.237 GR Rural gravel 555,033$ 131,543$ 1,127,581$ 267,237$ 160 Birch Street Aberdeen Street Grey Street 0.096 HCB Rural paved 1,933,493$ 185,615$ 4,837,733$ 464,422$ 170 Birch Street Grey Street Connaught Street 0.098 HCB Rural paved 1,933,493$ 189,482$ 4,837,733$ 474,098$ 230 Cedar Street Lorne Street Landsdowne Street 0.09 HCB Rural paved 1,933,493$ 174,014$ 4,837,733$ 435,396$ 240 Cedar Street Landsdowne Street Aberdeen Street 0.1 HCB Rural paved 1,933,493$ 193,349$ 4,837,733$ 483,773$ 250 Cedar Street Aberdeen Street Grey Street 0.1 HCB Rural paved 1,933,493$ 193,349$ 4,837,733$ 483,773$ 290 Connaught Street Riverside Drive Pine Street 0.198 HCB Rural paved 1,933,493$ 382,832$ 4,837,733$ 957,871$ 300 Connaught Street Pine Street Cherry Street 0.136 HCB Rural paved 1,933,493$ 262,955$ 4,837,733$ 657,932$ 540 Fox Lake Road Hwy. 129 Gas Bar 2.85 HCB Rural paved 1,933,493$ 5,510,455$ 4,837,733$ 13,787,539$ 660 King Street Elm Street 120m North of Maple Street 0.08 HCB Rural paved 1,933,493$ 154,679$ 4,837,733$ 387,019$ 670 King Street 120m North of Maple Street Maple Street 0.12 HCB Rural paved 1,933,493$ 232,019$ 4,837,733$ 580,528$
1190 Lorne Street Pine Street Beech St 0.095 HCB Rural paved 1,933,493$ 183,682$ 4,837,733$ 459,585$ 1200 Lorne Street Beech St 50m North of Birch Street 0.045 HCB Rural paved 1,933,493$ 87,007$ 4,837,733$ 217,698$ 1210 Lorne Street 50m North of Birch Street Birch Street 0.05 HCB Rural paved 1,933,493$ 96,675$ 4,837,733$ 241,887$ 1220 Lorne Street Birch Street Civic No. 28 0.12 HCB Rural paved 1,933,493$ 232,019$ 4,837,733$ 580,528$ 1300 Maple Street King Street Queen Street 0.095 HCB Rural paved 1,933,493$ 183,682$ 4,837,733$ 459,585$ 1310 Maple Street Queen Street Elgin Street 0.098 HCB Rural paved 1,933,493$ 189,482$ 4,837,733$ 474,098$ 1320 Maple Street Elgin Street Monk Street 0.088 HCB Rural paved 1,933,493$ 170,147$ 4,837,733$ 425,721$ 1330 Maple Street Monk Street Dufferin Street 0.097 HCB Rural paved 1,933,493$ 187,549$ 4,837,733$ 469,260$ 1400 Minto Street Laneway No. 1 Pine Street 0.127 HCB Rural paved 1,933,493$ 245,554$ 4,837,733$ 614,392$ 1440 Monk Street Lisgar Street Pine Street 0.085 HCB Rural paved 1,933,493$ 164,347$ 4,837,733$ 411,207$ 1530 Oak Street Lorne Street Landsdowne Street 0.095 HCB Rural paved 1,933,493$ 183,682$ 4,837,733$ 459,585$ 1540 Oak Street Landsdowne Street Aberdeen Street 0.092 HCB Rural paved 1,933,493$ 177,881$ 4,837,733$ 445,071$ 1740 Queen Street Dead End South (South of Elm) Elm Street 0.04 HCB Rural paved 1,933,493$ 77,340$ 4,837,733$ 193,509$ 1790 Rate Road Bucciarelli Dead End Cul De Sac 0.33 HCB Rural paved 1,933,493$ 638,053$ 4,837,733$ 1,596,452$ 2020 Water Plant Road Queen Street King Street 0.099 HCB Rural paved 1,933,493$ 191,416$ 4,837,733$ 478,936$ 870 Laneway No. 7 Oak Street Fir Street 0.2 GR Rural gravel 555,033$ 111,007$ 1,127,581$ 225,516$ 1410 Minto Street Pine Street Riverside Drive 0.154 GR Rural gravel 555,033$ 85,475$ 1,127,581$ 173,647$ 1660 Pineland Road Hwy. 129 Dead End 0.135 GR Rural gravel 555,033$ 74,929$ 1,127,581$ 152,223$ 1720 Queen Street Maple Street Dead End North (North of Maple) 0.13 GR Rural gravel 555,033$ 72,154$ 1,127,581$ 146,586$
3 of 4
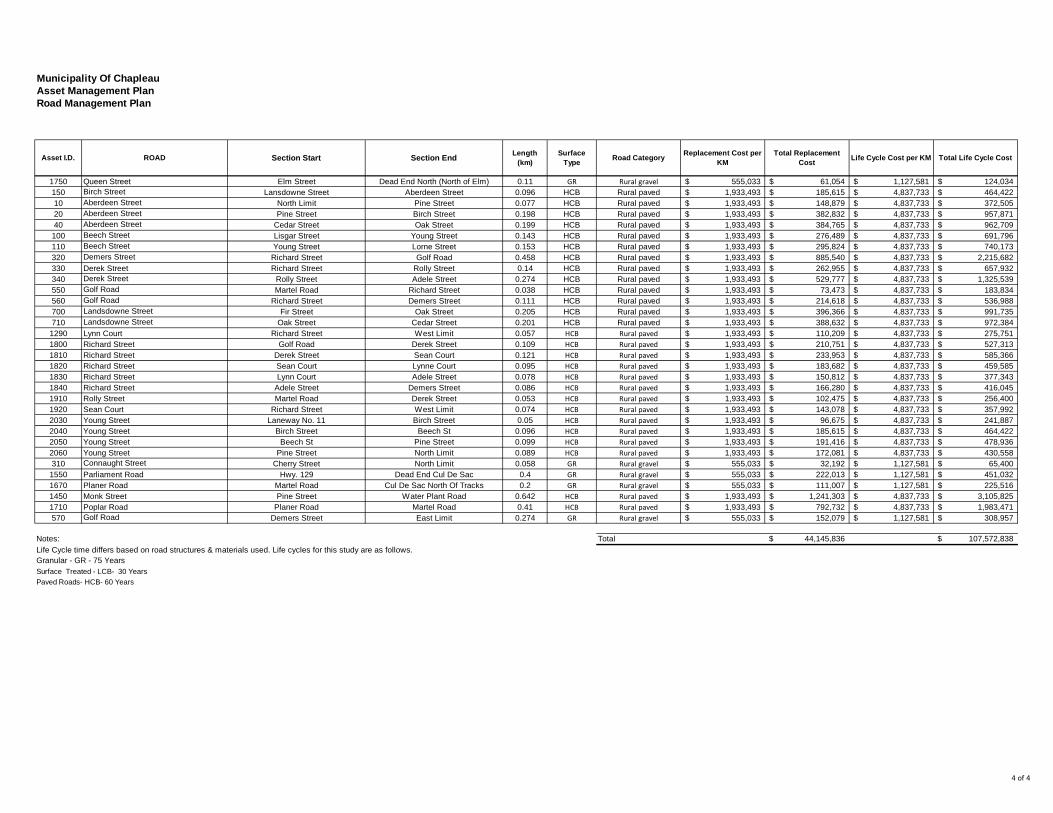
Municipality Of ChapleauAsset Management PlanRoad Management Plan
Road Category Replacement Cost per KM
Total Replacement Cost Total Life Cycle CostLife Cycle Cost per KMROAD Section Start Section End Length
(km)Asset I.D. Surface Type
1750 Queen Street Elm Street Dead End North (North of Elm) 0.11 GR Rural gravel 555,033$ 61,054$ 1,127,581$ 124,034$ 150 Birch Street Lansdowne Street Aberdeen Street 0.096 HCB Rural paved 1,933,493$ 185,615$ 4,837,733$ 464,422$ 10 Aberdeen Street North Limit Pine Street 0.077 HCB Rural paved 1,933,493$ 148,879$ 4,837,733$ 372,505$ 20 Aberdeen Street Pine Street Birch Street 0.198 HCB Rural paved 1,933,493$ 382,832$ 4,837,733$ 957,871$ 40 Aberdeen Street Cedar Street Oak Street 0.199 HCB Rural paved 1,933,493$ 384,765$ 4,837,733$ 962,709$
100 Beech Street Lisgar Street Young Street 0.143 HCB Rural paved 1,933,493$ 276,489$ 4,837,733$ 691,796$ 110 Beech Street Young Street Lorne Street 0.153 HCB Rural paved 1,933,493$ 295,824$ 4,837,733$ 740,173$ 320 Demers Street Richard Street Golf Road 0.458 HCB Rural paved 1,933,493$ 885,540$ 4,837,733$ 2,215,682$ 330 Derek Street Richard Street Rolly Street 0.14 HCB Rural paved 1,933,493$ 262,955$ 4,837,733$ 657,932$ 340 Derek Street Rolly Street Adele Street 0.274 HCB Rural paved 1,933,493$ 529,777$ 4,837,733$ 1,325,539$ 550 Golf Road Martel Road Richard Street 0.038 HCB Rural paved 1,933,493$ 73,473$ 4,837,733$ 183,834$ 560 Golf Road Richard Street Demers Street 0.111 HCB Rural paved 1,933,493$ 214,618$ 4,837,733$ 536,988$ 700 Landsdowne Street Fir Street Oak Street 0.205 HCB Rural paved 1,933,493$ 396,366$ 4,837,733$ 991,735$ 710 Landsdowne Street Oak Street Cedar Street 0.201 HCB Rural paved 1,933,493$ 388,632$ 4,837,733$ 972,384$
1290 Lynn Court Richard Street West Limit 0.057 HCB Rural paved 1,933,493$ 110,209$ 4,837,733$ 275,751$ 1800 Richard Street Golf Road Derek Street 0.109 HCB Rural paved 1,933,493$ 210,751$ 4,837,733$ 527,313$ 1810 Richard Street Derek Street Sean Court 0.121 HCB Rural paved 1,933,493$ 233,953$ 4,837,733$ 585,366$ 1820 Richard Street Sean Court Lynne Court 0.095 HCB Rural paved 1,933,493$ 183,682$ 4,837,733$ 459,585$ 1830 Richard Street Lynn Court Adele Street 0.078 HCB Rural paved 1,933,493$ 150,812$ 4,837,733$ 377,343$ 1840 Richard Street Adele Street Demers Street 0.086 HCB Rural paved 1,933,493$ 166,280$ 4,837,733$ 416,045$ 1910 Rolly Street Martel Road Derek Street 0.053 HCB Rural paved 1,933,493$ 102,475$ 4,837,733$ 256,400$ 1920 Sean Court Richard Street West Limit 0.074 HCB Rural paved 1,933,493$ 143,078$ 4,837,733$ 357,992$ 2030 Young Street Laneway No. 11 Birch Street 0.05 HCB Rural paved 1,933,493$ 96,675$ 4,837,733$ 241,887$ 2040 Young Street Birch Street Beech St 0.096 HCB Rural paved 1,933,493$ 185,615$ 4,837,733$ 464,422$ 2050 Young Street Beech St Pine Street 0.099 HCB Rural paved 1,933,493$ 191,416$ 4,837,733$ 478,936$ 2060 Young Street Pine Street North Limit 0.089 HCB Rural paved 1,933,493$ 172,081$ 4,837,733$ 430,558$ 310 Connaught Street Cherry Street North Limit 0.058 GR Rural gravel 555,033$ 32,192$ 1,127,581$ 65,400$
1550 Parliament Road Hwy. 129 Dead End Cul De Sac 0.4 GR Rural gravel 555,033$ 222,013$ 1,127,581$ 451,032$ 1670 Planer Road Martel Road Cul De Sac North Of Tracks 0.2 GR Rural gravel 555,033$ 111,007$ 1,127,581$ 225,516$ 1450 Monk Street Pine Street Water Plant Road 0.642 HCB Rural paved 1,933,493$ 1,241,303$ 4,837,733$ 3,105,825$ 1710 Poplar Road Planer Road Martel Road 0.41 HCB Rural paved 1,933,493$ 792,732$ 4,837,733$ 1,983,471$ 570 Golf Road Demers Street East Limit 0.274 GR Rural gravel 555,033$ 152,079$ 1,127,581$ 308,957$
Notes: Total 44,145,836$ 107,572,838$ Life Cycle time differs based on road structures & materials used. Life cycles for this study are as follows.Granular - GR - 75 YearsSurface Treated - LCB- 30 YearsPaved Roads- HCB- 60 Years
4 of 4

Asset Management PlanningAsset Management Planning for the Township of Chapleau
Appendix BAppendix BInfrastructure ProfileWater
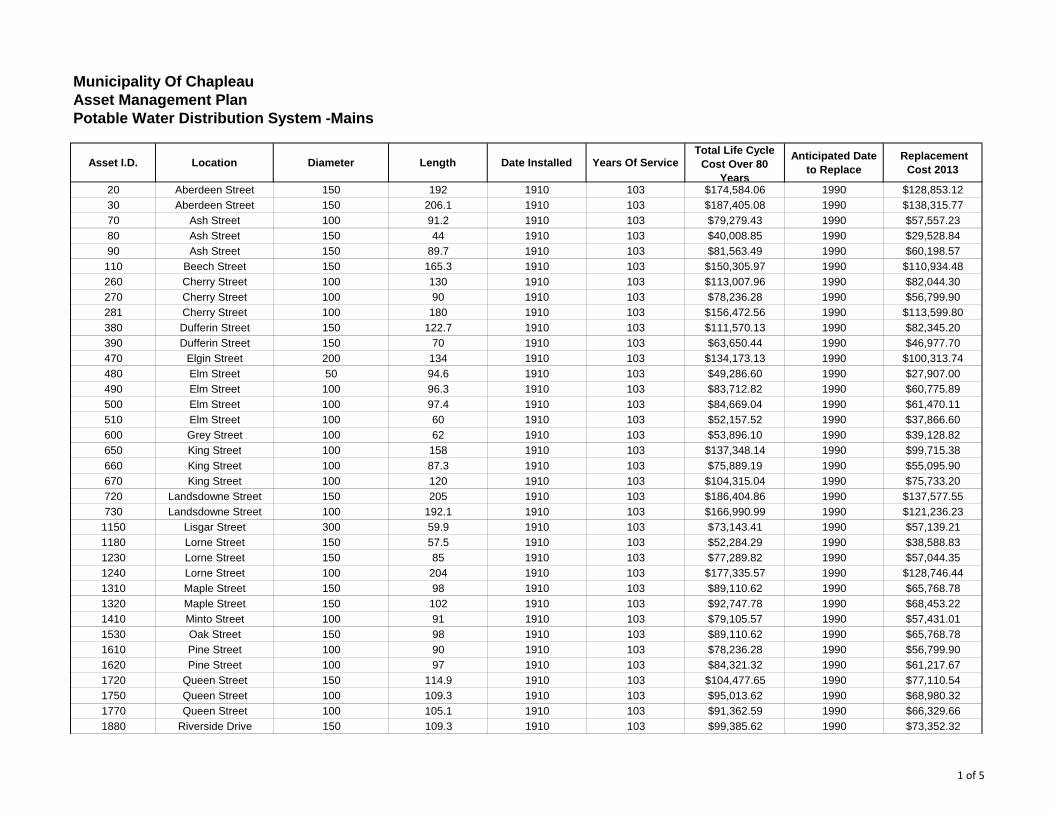
Municipality Of ChapleauAsset Management PlanPotable Water Distribution System -Mains
Asset I.D. Location Diameter Length Date Installed Years Of ServiceTotal Life Cycle
Cost Over 80 Years
Anticipated Date to Replace
Replacement Cost 2013
20 Aberdeen Street 150 192 1910 103 $174,584.06 1990 $128,853.1230 Aberdeen Street 150 206.1 1910 103 $187,405.08 1990 $138,315.7770 Ash Street 100 91.2 1910 103 $79,279.43 1990 $57,557.2380 Ash Street 150 44 1910 103 $40,008.85 1990 $29,528.8490 Ash Street 150 89.7 1910 103 $81,563.49 1990 $60,198.57
110 Beech Street 150 165.3 1910 103 $150,305.97 1990 $110,934.48260 Cherry Street 100 130 1910 103 $113,007.96 1990 $82,044.30270 Cherry Street 100 90 1910 103 $78,236.28 1990 $56,799.90281 Cherry Street 100 180 1910 103 $156,472.56 1990 $113,599.80380 Dufferin Street 150 122.7 1910 103 $111,570.13 1990 $82,345.20390 Dufferin Street 150 70 1910 103 $63,650.44 1990 $46,977.70470 Elgin Street 200 134 1910 103 $134,173.13 1990 $100,313.74480 Elm Street 50 94.6 1910 103 $49,286.60 1990 $27,907.00490 Elm Street 100 96.3 1910 103 $83,712.82 1990 $60,775.89500 Elm Street 100 97.4 1910 103 $84,669.04 1990 $61,470.11510 Elm Street 100 60 1910 103 $52,157.52 1990 $37,866.60600 Grey Street 100 62 1910 103 $53,896.10 1990 $39,128.82650 King Street 100 158 1910 103 $137 348 14 1990 $99 715 38650 King Street 100 158 1910 103 $137,348.14 1990 $99,715.38660 King Street 100 87.3 1910 103 $75,889.19 1990 $55,095.90670 King Street 100 120 1910 103 $104,315.04 1990 $75,733.20720 Landsdowne Street 150 205 1910 103 $186,404.86 1990 $137,577.55730 Landsdowne Street 100 192.1 1910 103 $166,990.99 1990 $121,236.231150 Lisgar Street 300 59.9 1910 103 $73,143.41 1990 $57,139.211180 Lorne Street 150 57.5 1910 103 $52,284.29 1990 $38,588.831230 Lorne Street 150 85 1910 103 $77,289.82 1990 $57,044.351240 Lorne Street 100 204 1910 103 $177,335.57 1990 $128,746.441310 Maple Street 150 98 1910 103 $89,110.62 1990 $65,768.781320 Maple Street 150 102 1910 103 $92,747.78 1990 $68,453.221410 Minto Street 100 91 1910 103 $79,105.57 1990 $57,431.011530 Oak Street 150 98 1910 103 $89,110.62 1990 $65,768.781610 Pine Street 100 90 1910 103 $78,236.28 1990 $56,799.901620 Pine Street 100 97 1910 103 $84,321.32 1990 $61,217.671720 Queen Street 150 114.9 1910 103 $104,477.65 1990 $77,110.541750 Queen Street 100 109.3 1910 103 $95,013.62 1990 $68,980.321770 Queen Street 100 105.1 1910 103 $91,362.59 1990 $66,329.661880 Riverside Drive 150 109.3 1910 103 $99,385.62 1990 $73,352.32
1 of 5
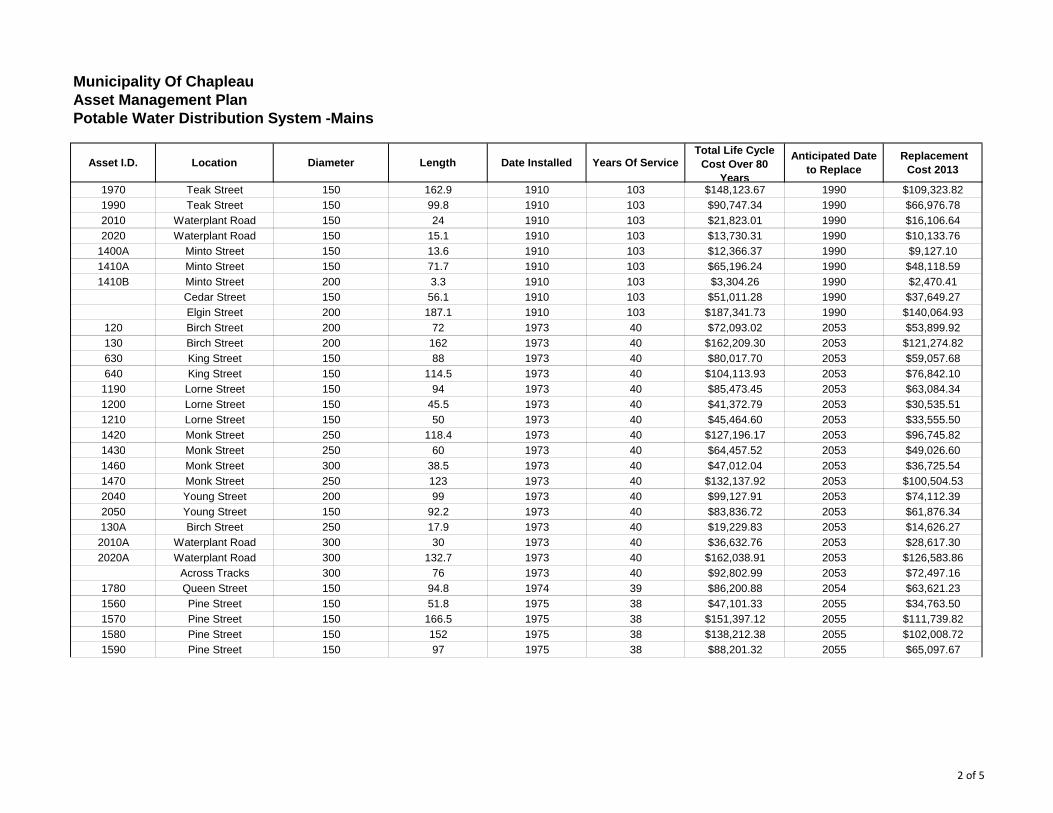
Municipality Of ChapleauAsset Management PlanPotable Water Distribution System -Mains
Asset I.D. Location Diameter Length Date Installed Years Of ServiceTotal Life Cycle
Cost Over 80 Years
Anticipated Date to Replace
Replacement Cost 2013
1970 Teak Street 150 162.9 1910 103 $148,123.67 1990 $109,323.821990 Teak Street 150 99.8 1910 103 $90,747.34 1990 $66,976.782010 Waterplant Road 150 24 1910 103 $21,823.01 1990 $16,106.642020 Waterplant Road 150 15.1 1910 103 $13,730.31 1990 $10,133.76
1400A Minto Street 150 13.6 1910 103 $12,366.37 1990 $9,127.101410A Minto Street 150 71.7 1910 103 $65,196.24 1990 $48,118.591410B Minto Street 200 3.3 1910 103 $3,304.26 1990 $2,470.41
Cedar Street 150 56.1 1910 103 $51,011.28 1990 $37,649.27Elgin Street 200 187.1 1910 103 $187,341.73 1990 $140,064.93
120 Birch Street 200 72 1973 40 $72,093.02 2053 $53,899.92130 Birch Street 200 162 1973 40 $162,209.30 2053 $121,274.82630 King Street 150 88 1973 40 $80,017.70 2053 $59,057.68640 King Street 150 114.5 1973 40 $104,113.93 2053 $76,842.101190 Lorne Street 150 94 1973 40 $85,473.45 2053 $63,084.341200 Lorne Street 150 45.5 1973 40 $41,372.79 2053 $30,535.511210 Lorne Street 150 50 1973 40 $45,464.60 2053 $33,555.501420 Monk Street 250 118.4 1973 40 $127,196.17 2053 $96,745.821430 Monk Street 250 60 1973 40 $64 457 52 2053 $49 026 601430 Monk Street 250 60 1973 40 $64,457.52 2053 $49,026.601460 Monk Street 300 38.5 1973 40 $47,012.04 2053 $36,725.541470 Monk Street 250 123 1973 40 $132,137.92 2053 $100,504.532040 Young Street 200 99 1973 40 $99,127.91 2053 $74,112.392050 Young Street 150 92.2 1973 40 $83,836.72 2053 $61,876.34130A Birch Street 250 17.9 1973 40 $19,229.83 2053 $14,626.272010A Waterplant Road 300 30 1973 40 $36,632.76 2053 $28,617.302020A Waterplant Road 300 132.7 1973 40 $162,038.91 2053 $126,583.86
Across Tracks 300 76 1973 40 $92,802.99 2053 $72,497.161780 Queen Street 150 94.8 1974 39 $86,200.88 2054 $63,621.231560 Pine Street 150 51.8 1975 38 $47,101.33 2055 $34,763.501570 Pine Street 150 166.5 1975 38 $151,397.12 2055 $111,739.821580 Pine Street 150 152 1975 38 $138,212.38 2055 $102,008.721590 Pine Street 150 97 1975 38 $88,201.32 2055 $65,097.67
2 of 5
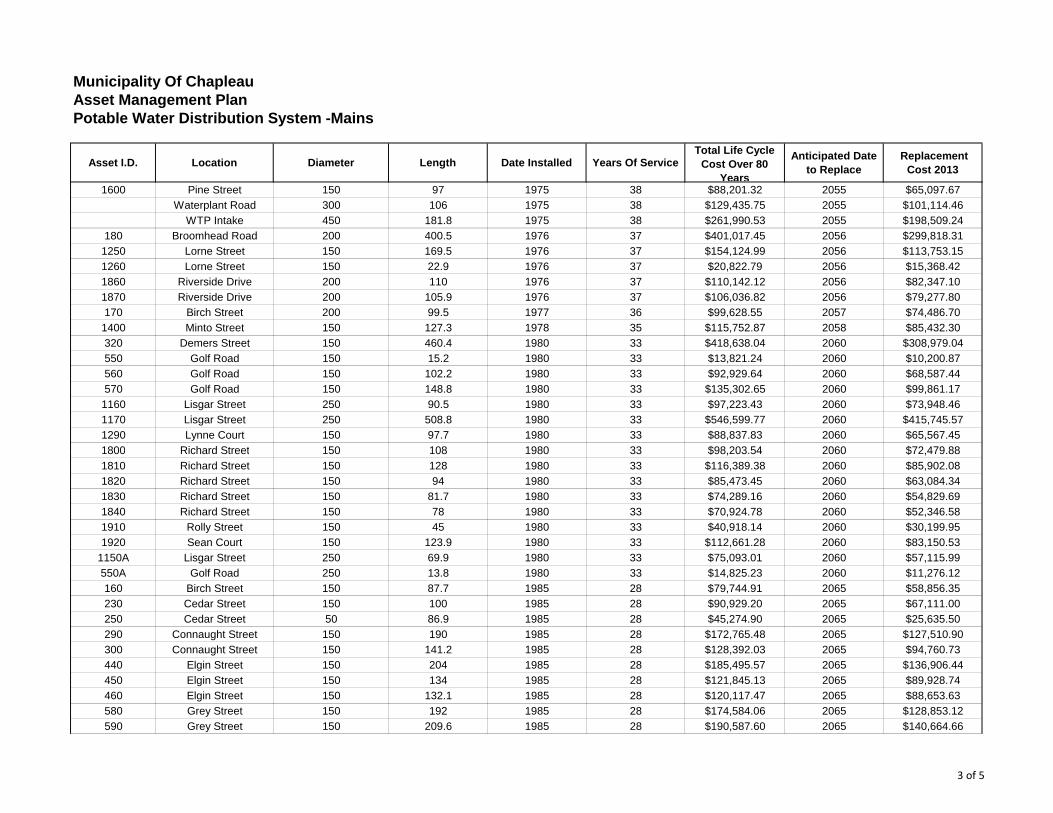
Municipality Of ChapleauAsset Management PlanPotable Water Distribution System -Mains
Asset I.D. Location Diameter Length Date Installed Years Of ServiceTotal Life Cycle
Cost Over 80 Years
Anticipated Date to Replace
Replacement Cost 2013
1600 Pine Street 150 97 1975 38 $88,201.32 2055 $65,097.67Waterplant Road 300 106 1975 38 $129,435.75 2055 $101,114.46
WTP Intake 450 181.8 1975 38 $261,990.53 2055 $198,509.24180 Broomhead Road 200 400.5 1976 37 $401,017.45 2056 $299,818.31
1250 Lorne Street 150 169.5 1976 37 $154,124.99 2056 $113,753.151260 Lorne Street 150 22.9 1976 37 $20,822.79 2056 $15,368.421860 Riverside Drive 200 110 1976 37 $110,142.12 2056 $82,347.101870 Riverside Drive 200 105.9 1976 37 $106,036.82 2056 $79,277.80170 Birch Street 200 99.5 1977 36 $99,628.55 2057 $74,486.701400 Minto Street 150 127.3 1978 35 $115,752.87 2058 $85,432.30320 Demers Street 150 460.4 1980 33 $418,638.04 2060 $308,979.04550 Golf Road 150 15.2 1980 33 $13,821.24 2060 $10,200.87560 Golf Road 150 102.2 1980 33 $92,929.64 2060 $68,587.44570 Golf Road 150 148.8 1980 33 $135,302.65 2060 $99,861.17
1160 Lisgar Street 250 90.5 1980 33 $97,223.43 2060 $73,948.461170 Lisgar Street 250 508.8 1980 33 $546,599.77 2060 $415,745.571290 Lynne Court 150 97.7 1980 33 $88,837.83 2060 $65,567.451800 Richard Street 150 108 1980 33 $98 203 54 2060 $72 479 881800 Richard Street 150 108 1980 33 $98,203.54 2060 $72,479.881810 Richard Street 150 128 1980 33 $116,389.38 2060 $85,902.081820 Richard Street 150 94 1980 33 $85,473.45 2060 $63,084.341830 Richard Street 150 81.7 1980 33 $74,289.16 2060 $54,829.691840 Richard Street 150 78 1980 33 $70,924.78 2060 $52,346.581910 Rolly Street 150 45 1980 33 $40,918.14 2060 $30,199.951920 Sean Court 150 123.9 1980 33 $112,661.28 2060 $83,150.53
1150A Lisgar Street 250 69.9 1980 33 $75,093.01 2060 $57,115.99550A Golf Road 250 13.8 1980 33 $14,825.23 2060 $11,276.12160 Birch Street 150 87.7 1985 28 $79,744.91 2065 $58,856.35230 Cedar Street 150 100 1985 28 $90,929.20 2065 $67,111.00250 Cedar Street 50 86.9 1985 28 $45,274.90 2065 $25,635.50290 Connaught Street 150 190 1985 28 $172,765.48 2065 $127,510.90300 Connaught Street 150 141.2 1985 28 $128,392.03 2065 $94,760.73440 Elgin Street 150 204 1985 28 $185,495.57 2065 $136,906.44450 Elgin Street 150 134 1985 28 $121,845.13 2065 $89,928.74460 Elgin Street 150 132.1 1985 28 $120,117.47 2065 $88,653.63580 Grey Street 150 192 1985 28 $174,584.06 2065 $128,853.12590 Grey Street 150 209.6 1985 28 $190,587.60 2065 $140,664.66
3 of 5
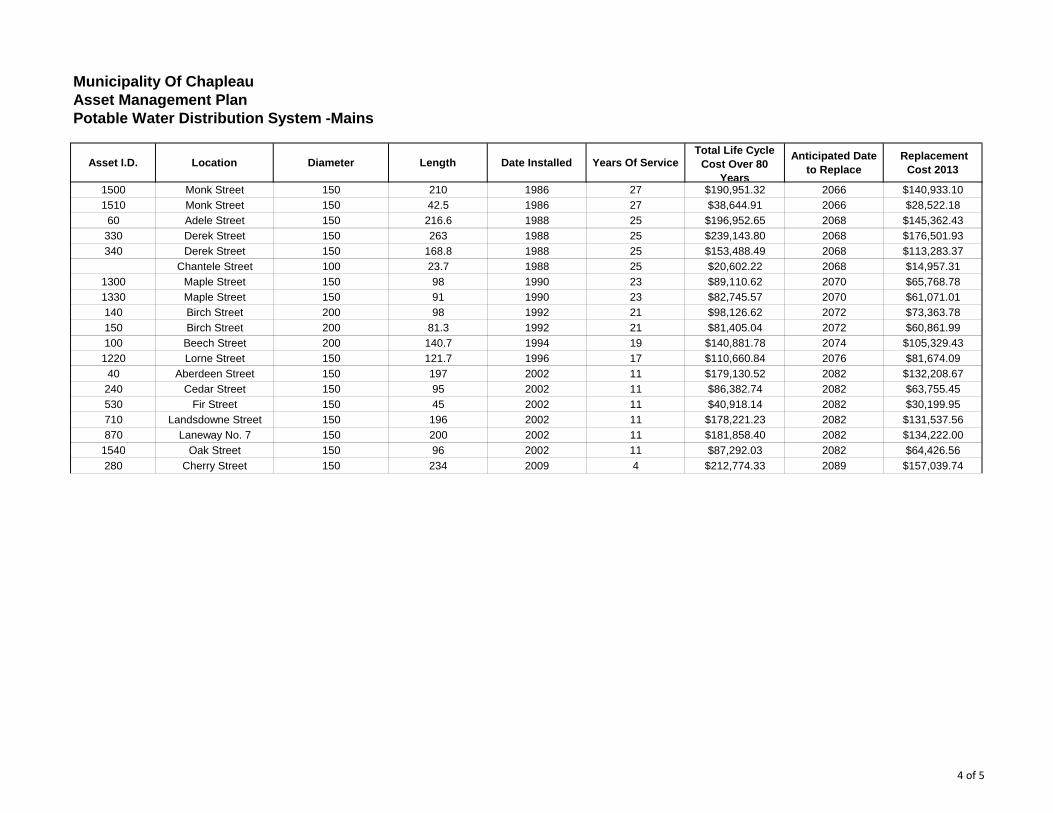
Municipality Of ChapleauAsset Management PlanPotable Water Distribution System -Mains
Asset I.D. Location Diameter Length Date Installed Years Of ServiceTotal Life Cycle
Cost Over 80 Years
Anticipated Date to Replace
Replacement Cost 2013
1500 Monk Street 150 210 1986 27 $190,951.32 2066 $140,933.101510 Monk Street 150 42.5 1986 27 $38,644.91 2066 $28,522.18
60 Adele Street 150 216.6 1988 25 $196,952.65 2068 $145,362.43330 Derek Street 150 263 1988 25 $239,143.80 2068 $176,501.93340 Derek Street 150 168.8 1988 25 $153,488.49 2068 $113,283.37
Chantele Street 100 23.7 1988 25 $20,602.22 2068 $14,957.311300 Maple Street 150 98 1990 23 $89,110.62 2070 $65,768.781330 Maple Street 150 91 1990 23 $82,745.57 2070 $61,071.01140 Birch Street 200 98 1992 21 $98,126.62 2072 $73,363.78150 Birch Street 200 81.3 1992 21 $81,405.04 2072 $60,861.99100 Beech Street 200 140.7 1994 19 $140,881.78 2074 $105,329.431220 Lorne Street 150 121.7 1996 17 $110,660.84 2076 $81,674.09
40 Aberdeen Street 150 197 2002 11 $179,130.52 2082 $132,208.67240 Cedar Street 150 95 2002 11 $86,382.74 2082 $63,755.45530 Fir Street 150 45 2002 11 $40,918.14 2082 $30,199.95710 Landsdowne Street 150 196 2002 11 $178,221.23 2082 $131,537.56870 Laneway No. 7 150 200 2002 11 $181,858.40 2082 $134,222.00
1540 Oak Street 150 96 2002 11 $87 292 03 2082 $64 426 561540 Oak Street 150 96 2002 11 $87,292.03 2082 $64,426.56280 Cherry Street 150 234 2009 4 $212,774.33 2089 $157,039.74
4 of 5
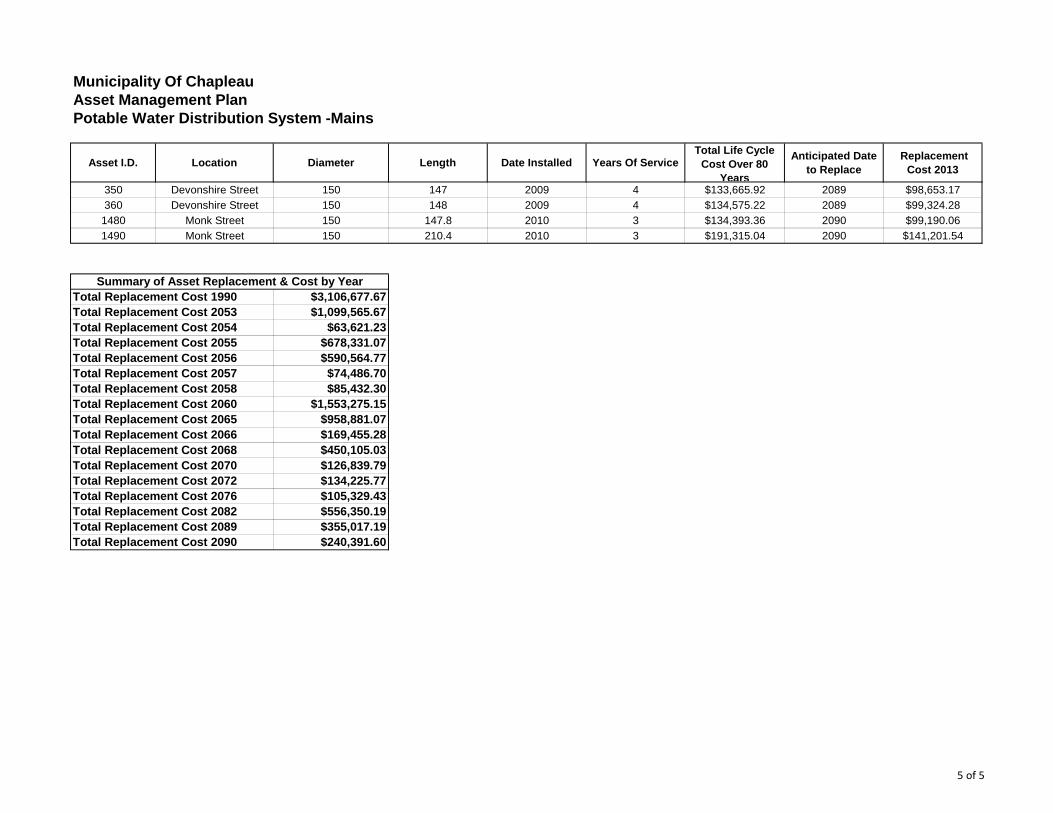
Municipality Of ChapleauAsset Management PlanPotable Water Distribution System -Mains
Asset I.D. Location Diameter Length Date Installed Years Of ServiceTotal Life Cycle
Cost Over 80 Years
Anticipated Date to Replace
Replacement Cost 2013
350 Devonshire Street 150 147 2009 4 $133,665.92 2089 $98,653.17360 Devonshire Street 150 148 2009 4 $134,575.22 2089 $99,324.28
1480 Monk Street 150 147.8 2010 3 $134,393.36 2090 $99,190.061490 Monk Street 150 210.4 2010 3 $191,315.04 2090 $141,201.54
Total Replacement Cost 1990 $3,106,677.67Total Replacement Cost 2053 $1,099,565.67Total Replacement Cost 2054 $63,621.23Total Replacement Cost 2055 $678,331.07Total Replacement Cost 2056 $590,564.77Total Replacement Cost 2057 $74,486.70Total Replacement Cost 2058 $85,432.30Total Replacement Cost 2060 $1,553,275.15Total Replacement Cost 2065 $958,881.07Total Replacement Cost 2066 $169,455.28Total Replacement Cost 2068 $450 105 03
Summary of Asset Replacement & Cost by Year
Total Replacement Cost 2068 $450,105.03Total Replacement Cost 2070 $126,839.79Total Replacement Cost 2072 $134,225.77Total Replacement Cost 2076 $105,329.43Total Replacement Cost 2082 $556,350.19Total Replacement Cost 2089 $355,017.19Total Replacement Cost 2090 $240,391.60
5 of 5

Asset Management PlanningAsset Management Planning for the Township of Chapleau
Appendix CAppendix CInfrastructure ProfileWastewater and Storm SSewer
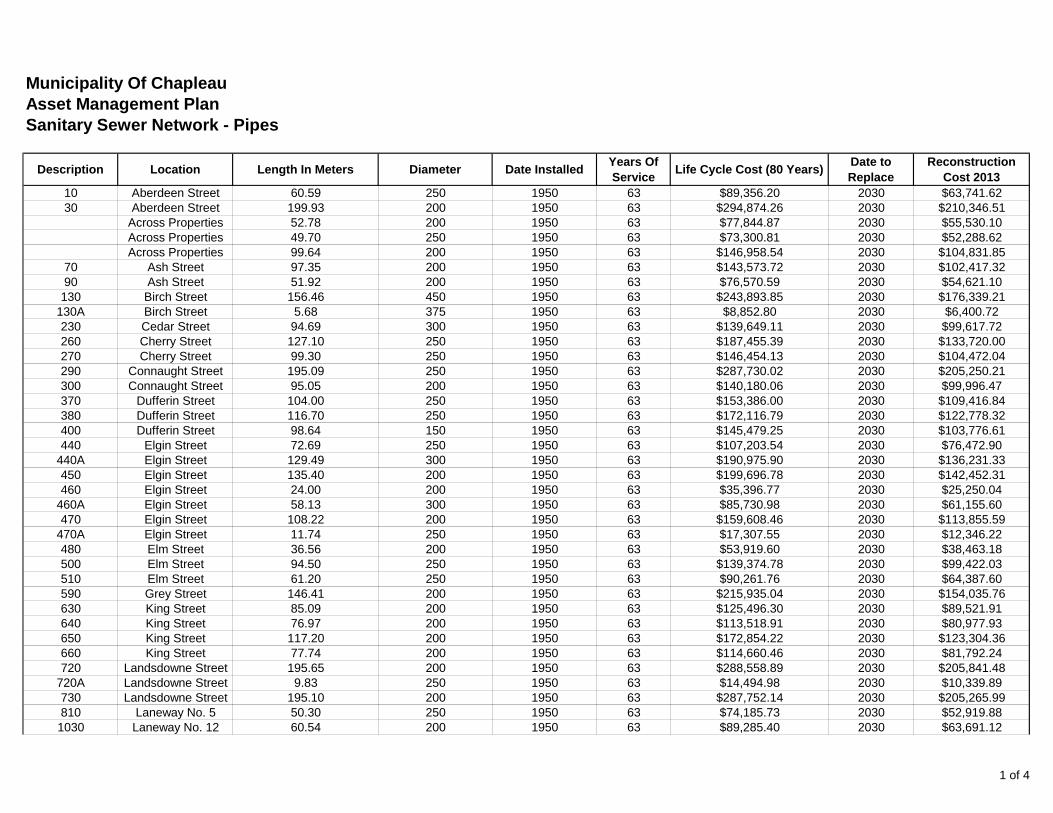
Municipality Of ChapleauAsset Management PlanSanitary Sewer Network - Pipes
Description Location Length In Meters Diameter Date Installed Years Of Service Life Cycle Cost (80 Years) Date to
ReplaceReconstruction
Cost 201310 Aberdeen Street 60.59 250 1950 63 $89,356.20 2030 $63,741.6230 Aberdeen Street 199.93 200 1950 63 $294,874.26 2030 $210,346.51
Across Properties 52.78 200 1950 63 $77,844.87 2030 $55,530.10Across Properties 49.70 250 1950 63 $73,300.81 2030 $52,288.62Across Properties 99.64 200 1950 63 $146,958.54 2030 $104,831.85
70 Ash Street 97.35 200 1950 63 $143,573.72 2030 $102,417.3290 Ash Street 51.92 200 1950 63 $76,570.59 2030 $54,621.10130 Birch Street 156.46 450 1950 63 $243,893.85 2030 $176,339.21
130A Birch Street 5.68 375 1950 63 $8,852.80 2030 $6,400.72230 Cedar Street 94.69 300 1950 63 $139,649.11 2030 $99,617.72260 Cherry Street 127.10 250 1950 63 $187,455.39 2030 $133,720.00270 Cherry Street 99.30 250 1950 63 $146,454.13 2030 $104,472.04290 Connaught Street 195.09 250 1950 63 $287,730.02 2030 $205,250.21300 Connaught Street 95.05 200 1950 63 $140,180.06 2030 $99,996.47370 Dufferin Street 104.00 250 1950 63 $153,386.00 2030 $109,416.84380 Dufferin Street 116.70 250 1950 63 $172,116.79 2030 $122,778.32400 Dufferin Street 98.64 150 1950 63 $145,479.25 2030 $103,776.61440 Elgin Street 72.69 250 1950 63 $107,203.54 2030 $76,472.90
440A Elgin Street 129.49 300 1950 63 $190,975.90 2030 $136,231.33450 Elgin Street 135.40 200 1950 63 $199,696.78 2030 $142,452.31460 Elgin Street 24.00 200 1950 63 $35,396.77 2030 $25,250.04
460A Elgin Street 58.13 300 1950 63 $85,730.98 2030 $61,155.60470 Elgin Street 108.22 200 1950 63 $159,608.46 2030 $113,855.59
470A Elgin Street 11.74 250 1950 63 $17,307.55 2030 $12,346.22480 Elm Street 36.56 200 1950 63 $53,919.60 2030 $38,463.18500 Elm Street 94.50 250 1950 63 $139,374.78 2030 $99,422.03510 Elm Street 61.20 250 1950 63 $90,261.76 2030 $64,387.60590 Grey Street 146.41 200 1950 63 $215,935.04 2030 $154,035.76630 King Street 85.09 200 1950 63 $125,496.30 2030 $89,521.91640 King Street 76.97 200 1950 63 $113,518.91 2030 $80,977.93650 King Street 117.20 200 1950 63 $172,854.22 2030 $123,304.36660 King Street 77.74 200 1950 63 $114,660.46 2030 $81,792.24720 Landsdowne Street 195.65 200 1950 63 $288,558.89 2030 $205,841.48
720A Landsdowne Street 9.83 250 1950 63 $14,494.98 2030 $10,339.89730 Landsdowne Street 195.10 200 1950 63 $287,752.14 2030 $205,265.99810 Laneway No. 5 50.30 250 1950 63 $74,185.73 2030 $52,919.881030 Laneway No. 12 60.54 200 1950 63 $89,285.40 2030 $63,691.12
1 of 4
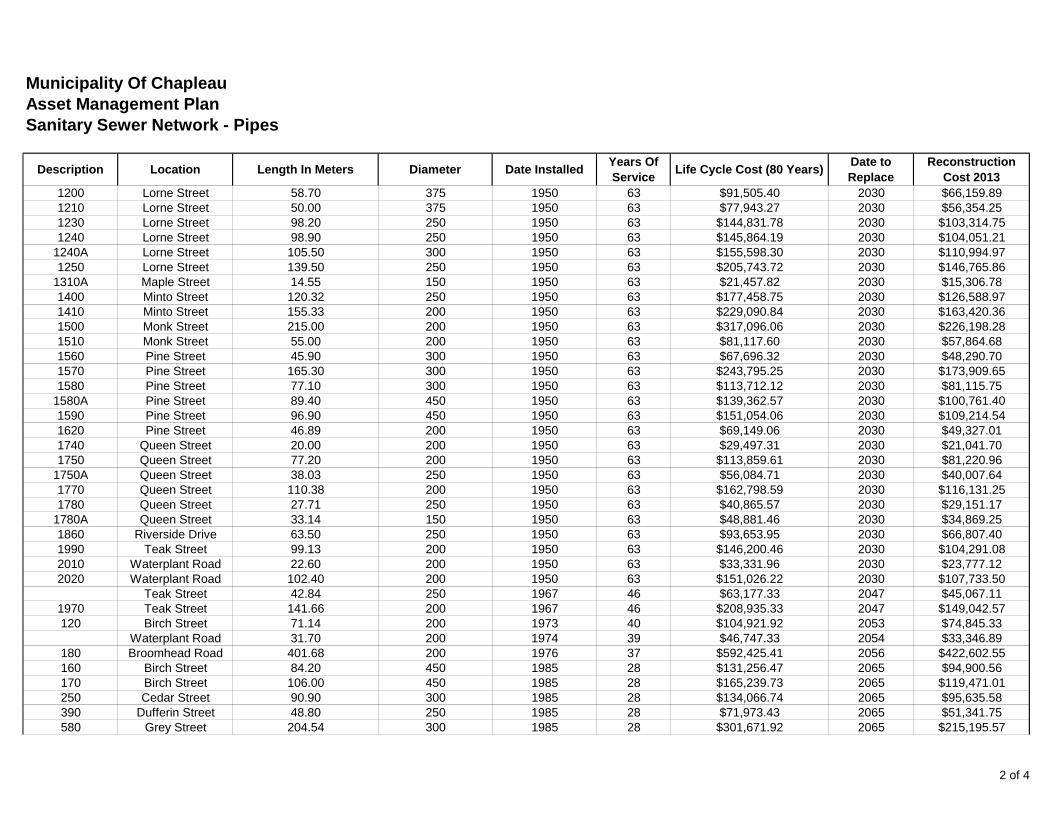
Municipality Of ChapleauAsset Management PlanSanitary Sewer Network - Pipes
Description Location Length In Meters Diameter Date Installed Years Of Service Life Cycle Cost (80 Years) Date to
ReplaceReconstruction
Cost 20131200 Lorne Street 58.70 375 1950 63 $91,505.40 2030 $66,159.891210 Lorne Street 50.00 375 1950 63 $77,943.27 2030 $56,354.251230 Lorne Street 98.20 250 1950 63 $144,831.78 2030 $103,314.751240 Lorne Street 98.90 250 1950 63 $145,864.19 2030 $104,051.21
1240A Lorne Street 105.50 300 1950 63 $155,598.30 2030 $110,994.971250 Lorne Street 139.50 250 1950 63 $205,743.72 2030 $146,765.86
1310A Maple Street 14.55 150 1950 63 $21,457.82 2030 $15,306.781400 Minto Street 120.32 250 1950 63 $177,458.75 2030 $126,588.971410 Minto Street 155.33 200 1950 63 $229,090.84 2030 $163,420.361500 Monk Street 215.00 200 1950 63 $317,096.06 2030 $226,198.281510 Monk Street 55.00 200 1950 63 $81,117.60 2030 $57,864.681560 Pine Street 45.90 300 1950 63 $67,696.32 2030 $48,290.701570 Pine Street 165.30 300 1950 63 $243,795.25 2030 $173,909.651580 Pine Street 77.10 300 1950 63 $113,712.12 2030 $81,115.75
1580A Pine Street 89.40 450 1950 63 $139,362.57 2030 $100,761.401590 Pine Street 96.90 450 1950 63 $151,054.06 2030 $109,214.541620 Pine Street 46.89 200 1950 63 $69,149.06 2030 $49,327.011740 Queen Street 20.00 200 1950 63 $29,497.31 2030 $21,041.701750 Queen Street 77.20 200 1950 63 $113,859.61 2030 $81,220.96
1750A Queen Street 38.03 250 1950 63 $56,084.71 2030 $40,007.641770 Queen Street 110.38 200 1950 63 $162,798.59 2030 $116,131.251780 Queen Street 27.71 250 1950 63 $40,865.57 2030 $29,151.17
1780A Queen Street 33.14 150 1950 63 $48,881.46 2030 $34,869.251860 Riverside Drive 63.50 250 1950 63 $93,653.95 2030 $66,807.401990 Teak Street 99.13 200 1950 63 $146,200.46 2030 $104,291.082010 Waterplant Road 22.60 200 1950 63 $33,331.96 2030 $23,777.122020 Waterplant Road 102.40 200 1950 63 $151,026.22 2030 $107,733.50
Teak Street 42.84 250 1967 46 $63,177.33 2047 $45,067.111970 Teak Street 141.66 200 1967 46 $208,935.33 2047 $149,042.57120 Birch Street 71.14 200 1973 40 $104,921.92 2053 $74,845.33
Waterplant Road 31.70 200 1974 39 $46,747.33 2054 $33,346.89180 Broomhead Road 401.68 200 1976 37 $592,425.41 2056 $422,602.55160 Birch Street 84.20 450 1985 28 $131,256.47 2065 $94,900.56170 Birch Street 106.00 450 1985 28 $165,239.73 2065 $119,471.01250 Cedar Street 90.90 300 1985 28 $134,066.74 2065 $95,635.58390 Dufferin Street 48.80 250 1985 28 $71,973.43 2065 $51,341.75580 Grey Street 204.54 300 1985 28 $301,671.92 2065 $215,195.57
2 of 4
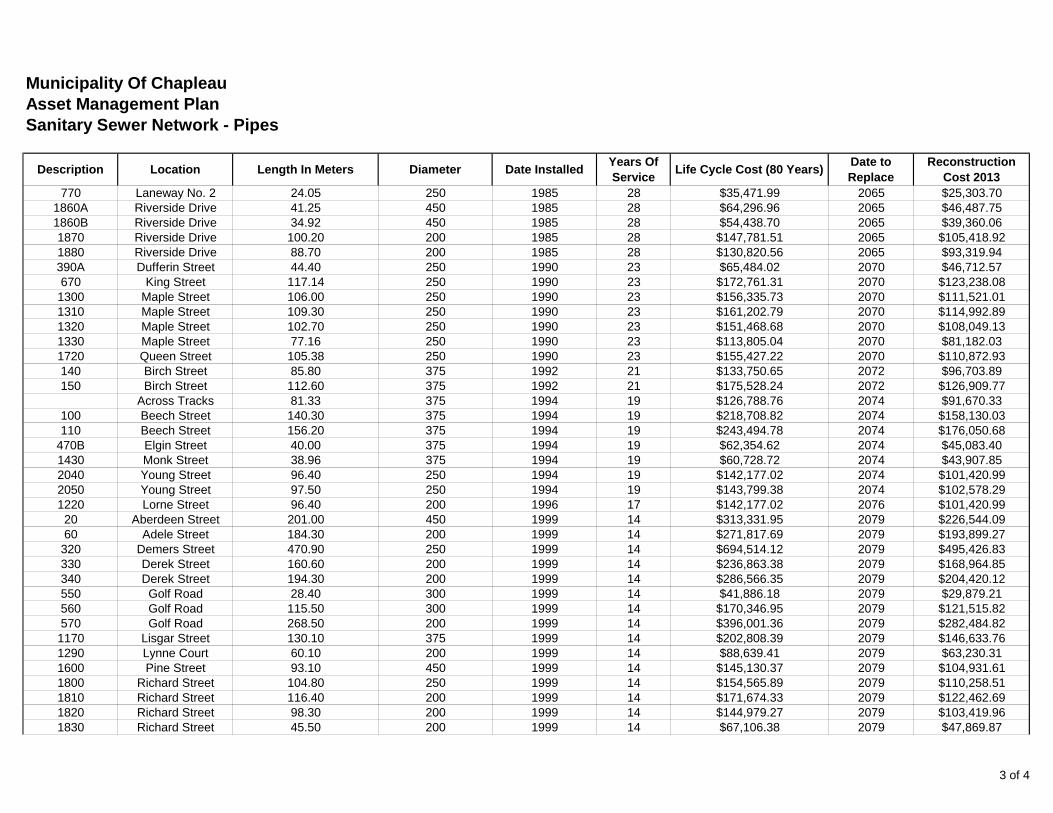
Municipality Of ChapleauAsset Management PlanSanitary Sewer Network - Pipes
Description Location Length In Meters Diameter Date Installed Years Of Service Life Cycle Cost (80 Years) Date to
ReplaceReconstruction
Cost 2013770 Laneway No. 2 24.05 250 1985 28 $35,471.99 2065 $25,303.70
1860A Riverside Drive 41.25 450 1985 28 $64,296.96 2065 $46,487.751860B Riverside Drive 34.92 450 1985 28 $54,438.70 2065 $39,360.061870 Riverside Drive 100.20 200 1985 28 $147,781.51 2065 $105,418.921880 Riverside Drive 88.70 200 1985 28 $130,820.56 2065 $93,319.94390A Dufferin Street 44.40 250 1990 23 $65,484.02 2070 $46,712.57670 King Street 117.14 250 1990 23 $172,761.31 2070 $123,238.081300 Maple Street 106.00 250 1990 23 $156,335.73 2070 $111,521.011310 Maple Street 109.30 250 1990 23 $161,202.79 2070 $114,992.891320 Maple Street 102.70 250 1990 23 $151,468.68 2070 $108,049.131330 Maple Street 77.16 250 1990 23 $113,805.04 2070 $81,182.031720 Queen Street 105.38 250 1990 23 $155,427.22 2070 $110,872.93140 Birch Street 85.80 375 1992 21 $133,750.65 2072 $96,703.89150 Birch Street 112.60 375 1992 21 $175,528.24 2072 $126,909.77
Across Tracks 81.33 375 1994 19 $126,788.76 2074 $91,670.33100 Beech Street 140.30 375 1994 19 $218,708.82 2074 $158,130.03110 Beech Street 156.20 375 1994 19 $243,494.78 2074 $176,050.68
470B Elgin Street 40.00 375 1994 19 $62,354.62 2074 $45,083.401430 Monk Street 38.96 375 1994 19 $60,728.72 2074 $43,907.852040 Young Street 96.40 250 1994 19 $142,177.02 2074 $101,420.992050 Young Street 97.50 250 1994 19 $143,799.38 2074 $102,578.291220 Lorne Street 96.40 200 1996 17 $142,177.02 2076 $101,420.9920 Aberdeen Street 201.00 450 1999 14 $313,331.95 2079 $226,544.0960 Adele Street 184.30 200 1999 14 $271,817.69 2079 $193,899.27
320 Demers Street 470.90 250 1999 14 $694,514.12 2079 $495,426.83330 Derek Street 160.60 200 1999 14 $236,863.38 2079 $168,964.85340 Derek Street 194.30 200 1999 14 $286,566.35 2079 $204,420.12550 Golf Road 28.40 300 1999 14 $41,886.18 2079 $29,879.21560 Golf Road 115.50 300 1999 14 $170,346.95 2079 $121,515.82570 Golf Road 268.50 200 1999 14 $396,001.36 2079 $282,484.821170 Lisgar Street 130.10 375 1999 14 $202,808.39 2079 $146,633.761290 Lynne Court 60.10 200 1999 14 $88,639.41 2079 $63,230.311600 Pine Street 93.10 450 1999 14 $145,130.37 2079 $104,931.611800 Richard Street 104.80 250 1999 14 $154,565.89 2079 $110,258.511810 Richard Street 116.40 200 1999 14 $171,674.33 2079 $122,462.691820 Richard Street 98.30 200 1999 14 $144,979.27 2079 $103,419.961830 Richard Street 45.50 200 1999 14 $67,106.38 2079 $47,869.87
3 of 4
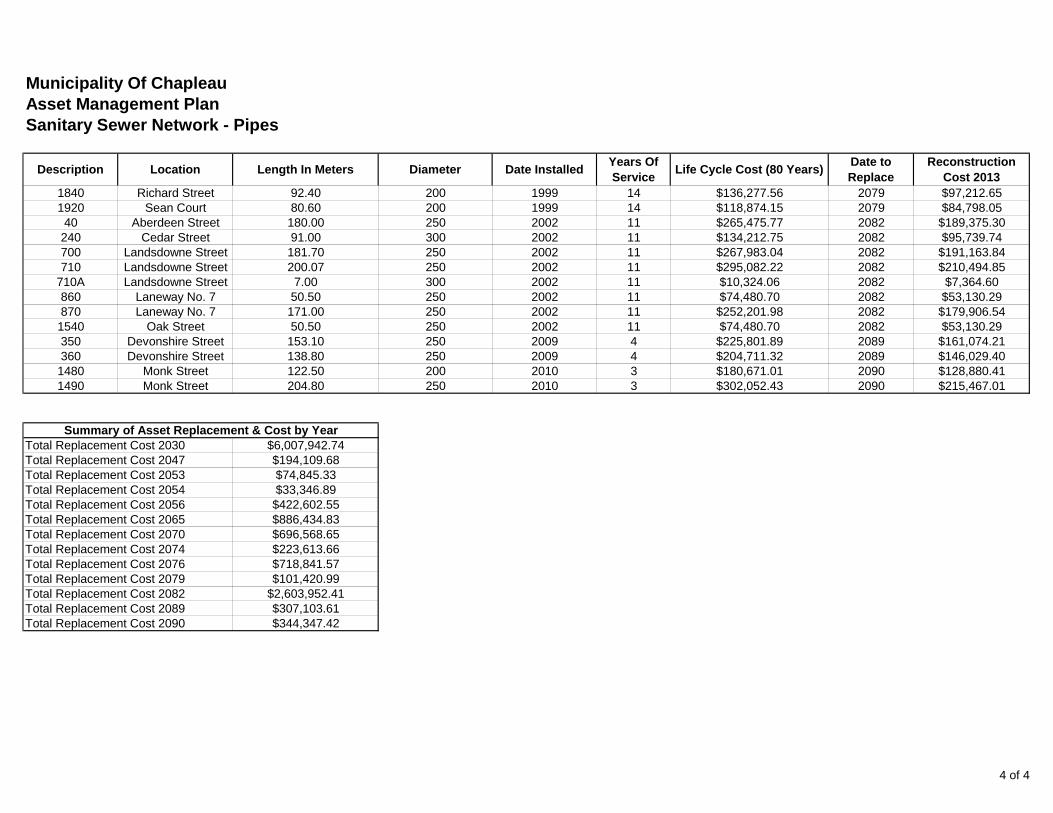
Municipality Of ChapleauAsset Management PlanSanitary Sewer Network - Pipes
Description Location Length In Meters Diameter Date Installed Years Of Service Life Cycle Cost (80 Years) Date to
ReplaceReconstruction
Cost 20131840 Richard Street 92.40 200 1999 14 $136,277.56 2079 $97,212.651920 Sean Court 80.60 200 1999 14 $118,874.15 2079 $84,798.0540 Aberdeen Street 180.00 250 2002 11 $265,475.77 2082 $189,375.30240 Cedar Street 91.00 300 2002 11 $134,212.75 2082 $95,739.74700 Landsdowne Street 181.70 250 2002 11 $267,983.04 2082 $191,163.84710 Landsdowne Street 200.07 250 2002 11 $295,082.22 2082 $210,494.85
710A Landsdowne Street 7.00 300 2002 11 $10,324.06 2082 $7,364.60860 Laneway No. 7 50.50 250 2002 11 $74,480.70 2082 $53,130.29870 Laneway No. 7 171.00 250 2002 11 $252,201.98 2082 $179,906.541540 Oak Street 50.50 250 2002 11 $74,480.70 2082 $53,130.29350 Devonshire Street 153.10 250 2009 4 $225,801.89 2089 $161,074.21360 Devonshire Street 138.80 250 2009 4 $204,711.32 2089 $146,029.401480 Monk Street 122.50 200 2010 3 $180,671.01 2090 $128,880.411490 Monk Street 204.80 250 2010 3 $302,052.43 2090 $215,467.01
Total Replacement Cost 2030 $6,007,942.74Summary of Asset Replacement & Cost by Year
Total Replacement Cost 2047 $194,109.68Total Replacement Cost 2053 $74,845.33Total Replacement Cost 2054 $33,346.89Total Replacement Cost 2056 $422,602.55Total Replacement Cost 2065 $886,434.83Total Replacement Cost 2070 $696,568.65Total Replacement Cost 2074 $223,613.66Total Replacement Cost 2076 $718,841.57Total Replacement Cost 2079 $101,420.99Total Replacement Cost 2082 $2,603,952.41Total Replacement Cost 2089 $307,103.61Total Replacement Cost 2090 $344,347.42
4 of 4

Municipality Of ChapleauAsset Management PlanStorm Network- Pipes
Description (Asset ID) Location Length In Meters Diameter Date Installed Years Of Service
Life Cycle Cost (80 Years)
Date To Replace
Reconstruction Cost 2013
10 Aberdeen Street 101.275 200 1950 63 $124,206.46 2030 $95,592.4620 Aberdeen Street 68.814 200 1950 63 $84,395.39 2030 $64,952.85
20A Aberdeen Street 146.755 250 1950 63 $179,984.38 2030 $138,520.5830 Aberdeen Street 29.521 250 1950 63 $36,205.37 2030 $27,864.58
30A Aberdeen Street 27.801 100 1950 63 $34,095.91 2030 $26,241.0930B Aberdeen Street 166.03 450 1950 63 $203,623.77 2030 $156,714.0640 Aberdeen Street 18.556 250 1950 63 $22,757.59 2030 $17,514.82
Ash and Elm Streets 110.952 200 1950 63 $136,074.60 2030 $104,726.4890 Ash Street 76.9279 300 1950 63 $94,346.50 2030 $72,611.48
90A Ash Street 25.497 450 1950 63 $31,270.22 2030 $24,066.36100A Beech Street 10.732 250 1950 63 $13,162.02 2030 $10,129.83110 Beech Street 45.697 250 1950 63 $56,044.06 2030 $43,132.94120 Birch Street 69.443 250 1950 63 $85,166.81 2030 $65,546.55
120A Birch Street 12.064 375 1950 63 $14,795.62 2030 $11,387.09130 Birch Street 170.403 375 1950 63 $208,986.94 2030 $160,841.69
130A Birch Street 49.638 250 1950 63 $60,877.41 2030 $46,852.81140 Birch Street 27.215 250 1950 63 $33,377.23 2030 $25,687.97
140B Birch Street 18.622 525 1950 63 $22,838.53 2030 $17,577.12150 Birch Street 15.637 200 1950 63 $19,177.65 2030 $14,759.61
$ $150A Birch Street 12.825 250 1950 63 $15,728.93 2030 $12,105.39150B Birch Street 90.518 450 1950 63 $111,013.77 2030 $85,439.04160 Birch Street 90.19 200 1950 63 $110,611.51 2030 $85,129.44
160A Birch Street 18.967 250 1950 63 $23,261.65 2030 $17,902.76230 Cedar Street 78.21 450 1950 63 $95,918.90 2030 $73,821.64
230A Cedar Street 10.565 250 1950 63 $12,957.21 2030 $9,972.20240 Cedar Street 91.156 450 1950 63 $111,796.23 2030 $86,041.24
240A Cedar Street 18.056 250 1950 63 $22,144.38 2030 $17,042.88240B Cedar Street 29.082 250 1950 63 $35,666.97 2030 $27,450.21250 Cedar Street 107.038 450 1950 63 $131,274.36 2030 $101,032.10270 Cherry Street 118.872 375 1950 63 $145,787.90 2030 $112,202.09290 Connaught Street 113.923 300 1950 63 $139,718.31 2030 $107,530.78310 Connaught Street 80.181 450 1950 63 $98,336.19 2030 $75,682.04380 Dufferin Street 156.4 450 1950 63 $191,813.28 2030 $147,624.40390 Dufferin Street 70 450 1950 63 $85,849.93 2030 $66,072.30400 Dufferin Street 119.926 600 1950 63 $147,080.56 2030 $113,196.95440 Elgin Street 22.822 250 1950 63 $27,989.53 2030 $21,541.46
440A Elgin Street 112.004 600 1950 63 $137,364.80 2030 $105,719.46450 Elgin Street 61.96 200 1950 63 $75,989.45 2030 $58,483.42500 Elm Street 114.186 200 1950 63 $140,040.86 2030 $107,779.02
1 of 4
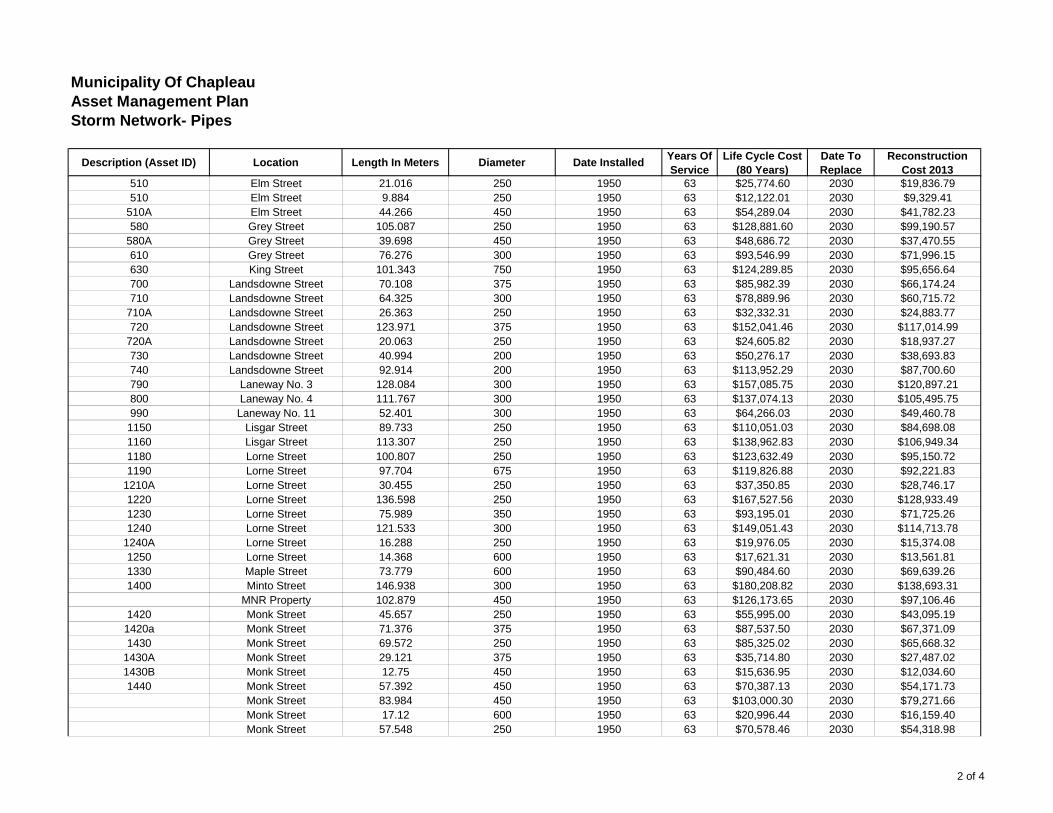
Municipality Of ChapleauAsset Management PlanStorm Network- Pipes
Description (Asset ID) Location Length In Meters Diameter Date Installed Years Of Service
Life Cycle Cost (80 Years)
Date To Replace
Reconstruction Cost 2013
510 Elm Street 21.016 250 1950 63 $25,774.60 2030 $19,836.79510 Elm Street 9.884 250 1950 63 $12,122.01 2030 $9,329.41
510A Elm Street 44.266 450 1950 63 $54,289.04 2030 $41,782.23580 Grey Street 105.087 250 1950 63 $128,881.60 2030 $99,190.57
580A Grey Street 39.698 450 1950 63 $48,686.72 2030 $37,470.55610 Grey Street 76.276 300 1950 63 $93,546.99 2030 $71,996.15630 King Street 101.343 750 1950 63 $124,289.85 2030 $95,656.64700 Landsdowne Street 70.108 375 1950 63 $85,982.39 2030 $66,174.24710 Landsdowne Street 64.325 300 1950 63 $78,889.96 2030 $60,715.72
710A Landsdowne Street 26.363 250 1950 63 $32,332.31 2030 $24,883.77720 Landsdowne Street 123.971 375 1950 63 $152,041.46 2030 $117,014.99
720A Landsdowne Street 20.063 250 1950 63 $24,605.82 2030 $18,937.27730 Landsdowne Street 40.994 200 1950 63 $50,276.17 2030 $38,693.83740 Landsdowne Street 92.914 200 1950 63 $113,952.29 2030 $87,700.60790 Laneway No. 3 128.084 300 1950 63 $157,085.75 2030 $120,897.21800 Laneway No. 4 111.767 300 1950 63 $137,074.13 2030 $105,495.75990 Laneway No. 11 52.401 300 1950 63 $64,266.03 2030 $49,460.781150 Lisgar Street 89.733 250 1950 63 $110,051.03 2030 $84,698.081160 Lisgar Street 113.307 250 1950 63 $138,962.83 2030 $106,949.34
$ $1180 Lorne Street 100.807 250 1950 63 $123,632.49 2030 $95,150.721190 Lorne Street 97.704 675 1950 63 $119,826.88 2030 $92,221.83
1210A Lorne Street 30.455 250 1950 63 $37,350.85 2030 $28,746.171220 Lorne Street 136.598 250 1950 63 $167,527.56 2030 $128,933.491230 Lorne Street 75.989 350 1950 63 $93,195.01 2030 $71,725.261240 Lorne Street 121.533 300 1950 63 $149,051.43 2030 $114,713.78
1240A Lorne Street 16.288 250 1950 63 $19,976.05 2030 $15,374.081250 Lorne Street 14.368 600 1950 63 $17,621.31 2030 $13,561.811330 Maple Street 73.779 600 1950 63 $90,484.60 2030 $69,639.261400 Minto Street 146.938 300 1950 63 $180,208.82 2030 $138,693.31
MNR Property 102.879 450 1950 63 $126,173.65 2030 $97,106.461420 Monk Street 45.657 250 1950 63 $55,995.00 2030 $43,095.191420a Monk Street 71.376 375 1950 63 $87,537.50 2030 $67,371.091430 Monk Street 69.572 250 1950 63 $85,325.02 2030 $65,668.32
1430A Monk Street 29.121 375 1950 63 $35,714.80 2030 $27,487.021430B Monk Street 12.75 450 1950 63 $15,636.95 2030 $12,034.601440 Monk Street 57.392 450 1950 63 $70,387.13 2030 $54,171.73
Monk Street 83.984 450 1950 63 $103,000.30 2030 $79,271.66Monk Street 17.12 600 1950 63 $20,996.44 2030 $16,159.40Monk Street 57.548 250 1950 63 $70,578.46 2030 $54,318.98
2 of 4
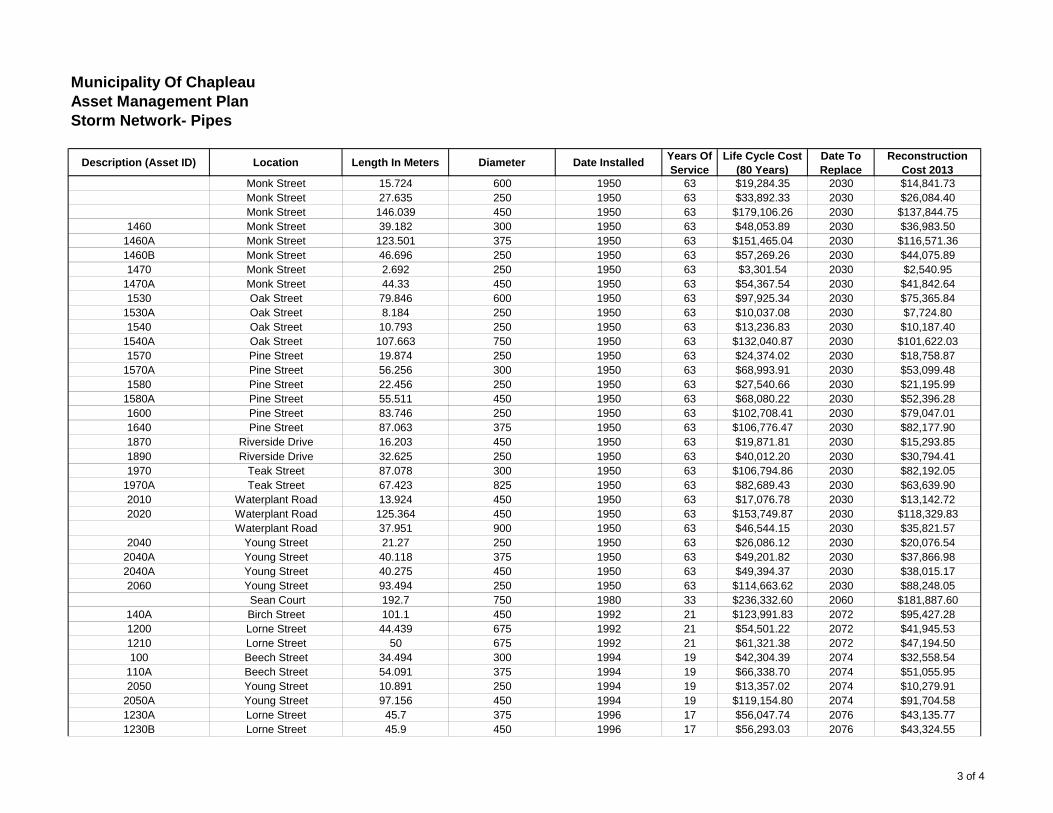
Municipality Of ChapleauAsset Management PlanStorm Network- Pipes
Description (Asset ID) Location Length In Meters Diameter Date Installed Years Of Service
Life Cycle Cost (80 Years)
Date To Replace
Reconstruction Cost 2013
Monk Street 15.724 600 1950 63 $19,284.35 2030 $14,841.73Monk Street 27.635 250 1950 63 $33,892.33 2030 $26,084.40Monk Street 146.039 450 1950 63 $179,106.26 2030 $137,844.75
1460 Monk Street 39.182 300 1950 63 $48,053.89 2030 $36,983.501460A Monk Street 123.501 375 1950 63 $151,465.04 2030 $116,571.361460B Monk Street 46.696 250 1950 63 $57,269.26 2030 $44,075.891470 Monk Street 2.692 250 1950 63 $3,301.54 2030 $2,540.95
1470A Monk Street 44.33 450 1950 63 $54,367.54 2030 $41,842.641530 Oak Street 79.846 600 1950 63 $97,925.34 2030 $75,365.84
1530A Oak Street 8.184 250 1950 63 $10,037.08 2030 $7,724.801540 Oak Street 10.793 250 1950 63 $13,236.83 2030 $10,187.40
1540A Oak Street 107.663 750 1950 63 $132,040.87 2030 $101,622.031570 Pine Street 19.874 250 1950 63 $24,374.02 2030 $18,758.87
1570A Pine Street 56.256 300 1950 63 $68,993.91 2030 $53,099.481580 Pine Street 22.456 250 1950 63 $27,540.66 2030 $21,195.99
1580A Pine Street 55.511 450 1950 63 $68,080.22 2030 $52,396.281600 Pine Street 83.746 250 1950 63 $102,708.41 2030 $79,047.011640 Pine Street 87.063 375 1950 63 $106,776.47 2030 $82,177.901870 Riverside Drive 16.203 450 1950 63 $19,871.81 2030 $15,293.85
$ $1890 Riverside Drive 32.625 250 1950 63 $40,012.20 2030 $30,794.411970 Teak Street 87.078 300 1950 63 $106,794.86 2030 $82,192.05
1970A Teak Street 67.423 825 1950 63 $82,689.43 2030 $63,639.902010 Waterplant Road 13.924 450 1950 63 $17,076.78 2030 $13,142.722020 Waterplant Road 125.364 450 1950 63 $153,749.87 2030 $118,329.83
Waterplant Road 37.951 900 1950 63 $46,544.15 2030 $35,821.572040 Young Street 21.27 250 1950 63 $26,086.12 2030 $20,076.54
2040A Young Street 40.118 375 1950 63 $49,201.82 2030 $37,866.982040A Young Street 40.275 450 1950 63 $49,394.37 2030 $38,015.172060 Young Street 93.494 250 1950 63 $114,663.62 2030 $88,248.05
Sean Court 192.7 750 1980 33 $236,332.60 2060 $181,887.60140A Birch Street 101.1 450 1992 21 $123,991.83 2072 $95,427.281200 Lorne Street 44.439 675 1992 21 $54,501.22 2072 $41,945.531210 Lorne Street 50 675 1992 21 $61,321.38 2072 $47,194.50100 Beech Street 34.494 300 1994 19 $42,304.39 2074 $32,558.54
110A Beech Street 54.091 375 1994 19 $66,338.70 2074 $51,055.952050 Young Street 10.891 250 1994 19 $13,357.02 2074 $10,279.91
2050A Young Street 97.156 450 1994 19 $119,154.80 2074 $91,704.581230A Lorne Street 45.7 375 1996 17 $56,047.74 2076 $43,135.771230B Lorne Street 45.9 450 1996 17 $56,293.03 2076 $43,324.55
3 of 4
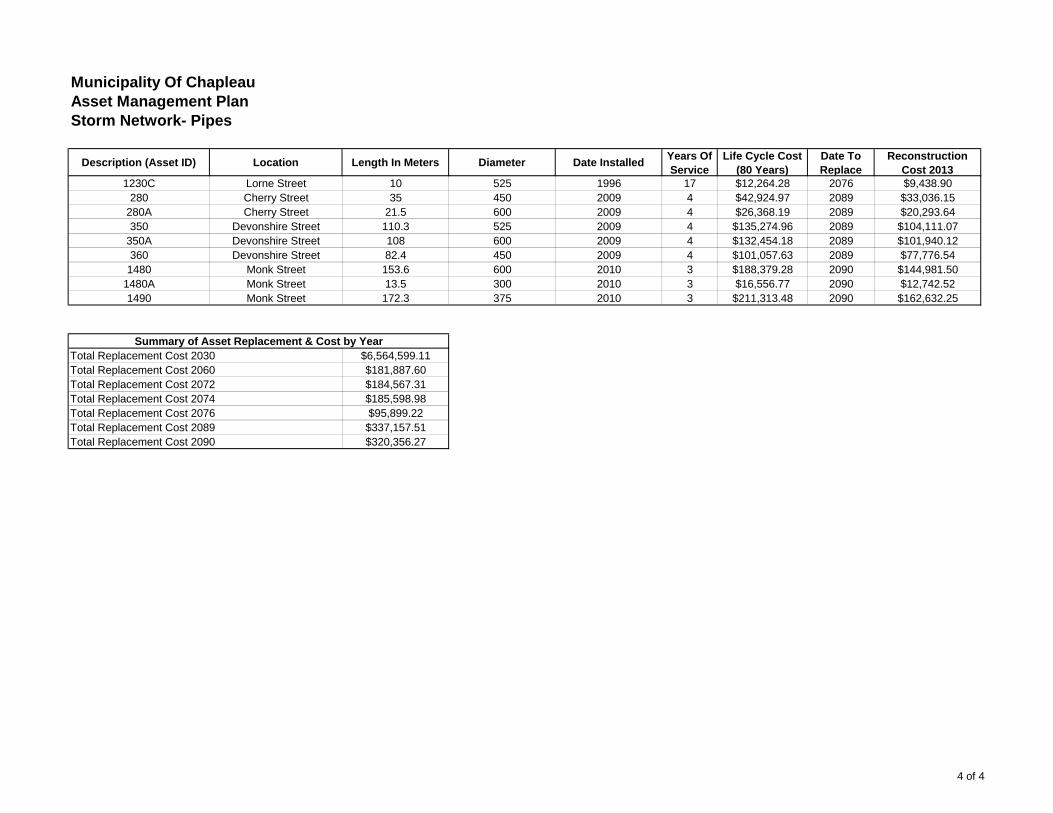
Municipality Of ChapleauAsset Management PlanStorm Network- Pipes
Description (Asset ID) Location Length In Meters Diameter Date Installed Years Of Service
Life Cycle Cost (80 Years)
Date To Replace
Reconstruction Cost 2013
1230C Lorne Street 10 525 1996 17 $12,264.28 2076 $9,438.90280 Cherry Street 35 450 2009 4 $42,924.97 2089 $33,036.15
280A Cherry Street 21.5 600 2009 4 $26,368.19 2089 $20,293.64350 Devonshire Street 110.3 525 2009 4 $135,274.96 2089 $104,111.07
350A Devonshire Street 108 600 2009 4 $132,454.18 2089 $101,940.12360 Devonshire Street 82.4 450 2009 4 $101,057.63 2089 $77,776.541480 Monk Street 153.6 600 2010 3 $188,379.28 2090 $144,981.50
1480A Monk Street 13.5 300 2010 3 $16,556.77 2090 $12,742.521490 Monk Street 172.3 375 2010 3 $211,313.48 2090 $162,632.25
Total Replacement Cost 2030 $6,564,599.11Total Replacement Cost 2060 $181,887.60Total Replacement Cost 2072 $184,567.31Total Replacement Cost 2074 $185,598.98Total Replacement Cost 2076 $95,899.22Total Replacement Cost 2089 $337,157.51Total Replacement Cost 2090 $320,356.27
Summary of Asset Replacement & Cost by Year
4 of 4

Asset Management PlanningAsset Management Planning for the Township of Chapleau
Appendix DAppendix DInfrastructure ProfileBridges and Structures
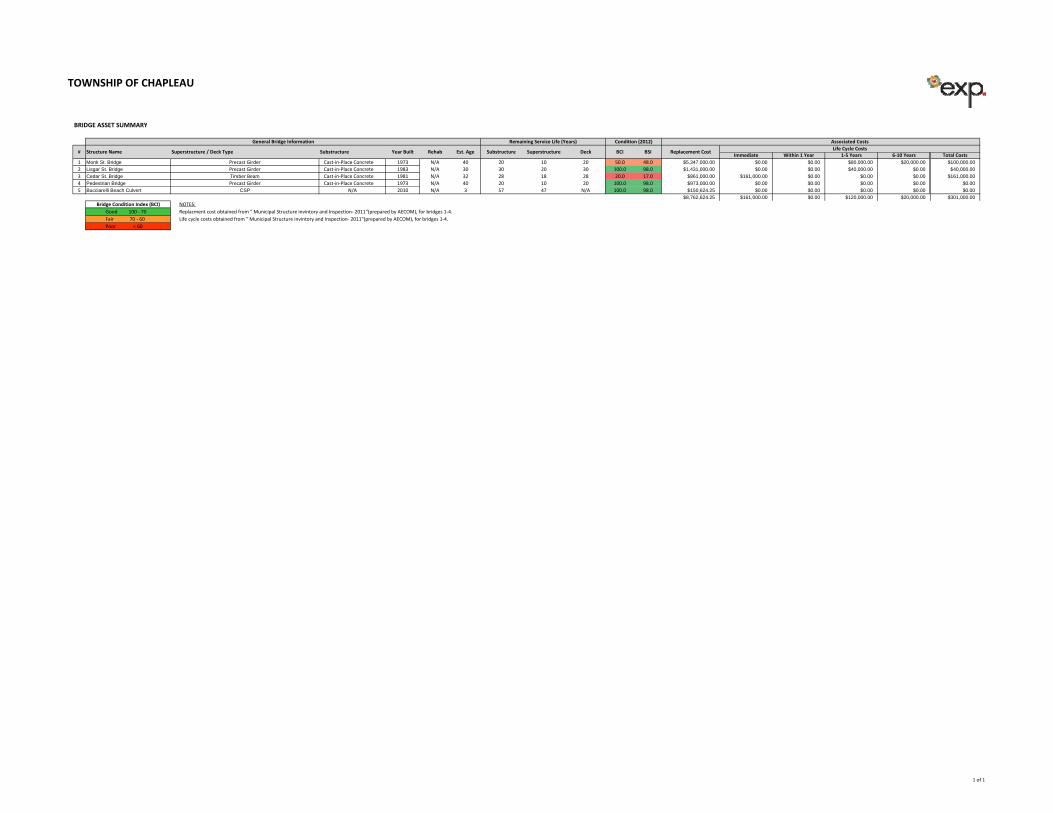
TOWNSHIP OF CHAPLEAU
BRIDGE ASSET SUMMARY
Immediate Within 1 Year 1‐5 Years 6‐10 Years Total Costs1 Monk St. Bridge Precast Girder Cast‐in‐Place Concrete 1973 N/A 40 20 10 20 50.0 48.0 $5,347,000.00 $0.00 $0.00 $80,000.00 $20,000.00 $100,000.002 Lisgar St. Bridge Precast Girder Cast‐in‐Place Concrete 1983 N/A 30 30 20 30 100.0 98.0 $1,431,000.00 $0.00 $0.00 $40,000.00 $0.00 $40,000.003 Cedar St. Bridge Timber Beam Cast‐in‐Place Concrete 1981 N/A 32 28 18 28 20.0 17.0 $861,000.00 $161,000.00 $0.00 $0.00 $0.00 $161,000.004 Pedestrian Bridge Precast Girder Cast‐in‐Place Concrete 1973 N/A 40 20 10 20 100.0 98.0 $973,000.00 $0.00 $0.00 $0.00 $0.00 $0.005 Bucciarelli Beach Culvert CSP N/A 2010 N/A 3 57 47 N/A 100.0 98.0 $150,624.25 $0.00 $0.00 $0.00 $0.00 $0.00
$8,762,624.25 $161,000.00 $0.00 $120,000.00 $20,000.00 $301,000.00Bridge Condition Index (BCI) NOTES:
Good 100 ‐ 70 Replacment cost obtained from " Municipal Structure invintory and Inspection‐ 2011"(prepared by AECOM), for bridges 1‐4.Fair 70 ‐ 60 Life cycle costs obtained from " Municipal Structure invintory and Inspection‐ 2011"(prepared by AECOM), for bridges 1‐4.Poor < 60
General Bridge Information Remaining Service Life (Years) Condition (2012) Associated Costs
# Structure Name Superstructure / Deck Type Year Built Life Cycle CostsSubstructure DeckRehabSubstructure Superstructure Replacement CostEst. Age BCI BSI
1 of 1

Asset Management PlanningAsset Management Planning for the Township of Chapleau
Appendix EAppendix EInfrastructure ProfileBuildings and Facilities
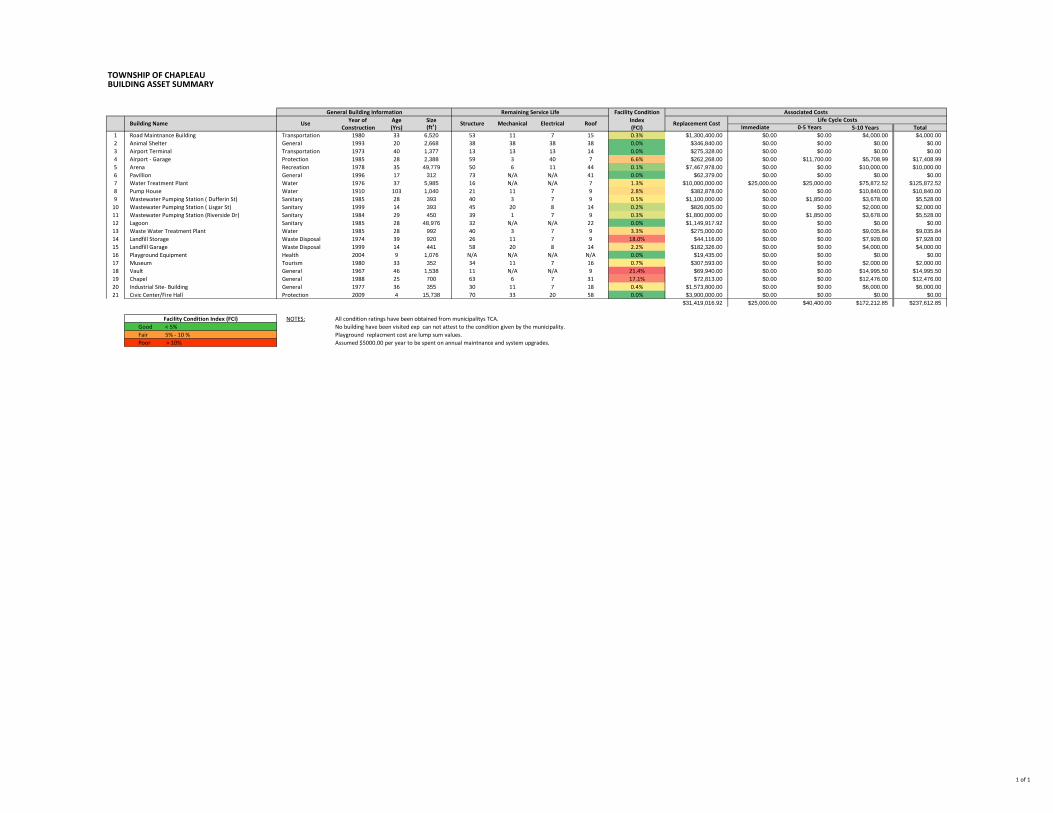
TOWNSHIP OF CHAPLEAUBUILDING ASSET SUMMARY
Facility ConditionYear of Age Size Index
Construction (Yrs) (ft2) (FCI) Immediate 0‐5 Years 5‐10 Years Total1 Road Maintnance Building Transportation 1980 33 6,520 53 11 7 15 0.3% $1,300,400.00 $0.00 $0.00 $4,000.00 $4,000.002 Animal Shelter General 1993 20 2,668 38 38 38 38 0.0% $346,840.00 $0.00 $0.00 $0.00 $0.003 Airport Terminal Transportation 1973 40 1,377 13 13 13 14 0.0% $275,328.00 $0.00 $0.00 $0.00 $0.004 Airport ‐ Garage Protection 1985 28 2,388 59 3 40 7 6.6% $262,268.00 $0.00 $11,700.00 $5,708.99 $17,408.995 Arena Recreation 1978 35 49,779 50 6 11 44 0.1% $7,467,978.00 $0.00 $0.00 $10,000.00 $10,000.006 Pavillion General 1996 17 312 73 N/A N/A 41 0.0% $62,379.00 $0.00 $0.00 $0.00 $0.007 Water Treatment Plant Water 1976 37 5,985 16 N/A N/A 7 1.3% $10,000,000.00 $25,000.00 $25,000.00 $75,872.52 $125,872.528 Pump House Water 1910 103 1,040 21 11 7 9 2.8% $382,878.00 $0.00 $0.00 $10,840.00 $10,840.009 Wastewater Pumping Station ( Dufferin St) Sanitary 1985 28 393 40 3 7 9 0.5% $1,100,000.00 $0.00 $1,850.00 $3,678.00 $5,528.0010 Wastewater Pumping Station ( Lisgar St) Sanitary 1999 14 393 45 20 8 14 0.2% $826,005.00 $0.00 $0.00 $2,000.00 $2,000.0011 Wastewater Pumping Station (Riverside Dr) Sanitary 1984 29 450 39 1 7 9 0.3% $1,800,000.00 $0.00 $1,850.00 $3,678.00 $5,528.0012 Lagoon Sanitary 1985 28 48,976 32 N/A N/A 22 0.0% $1,149,917.92 $0.00 $0.00 $0.00 $0.0013 Waste Water Treatment Plant Water 1985 28 992 40 3 7 9 3.3% $275,000.00 $0.00 $0.00 $9,035.84 $9,035.8414 Landfill Storage Waste Disposal 1974 39 920 26 11 7 9 18.0% $44,116.00 $0.00 $0.00 $7,928.00 $7,928.0015 Landfill Garage Waste Disposal 1999 14 441 58 20 8 14 2.2% $182,326.00 $0.00 $0.00 $4,000.00 $4,000.0016 Playground Equipment Health 2004 9 1,076 N/A N/A N/A N/A 0.0% $19,435.00 $0.00 $0.00 $0.00 $0.0017 Museum Tourism 1980 33 352 34 11 7 16 0.7% $307,593.00 $0.00 $0.00 $2,000.00 $2,000.0018 Vault General 1967 46 1,538 11 N/A N/A 9 21.4% $69,940.00 $0.00 $0.00 $14,995.50 $14,995.5019 Chapel General 1988 25 700 63 6 7 31 17.1% $72,813.00 $0.00 $0.00 $12,476.00 $12,476.0020 Industrial Site‐ Building General 1977 36 355 30 11 7 18 0.4% $1,573,800.00 $0.00 $0.00 $6,000.00 $6,000.0021 Civic Center/Fire Hall Protection 2009 4 15,738 70 33 20 58 0.0% $3,900,000.00 $0.00 $0.00 $0.00 $0.00
$31,419,016.92 $25,000.00 $40,400.00 $172,212.85 $237,612.85
Facility Condition Index (FCI) NOTES: All condition ratings have been obtained from municipalitys TCA.Good < 5% No building have been visited exp can not attest to the condition given by the municipality. Fair 5% ‐ 10 % Playground replacment cost are lump sum values.Poor > 10% Assumed $5000.00 per year to be spent on annual maintnance and system upgrades.
Life Cycle CostsReplacement Cost
Associated Costs
Building Name
Remaining Service Life
Structure RoofMechanical ElectricalUse
General Building Information
1 of 1

Asset Management PlanningAsset Management Planning for the Township of Chapleau
Appendix FAppendix FInfrastructure ProfileVehicles
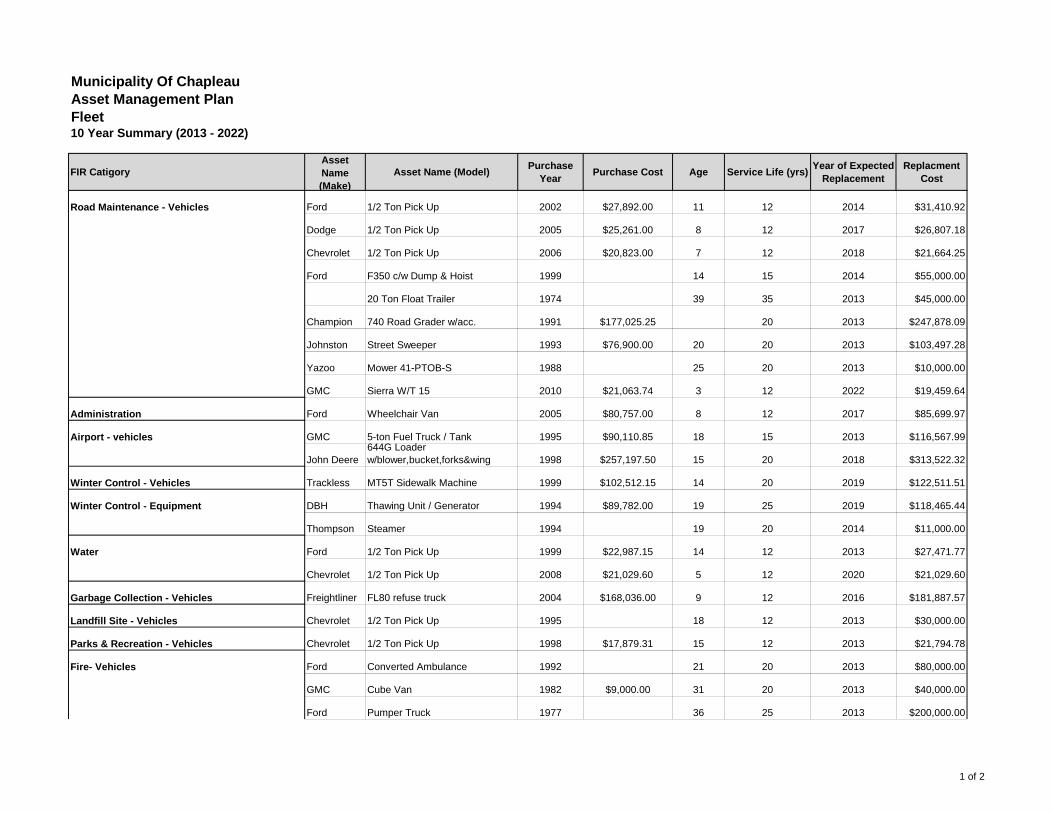
Municipality Of ChapleauAsset Management PlanFleet10 Year Summary (2013 - 2022)
FIR CatigoryAsset Name (Make)
Asset Name (Model) Purchase Year Purchase Cost Age Service Life (yrs) Year of Expected
ReplacementReplacment
Cost
Road Maintenance - Vehicles Ford 1/2 Ton Pick Up 2002 $27,892.00 11 12 2014 $31,410.92
Dodge 1/2 Ton Pick Up 2005 $25,261.00 8 12 2017 $26,807.18
Chevrolet 1/2 Ton Pick Up 2006 $20,823.00 7 12 2018 $21,664.25
Ford F350 c/w Dump & Hoist 1999 14 15 2014 $55,000.00
20 Ton Float Trailer 1974 39 35 2013 $45,000.00
Champion 740 Road Grader w/acc. 1991 $177,025.25 20 2013 $247,878.09
Johnston Street Sweeper 1993 $76,900.00 20 20 2013 $103,497.28
Yazoo Mower 41-PTOB-S 1988 25 20 2013 $10,000.00
GMC Sierra W/T 15 2010 $21,063.74 3 12 2022 $19,459.64
Administration Ford Wheelchair Van 2005 $80,757.00 8 12 2017 $85,699.97
Airport - vehicles GMC 5-ton Fuel Truck / Tank 1995 $90,110.85 18 15 2013 $116,567.99644G Loader
John Deere w/blower,bucket,forks&wing 1998 $257,197.50 15 20 2018 $313,522.32
Winter Control - Vehicles Trackless MT5T Sidewalk Machine 1999 $102,512.15 14 20 2019 $122,511.51
Winter Control - Equipment DBH Thawing Unit / Generator 1994 $89,782.00 19 25 2019 $118,465.44
Thompson Steamer 1994 19 20 2014 $11,000.00
Water Ford 1/2 Ton Pick Up 1999 $22,987.15 14 12 2013 $27,471.77
Chevrolet 1/2 Ton Pick Up 2008 $21,029.60 5 12 2020 $21,029.60
Garbage Collection - Vehicles Freightliner FL80 refuse truck 2004 $168,036.00 9 12 2016 $181,887.57
Landfill Site - Vehicles Chevrolet 1/2 Ton Pick Up 1995 18 12 2013 $30,000.00
Parks & Recreation - Vehicles Chevrolet 1/2 Ton Pick Up 1998 $17,879.31 15 12 2013 $21,794.78
Fire- Vehicles Ford Converted Ambulance 1992 21 20 2013 $80,000.00
GMC Cube Van 1982 $9,000.00 31 20 2013 $40,000.00
Ford Pumper Truck 1977 36 25 2013 $200,000.00
1 of 2
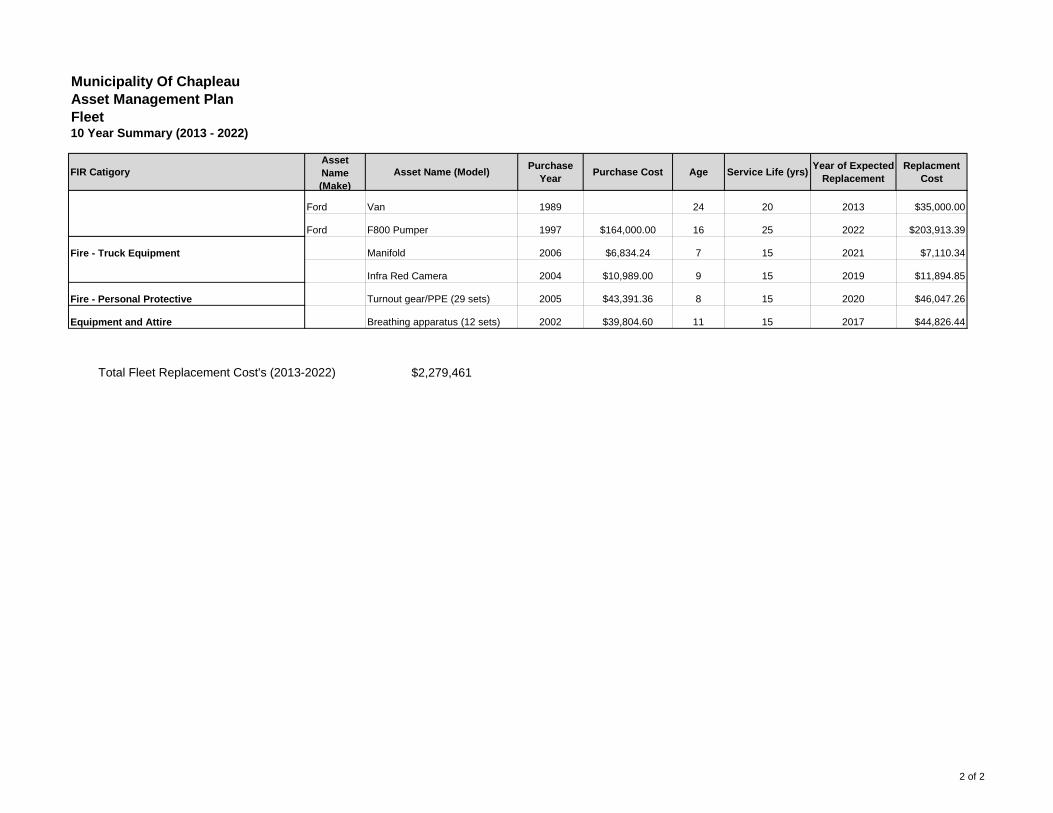
Municipality Of ChapleauAsset Management PlanFleet10 Year Summary (2013 - 2022)
FIR CatigoryAsset Name (Make)
Asset Name (Model) Purchase Year Purchase Cost Age Service Life (yrs) Year of Expected
ReplacementReplacment
Cost
Ford Van 1989 24 20 2013 $35,000.00
Ford F800 Pumper 1997 $164,000.00 16 25 2022 $203,913.39
Fire - Truck Equipment Manifold 2006 $6,834.24 7 15 2021 $7,110.34
Infra Red Camera 2004 $10,989.00 9 15 2019 $11,894.85
Fire - Personal Protective Turnout gear/PPE (29 sets) 2005 $43,391.36 8 15 2020 $46,047.26
Equipment and Attire Breathing apparatus (12 sets) 2002 $39,804.60 11 15 2017 $44,826.44
$2,279,461Total Fleet Replacement Cost's (2013-2022)
2 of 2

Asset Management PlanningAsset Management Planning for the Township of Chapleau
Appendix GAppendix GLife Cycle Profiles for Linear Infrastructure
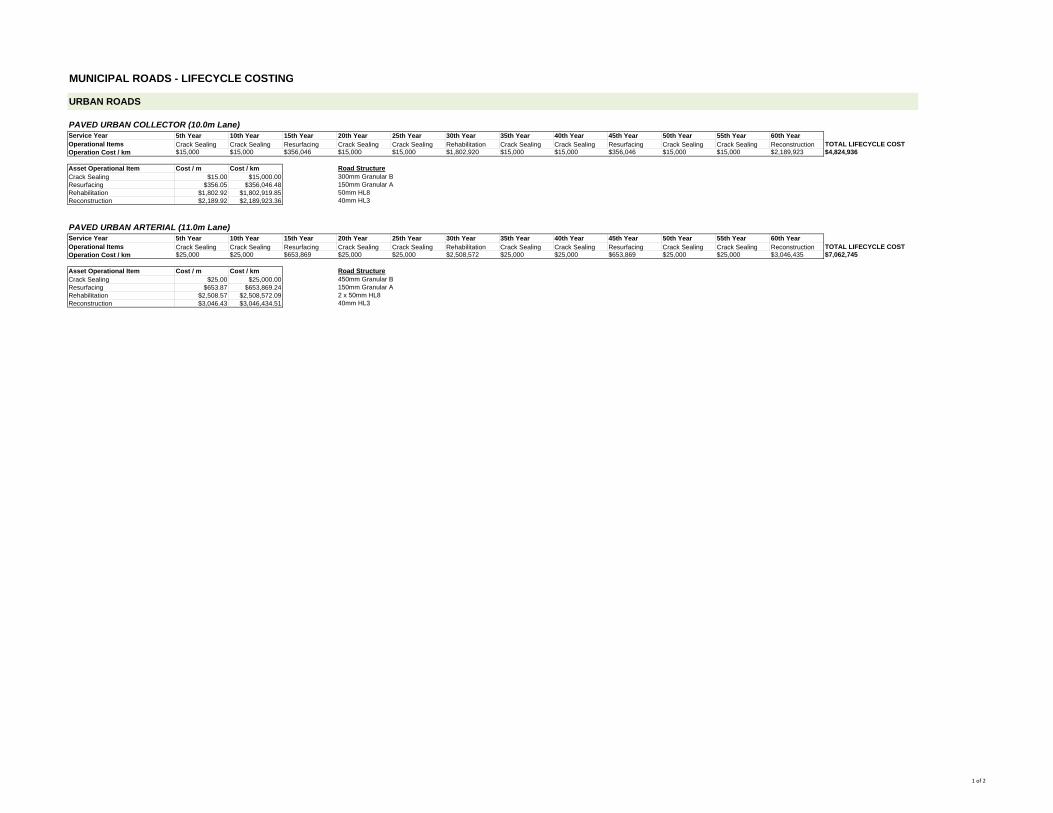
MUNICIPAL ROADS - LIFECYCLE COSTING
PAVED URBAN COLLECTOR (10.0m Lane)Service Year 5th Year 10th Year 15th Year 20th Year 25th Year 30th Year 35th Year 40th Year 45th Year 50th Year 55th Year 60th YearOperational Items Crack Sealing Crack Sealing Resurfacing Crack Sealing Crack Sealing Rehabilitation Crack Sealing Crack Sealing Resurfacing Crack Sealing Crack Sealing Reconstruction TOTAL LIFECYCLE COSTOperation Cost / km $15,000 $15,000 $356,046 $15,000 $15,000 $1,802,920 $15,000 $15,000 $356,046 $15,000 $15,000 $2,189,923 $4,824,936
Asset Operational Item Cost / m Cost / kmCrack Sealing $15.00 $15,000.00Resurfacing $356.05 $356,046.48Rehabilitation $1,802.92 $1,802,919.85Reconstruction $2,189.92 $2,189,923.36
PAVED URBAN ARTERIAL (11.0m Lane)Service Year 5th Year 10th Year 15th Year 20th Year 25th Year 30th Year 35th Year 40th Year 45th Year 50th Year 55th Year 60th YearOperational Items Crack Sealing Crack Sealing Resurfacing Crack Sealing Crack Sealing Rehabilitation Crack Sealing Crack Sealing Resurfacing Crack Sealing Crack Sealing Reconstruction TOTAL LIFECYCLE COSTOperation Cost / km $25,000 $25,000 $653,869 $25,000 $25,000 $2,508,572 $25,000 $25,000 $653,869 $25,000 $25,000 $3,046,435 $7,062,745
Asset Operational Item Cost / m Cost / kmCrack Sealing $25.00 $25,000.00Resurfacing $653.87 $653,869.24Rehabilitation $2,508.57 $2,508,572.09Reconstruction $3,046.43 $3,046,434.51
Road Structure450mm Granular B150mm Granular A2 x 50mm HL840mm HL3
40mm HL3
URBAN ROADS
Road Structure300mm Granular B150mm Granular A50mm HL8
1 of 2
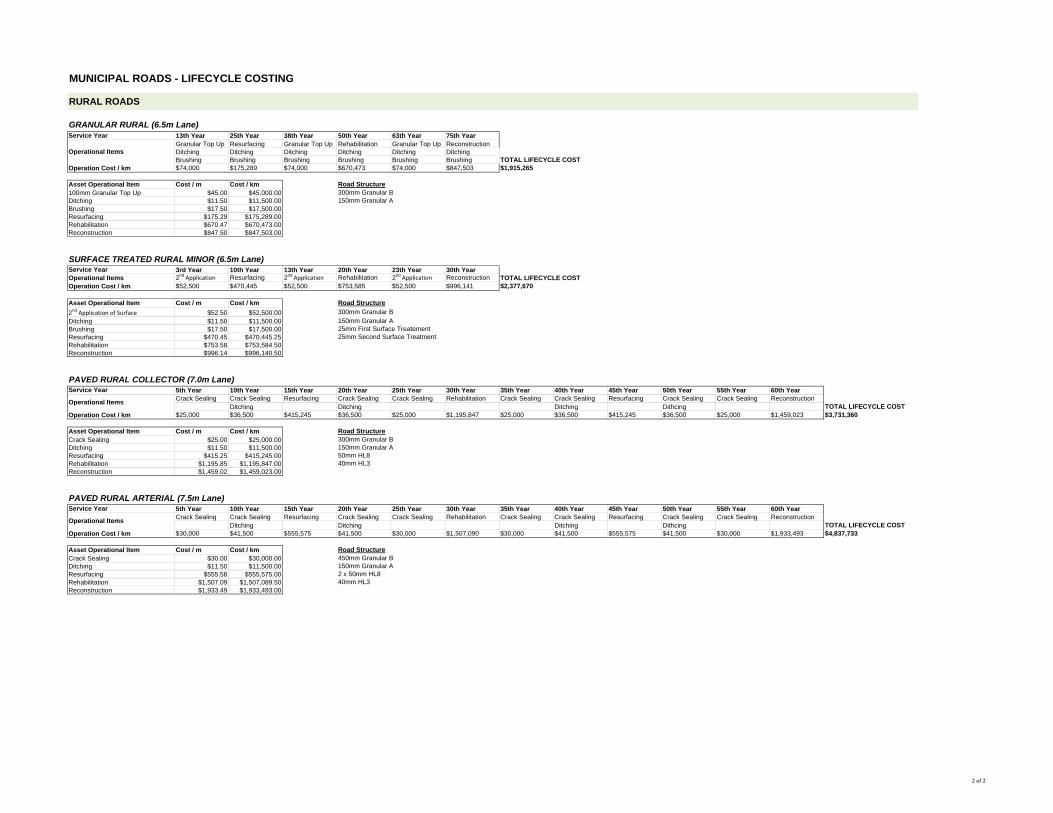
MUNICIPAL ROADS - LIFECYCLE COSTING
GRANULAR RURAL (6.5m Lane)Service Year 13th Year 25th Year 38th Year 50th Year 63th Year 75th Year
Granular Top Up Resurfacing Granular Top Up Rehabilitation Granular Top Up ReconstructionDitching Ditching Ditching Ditching Ditching DitchingBrushing Brushing Brushing Brushing Brushing Brushing TOTAL LIFECYCLE COST
Operation Cost / km $74,000 $175,289 $74,000 $670,473 $74,000 $847,503 $1,915,265
Asset Operational Item Cost / m Cost / km100mm Granular Top Up $45.00 $45,000.00Ditching $11.50 $11,500.00Brushing $17.50 $17,500.00Resurfacing $175.29 $175,289.00Rehabilitation $670.47 $670,473.00Reconstruction $847.50 $847,503.00
SURFACE TREATED RURAL MINOR (6.5m Lane)Service Year 3rd Year 10th Year 13th Year 20th Year 23th Year 30th YearOperational Items 2nd Application Resurfacing 2nd Application Rehabilitation 2nd Application Reconstruction TOTAL LIFECYCLE COSTOperation Cost / km $52,500 $470,445 $52,500 $753,585 $52,500 $996,141 $2,377,670
Asset Operational Item Cost / m Cost / km2nd Application of Surface $52.50 $52,500.00Ditching $11.50 $11,500.00Brushing $17.50 $17,500.00Resurfacing $470.45 $470,445.25Rehabilitation $753.58 $753,584.50Reconstruction $996.14 $996,140.50
PAVED RURAL COLLECTOR (7.0m Lane)Service Year 5th Year 10th Year 15th Year 20th Year 25th Year 30th Year 35th Year 40th Year 45th Year 50th Year 55th Year 60th Year
Crack Sealing Crack Sealing Resurfacing Crack Sealing Crack Sealing Rehabilitation Crack Sealing Crack Sealing Resurfacing Crack Sealing Crack Sealing ReconstructionDitching Ditching Ditching Dithcing TOTAL LIFECYCLE COST
Operation Cost / km $25,000 $36,500 $415,245 $36,500 $25,000 $1,195,847 $25,000 $36,500 $415,245 $36,500 $25,000 $1,459,023 $3,731,360
Asset Operational Item Cost / m Cost / kmCrack Sealing $25.00 $25,000.00Ditching $11.50 $11,500.00Resurfacing $415.25 $415,245.00Rehabilitation $1,195.85 $1,195,847.00Reconstruction $1,459.02 $1,459,023.00
PAVED RURAL ARTERIAL (7.5m Lane)Service Year 5th Year 10th Year 15th Year 20th Year 25th Year 30th Year 35th Year 40th Year 45th Year 50th Year 55th Year 60th Year
Crack Sealing Crack Sealing Resurfacing Crack Sealing Crack Sealing Rehabilitation Crack Sealing Crack Sealing Resurfacing Crack Sealing Crack Sealing ReconstructionDitching Ditching Ditching Dithcing TOTAL LIFECYCLE COST
Operation Cost / km $30,000 $41,500 $555,575 $41,500 $30,000 $1,507,090 $30,000 $41,500 $555,575 $41,500 $30,000 $1,933,493 $4,837,733
Asset Operational Item Cost / m Cost / kmCrack Sealing $30.00 $30,000.00Ditching $11.50 $11,500.00Resurfacing $555.58 $555,575.00Rehabilitation $1,507.09 $1,507,089.50Reconstruction $1,933.49 $1,933,493.00
150mm Granular A2 x 50mm HL840mm HL3
150mm Granular A50mm HL840mm HL3
Operational Items
Road Structure450mm Granular B
150mm Granular A25mm First Surface Treatement25mm Second Surface Treatment
Operational Items
Road Structure300mm Granular B
300mm Granular B
RURAL ROADS
Operational Items
Road Structure300mm Granular B150mm Granular A
Road Structure
2 of 2

STORM SEWER LIFECYCLE COSTING
URBAN COLLECTION SEWER (300 - 900mmø)Service Year 20th Year 35th Year 50th Year 65th Year 80th Year
Operational Items Cleaning/Flushing
Camera Inspections Cleaning/Flushing Structure Inspections
60% Appurtenance Replacement
Camera Inspections Cleaning/Flushing Structure Inspections
Complete Replacement
TOTAL LIFECYCLE COSTOperation Cost / k $35,000 $56,000 $135,538 $56,000 $943,890 $1,226,428
Asset Operational Cost / m Cost / km NotesCamera Inspection $15.00 $15,000.00Structure Inspection $6.00 $6,000.00Cleaning / Flushing $35.00 $35,000.00Appurtenance Replac $225.90 $225,896.00Complete Replaceme $943.89 $943,890.00
URBAN TRUNK SEWER (900 - 1500mmø)Service Year 20th Year 35th Year 50th Year 65th Year 80th Year
Operational Items Cleaning/Flushing
Camera Inspections Structure Inspections Cleaning/Flushing
60% Appurtenance Replacement
Camera Inspections Structure Inspections Cleaning/Flushing
Complete Replacement
TOTAL LIFECYCLE COSTOperation Cost / k $35,000 $56,000 $189,536 $56,000 $1,562,685 $1,899,221
Asset Operational Cost / m Cost / km NotesCamera Inspection $15.00 $15,000.00Structure Inspection $6.00 $6,000.00Cleaning / Flushing $35.00 $35,000.00Appurtenance Replac $315.89 $315,894.00Complete Replaceme $1,562.69 $1,562,685.00
URBAN LARGE TRUNK SEWER (1500mmø - 3.0 x 3.0m Box Culvert)Service Year 20th Year 35th Year 50th Year 65th Year 80th Year
Operational Items Cleaning/Flushing
Camera Inspections Structure Inspections Cleaning/Flushing
60% Appurtenance Replacement
Camera Inspections Structure Inspections Cleaning/Flushing
Complete Replacement
TOTAL LIFECYCLE COSTOperation Cost / k $35,000 $56,000 $362,071 $56,000 $3,759,880 $4,268,951
Asset Operational Cost / m Cost / km NotesCamera Inspection $15.00 $15,000.00Structure Inspection $6.00 $6,000.00Cleaning / Flushing $35.00 $35,000.00Appurtenance Replac $603.45 $603,452.00Complete Replaceme $3,759.88 $3,759,880.00
RURAL STORM SEWER
RURAL COLLECTION SEWER (300 - 900mmø)Service Year 20th Year 35th Year 50th Year 65th Year 80th Year
Operational Items Cleaning/Flushing
Camera Inspections Structure Inspections Cleaning/Flushing
60% Appurtenance Replacement
Camera Inspections Structure Inspections Cleaning/Flushing
Complete Replacement
TOTAL LIFECYCLE COSTOperation Cost / k $35,000 $56,000 $154,796 $56,000 $903,185 $1,204,981
Asset Operational Cost / m Cost / km NotesCamera Inspection $15.00 $15,000.00Structure Inspection $6.00 $6,000.00Cleaning / Flushing $35.00 $35,000.00Appurtenance Replac $257.99 $257,994.00Complete Replaceme $903.19 $903,185.00
RURAL TRUNK SEWER (900 - 1500mmø)Service Year 20th Year 35th Year 50th Year 65th Year 80th Year
Operational Items Cleaning/Flushing
Camera Inspections Structure Inspections Cleaning/Flushing
60% Appurtenance Replacement
Camera Inspections Structure Inspections Cleaning/Flushing
Complete Replacement
TOTAL LIFECYCLE COSTOperation Cost / k $35,000 $56,000 $209,131 $56,000 $1,581,480 $1,937,611
Asset Operational Cost / m Cost / km NotesCamera Inspection $15.00 $15,000.00Structure Inspection $6.00 $6,000.00Cleaning / Flushing $35.00 $35,000.00Appurtenance Replac $348.55 $348,552.00Complete Replaceme $1,581.48 $1,581,480.00
URBAN STORM SEWER
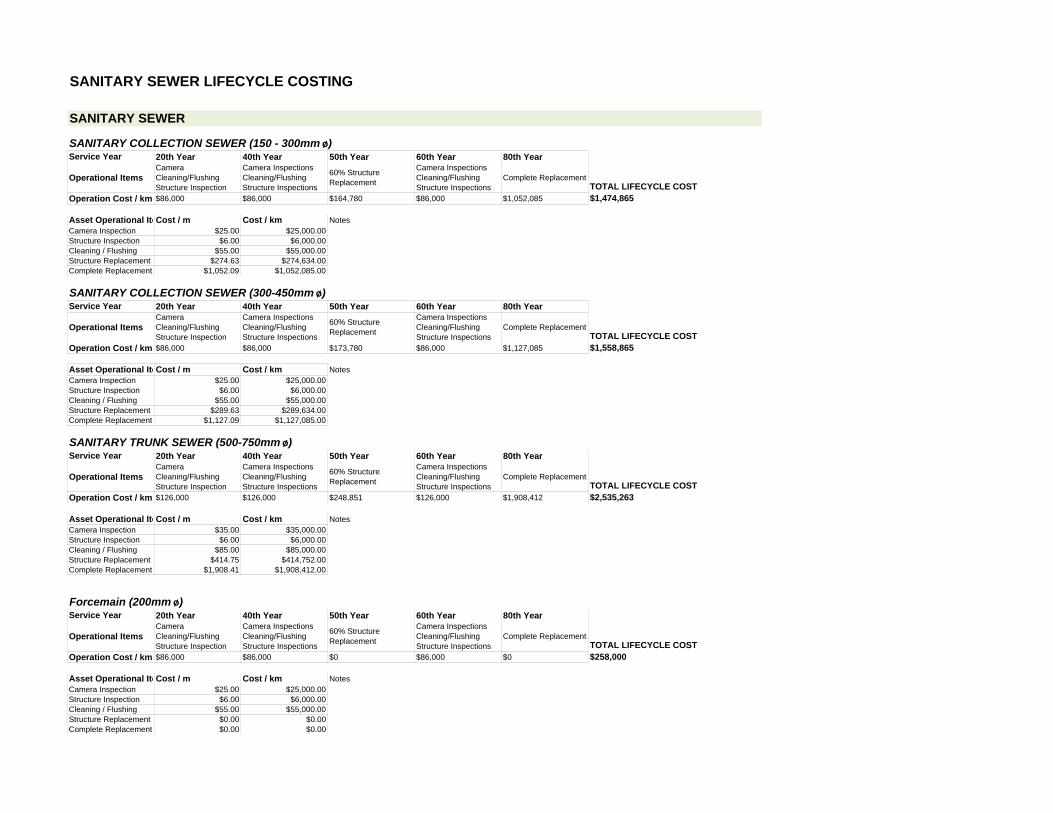
SANITARY SEWER LIFECYCLE COSTING
SANITARY COLLECTION SEWER (150 - 300mm ø)Service Year 20th Year 40th Year 50th Year 60th Year 80th Year
Operational ItemsCamera Cleaning/Flushing Structure Inspection
Camera Inspections Cleaning/Flushing Structure Inspections
60% Structure Replacement
Camera Inspections Cleaning/Flushing Structure Inspections
Complete ReplacementTOTAL LIFECYCLE COST
Operation Cost / km $86,000 $86,000 $164,780 $86,000 $1,052,085 $1,474,865
Asset Operational IteCost / m Cost / km NotesCamera Inspection $25.00 $25,000.00Structure Inspection $6.00 $6,000.00Cleaning / Flushing $55.00 $55,000.00Structure Replacement $274.63 $274,634.00Complete Replacement $1,052.09 $1,052,085.00
SANITARY COLLECTION SEWER (300-450mm ø)Service Year 20th Year 40th Year 50th Year 60th Year 80th Year
Operational ItemsCamera Cleaning/Flushing Structure Inspection
Camera Inspections Cleaning/Flushing Structure Inspections
60% Structure Replacement
Camera Inspections Cleaning/Flushing Structure Inspections
Complete ReplacementTOTAL LIFECYCLE COST
Operation Cost / km $86,000 $86,000 $173,780 $86,000 $1,127,085 $1,558,865
Asset Operational IteCost / m Cost / km NotesCamera Inspection $25.00 $25,000.00Structure Inspection $6.00 $6,000.00Cleaning / Flushing $55.00 $55,000.00Structure Replacement $289.63 $289,634.00Complete Replacement $1,127.09 $1,127,085.00
SANITARY TRUNK SEWER (500-750mm ø)Service Year 20th Year 40th Year 50th Year 60th Year 80th Year
Operational ItemsCamera Cleaning/Flushing Structure Inspection
Camera Inspections Cleaning/Flushing Structure Inspections
60% Structure Replacement
Camera Inspections Cleaning/Flushing Structure Inspections
Complete ReplacementTOTAL LIFECYCLE COST
Operation Cost / km $126,000 $126,000 $248,851 $126,000 $1,908,412 $2,535,263
Asset Operational IteCost / m Cost / km NotesCamera Inspection $35.00 $35,000.00Structure Inspection $6.00 $6,000.00Cleaning / Flushing $85.00 $85,000.00Structure Replacement $414.75 $414,752.00Complete Replacement $1,908.41 $1,908,412.00
Forcemain (200mm ø)Service Year 20th Year 40th Year 50th Year 60th Year 80th Year
Operational ItemsCamera Cleaning/Flushing Structure Inspection
Camera Inspections Cleaning/Flushing Structure Inspections
60% Structure Replacement
Camera Inspections Cleaning/Flushing Structure Inspections
Complete ReplacementTOTAL LIFECYCLE COST
Operation Cost / km $86,000 $86,000 $0 $86,000 $0 $258,000
Asset Operational IteCost / m Cost / km NotesCamera Inspection $25.00 $25,000.00Structure Inspection $6.00 $6,000.00Cleaning / Flushing $55.00 $55,000.00Structure Replacement $0.00 $0.00Complete Replacement $0.00 $0.00
SANITARY SEWER
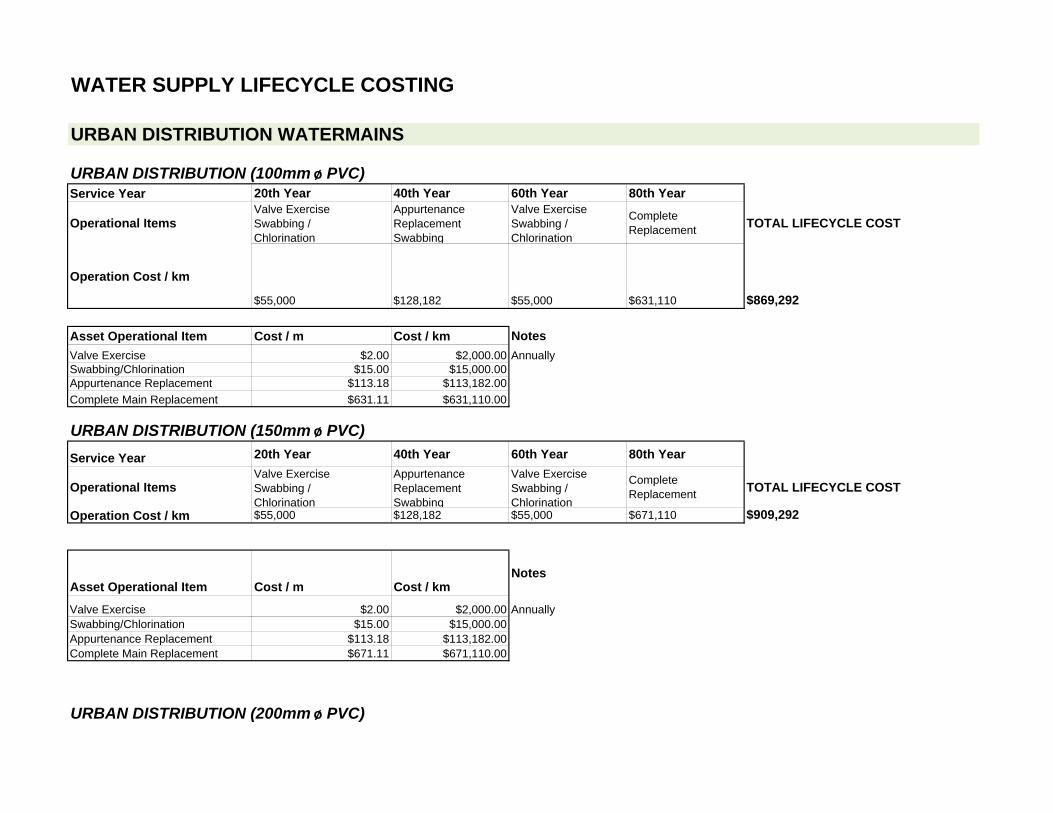
WATER SUPPLY LIFECYCLE COSTING
URBAN DISTRIBUTION (100mm ø PVC)Service Year 20th Year 40th Year 60th Year 80th Year
Operational ItemsValve Exercise Swabbing / Chlorination
Appurtenance Replacement Swabbing
Valve Exercise Swabbing / Chlorination
Complete Replacement TOTAL LIFECYCLE COST
Operation Cost / km
$55,000 $128,182 $55,000 $631,110 $869,292
Asset Operational Item Cost / m Cost / km NotesValve Exercise $2.00 $2,000.00 AnnuallySwabbing/Chlorination $15.00 $15,000.00Appurtenance Replacement $113.18 $113,182.00Complete Main Replacement $631.11 $631,110.00
URBAN DISTRIBUTION (150mm ø PVC)Service Year 20th Year 40th Year 60th Year 80th Year
Operational ItemsValve Exercise Swabbing / Chlorination
Appurtenance Replacement Swabbing
Valve Exercise Swabbing / Chlorination
Complete Replacement TOTAL LIFECYCLE COST
Operation Cost / km $55,000 $128,182 $55,000 $671,110 $909,292
Asset Operational Item Cost / m Cost / kmNotes
Valve Exercise $2.00 $2,000.00 AnnuallySwabbing/Chlorination $15.00 $15,000.00Appurtenance Replacement $113.18 $113,182.00Complete Main Replacement $671.11 $671,110.00
URBAN DISTRIBUTION (200mm ø PVC)
URBAN DISTRIBUTION WATERMAINS
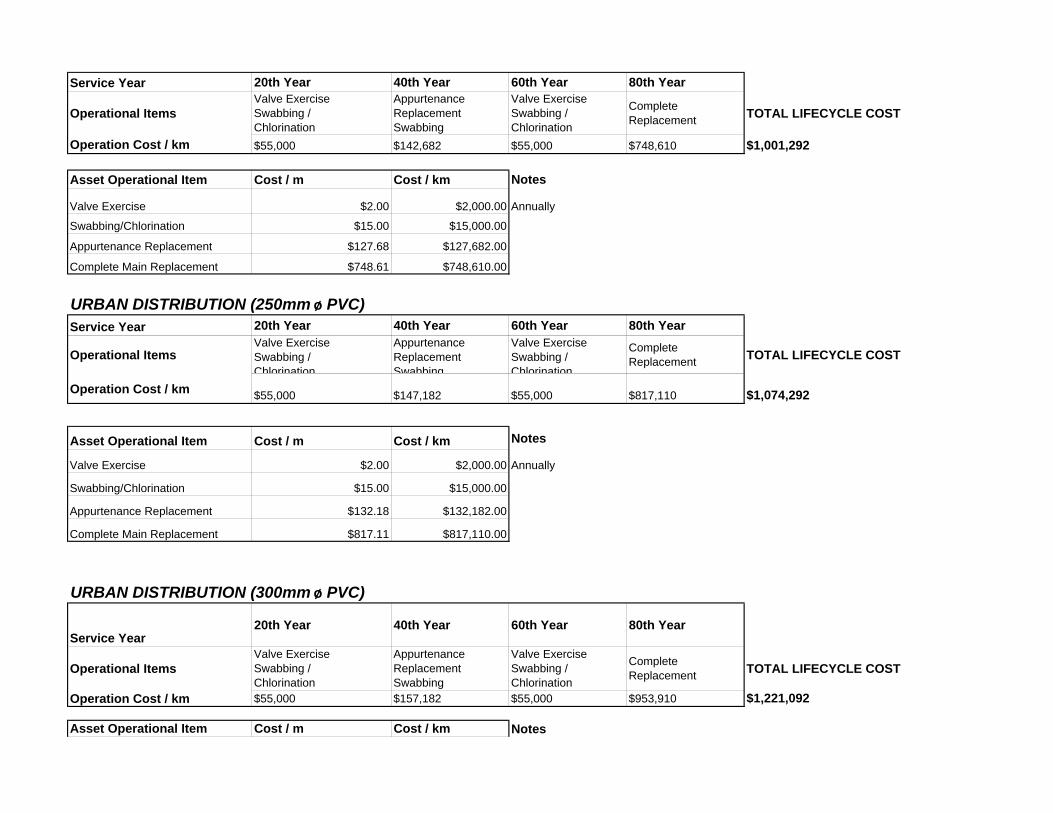
Service Year 20th Year 40th Year 60th Year 80th Year
Operational ItemsValve Exercise Swabbing / Chlorination
Appurtenance Replacement Swabbing
Valve Exercise Swabbing / Chlorination
Complete Replacement TOTAL LIFECYCLE COST
Operation Cost / km $55,000 $142,682 $55,000 $748,610 $1,001,292
Asset Operational Item Cost / m Cost / km Notes
Valve Exercise $2.00 $2,000.00 Annually
Swabbing/Chlorination $15.00 $15,000.00
Appurtenance Replacement $127.68 $127,682.00
Complete Main Replacement $748.61 $748,610.00
URBAN DISTRIBUTION (250mm ø PVC)Service Year 20th Year 40th Year 60th Year 80th Year
Operational ItemsValve Exercise Swabbing / Chlorination
Appurtenance Replacement Swabbing
Valve Exercise Swabbing / Chlorination
Complete Replacement TOTAL LIFECYCLE COST
Operation Cost / km $55,000 $147,182 $55,000 $817,110 $1,074,292
Asset Operational Item Cost / m Cost / km Notes
Valve Exercise $2.00 $2,000.00 Annually
Swabbing/Chlorination $15.00 $15,000.00
Appurtenance Replacement $132.18 $132,182.00
Complete Main Replacement $817.11 $817,110.00
URBAN DISTRIBUTION (300mm ø PVC)
Service Year20th Year 40th Year 60th Year 80th Year
Operational ItemsValve Exercise Swabbing / Chlorination
Appurtenance Replacement Swabbing
Valve Exercise Swabbing / Chlorination
Complete Replacement TOTAL LIFECYCLE COST
Operation Cost / km $55,000 $157,182 $55,000 $953,910 $1,221,092
Asset Operational Item Cost / m Cost / km Notes
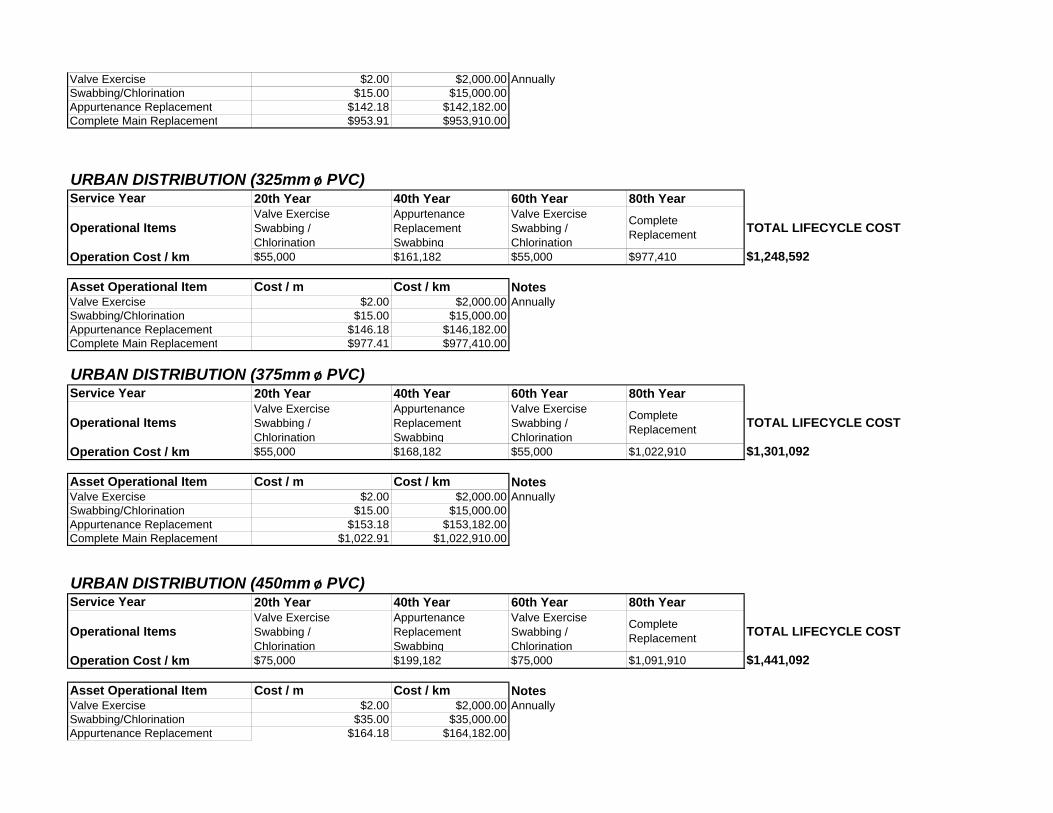
Valve Exercise $2.00 $2,000.00 AnnuallySwabbing/Chlorination $15.00 $15,000.00Appurtenance Replacement $142.18 $142,182.00Complete Main Replacement $953.91 $953,910.00
URBAN DISTRIBUTION (325mm ø PVC)Service Year 20th Year 40th Year 60th Year 80th Year
Operational ItemsValve Exercise Swabbing / Chlorination
Appurtenance Replacement Swabbing
Valve Exercise Swabbing / Chlorination
Complete Replacement TOTAL LIFECYCLE COST
Operation Cost / km $55,000 $161,182 $55,000 $977,410 $1,248,592
Asset Operational Item Cost / m Cost / km NotesValve Exercise $2.00 $2,000.00 AnnuallySwabbing/Chlorination $15.00 $15,000.00Appurtenance Replacement $146.18 $146,182.00Complete Main Replacement $977.41 $977,410.00
URBAN DISTRIBUTION (375mm ø PVC)Service Year 20th Year 40th Year 60th Year 80th Year
Operational ItemsValve Exercise Swabbing / Chlorination
Appurtenance Replacement Swabbing
Valve Exercise Swabbing / Chlorination
Complete Replacement TOTAL LIFECYCLE COST
Operation Cost / km $55,000 $168,182 $55,000 $1,022,910 $1,301,092
Asset Operational Item Cost / m Cost / km NotesValve Exercise $2.00 $2,000.00 AnnuallySwabbing/Chlorination $15.00 $15,000.00Appurtenance Replacement $153.18 $153,182.00Complete Main Replacement $1,022.91 $1,022,910.00
URBAN DISTRIBUTION (450mm ø PVC)Service Year 20th Year 40th Year 60th Year 80th Year
Operational ItemsValve Exercise Swabbing / Chlorination
Appurtenance Replacement Swabbing
Valve Exercise Swabbing / Chlorination
Complete Replacement TOTAL LIFECYCLE COST
Operation Cost / km $75,000 $199,182 $75,000 $1,091,910 $1,441,092
Asset Operational Item Cost / m Cost / km NotesValve Exercise $2.00 $2,000.00 AnnuallySwabbing/Chlorination $35.00 $35,000.00Appurtenance Replacement $164.18 $164,182.00
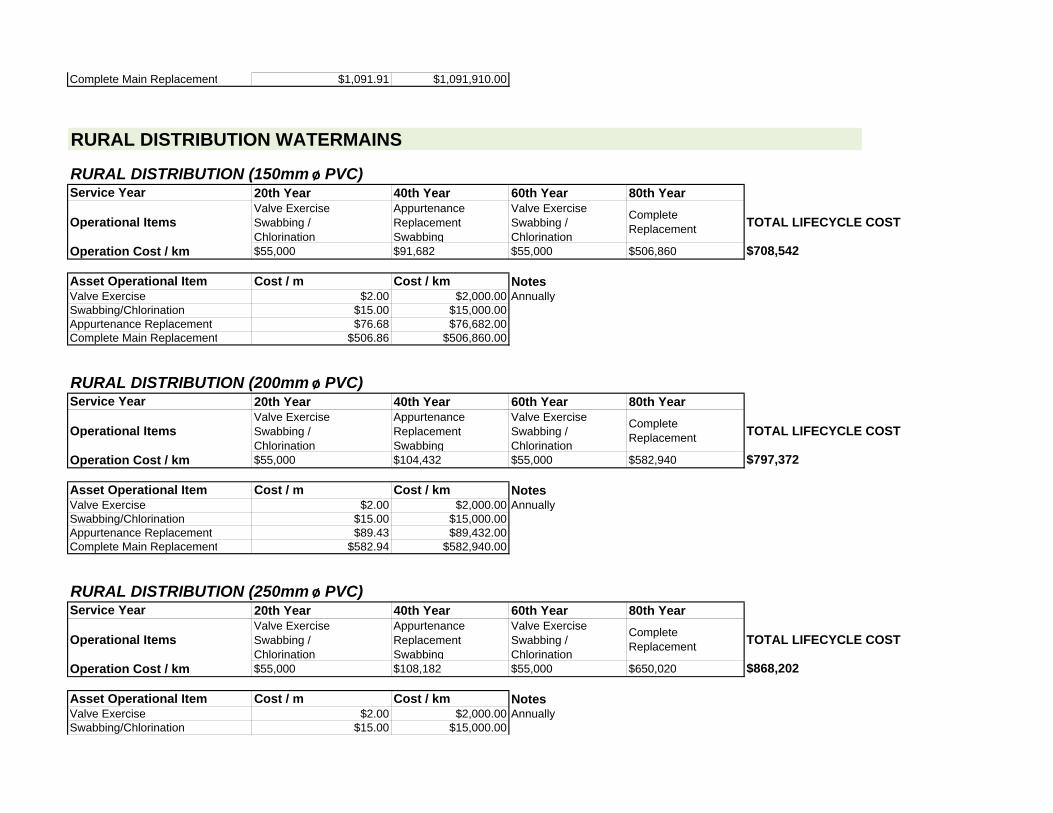
Complete Main Replacement $1,091.91 $1,091,910.00
RURAL DISTRIBUTION WATERMAINS
RURAL DISTRIBUTION (150mm ø PVC)Service Year 20th Year 40th Year 60th Year 80th Year
Operational ItemsValve Exercise Swabbing / Chlorination
Appurtenance Replacement Swabbing
Valve Exercise Swabbing / Chlorination
Complete Replacement TOTAL LIFECYCLE COST
Operation Cost / km $55,000 $91,682 $55,000 $506,860 $708,542
Asset Operational Item Cost / m Cost / km NotesValve Exercise $2.00 $2,000.00 AnnuallySwabbing/Chlorination $15.00 $15,000.00Appurtenance Replacement $76.68 $76,682.00Complete Main Replacement $506.86 $506,860.00
RURAL DISTRIBUTION (200mm ø PVC)Service Year 20th Year 40th Year 60th Year 80th Year
Operational ItemsValve Exercise Swabbing / Chlorination
Appurtenance Replacement Swabbing
Valve Exercise Swabbing / Chlorination
Complete Replacement TOTAL LIFECYCLE COST
Operation Cost / km $55,000 $104,432 $55,000 $582,940 $797,372
Asset Operational Item Cost / m Cost / km NotesValve Exercise $2.00 $2,000.00 AnnuallySwabbing/Chlorination $15.00 $15,000.00Appurtenance Replacement $89.43 $89,432.00Complete Main Replacement $582.94 $582,940.00
RURAL DISTRIBUTION (250mm ø PVC)Service Year 20th Year 40th Year 60th Year 80th Year
Operational ItemsValve Exercise Swabbing / Chlorination
Appurtenance Replacement Swabbing
Valve Exercise Swabbing / Chlorination
Complete Replacement TOTAL LIFECYCLE COST
Operation Cost / km $55,000 $108,182 $55,000 $650,020 $868,202
Asset Operational Item Cost / m Cost / km NotesValve Exercise $2.00 $2,000.00 AnnuallySwabbing/Chlorination $15.00 $15,000.00
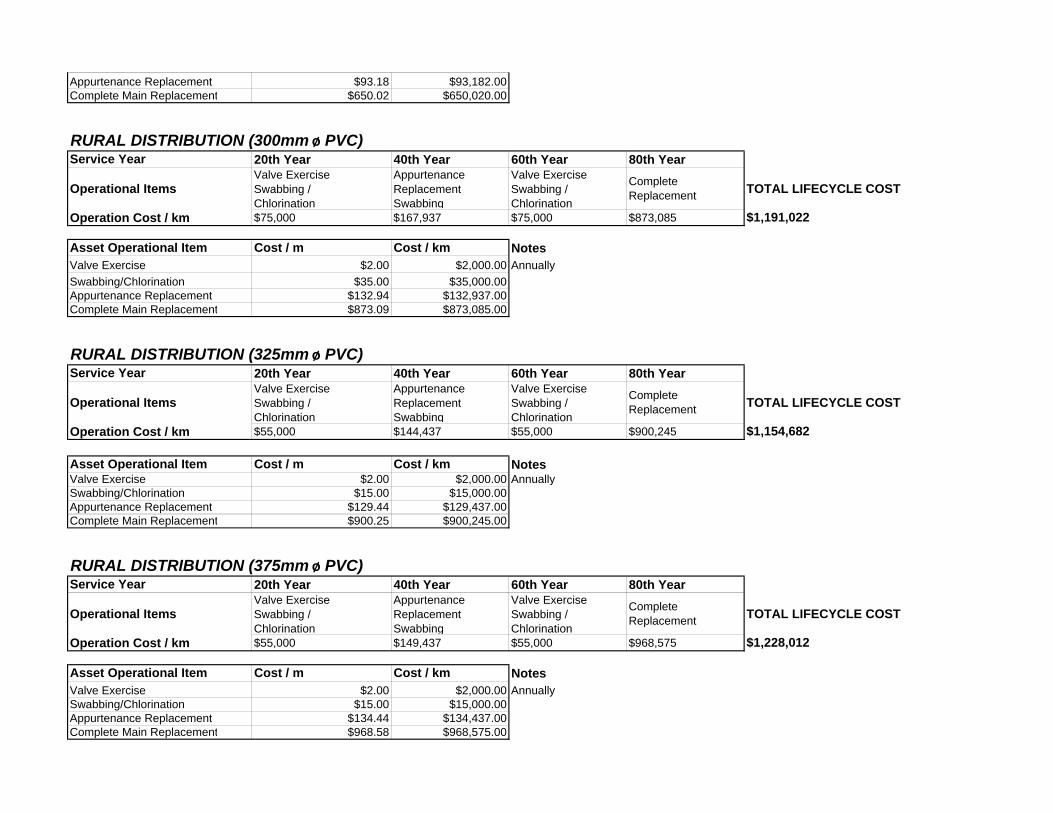
Appurtenance Replacement $93.18 $93,182.00Complete Main Replacement $650.02 $650,020.00
RURAL DISTRIBUTION (300mm ø PVC)Service Year 20th Year 40th Year 60th Year 80th Year
Operational ItemsValve Exercise Swabbing / Chlorination
Appurtenance Replacement Swabbing
Valve Exercise Swabbing / Chlorination
Complete Replacement TOTAL LIFECYCLE COST
Operation Cost / km $75,000 $167,937 $75,000 $873,085 $1,191,022
Asset Operational Item Cost / m Cost / km NotesValve Exercise $2.00 $2,000.00 AnnuallySwabbing/Chlorination $35.00 $35,000.00Appurtenance Replacement $132.94 $132,937.00Complete Main Replacement $873.09 $873,085.00
RURAL DISTRIBUTION (325mm ø PVC)Service Year 20th Year 40th Year 60th Year 80th Year
Operational ItemsValve Exercise Swabbing / Chlorination
Appurtenance Replacement Swabbing
Valve Exercise Swabbing / Chlorination
Complete Replacement TOTAL LIFECYCLE COST
Operation Cost / km $55,000 $144,437 $55,000 $900,245 $1,154,682
Asset Operational Item Cost / m Cost / km NotesValve Exercise $2.00 $2,000.00 AnnuallySwabbing/Chlorination $15.00 $15,000.00Appurtenance Replacement $129.44 $129,437.00Complete Main Replacement $900.25 $900,245.00
RURAL DISTRIBUTION (375mm ø PVC)Service Year 20th Year 40th Year 60th Year 80th Year
Operational ItemsValve Exercise Swabbing / Chlorination
Appurtenance Replacement Swabbing
Valve Exercise Swabbing / Chlorination
Complete Replacement TOTAL LIFECYCLE COST
Operation Cost / km $55,000 $149,437 $55,000 $968,575 $1,228,012
Asset Operational Item Cost / m Cost / km NotesValve Exercise $2.00 $2,000.00 AnnuallySwabbing/Chlorination $15.00 $15,000.00Appurtenance Replacement $134.44 $134,437.00Complete Main Replacement $968.58 $968,575.00
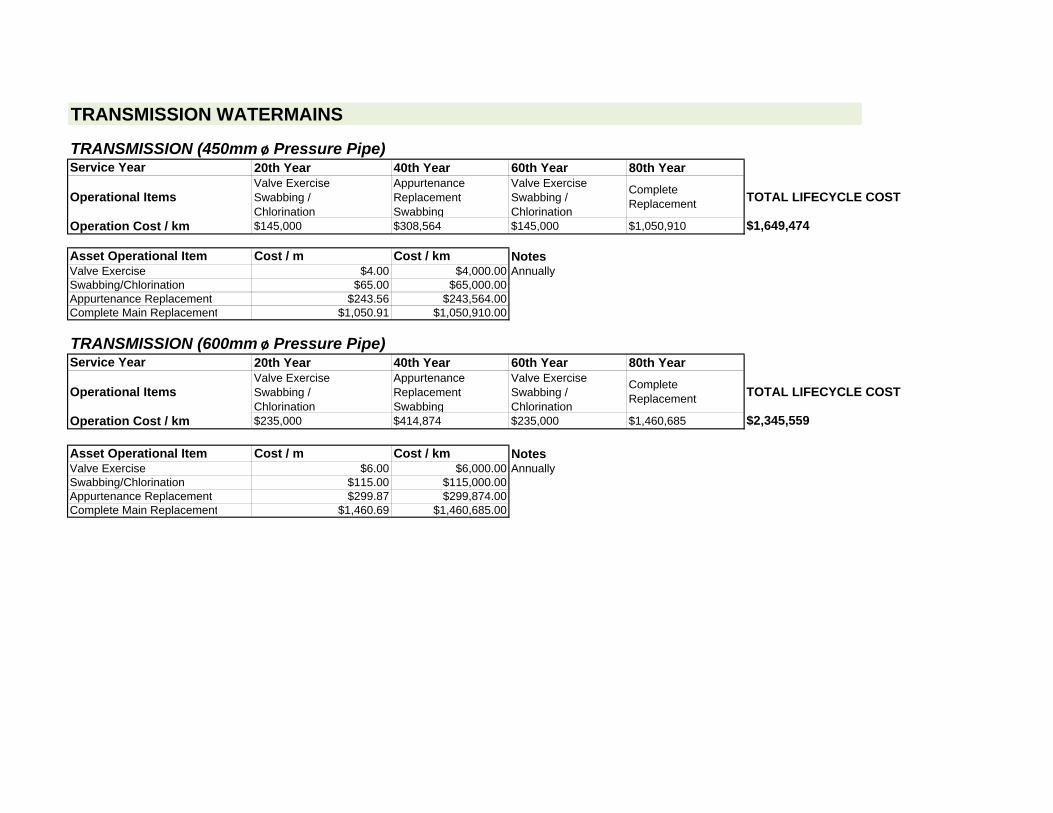
TRANSMISSION WATERMAINS
TRANSMISSION (450mm ø Pressure Pipe)Service Year 20th Year 40th Year 60th Year 80th Year
Operational ItemsValve Exercise Swabbing / Chlorination
Appurtenance Replacement Swabbing
Valve Exercise Swabbing / Chlorination
Complete Replacement TOTAL LIFECYCLE COST
Operation Cost / km $145,000 $308,564 $145,000 $1,050,910 $1,649,474
Asset Operational Item Cost / m Cost / km NotesValve Exercise $4.00 $4,000.00 AnnuallySwabbing/Chlorination $65.00 $65,000.00Appurtenance Replacement $243.56 $243,564.00Complete Main Replacement $1,050.91 $1,050,910.00
TRANSMISSION (600mm ø Pressure Pipe)Service Year 20th Year 40th Year 60th Year 80th Year
Operational ItemsValve Exercise Swabbing / Chlorination
Appurtenance Replacement Swabbing
Valve Exercise Swabbing / Chlorination
Complete Replacement TOTAL LIFECYCLE COST
Operation Cost / km $235,000 $414,874 $235,000 $1,460,685 $2,345,559
Asset Operational Item Cost / m Cost / km NotesValve Exercise $6.00 $6,000.00 AnnuallySwabbing/Chlorination $115.00 $115,000.00Appurtenance Replacement $299.87 $299,874.00Complete Main Replacement $1,460.69 $1,460,685.00

Asset Management PlanningAsset Management Planning for the Township of Chapleau
Appendix HAppendix HCosting Estimates for Life Cycle Activities
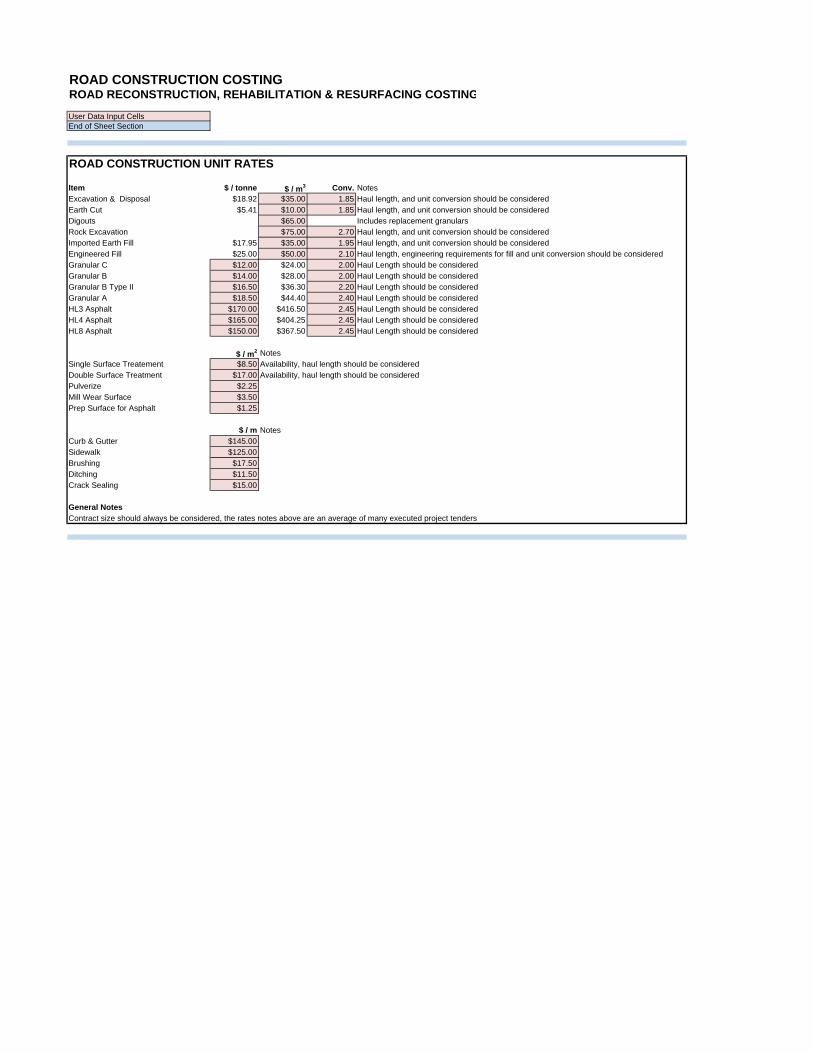
ROAD CONSTRUCTION COSTING
User Data Input CellsEnd of Sheet Section
ROAD CONSTRUCTION UNIT RATES
Item $ / tonne $ / m3 Conv. NotesExcavation & Disposal $18.92 $35.00 1.85 Haul length, and unit conversion should be consideredEarth Cut $5.41 $10.00 1.85 Haul length, and unit conversion should be consideredDigouts $65.00 Includes replacement granularsRock Excavation $75.00 2.70 Haul length, and unit conversion should be consideredImported Earth Fill $17.95 $35.00 1.95 Haul length, and unit conversion should be consideredEngineered Fill $25.00 $50.00 2.10 Haul length, engineering requirements for fill and unit conversion should be consideredGranular C $12.00 $24.00 2.00 Haul Length should be consideredGranular B $14.00 $28.00 2.00 Haul Length should be consideredGranular B Type II $16.50 $36.30 2.20 Haul Length should be consideredGranular A $18.50 $44.40 2.40 Haul Length should be consideredHL3 Asphalt $170.00 $416.50 2.45 Haul Length should be consideredHL4 Asphalt $165.00 $404.25 2.45 Haul Length should be consideredHL8 Asphalt $150.00 $367.50 2.45 Haul Length should be considered
$ / m2 NotesSingle Surface Treatement $8.50 Availability, haul length should be consideredDouble Surface Treatment $17.00 Availability, haul length should be consideredPulverize $2.25Mill Wear Surface $3.50Prep Surface for Asphalt $1.25
$ / m NotesCurb & Gutter $145.00Sidewalk $125.00Brushing $17.50Ditching $11.50Crack Sealing $15.00
General NotesContract size should always be considered, the rates notes above are an average of many executed project tenders
ROAD RECONSTRUCTION, REHABILITATION & RESURFACING COSTING
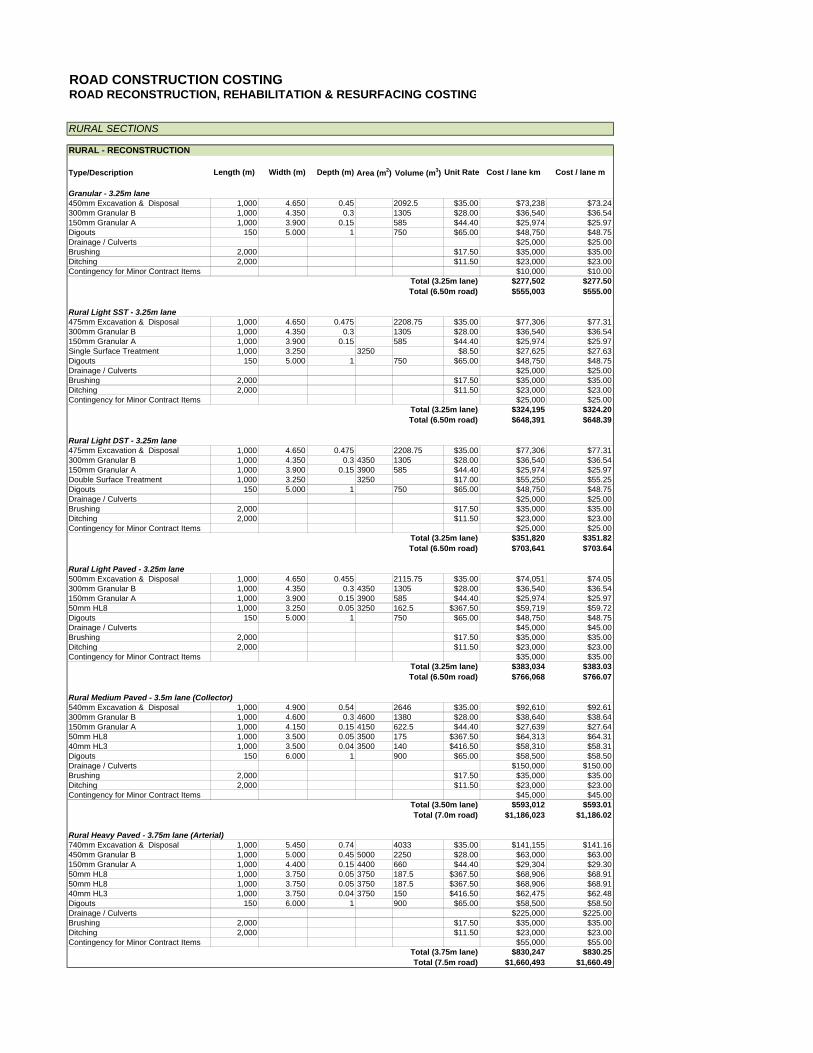
ROAD CONSTRUCTION COSTINGROAD RECONSTRUCTION, REHABILITATION & RESURFACING COSTING
Type/Description Length (m) Width (m) Depth (m) Area (m2) Volume (m3) Unit Rate Cost / lane km Cost / lane m
Granular - 3.25m lane450mm Excavation & Disposal 1,000 4.650 0.45 2092.5 $35.00 $73,238 $73.24300mm Granular B 1,000 4.350 0.3 1305 $28.00 $36,540 $36.54150mm Granular A 1,000 3.900 0.15 585 $44.40 $25,974 $25.97Digouts 150 5.000 1 750 $65.00 $48,750 $48.75Drainage / Culverts $25,000 $25.00Brushing 2,000 $17.50 $35,000 $35.00Ditching 2,000 $11.50 $23,000 $23.00Contingency for Minor Contract Items $10,000 $10.00
Total (3.25m lane) $277,502 $277.50Total (6.50m road) $555,003 $555.00
Rural Light SST - 3.25m lane475mm Excavation & Disposal 1,000 4.650 0.475 2208.75 $35.00 $77,306 $77.31300mm Granular B 1,000 4.350 0.3 1305 $28.00 $36,540 $36.54150mm Granular A 1,000 3.900 0.15 585 $44.40 $25,974 $25.97Single Surface Treatment 1,000 3.250 3250 $8.50 $27,625 $27.63Digouts 150 5.000 1 750 $65.00 $48,750 $48.75Drainage / Culverts $25,000 $25.00Brushing 2,000 $17.50 $35,000 $35.00Ditching 2,000 $11.50 $23,000 $23.00Contingency for Minor Contract Items $25,000 $25.00
Total (3.25m lane) $324,195 $324.20Total (6.50m road) $648,391 $648.39
Rural Light DST - 3.25m lane475mm Excavation & Disposal 1,000 4.650 0.475 2208.75 $35.00 $77,306 $77.31300mm Granular B 1,000 4.350 0.3 4350 1305 $28.00 $36,540 $36.54150mm Granular A 1,000 3.900 0.15 3900 585 $44.40 $25,974 $25.97Double Surface Treatment 1,000 3.250 3250 $17.00 $55,250 $55.25Digouts 150 5.000 1 750 $65.00 $48,750 $48.75Drainage / Culverts $25,000 $25.00Brushing 2,000 $17.50 $35,000 $35.00Ditching 2,000 $11.50 $23,000 $23.00Contingency for Minor Contract Items $25,000 $25.00
Total (3.25m lane) $351,820 $351.82Total (6.50m road) $703,641 $703.64
Rural Light Paved - 3.25m lane500mm Excavation & Disposal 1,000 4.650 0.455 2115.75 $35.00 $74,051 $74.05300mm Granular B 1,000 4.350 0.3 4350 1305 $28.00 $36,540 $36.54150mm Granular A 1,000 3.900 0.15 3900 585 $44.40 $25,974 $25.9750mm HL8 1,000 3.250 0.05 3250 162.5 $367.50 $59,719 $59.72Digouts 150 5.000 1 750 $65.00 $48,750 $48.75Drainage / Culverts $45,000 $45.00Brushing 2,000 $17.50 $35,000 $35.00Ditching 2,000 $11.50 $23,000 $23.00Contingency for Minor Contract Items $35,000 $35.00
Total (3.25m lane) $383,034 $383.03Total (6.50m road) $766,068 $766.07
Rural Medium Paved - 3.5m lane (Collector)540mm Excavation & Disposal 1,000 4.900 0.54 2646 $35.00 $92,610 $92.61300mm Granular B 1,000 4.600 0.3 4600 1380 $28.00 $38,640 $38.64150mm Granular A 1,000 4.150 0.15 4150 622.5 $44.40 $27,639 $27.6450mm HL8 1,000 3.500 0.05 3500 175 $367.50 $64,313 $64.3140mm HL3 1,000 3.500 0.04 3500 140 $416.50 $58,310 $58.31Digouts 150 6.000 1 900 $65.00 $58,500 $58.50Drainage / Culverts $150,000 $150.00Brushing 2,000 $17.50 $35,000 $35.00Ditching 2,000 $11.50 $23,000 $23.00Contingency for Minor Contract Items $45,000 $45.00
Total (3.50m lane) $593,012 $593.01Total (7.0m road) $1,186,023 $1,186.02
Rural Heavy Paved - 3.75m lane (Arterial)740mm Excavation & Disposal 1,000 5.450 0.74 4033 $35.00 $141,155 $141.16450mm Granular B 1,000 5.000 0.45 5000 2250 $28.00 $63,000 $63.00150mm Granular A 1,000 4.400 0.15 4400 660 $44.40 $29,304 $29.3050mm HL8 1,000 3.750 0.05 3750 187.5 $367.50 $68,906 $68.9150mm HL8 1,000 3.750 0.05 3750 187.5 $367.50 $68,906 $68.9140mm HL3 1,000 3.750 0.04 3750 150 $416.50 $62,475 $62.48Digouts 150 6.000 1 900 $65.00 $58,500 $58.50Drainage / Culverts $225,000 $225.00Brushing 2,000 $17.50 $35,000 $35.00Ditching 2,000 $11.50 $23,000 $23.00Contingency for Minor Contract Items $55,000 $55.00
Total (3.75m lane) $830,247 $830.25Total (7.5m road) $1,660,493 $1,660.49
RURAL SECTIONS
RURAL - RECONSTRUCTION
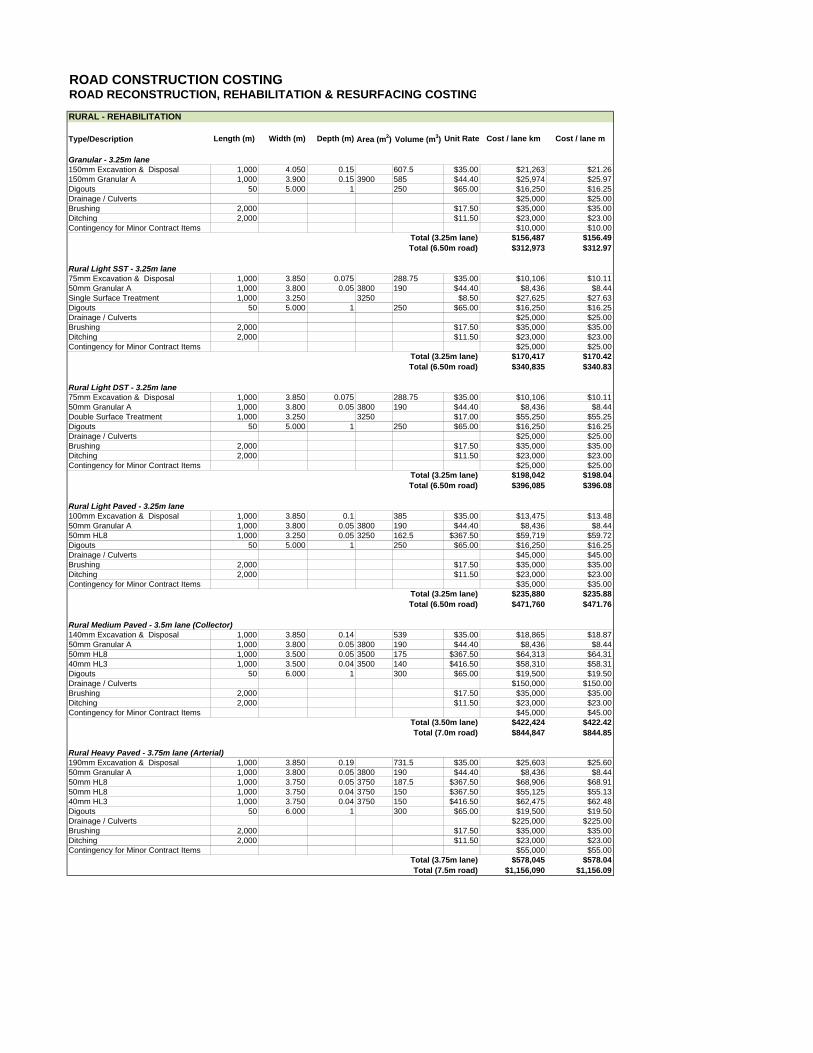
ROAD CONSTRUCTION COSTINGROAD RECONSTRUCTION, REHABILITATION & RESURFACING COSTING
Type/Description Length (m) Width (m) Depth (m) Area (m2) Volume (m3) Unit Rate Cost / lane km Cost / lane m
Granular - 3.25m lane150mm Excavation & Disposal 1,000 4.050 0.15 607.5 $35.00 $21,263 $21.26150mm Granular A 1,000 3.900 0.15 3900 585 $44.40 $25,974 $25.97Digouts 50 5.000 1 250 $65.00 $16,250 $16.25Drainage / Culverts $25,000 $25.00Brushing 2,000 $17.50 $35,000 $35.00Ditching 2,000 $11.50 $23,000 $23.00Contingency for Minor Contract Items $10,000 $10.00
Total (3.25m lane) $156,487 $156.49Total (6.50m road) $312,973 $312.97
Rural Light SST - 3.25m lane75mm Excavation & Disposal 1,000 3.850 0.075 288.75 $35.00 $10,106 $10.1150mm Granular A 1,000 3.800 0.05 3800 190 $44.40 $8,436 $8.44Single Surface Treatment 1,000 3.250 3250 $8.50 $27,625 $27.63Digouts 50 5.000 1 250 $65.00 $16,250 $16.25Drainage / Culverts $25,000 $25.00Brushing 2,000 $17.50 $35,000 $35.00Ditching 2,000 $11.50 $23,000 $23.00Contingency for Minor Contract Items $25,000 $25.00
Total (3.25m lane) $170,417 $170.42Total (6.50m road) $340,835 $340.83
Rural Light DST - 3.25m lane75mm Excavation & Disposal 1,000 3.850 0.075 288.75 $35.00 $10,106 $10.1150mm Granular A 1,000 3.800 0.05 3800 190 $44.40 $8,436 $8.44Double Surface Treatment 1,000 3.250 3250 $17.00 $55,250 $55.25Digouts 50 5.000 1 250 $65.00 $16,250 $16.25Drainage / Culverts $25,000 $25.00Brushing 2,000 $17.50 $35,000 $35.00Ditching 2,000 $11.50 $23,000 $23.00Contingency for Minor Contract Items $25,000 $25.00
Total (3.25m lane) $198,042 $198.04Total (6.50m road) $396,085 $396.08
Rural Light Paved - 3.25m lane100mm Excavation & Disposal 1,000 3.850 0.1 385 $35.00 $13,475 $13.4850mm Granular A 1,000 3.800 0.05 3800 190 $44.40 $8,436 $8.4450mm HL8 1,000 3.250 0.05 3250 162.5 $367.50 $59,719 $59.72Digouts 50 5.000 1 250 $65.00 $16,250 $16.25Drainage / Culverts $45,000 $45.00Brushing 2,000 $17.50 $35,000 $35.00Ditching 2,000 $11.50 $23,000 $23.00Contingency for Minor Contract Items $35,000 $35.00
Total (3.25m lane) $235,880 $235.88Total (6.50m road) $471,760 $471.76
Rural Medium Paved - 3.5m lane (Collector)140mm Excavation & Disposal 1,000 3.850 0.14 539 $35.00 $18,865 $18.8750mm Granular A 1,000 3.800 0.05 3800 190 $44.40 $8,436 $8.4450mm HL8 1,000 3.500 0.05 3500 175 $367.50 $64,313 $64.3140mm HL3 1,000 3.500 0.04 3500 140 $416.50 $58,310 $58.31Digouts 50 6.000 1 300 $65.00 $19,500 $19.50Drainage / Culverts $150,000 $150.00Brushing 2,000 $17.50 $35,000 $35.00Ditching 2,000 $11.50 $23,000 $23.00Contingency for Minor Contract Items $45,000 $45.00
Total (3.50m lane) $422,424 $422.42Total (7.0m road) $844,847 $844.85
Rural Heavy Paved - 3.75m lane (Arterial)190mm Excavation & Disposal 1,000 3.850 0.19 731.5 $35.00 $25,603 $25.6050mm Granular A 1,000 3.800 0.05 3800 190 $44.40 $8,436 $8.4450mm HL8 1,000 3.750 0.05 3750 187.5 $367.50 $68,906 $68.9150mm HL8 1,000 3.750 0.04 3750 150 $367.50 $55,125 $55.1340mm HL3 1,000 3.750 0.04 3750 150 $416.50 $62,475 $62.48Digouts 50 6.000 1 300 $65.00 $19,500 $19.50Drainage / Culverts $225,000 $225.00Brushing 2,000 $17.50 $35,000 $35.00Ditching 2,000 $11.50 $23,000 $23.00Contingency for Minor Contract Items $55,000 $55.00
Total (3.75m lane) $578,045 $578.04Total (7.5m road) $1,156,090 $1,156.09
RURAL - REHABILITATION
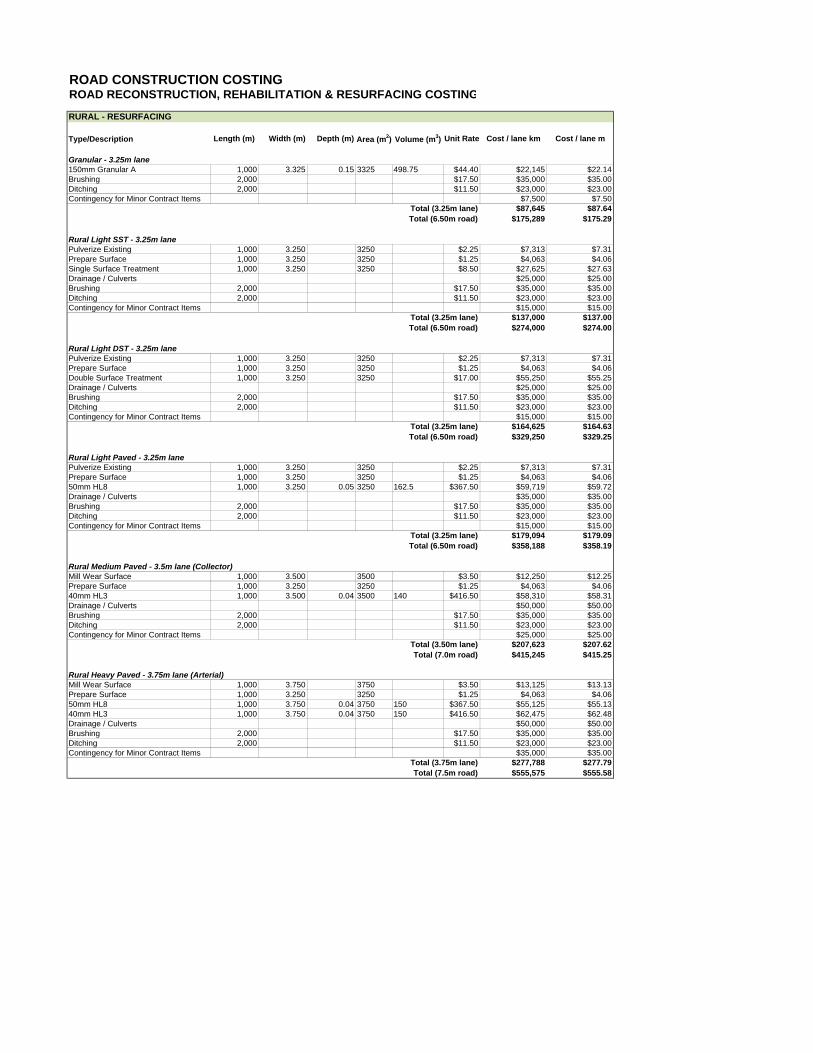
ROAD CONSTRUCTION COSTINGROAD RECONSTRUCTION, REHABILITATION & RESURFACING COSTING
Type/Description Length (m) Width (m) Depth (m) Area (m2) Volume (m3) Unit Rate Cost / lane km Cost / lane m
Granular - 3.25m lane150mm Granular A 1,000 3.325 0.15 3325 498.75 $44.40 $22,145 $22.14Brushing 2,000 $17.50 $35,000 $35.00Ditching 2,000 $11.50 $23,000 $23.00Contingency for Minor Contract Items $7,500 $7.50
Total (3.25m lane) $87,645 $87.64Total (6.50m road) $175,289 $175.29
Rural Light SST - 3.25m lanePulverize Existing 1,000 3.250 3250 $2.25 $7,313 $7.31Prepare Surface 1,000 3.250 3250 $1.25 $4,063 $4.06Single Surface Treatment 1,000 3.250 3250 $8.50 $27,625 $27.63Drainage / Culverts $25,000 $25.00Brushing 2,000 $17.50 $35,000 $35.00Ditching 2,000 $11.50 $23,000 $23.00Contingency for Minor Contract Items $15,000 $15.00
Total (3.25m lane) $137,000 $137.00Total (6.50m road) $274,000 $274.00
Rural Light DST - 3.25m lanePulverize Existing 1,000 3.250 3250 $2.25 $7,313 $7.31Prepare Surface 1,000 3.250 3250 $1.25 $4,063 $4.06Double Surface Treatment 1,000 3.250 3250 $17.00 $55,250 $55.25Drainage / Culverts $25,000 $25.00Brushing 2,000 $17.50 $35,000 $35.00Ditching 2,000 $11.50 $23,000 $23.00Contingency for Minor Contract Items $15,000 $15.00
Total (3.25m lane) $164,625 $164.63Total (6.50m road) $329,250 $329.25
Rural Light Paved - 3.25m lanePulverize Existing 1,000 3.250 3250 $2.25 $7,313 $7.31Prepare Surface 1,000 3.250 3250 $1.25 $4,063 $4.0650mm HL8 1,000 3.250 0.05 3250 162.5 $367.50 $59,719 $59.72Drainage / Culverts $35,000 $35.00Brushing 2,000 $17.50 $35,000 $35.00Ditching 2,000 $11.50 $23,000 $23.00Contingency for Minor Contract Items $15,000 $15.00
Total (3.25m lane) $179,094 $179.09Total (6.50m road) $358,188 $358.19
Rural Medium Paved - 3.5m lane (Collector)Mill Wear Surface 1,000 3.500 3500 $3.50 $12,250 $12.25Prepare Surface 1,000 3.250 3250 $1.25 $4,063 $4.0640mm HL3 1,000 3.500 0.04 3500 140 $416.50 $58,310 $58.31Drainage / Culverts $50,000 $50.00Brushing 2,000 $17.50 $35,000 $35.00Ditching 2,000 $11.50 $23,000 $23.00Contingency for Minor Contract Items $25,000 $25.00
Total (3.50m lane) $207,623 $207.62Total (7.0m road) $415,245 $415.25
Rural Heavy Paved - 3.75m lane (Arterial)Mill Wear Surface 1,000 3.750 3750 $3.50 $13,125 $13.13Prepare Surface 1,000 3.250 3250 $1.25 $4,063 $4.0650mm HL8 1,000 3.750 0.04 3750 150 $367.50 $55,125 $55.1340mm HL3 1,000 3.750 0.04 3750 150 $416.50 $62,475 $62.48Drainage / Culverts $50,000 $50.00Brushing 2,000 $17.50 $35,000 $35.00Ditching 2,000 $11.50 $23,000 $23.00Contingency for Minor Contract Items $35,000 $35.00
Total (3.75m lane) $277,788 $277.79Total (7.5m road) $555,575 $555.58
RURAL - RESURFACING
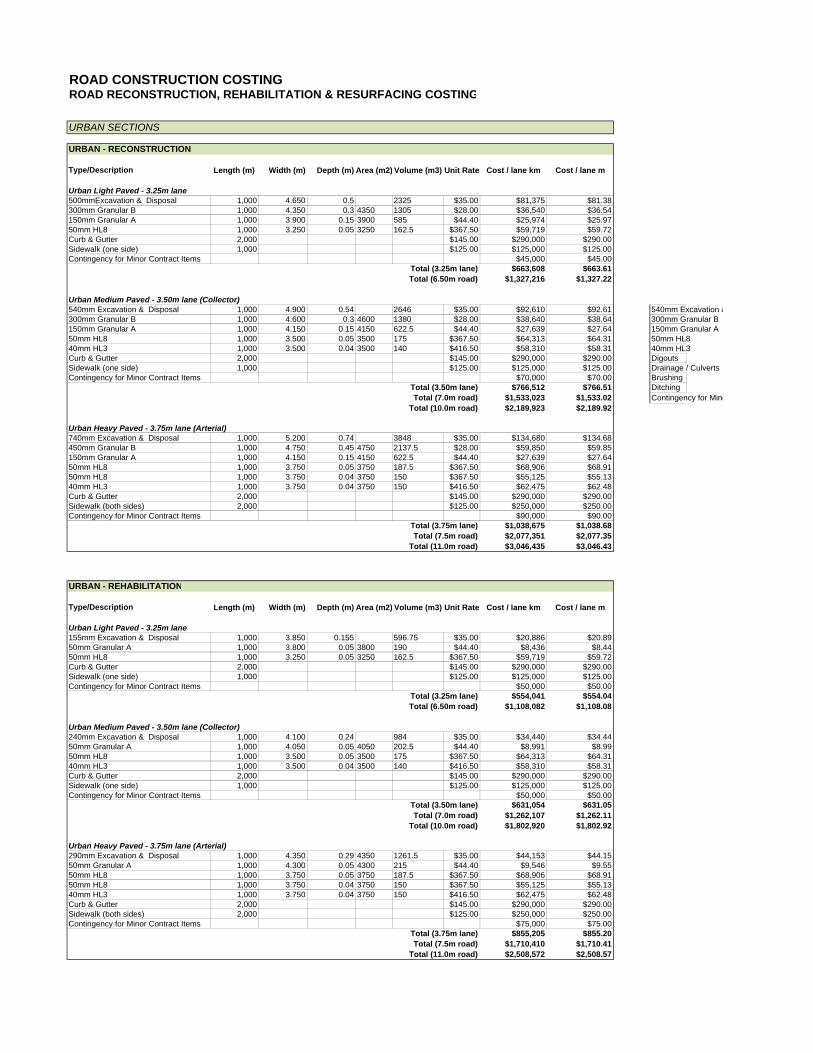
ROAD CONSTRUCTION COSTINGROAD RECONSTRUCTION, REHABILITATION & RESURFACING COSTING
URBAN - RECONSTRUCTION
Type/Description Length (m) Width (m) Depth (m) Area (m2) Volume (m3) Unit Rate Cost / lane km Cost / lane m
Urban Light Paved - 3.25m lane500mmExcavation & Disposal 1,000 4.650 0.5 2325 $35.00 $81,375 $81.38300mm Granular B 1,000 4.350 0.3 4350 1305 $28.00 $36,540 $36.54150mm Granular A 1,000 3.900 0.15 3900 585 $44.40 $25,974 $25.9750mm HL8 1,000 3.250 0.05 3250 162.5 $367.50 $59,719 $59.72Curb & Gutter 2,000 $145.00 $290,000 $290.00Sidewalk (one side) 1,000 $125.00 $125,000 $125.00Contingency for Minor Contract Items $45,000 $45.00
Total (3.25m lane) $663,608 $663.61Total (6.50m road) $1,327,216 $1,327.22
Urban Medium Paved - 3.50m lane (Collector)540mm Excavation & Disposal 1,000 4.900 0.54 2646 $35.00 $92,610 $92.61 540mm Excavation &300mm Granular B 1,000 4.600 0.3 4600 1380 $28.00 $38,640 $38.64 300mm Granular B150mm Granular A 1,000 4.150 0.15 4150 622.5 $44.40 $27,639 $27.64 150mm Granular A50mm HL8 1,000 3.500 0.05 3500 175 $367.50 $64,313 $64.31 50mm HL840mm HL3 1,000 3.500 0.04 3500 140 $416.50 $58,310 $58.31 40mm HL3Curb & Gutter 2,000 $145.00 $290,000 $290.00 Digouts Sidewalk (one side) 1,000 $125.00 $125,000 $125.00 Drainage / CulvertsContingency for Minor Contract Items $70,000 $70.00 Brushing
Total (3.50m lane) $766,512 $766.51 DitchingTotal (7.0m road) $1,533,023 $1,533.02 Contingency for Mino
Total (10.0m road) $2,189,923 $2,189.92
Urban Heavy Paved - 3.75m lane (Arterial)740mm Excavation & Disposal 1,000 5.200 0.74 3848 $35.00 $134,680 $134.68450mm Granular B 1,000 4.750 0.45 4750 2137.5 $28.00 $59,850 $59.85150mm Granular A 1,000 4.150 0.15 4150 622.5 $44.40 $27,639 $27.6450mm HL8 1,000 3.750 0.05 3750 187.5 $367.50 $68,906 $68.9150mm HL8 1,000 3.750 0.04 3750 150 $367.50 $55,125 $55.1340mm HL3 1,000 3.750 0.04 3750 150 $416.50 $62,475 $62.48Curb & Gutter 2,000 $145.00 $290,000 $290.00Sidewalk (both sides) 2,000 $125.00 $250,000 $250.00Contingency for Minor Contract Items $90,000 $90.00
Total (3.75m lane) $1,038,675 $1,038.68Total (7.5m road) $2,077,351 $2,077.35
Total (11.0m road) $3,046,435 $3,046.43
URBAN - REHABILITATION
Type/Description Length (m) Width (m) Depth (m) Area (m2) Volume (m3) Unit Rate Cost / lane km Cost / lane m
Urban Light Paved - 3.25m lane155mm Excavation & Disposal 1,000 3.850 0.155 596.75 $35.00 $20,886 $20.8950mm Granular A 1,000 3.800 0.05 3800 190 $44.40 $8,436 $8.4450mm HL8 1,000 3.250 0.05 3250 162.5 $367.50 $59,719 $59.72Curb & Gutter 2,000 $145.00 $290,000 $290.00Sidewalk (one side) 1,000 $125.00 $125,000 $125.00Contingency for Minor Contract Items $50,000 $50.00
Total (3.25m lane) $554,041 $554.04Total (6.50m road) $1,108,082 $1,108.08
Urban Medium Paved - 3.50m lane (Collector)240mm Excavation & Disposal 1,000 4.100 0.24 984 $35.00 $34,440 $34.4450mm Granular A 1,000 4.050 0.05 4050 202.5 $44.40 $8,991 $8.9950mm HL8 1,000 3.500 0.05 3500 175 $367.50 $64,313 $64.3140mm HL3 1,000 3.500 0.04 3500 140 $416.50 $58,310 $58.31Curb & Gutter 2,000 $145.00 $290,000 $290.00Sidewalk (one side) 1,000 $125.00 $125,000 $125.00Contingency for Minor Contract Items $50,000 $50.00
Total (3.50m lane) $631,054 $631.05Total (7.0m road) $1,262,107 $1,262.11
Total (10.0m road) $1,802,920 $1,802.92
Urban Heavy Paved - 3.75m lane (Arterial)290mm Excavation & Disposal 1,000 4.350 0.29 4350 1261.5 $35.00 $44,153 $44.1550mm Granular A 1,000 4.300 0.05 4300 215 $44.40 $9,546 $9.5550mm HL8 1,000 3.750 0.05 3750 187.5 $367.50 $68,906 $68.9150mm HL8 1,000 3.750 0.04 3750 150 $367.50 $55,125 $55.1340mm HL3 1,000 3.750 0.04 3750 150 $416.50 $62,475 $62.48Curb & Gutter 2,000 $145.00 $290,000 $290.00Sidewalk (both sides) 2,000 $125.00 $250,000 $250.00Contingency for Minor Contract Items $75,000 $75.00
Total (3.75m lane) $855,205 $855.20Total (7.5m road) $1,710,410 $1,710.41
Total (11.0m road) $2,508,572 $2,508.57
URBAN SECTIONS
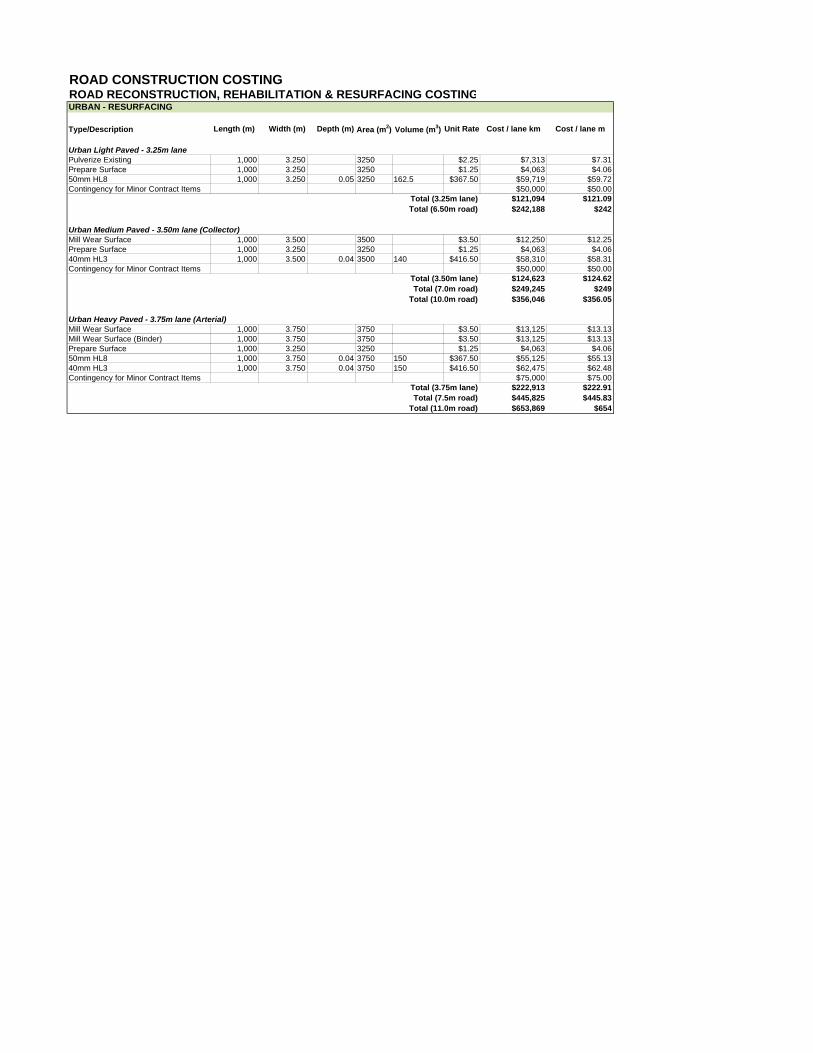
ROAD CONSTRUCTION COSTINGROAD RECONSTRUCTION, REHABILITATION & RESURFACING COSTINGURBAN - RESURFACING
Type/Description Length (m) Width (m) Depth (m) Area (m2) Volume (m3) Unit Rate Cost / lane km Cost / lane m
Urban Light Paved - 3.25m lanePulverize Existing 1,000 3.250 3250 $2.25 $7,313 $7.31Prepare Surface 1,000 3.250 3250 $1.25 $4,063 $4.0650mm HL8 1,000 3.250 0.05 3250 162.5 $367.50 $59,719 $59.72Contingency for Minor Contract Items $50,000 $50.00
Total (3.25m lane) $121,094 $121.09Total (6.50m road) $242,188 $242
Urban Medium Paved - 3.50m lane (Collector)Mill Wear Surface 1,000 3.500 3500 $3.50 $12,250 $12.25Prepare Surface 1,000 3.250 3250 $1.25 $4,063 $4.0640mm HL3 1,000 3.500 0.04 3500 140 $416.50 $58,310 $58.31Contingency for Minor Contract Items $50,000 $50.00
Total (3.50m lane) $124,623 $124.62Total (7.0m road) $249,245 $249
Total (10.0m road) $356,046 $356.05
Urban Heavy Paved - 3.75m lane (Arterial)Mill Wear Surface 1,000 3.750 3750 $3.50 $13,125 $13.13Mill Wear Surface (Binder) 1,000 3.750 3750 $3.50 $13,125 $13.13Prepare Surface 1,000 3.250 3250 $1.25 $4,063 $4.0650mm HL8 1,000 3.750 0.04 3750 150 $367.50 $55,125 $55.1340mm HL3 1,000 3.750 0.04 3750 150 $416.50 $62,475 $62.48Contingency for Minor Contract Items $75,000 $75.00
Total (3.75m lane) $222,913 $222.91Total (7.5m road) $445,825 $445.83
Total (11.0m road) $653,869 $654
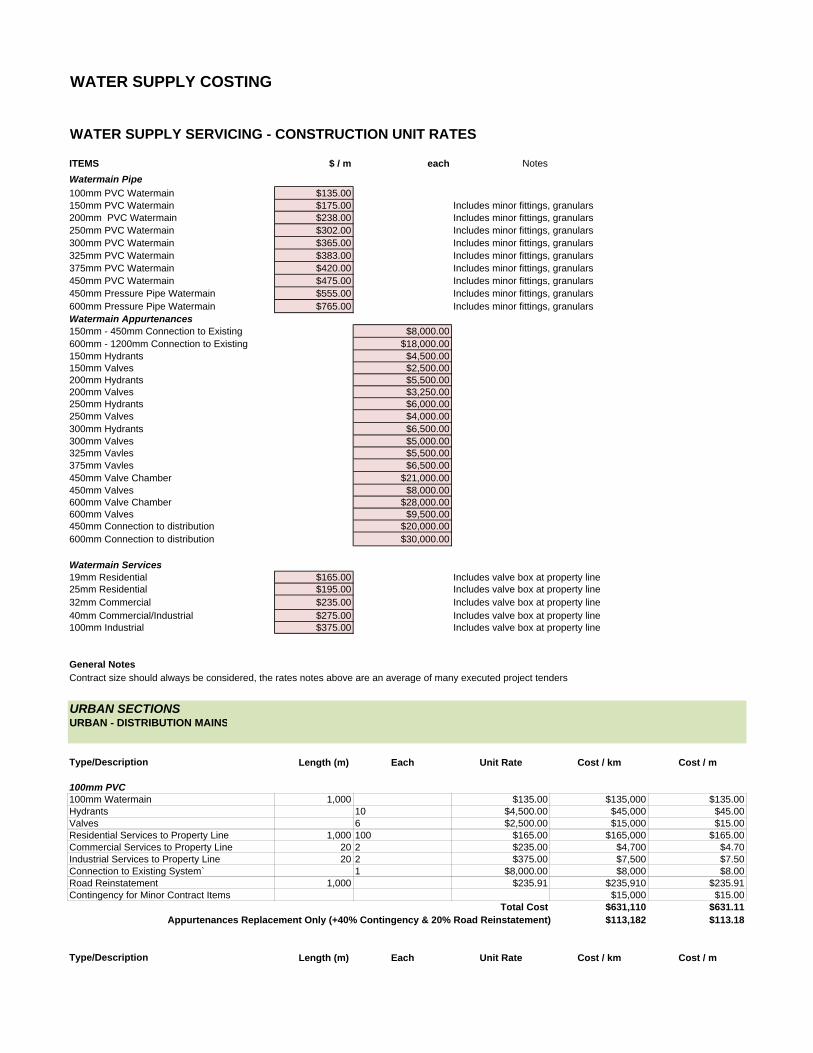
WATER SUPPLY COSTING
WATER SUPPLY SERVICING - CONSTRUCTION UNIT RATES
ITEMS $ / m each NotesWatermain Pipe100mm PVC Watermain $135.00150mm PVC Watermain $175.00 Includes minor fittings, granulars200mm PVC Watermain $238.00 Includes minor fittings, granulars250mm PVC Watermain $302.00 Includes minor fittings, granulars300mm PVC Watermain $365.00 Includes minor fittings, granulars325mm PVC Watermain $383.00 Includes minor fittings, granulars375mm PVC Watermain $420.00 Includes minor fittings, granulars450mm PVC Watermain $475.00 Includes minor fittings, granulars450mm Pressure Pipe Watermain $555.00 Includes minor fittings, granulars600mm Pressure Pipe Watermain $765.00 Includes minor fittings, granularsWatermain Appurtenances150mm - 450mm Connection to Existing $8,000.00600mm - 1200mm Connection to Existing $18,000.00150mm Hydrants $4,500.00150mm Valves $2,500.00200mm Hydrants $5,500.00200mm Valves $3,250.00250mm Hydrants $6,000.00250mm Valves $4,000.00300mm Hydrants $6,500.00300mm Valves $5,000.00325mm Vavles $5,500.00375mm Vavles $6,500.00450mm Valve Chamber $21,000.00450mm Valves $8,000.00600mm Valve Chamber $28,000.00600mm Valves $9,500.00450mm Connection to distribution $20,000.00600mm Connection to distribution $30,000.00
Watermain Services19mm Residential $165.00 Includes valve box at property line25mm Residential $195.00 Includes valve box at property line32mm Commercial $235.00 Includes valve box at property line40mm Commercial/Industrial $275.00 Includes valve box at property line100mm Industrial $375.00 Includes valve box at property line
General NotesContract size should always be considered, the rates notes above are an average of many executed project tenders
URBAN SECTIONSURBAN - DISTRIBUTION MAINS
Type/Description Length (m) Each Unit Rate Cost / km Cost / m
100mm PVC100mm Watermain 1,000 $135.00 $135,000 $135.00Hydrants 10 $4,500.00 $45,000 $45.00Valves 6 $2,500.00 $15,000 $15.00Residential Services to Property Line 1,000 100 $165.00 $165,000 $165.00Commercial Services to Property Line 20 2 $235.00 $4,700 $4.70Industrial Services to Property Line 20 2 $375.00 $7,500 $7.50Connection to Existing System` 1 $8,000.00 $8,000 $8.00Road Reinstatement 1,000 $235.91 $235,910 $235.91Contingency for Minor Contract Items $15,000 $15.00
Total Cost $631,110 $631.11Appurtenances Replacement Only (+40% Contingency & 20% Road Reinstatement) $113,182 $113.18
Type/Description Length (m) Each Unit Rate Cost / km Cost / m
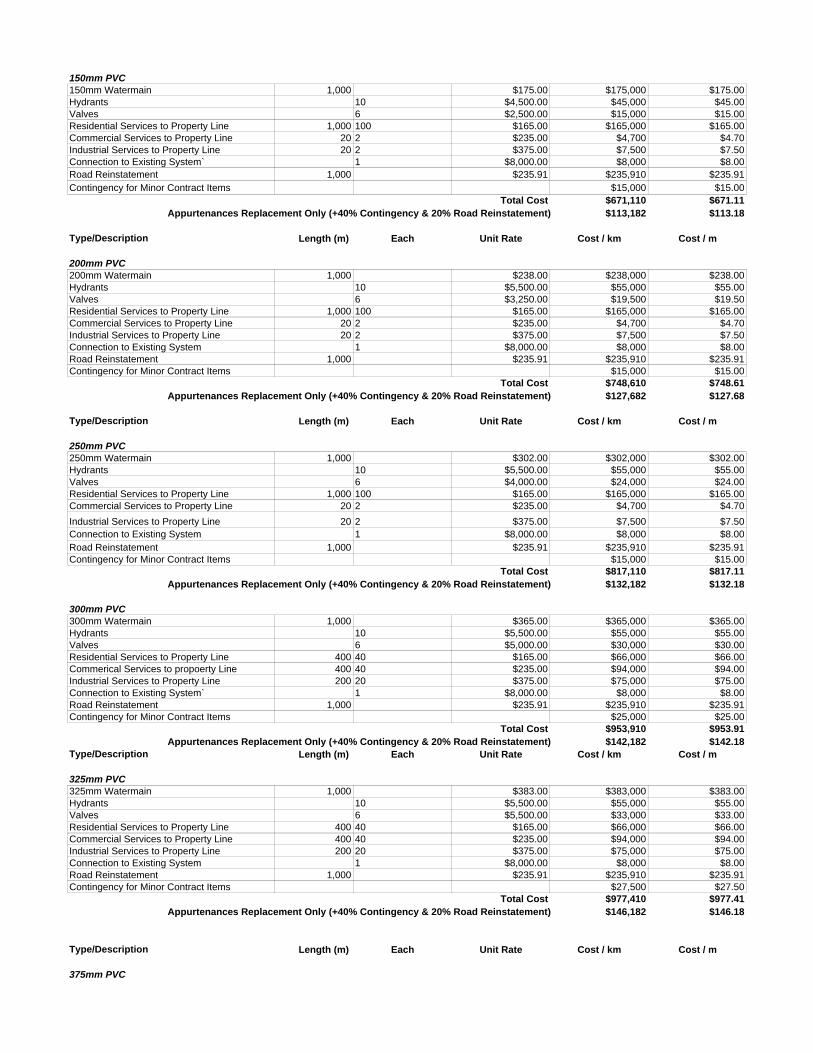
150mm PVC150mm Watermain 1,000 $175.00 $175,000 $175.00Hydrants 10 $4,500.00 $45,000 $45.00Valves 6 $2,500.00 $15,000 $15.00Residential Services to Property Line 1,000 100 $165.00 $165,000 $165.00Commercial Services to Property Line 20 2 $235.00 $4,700 $4.70Industrial Services to Property Line 20 2 $375.00 $7,500 $7.50Connection to Existing System` 1 $8,000.00 $8,000 $8.00Road Reinstatement 1,000 $235.91 $235,910 $235.91Contingency for Minor Contract Items $15,000 $15.00
Total Cost $671,110 $671.11Appurtenances Replacement Only (+40% Contingency & 20% Road Reinstatement) $113,182 $113.18
Type/Description Length (m) Each Unit Rate Cost / km Cost / m
200mm PVC200mm Watermain 1,000 $238.00 $238,000 $238.00Hydrants 10 $5,500.00 $55,000 $55.00Valves 6 $3,250.00 $19,500 $19.50Residential Services to Property Line 1,000 100 $165.00 $165,000 $165.00Commercial Services to Property Line 20 2 $235.00 $4,700 $4.70Industrial Services to Property Line 20 2 $375.00 $7,500 $7.50Connection to Existing System 1 $8,000.00 $8,000 $8.00Road Reinstatement 1,000 $235.91 $235,910 $235.91Contingency for Minor Contract Items $15,000 $15.00
Total Cost $748,610 $748.61Appurtenances Replacement Only (+40% Contingency & 20% Road Reinstatement) $127,682 $127.68
Type/Description Length (m) Each Unit Rate Cost / km Cost / m
250mm PVC250mm Watermain 1,000 $302.00 $302,000 $302.00Hydrants 10 $5,500.00 $55,000 $55.00Valves 6 $4,000.00 $24,000 $24.00Residential Services to Property Line 1,000 100 $165.00 $165,000 $165.00Commercial Services to Property Line 20 2 $235.00 $4,700 $4.70Industrial Services to Property Line 20 2 $375.00 $7,500 $7.50Connection to Existing System 1 $8,000.00 $8,000 $8.00Road Reinstatement 1,000 $235.91 $235,910 $235.91Contingency for Minor Contract Items $15,000 $15.00
Total Cost $817,110 $817.11Appurtenances Replacement Only (+40% Contingency & 20% Road Reinstatement) $132,182 $132.18
300mm PVC300mm Watermain 1,000 $365.00 $365,000 $365.00Hydrants 10 $5,500.00 $55,000 $55.00Valves 6 $5,000.00 $30,000 $30.00Residential Services to Property Line 400 40 $165.00 $66,000 $66.00Commerical Services to propoerty Line 400 40 $235.00 $94,000 $94.00Industrial Services to Property Line 200 20 $375.00 $75,000 $75.00Connection to Existing System` 1 $8,000.00 $8,000 $8.00Road Reinstatement 1,000 $235.91 $235,910 $235.91Contingency for Minor Contract Items $25,000 $25.00
Total Cost $953,910 $953.91Appurtenances Replacement Only (+40% Contingency & 20% Road Reinstatement) $142,182 $142.18
Type/Description Length (m) Each Unit Rate Cost / km Cost / m
325mm PVC325mm Watermain 1,000 $383.00 $383,000 $383.00Hydrants 10 $5,500.00 $55,000 $55.00Valves 6 $5,500.00 $33,000 $33.00Residential Services to Property Line 400 40 $165.00 $66,000 $66.00Commercial Services to Property Line 400 40 $235.00 $94,000 $94.00Industrial Services to Property Line 200 20 $375.00 $75,000 $75.00Connection to Existing System 1 $8,000.00 $8,000 $8.00Road Reinstatement 1,000 $235.91 $235,910 $235.91Contingency for Minor Contract Items $27,500 $27.50
Total Cost $977,410 $977.41Appurtenances Replacement Only (+40% Contingency & 20% Road Reinstatement) $146,182 $146.18
Type/Description Length (m) Each Unit Rate Cost / km Cost / m
375mm PVC
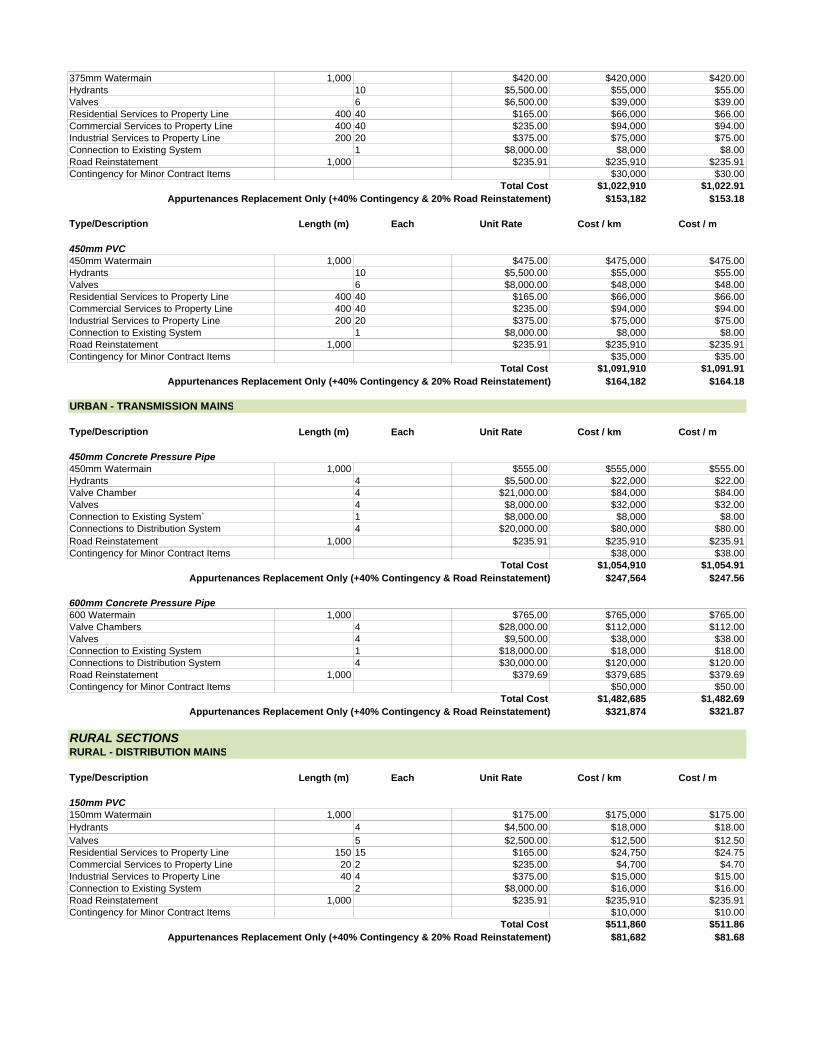
375mm Watermain 1,000 $420.00 $420,000 $420.00Hydrants 10 $5,500.00 $55,000 $55.00Valves 6 $6,500.00 $39,000 $39.00Residential Services to Property Line 400 40 $165.00 $66,000 $66.00Commercial Services to Property Line 400 40 $235.00 $94,000 $94.00Industrial Services to Property Line 200 20 $375.00 $75,000 $75.00Connection to Existing System 1 $8,000.00 $8,000 $8.00Road Reinstatement 1,000 $235.91 $235,910 $235.91Contingency for Minor Contract Items $30,000 $30.00
Total Cost $1,022,910 $1,022.91Appurtenances Replacement Only (+40% Contingency & 20% Road Reinstatement) $153,182 $153.18
Type/Description Length (m) Each Unit Rate Cost / km Cost / m
450mm PVC450mm Watermain 1,000 $475.00 $475,000 $475.00Hydrants 10 $5,500.00 $55,000 $55.00Valves 6 $8,000.00 $48,000 $48.00Residential Services to Property Line 400 40 $165.00 $66,000 $66.00Commercial Services to Property Line 400 40 $235.00 $94,000 $94.00Industrial Services to Property Line 200 20 $375.00 $75,000 $75.00Connection to Existing System 1 $8,000.00 $8,000 $8.00Road Reinstatement 1,000 $235.91 $235,910 $235.91Contingency for Minor Contract Items $35,000 $35.00
Total Cost $1,091,910 $1,091.91Appurtenances Replacement Only (+40% Contingency & 20% Road Reinstatement) $164,182 $164.18
URBAN - TRANSMISSION MAINS
Type/Description Length (m) Each Unit Rate Cost / km Cost / m
450mm Concrete Pressure Pipe450mm Watermain 1,000 $555.00 $555,000 $555.00Hydrants 4 $5,500.00 $22,000 $22.00Valve Chamber 4 $21,000.00 $84,000 $84.00Valves 4 $8,000.00 $32,000 $32.00Connection to Existing System` 1 $8,000.00 $8,000 $8.00Connections to Distribution System 4 $20,000.00 $80,000 $80.00Road Reinstatement 1,000 $235.91 $235,910 $235.91Contingency for Minor Contract Items $38,000 $38.00
Total Cost $1,054,910 $1,054.91Appurtenances Replacement Only (+40% Contingency & Road Reinstatement) $247,564 $247.56
600mm Concrete Pressure Pipe600 Watermain 1,000 $765.00 $765,000 $765.00Valve Chambers 4 $28,000.00 $112,000 $112.00Valves 4 $9,500.00 $38,000 $38.00Connection to Existing System 1 $18,000.00 $18,000 $18.00Connections to Distribution System 4 $30,000.00 $120,000 $120.00Road Reinstatement 1,000 $379.69 $379,685 $379.69Contingency for Minor Contract Items $50,000 $50.00
Total Cost $1,482,685 $1,482.69Appurtenances Replacement Only (+40% Contingency & Road Reinstatement) $321,874 $321.87
RURAL SECTIONSRURAL - DISTRIBUTION MAINS
Type/Description Length (m) Each Unit Rate Cost / km Cost / m
150mm PVC150mm Watermain 1,000 $175.00 $175,000 $175.00Hydrants 4 $4,500.00 $18,000 $18.00Valves 5 $2,500.00 $12,500 $12.50Residential Services to Property Line 150 15 $165.00 $24,750 $24.75Commercial Services to Property Line 20 2 $235.00 $4,700 $4.70Industrial Services to Property Line 40 4 $375.00 $15,000 $15.00Connection to Existing System 2 $8,000.00 $16,000 $16.00Road Reinstatement 1,000 $235.91 $235,910 $235.91Contingency for Minor Contract Items $10,000 $10.00
Total Cost $511,860 $511.86Appurtenances Replacement Only (+40% Contingency & 20% Road Reinstatement) $81,682 $81.68
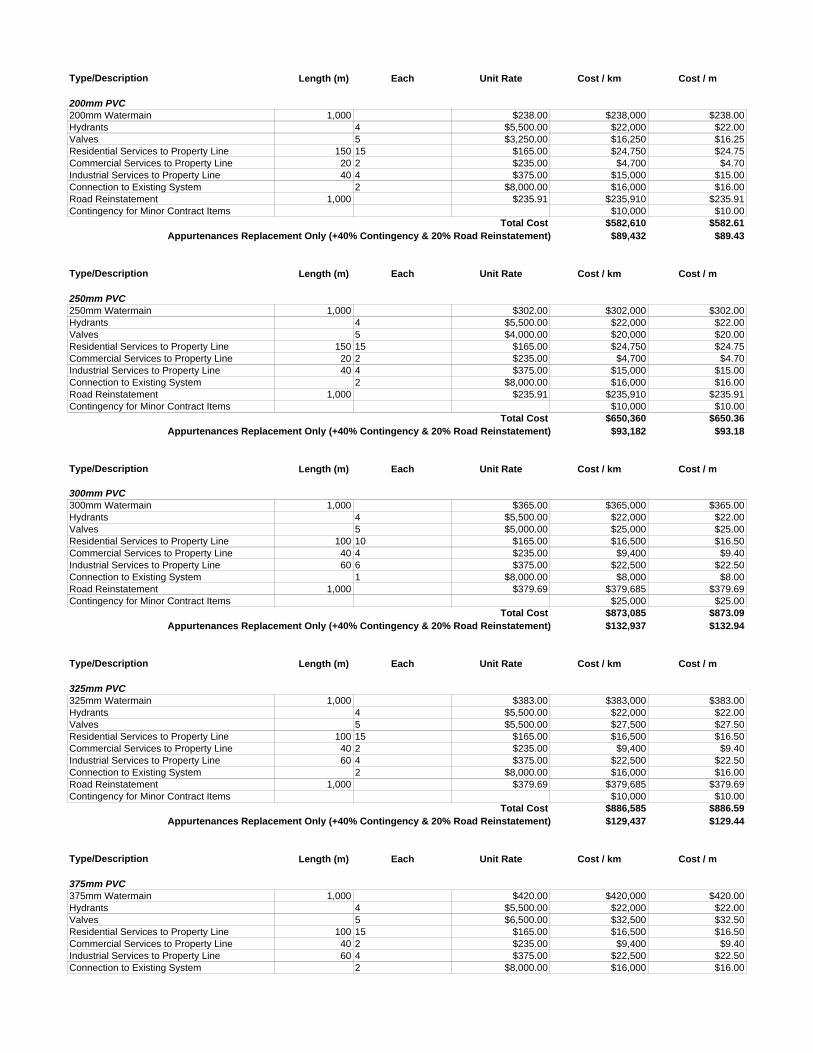
Type/Description Length (m) Each Unit Rate Cost / km Cost / m
200mm PVC200mm Watermain 1,000 $238.00 $238,000 $238.00Hydrants 4 $5,500.00 $22,000 $22.00Valves 5 $3,250.00 $16,250 $16.25Residential Services to Property Line 150 15 $165.00 $24,750 $24.75Commercial Services to Property Line 20 2 $235.00 $4,700 $4.70Industrial Services to Property Line 40 4 $375.00 $15,000 $15.00Connection to Existing System 2 $8,000.00 $16,000 $16.00Road Reinstatement 1,000 $235.91 $235,910 $235.91Contingency for Minor Contract Items $10,000 $10.00
Total Cost $582,610 $582.61Appurtenances Replacement Only (+40% Contingency & 20% Road Reinstatement) $89,432 $89.43
Type/Description Length (m) Each Unit Rate Cost / km Cost / m
250mm PVC250mm Watermain 1,000 $302.00 $302,000 $302.00Hydrants 4 $5,500.00 $22,000 $22.00Valves 5 $4,000.00 $20,000 $20.00Residential Services to Property Line 150 15 $165.00 $24,750 $24.75Commercial Services to Property Line 20 2 $235.00 $4,700 $4.70Industrial Services to Property Line 40 4 $375.00 $15,000 $15.00Connection to Existing System 2 $8,000.00 $16,000 $16.00Road Reinstatement 1,000 $235.91 $235,910 $235.91Contingency for Minor Contract Items $10,000 $10.00
Total Cost $650,360 $650.36Appurtenances Replacement Only (+40% Contingency & 20% Road Reinstatement) $93,182 $93.18
Type/Description Length (m) Each Unit Rate Cost / km Cost / m
300mm PVC300mm Watermain 1,000 $365.00 $365,000 $365.00Hydrants 4 $5,500.00 $22,000 $22.00Valves 5 $5,000.00 $25,000 $25.00Residential Services to Property Line 100 10 $165.00 $16,500 $16.50Commercial Services to Property Line 40 4 $235.00 $9,400 $9.40Industrial Services to Property Line 60 6 $375.00 $22,500 $22.50Connection to Existing System 1 $8,000.00 $8,000 $8.00Road Reinstatement 1,000 $379.69 $379,685 $379.69Contingency for Minor Contract Items $25,000 $25.00
Total Cost $873,085 $873.09Appurtenances Replacement Only (+40% Contingency & 20% Road Reinstatement) $132,937 $132.94
Type/Description Length (m) Each Unit Rate Cost / km Cost / m
325mm PVC325mm Watermain 1,000 $383.00 $383,000 $383.00Hydrants 4 $5,500.00 $22,000 $22.00Valves 5 $5,500.00 $27,500 $27.50Residential Services to Property Line 100 15 $165.00 $16,500 $16.50Commercial Services to Property Line 40 2 $235.00 $9,400 $9.40Industrial Services to Property Line 60 4 $375.00 $22,500 $22.50Connection to Existing System 2 $8,000.00 $16,000 $16.00Road Reinstatement 1,000 $379.69 $379,685 $379.69Contingency for Minor Contract Items $10,000 $10.00
Total Cost $886,585 $886.59Appurtenances Replacement Only (+40% Contingency & 20% Road Reinstatement) $129,437 $129.44
Type/Description Length (m) Each Unit Rate Cost / km Cost / m
375mm PVC375mm Watermain 1,000 $420.00 $420,000 $420.00Hydrants 4 $5,500.00 $22,000 $22.00Valves 5 $6,500.00 $32,500 $32.50Residential Services to Property Line 100 15 $165.00 $16,500 $16.50Commercial Services to Property Line 40 2 $235.00 $9,400 $9.40Industrial Services to Property Line 60 4 $375.00 $22,500 $22.50Connection to Existing System 2 $8,000.00 $16,000 $16.00
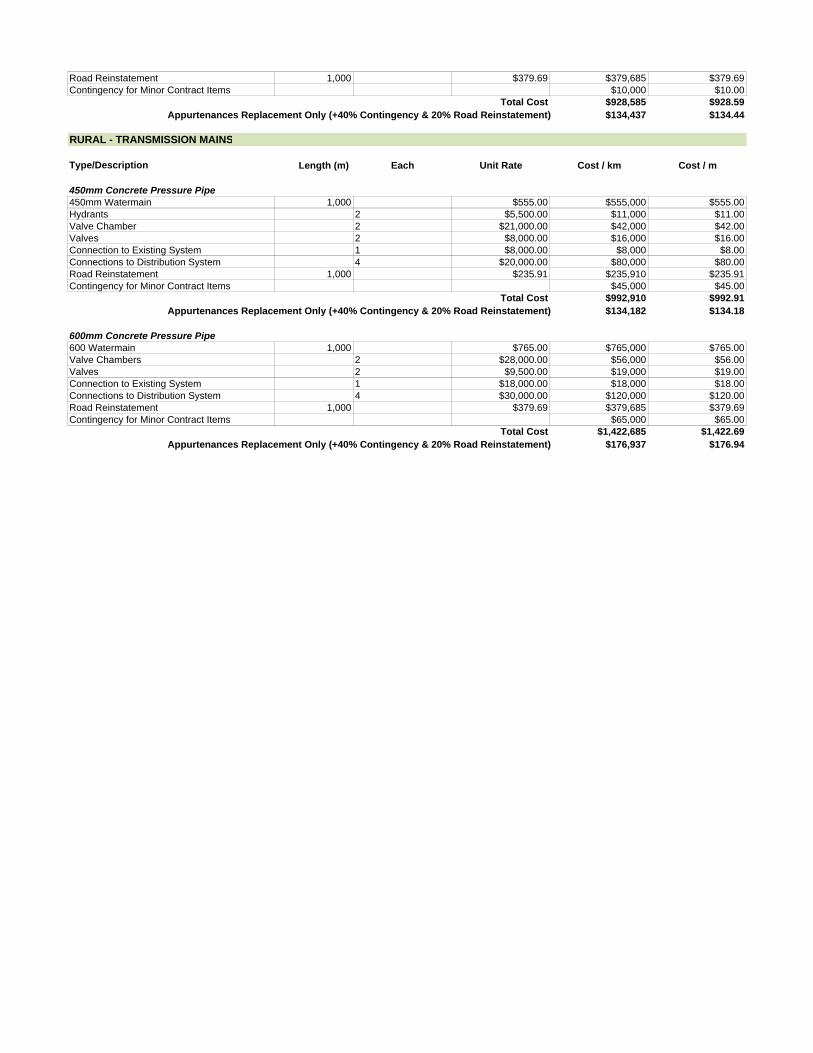
Road Reinstatement 1,000 $379.69 $379,685 $379.69Contingency for Minor Contract Items $10,000 $10.00
Total Cost $928,585 $928.59Appurtenances Replacement Only (+40% Contingency & 20% Road Reinstatement) $134,437 $134.44
RURAL - TRANSMISSION MAINS
Type/Description Length (m) Each Unit Rate Cost / km Cost / m
450mm Concrete Pressure Pipe450mm Watermain 1,000 $555.00 $555,000 $555.00Hydrants 2 $5,500.00 $11,000 $11.00Valve Chamber 2 $21,000.00 $42,000 $42.00Valves 2 $8,000.00 $16,000 $16.00Connection to Existing System 1 $8,000.00 $8,000 $8.00Connections to Distribution System 4 $20,000.00 $80,000 $80.00Road Reinstatement 1,000 $235.91 $235,910 $235.91Contingency for Minor Contract Items $45,000 $45.00
Total Cost $992,910 $992.91Appurtenances Replacement Only (+40% Contingency & 20% Road Reinstatement) $134,182 $134.18
600mm Concrete Pressure Pipe600 Watermain 1,000 $765.00 $765,000 $765.00Valve Chambers 2 $28,000.00 $56,000 $56.00Valves 2 $9,500.00 $19,000 $19.00Connection to Existing System 1 $18,000.00 $18,000 $18.00Connections to Distribution System 4 $30,000.00 $120,000 $120.00Road Reinstatement 1,000 $379.69 $379,685 $379.69Contingency for Minor Contract Items $65,000 $65.00
Total Cost $1,422,685 $1,422.69Appurtenances Replacement Only (+40% Contingency & 20% Road Reinstatement) $176,937 $176.94
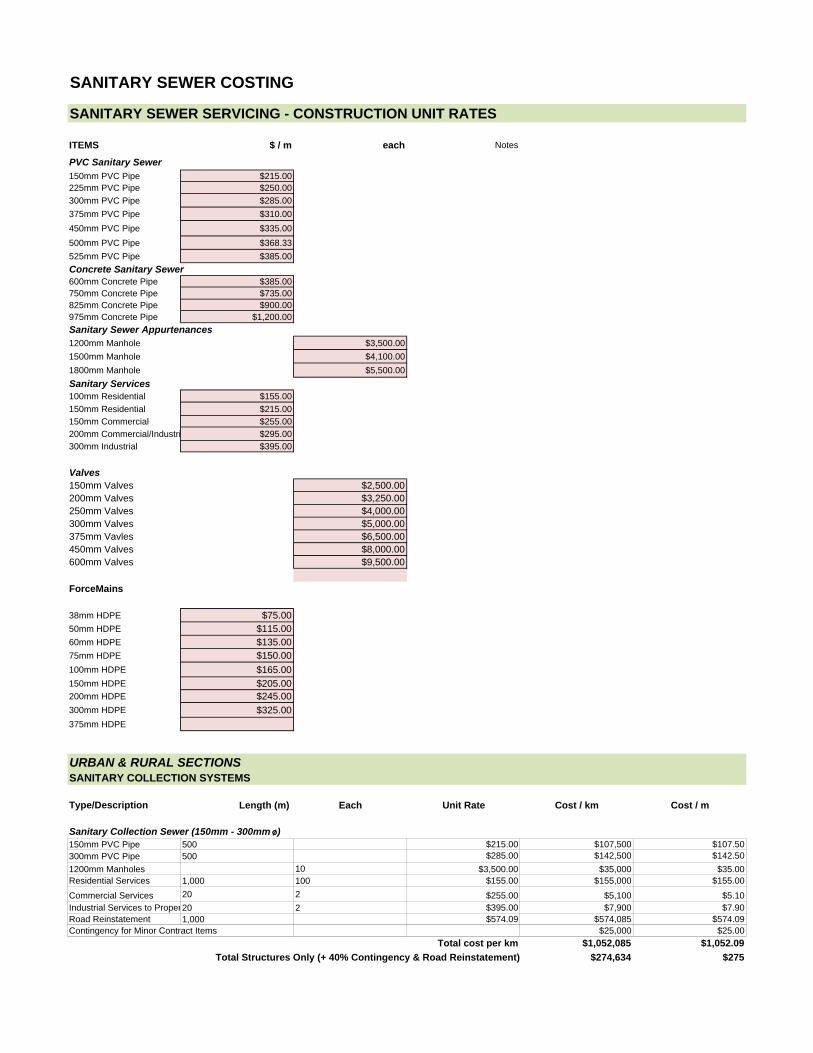
SANITARY SEWER COSTING
SANITARY SEWER SERVICING - CONSTRUCTION UNIT RATES
ITEMS $ / m each Notes
PVC Sanitary Sewer150mm PVC Pipe $215.00225mm PVC Pipe $250.00300mm PVC Pipe $285.00375mm PVC Pipe $310.00450mm PVC Pipe $335.00500mm PVC Pipe $368.33525mm PVC Pipe $385.00Concrete Sanitary Sewer600mm Concrete Pipe $385.00750mm Concrete Pipe $735.00825mm Concrete Pipe $900.00975mm Concrete Pipe $1,200.00Sanitary Sewer Appurtenances1200mm Manhole $3,500.001500mm Manhole $4,100.001800mm Manhole $5,500.00Sanitary Services100mm Residential $155.00150mm Residential $215.00150mm Commercial $255.00200mm Commercial/Industri $295.00300mm Industrial $395.00
Valves150mm Valves $2,500.00200mm Valves $3,250.00250mm Valves $4,000.00300mm Valves $5,000.00375mm Vavles $6,500.00450mm Valves $8,000.00600mm Valves $9,500.00
ForceMains
38mm HDPE $75.0050mm HDPE $115.0060mm HDPE $135.0075mm HDPE $150.00100mm HDPE $165.00150mm HDPE $205.00200mm HDPE $245.00300mm HDPE $325.00375mm HDPE
URBAN & RURAL SECTIONSSANITARY COLLECTION SYSTEMS
Type/Description Length (m) Each Unit Rate Cost / km Cost / m
Sanitary Collection Sewer (150mm - 300mmø)150mm PVC Pipe 500 $215.00 $107,500 $107.50300mm PVC Pipe 500 $285.00 $142,500 $142.501200mm Manholes 10 $3,500.00 $35,000 $35.00Residential Services 1,000 100 $155.00 $155,000 $155.00Commercial Services 20 2 $255.00 $5,100 $5.10Industrial Services to Proper20 2 $395.00 $7,900 $7.90Road Reinstatement 1,000 $574.09 $574,085 $574.09Contingency for Minor Contract Items $25,000 $25.00
Total cost per km $1,052,085 $1,052.09Total Structures Only (+ 40% Contingency & Road Reinstatement) $274,634 $275
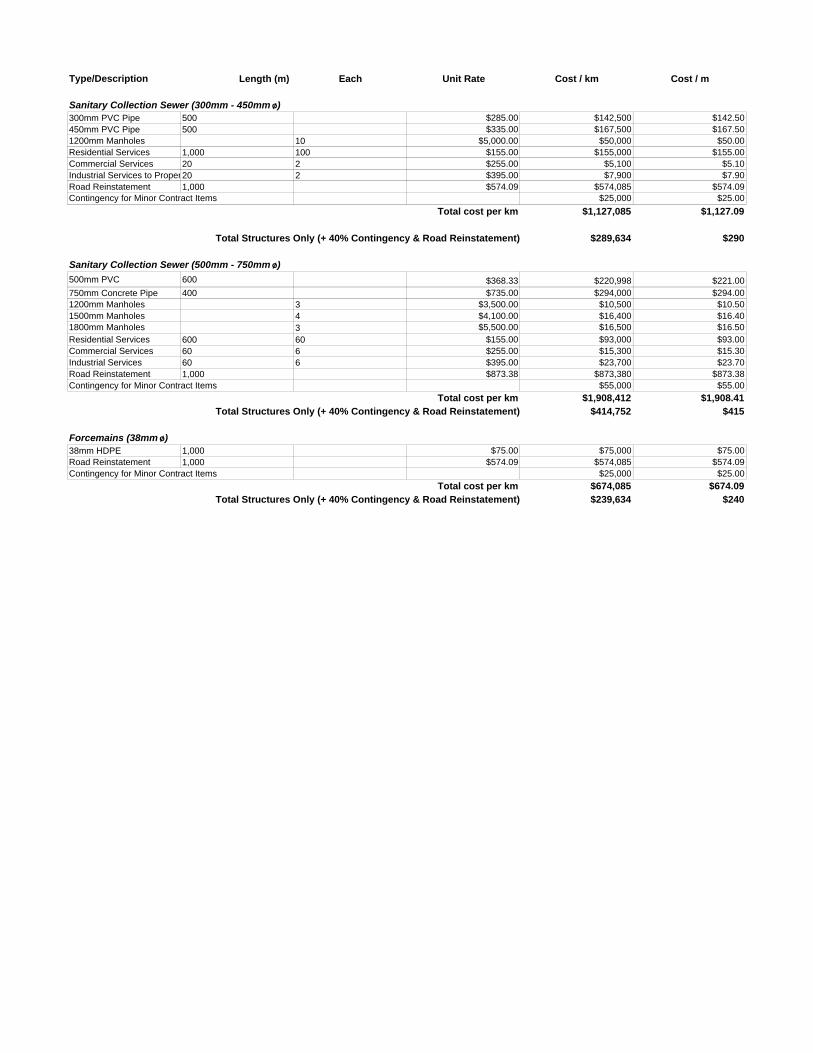
Type/Description Length (m) Each Unit Rate Cost / km Cost / m
Sanitary Collection Sewer (300mm - 450mmø)300mm PVC Pipe 500 $285.00 $142,500 $142.50450mm PVC Pipe 500 $335.00 $167,500 $167.501200mm Manholes 10 $5,000.00 $50,000 $50.00Residential Services 1,000 100 $155.00 $155,000 $155.00Commercial Services 20 2 $255.00 $5,100 $5.10Industrial Services to Proper20 2 $395.00 $7,900 $7.90Road Reinstatement 1,000 $574.09 $574,085 $574.09Contingency for Minor Contract Items $25,000 $25.00
Total cost per km $1,127,085 $1,127.09
Total Structures Only (+ 40% Contingency & Road Reinstatement) $289,634 $290
Sanitary Collection Sewer (500mm - 750mmø)500mm PVC 600 $368.33 $220,998 $221.00750mm Concrete Pipe 400 $735.00 $294,000 $294.001200mm Manholes 3 $3,500.00 $10,500 $10.501500mm Manholes 4 $4,100.00 $16,400 $16.401800mm Manholes 3 $5,500.00 $16,500 $16.50Residential Services 600 60 $155.00 $93,000 $93.00Commercial Services 60 6 $255.00 $15,300 $15.30Industrial Services 60 6 $395.00 $23,700 $23.70Road Reinstatement 1,000 $873.38 $873,380 $873.38Contingency for Minor Contract Items $55,000 $55.00
Total cost per km $1,908,412 $1,908.41Total Structures Only (+ 40% Contingency & Road Reinstatement) $414,752 $415
Forcemains (38mm ø)38mm HDPE 1,000 $75.00 $75,000 $75.00Road Reinstatement 1,000 $574.09 $574,085 $574.09Contingency for Minor Contract Items $25,000 $25.00
Total cost per km $674,085 $674.09Total Structures Only (+ 40% Contingency & Road Reinstatement) $239,634 $240
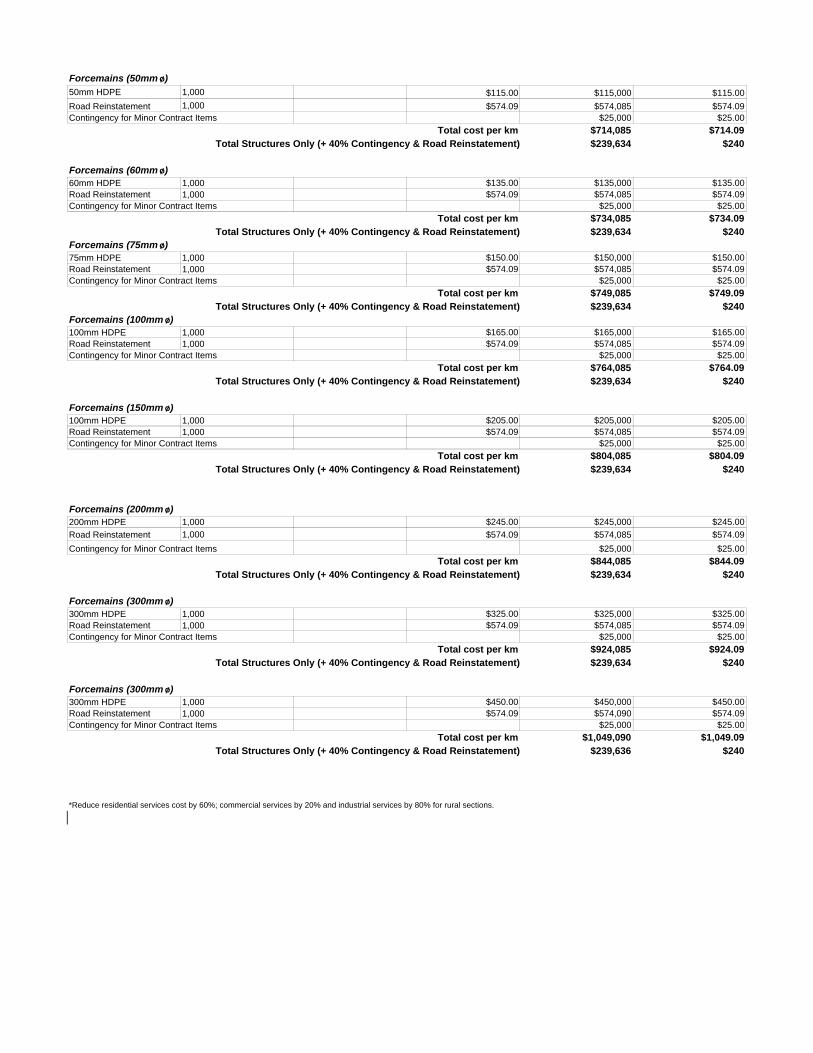
Forcemains (50mm ø)50mm HDPE 1,000 $115.00 $115,000 $115.00Road Reinstatement 1,000 $574.09 $574,085 $574.09Contingency for Minor Contract Items $25,000 $25.00
Total cost per km $714,085 $714.09Total Structures Only (+ 40% Contingency & Road Reinstatement) $239,634 $240
Forcemains (60mm ø)60mm HDPE 1,000 $135.00 $135,000 $135.00Road Reinstatement 1,000 $574.09 $574,085 $574.09Contingency for Minor Contract Items $25,000 $25.00
Total cost per km $734,085 $734.09Total Structures Only (+ 40% Contingency & Road Reinstatement) $239,634 $240
Forcemains (75mm ø)75mm HDPE 1,000 $150.00 $150,000 $150.00Road Reinstatement 1,000 $574.09 $574,085 $574.09Contingency for Minor Contract Items $25,000 $25.00
Total cost per km $749,085 $749.09Total Structures Only (+ 40% Contingency & Road Reinstatement) $239,634 $240
Forcemains (100mm ø)100mm HDPE 1,000 $165.00 $165,000 $165.00Road Reinstatement 1,000 $574.09 $574,085 $574.09Contingency for Minor Contract Items $25,000 $25.00
Total cost per km $764,085 $764.09Total Structures Only (+ 40% Contingency & Road Reinstatement) $239,634 $240
Forcemains (150mm ø)100mm HDPE 1,000 $205.00 $205,000 $205.00Road Reinstatement 1,000 $574.09 $574,085 $574.09Contingency for Minor Contract Items $25,000 $25.00
Total cost per km $804,085 $804.09Total Structures Only (+ 40% Contingency & Road Reinstatement) $239,634 $240
Forcemains (200mm ø)200mm HDPE 1,000 $245.00 $245,000 $245.00Road Reinstatement 1,000 $574.09 $574,085 $574.09Contingency for Minor Contract Items $25,000 $25.00
Total cost per km $844,085 $844.09Total Structures Only (+ 40% Contingency & Road Reinstatement) $239,634 $240
Forcemains (300mm ø)300mm HDPE 1,000 $325.00 $325,000 $325.00Road Reinstatement 1,000 $574.09 $574,085 $574.09Contingency for Minor Contract Items $25,000 $25.00
Total cost per km $924,085 $924.09Total Structures Only (+ 40% Contingency & Road Reinstatement) $239,634 $240
Forcemains (300mm ø)300mm HDPE 1,000 $450.00 $450,000 $450.00Road Reinstatement 1,000 $574.09 $574,090 $574.09Contingency for Minor Contract Items $25,000 $25.00
Total cost per km $1,049,090 $1,049.09Total Structures Only (+ 40% Contingency & Road Reinstatement) $239,636 $240
*Reduce residential services cost by 60%; commercial services by 20% and industrial services by 80% for rural sections.
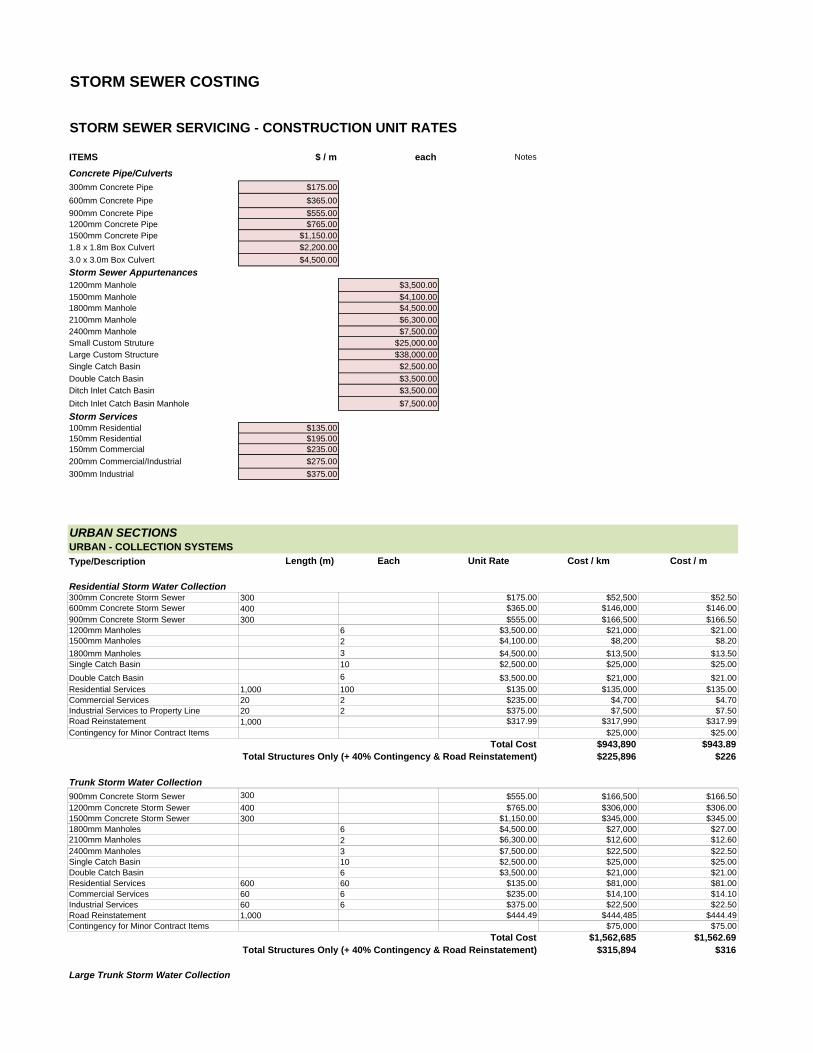
STORM SEWER COSTING
STORM SEWER SERVICING - CONSTRUCTION UNIT RATES
ITEMS $ / m each Notes
Concrete Pipe/Culverts300mm Concrete Pipe $175.00600mm Concrete Pipe $365.00900mm Concrete Pipe $555.001200mm Concrete Pipe $765.001500mm Concrete Pipe $1,150.001.8 x 1.8m Box Culvert $2,200.003.0 x 3.0m Box Culvert $4,500.00Storm Sewer Appurtenances1200mm Manhole $3,500.001500mm Manhole $4,100.001800mm Manhole $4,500.002100mm Manhole $6,300.002400mm Manhole $7,500.00Small Custom Struture $25,000.00Large Custom Structure $38,000.00Single Catch Basin $2,500.00Double Catch Basin $3,500.00Ditch Inlet Catch Basin $3,500.00Ditch Inlet Catch Basin Manhole $7,500.00Storm Services100mm Residential $135.00150mm Residential $195.00150mm Commercial $235.00200mm Commercial/Industrial $275.00300mm Industrial $375.00
URBAN SECTIONSURBAN - COLLECTION SYSTEMSType/Description Length (m) Each Unit Rate Cost / km Cost / m
Residential Storm Water Collection300mm Concrete Storm Sewer 300 $175.00 $52,500 $52.50600mm Concrete Storm Sewer 400 $365.00 $146,000 $146.00900mm Concrete Storm Sewer 300 $555.00 $166,500 $166.501200mm Manholes 6 $3,500.00 $21,000 $21.001500mm Manholes 2 $4,100.00 $8,200 $8.201800mm Manholes 3 $4,500.00 $13,500 $13.50Single Catch Basin 10 $2,500.00 $25,000 $25.00Double Catch Basin 6 $3,500.00 $21,000 $21.00Residential Services 1,000 100 $135.00 $135,000 $135.00Commercial Services 20 2 $235.00 $4,700 $4.70Industrial Services to Property Line 20 2 $375.00 $7,500 $7.50Road Reinstatement 1,000 $317.99 $317,990 $317.99Contingency for Minor Contract Items $25,000 $25.00
Total Cost $943,890 $943.89Total Structures Only (+ 40% Contingency & Road Reinstatement) $225,896 $226
Trunk Storm Water Collection900mm Concrete Storm Sewer 300 $555.00 $166,500 $166.501200mm Concrete Storm Sewer 400 $765.00 $306,000 $306.001500mm Concrete Storm Sewer 300 $1,150.00 $345,000 $345.001800mm Manholes 6 $4,500.00 $27,000 $27.002100mm Manholes 2 $6,300.00 $12,600 $12.602400mm Manholes 3 $7,500.00 $22,500 $22.50Single Catch Basin 10 $2,500.00 $25,000 $25.00Double Catch Basin 6 $3,500.00 $21,000 $21.00Residential Services 600 60 $135.00 $81,000 $81.00Commercial Services 60 6 $235.00 $14,100 $14.10Industrial Services 60 6 $375.00 $22,500 $22.50Road Reinstatement 1,000 $444.49 $444,485 $444.49Contingency for Minor Contract Items $75,000 $75.00
Total Cost $1,562,685 $1,562.69Total Structures Only (+ 40% Contingency & Road Reinstatement) $315,894 $316
Large Trunk Storm Water Collection
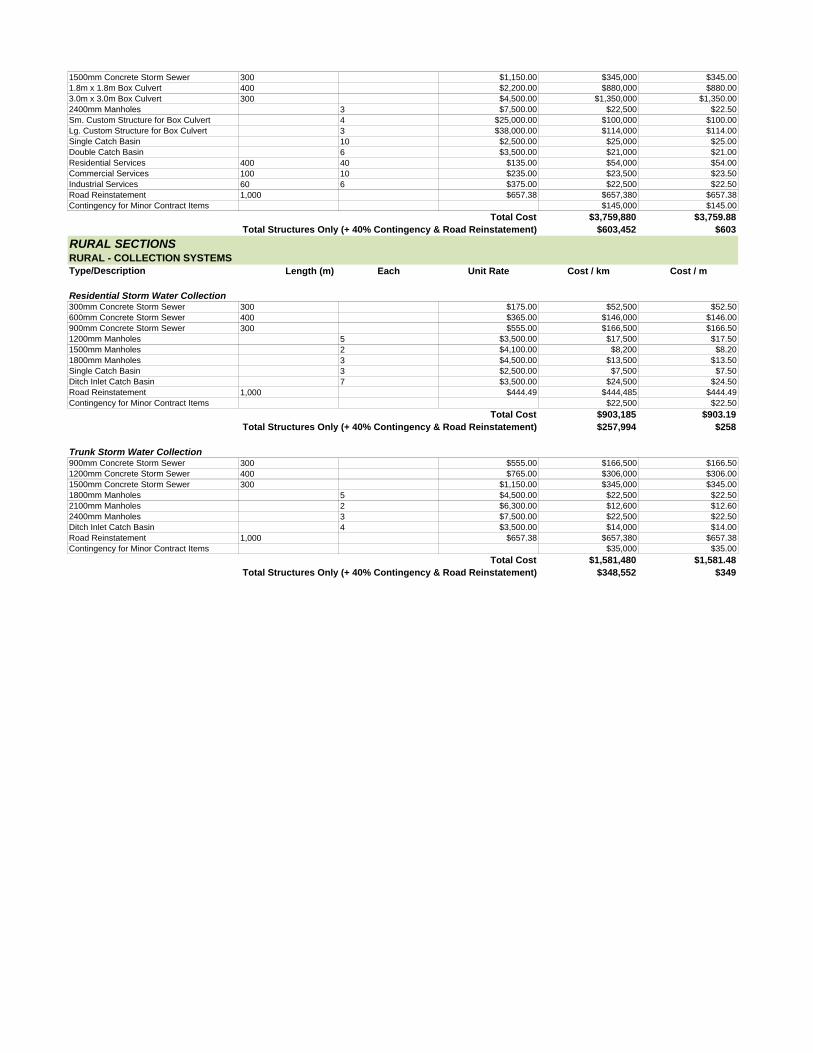
1500mm Concrete Storm Sewer 300 $1,150.00 $345,000 $345.001.8m x 1.8m Box Culvert 400 $2,200.00 $880,000 $880.003.0m x 3.0m Box Culvert 300 $4,500.00 $1,350,000 $1,350.002400mm Manholes 3 $7,500.00 $22,500 $22.50Sm. Custom Structure for Box Culvert 4 $25,000.00 $100,000 $100.00Lg. Custom Structure for Box Culvert 3 $38,000.00 $114,000 $114.00Single Catch Basin 10 $2,500.00 $25,000 $25.00Double Catch Basin 6 $3,500.00 $21,000 $21.00Residential Services 400 40 $135.00 $54,000 $54.00Commercial Services 100 10 $235.00 $23,500 $23.50Industrial Services 60 6 $375.00 $22,500 $22.50Road Reinstatement 1,000 $657.38 $657,380 $657.38Contingency for Minor Contract Items $145,000 $145.00
Total Cost $3,759,880 $3,759.88Total Structures Only (+ 40% Contingency & Road Reinstatement) $603,452 $603
RURAL SECTIONSRURAL - COLLECTION SYSTEMSType/Description Length (m) Each Unit Rate Cost / km Cost / m
Residential Storm Water Collection300mm Concrete Storm Sewer 300 $175.00 $52,500 $52.50600mm Concrete Storm Sewer 400 $365.00 $146,000 $146.00900mm Concrete Storm Sewer 300 $555.00 $166,500 $166.501200mm Manholes 5 $3,500.00 $17,500 $17.501500mm Manholes 2 $4,100.00 $8,200 $8.201800mm Manholes 3 $4,500.00 $13,500 $13.50Single Catch Basin 3 $2,500.00 $7,500 $7.50Ditch Inlet Catch Basin 7 $3,500.00 $24,500 $24.50Road Reinstatement 1,000 $444.49 $444,485 $444.49Contingency for Minor Contract Items $22,500 $22.50
Total Cost $903,185 $903.19Total Structures Only (+ 40% Contingency & Road Reinstatement) $257,994 $258
Trunk Storm Water Collection900mm Concrete Storm Sewer 300 $555.00 $166,500 $166.501200mm Concrete Storm Sewer 400 $765.00 $306,000 $306.001500mm Concrete Storm Sewer 300 $1,150.00 $345,000 $345.001800mm Manholes 5 $4,500.00 $22,500 $22.502100mm Manholes 2 $6,300.00 $12,600 $12.602400mm Manholes 3 $7,500.00 $22,500 $22.50Ditch Inlet Catch Basin 4 $3,500.00 $14,000 $14.00Road Reinstatement 1,000 $657.38 $657,380 $657.38Contingency for Minor Contract Items $35,000 $35.00
Total Cost $1,581,480 $1,581.48Total Structures Only (+ 40% Contingency & Road Reinstatement) $348,552 $349

Asset Management PlanningAsset Management Planning for the Township of Chapleau
Appendix IAppendix IInfrastructure Priority Classifications
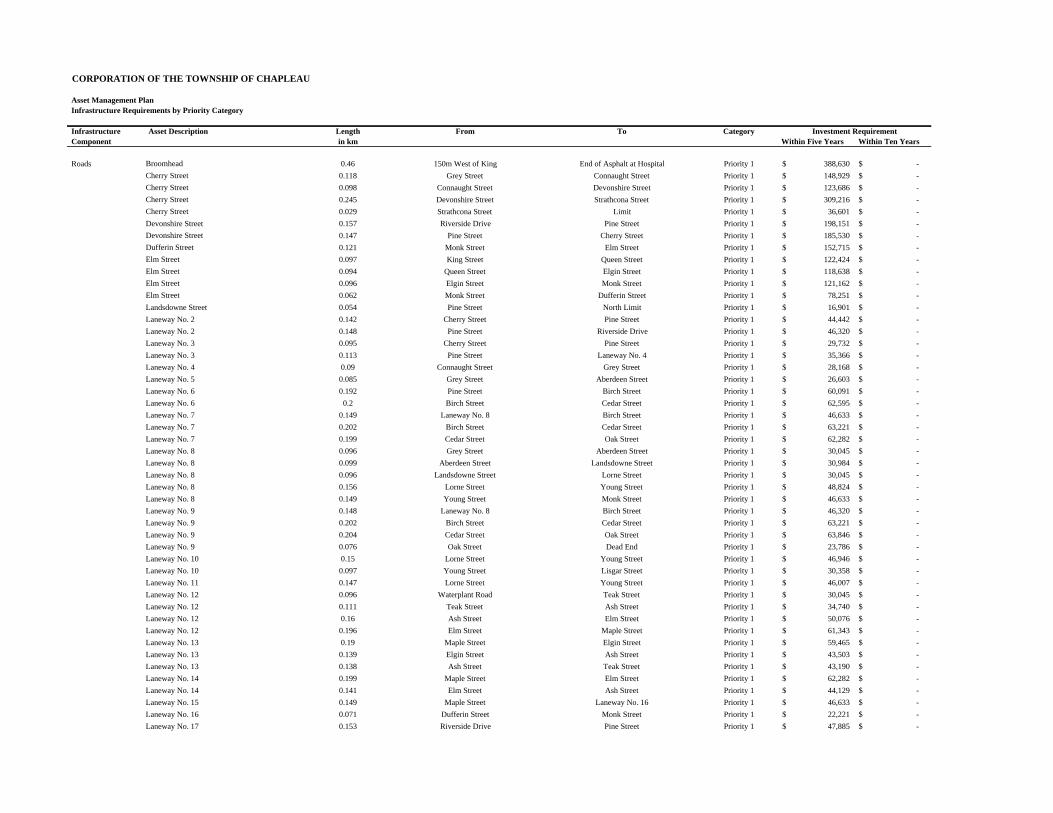
CORPORATION OF THE TOWNSHIP OF CHAPLEAU
Asset Management PlanInfrastructure Requirements by Priority Category
Infrastructure Asset Description Length From To CategoryComponent in km Within Five Years Within Ten Years
Roads Broomhead 0.46 150m West of King End of Asphalt at Hospital Priority 1 388,630$ -$ Cherry Street 0.118 Grey Street Connaught Street Priority 1 148,929$ -$ Cherry Street 0.098 Connaught Street Devonshire Street Priority 1 123,686$ -$ Cherry Street 0.245 Devonshire Street Strathcona Street Priority 1 309,216$ -$ Cherry Street 0.029 Strathcona Street Limit Priority 1 36,601$ -$ Devonshire Street 0.157 Riverside Drive Pine Street Priority 1 198,151$ -$ Devonshire Street 0.147 Pine Street Cherry Street Priority 1 185,530$ -$ Dufferin Street 0.121 Monk Street Elm Street Priority 1 152,715$ -$ Elm Street 0.097 King Street Queen Street Priority 1 122,424$ -$ Elm Street 0.094 Queen Street Elgin Street Priority 1 118,638$ -$ Elm Street 0.096 Elgin Street Monk Street Priority 1 121,162$ -$ Elm Street 0.062 Monk Street Dufferin Street Priority 1 78,251$ -$ Landsdowne Street 0.054 Pine Street North Limit Priority 1 16,901$ -$ Laneway No. 2 0.142 Cherry Street Pine Street Priority 1 44,442$ -$ Laneway No. 2 0.148 Pine Street Riverside Drive Priority 1 46,320$ -$ Laneway No. 3 0.095 Cherry Street Pine Street Priority 1 29,732$ -$ Laneway No. 3 0.113 Pine Street Laneway No. 4 Priority 1 35,366$ -$ Laneway No. 4 0.09 Connaught Street Grey Street Priority 1 28,168$ -$ Laneway No. 5 0.085 Grey Street Aberdeen Street Priority 1 26,603$ -$ Laneway No. 6 0.192 Pine Street Birch Street Priority 1 60,091$ -$ Laneway No. 6 0.2 Birch Street Cedar Street Priority 1 62,595$ -$ Laneway No. 7 0.149 Laneway No. 8 Birch Street Priority 1 46,633$ -$ Laneway No. 7 0.202 Birch Street Cedar Street Priority 1 63,221$ -$ Laneway No. 7 0.199 Cedar Street Oak Street Priority 1 62,282$ -$ Laneway No. 8 0.096 Grey Street Aberdeen Street Priority 1 30,045$ -$ Laneway No. 8 0.099 Aberdeen Street Landsdowne Street Priority 1 30,984$ -$ Laneway No. 8 0.096 Landsdowne Street Lorne Street Priority 1 30,045$ -$ Laneway No. 8 0.156 Lorne Street Young Street Priority 1 48,824$ -$ Laneway No. 8 0.149 Young Street Monk Street Priority 1 46,633$ -$ Laneway No. 9 0.148 Laneway No. 8 Birch Street Priority 1 46,320$ -$ Laneway No. 9 0.202 Birch Street Cedar Street Priority 1 63,221$ -$ Laneway No. 9 0.204 Cedar Street Oak Street Priority 1 63,846$ -$ Laneway No. 9 0.076 Oak Street Dead End Priority 1 23,786$ -$ Laneway No. 10 0.15 Lorne Street Young Street Priority 1 46,946$ -$ Laneway No. 10 0.097 Young Street Lisgar Street Priority 1 30,358$ -$ Laneway No. 11 0.147 Lorne Street Young Street Priority 1 46,007$ -$ Laneway No. 12 0.096 Waterplant Road Teak Street Priority 1 30,045$ -$ Laneway No. 12 0.111 Teak Street Ash Street Priority 1 34,740$ -$ Laneway No. 12 0.16 Ash Street Elm Street Priority 1 50,076$ -$ Laneway No. 12 0.196 Elm Street Maple Street Priority 1 61,343$ -$ Laneway No. 13 0.19 Maple Street Elgin Street Priority 1 59,465$ -$ Laneway No. 13 0.139 Elgin Street Ash Street Priority 1 43,503$ -$ Laneway No. 13 0.138 Ash Street Teak Street Priority 1 43,190$ -$ Laneway No. 14 0.199 Maple Street Elm Street Priority 1 62,282$ -$ Laneway No. 14 0.141 Elm Street Ash Street Priority 1 44,129$ -$ Laneway No. 15 0.149 Maple Street Laneway No. 16 Priority 1 46,633$ -$ Laneway No. 16 0.071 Dufferin Street Monk Street Priority 1 22,221$ -$ Laneway No. 17 0.153 Riverside Drive Pine Street Priority 1 47,885$ -$
Investment Requirement
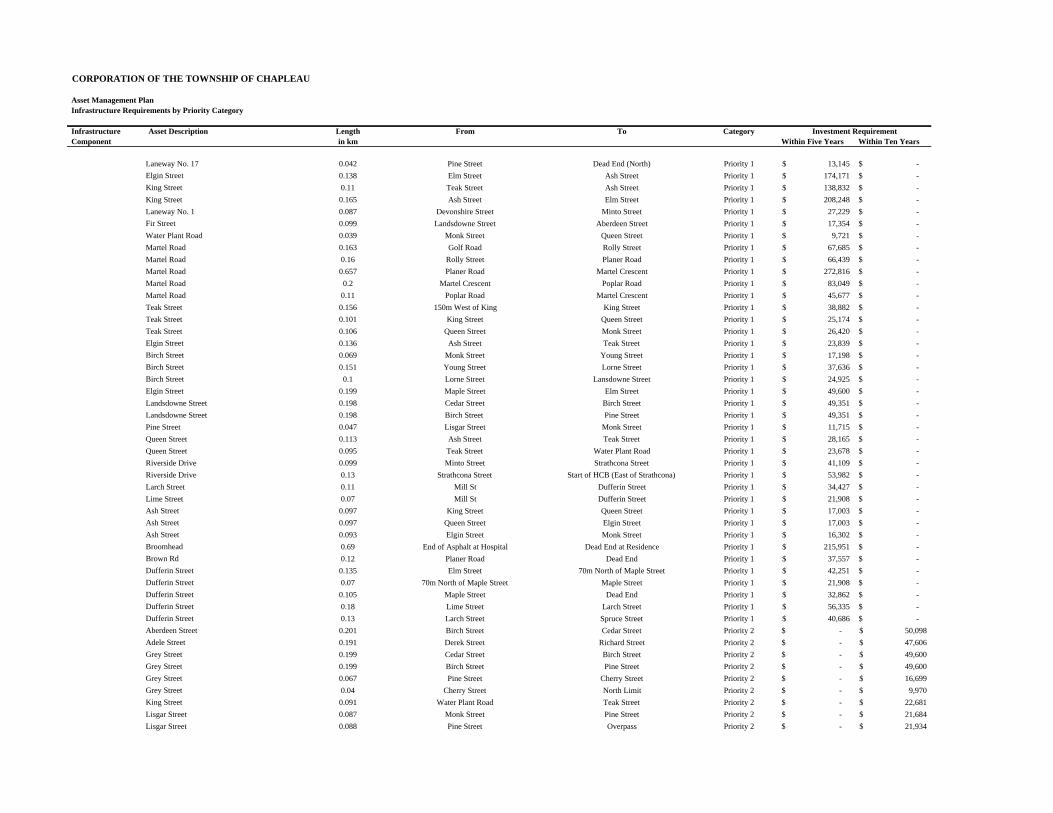
CORPORATION OF THE TOWNSHIP OF CHAPLEAU
Asset Management PlanInfrastructure Requirements by Priority Category
Infrastructure Asset Description Length From To CategoryComponent in km Within Five Years Within Ten Years
Investment Requirement
Laneway No. 17 0.042 Pine Street Dead End (North) Priority 1 13,145$ -$ Elgin Street 0.138 Elm Street Ash Street Priority 1 174,171$ -$ King Street 0.11 Teak Street Ash Street Priority 1 138,832$ -$ King Street 0.165 Ash Street Elm Street Priority 1 208,248$ -$ Laneway No. 1 0.087 Devonshire Street Minto Street Priority 1 27,229$ -$ Fir Street 0.099 Landsdowne Street Aberdeen Street Priority 1 17,354$ -$ Water Plant Road 0.039 Monk Street Queen Street Priority 1 9,721$ -$ Martel Road 0.163 Golf Road Rolly Street Priority 1 67,685$ -$ Martel Road 0.16 Rolly Street Planer Road Priority 1 66,439$ -$ Martel Road 0.657 Planer Road Martel Crescent Priority 1 272,816$ -$ Martel Road 0.2 Martel Crescent Poplar Road Priority 1 83,049$ -$ Martel Road 0.11 Poplar Road Martel Crescent Priority 1 45,677$ -$ Teak Street 0.156 150m West of King King Street Priority 1 38,882$ -$ Teak Street 0.101 King Street Queen Street Priority 1 25,174$ -$ Teak Street 0.106 Queen Street Monk Street Priority 1 26,420$ -$ Elgin Street 0.136 Ash Street Teak Street Priority 1 23,839$ -$ Birch Street 0.069 Monk Street Young Street Priority 1 17,198$ -$ Birch Street 0.151 Young Street Lorne Street Priority 1 37,636$ -$ Birch Street 0.1 Lorne Street Lansdowne Street Priority 1 24,925$ -$ Elgin Street 0.199 Maple Street Elm Street Priority 1 49,600$ -$ Landsdowne Street 0.198 Cedar Street Birch Street Priority 1 49,351$ -$ Landsdowne Street 0.198 Birch Street Pine Street Priority 1 49,351$ -$ Pine Street 0.047 Lisgar Street Monk Street Priority 1 11,715$ -$ Queen Street 0.113 Ash Street Teak Street Priority 1 28,165$ -$ Queen Street 0.095 Teak Street Water Plant Road Priority 1 23,678$ -$ Riverside Drive 0.099 Minto Street Strathcona Street Priority 1 41,109$ -$ Riverside Drive 0.13 Strathcona Street Start of HCB (East of Strathcona) Priority 1 53,982$ -$ Larch Street 0.11 Mill St Dufferin Street Priority 1 34,427$ -$ Lime Street 0.07 Mill St Dufferin Street Priority 1 21,908$ -$ Ash Street 0.097 King Street Queen Street Priority 1 17,003$ -$ Ash Street 0.097 Queen Street Elgin Street Priority 1 17,003$ -$ Ash Street 0.093 Elgin Street Monk Street Priority 1 16,302$ -$ Broomhead 0.69 End of Asphalt at Hospital Dead End at Residence Priority 1 215,951$ -$ Brown Rd 0.12 Planer Road Dead End Priority 1 37,557$ -$ Dufferin Street 0.135 Elm Street 70m North of Maple Street Priority 1 42,251$ -$ Dufferin Street 0.07 70m North of Maple Street Maple Street Priority 1 21,908$ -$ Dufferin Street 0.105 Maple Street Dead End Priority 1 32,862$ -$ Dufferin Street 0.18 Lime Street Larch Street Priority 1 56,335$ -$ Dufferin Street 0.13 Larch Street Spruce Street Priority 1 40,686$ -$ Aberdeen Street 0.201 Birch Street Cedar Street Priority 2 -$ 50,098$ Adele Street 0.191 Derek Street Richard Street Priority 2 -$ 47,606$ Grey Street 0.199 Cedar Street Birch Street Priority 2 -$ 49,600$ Grey Street 0.199 Birch Street Pine Street Priority 2 -$ 49,600$ Grey Street 0.067 Pine Street Cherry Street Priority 2 -$ 16,699$ Grey Street 0.04 Cherry Street North Limit Priority 2 -$ 9,970$ King Street 0.091 Water Plant Road Teak Street Priority 2 -$ 22,681$ Lisgar Street 0.087 Monk Street Pine Street Priority 2 -$ 21,684$ Lisgar Street 0.088 Pine Street Overpass Priority 2 -$ 21,934$
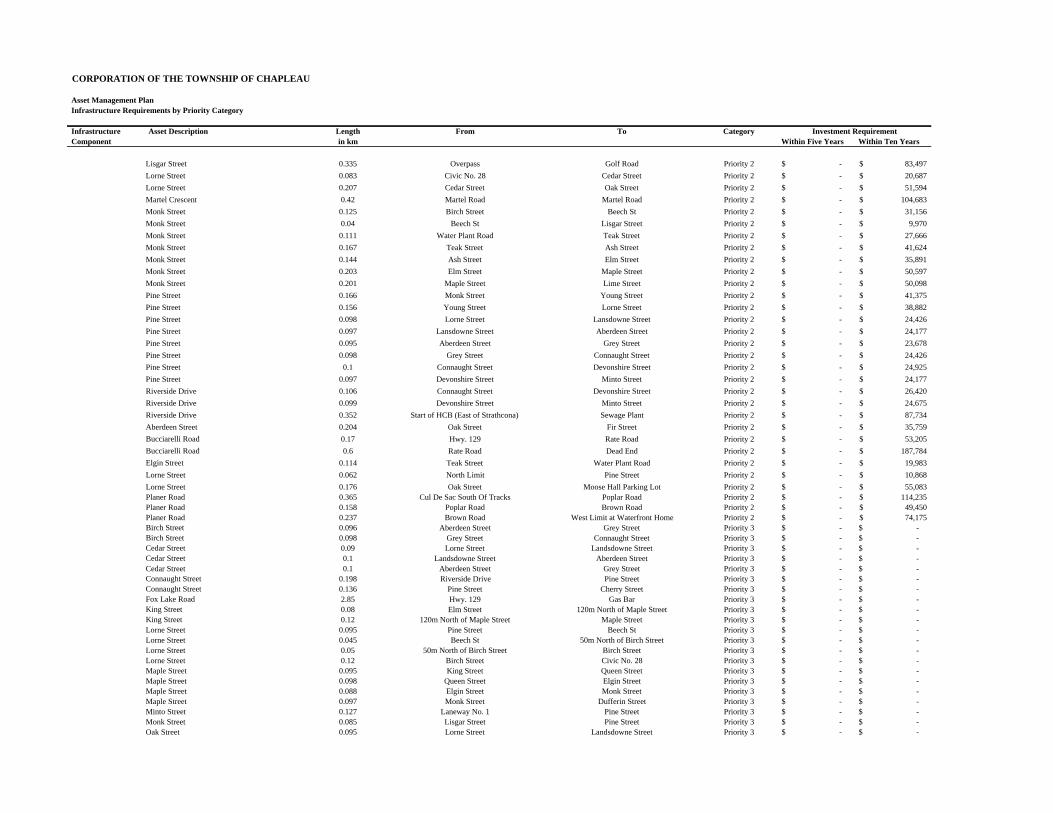
CORPORATION OF THE TOWNSHIP OF CHAPLEAU
Asset Management PlanInfrastructure Requirements by Priority Category
Infrastructure Asset Description Length From To CategoryComponent in km Within Five Years Within Ten Years
Investment Requirement
Lisgar Street 0.335 Overpass Golf Road Priority 2 -$ 83,497$ Lorne Street 0.083 Civic No. 28 Cedar Street Priority 2 -$ 20,687$ Lorne Street 0.207 Cedar Street Oak Street Priority 2 -$ 51,594$ Martel Crescent 0.42 Martel Road Martel Road Priority 2 -$ 104,683$ Monk Street 0.125 Birch Street Beech St Priority 2 -$ 31,156$ Monk Street 0.04 Beech St Lisgar Street Priority 2 -$ 9,970$ Monk Street 0.111 Water Plant Road Teak Street Priority 2 -$ 27,666$ Monk Street 0.167 Teak Street Ash Street Priority 2 -$ 41,624$ Monk Street 0.144 Ash Street Elm Street Priority 2 -$ 35,891$ Monk Street 0.203 Elm Street Maple Street Priority 2 -$ 50,597$ Monk Street 0.201 Maple Street Lime Street Priority 2 -$ 50,098$ Pine Street 0.166 Monk Street Young Street Priority 2 -$ 41,375$ Pine Street 0.156 Young Street Lorne Street Priority 2 -$ 38,882$ Pine Street 0.098 Lorne Street Lansdowne Street Priority 2 -$ 24,426$ Pine Street 0.097 Lansdowne Street Aberdeen Street Priority 2 -$ 24,177$ Pine Street 0.095 Aberdeen Street Grey Street Priority 2 -$ 23,678$ Pine Street 0.098 Grey Street Connaught Street Priority 2 -$ 24,426$ Pine Street 0.1 Connaught Street Devonshire Street Priority 2 -$ 24,925$ Pine Street 0.097 Devonshire Street Minto Street Priority 2 -$ 24,177$ Riverside Drive 0.106 Connaught Street Devonshire Street Priority 2 -$ 26,420$ Riverside Drive 0.099 Devonshire Street Minto Street Priority 2 -$ 24,675$ Riverside Drive 0.352 Start of HCB (East of Strathcona) Sewage Plant Priority 2 -$ 87,734$ Aberdeen Street 0.204 Oak Street Fir Street Priority 2 -$ 35,759$ Bucciarelli Road 0.17 Hwy. 129 Rate Road Priority 2 -$ 53,205$ Bucciarelli Road 0.6 Rate Road Dead End Priority 2 -$ 187,784$ Elgin Street 0.114 Teak Street Water Plant Road Priority 2 -$ 19,983$ Lorne Street 0.062 North Limit Pine Street Priority 2 -$ 10,868$ Lorne Street 0.176 Oak Street Moose Hall Parking Lot Priority 2 -$ 55,083$ Planer Road 0.365 Cul De Sac South Of Tracks Poplar Road Priority 2 -$ 114,235$ Planer Road 0.158 Poplar Road Brown Road Priority 2 -$ 49,450$ Planer Road 0.237 Brown Road West Limit at Waterfront Home Priority 2 -$ 74,175$ Birch Street 0.096 Aberdeen Street Grey Street Priority 3 -$ -$ Birch Street 0.098 Grey Street Connaught Street Priority 3 -$ -$ Cedar Street 0.09 Lorne Street Landsdowne Street Priority 3 -$ -$ Cedar Street 0.1 Landsdowne Street Aberdeen Street Priority 3 -$ -$ Cedar Street 0.1 Aberdeen Street Grey Street Priority 3 -$ -$ Connaught Street 0.198 Riverside Drive Pine Street Priority 3 -$ -$ Connaught Street 0.136 Pine Street Cherry Street Priority 3 -$ -$ Fox Lake Road 2.85 Hwy. 129 Gas Bar Priority 3 -$ -$ King Street 0.08 Elm Street 120m North of Maple Street Priority 3 -$ -$ King Street 0.12 120m North of Maple Street Maple Street Priority 3 -$ -$ Lorne Street 0.095 Pine Street Beech St Priority 3 -$ -$ Lorne Street 0.045 Beech St 50m North of Birch Street Priority 3 -$ -$ Lorne Street 0.05 50m North of Birch Street Birch Street Priority 3 -$ -$ Lorne Street 0.12 Birch Street Civic No. 28 Priority 3 -$ -$ Maple Street 0.095 King Street Queen Street Priority 3 -$ -$ Maple Street 0.098 Queen Street Elgin Street Priority 3 -$ -$ Maple Street 0.088 Elgin Street Monk Street Priority 3 -$ -$ Maple Street 0.097 Monk Street Dufferin Street Priority 3 -$ -$ Minto Street 0.127 Laneway No. 1 Pine Street Priority 3 -$ -$ Monk Street 0.085 Lisgar Street Pine Street Priority 3 -$ -$ Oak Street 0.095 Lorne Street Landsdowne Street Priority 3 -$ -$
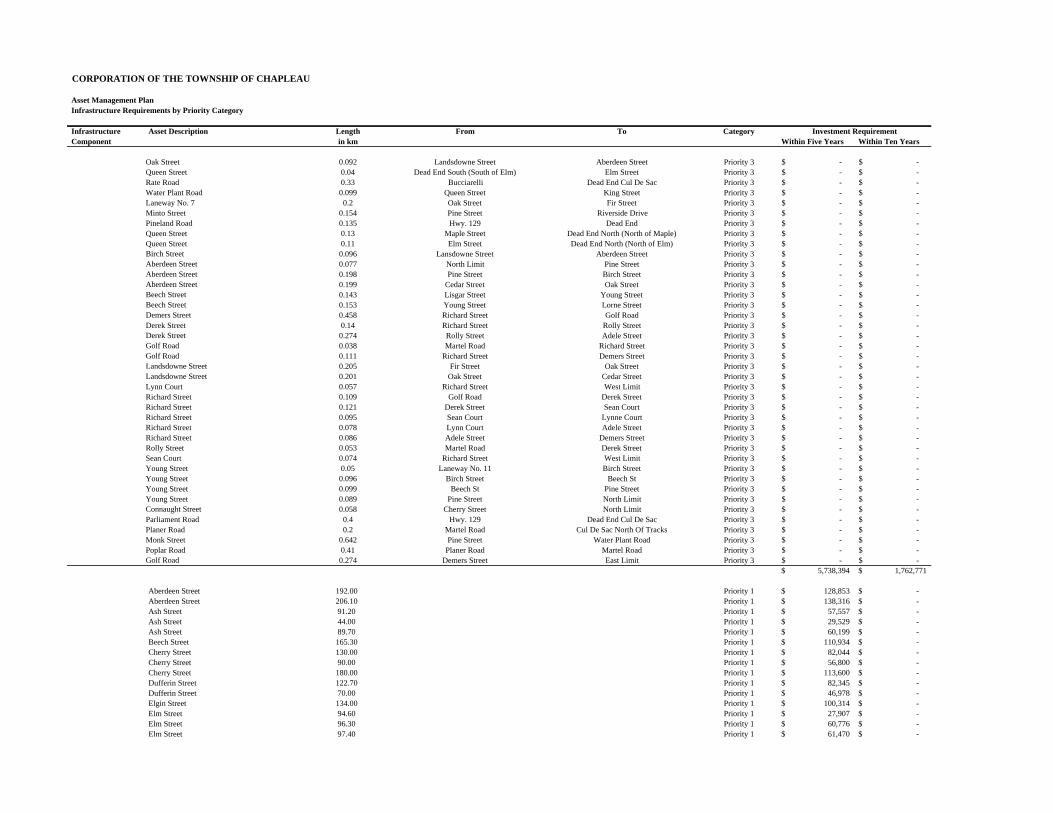
CORPORATION OF THE TOWNSHIP OF CHAPLEAU
Asset Management PlanInfrastructure Requirements by Priority Category
Infrastructure Asset Description Length From To CategoryComponent in km Within Five Years Within Ten Years
Investment Requirement
Oak Street 0.092 Landsdowne Street Aberdeen Street Priority 3 -$ -$ Queen Street 0.04 Dead End South (South of Elm) Elm Street Priority 3 -$ -$ Rate Road 0.33 Bucciarelli Dead End Cul De Sac Priority 3 -$ -$ Water Plant Road 0.099 Queen Street King Street Priority 3 -$ -$ Laneway No. 7 0.2 Oak Street Fir Street Priority 3 -$ -$ Minto Street 0.154 Pine Street Riverside Drive Priority 3 -$ -$ Pineland Road 0.135 Hwy. 129 Dead End Priority 3 -$ -$ Queen Street 0.13 Maple Street Dead End North (North of Maple) Priority 3 -$ -$ Queen Street 0.11 Elm Street Dead End North (North of Elm) Priority 3 -$ -$ Birch Street 0.096 Lansdowne Street Aberdeen Street Priority 3 -$ -$ Aberdeen Street 0.077 North Limit Pine Street Priority 3 -$ -$ Aberdeen Street 0.198 Pine Street Birch Street Priority 3 -$ -$ Aberdeen Street 0.199 Cedar Street Oak Street Priority 3 -$ -$ Beech Street 0.143 Lisgar Street Young Street Priority 3 -$ -$ Beech Street 0.153 Young Street Lorne Street Priority 3 -$ -$ Demers Street 0.458 Richard Street Golf Road Priority 3 -$ -$ Derek Street 0.14 Richard Street Rolly Street Priority 3 -$ -$ Derek Street 0.274 Rolly Street Adele Street Priority 3 -$ -$ Golf Road 0.038 Martel Road Richard Street Priority 3 -$ -$ Golf Road 0.111 Richard Street Demers Street Priority 3 -$ -$ Landsdowne Street 0.205 Fir Street Oak Street Priority 3 -$ -$ Landsdowne Street 0.201 Oak Street Cedar Street Priority 3 -$ -$ Lynn Court 0.057 Richard Street West Limit Priority 3 -$ -$ Richard Street 0.109 Golf Road Derek Street Priority 3 -$ -$ Richard Street 0.121 Derek Street Sean Court Priority 3 -$ -$ Richard Street 0.095 Sean Court Lynne Court Priority 3 -$ -$ Richard Street 0.078 Lynn Court Adele Street Priority 3 -$ -$ Richard Street 0.086 Adele Street Demers Street Priority 3 -$ -$ Rolly Street 0.053 Martel Road Derek Street Priority 3 -$ -$ Sean Court 0.074 Richard Street West Limit Priority 3 -$ -$ Young Street 0.05 Laneway No. 11 Birch Street Priority 3 -$ -$ Young Street 0.096 Birch Street Beech St Priority 3 -$ -$ Young Street 0.099 Beech St Pine Street Priority 3 -$ -$ Young Street 0.089 Pine Street North Limit Priority 3 -$ -$ Connaught Street 0.058 Cherry Street North Limit Priority 3 -$ -$ Parliament Road 0.4 Hwy. 129 Dead End Cul De Sac Priority 3 -$ -$ Planer Road 0.2 Martel Road Cul De Sac North Of Tracks Priority 3 -$ -$ Monk Street 0.642 Pine Street Water Plant Road Priority 3 -$ -$ Poplar Road 0.41 Planer Road Martel Road Priority 3 -$ -$ Golf Road 0.274 Demers Street East Limit Priority 3 -$ -$
5,738,394$ 1,762,771$
Aberdeen Street 192.00 Priority 1 128,853$ -$ Aberdeen Street 206.10 Priority 1 138,316$ -$ Ash Street 91.20 Priority 1 57,557$ -$ Ash Street 44.00 Priority 1 29,529$ -$ Ash Street 89.70 Priority 1 60,199$ -$ Beech Street 165.30 Priority 1 110,934$ -$ Cherry Street 130.00 Priority 1 82,044$ -$ Cherry Street 90.00 Priority 1 56,800$ -$ Cherry Street 180.00 Priority 1 113,600$ -$ Dufferin Street 122.70 Priority 1 82,345$ -$ Dufferin Street 70.00 Priority 1 46,978$ -$ Elgin Street 134.00 Priority 1 100,314$ -$ Elm Street 94.60 Priority 1 27,907$ -$ Elm Street 96.30 Priority 1 60,776$ -$ Elm Street 97.40 Priority 1 61,470$ -$
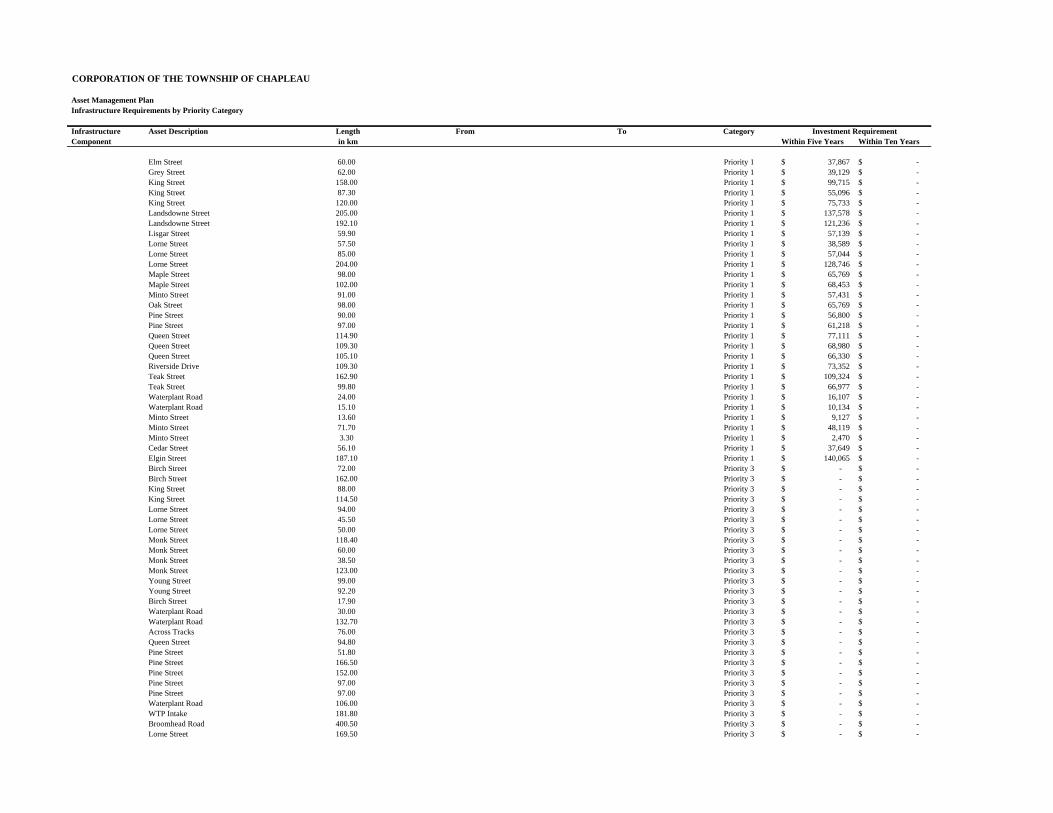
CORPORATION OF THE TOWNSHIP OF CHAPLEAU
Asset Management PlanInfrastructure Requirements by Priority Category
Infrastructure Asset Description Length From To CategoryComponent in km Within Five Years Within Ten Years
Investment Requirement
Elm Street 60.00 Priority 1 37,867$ -$ Grey Street 62.00 Priority 1 39,129$ -$ King Street 158.00 Priority 1 99,715$ -$ King Street 87.30 Priority 1 55,096$ -$ King Street 120.00 Priority 1 75,733$ -$ Landsdowne Street 205.00 Priority 1 137,578$ -$ Landsdowne Street 192.10 Priority 1 121,236$ -$ Lisgar Street 59.90 Priority 1 57,139$ -$ Lorne Street 57.50 Priority 1 38,589$ -$ Lorne Street 85.00 Priority 1 57,044$ -$ Lorne Street 204.00 Priority 1 128,746$ -$ Maple Street 98.00 Priority 1 65,769$ -$ Maple Street 102.00 Priority 1 68,453$ -$ Minto Street 91.00 Priority 1 57,431$ -$ Oak Street 98.00 Priority 1 65,769$ -$ Pine Street 90.00 Priority 1 56,800$ -$ Pine Street 97.00 Priority 1 61,218$ -$ Queen Street 114.90 Priority 1 77,111$ -$ Queen Street 109.30 Priority 1 68,980$ -$ Queen Street 105.10 Priority 1 66,330$ -$ Riverside Drive 109.30 Priority 1 73,352$ -$ Teak Street 162.90 Priority 1 109,324$ -$ Teak Street 99.80 Priority 1 66,977$ -$ Waterplant Road 24.00 Priority 1 16,107$ -$ Waterplant Road 15.10 Priority 1 10,134$ -$ Minto Street 13.60 Priority 1 9,127$ -$ Minto Street 71.70 Priority 1 48,119$ -$ Minto Street 3.30 Priority 1 2,470$ -$ Cedar Street 56.10 Priority 1 37,649$ -$ Elgin Street 187.10 Priority 1 140,065$ -$ Birch Street 72.00 Priority 3 -$ -$ Birch Street 162.00 Priority 3 -$ -$ King Street 88.00 Priority 3 -$ -$ King Street 114.50 Priority 3 -$ -$ Lorne Street 94.00 Priority 3 -$ -$ Lorne Street 45.50 Priority 3 -$ -$ Lorne Street 50.00 Priority 3 -$ -$ Monk Street 118.40 Priority 3 -$ -$ Monk Street 60.00 Priority 3 -$ -$ Monk Street 38.50 Priority 3 -$ -$ Monk Street 123.00 Priority 3 -$ -$ Young Street 99.00 Priority 3 -$ -$ Young Street 92.20 Priority 3 -$ -$ Birch Street 17.90 Priority 3 -$ -$ Waterplant Road 30.00 Priority 3 -$ -$ Waterplant Road 132.70 Priority 3 -$ -$ Across Tracks 76.00 Priority 3 -$ -$ Queen Street 94.80 Priority 3 -$ -$ Pine Street 51.80 Priority 3 -$ -$ Pine Street 166.50 Priority 3 -$ -$ Pine Street 152.00 Priority 3 -$ -$ Pine Street 97.00 Priority 3 -$ -$ Pine Street 97.00 Priority 3 -$ -$ Waterplant Road 106.00 Priority 3 -$ -$ WTP Intake 181.80 Priority 3 -$ -$ Broomhead Road 400.50 Priority 3 -$ -$ Lorne Street 169.50 Priority 3 -$ -$
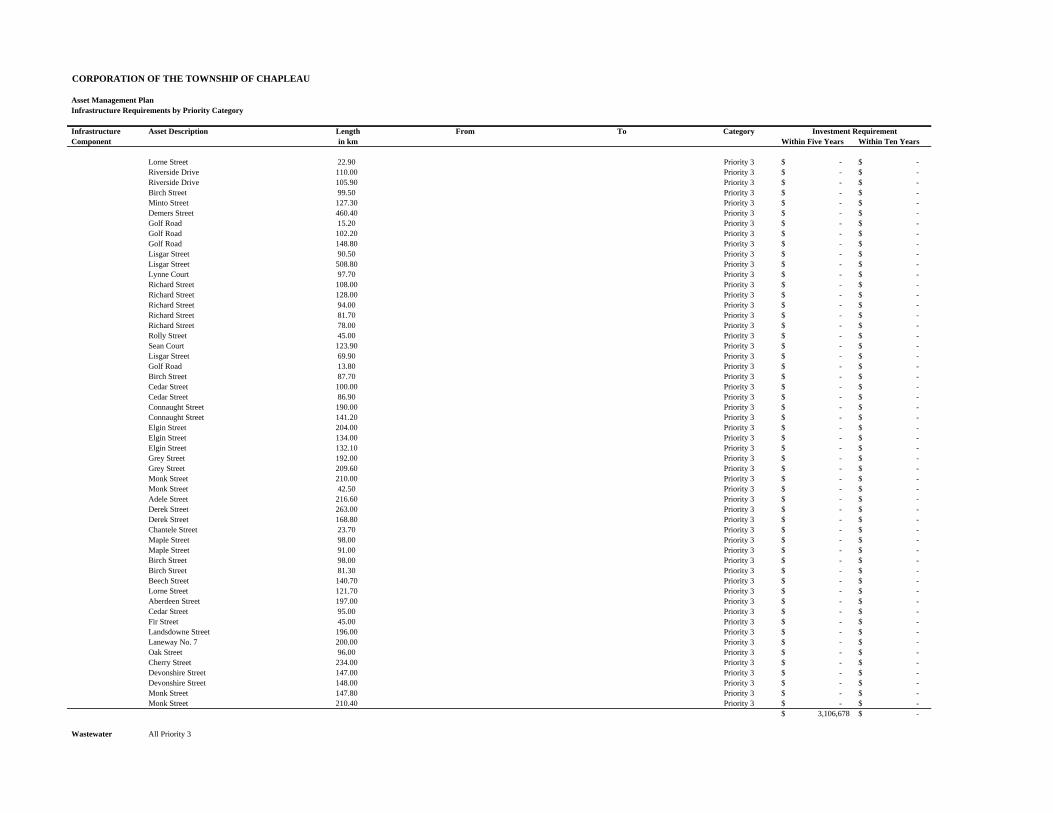
CORPORATION OF THE TOWNSHIP OF CHAPLEAU
Asset Management PlanInfrastructure Requirements by Priority Category
Infrastructure Asset Description Length From To CategoryComponent in km Within Five Years Within Ten Years
Investment Requirement
Lorne Street 22.90 Priority 3 -$ -$ Riverside Drive 110.00 Priority 3 -$ -$ Riverside Drive 105.90 Priority 3 -$ -$ Birch Street 99.50 Priority 3 -$ -$ Minto Street 127.30 Priority 3 -$ -$ Demers Street 460.40 Priority 3 -$ -$ Golf Road 15.20 Priority 3 -$ -$ Golf Road 102.20 Priority 3 -$ -$ Golf Road 148.80 Priority 3 -$ -$ Lisgar Street 90.50 Priority 3 -$ -$ Lisgar Street 508.80 Priority 3 -$ -$ Lynne Court 97.70 Priority 3 -$ -$ Richard Street 108.00 Priority 3 -$ -$ Richard Street 128.00 Priority 3 -$ -$ Richard Street 94.00 Priority 3 -$ -$ Richard Street 81.70 Priority 3 -$ -$ Richard Street 78.00 Priority 3 -$ -$ Rolly Street 45.00 Priority 3 -$ -$ Sean Court 123.90 Priority 3 -$ -$ Lisgar Street 69.90 Priority 3 -$ -$ Golf Road 13.80 Priority 3 -$ -$ Birch Street 87.70 Priority 3 -$ -$ Cedar Street 100.00 Priority 3 -$ -$ Cedar Street 86.90 Priority 3 -$ -$ Connaught Street 190.00 Priority 3 -$ -$ Connaught Street 141.20 Priority 3 -$ -$ Elgin Street 204.00 Priority 3 -$ -$ Elgin Street 134.00 Priority 3 -$ -$ Elgin Street 132.10 Priority 3 -$ -$ Grey Street 192.00 Priority 3 -$ -$ Grey Street 209.60 Priority 3 -$ -$ Monk Street 210.00 Priority 3 -$ -$ Monk Street 42.50 Priority 3 -$ -$ Adele Street 216.60 Priority 3 -$ -$ Derek Street 263.00 Priority 3 -$ -$ Derek Street 168.80 Priority 3 -$ -$ Chantele Street 23.70 Priority 3 -$ -$ Maple Street 98.00 Priority 3 -$ -$ Maple Street 91.00 Priority 3 -$ -$ Birch Street 98.00 Priority 3 -$ -$ Birch Street 81.30 Priority 3 -$ -$ Beech Street 140.70 Priority 3 -$ -$ Lorne Street 121.70 Priority 3 -$ -$ Aberdeen Street 197.00 Priority 3 -$ -$ Cedar Street 95.00 Priority 3 -$ -$ Fir Street 45.00 Priority 3 -$ -$ Landsdowne Street 196.00 Priority 3 -$ -$ Laneway No. 7 200.00 Priority 3 -$ -$ Oak Street 96.00 Priority 3 -$ -$ Cherry Street 234.00 Priority 3 -$ -$ Devonshire Street 147.00 Priority 3 -$ -$ Devonshire Street 148.00 Priority 3 -$ -$ Monk Street 147.80 Priority 3 -$ -$ Monk Street 210.40 Priority 3 -$ -$
3,106,678$ -$
Wastewater All Priority 3
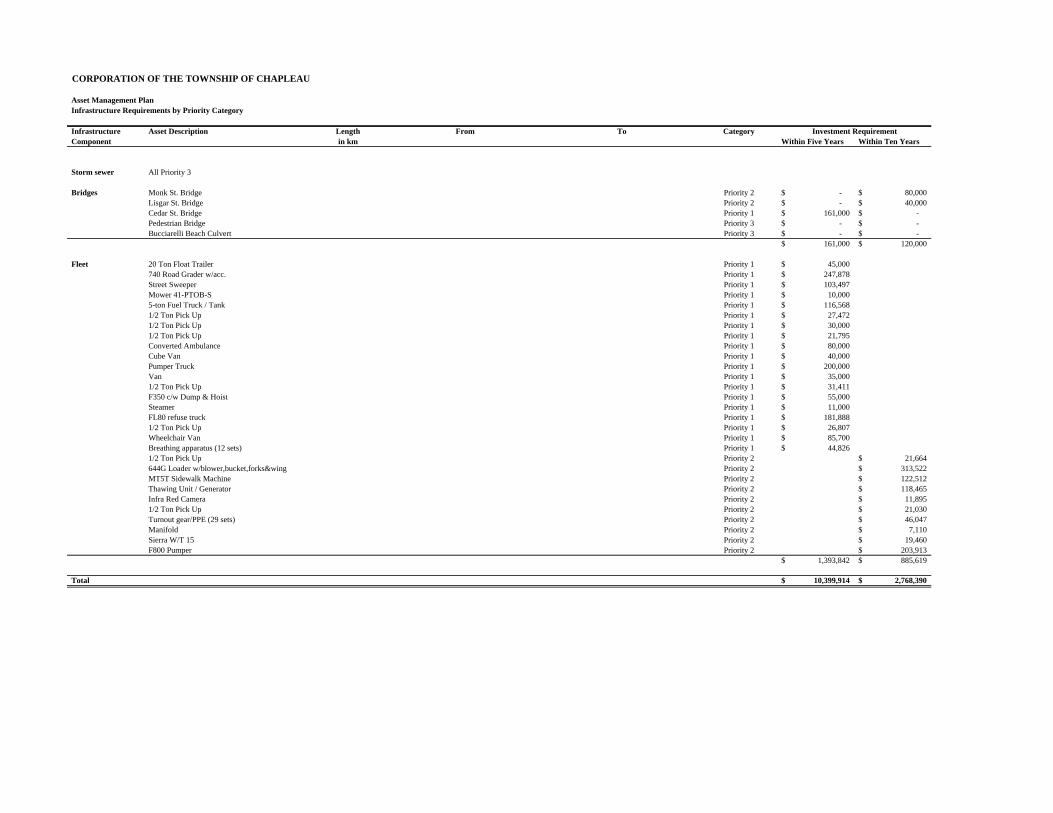
CORPORATION OF THE TOWNSHIP OF CHAPLEAU
Asset Management PlanInfrastructure Requirements by Priority Category
Infrastructure Asset Description Length From To CategoryComponent in km Within Five Years Within Ten Years
Investment Requirement
Storm sewer All Priority 3
Bridges Monk St. Bridge Priority 2 -$ 80,000$ Lisgar St. Bridge Priority 2 -$ 40,000$ Cedar St. Bridge Priority 1 161,000$ -$ Pedestrian Bridge Priority 3 -$ -$ Bucciarelli Beach Culvert Priority 3 -$ -$
161,000$ 120,000$
Fleet 20 Ton Float Trailer Priority 1 45,000$ 740 Road Grader w/acc. Priority 1 247,878$ Street Sweeper Priority 1 103,497$ Mower 41-PTOB-S Priority 1 10,000$ 5-ton Fuel Truck / Tank Priority 1 116,568$ 1/2 Ton Pick Up Priority 1 27,472$ 1/2 Ton Pick Up Priority 1 30,000$ 1/2 Ton Pick Up Priority 1 21,795$ Converted Ambulance Priority 1 80,000$ Cube Van Priority 1 40,000$ Pumper Truck Priority 1 200,000$ Van Priority 1 35,000$ 1/2 Ton Pick Up Priority 1 31,411$ F350 c/w Dump & Hoist Priority 1 55,000$ Steamer Priority 1 11,000$ FL80 refuse truck Priority 1 181,888$ 1/2 Ton Pick Up Priority 1 26,807$ Wheelchair Van Priority 1 85,700$ Breathing apparatus (12 sets) Priority 1 44,826$ 1/2 Ton Pick Up Priority 2 21,664$ 644G Loader w/blower,bucket,forks&wing Priority 2 313,522$ MT5T Sidewalk Machine Priority 2 122,512$ Thawing Unit / Generator Priority 2 118,465$ Infra Red Camera Priority 2 11,895$ 1/2 Ton Pick Up Priority 2 21,030$ Turnout gear/PPE (29 sets) Priority 2 46,047$ Manifold Priority 2 7,110$ Sierra W/T 15 Priority 2 19,460$ F800 Pumper Priority 2 203,913$
1,393,842$ 885,619$
Total 10,399,914$ 2,768,390$

Asset Management PlanningAsset Management Planning for the Township of Chapleau
Appendix JAppendix JFinancial Projections (Scenario 1)
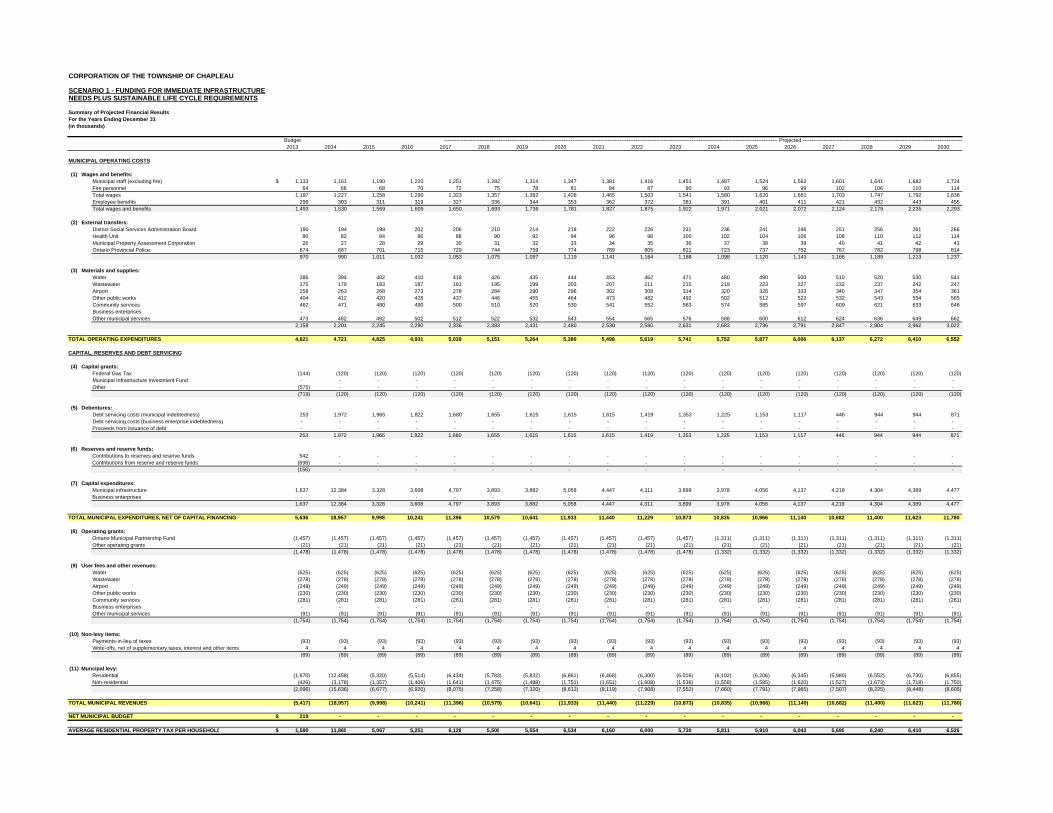
CORPORATION OF THE TOWNSHIP OF CHAPLEAU
SCENARIO 1 - FUNDING FOR IMMEDIATE INFRASTRUCTURENEEDS PLUS SUSTAINABLE LIFE CYCLE REQUIREMENTS
Summary of Projected Financial Results For the Years Ending December 31(in thousands)
Budget2013 2014 2015 2016 2017 2018 2019 2020 2021 2022 2023 2024 2025 2026 2027 2028 2029 2030
MUNICIPAL OPERATING COSTS
(1) Wages and benefits:Municipal staff (excluding fire) 1,133$ 1,161 1,190 1,220 1,251 1,282 1,314 1,347 1,381 1,416 1,451 1,487 1,524 1,562 1,601 1,641 1,682 1,724 Fire personnel 64 66 68 70 72 75 78 81 84 87 90 93 96 99 102 106 110 114 Total wages 1,197 1,227 1,258 1,290 1,323 1,357 1,392 1,428 1,465 1,503 1,541 1,580 1,620 1,661 1,703 1,747 1,792 1,838 Employee benefits 296 303 311 319 327 336 344 353 362 372 381 391 401 411 421 432 443 455 Total wages and benefits 1,493 1,530 1,569 1,609 1,650 1,693 1,736 1,781 1,827 1,875 1,922 1,971 2,021 2,072 2,124 2,179 2,235 2,293
(2) External transfers:District Social Services Administration Board 190 194 198 202 206 210 214 218 222 226 231 236 241 246 251 256 261 266 Health Unit 80 82 84 86 88 90 92 94 96 98 100 102 104 106 108 110 112 114 Municipal Property Assessment Corporation 26 27 28 29 30 31 32 33 34 35 36 37 38 39 40 41 42 43 Ontario Provincial Police 674 687 701 715 729 744 759 774 789 805 821 723 737 752 767 782 798 814
970 990 1,011 1,032 1,053 1,075 1,097 1,119 1,141 1,164 1,188 1,098 1,120 1,143 1,166 1,189 1,213 1,237
(3) Materials and supplies:Water 386 394 402 410 418 426 435 444 453 462 471 480 490 500 510 520 530 541 Wastewater 175 179 183 187 191 195 199 203 207 211 215 219 223 227 232 237 242 247 Airport 258 263 268 273 278 284 290 296 302 308 314 320 326 333 340 347 354 361 Other public works 404 412 420 428 437 446 455 464 473 482 492 502 512 522 532 543 554 565 Community services 462 471 480 490 500 510 520 530 541 552 563 574 585 597 609 621 633 646 Business enterprises - - - - - - - - - - - - - - - - - - Other municipal services 473 482 492 502 512 522 532 543 554 565 576 588 600 612 624 636 649 662
2,158 2,201 2,245 2,290 2,336 2,383 2,431 2,480 2,530 2,580 2,631 2,683 2,736 2,791 2,847 2,904 2,962 3,022
TOTAL OPERATING EXPENDITURES 4,621 4,721 4,825 4,931 5,039 5,151 5,264 5,380 5,498 5,619 5,741 5,752 5,877 6,006 6,137 6,272 6,410 6,552
CAPITAL, RESERVES AND DEBT SERVICING
(4) Capital grants:Federal Gas Tax (144) (120) (120) (120) (120) (120) (120) (120) (120) (120) (120) (120) (120) (120) (120) (120) (120) (120) Municipal Infrastructure Investment Fund - - - - - - - - - - - - - - - - - - Other (575) - - - - - - - - - - - - - - - - -
(719) (120) (120) (120) (120) (120) (120) (120) (120) (120) (120) (120) (120) (120) (120) (120) (120) (120)
(5) Debentures:Debt servicing costs (municipal indebtedness) 253 1,972 1,965 1,822 1,680 1,655 1,615 1,615 1,615 1,419 1,353 1,225 1,153 1,117 446 944 944 871 Debt servicing costs (business enterprise indebtedness) - - - - - - - - - - - - - - - - - - Proceeds from issuance of debt - - - - - - - - - - - - - - - - - -
253 1,972 1,965 1,822 1,680 1,655 1,615 1,615 1,615 1,419 1,353 1,225 1,153 1,117 446 944 944 871
(6) Reserves and reserve funds:Contributions to reserves and reserve funds 542 - - - - - - - - - - - - - - - - - Contributions from reserve and reserve funds (698) - - - - - - - - - - - - - - - - -
(156) - - - - - - - - - - - - - - - - -
(7) Capital expenditures:Municipal infrastructure 1,637 12,384 3,328 3,608 4,797 3,893 3,882 5,058 4,447 4,311 3,899 3,978 4,056 4,137 4,219 4,304 4,389 4,477 Business enterprises - - - - - - - - - - - - - - - - - -
1,637 12,384 3,328 3,608 4,797 3,893 3,882 5,058 4,447 4,311 3,899 3,978 4,056 4,137 4,219 4,304 4,389 4,477
TOTAL MUNICIPAL EXPENDITURES, NET OF CAPITAL FINANCING 5,636 18,957 9,998 10,241 11,396 10,579 10,641 11,933 11,440 11,229 10,873 10,835 10,966 11,140 10,682 11,400 11,623 11,780
(8) Operating grants:Ontario Municipal Partnership Fund (1,457) (1,457) (1,457) (1,457) (1,457) (1,457) (1,457) (1,457) (1,457) (1,457) (1,457) (1,311) (1,311) (1,311) (1,311) (1,311) (1,311) (1,311) Other operating grants (21) (21) (21) (21) (21) (21) (21) (21) (21) (21) (21) (21) (21) (21) (21) (21) (21) (21)
(1,478) (1,478) (1,478) (1,478) (1,478) (1,478) (1,478) (1,478) (1,478) (1,478) (1,478) (1,332) (1,332) (1,332) (1,332) (1,332) (1,332) (1,332)
(9) User fees and other revenues:Water (625) (625) (625) (625) (625) (625) (625) (625) (625) (625) (625) (625) (625) (625) (625) (625) (625) (625) Wastewater (278) (278) (278) (278) (278) (278) (278) (278) (278) (278) (278) (278) (278) (278) (278) (278) (278) (278) Airport (249) (249) (249) (249) (249) (249) (249) (249) (249) (249) (249) (249) (249) (249) (249) (249) (249) (249) Other public works (230) (230) (230) (230) (230) (230) (230) (230) (230) (230) (230) (230) (230) (230) (230) (230) (230) (230) Community services (281) (281) (281) (281) (281) (281) (281) (281) (281) (281) (281) (281) (281) (281) (281) (281) (281) (281) Business enterprises - - - - - - - - - - - - - - - - - - Other municipal services (91) (91) (91) (91) (91) (91) (91) (91) (91) (91) (91) (91) (91) (91) (91) (91) (91) (91)
(1,754) (1,754) (1,754) (1,754) (1,754) (1,754) (1,754) (1,754) (1,754) (1,754) (1,754) (1,754) (1,754) (1,754) (1,754) (1,754) (1,754) (1,754)
(10) Non-levy items:Payments-in-lieu of taxes (93) (93) (93) (93) (93) (93) (93) (93) (93) (93) (93) (93) (93) (93) (93) (93) (93) (93) Write-offs, net of supplementary taxes, interest and other items 4 4 4 4 4 4 4 4 4 4 4 4 4 4 4 4 4 4
(89) (89) (89) (89) (89) (89) (89) (89) (89) (89) (89) (89) (89) (89) (89) (89) (89) (89)
(11) Muncipal levy:Residential (1,670) (12,458) (5,320) (5,514) (6,434) (5,783) (5,832) (6,861) (6,468) (6,300) (6,016) (6,102) (6,206) (6,345) (5,980) (6,552) (6,730) (6,855) Non-residential (426) (3,178) (1,357) (1,406) (1,641) (1,475) (1,488) (1,751) (1,651) (1,608) (1,536) (1,558) (1,585) (1,620) (1,527) (1,673) (1,718) (1,750)
(2,096) (15,636) (6,677) (6,920) (8,075) (7,258) (7,320) (8,612) (8,119) (7,908) (7,552) (7,660) (7,791) (7,965) (7,507) (8,225) (8,448) (8,605)
TOTAL MUNICIPAL REVENUES (5,417) (18,957) (9,998) (10,241) (11,396) (10,579) (10,641) (11,933) (11,440) (11,229) (10,873) (10,835) (10,966) (11,140) (10,682) (11,400) (11,623) (11,780)
NET MUNICIPAL BUDGET 219$ - - - - - - - - - - - - - - - - -
AVERAGE RESIDENTIAL PROPERTY TAX PER HOUSEHOLD 1,590$ 11,865 5,067 5,251 6,128 5,508 5,554 6,534 6,160 6,000 5,730 5,811 5,910 6,043 5,695 6,240 6,410 6,529
---------------------------------------------------------------------------------------------------------------------------------------------------------------------------------------------- Projected --------------------------------------------------------------------------------------------
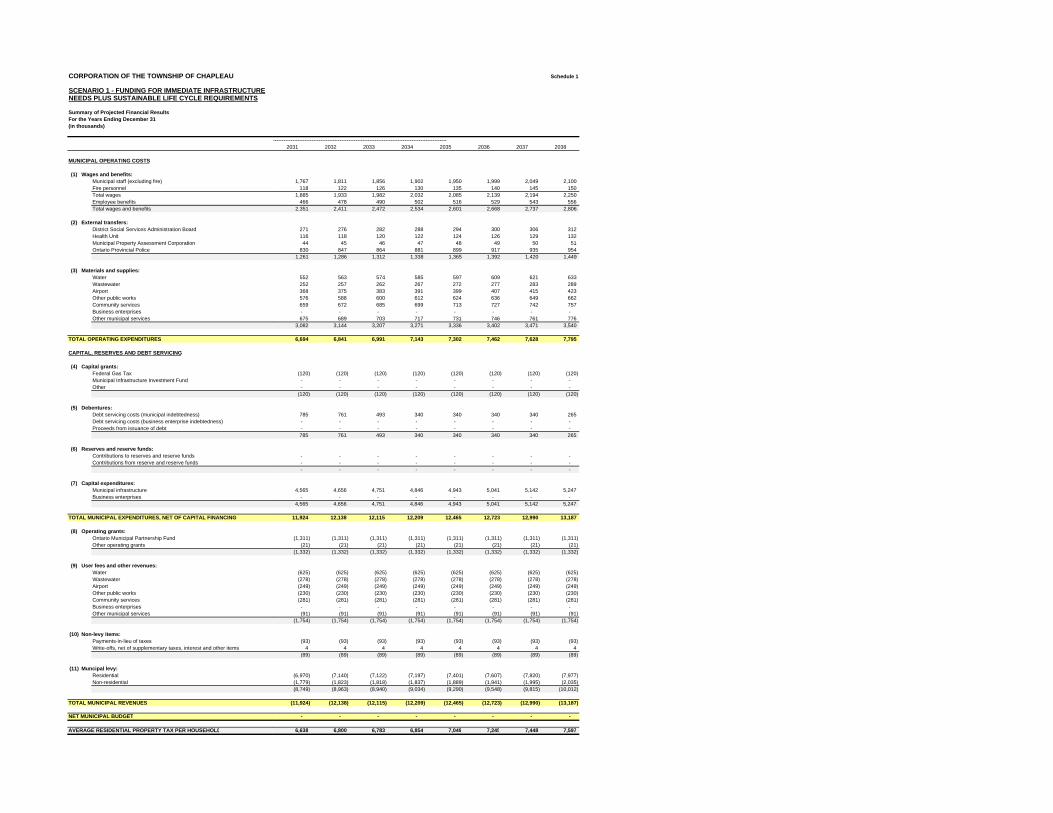
CORPORATION OF THE TOWNSHIP OF CHAPLEAU
SCENARIO 1 - FUNDING FOR IMMEDIATE INFRASTRUCTURENEEDS PLUS SUSTAINABLE LIFE CYCLE REQUIREMENTS
Summary of Projected Financial Results For the Years Ending December 31(in thousands)
MUNICIPAL OPERATING COSTS
(1) Wages and benefits:Municipal staff (excluding fire)Fire personnelTotal wagesEmployee benefitsTotal wages and benefits
(2) External transfers:District Social Services Administration BoardHealth UnitMunicipal Property Assessment CorporationOntario Provincial Police
(3) Materials and supplies:WaterWastewaterAirportOther public worksCommunity servicesBusiness enterprisesOther municipal services
TOTAL OPERATING EXPENDITURES
CAPITAL, RESERVES AND DEBT SERVICING
(4) Capital grants:Federal Gas TaxMunicipal Infrastructure Investment FundOther
(5) Debentures:Debt servicing costs (municipal indebtedness)Debt servicing costs (business enterprise indebtedness)Proceeds from issuance of debt
(6) Reserves and reserve funds:Contributions to reserves and reserve fundsContributions from reserve and reserve funds
(7) Capital expenditures:Municipal infrastructureBusiness enterprises
TOTAL MUNICIPAL EXPENDITURES, NET OF CAPITAL FINANCING
(8) Operating grants:Ontario Municipal Partnership FundOther operating grants
(9) User fees and other revenues:WaterWastewaterAirportOther public worksCommunity servicesBusiness enterprisesOther municipal services
(10) Non-levy items:Payments-in-lieu of taxesWrite-offs, net of supplementary taxes, interest and other items
(11) Muncipal levy:ResidentialNon-residential
TOTAL MUNICIPAL REVENUES
NET MUNICIPAL BUDGET
AVERAGE RESIDENTIAL PROPERTY TAX PER HOUSEHOLD
Schedule 1
2031 2032 2033 2034 2035 2036 2037 2038
1,767 1,811 1,856 1,902 1,950 1,999 2,049 2,100 118 122 126 130 135 140 145 150
1,885 1,933 1,982 2,032 2,085 2,139 2,194 2,250 466 478 490 502 516 529 543 556
2,351 2,411 2,472 2,534 2,601 2,668 2,737 2,806
271 276 282 288 294 300 306 312 116 118 120 122 124 126 129 132 44 45 46 47 48 49 50 51
830 847 864 881 899 917 935 954 1,261 1,286 1,312 1,338 1,365 1,392 1,420 1,449
552 563 574 585 597 609 621 633 252 257 262 267 272 277 283 289 368 375 383 391 399 407 415 423 576 588 600 612 624 636 649 662 659 672 685 699 713 727 742 757 - - - - - - - - 675 689 703 717 731 746 761 776
3,082 3,144 3,207 3,271 3,336 3,402 3,471 3,540
6,694 6,841 6,991 7,143 7,302 7,462 7,628 7,795
(120) (120) (120) (120) (120) (120) (120) (120) - - - - - - - - - - - - - - - -
(120) (120) (120) (120) (120) (120) (120) (120)
785 761 493 340 340 340 340 265 - - - - - - - - - - - - - - - - 785 761 493 340 340 340 340 265
- - - - - - - - - - - - - - - - - - - - - - - -
4,565 4,656 4,751 4,846 4,943 5,041 5,142 5,247 - - - - - - - -
4,565 4,656 4,751 4,846 4,943 5,041 5,142 5,247
11,924 12,138 12,115 12,209 12,465 12,723 12,990 13,187
(1,311) (1,311) (1,311) (1,311) (1,311) (1,311) (1,311) (1,311) (21) (21) (21) (21) (21) (21) (21) (21)
(1,332) (1,332) (1,332) (1,332) (1,332) (1,332) (1,332) (1,332)
(625) (625) (625) (625) (625) (625) (625) (625) (278) (278) (278) (278) (278) (278) (278) (278) (249) (249) (249) (249) (249) (249) (249) (249) (230) (230) (230) (230) (230) (230) (230) (230) (281) (281) (281) (281) (281) (281) (281) (281) - - - - - - - - (91) (91) (91) (91) (91) (91) (91) (91)
(1,754) (1,754) (1,754) (1,754) (1,754) (1,754) (1,754) (1,754)
(93) (93) (93) (93) (93) (93) (93) (93) 4 4 4 4 4 4 4 4
(89) (89) (89) (89) (89) (89) (89) (89)
(6,970) (7,140) (7,122) (7,197) (7,401) (7,607) (7,820) (7,977) (1,779) (1,823) (1,818) (1,837) (1,889) (1,941) (1,995) (2,035) (8,749) (8,963) (8,940) (9,034) (9,290) (9,548) (9,815) (10,012)
(11,924) (12,138) (12,115) (12,209) (12,465) (12,723) (12,990) (13,187)
- - - - - - - -
6,638 6,800 6,783 6,854 7,049 7,245 7,448 7,597
---------------------------------------------------------------------------------------------------
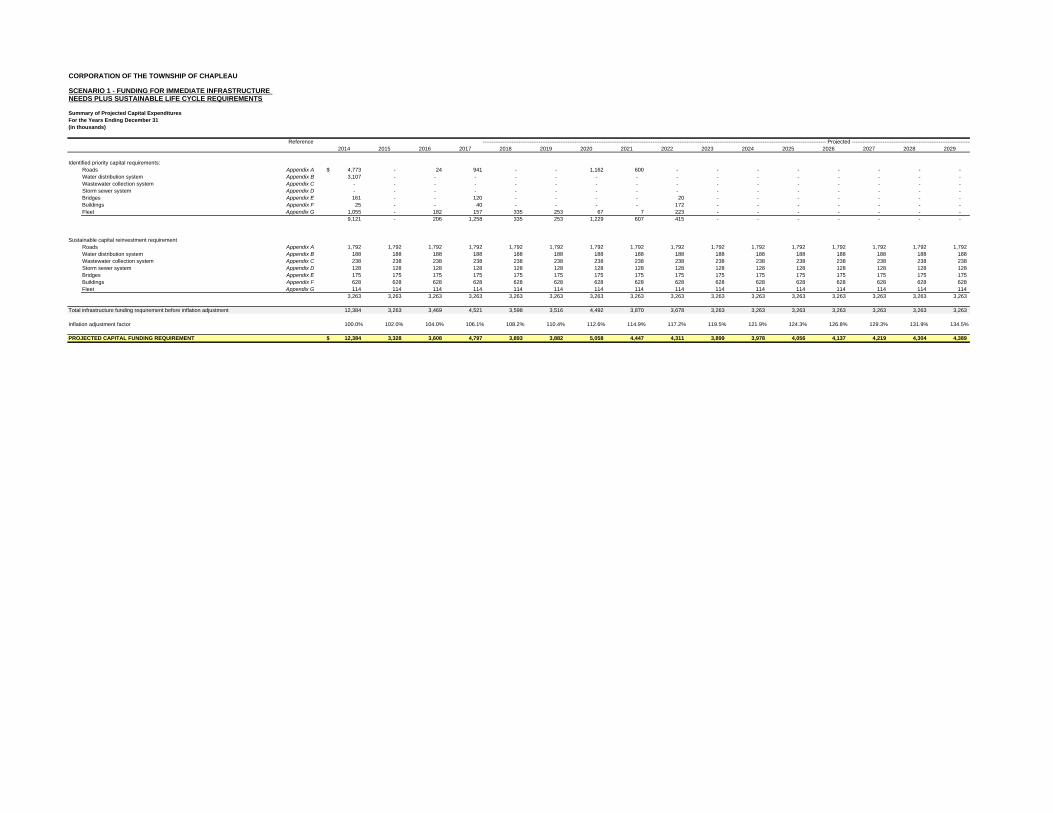
CORPORATION OF THE TOWNSHIP OF CHAPLEAU
SCENARIO 1 - FUNDING FOR IMMEDIATE INFRASTRUCTURE NEEDS PLUS SUSTAINABLE LIFE CYCLE REQUIREMENTS
Summary of Projected Capital ExpendituresFor the Years Ending December 31(in thousands)
Reference2014 2015 2016 2017 2018 2019 2020 2021 2022 2023 2024 2025 2026 2027 2028 2029
Identified priority capital requirements:Roads Appendix A 4,773$ - 24 941 - - 1,162 600 - - - - - - - - Water distribution system Appendix B 3,107 - - - - - - - - - - - - - - - Wastewater collection system Appendix C - - - - - - - - - - - - - - - - Storm sewer system Appendix D - - - - - - - - - - - - - - - - Bridges Appendix E 161 - - 120 - - - - 20 - - - - - - - Buildings Appendix F 25 - - 40 - - - - 172 - - - - - - - Fleet Appendix G 1,055 - 182 157 335 253 67 7 223 - - - - - - -
9,121 - 206 1,258 335 253 1,229 607 415 - - - - - - -
Sustainable capital reinvestment requirementRoads Appendix A 1,792 1,792 1,792 1,792 1,792 1,792 1,792 1,792 1,792 1,792 1,792 1,792 1,792 1,792 1,792 1,792 Water distribution system Appendix B 188 188 188 188 188 188 188 188 188 188 188 188 188 188 188 188 Wastewater collection system Appendix C 238 238 238 238 238 238 238 238 238 238 238 238 238 238 238 238 Storm sewer system Appendix D 128 128 128 128 128 128 128 128 128 128 128 128 128 128 128 128 Bridges Appendix E 175 175 175 175 175 175 175 175 175 175 175 175 175 175 175 175 Buildings Appendix F 628 628 628 628 628 628 628 628 628 628 628 628 628 628 628 628 Fleet Appendix G 114 114 114 114 114 114 114 114 114 114 114 114 114 114 114 114
3,263 3,263 3,263 3,263 3,263 3,263 3,263 3,263 3,263 3,263 3,263 3,263 3,263 3,263 3,263 3,263
Total infrastructure funding requirement before inflation adjustment 12,384 3,263 3,469 4,521 3,598 3,516 4,492 3,870 3,678 3,263 3,263 3,263 3,263 3,263 3,263 3,263
Inflation adjustment factor 100.0% 102.0% 104.0% 106.1% 108.2% 110.4% 112.6% 114.9% 117.2% 119.5% 121.9% 124.3% 126.8% 129.3% 131.9% 134.5%
PROJECTED CAPITAL FUNDING REQUIREMENT 12,384$ 3,328 3,608 4,797 3,893 3,882 5,058 4,447 4,311 3,899 3,978 4,056 4,137 4,219 4,304 4,389
---------------------------------------------------------------------------------------------------------------------------------------------------------------------------------------------- Projected ------------------------------------------------------------------
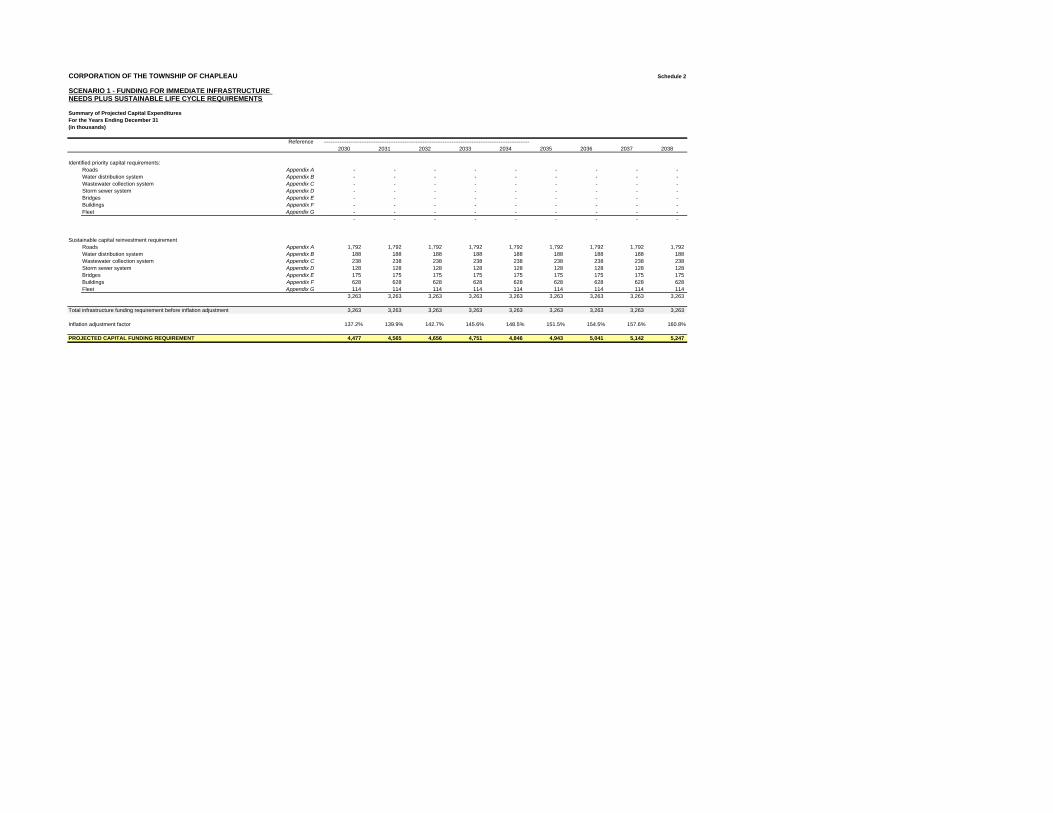
CORPORATION OF THE TOWNSHIP OF CHAPLEAU
SCENARIO 1 - FUNDING FOR IMMEDIATE INFRASTRUCTURE NEEDS PLUS SUSTAINABLE LIFE CYCLE REQUIREMENTS
Summary of Projected Capital ExpendituresFor the Years Ending December 31(in thousands)
Reference
Identified priority capital requirements:Roads Appendix AWater distribution system Appendix BWastewater collection system Appendix CStorm sewer system Appendix DBridges Appendix EBuildings Appendix FFleet Appendix G
Sustainable capital reinvestment requirementRoads Appendix AWater distribution system Appendix BWastewater collection system Appendix CStorm sewer system Appendix DBridges Appendix EBuildings Appendix FFleet Appendix G
Total infrastructure funding requirement before inflation adjustment
Inflation adjustment factor
PROJECTED CAPITAL FUNDING REQUIREMENT
Schedule 2
2030 2031 2032 2033 2034 2035 2036 2037 2038
- - - - - - - - - - - - - - - - - - - - - - - - - - - - - - - - - - - - - - - - - - - - - - - - - - - - - - - - - - - - - - - - - - - - - - - -
1,792 1,792 1,792 1,792 1,792 1,792 1,792 1,792 1,792 188 188 188 188 188 188 188 188 188 238 238 238 238 238 238 238 238 238 128 128 128 128 128 128 128 128 128 175 175 175 175 175 175 175 175 175 628 628 628 628 628 628 628 628 628 114 114 114 114 114 114 114 114 114
3,263 3,263 3,263 3,263 3,263 3,263 3,263 3,263 3,263
3,263 3,263 3,263 3,263 3,263 3,263 3,263 3,263 3,263
137.2% 139.9% 142.7% 145.6% 148.5% 151.5% 154.5% 157.6% 160.8%
4,477 4,565 4,656 4,751 4,846 4,943 5,041 5,142 5,247
------------------------------------------------------------------------------------------------------------------

Asset Management PlanningAsset Management Planning for the Township of Chapleau
Appendix KAppendix KFinancial Projections (Scenario 2)
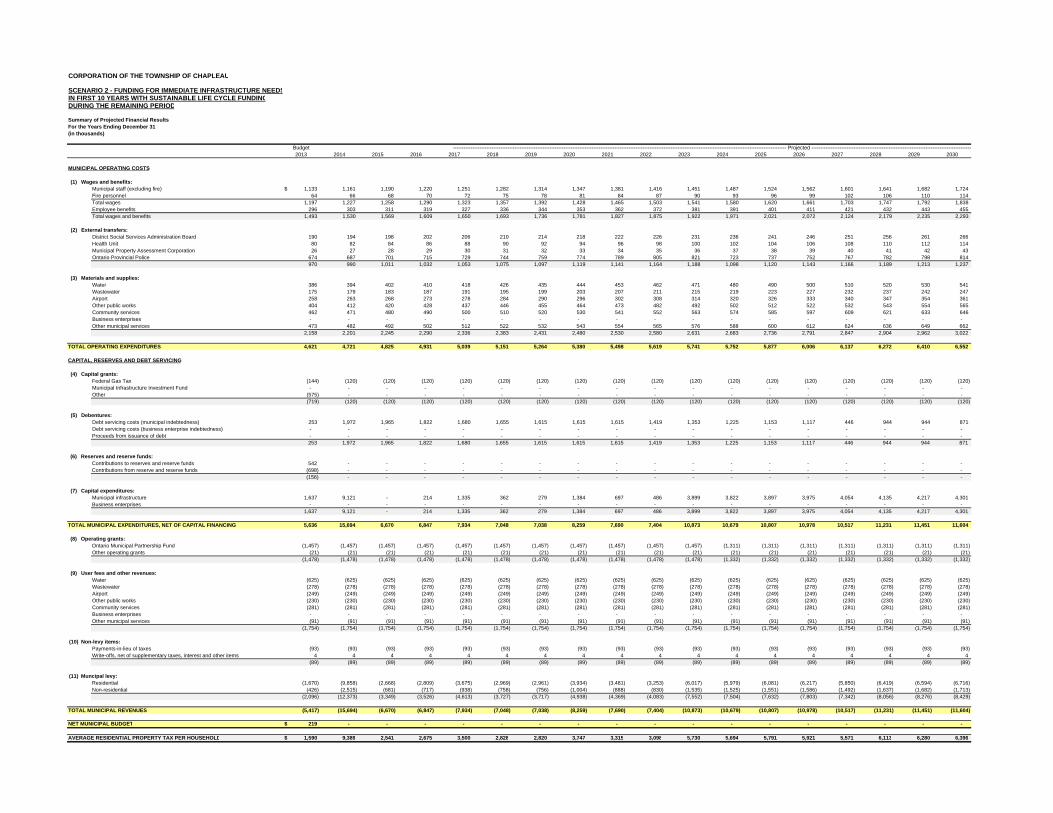
CORPORATION OF THE TOWNSHIP OF CHAPLEAU
SCENARIO 2 - FUNDING FOR IMMEDIATE INFRASTRUCTURE NEEDSIN FIRST 10 YEARS WITH SUSTAINABLE LIFE CYCLE FUNDINGDURING THE REMAINING PERIOD
Summary of Projected Financial Results For the Years Ending December 31(in thousands)
Budget2013 2014 2015 2016 2017 2018 2019 2020 2021 2022 2023 2024 2025 2026 2027 2028 2029 2030
MUNICIPAL OPERATING COSTS
(1) Wages and benefits:Municipal staff (excluding fire) 1,133$ 1,161 1,190 1,220 1,251 1,282 1,314 1,347 1,381 1,416 1,451 1,487 1,524 1,562 1,601 1,641 1,682 1,724 Fire personnel 64 66 68 70 72 75 78 81 84 87 90 93 96 99 102 106 110 114 Total wages 1,197 1,227 1,258 1,290 1,323 1,357 1,392 1,428 1,465 1,503 1,541 1,580 1,620 1,661 1,703 1,747 1,792 1,838 Employee benefits 296 303 311 319 327 336 344 353 362 372 381 391 401 411 421 432 443 455 Total wages and benefits 1,493 1,530 1,569 1,609 1,650 1,693 1,736 1,781 1,827 1,875 1,922 1,971 2,021 2,072 2,124 2,179 2,235 2,293
(2) External transfers:District Social Services Administration Board 190 194 198 202 206 210 214 218 222 226 231 236 241 246 251 256 261 266 Health Unit 80 82 84 86 88 90 92 94 96 98 100 102 104 106 108 110 112 114 Municipal Property Assessment Corporation 26 27 28 29 30 31 32 33 34 35 36 37 38 39 40 41 42 43 Ontario Provincial Police 674 687 701 715 729 744 759 774 789 805 821 723 737 752 767 782 798 814
970 990 1,011 1,032 1,053 1,075 1,097 1,119 1,141 1,164 1,188 1,098 1,120 1,143 1,166 1,189 1,213 1,237
(3) Materials and supplies:Water 386 394 402 410 418 426 435 444 453 462 471 480 490 500 510 520 530 541 Wastewater 175 179 183 187 191 195 199 203 207 211 215 219 223 227 232 237 242 247 Airport 258 263 268 273 278 284 290 296 302 308 314 320 326 333 340 347 354 361 Other public works 404 412 420 428 437 446 455 464 473 482 492 502 512 522 532 543 554 565 Community services 462 471 480 490 500 510 520 530 541 552 563 574 585 597 609 621 633 646 Business enterprises - - - - - - - - - - - - - - - - - - Other municipal services 473 482 492 502 512 522 532 543 554 565 576 588 600 612 624 636 649 662
2,158 2,201 2,245 2,290 2,336 2,383 2,431 2,480 2,530 2,580 2,631 2,683 2,736 2,791 2,847 2,904 2,962 3,022
TOTAL OPERATING EXPENDITURES 4,621 4,721 4,825 4,931 5,039 5,151 5,264 5,380 5,498 5,619 5,741 5,752 5,877 6,006 6,137 6,272 6,410 6,552
CAPITAL, RESERVES AND DEBT SERVICING
(4) Capital grants:Federal Gas Tax (144) (120) (120) (120) (120) (120) (120) (120) (120) (120) (120) (120) (120) (120) (120) (120) (120) (120) Municipal Infrastructure Investment Fund - - - - - - - - - - - - - - - - - - Other (575) - - - - - - - - - - - - - - - - -
(719) (120) (120) (120) (120) (120) (120) (120) (120) (120) (120) (120) (120) (120) (120) (120) (120) (120)
(5) Debentures:Debt servicing costs (municipal indebtedness) 253 1,972 1,965 1,822 1,680 1,655 1,615 1,615 1,615 1,419 1,353 1,225 1,153 1,117 446 944 944 871 Debt servicing costs (business enterprise indebtedness) - - - - - - - - - - - - - - - - - - Proceeds from issuance of debt - - - - - - - - - - - - - - - - - -
253 1,972 1,965 1,822 1,680 1,655 1,615 1,615 1,615 1,419 1,353 1,225 1,153 1,117 446 944 944 871
(6) Reserves and reserve funds:Contributions to reserves and reserve funds 542 - - - - - - - - - - - - - - - - - Contributions from reserve and reserve funds (698) - - - - - - - - - - - - - - - - -
(156) - - - - - - - - - - - - - - - - -
(7) Capital expenditures:Municipal infrastructure 1,637 9,121 - 214 1,335 362 279 1,384 697 486 3,899 3,822 3,897 3,975 4,054 4,135 4,217 4,301 Business enterprises - - - - - - - - - - - - - - - - - -
1,637 9,121 - 214 1,335 362 279 1,384 697 486 3,899 3,822 3,897 3,975 4,054 4,135 4,217 4,301
TOTAL MUNICIPAL EXPENDITURES, NET OF CAPITAL FINANCING 5,636 15,694 6,670 6,847 7,934 7,048 7,038 8,259 7,690 7,404 10,873 10,679 10,807 10,978 10,517 11,231 11,451 11,604
(8) Operating grants:Ontario Municipal Partnership Fund (1,457) (1,457) (1,457) (1,457) (1,457) (1,457) (1,457) (1,457) (1,457) (1,457) (1,457) (1,311) (1,311) (1,311) (1,311) (1,311) (1,311) (1,311) Other operating grants (21) (21) (21) (21) (21) (21) (21) (21) (21) (21) (21) (21) (21) (21) (21) (21) (21) (21)
(1,478) (1,478) (1,478) (1,478) (1,478) (1,478) (1,478) (1,478) (1,478) (1,478) (1,478) (1,332) (1,332) (1,332) (1,332) (1,332) (1,332) (1,332)
(9) User fees and other revenues:Water (625) (625) (625) (625) (625) (625) (625) (625) (625) (625) (625) (625) (625) (625) (625) (625) (625) (625) Wastewater (278) (278) (278) (278) (278) (278) (278) (278) (278) (278) (278) (278) (278) (278) (278) (278) (278) (278) Airport (249) (249) (249) (249) (249) (249) (249) (249) (249) (249) (249) (249) (249) (249) (249) (249) (249) (249) Other public works (230) (230) (230) (230) (230) (230) (230) (230) (230) (230) (230) (230) (230) (230) (230) (230) (230) (230) Community services (281) (281) (281) (281) (281) (281) (281) (281) (281) (281) (281) (281) (281) (281) (281) (281) (281) (281) Business enterprises - - - - - - - - - - - - - - - - - - Other municipal services (91) (91) (91) (91) (91) (91) (91) (91) (91) (91) (91) (91) (91) (91) (91) (91) (91) (91)
(1,754) (1,754) (1,754) (1,754) (1,754) (1,754) (1,754) (1,754) (1,754) (1,754) (1,754) (1,754) (1,754) (1,754) (1,754) (1,754) (1,754) (1,754)
(10) Non-levy items:Payments-in-lieu of taxes (93) (93) (93) (93) (93) (93) (93) (93) (93) (93) (93) (93) (93) (93) (93) (93) (93) (93) Write-offs, net of supplementary taxes, interest and other items 4 4 4 4 4 4 4 4 4 4 4 4 4 4 4 4 4 4
(89) (89) (89) (89) (89) (89) (89) (89) (89) (89) (89) (89) (89) (89) (89) (89) (89) (89)
(11) Muncipal levy:Residential (1,670) (9,858) (2,668) (2,809) (3,675) (2,969) (2,961) (3,934) (3,481) (3,253) (6,017) (5,979) (6,081) (6,217) (5,850) (6,419) (6,594) (6,716) Non-residential (426) (2,515) (681) (717) (938) (758) (756) (1,004) (888) (830) (1,535) (1,525) (1,551) (1,586) (1,492) (1,637) (1,682) (1,713)
(2,096) (12,373) (3,349) (3,526) (4,613) (3,727) (3,717) (4,938) (4,369) (4,083) (7,552) (7,504) (7,632) (7,803) (7,342) (8,056) (8,276) (8,429)
TOTAL MUNICIPAL REVENUES (5,417) (15,694) (6,670) (6,847) (7,934) (7,048) (7,038) (8,259) (7,690) (7,404) (10,873) (10,679) (10,807) (10,978) (10,517) (11,231) (11,451) (11,604)
NET MUNICIPAL BUDGET 219$ - - - - - - - - - - - - - - - - -
AVERAGE RESIDENTIAL PROPERTY TAX PER HOUSEHOLD 1,590$ 9,389 2,541 2,675 3,500 2,828 2,820 3,747 3,315 3,098 5,730 5,694 5,791 5,921 5,571 6,113 6,280 6,396
---------------------------------------------------------------------------------------------------------------------------------------------------------------------------------------------- Projected --------------------------------------------------------------------------------------------
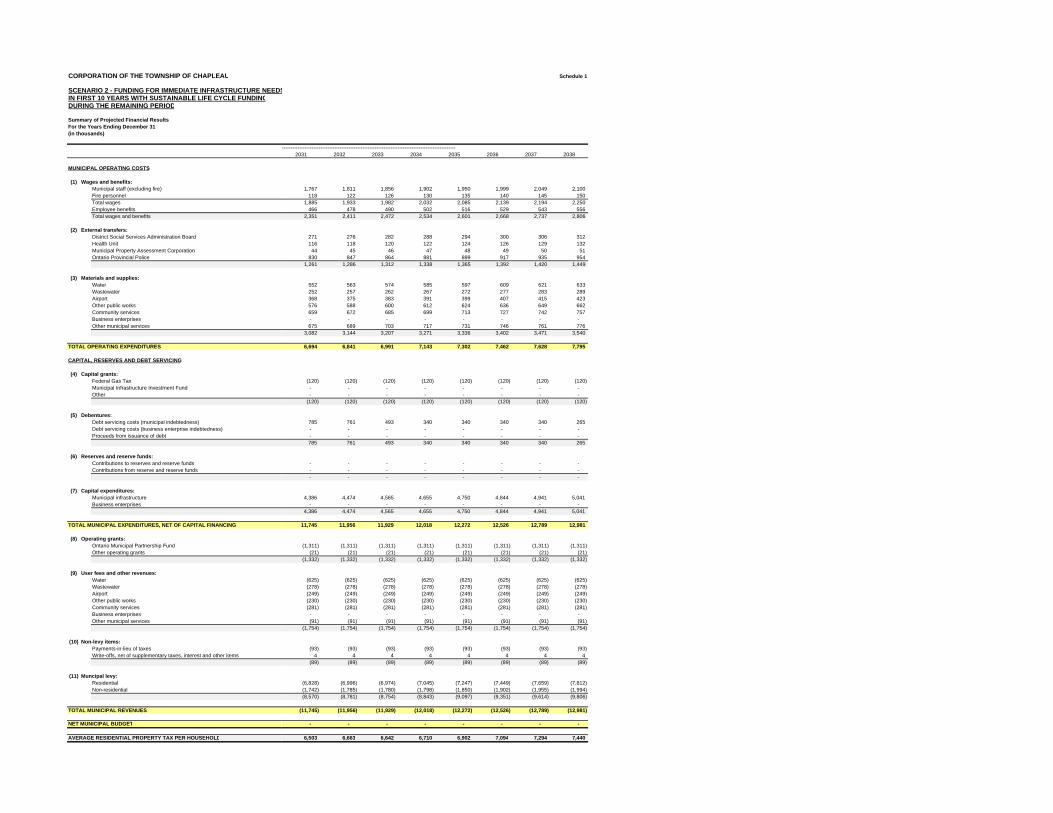
CORPORATION OF THE TOWNSHIP OF CHAPLEAU
SCENARIO 2 - FUNDING FOR IMMEDIATE INFRASTRUCTURE NEEDSIN FIRST 10 YEARS WITH SUSTAINABLE LIFE CYCLE FUNDINGDURING THE REMAINING PERIOD
Summary of Projected Financial Results For the Years Ending December 31(in thousands)
MUNICIPAL OPERATING COSTS
(1) Wages and benefits:Municipal staff (excluding fire)Fire personnelTotal wagesEmployee benefitsTotal wages and benefits
(2) External transfers:District Social Services Administration BoardHealth UnitMunicipal Property Assessment CorporationOntario Provincial Police
(3) Materials and supplies:WaterWastewaterAirportOther public worksCommunity servicesBusiness enterprisesOther municipal services
TOTAL OPERATING EXPENDITURES
CAPITAL, RESERVES AND DEBT SERVICING
(4) Capital grants:Federal Gas TaxMunicipal Infrastructure Investment FundOther
(5) Debentures:Debt servicing costs (municipal indebtedness)Debt servicing costs (business enterprise indebtedness)Proceeds from issuance of debt
(6) Reserves and reserve funds:Contributions to reserves and reserve fundsContributions from reserve and reserve funds
(7) Capital expenditures:Municipal infrastructureBusiness enterprises
TOTAL MUNICIPAL EXPENDITURES, NET OF CAPITAL FINANCING
(8) Operating grants:Ontario Municipal Partnership FundOther operating grants
(9) User fees and other revenues:WaterWastewaterAirportOther public worksCommunity servicesBusiness enterprisesOther municipal services
(10) Non-levy items:Payments-in-lieu of taxesWrite-offs, net of supplementary taxes, interest and other items
(11) Muncipal levy:ResidentialNon-residential
TOTAL MUNICIPAL REVENUES
NET MUNICIPAL BUDGET
AVERAGE RESIDENTIAL PROPERTY TAX PER HOUSEHOLD
Schedule 1
2031 2032 2033 2034 2035 2036 2037 2038
1,767 1,811 1,856 1,902 1,950 1,999 2,049 2,100 118 122 126 130 135 140 145 150
1,885 1,933 1,982 2,032 2,085 2,139 2,194 2,250 466 478 490 502 516 529 543 556
2,351 2,411 2,472 2,534 2,601 2,668 2,737 2,806
271 276 282 288 294 300 306 312 116 118 120 122 124 126 129 132 44 45 46 47 48 49 50 51
830 847 864 881 899 917 935 954 1,261 1,286 1,312 1,338 1,365 1,392 1,420 1,449
552 563 574 585 597 609 621 633 252 257 262 267 272 277 283 289 368 375 383 391 399 407 415 423 576 588 600 612 624 636 649 662 659 672 685 699 713 727 742 757 - - - - - - - - 675 689 703 717 731 746 761 776
3,082 3,144 3,207 3,271 3,336 3,402 3,471 3,540
6,694 6,841 6,991 7,143 7,302 7,462 7,628 7,795
(120) (120) (120) (120) (120) (120) (120) (120) - - - - - - - - - - - - - - - -
(120) (120) (120) (120) (120) (120) (120) (120)
785 761 493 340 340 340 340 265 - - - - - - - - - - - - - - - - 785 761 493 340 340 340 340 265
- - - - - - - - - - - - - - - - - - - - - - - -
4,386 4,474 4,565 4,655 4,750 4,844 4,941 5,041 - - - - - - - -
4,386 4,474 4,565 4,655 4,750 4,844 4,941 5,041
11,745 11,956 11,929 12,018 12,272 12,526 12,789 12,981
(1,311) (1,311) (1,311) (1,311) (1,311) (1,311) (1,311) (1,311) (21) (21) (21) (21) (21) (21) (21) (21)
(1,332) (1,332) (1,332) (1,332) (1,332) (1,332) (1,332) (1,332)
(625) (625) (625) (625) (625) (625) (625) (625) (278) (278) (278) (278) (278) (278) (278) (278) (249) (249) (249) (249) (249) (249) (249) (249) (230) (230) (230) (230) (230) (230) (230) (230) (281) (281) (281) (281) (281) (281) (281) (281) - - - - - - - - (91) (91) (91) (91) (91) (91) (91) (91)
(1,754) (1,754) (1,754) (1,754) (1,754) (1,754) (1,754) (1,754)
(93) (93) (93) (93) (93) (93) (93) (93) 4 4 4 4 4 4 4 4
(89) (89) (89) (89) (89) (89) (89) (89)
(6,828) (6,996) (6,974) (7,045) (7,247) (7,449) (7,659) (7,812) (1,742) (1,785) (1,780) (1,798) (1,850) (1,902) (1,955) (1,994) (8,570) (8,781) (8,754) (8,843) (9,097) (9,351) (9,614) (9,806)
(11,745) (11,956) (11,929) (12,018) (12,272) (12,526) (12,789) (12,981)
- - - - - - - -
6,503 6,663 6,642 6,710 6,902 7,094 7,294 7,440
---------------------------------------------------------------------------------------------------
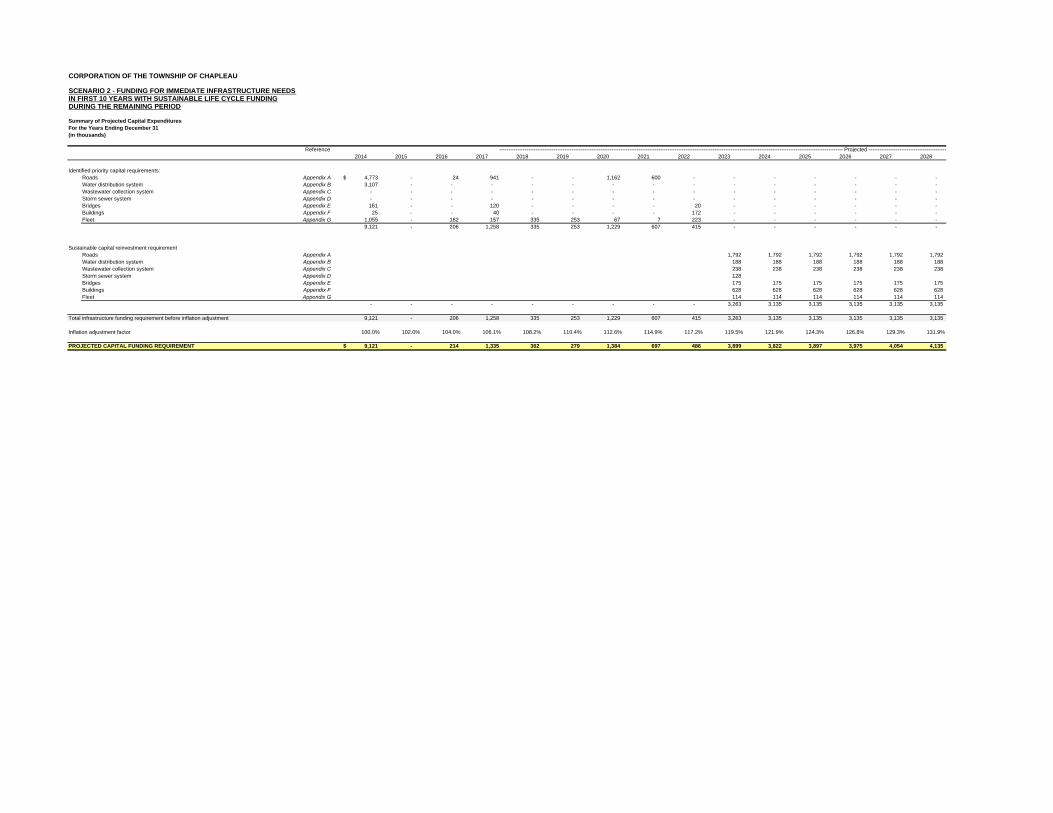
CORPORATION OF THE TOWNSHIP OF CHAPLEAU
SCENARIO 2 - FUNDING FOR IMMEDIATE INFRASTRUCTURE NEEDSIN FIRST 10 YEARS WITH SUSTAINABLE LIFE CYCLE FUNDINGDURING THE REMAINING PERIOD
Summary of Projected Capital ExpendituresFor the Years Ending December 31(in thousands)
Reference2014 2015 2016 2017 2018 2019 2020 2021 2022 2023 2024 2025 2026 2027 2028
Identified priority capital requirements:Roads Appendix A 4,773$ - 24 941 - - 1,162 600 - - - - - - - Water distribution system Appendix B 3,107 - - - - - - - - - - - - - - Wastewater collection system Appendix C - - - - - - - - - - - - - - - Storm sewer system Appendix D - - - - - - - - - - - - - - - Bridges Appendix E 161 - - 120 - - - - 20 - - - - - - Buildings Appendix F 25 - - 40 - - - - 172 - - - - - - Fleet Appendix G 1,055 - 182 157 335 253 67 7 223 - - - - - -
9,121 - 206 1,258 335 253 1,229 607 415 - - - - - -
Sustainable capital reinvestment requirementRoads Appendix A 1,792 1,792 1,792 1,792 1,792 1,792 Water distribution system Appendix B 188 188 188 188 188 188 Wastewater collection system Appendix C 238 238 238 238 238 238 Storm sewer system Appendix D 128 Bridges Appendix E 175 175 175 175 175 175 Buildings Appendix F 628 628 628 628 628 628 Fleet Appendix G 114 114 114 114 114 114
- - - - - - - - - 3,263 3,135 3,135 3,135 3,135 3,135
Total infrastructure funding requirement before inflation adjustment 9,121 - 206 1,258 335 253 1,229 607 415 3,263 3,135 3,135 3,135 3,135 3,135
Inflation adjustment factor 100.0% 102.0% 104.0% 106.1% 108.2% 110.4% 112.6% 114.9% 117.2% 119.5% 121.9% 124.3% 126.8% 129.3% 131.9%
PROJECTED CAPITAL FUNDING REQUIREMENT 9,121$ - 214 1,335 362 279 1,384 697 486 3,899 3,822 3,897 3,975 4,054 4,135
---------------------------------------------------------------------------------------------------------------------------------------------------------------------------------------------- Projected -------------------------------------------
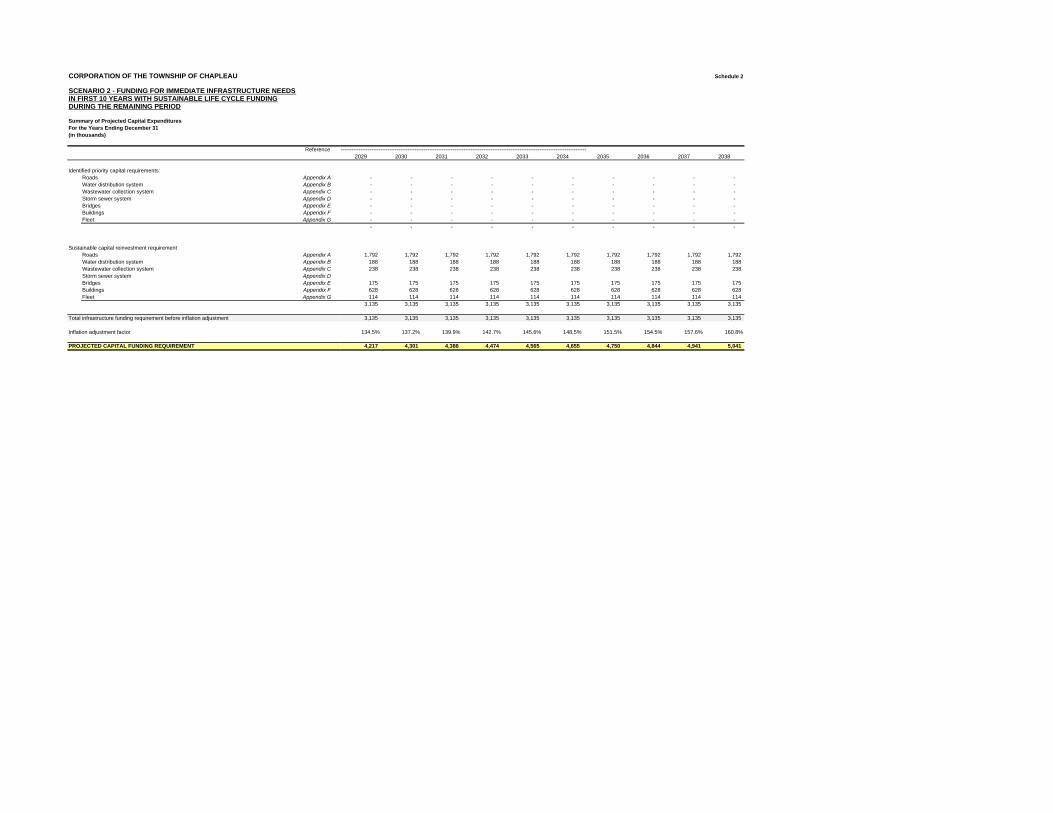
CORPORATION OF THE TOWNSHIP OF CHAPLEAU
SCENARIO 2 - FUNDING FOR IMMEDIATE INFRASTRUCTURE NEEDSIN FIRST 10 YEARS WITH SUSTAINABLE LIFE CYCLE FUNDINGDURING THE REMAINING PERIOD
Summary of Projected Capital ExpendituresFor the Years Ending December 31(in thousands)
Reference
Identified priority capital requirements:Roads Appendix AWater distribution system Appendix BWastewater collection system Appendix CStorm sewer system Appendix DBridges Appendix EBuildings Appendix FFleet Appendix G
Sustainable capital reinvestment requirementRoads Appendix AWater distribution system Appendix BWastewater collection system Appendix CStorm sewer system Appendix DBridges Appendix EBuildings Appendix FFleet Appendix G
Total infrastructure funding requirement before inflation adjustment
Inflation adjustment factor
PROJECTED CAPITAL FUNDING REQUIREMENT
Schedule 2
2029 2030 2031 2032 2033 2034 2035 2036 2037 2038
- - - - - - - - - - - - - - - - - - - - - - - - - - - - - - - - - - - - - - - - - - - - - - - - - - - - - - - - - - - - - - - - - - - - - - - - - - - - - - - -
1,792 1,792 1,792 1,792 1,792 1,792 1,792 1,792 1,792 1,792 188 188 188 188 188 188 188 188 188 188 238 238 238 238 238 238 238 238 238 238
175 175 175 175 175 175 175 175 175 175 628 628 628 628 628 628 628 628 628 628 114 114 114 114 114 114 114 114 114 114
3,135 3,135 3,135 3,135 3,135 3,135 3,135 3,135 3,135 3,135
3,135 3,135 3,135 3,135 3,135 3,135 3,135 3,135 3,135 3,135
134.5% 137.2% 139.9% 142.7% 145.6% 148.5% 151.5% 154.5% 157.6% 160.8%
4,217 4,301 4,386 4,474 4,565 4,655 4,750 4,844 4,941 5,041
----------------------------------------------------------------------------------------------------------------------------------------

Asset Management PlanningAsset Management Planning for the Township of Chapleau
Appendix LAppendix LFinancial Projections (Scenario 3)
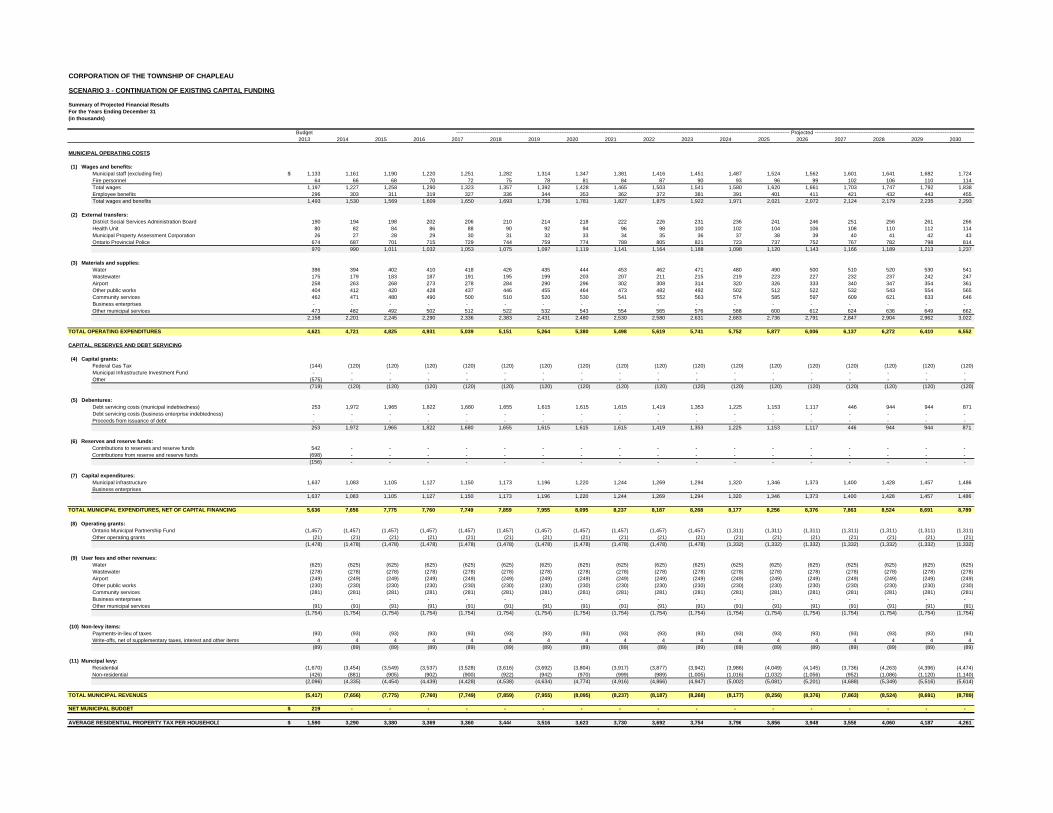
CORPORATION OF THE TOWNSHIP OF CHAPLEAU
SCENARIO 3 - CONTINUATION OF EXISTING CAPITAL FUNDING
Summary of Projected Financial Results For the Years Ending December 31(in thousands)
Budget2013 2014 2015 2016 2017 2018 2019 2020 2021 2022 2023 2024 2025 2026 2027 2028 2029 2030
MUNICIPAL OPERATING COSTS
(1) Wages and benefits:Municipal staff (excluding fire) 1,133$ 1,161 1,190 1,220 1,251 1,282 1,314 1,347 1,381 1,416 1,451 1,487 1,524 1,562 1,601 1,641 1,682 1,724 Fire personnel 64 66 68 70 72 75 78 81 84 87 90 93 96 99 102 106 110 114 Total wages 1,197 1,227 1,258 1,290 1,323 1,357 1,392 1,428 1,465 1,503 1,541 1,580 1,620 1,661 1,703 1,747 1,792 1,838 Employee benefits 296 303 311 319 327 336 344 353 362 372 381 391 401 411 421 432 443 455 Total wages and benefits 1,493 1,530 1,569 1,609 1,650 1,693 1,736 1,781 1,827 1,875 1,922 1,971 2,021 2,072 2,124 2,179 2,235 2,293
(2) External transfers:District Social Services Administration Board 190 194 198 202 206 210 214 218 222 226 231 236 241 246 251 256 261 266 Health Unit 80 82 84 86 88 90 92 94 96 98 100 102 104 106 108 110 112 114 Municipal Property Assessment Corporation 26 27 28 29 30 31 32 33 34 35 36 37 38 39 40 41 42 43 Ontario Provincial Police 674 687 701 715 729 744 759 774 789 805 821 723 737 752 767 782 798 814
970 990 1,011 1,032 1,053 1,075 1,097 1,119 1,141 1,164 1,188 1,098 1,120 1,143 1,166 1,189 1,213 1,237
(3) Materials and supplies:Water 386 394 402 410 418 426 435 444 453 462 471 480 490 500 510 520 530 541 Wastewater 175 179 183 187 191 195 199 203 207 211 215 219 223 227 232 237 242 247 Airport 258 263 268 273 278 284 290 296 302 308 314 320 326 333 340 347 354 361 Other public works 404 412 420 428 437 446 455 464 473 482 492 502 512 522 532 543 554 565 Community services 462 471 480 490 500 510 520 530 541 552 563 574 585 597 609 621 633 646 Business enterprises - - - - - - - - - - - - - - - - - - Other municipal services 473 482 492 502 512 522 532 543 554 565 576 588 600 612 624 636 649 662
2,158 2,201 2,245 2,290 2,336 2,383 2,431 2,480 2,530 2,580 2,631 2,683 2,736 2,791 2,847 2,904 2,962 3,022
TOTAL OPERATING EXPENDITURES 4,621 4,721 4,825 4,931 5,039 5,151 5,264 5,380 5,498 5,619 5,741 5,752 5,877 6,006 6,137 6,272 6,410 6,552
CAPITAL, RESERVES AND DEBT SERVICING
(4) Capital grants:Federal Gas Tax (144) (120) (120) (120) (120) (120) (120) (120) (120) (120) (120) (120) (120) (120) (120) (120) (120) (120) Municipal Infrastructure Investment Fund - - - - - - - - - - - - - - - - - - Other (575) - - - - - - - - - - - - - - - - -
(719) (120) (120) (120) (120) (120) (120) (120) (120) (120) (120) (120) (120) (120) (120) (120) (120) (120)
(5) Debentures:Debt servicing costs (municipal indebtedness) 253 1,972 1,965 1,822 1,680 1,655 1,615 1,615 1,615 1,419 1,353 1,225 1,153 1,117 446 944 944 871 Debt servicing costs (business enterprise indebtedness) - - - - - - - - - - - - - - - - - - Proceeds from issuance of debt - - - - - - - - - - - - - - - - - -
253 1,972 1,965 1,822 1,680 1,655 1,615 1,615 1,615 1,419 1,353 1,225 1,153 1,117 446 944 944 871
(6) Reserves and reserve funds:Contributions to reserves and reserve funds 542 - - - - - - - - - - - - - - - - - Contributions from reserve and reserve funds (698) - - - - - - - - - - - - - - - - -
(156) - - - - - - - - - - - - - - - - -
(7) Capital expenditures:Municipal infrastructure 1,637 1,083 1,105 1,127 1,150 1,173 1,196 1,220 1,244 1,269 1,294 1,320 1,346 1,373 1,400 1,428 1,457 1,486 Business enterprises - - - - - - - - - - - - - - - - - -
1,637 1,083 1,105 1,127 1,150 1,173 1,196 1,220 1,244 1,269 1,294 1,320 1,346 1,373 1,400 1,428 1,457 1,486
TOTAL MUNICIPAL EXPENDITURES, NET OF CAPITAL FINANCING 5,636 7,656 7,775 7,760 7,749 7,859 7,955 8,095 8,237 8,187 8,268 8,177 8,256 8,376 7,863 8,524 8,691 8,789
(8) Operating grants:Ontario Municipal Partnership Fund (1,457) (1,457) (1,457) (1,457) (1,457) (1,457) (1,457) (1,457) (1,457) (1,457) (1,457) (1,311) (1,311) (1,311) (1,311) (1,311) (1,311) (1,311) Other operating grants (21) (21) (21) (21) (21) (21) (21) (21) (21) (21) (21) (21) (21) (21) (21) (21) (21) (21)
(1,478) (1,478) (1,478) (1,478) (1,478) (1,478) (1,478) (1,478) (1,478) (1,478) (1,478) (1,332) (1,332) (1,332) (1,332) (1,332) (1,332) (1,332)
(9) User fees and other revenues:Water (625) (625) (625) (625) (625) (625) (625) (625) (625) (625) (625) (625) (625) (625) (625) (625) (625) (625) Wastewater (278) (278) (278) (278) (278) (278) (278) (278) (278) (278) (278) (278) (278) (278) (278) (278) (278) (278) Airport (249) (249) (249) (249) (249) (249) (249) (249) (249) (249) (249) (249) (249) (249) (249) (249) (249) (249) Other public works (230) (230) (230) (230) (230) (230) (230) (230) (230) (230) (230) (230) (230) (230) (230) (230) (230) (230) Community services (281) (281) (281) (281) (281) (281) (281) (281) (281) (281) (281) (281) (281) (281) (281) (281) (281) (281) Business enterprises - - - - - - - - - - - - - - - - - - Other municipal services (91) (91) (91) (91) (91) (91) (91) (91) (91) (91) (91) (91) (91) (91) (91) (91) (91) (91)
(1,754) (1,754) (1,754) (1,754) (1,754) (1,754) (1,754) (1,754) (1,754) (1,754) (1,754) (1,754) (1,754) (1,754) (1,754) (1,754) (1,754) (1,754)
(10) Non-levy items:Payments-in-lieu of taxes (93) (93) (93) (93) (93) (93) (93) (93) (93) (93) (93) (93) (93) (93) (93) (93) (93) (93) Write-offs, net of supplementary taxes, interest and other items 4 4 4 4 4 4 4 4 4 4 4 4 4 4 4 4 4 4
(89) (89) (89) (89) (89) (89) (89) (89) (89) (89) (89) (89) (89) (89) (89) (89) (89) (89)
(11) Muncipal levy:Residential (1,670) (3,454) (3,549) (3,537) (3,528) (3,616) (3,692) (3,804) (3,917) (3,877) (3,942) (3,986) (4,049) (4,145) (3,736) (4,263) (4,396) (4,474) Non-residential (426) (881) (905) (902) (900) (922) (942) (970) (999) (989) (1,005) (1,016) (1,032) (1,056) (952) (1,086) (1,120) (1,140)
(2,096) (4,335) (4,454) (4,439) (4,428) (4,538) (4,634) (4,774) (4,916) (4,866) (4,947) (5,002) (5,081) (5,201) (4,688) (5,349) (5,516) (5,614)
TOTAL MUNICIPAL REVENUES (5,417) (7,656) (7,775) (7,760) (7,749) (7,859) (7,955) (8,095) (8,237) (8,187) (8,268) (8,177) (8,256) (8,376) (7,863) (8,524) (8,691) (8,789)
NET MUNICIPAL BUDGET 219$ - - - - - - - - - - - - - - - - -
AVERAGE RESIDENTIAL PROPERTY TAX PER HOUSEHOLD 1,590$ 3,290 3,380 3,369 3,360 3,444 3,516 3,623 3,730 3,692 3,754 3,796 3,856 3,948 3,558 4,060 4,187 4,261
---------------------------------------------------------------------------------------------------------------------------------------------------------------------------------------------- Projected --------------------------------------------------------------------------------------------
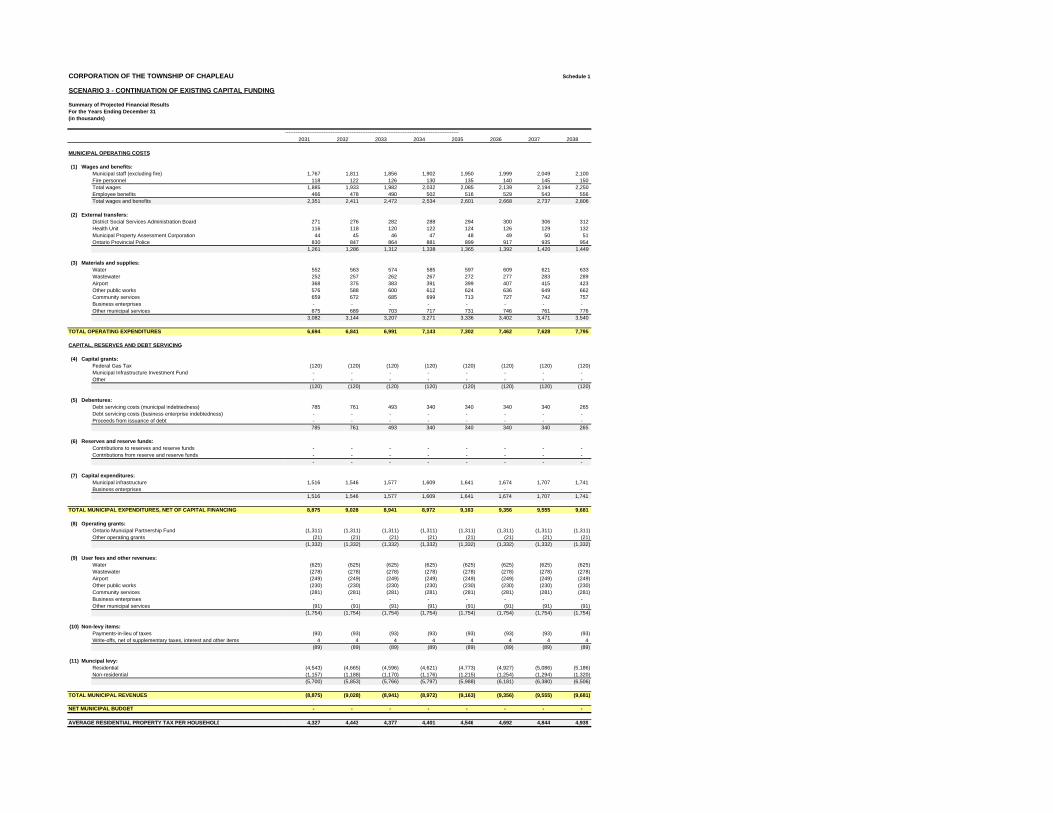
CORPORATION OF THE TOWNSHIP OF CHAPLEAU
SCENARIO 3 - CONTINUATION OF EXISTING CAPITAL FUNDING
Summary of Projected Financial Results For the Years Ending December 31(in thousands)
MUNICIPAL OPERATING COSTS
(1) Wages and benefits:Municipal staff (excluding fire)Fire personnelTotal wagesEmployee benefitsTotal wages and benefits
(2) External transfers:District Social Services Administration BoardHealth UnitMunicipal Property Assessment CorporationOntario Provincial Police
(3) Materials and supplies:WaterWastewaterAirportOther public worksCommunity servicesBusiness enterprisesOther municipal services
TOTAL OPERATING EXPENDITURES
CAPITAL, RESERVES AND DEBT SERVICING
(4) Capital grants:Federal Gas TaxMunicipal Infrastructure Investment FundOther
(5) Debentures:Debt servicing costs (municipal indebtedness)Debt servicing costs (business enterprise indebtedness)Proceeds from issuance of debt
(6) Reserves and reserve funds:Contributions to reserves and reserve fundsContributions from reserve and reserve funds
(7) Capital expenditures:Municipal infrastructureBusiness enterprises
TOTAL MUNICIPAL EXPENDITURES, NET OF CAPITAL FINANCING
(8) Operating grants:Ontario Municipal Partnership FundOther operating grants
(9) User fees and other revenues:WaterWastewaterAirportOther public worksCommunity servicesBusiness enterprisesOther municipal services
(10) Non-levy items:Payments-in-lieu of taxesWrite-offs, net of supplementary taxes, interest and other items
(11) Muncipal levy:ResidentialNon-residential
TOTAL MUNICIPAL REVENUES
NET MUNICIPAL BUDGET
AVERAGE RESIDENTIAL PROPERTY TAX PER HOUSEHOLD
Schedule 1
2031 2032 2033 2034 2035 2036 2037 2038
1,767 1,811 1,856 1,902 1,950 1,999 2,049 2,100 118 122 126 130 135 140 145 150
1,885 1,933 1,982 2,032 2,085 2,139 2,194 2,250 466 478 490 502 516 529 543 556
2,351 2,411 2,472 2,534 2,601 2,668 2,737 2,806
271 276 282 288 294 300 306 312 116 118 120 122 124 126 129 132 44 45 46 47 48 49 50 51
830 847 864 881 899 917 935 954 1,261 1,286 1,312 1,338 1,365 1,392 1,420 1,449
552 563 574 585 597 609 621 633 252 257 262 267 272 277 283 289 368 375 383 391 399 407 415 423 576 588 600 612 624 636 649 662 659 672 685 699 713 727 742 757 - - - - - - - - 675 689 703 717 731 746 761 776
3,082 3,144 3,207 3,271 3,336 3,402 3,471 3,540
6,694 6,841 6,991 7,143 7,302 7,462 7,628 7,795
(120) (120) (120) (120) (120) (120) (120) (120) - - - - - - - - - - - - - - - -
(120) (120) (120) (120) (120) (120) (120) (120)
785 761 493 340 340 340 340 265 - - - - - - - - - - - - - - - - 785 761 493 340 340 340 340 265
- - - - - - - - - - - - - - - - - - - - - - - -
1,516 1,546 1,577 1,609 1,641 1,674 1,707 1,741 - - - - - - - -
1,516 1,546 1,577 1,609 1,641 1,674 1,707 1,741
8,875 9,028 8,941 8,972 9,163 9,356 9,555 9,681
(1,311) (1,311) (1,311) (1,311) (1,311) (1,311) (1,311) (1,311) (21) (21) (21) (21) (21) (21) (21) (21)
(1,332) (1,332) (1,332) (1,332) (1,332) (1,332) (1,332) (1,332)
(625) (625) (625) (625) (625) (625) (625) (625) (278) (278) (278) (278) (278) (278) (278) (278) (249) (249) (249) (249) (249) (249) (249) (249) (230) (230) (230) (230) (230) (230) (230) (230) (281) (281) (281) (281) (281) (281) (281) (281) - - - - - - - - (91) (91) (91) (91) (91) (91) (91) (91)
(1,754) (1,754) (1,754) (1,754) (1,754) (1,754) (1,754) (1,754)
(93) (93) (93) (93) (93) (93) (93) (93) 4 4 4 4 4 4 4 4
(89) (89) (89) (89) (89) (89) (89) (89)
(4,543) (4,665) (4,596) (4,621) (4,773) (4,927) (5,086) (5,186) (1,157) (1,188) (1,170) (1,176) (1,215) (1,254) (1,294) (1,320) (5,700) (5,853) (5,766) (5,797) (5,988) (6,181) (6,380) (6,506)
(8,875) (9,028) (8,941) (8,972) (9,163) (9,356) (9,555) (9,681)
- - - - - - - -
4,327 4,443 4,377 4,401 4,546 4,692 4,844 4,939
---------------------------------------------------------------------------------------------------

Asset Management PlanningAsset Management Planning for the Township of Chapleau
Appendix MAppendix MSuggested Capital Financing Policy
PURPOSE
The goal of the Municipality’s capital financing policy shall be to set out the guiding principles for the financing of future capital expenditures in a manner that considers the infrastructure investment requirements of the Municipality as well as affordability issues for taxpayers.
GLOSSARY
Capital Levy – The amount of money raised through taxation that is transferred to the capital fund or reserves to be used to help pay for the cost of capital projects.
Debt – Any obligation for the payment of money. The Municipality considers debt to consist of debentures, cash loans from financial institutions, capital leases, debenture financing approved through bylaw for which no debt has yet been issued, debenture financing approved through the capital budget for which no bylaw has yet been established, outstanding financial commitments, loan guarantees and any debt issue by, or on behalf of the Municipality, including mortgages, debentures or demand loans.
Long-term Debt – Any Debt for which the repayment of any portion of the principal is due beyond one year.
Municipal Levy – The amount of money raised through taxation by the Municipality for the purposes of funding operating costs as well as the Capital Levy.
POLICY STATEMENTS
1. The Municipality shall increase the Municipal Levy by a minimum of 2% per year for each of the next five years (2014 to 2018 inclusive), with the 2% increase being added to the Capital Levy.
2. The increase in the Capital Levy shall only be used for the following purposes:
a. To fund capital expenditures;
b. To increase reserve balances in order to finance future capital expenditures; or
c. To finance the annual costs associated with Long-term Debt issued in connection with capital projects.
3. Subsequent to the five year phase-in period for increases to the Municipal Levy, the Municipality shall increase the Capital Levy by at least the Consumer Price Index, as published by Statistics Canada.

Asset Management PlanningAsset Management Planning for the Township of Chapleau
Appendix NAppendix NSuggested Borrowing Policy
PURPOSE
The goal of the Municipality’s debt policy shall be to set out the guiding principles for the approval, issuance and administration of any Municipality debt, which shall adhere to all statutory requirements.
GLOSSARY
Debt – Any obligation for the payment of money. The Municipality considers debt to consist of debentures, cash loans from financial institutions, capital leases, debenture financing approved through bylaw for which no debt has yet been issued, debenture financing approved through the capital budget for which no bylaw has yet been established, outstanding financial commitments, loan guarantees and any debt issue by, or on behalf of the Municipality, including mortgages, debentures or demand loans.
Debt and Financial Obligation Limit – The maximum amount of annual debt servicing costs that a municipality can undertake or guarantee without seeking the approval of the Ontario Municipal Board. The Debt and Financial Obligation Limit is calculated pursuant to Ontario Regulation 403/02 – Debt and Financial Obligation Limits.
Lease Financial Agreements – A financial agreement, in accordance with Ontario Regulation 653/05 – Debt Related Financial Instruments and Financial Agreements, that a municipality may enter into for the purpose of obtaining long-term financing of a capital undertaking of the municipality.
Long-term Debt – Any Debt for which the repayment of any portion of the principal is due beyond one year.
Material Impact – Under Ontario Regulation 653/05 – Debt Related Financial Instruments and Financial Agreements, a Lease Financing Agreement has a material impact on a municipality if the costs or risks associated with the agreement significantly affect the municipality's Debt and Financial Obligation Limit, or would reasonably be expected to have a significant effect on that limit.
POLICY STATEMENTS
1. The Municipality shall only enter into Long-term Debt, including Lease Financing Agreements, where the following conditions are met:
a. The Long-term Debt will be managed in a manner consistent with other long-term planning, financial and management objectives.
b. Consideration will be given to the impact on future taxpayers.
c. Long-term Debt will be managed in a manner to limit financial risk exposure.
d. The timing, type and term of Long-term Debt will be determined with a view of minimizing long-term cost to the extent possible.
e. The term of Long-term Debt will not exceed the useful life of the particular asset.
f. The issuance of Long-term Debt will not result in the Municipality exceeding its Debt and Financial Obligation Limit.
g. A category of Lease Financing Agreements may be relied upon for non-material or operational leases where the agreements will not, in the opinion of the Treasurer as delegated by Council through this policy, result in a Material Impact for the Municipality.
2. All Debt shall be issued in Canadian dollars.
3. It shall be the general practice to issue Debt where the interest rates will be fixed over its term. The Municipality may issue Debt in which the interest rate will vary where, in the opinion of the Treasurer, it is in the Municipality’s best interest to allow the rate to float provided such Debt, in addition to any other Debt, does not exceed fifteen percent (15%) of the total outstanding Debt of the Municipality in accordance with Ontario Regulation 276/02 – Bank Loans.
4. Upon the repayment of Long-term Debt, the amounts previously committed to annual debt servicing shall not be removed from the Municipality’s budget but rather will be reallocated towards:
a. Debt servicing costs for new Debt issued by the Municipality; and/or
b. Contributions to reserves for capital purposes.
5. The awarding of any contract under this Policy, unless otherwise authorized by Council, shall follow the requirements as set out in the Municipality’s procurement policy.
6. Council, in conjunction with staff, shall review the Municipality’s outstanding Debt in conjunction with the annual budget process.
RELEVANT LEGISLATION
Municipal Act, 2001
Ontario Regulation 247/01 – Variable Interest Rate Debentures and Foreign Currency Borrowing
Ontario Regulation 276/02 – Bank Loans
Ontario Regulation 278/02 – Construction Financing
Ontario Regulation 403/02 – Debt and Financial Obligation Limits
Ontario Regulation 653/05 – Debt Related Financial Instruments and Financial Agreements
KPMG CONFIDENTIAL
The information contained herein is of a general nature and is not intended to address the circumstances of any particular individual or entity. Although we endeavor to provide accurate and timely information, there can be no guarantee that such information is accurate as of the date it is received or that it will continue to be accurate in the future. No one should act on such information without appropriate professional advice after a thorough examination of the particular situation.
© 2013 KPMG LLP, a Canadian limited liability partnership and a member firm of the KPMG network of independent member firms affiliated with KPMG International Cooperative (“KPMG International”), a Swiss entity. All rights reserved.
The KPMG name, logo and “cutting through complexity” are registered trademarks or trademarks of KPMG International.