Corporate Social Responsibility Report CSR Report 2015 ... · Sales 1 company and 13 business sites...
15
CSR Report 2015 (including the Data Book (PDF)) has been reviewed for assurance by an independent third party and as a result has been granted the sustainability report review and registration logo. This demonstrates that this report satisfies the necessary criteria established by the Japanese Association of Assurance Organizations for Sustainability Information (J-SUS; http://www.j-sus.org/) for the use of this logo, intended to assure the reliability of sustainability information. This report has been printed and bound with consideration for the environment in the following ways: (1) This report uses Forest Stewardship Council (FSC®)-certified paper produced from carefully managed forests. (2) The computer-to-plate (CTP) method of direct printing, which uses no film that later must be disposed of as waste, is used in the plate-making process. (3) Vegetable-oil ink, which generates few volatile organic compounds (VOC) and has excellent biodegradability and de-inking performance, is used in the printing process. Waterless printing, which generates no hazardous waste fluids, has been used as well. (4) Glue that does not hinder the recyclability of paper is used in the binding process. Corporate Social Responsibility Report CSR Report 2015 Data Book Management Benchmarks (Consolidated) Coverage of the Environmental Performance Data Results of the Medium-Term Environmental Plan Sekisui Chemical Group’s Environmental Accounting Integrated Index: SEKISUI Environmental Sustainability Index Material Balance (in Japan) Environment-Contributing Products Product Assessment System for Environmental Impact Biodiversity Global Warming Prevention Resource Recycling and Saving Environmental Performance in Offices Atmospheric and Water-Related Emissions Environmental Incidents, Complaints, and Emergency Responses Chemical Substances Environmental Management CS & Quality Human Resources Safety Compliance Environmental and Social Contribution Sekisui Chemical Group’s CSR Management System Sekisui Chemical Group’s CSR Management Policies Calculation Standards of Key Performance Indicators 1 2 3 5 7 7 8 8 8 9 11 12 13 13 14 15 16 17 18 20 20 22 23 26 Published: June 25, 2015. Published annually. Previous edition published: June 26, 2014. Next edition planned for publication: June 2016 Scope of Independent Practitioner’s Assurance The environmental and social information in this report has been subjected to the independent practitioner’s assurance for the appropriateness of calculation methods and the accuracy of the results of calculation. The “Verified” logo is used to indicate that each item of such subject information has been verified. 4-4 Nishitenma 2-chome, Kita-ku, Osaka 530-8565, Japan (Dojima Kanden Bldg.) URL http://www.sekisuichemical.com/ For further information contact: CSR Planning, CSR Promotion Department 2-3-17 Toranomon, Minato-ku, Tokyo 105-8450, Japan (Toranomon 2-chome Tower) Email: [email protected]
Transcript of Corporate Social Responsibility Report CSR Report 2015 ... · Sales 1 company and 13 business sites...

CSR Report 2015 (including the Data Book (PDF)) has been reviewed for assurance by an independent third party and as a result has been granted the sustainability report review and registration logo. This demonstrates that this report satis�es the necessary criteriaestablished by the Japanese Association of Assurance Organizations for Sustainability Information (J-SUS; http://www.j-sus.org/) for the use of this logo, intended to assure the reliability of sustainability information.
This report has been printed and bound with consideration for the environment in the following ways:(1) This report uses Forest Stewardship Council (FSC®)-certi�ed paper produced from carefully managed forests.(2) The computer-to-plate (CTP) method of direct printing, which uses no �lm that later must be disposed of as waste, is used in the plate-making process.(3) Vegetable-oil ink, which generates few volatile organic compounds (VOC) and has excellent biodegradability and de-inking performance, is used in the printing process. Waterless printing, which generates no hazardous waste �uids, has been used as well.(4) Glue that does not hinder the recyclability of paper is used in the binding process.
Corporate Social Responsibility Report
CSR Report 2015Data Book
Management Benchmarks (Consolidated)
Coverage of the Environmental Performance Data
Results of the Medium-Term Environmental Plan
Sekisui Chemical Group’s Environmental Accounting
Integrated Index: SEKISUI Environmental Sustainability Index
Material Balance (in Japan)
Environment-Contributing Products
Product Assessment System for Environmental Impact
Biodiversity
Global Warming Prevention
Resource Recycling and Saving
Environmental Performance in Offices
Atmospheric and Water-Related Emissions
Environmental Incidents, Complaints, and Emergency Responses
Chemical Substances
Environmental Management
CS & Quality
Human Resources
Safety
Compliance
Environmental and Social Contribution
Sekisui Chemical Group’s CSR Management System
Sekisui Chemical Group’s CSR Management Policies
Calculation Standards of Key Performance Indicators
1
2
3
5
7
7
8
8
8
9
11
12
13
13
14
15
16
17
18
20
20
22
23
26
Published: June 25, 2015. Published annually. Previous edition published: June 26, 2014. Next edition planned for publication: June 2016
Scope of Independent Practitioner’s Assurance
The environmental and social information in this report has been
subjected to the independent practitioner’s assurance for the
appropriateness of calculation methods and the accuracy of the
results of calculation. The “Verified” logo is used to indicate
that each item of such subject information has been verified.
4-4 Nishitenma 2-chome, Kita-ku, Osaka 530-8565, Japan (Dojima Kanden Bldg.)URL http://www.sekisuichemical.com/
For further information contact:CSR Planning, CSR Promotion Department2-3-17 Toranomon, Minato-ku, Tokyo 105-8450, Japan (Toranomon 2-chome Tower)Email: [email protected]

Coverage of the Environmental Performance Data
12,000
10,000
6,000
8,000
4,000
2,000
0
(100 million yen)
2010
2,816
1,955
4,186
195
9,154
2011
2,968
2,000
4,493
190
2012
3,320
2,145
4,690
168
10,324
2014
3,722
2,276
4,941
188
11,127
2013
3,537
2,399
4,967
203
11,108
9,650
HousingCompany
UrbanInfrastructure &EnvironmentalProductsCompany
Others
HighPerformancePlasticsCompany
Sales (by Each Division Company)
(100 million yen) (%)
2010
3,000
2,500
2,000
1,500
1,000
500
30
25
20
15
10
5
0
19.7
2011
19.6
2012
23.0
0 89
528
506
675
1,800
104
564
570
655
1,895
104
767
633
872
2013 2014
23.4
102
779
670
1,042
2,594 24.9
99
847
642
1,182
2,772
2,378
Others
NorthAmerica
Europe
Asia
Overseas Sales and Sales Ratio
300
200
100
0
(100 million yen)
2010
246
2011
256
2012
258
2013
277
2014
294
R&D Costs
(100 million yen)
2010
400
600
500
100
300
200
−300
−200
−100
126
-123
2011
306
2012 2013
588
2014
0
249
Free Cash Flows
10,000
6,000
8,000
4,000
2,000
0
(100 million yen)
2010
7,901
2011
8,271
2012
9,015
2013
9,610
2014
9,680
Total Assets
600
900
300
0
−200
(100 million yen)
2011
244
15
493
244
2010
-9
206
30
546
311
0
232
18
596
363
-18 -11
2012 2013
361
825
411
65
-27
2014
459
857
413
12
HousingCompany
UrbanInfrastructure &EnvironmentalProductsCompany
Others
HighPerformancePlasticsCompany
Operating Income (by Each Division Company)
0
10
5
15
20
(Yen)
2010
30
25
13
2011
15
2012
18
2013
23
2014
27
500
300
400
200
100
0
(100 million yen)
2010
252
2011
330
2012
368
2013
418
2014
469
Capital Expenditures
Annual Dividend per Share
24,000
16,000
8,000
0 1,031 1,022
5,655 6,443
2010
4,447
8,637
19,770
2011
4,570
8,820
20,855
995
6,545
2012
9,775
22,202
4,887
956
6,858
2013
9,840
23,017
5,363
940
7,051
2014
10,442
23,886
5,453
HousingCompany
HighPerformancePlasticsCompany
Headquarters
UrbanInfrastructure & EnvironmentalProductsCompany
400
300
200
100
0
(100 million yen)
2010
345
2011
351
2012
348
2013
343
2014
312
Depreciation and Amortization
Number of Employees
(%)
1,500
1,200
900
600
300
0
50
40
30
20
10
0
(100 million yen)
2010
1,245
36.6
2011
1,271
36.2
2012 2013
1,153
94027.6
20.6
2014
631
12.2
Interest-bearingdebt
Interest-bearingdebt as a percentageof equity capital
Interest-bearing Debt andInterest-bearing Debt as a Percentage of Equity Capital
5
(%)
6.9
8.1
0
2010 20122011
7.8
2013 2014
15
10 9.4
10.9
ROE
* Fiscal 2012: Performance for overseas subsidiaries is for the 15-month period January 2012 through March 2013 (in connection with standardization of the fiscal years of consolidated subsidiaries to end in March beginning with fiscal 2012).
Management Benchmarks (Consolidated)
Housing Company
Urban Infrastructure &Environmental Products Company
R&D institutes
Japan
Overseas
Sekisui Chemical Co., Ltd. Tsukuba R&D Site
Production plants
Sales and constructioncompanies
Kanto Sekisui Heim Industry Co., Ltd.Kinki Sekisui Heim Industry Co., Ltd.Sekisui Board Co., Ltd., etc.
Sekisui Heim Sales CompaniesConstruction and Service Companies
1 company and 1 business site
11 companies and 10 business sites
28 companies and106 business sites
40 companies and 117 business sites in total
19 companies and 25 business sites in total Total: 74 companies and 169 business sites
High Performance Plastics Company
High Performance Plastics Company
R&D institutes
Sekisui Chemical Co., Ltd. Minase SiteSekisui Medical Co., Ltd. ADME & Tox. Research Institute
Production plants
Sekisui Chemical Co., Ltd. Musashi PlantSekisui Chemical Co., Ltd. Shiga-Minakuchi PlantSekisui Chemical Co., Ltd. Taga PlantSekisui Techno Molding Co., Ltd. / Sekisui Film Co., Ltd.Sekisui Medical Co., Ltd., etc. / Sekisui Fuller Co., Ltd.Sekisui Nano Coat Technology Co., Ltd. etc.
SEKISUI Polymer Innovations, LLC. Bloomsburg PlantSEKISUI Polymer Innovations, LLC. Holland PlantSekisui Industrial Piping Co., Ltd. Sekisui (Qingdao) Plastic Co., Ltd.Sekisui (Wuxi) Plastics Technology Co., Ltd.Sekisui Eslon B.V.Yongchang Sekisui Composites Co., Ltd.Sekisui Rib Loc Australia Pty. Ltd.
Sekisui S-Lec America, LLC.Sekisui S-Lec Mexico S.A. de C.V.Sekisui S-Lec B.V. Film PlantSekisui S-Lec B.V. Resin PlantSekisui S-Lec (Thailand) Co., Ltd.Sekisui S-LEC (Suzhou) Co., Ltd.Sekisui Specialty Chemicals America, LLC. Pasadena Plant
Sekisui Specialty Chemicals America, LLC. Calvert City PlantSekisui Specialty Chemicals Europe, S.L.Sekisui Voltek, LLC. Lawrence PlantSekisui Voltek, LLC. Coldwater PlantSekisui Alveo B.V.Sekisui Alveo Ltd.Sekisui Alveo BS G.m.b.H.Thai Sekisui Foam Co., Ltd.Sekisui Pilon Pty. Ltd.YoungBo Chemical Co., Ltd. Daejeon PlantYoungBo Chemical Co., Ltd. Cheongwon PlantYoungBo HPP (Langfang) Co., Ltd.Sekisui TA Industries, LLC. Buena Park Plant*Sekisui TA Industries, LLC. Tennessee PlantSekisui High Performance Packaging (Langfang) Co., Ltd.Sekisui Medical Technology (China) Ltd.XenoTech, LLC.Sekisui Diagnostics, LLC. Stamford*Sekisui Diagnostics, LLC. San DiegoSekisui Diagnostics (UK) Ltd.Sekisui Diagnostics P.E.I. Inc.Sekisui Virotech G.m.b.H.Sekisui DLJM Molding Private Ltd. Greater Noida PlantSekisui DLJM Molding Private Ltd. Tapukara Plant
2 companies and 2 business sites
11 companies and 14 business sites
11 companies and 16 business sites in total
Urban Infrastructure &Environmental Products Company
Sekisui Chemical Co., Ltd. Higashinihon Branch,Nishinihon Branch etc.
18 business sites in total
31 business sites in total
R&D institutesSekisui Chemical Co., Ltd. Kyoto Research & Development Laboratories
1 company and 1 business site
Sekisui Chemical Co., Ltd. Shiga-Ritto PlantSekisui Chemical Co., Ltd. Gunma PlanSekisui Chemical Hokkaido Co., Ltd.Toto Sekisui Co., Ltd. Ota PlantChiba Sekisui Industry Co., Ltd. / Nara Sekisui Co., Ltd. Okayama Sekisui Industry Co., Ltd. / Shikoku Sekisui Co., Ltd.,Kyushu Sekisui Industry Co., Ltd. / Hanyu Sekisui Co., Ltd.Yamanashi Sekisui Co., Ltd. etc.
Production plants19 companies and
11 business sites
Headquarters
R&D institutes
Sekisui Chemical Co., Ltd. Development Center
1 company and 1 business site
Note: The total number of companies and business sites do not match, since some companies have two or more business sites, and some business sites are shared by two or more companies.
Production Plants and HeadquartersSekisui Seikei, Ltd.Hinomaru Co., Ltd.Tokuyama Sekisui Industry Co., Ltd.,Osaka Headquarters and Tokyo Headquarters etc.
7 companies and10 business sites
7 companies and 11 business sites in total
* Data was collected only for wastes and CO2 emissions.
Scope of data collection revised to fiscal 2014, the first fiscal year of the environmental medium-term SEKISUI Environmental Sustainability Plan Take-Off.
Sales1 company and
13 business sites
1 2

New Environmental Medium-Term Plan
Efforts
Subjects
Indicators Medium-Term Targets(2014-2016) Fiscal 2014 Targets Fiscal 2014 Results Evaluation Page
Production sites in Japan
Laboratories
Dom
estic offices
Overseas production sites
Overseas offi
ces
Other
atipac larutan fo nruter eht ot etubirtnoC
Expand andcreate Environment-Contributing Products
Increase sales of Environment-Contributing Products ○ ○ ○ ○Environment-Contributing Product sales ratio (consolidated) 50% 44% 44.5% ○ 31
Data Book 8
Create Environment-Contributing Products ○ ○ ○Number of new Environment-Contributing Product registrations 30 products 10 products 22 products ○
tcapmi latne
mnorivne ecudeR
Greenhousegases, energy
Reducegreenhouse gas emissions
Emissions reductions ○ ○ GHG emissions Total emissions level maintained(compared to fiscal 2013) ±0%
-2.5%(Japan: -5.7%, overseas: -0.2%)
○27
Data Book 9
Energyconservation Reduce energy use
○ ○ Energy consumption per unit of output -3%(compared to fiscal 2013) -1%
+3.6%(Japan: ×1.0%, overseas: +4.8%)
×27
Data Book 9
○ Energy consumption per capita -3%(compared to fiscal 2013) -1% -4.3% ○
○ ○ Energy consumption per unit of area -3%(compared to fiscal 2013) -1%
+0.3%(Japan: +0.4%, overseas: -8.8%)
×
○ Energy consumption per unit of transportation -3%(compared to fiscal 2013) -1% +1.7% × Data Book 10
Resources,waste
Waste reduction
Reduce waste generationby production volume ○ ○ Waste generated per unit of output -12%
(compared to fiscal 2013) -4%+8.6%
(Japan: +6.5%, overseas: +10.9%)×
28Data Book 11
Reduce use of resources in offices ○ ○ Copier paper use per capita -6%
(compared to fiscal 2013) -2%-2.9%
(Japan: -2.9%, overseas: -6.5%)○ Data Book 12
Reduce waste generation at new construction sites ○ Waste generated per building Sekisui Heim 825kg/building
Two-U Home 1,375kg/buildingSekisui Heim: 915kg/building
Two-U Home: 1,465kg/building
Sekisui Heim: 1,233kg/building
Two-U Home: 1,748kg/building×
28Data Book 12
EMS,zero emissions
EMS certification ○ ○ ○ Number of business sites with EMS certification 15 business sites certified (compared with fiscal 2013) 1 business site 2 business sites ○
26Data Book 15
Expand zero emissions activities ○ ○ ○Number of business sites that have achieved zero emissions
13 business sites achieved (compared with fiscal 2013) 1 business site 2 business sites ○
28Data Book 11
Otherenvironmental impact
Reduce water use ○ ○ Water usage No change in total volume (compared with fiscal 2013) ±0%
-5.1%(Japan: -6.0%, overseas: -0.8%)
○ Data Book 12
Reduce atmospheric VOC emissions ○ ○ VOC emissionsNo change in total volume
(compared with fiscal 2013)(Overseas 2014 BM)
±0%Japan -6.6%
Still tallying overseas data○
29Data Book 14
tnemnorivne larutan evresno
C
Business siteactivities
Improve quality of green space on business sites ○ ○ JBIB Land Use Score Card® points + 10 points
(compared to fiscal 2013) +3 points +4.6 points ○ 30
Promote Sekisui Environment Week ○ ○ ○ ○ ○ Ratio of participants to total employees 100% 60% 54% ×
Activities inpartnershipwith localcommunities
Japan
Activities centered on production sites ○ ○
Number of business sites implementing self-guided activities 25 business sites 8 business sites 14 business sites ○
Activities centered on sales companies ○ Number of activity blocs 7 blocs 2 additional blocs 2 additional blocs ○
Overseas ○ ○ Five sites continue the activities at least once a year 5 bases 5 bases 5 bases ○
Targets and Results of Initiatives under Environmental Medium-Term SEKISUI Environmental Sustainability Plan Take-Off (FY 2014-2016)
3 4
Items FY2012 FY2013 FY2014Category Description of main activities Costs Investments Costs Investments Costs Investments
1) Costs within business areas
Prevention of air, water, and noise pollution, etc. 1,589 215 1,243 192 1,284 318
Countermeasures against global warming (energy saving), etc. 504 993 732 885 503 1,026
Waste reduction, recycling, disposal, etc. 4,914 195 4,467 280 4,442 84
2) Upstream/downstream costs Cost increases due to URU, switching to packaging/packing methodsinvolving reduced environmental impact, greener purchasing, etc.
248 0 334 5 231 0
3) Administrative costs Environmental education, EMS maintenance, running costs forgreen action organization, information disclosure, etc.
2,408 4 1,818 4 2,077 37
4) Research & development costs Research and development on environmental conservation 3,222 244 3,183 999 2,849 230
5) Social activities costs Social contributions, etc. 78 0 338 1,754 331 0
6) Environmental damage costs Nature restoration, etc. 26 0 30 0 32 0
Total 12,990 1,652 12,144 4,120 11,748 1,694
Total amount of R&D costs* and investment in the fiscal period (million yen) 25,895 15,473 27,721 16,217 29,453 18,560
Ratio of amount related to environmental conservation activities to total (%) 12.4 10.7 11.5 25.4 9.7 9.1
Environmental Conservation Benefits Environmental performance criteria: per unit of output; Total Self-evalu-ationDescription of effects Item Unit FY2012 FY2013 FY2014 Effect
(14-13) See page Item Unit FY2013 FY2014
Effectswithinbusinessareas
Effects oninvestedresources
Amount of energyusage 1
(1) Electricity TJ 3,315 3,360 3,423 63 Data Book 9 (1) Energy usage per unit ofoutput (electricity + fuel) 1 GJ/ton 1.64 1.71 ×
(2) Fuel TJ 2,142 2,259 2,172 -87 Data Book 9
Effects onenvironmentalimpact andwaste
(3) CO2 emissions 2 Thousandtons 303.9 312.1 311.6 -0.5 Data Book 9 ○
(4) Volume of environmental pollutants discharged 3 Tons 532.5 554.3 630.9 76.6 Data Book 14 ×
(5) Waste generated 4 Thousandtons 35.2 33.9 34.1 0.2 Data Book 12 (2) Waste generated
per unit of output kg/ton 33.7 36.0 ×
(6) Outsourced disposal 5 Thousandtons 0.02 0.00 0.04 0.04 (3) Outsourced disposal per
unit of output kg/ton 0.00 0.04 ×
Upstream/downstreameffects
Effectsrelated toproducts/services
CO2 reduction by photovoltaic power generation, etc. (cumulative)
Thousandtons 271 316 362 46 ◎
Otherbenefits toenvironmentalconservation
Others 6
Business sitesattaining ISO 14001and other certifications
New acquisitions Sites 1 4 2 Business sites attaining ISO 14001 and other certifications 7
Total numberof business
sites92 94 ○
Renewals Sites 15 17 15
Number of business sites achievingzero emissions 8 Sites 4 2 2 Number of business sites
achieving zero emissions 8
Total numberof business
sites150 152 ○
CO2 reduction from use of megasolar facilities Thousandtons 2.95 5.32 2.37
Description of effects FY2012 FY2013 FY2014 Remarks
Revenue(1) Profit on sales of valuable resources 257 245 165 Profit on sales of valuable resources from promotion of waste segregation and recycling
(2) Revenues from sale of electricity 216 393 Revenues from sale of electricity generated by megasolar facilities
Costsavings
(3) Savings from simplified packaging 21 6 5
(4) Cost savings through energy-saving activities 436 546 669
(5) Cost savings through waste-reduction activities, etc. 896 698 1,118 Including resource-saving activities
Subtotal (actual effects) 1,610 1,712 2,350
(6) Contribution to environmental conservation activities 9 6,888 7,517 7,150 Contribution of environmental conservation activities to added value at business sites 10
(7) External economic effect 19,135 21,215 23,898Monetary conversion of impact from photovoltaic generation systems and No-Dig piperehabilitation method
Subtotal (estimated effects) 26,023 28,732 31,049
Total 27,633 30,444 33,399
Sekisui Chemical Group’s Environmental Accounting
Description of e�ectsHousing
Company1
Urban Infrastructure & Environmental
Products Company
High Performance Plastics Company
Sekisui Chemical Group2 Remarks
24
249
0
10
27
309
1,749
18,914
20,663
20,972
15
64
4
87
125
295
2,020
4,984
7,005
7,300
106
80
1
506
955
1,648
3,121
3,121
4,769
165
393
5
669
1,118
2,350
7,150
23,898
31,049
33,399
11 Excluding housing sales companies 12 (Added value from business sites) × {(Costs within business areas + Administrative costs)/(Total production costs excluding materials costs)}
Revenue
Subtotal (actual e�ects)
(6) Contribution to environmental conservation activities11
(7) External Economic E�ect
Sub-total (estimated e�ects)
Total
Cost savings
(1) Pro�t on sales of valuable resources
(2) Revenues from sale of electricity
(3) Savings from simpli�ed packaging
(4) Cost savings through energy-saving activities
(5) Cost savings through waste-reduction activities, etc.
Profit on sales of valuable resources from promotion of waste egregation and recycling
Revenues from sale of electricity generated by megasolar facilities
Including resource-saving activities
Contribution of environmental conservation activities to added value at business sites12
Monetary conversion of impact from photovoltaic generationsystems and No-Dig pipe rehabilitation method
Economic Effects Related to Environmental Conservation Measures (by Each Division Company)
Total amount of R&D costs3 and investment in the �scal period (million yen)
Ratio of amount related to environmental conservation activities to total (%)
Items Housing Company1Urban Infrastructure &
EnvironmentalProducts Company
High PerformancePlastics Company
SekisuiChemical Group2
1,056
154
3,739
205
539
112
178
0
5,984
10
654
1
0
1
22
0
0
687
59
87
318
2
292
1,061
49
0
1,868
16
168
19
0
0
0
0
0
203
106
184
358
6
351
752
37
32
1,825
108
100
64
0
8
0
0
0
279
1,284
503
4,442
231
2,077
2,849
331
32
11,748
318
1,026
84
0
37
230
0
0
1,694
4,884
2.3
3,875
17.7
5,067
20.9
5,310
3.8
6,783
4.1
29,453
9.7
15,878
4.7
18,560
9.1
Category Description of main activities
1 Including 41 business sites of housing sales companies. 2 Total of three division companies and departments of Headquarters. 3 R&D costs are the total for all consolidated companies.
Items
149
4
218
5
228
3,903
581
44
852
5,984
74
3
3
0
7
1
0
0
599
687
101
0
46
3
21
337
2
91
1,267
1,868
168
0
14
0
0
19
0
0
2
203
180
0
46
5
90
373
5
33
1,092
1,825
76
23
8
8
88
64
0
8
5
279
Category Description of main activities
Costs Investments Costs Investments Costs Investments Costs Investments
Costs Investments Costs Investments Costs Investments Costs Investments
Prevention of air, water, and noise pollution, etc.
Countermeasures against global warming (energy saving), etc.
Waste reduction, recycling, disposal, etc.
Research and development on environmental conservation
Social contributions, etc.
Nature restoration, etc.
Cost increases due to URU, switching to packaging/packing methodsinvolving reduced environmental impact, greener purchasing, etc.Environmental education, EMS maintenance, running costs forgreen action organization, information disclosure, etc.
Housing Company1Urban Infrastructure &
EnvironmentalProducts Company
High PerformancePlastics Company
SekisuiChemical Group2
508
6
340
15
373
4,642
589
234
5,042
11,748
387
63
25
8
279
84
0
8
841
1,694
1 Including 41 business sites of housing sales companies. 2 Total of three division companies and departments of Headquarters.
1) Costs within business areas
2) Upstream/ downstream costs
3) Administrative costs
5) Social activities costs6) Environmental damage costs
Total
1. Prevention of global warming
2. Ozone layer protection
3. Conservation of air quality
4. Prevention of noise and vibration
Reduction of CO2 emissions, etc.
Reduction of chloro�uorocarbon emissions, etc.
Prevention of air pollution by reducing polluting substances
Prevention of noise and vibration pollution
Preservation of water quality, prevention of subsidence
Reduction and treatment of waste, recycling, etc.
Risk management of chemical substances, etc.
Nature conservation, etc.
Others
6. Waste reduction and recycling
7. Reduction of chemical substances
8. Conservation of natural environment
9. Others
5. Conservation of water environment, soil environment, ground quality
4) Research & development costs
Total
Environmental Conservation Cost (by Each Division Company) (Yen in millions)
Environmental Conservation Cost (by Environmental Conservation Measures) (Yen in millions)
9
9
9
14
12
11
Environmental Conservation Bene�ts
Description of e�ects Items Unit
63
-87
-0.5
76.6
0.2
0.04
46
2.37
3,423
2,172
311.6
630.9
34.1
0.04
362
2
15
2
5.32
3,360
2,259
312.1
554.3
33.9
0.00
316
4
17
2
2.95
128
-59
5.4
98.3
0.0
0.04
0.53
1,094
1,729
152.1
560.9
19.2
0.04
1
6
1
1.12
966
1,788
146.7
462.6
19.2
0.00
3
2
2
0.59
-2
-6
-0.9
-20.6
0.0
0.00
0.66
1,363
101
83.7
61.4
6.1
0.00
1
5
1
0.89
1,365
108
84.6
82.1
5.4
0.00
0
5
0
0.23
-43
-9
-3.2
-0.8
-0.4
0.00
46
1.18
381
108
28.2
4.8
7.0
0.00
362
0
0
0
3.31
425
117
31.4
5.6
7.4
0.00
316
1
5
0
2.13
E�ects on environ-mental impact and waste
E�ects related to products/services
Others9
See Data Book page
E�ects on invested resources
Amount of energy usage4
(3) CO2 emissions5
(5) Waste generated7
(6) Outsourced disposal8
(4) Volume of environmental pollutants discharged6
(1) Electricity
(2) Fuel
CO2 reduction by photovoltaic power generation, etc.
4 Conversion into thermal units uses the coefficient published by the Ministry of Economy, Trade and Industry. 5 Emissions at the time of manufacturing and conversion to CO2 use the coefficients used in the environmental medium-term SEKISUI Sustainable Plan Take-Off (see Data Book, p. 9). 6 Class I Designated Chemical Substances specified by PRTR Law. 7 Amount discharged + Amount disposed of at price + Amount incinerated within own premises 8 Simple incineration + landfill 9 Including business sites not subject to environmental accounting summation, such as overseas business sites 10 A business site affiliated to multiple companies is counted as one.
Newacquisitions
Renewals
Housing Company1Urban Infrastructure &
EnvironmentalProducts Company
High PerformancePlastics Company
SekisuiChemical Group2
FY2013 FY2014 E�ect(14-13) FY2013 FY2014 E�ect
(14-13) FY2013 FY2014 E�ect(14-13) FY2013 FY2014 E�ect
(14-13)
E�ects within business areas
Upstream/
downstream
e�ects
Oth
er ben
e�ts to
enviro
nm
ental
con
servation
Business sites attaining ISO 14001 and other certi�cationsNumber of business sites achieving zero emissions10CO2 reduction from use of megasolar facilities
TJ
TJ
Thousand tons
Thousand tons
Thousand tons
Thousand tons
Thousand tons
Tons
Sites
Sites
Sites
Environmental Conservation Benefits (by Each Division Company)
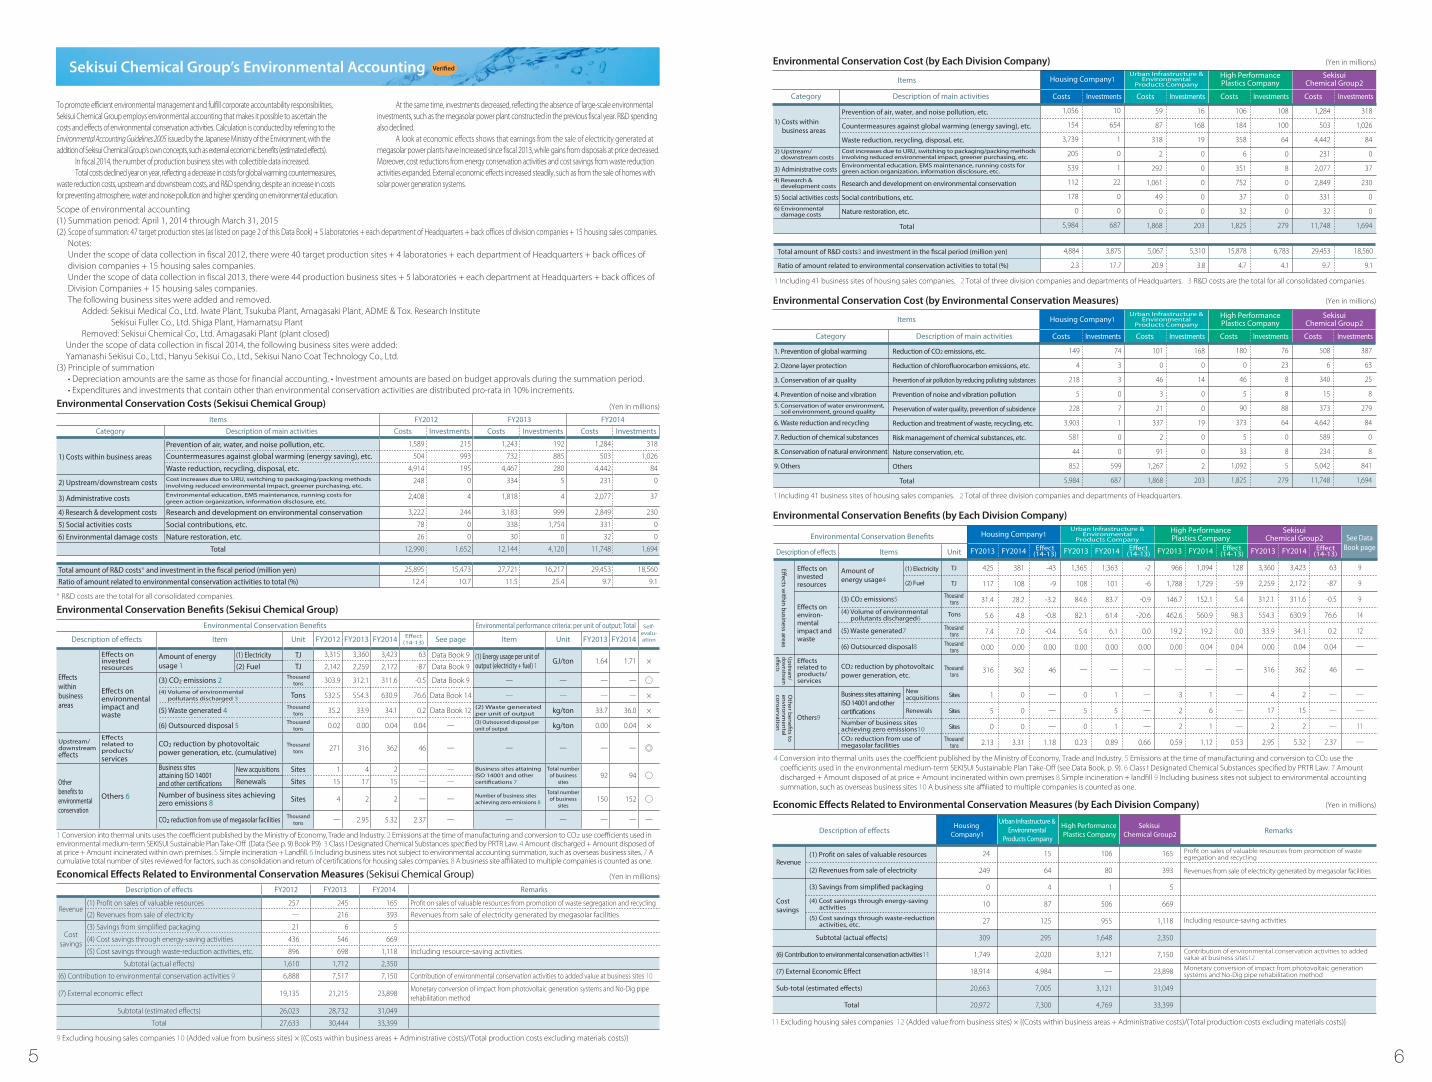
To promote efficient environmental management and fulfill corporate accountability responsibilities, Sekisui Chemical Group employs environmental accounting that makes it possible to ascertain the costs and effects of environmental conservation activities. Calculation is conducted by referring to the Environmental Accounting Guidelines 2005 issued by the Japanese Ministry of the Environment, with the addition of Sekisui Chemical Group’s own concepts, such as external economic benefits (estimated effects).
In fiscal 2014, the number of production business sites with collectible data increased.Total costs declined year on year, reflecting a decrease in costs for global warming countermeasures,
waste reduction costs, upstream and downstream costs, and R&D spending, despite an increase in costs for preventing atmosphere, water and noise pollution and higher spending on environmental education.
At the same time, investments decreased, reflecting the absence of large-scale environmental investments, such as the megasolar power plant constructed in the previous fiscal year. R&D spending also declined.
A look at economic effects shows that earnings from the sale of electricity generated at megasolar power plants have increased since fiscal 2013, while gains from disposals at price decreased. Moreover, cost reductions from energy conservation activities and cost savings from waste reduction activities expanded. External economic effects increased steadily, such as from the sale of homes with solar power generation systems.
Scope of environmental accounting(1) Summation period: April 1, 2014 through March 31, 2015(2) Scope of summation: 47 target production sites (as listed on page 2 of this Data Book) + 5 laboratories + each department of Headquarters + back offices of division companies + 15 housing sales companies.
Notes:Under the scope of data collection in fiscal 2012, there were 40 target production sites + 4 laboratories + each department of Headquarters + back offices of division companies + 15 housing sales companies.Under the scope of data collection in fiscal 2013, there were 44 production business sites + 5 laboratories + each department at Headquarters + back offices of Division Companies + 15 housing sales companies.The following business sites were added and removed. Added: Sekisui Medical Co., Ltd. Iwate Plant, Tsukuba Plant, Amagasaki Plant, ADME & Tox. Research Institute Sekisui Fuller Co., Ltd. Shiga Plant, Hamamatsu Plant Removed: Sekisui Chemical Co., Ltd. Amagasaki Plant (plant closed)Under the scope of data collection in fiscal 2014, the following business sites were added:Yamanashi Sekisui Co., Ltd., Hanyu Sekisui Co., Ltd., Sekisui Nano Coat Technology Co., Ltd.
(3) Principle of summation • Depreciation amounts are the same as those for financial accounting. • Investment amounts are based on budget approvals during the summation period. • Expenditures and investments that contain other than environmental conservation activities are distributed pro-rata in 10% increments.
Environmental Conservation Costs (Sekisui Chemical Group)
Environmental Conservation Benefits (Sekisui Chemical Group)
Economical Effects Related to Environmental Conservation Measures (Sekisui Chemical Group) (Yen in millions)
(Yen in millions)
9 Excluding housing sales companies 10 (Added value from business sites) × {(Costs within business areas + Administrative costs)/(Total production costs excluding materials costs)}
1 Conversion into thermal units uses the coefficient published by the Ministry of Economy, Trade and Industry. 2 Emissions at the time of manufacturing and conversion to CO2 use coefficients used in environmental medium-term SEKISUI Sustainable Plan Take-Off (Data (See p. 9) Book P9) 3 Class I Designated Chemical Substances specified by PRTR Law. 4 Amount discharged + Amount disposed of at price + Amount incinerated within own premises. 5 Simple incineration + Landfill. 6 Including business sites not subject to environmental accounting summation, such as overseas business sites. 7 A cumulative total number of sites reviewed for factors, such as consolidation and return of certifications for housing sales companies. 8 A business site affiliated to multiple companies is counted as one.
* R&D costs are the total for all consolidated companies.
(Yen in millions)
5 6

After collecting the raw data in (1) above, stages (2) and (3) are calculated using a customized version of the Life-cycle Impact assessment Method based on Endpoint modeling2 (LIME2) developed in Japan by Professor Norihiro Itsubo at Tokyo City University. (See p. 26 of this Data Book for calculation basis.)
Results of Fiscal 2014 Calculation
Calculation Method
(1) Gather quantitative data on the level of environmental impact and bene�ts of environmental activities by category
What is SEKISUI Environmental Sustainability Index?The SEKISUI Environmental Sustainability Index is a single indicator of the level of impact on the environment by all of the corporate activites of Sekisui Chemical Group (i.e. use of natural capital) and contributions back to the environment (i.e. return of natural capital) . This index integrates all of the effects of the key implementation objectives of our medium-term plan: reduce various environmental impact, increase products and services that contribute to the environment, and preserve the natural environment, and others.
Results of calculation
Based on fiscal 2014 performance , the SEKISUI Environmental Sustainability Index was calculated as follows. With environmental impact equal to 100 representing the use of natural capital, the return of natural capital as contributions back to the environment is 64.5.
Environmental impact = Use of natural capital
Environmental contribution = Return of natural capital
(2) A database of coe�cient to calculate the environment impact collected by experts was used for calculating the impact (negative factors) and contributions (positive factors) by category
• Raw material usage• Water used• Environmental contribution of each product
• GHG emissions• Emissions of chemical substances• Employee participation rate in activities to preserve the natural environment
• Volume of waste generated• Area of land used
Environmental impact and environmental
activities (i)
Raw data by category Ai x Coe�cient ki = Environmental impact (Ti)
Σ(Raw data for each category)Ai × Coe�cient ki = Σ (Environmental impact Ti)
(3) Total of Environmental impact and contribution for each category (integrated total)
* Units are the amount of damage calculated (= amount necessary to restore the environment to the original conditions[living organisms, plants, and global warming] if our activities damaged the environment)
Raw materials39.7
Production26.7
Other33.5 100
Contribution from products62.6
Impact reduction0.5
Contribution from activities1.4
64.5
Biodiversity
Product Assessment System for Environmental Impact
Integrated Index: SEKISUI Environmental Sustainability Index
Material Balance (in Japan)
Environment-Contributing Products
Input Output
Main Raw Materials• Metals 119,000 tons• Wood, wooden building materials 55,000 tons
• Cement for exterior walls • Concrete for foundations • PVC 157,000 tons• Polyethylene 51,000 tons• Polypropylene 32,000 tons• Kraft paper 18,000 tons• PRTR-designated substances 109,000 tons
Energy 5,596TJ• Purchased electricity • Heavy oil A 3,305kL• City gas 42,249,000 m3
Industrial water 16,019,000 tons
To the atmosphere
• CO2 from energy consumption
• NOx 197 tons
• SOx 10 tons
• Soot particles 3 tons
• PRTR-designated substances
To water
• Water discharged
• COD 71 tons
• PRTR-designated substances
Waste
• Total generated waste
SekisuiChemicalGroup
Note: Certain main raw materials are undisclosed for business strategy reasons.
84,000 tons424,000 tons
353,553MWh
14,999,000 tons
0.1 tons
590 tons
312,000 tons-CO2
34,000 tons
Note: Certain main raw materials are undisclosed for business strategy reasons.
• Laws and regulations
• Self regulation • Requirements of industries, etc.
• Laws and regulations
• Prohibited substances
• Restricted substances
Compliance Evaluation Chemical Substance Assessment
Product Assessment System for Environmental Impact
• Invested resources • Raw materials, composition, and structure • Information disclosure • Environment-Contributing Products standards • LCCO2 evaluation
Environment-friendly design
• Environmental impact Means of transportation Packaging materials • Green procurement (Suppliers, raw materials)
Raw material procurement
• Capital Investments • Invested resources, energy• Secondary resources used • Environmental impact Atmosphere, water, waste, chemical substances, etc.
Manufacture
• Environmental impact Means of transportation Load-e�cient design • Information disclosure
Transportation
• Invested resources, energy • Secondary resources used • Environmental impact Atmosphere, water, waste, chemical substances, etc.
Construction and assembly
• Invested resources, energy • Secondary resources used • Environmental impact Atmosphere, water, waste, chemical substances, etc.
Use
• Composition and structure• Recyclability • Environmental impact Transportation, disposal, soil/groundwater contamination
Disposal
Targets: Products and processesScope: All stages of the product lifecycle
Initiatives Envisioned under Biodiversity Guidelines
• Developing assessment methods and conducting assessment, reducing impact • Promoting biodiversity-conscious purchasing• Greening of business sites (promoting landscaping and biotope development)
• Incorporating biodiversity assessment at product development stage
• Conducting nature conservation activities at all business sites • Expanding Sekisui Nature Study Course and nature conservation activities
• Supporting Innovations Inspired by Nature, and holding periodic forums on subject • Supporting nonpro�t and other organizations through Keidanren (Japan Business Federation)
• Exhibiting at Eco-Products Exhibition and other events • Providing information in CSR Report, Site Reports, and websites• Educating next generation (Children’s Nature Study Course, school visits)
1. Assessment and reduction of the impact of business activities on biodiversity
2. Development and promotion of related technologies and products
3. Raising employees’ awareness
4. Dialogue and cooperation with external stakeholders
5. Transmittance of information
P31
P29
P30
P26
0 0
2,000
10,000
4,000
6,000
8,000
50
40
30
20
10
(Yen in 100 millions) (%)
44.5
37.2
2012 2013 2014Target
2015Target
2016Target
771349 11
2,462
799428 12
2,687
33.1
2010 2011
719221 97
2,078
2014
996
591
3,068
998
88114
3,0583,592
3,925
3,026
4,668 4,951
38.0
4447
50
42.0
Environment-Contributing Products Sales andSales-Ratio Trends
Veri�ed
Housing Company
Sales Ratio
Urban Infrastructure &Environmental ProductsCompany
High PerformancePlastics Company
Headquarters
Environment-Contributing Products Conceptual Diagram Criteria for Environment-Contributing ProductsDe�nition (products that satisfy the two conditions below)● Products and businesses able to reduce environmental impact of our
customers and society as a whole. ● Products or systems having at least a certain degree of effect in reducing
environmental impact compared with similar conventional products and systems. Types of environmental contribution● Able to reduce CO2 emissions and generate energy● Able to reduce waste● Able to achieve resource conservation● Able to save water and improve aquatic environments● Able to prevent chemical substance pollution● Able to directly preserve biodiversity● Interlayer materials essential for functionality of end-user products that
contribute to the environment● Able to reduce environmental impact during disasters
Envi
ronm
enta
l Co
ntrib
utio
n
High
LowProducts
Standards
Environment-Contributing Standard
Environments targeted1 Natural/social environments
Scope of contribution2 All / socity-wide
Level of contribution3 A level above conventional products/systems
Prerequisites for Environment-Contributing Products
1 Excluding living environments2 Excluding own business activities3 Set approved standards for each type of environmental contribution
7 8
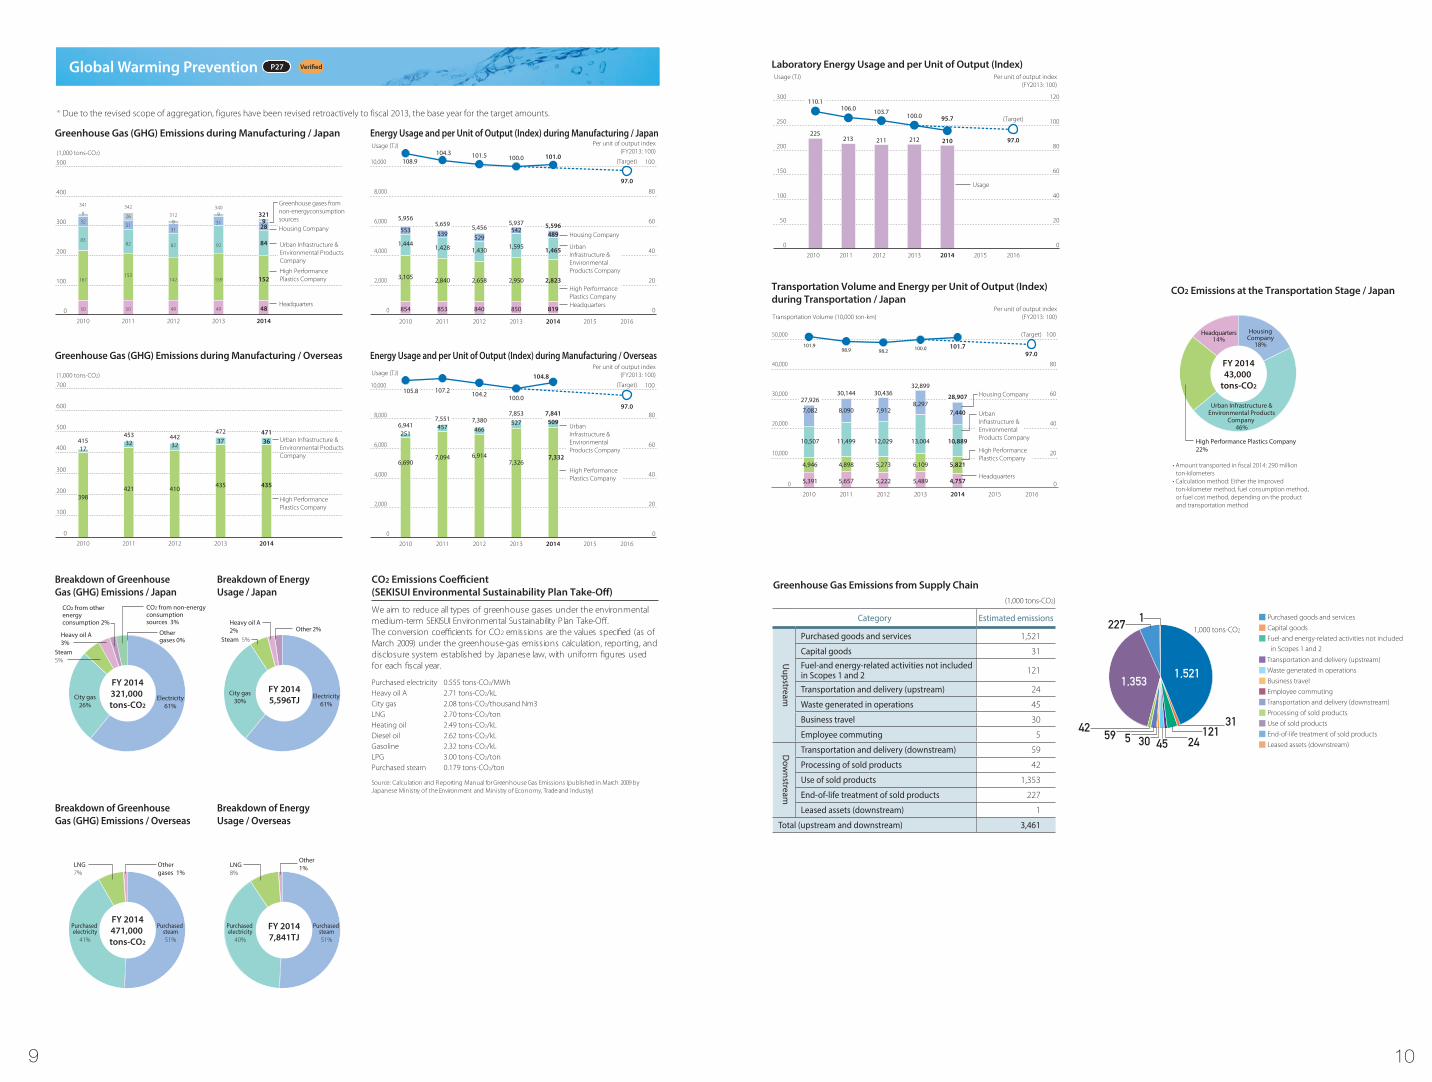
Global Warming Prevention
Steam 5%
Electricity61%
City gas26%
Othergases 0%
CO2 from otherenergyconsumption 2%
Heavy oil A3%
Steam5%
CO2 from non-energyconsumptionsources 3%
Greenhouse Gas (GHG) Emissions during Manufacturing / Overseas
Breakdown of Energy Usage / Japan
Breakdown of Greenhouse Gas (GHG) Emissions / Japan
CO2 Emissions Coe�cient (SEKISUI Environmental Sustainability Plan Take-O�)
We aim to reduce all types of greenhouse gases under the environmental medium-term SEKISUI Environmental Sustainability Plan Take-Off. The conversion coefficients for CO2 emissions are the values specified (as of March 2009) under the greenhouse-gas emissions calculation, reporting, and disclosure system established by Japanese law, with uniform figures used for each fiscal year.
0
2,000
4,000
6,000
8,000
10,000
0
20
40
60
80
100
Usage (TJ)
105.8 107.2 104.2
Per unit of output index(FY2013: 100)
Energy Usage and per Unit of Output (Index) during Manufacturing / Overseas
100.0
251
6,690
6,941 457
7,094
7,551
466
6,914
7,380 527
7,326
7,853509
7,332
7,841
104.8
97.0
Energy Usage and per Unit of Output (Index) during Manufacturing / Japan
201320122010 2011 2014 2015 2016
201320122010 2011 2014 2015 2016
Greenhouse Gas (GHG) Emissions during Manufacturing / Japan
Purchased steam51%
Purchased electricity
40%
LNG8%
Other1%
FY 20147,841TJ
Purchased steam51%
Purchased electricity
41%
Othergases 1%
FY 2014471,000 tons-CO2
LNG7%
Breakdown of Energy Usage / Overseas
Breakdown of Greenhouse Gas (GHG) Emissions / Overseas
0
100
200
300
500
400
49
142
82
31
9312
50
153
82
31
26
342
50
167
83
32
9
341
(1,000 tons-CO2)
Housing Company
Urban Infrastructure &Environmental ProductsCompany
High PerformancePlastics Company
Urban Infrastructure &Environmental ProductsCompany
High PerformancePlastics Company
Headquarters49
159
92
31
9340
48
152
84
289
321
Greenhouse gases fromnon-energyconsumptionsources
0
2,000
4,000
6,000
8,000
10,000
0
20
40
60
80
100
Usage (TJ) Per unit of output index(FY2013: 100)
Housing Company
UrbanInfrastructure &EnvironmentalProducts Company
High PerformancePlastics Company
UrbanInfrastructure &EnvironmentalProducts Company
High PerformancePlastics Company
Headquarters850
542
2,950
1,595
5,937
840
529
2,658
1,430
5,456
104.3108.9
853
539
2,840
1,428
5,659
854
553
3,105
1,444
5,956
101.5 100.0
819
489
2,823
1,465
5,596
101.0
97.0
0
100
200
300
700
600
500
400
20122010 2011
398
17415
45332
421 410
32442
47237
435 435
36471
(1,000 tons-CO2)
2013 2014
20122010 2011 2013 2014
* Due to the revised scope of aggregation, figures have been revised retroactively to fiscal 2013, the base year for the target amounts.
(Target)
(Target)
Purchased electricity 0.555 tons-CO2/MWhHeavy oil A 2.71 tons-CO2/kLCity gas 2.08 tons-CO2/thousand Nm3LNG 2.70 tons-CO2/tonHeating oil 2.49 tons-CO2/kLDiesel oil 2.62 tons-CO2/kLGasoline 2.32 tons-CO2/kLLPG 3.00 tons-CO2/tonPurchased steam 0.179 tons-CO2/ton
Source: Calculation and Reporting Manual for Greenhouse Gas Emissions (published in March 2009 by Japanese Ministry of the Environment and Ministry of Economy, Trade and Industry)
FY 2014321,000 tons-CO2
Electricity61%
City gas30%
Heavy oil A2% Other 2%
FY 20145,596TJ
Urban Infrastructure &Environmental Products
Company 46%
High Performance Plastics Company22%
Headquarters14%
HousingCompany
18%
FY 201443,000
tons-CO2
CO2 Emissions at the Transportation Stage / Japan
• Amount transported in fiscal 2014: 290 million ton-kilometers• Calculation method: Either the improved ton-kilometer method, fuel consumption method, or fuel cost method, depending on the product and transportation method
0
50
100
150
300
250
200
0
20
40
60
120
100
80
2010 2011 2012
213 211
Laboratory Energy Usage and per Unit of Output (Index)
2013
212
2015
Usage
20162014
210
Usage (TJ)
(Target)
97.0
95.7100.0103.7106.0
225
110.1
0
10,000
20,000
30,000
40,000
50,000
0
20
40
60
80
100
Transportation Volume (10,000 ton-km)Per unit of output index
(FY2013: 100)
Per unit of output index(FY2013: 100)
Transportation Volume and Energy per Unit of Output (Index) during Transportation / Japan
2013 2015 2016
5,489
8,297
6,109
13,004
32,899
28,907
2014
4,757
7,440
5,821
10,889
2012
5,222
7,912
5,273
12,029
30,436
2010 2011
5,657
8,090
4,898
11,499
30,144
5,391
7,082
4,946
10,507
27,926
100.0 101.798.2
101.998.9
97.0
(Target)
Housing Company
UrbanInfrastructure &EnvironmentalProducts Company
High PerformancePlastics Company
Headquarters
P27
Category Estimated emissions
Uupstream
Purchased goods and services 1,521
Capital goods 31
Fuel-and energy-related activities not included in Scopes 1 and 2 121
Transportation and delivery (upstream) 24
Waste generated in operations 45
Business travel 30
Employee commuting 5
Dow
nstream
Transportation and delivery (downstream) 59
Processing of sold products 42
Use of sold products 1,353
End-of-life treatment of sold products 227
Leased assets (downstream) 1
Total (upstream and downstream) 3,461
Greenhouse Gas Emissions from Supply Chain(1,000 tons-CO2)
■ Purchased goods and services
■ Capital goods
■ Fuel-and energy-related activities not included in Scopes 1 and 2
■ Transportation and delivery (upstream)
■ Waste generated in operations
■ Business travel
■ Employee commuting
■ Transportation and delivery (downstream)
■ Processing of sold products
■ Use of sold products
■ End-of-life treatment of sold products
■ Leased assets (downstream)
1,521
31121
24453055942
227 1
1,353
1,000 tons-CO2
9 10

Environmental Performance in Offices
10 50%
30 150%
20 100%
0 0%
4,000 50%
12,000 150%
8,000 100%
0 0%
Copier Paper Use at O�ces per Unit of Output (Index)
2013
11.0 10.8
2014
10.7 10.1
20162015
Per unit of output index(FY 2013: 100)
(Target)100.0
94
97.1
93.5
Energy Usage at O�ces per Unit of Output (Index)
Pages Used (1,000 pages / person)
Japan
OverseasJapan Overseas
2013 2014
3,102
1,469
20162015
Per unit of output index(FY 2013: 100)
(Target)100.0
97
100.4
91.2
Energy Used (M
j/m2)
Japan
Overseas
3,089Japan
1,611Overseas
* Calculated using electricity and fuel for company cars for Japan, only electricity for overseas.
0
5,000
10,000
20,000
15,000
Amount of Water Extracted for Use at Production Sites / Japan
2012
2,795
10,807
1,804
15,712306
287
2013
3,033
11,458
2,262
17,041
264
2014
2,867
10,700
2,189
16,019
20112010
2,879
11,369
1,861
16,413304
2,403
11,984
1,842
16,517288
Amount of Water Extracted for Use at Production Sites / Overseas
0
1,000
2,000
5,000
3,000
4,000
20112010 2012
3,498
2013
3,712
2014
3,651
3,616
77748179
65
3,6933,7253,7933,577
2,948
2,883
Note: See page 2 of this Data Book for scope of summation
Note: See page 2 of this Data Book for scope of summation
Plastics waste52.3%
Glass and ceramics scrap10.4%
Sludge 10.8%
Wastepaper 5.6%
Wood chips 4.9%
Metal scrap 2.8%
Plasterboard 1.0%
Oil waste, acidic waste,alkaline waste 9.6%
Others 2.2%Burnt residue 0.3%
FY 201434,000 tons
FY 201425,000 tons
Recycling78.3%
Landfill17.6%
Incineration4.2%
Breakdown of Generated Waste / Japan Waste Treatment Methods / Overseas
0
2
1
3
(Tons)
Waste Generated by New House Construction (per House) / Japan
Assembly plant
New house construction site
Exterior wall plant
2013
0.24
0.44
1.22
1.90
2014
0.221.87
0.34
1.31
2012
0.25
0.46
1.17
1.88
20112010
0.23
0.45
1.08
1.760.26
0.66
1.07
1.99
(1,000 tons) (1,000 tons)
Housing Company
Urban Infrastructure &Environmental Products Company
High PerformancePlastics Company
Urban Infrastructure &Environmental Products Company
High PerformancePlastics Company
Headquarters
Resource Recycling and Saving
88
2015 2016
Fiscal 2014 Annual Production Site Waste Generation and Disposal Conditions / Japan Change over the previous year is in ( ) and proportion of the total generation is in [ ].
Production sitesAchieved at 43 plants in Japan and 6 overseas plants, including those of affiliates. (Includes one plant in Japan and one overseas plant that achieved zero emissions in fiscal 2014)
Laboratories Achieved at all laboratories by fiscal 2012
New house construction sites Achieved at all locations by fiscal 2003
House renovation sites Achieved at all locations as of fiscal 2004
Osaka and Tokyo Headquarters buildings Achieved as of fiscal 2005
Home demolition sites
As of end of fiscal 2014, 99% recycling rate for Designated Construction Materials (scrap concrete and wood chips)
0
30
20
10
60
50
40
0
60
120
100
80
40
20
2010
Per unit of output index(FY 2013: 100)
Per unit of output index(FY 2013: 100)
Waste Generated by Production Sites and per Unit of Output (Index) / Japan
Reuse within the premises7,402 tons (increased by 2.1%)
Total amount of generatedwaste 34,104 tons (decreased by 2.6%) [100%] Amount of discharged
waste 20,966 tons (decreased by 3.1%) [61.5%]
Outsourcing of recyclingresources 20,924 tons (decreased by 2.7%) [61.4%]
Outsourced disposal 42 tons(decreased by 67.6%) [0.1%]
Landfill 41 tons [0.1%]
Valuable materials sold 13,138 tons (decreased by 1.7%) [38.5%]
Materials recycling15.509 tons (decreased by 2.6%) [45.5%]
Total amount ofmaterials recycling 28,648 tons (decreased by 2.2%) [84.0%]
Use of incinerationheat 5,415 tons (decreased by 3.0%) [15.9%]
On-site incineration (reduction)0 tons [0%]
Simple incineration 1 tons(decreased by 93.3%) [0.0%]
Zero Emissions Achievement Criteria and AccreditationSystem of Sekisui Chemical Group
(1) Not engaging in any outside incineration without thermal utilization (thermal recycling), or landfill outside or inside of facilities (recycling ratio: 100%)
(2) If the waste quantity is small and it is a type of waste that has never been recycled before, recycling methods and relevant contractors must be identified and a service agreement must be executed.
We also have established uniform evaluation criteria known as the Zero Emissions Achievement Evaluation List. We have established a system designed to conduct internal checks and issue approvals for the status of observance of the evaluation criteria as well as legal compliance, rules and signage for waste segregation and storage, management of related facilities, and waste reduction planning and management.
The list obliges us to conduct inspections of outside contractors and to clarify treatment routes in order to enhance the management system through these activities.
Status of Zero Emissions Achievement
100.0
110.2
2013
1.9
19.7
6.0
7.4
35.0
106.5
2014
1.8
19.2
6.1
7.0
34.1
2011 2012
2.1
19.0
6.0
8.0
35.2
113.4126.4
2.1
19.5
6.2
8.3
36.1
2.3
19.5
6.4
11.3
39.5
* Due to the revised scope of aggregation, figures have been revised retroactively to fiscal 2013, the base year for the target amounts.
(target)
0 0
50
100
150
Waste generated (1,000 tons)Waste generated (1,000 tons)
91.3101.3 102.8 100.0
Waste Generated by Production Sites and per Unit of Output (Index) / Overseas
2013 2015 2016
14.6
8.1
22.7
2012
11.8
8.1
19.9
110.9
88
20112010
13.0
7.9
20.8
15.9
8.7
2014
16.5
8.9
24.7 25.4
20
40
60
(target)
Housing Company
Urban Infrastructure &Environmental Products Company
High PerformancePlastics Company
Urban Infrastructure &Environmental Products Company
High PerformancePlastics Company
Headquarters
P28
11 12

Preventing Pollution Disposal and Storage of Machines and Equipment ThatContain PCBs
Sekisui Chemical Group is working to meet the targets of legal and regulatory restrictions and to reduce discharge of pollutants through appropriate maintenance and control and periodic inspection of the wide range of equipment it uses.
Stored transformers and condensers that contain PCBs are being disposedof steadily, beginning with sites for which acceptance at PCB treatmentfacilities is available.
In addition, at sites with machines and equipment that contain PCBs in storage, such devices are managed strictly and thoroughly, through means including locked storage and periodic inspection.
0
200
100
300
2010 2011
0
40
20
60
80
2010 2011
0
5
15
10
20
25
2010 2011
0
10
5
15
2010 2011
168
217
644
173
223
743
* Due to the revised scope of aggregation, figures have been revised retroactively to fiscal 2013, the base year for the target amounts.
8
15
2
5
2
6
22
2013
9
13
20
3
2014
7
10
3
2012
10
14
3
2
0.6 0.2
2013
0.7
2
11
1.2
4
2014
2
11
3
2012
8.2
1.1
9.5
2.5
7
43
11
6317
45
15
681
2013
166
217
545
2012
144
205
655
2014
158
197
336
2013
7
38
13
70
12
2014
5
39
16
71
11
2012
3
31
15
511
2
11
4
400
(Tons)
NOx Emission Volume Veri�ed
(Tons)
SOx Emission Volume Veri�ed
(Tons)(Tons)
COD Discharge VolumeSoot and Dust Emission Volume Veri�ed Veri�ed
HousingCompany
UrbanInfrastructure & Environmental ProductsCompany
HighPerformance Plastics Company
HousingCompany
HousingCompany
UrbanInfrastructure & Environmental ProductsCompany
UrbanInfrastructure & Environmental ProductsCompany
HighPerformance Plastics Company
HighPerformance Plastics Company
HousingCompany
Urban Infrastructure & Environmental ProductsCompany
High Performance Plastics Company
Headquarters
Description Countermeasures Simulated emergency situation Drills performed
Leakage and out�ow of oils
Atmospheric discharge of solvents
Fire
Earthquake
Emergency communication training
Comprehensive disaster drills
Responding to other equipment-related emergencies
37
0
57
8
14
33
31
Environmental Complaints, etc. Emergency Response and Reporting Drills
In order to prevent the occurrence and spread of environmental contamina-tion in the event of an emergency, at least once every year each of our business sites carries out emergency response and reporting drills, assuming a variety of hypothetical cases relevant to the nature of each business site. Major drills performed for fiscal 2014 are as follows:
In fiscal 2014, there were two fire accidents and six complaints. We have implemented measures to prevent a reoccurrence of environmental complaints.
Inci
dent
s
Fire
Bad
odor
s
Com
plai
nts
Noi
seOt
her
Fire started from resin waste
Fire started from residue stuck on filters
Chlorine gas leak from a cylinder
Noise from ground drilling work
Noise from blowers
Noise from line alarms
Noise from pump operation
Cargo dropped during transport
Installed a receiving bin only for resin waste
Added cooling process at the distillation tower
Disposed of cylinder
Installed sound-insulating net
Changed direction of ventilation tubes
Lowered alarm volume
Soundproofed pump building
Created and implemented carrier’s checklist
Environmental Incidents, Complaints, etc. Emergency ResponseVeri�ed
Chemical Substances
(Tons)
Summation Results Based on the PRTR Law (Calculations have been made for substances with handling volume of one ton or more atthe individual business sites surveyed.)
* Due to the revised scope of aggregation, figures have been revised retroactively to fiscal 2013, the base year for the target amounts.
[3]
[4]
[7]
[9]
[12]
[13]
[16]
[20]
[31]
[35]
[53]
[76]
[80]
[Special 94]
[127]
[134]
[144]
[154]
[207]
[213]
[232]
[239]
[240]
[270]
[296]
[300]
[Special 305]
[349]
[355]
[392]
[399]
[407]
[Special 411]
[412]
[415]
[420]
[438]
[448]
1.5
12.9
254.2
414.0
279.3
89.2
4.2
2.5
10.8
79.4
2.3
44.2
7.3
102,245.2
4.2
46.2
37.1
5.6
54.2
3.1
1.4
70.9
1,952.6
68.2
3.0
761.3
703.5
95.6
115.7
131.0
12.0
1.9
73.0
4.2
210.0
154.4
8.0
1,046.0
109,011.1
0.12
0
0.603
3.2
0.2
7.1
0
0.49
0
1.1
2.3
0
7.3
3.8
0.29
1.803
0
0.31
0
0
0
0
40
0
1.9
390
0.0004
0.0096
0
124
0
0
0.0007
0
1.2
1.2
0.040
2.9
590
0
0
0
0
0
0
0
0
0
0
0
0.014
0
0.13
0
0
0
0
0
0
0
0
0
0
0
0
0.0017
0
0
0
0
0
0
0
0
0
0
0
0.15
0
0
0
0
0
0
0
0
0
0
0
0
0
0
0
0
0
0
0
0
0
0
0
0
0
0
0
0
0
0
0
0
0
0
0
0
0
0
0
0
0
0
0
0
0
0
0
0
0
0
0
0
0
0
0
0
0
0
0
0
0
0
0
0
0
0
0
0
0
0
0
0
0
0
0
0
0
0
0
0
0
0
0
0
0
0
0
0
0
0
0
0
0
0
0
0
0
1.5
0
0
0
0
0
0
0.0010
0
0
0
0
0
0
0
0
0
0
0
1.5
0.20
0
0.974
0
0
0
0
0
0
0
0
0
0
0
0
2.415
0
0
0
0
0
0.052
0
0
0
35
0.39
0
0.087
0.20
0
0
0
0
0
0
0
0
39
0
1.3
1.5
0.010
0
82
0
0
1.1
0
0
0
0
0
0.7
0
0
0
0
1.6
0
0.17
3.7
0
0
28
3.1
0
2.2
3.8
0
0
0
4.2
0.0050
0
0
0.26
133
1.1
12
251
410
279
0
4.2
2.0
0
78
0
44
0
102,237
3.2
42
37
5.3
54
0
1.4
0
1,210
68
1.1
271
0
94
0
2.7
12
0
73
0
209
153
8.0
0
105,564
Ethyl acrylate
Acrylic acid and aqueous salt solutions thereof
n-Butyl acrylate
Acrylonitrile
Acetaldehyde
Acetonitrile
2,2’-Azobisisobutyronitrile
2-Aminoethanol
Antimony and its compounds
Isobutyraldehyde
Ethylbenzene
E-Caprolactam
Xylene
Vinyl chloride
Chloroform
Vinyl acetate
Inorganic cyanide compounds(not including complex salts and cyanate)
Cyclohexylamine
2,6-di-t-butyl-4-cresol
N,N-dimethylacetamide
N,N-dimenthylformamide
Organic tin compounds
Styrene
Terephthalic acid
1,2,4-Trimethylbenzene
Toluene
Lead compounds
Phenol
Bis- (2-ethylhexyl) phthalate
n-Hexane
Benzaldehyde
Poly (oxyethylene) = alkyl = ether (C = 12-15 and other blends)
Formaldehyde
Manganese and its compounds
Methacrylate
Methyl methacrylate
Methylnaphthalene
Methylenebis (4,1-phenylene)= diisocyanate
Substance Transactionvolume
Governmentordinance
noti�cationno.
Detoxi�cationEmission volume Transfer volume
Atmo-spheric
Public waterareas
In-housesoil
In-houseland�ll
Sewagesystem
Transfer inwaste
disposal
Transfer inwaste
recycling
P29
0
200
400
600
800
(Tons)
2010 2011
0
1,000
2,000
2010 2011
(Tons)
Emission and Transfer Volume by Substance (PRTR Law) Discharge of Volatile Organic Compounds (VOCs) into the Atmosphere
20144
9116
1,239
1,368
4
1395
1,166
1,278
2013
4
9107
1,099
1,219
2012
4
8
1,267
113
1,391
4
9
1,382
104
1499
2014
302
150
46
54536
4
6
425
125
40
631350
7
2013
348
99
37
525333
4
2012
401
122
40
607
587
154
34
807
54
36
55
23
0
200
400
600
800
2008 2009
(トン)
584
44
659
10763
596
53
730
2007
128 34
574
49
677
55
20
0
1,000
2,000
3,000
2008 20092000
(トン)
3
6
1,457
119
1,585
4
27
1,380
149
1,560
20074
46
1,336
153
1,539
14
55
2,401
467
2,936
2010
スチレン
キシレン塩化メチレン
n-ヘキサン
その他
トルエン
587
154
34
81155
26
2010
住宅カンパニー
高機能プラスチックスカンパニー
コーポレート4
4
1,382
108
1,498
20134
4125
1,239
1,373
20124
4114
1,099
1,221
20114
4
1,267
123
1,397
2013
302
150
46
55446
4
6
2012
348
99
37
532413
4
2011
401
122
40
618
54
46
環境•ライフラインカンパニー
Styrene
Xylene
Dichloromethane
n-Hexane
Others
Toluene
Housing Company
High PerformancePlastics Company
Headquarters
Urban Infrastructure &Environmental Products Company
Atmospheric and Water-Related Emissions
Environmental Incidents, Complaints, and Emergency Responses
P29
13 14

Number of Issues of Concern in Environmental Auditing for Fiscal 2014(for production sites and laboratories, as of end of March 2015)
Numbers of Persons with Qualifications
Urban Infrastructure & Environmental Products CompanyHousing Company High Performance Plastics Company
Headquarters environmental auditing (16 business sites)
* Categories of instructions for Headquarters environmental auditing:Issues of concern: Matters recommended for swift improvementIssues to work on: Matters recommended for planned improvementProposals: Matters to be considered for improvement, advice
対応継続中対応完了件数
コーポレート環境監査(23事業所)
審査機関審査
更新審査(17事業所)
維持審査(34事業所)
事業所内部監査(48事業所、55回)
指摘事項要望事項提案事項合計不適合(メジャー)不適合(マイナー)観察事項合計不適合(メジャー)不適合(マイナー)観察事項合計不適合(メジャー)不適合(マイナー)観察事項合計
※ コーポレート環境監査の指示の分類指摘事項 : 速やかに改善を実施すべき事項 要望事項 : 計画的に改善を実施すべき事項提案事項 : 改善を検討してもらう事項、アドバイス
対応継続中対応完了件数
コーポレート環境監査(23事業所)
審査機関審査
更新審査(17事業所)
維持審査(31事業所)
事業所内部監査(48事業所、48回)
指摘事項要望事項提案事項合計不適合(メジャー)不適合(マイナー)観察事項合計不適合(メジャー)不適合(マイナー)観察事項合計不適合(メジャー)不適合(マイナー)観察事項合計
4080
4124
00
3535
01
6768
011
126137
69104
2175
02
3032
0107989
076
243319
109184
6299
02
6567
011
146157
087
369456
※ コーポレート環境監査の指示の分類指摘事項 : 速やかに改善を実施すべき事項 要望事項 : 計画的に改善を実施すべき事項提案事項 : 改善を検討してもらう事項、アドバイス
対応継続中対応完了件数
コーポレート環境監査(23事業所)
審査機関審査
更新審査(17事業所)
維持審査(34事業所)
事業所内部監査(48事業所、55回)
指摘事項要望事項提案事項合計不適合(メジャー)不適合(マイナー)観察事項合計不適合(メジャー)不適合(マイナー)観察事項合計不適合(メジャー)不適合(マイナー)観察事項合計
1875
396
00
3131
03
8689
060
118178
46106
2154
0135972
09
7988
673
229308
64181
5250
01390
1030
12165177
6133347486
※ コーポレート環境監査の指示の分類指摘事項 : 速やかに改善を実施すべき事項 要望事項 : 計画的に改善を実施すべき事項提案事項 : 改善を検討してもらう事項、アドバイス
59
163
1
223
0
0
77
77
0
9
123
132
1
99
421
521
29
82
1
112
0
0
44
44
0
6
64
70
1
58
219
278
30
81
0
111
0
0
33
33
0
3
59
62
0
41
202
243
Number of cases
Correction completed
Undergoing correction
Auditing by certi�cation body
Renewal (15 business sites)
Surveillance (35 business sites)
Internal auditing of business sites (49 business sites; 49 audits)
Issues of concern
Issues to work on
Proposals
Total
Nonconformity (major)
Nonconformity (minor)
Observations
Total
Nonconformity (major)
Nonconformity (minor)
Observations
Total
Nonconformity (major)
Nonconformity (minor)
Observations
Total
713
265
978
1
1
1
50
93
32
1
4
57
1
109
32
14
46
0
0
0
0
6
1
0
0
0
0
3
Number of persons with major quali�cations
End of �scal 2014
Those who acquired
quali�cations during �scal
2014
内部研修受講者外部研修受講者合計内部研修受講者外部研修受講者合計
環境計量士エネルギー管理士臭気判定士eco検定
CEAR登録環境審査員
公害防止管理者
主任審査員審査員審査員補大気 1~4種水質 1~4種騒音・振動ダイオキシン
68126694756118174211147973716601
112
42196123629001021002012
資格名
EMS内部監査員養成研修受講者数
OHSMS内部監査員養成研修受講者数
主な資格保有者数
2013年度末2013年度取得
資格名
Number of internal training course participants
Number of external training course participants
Total
Certi�ed Environmental Measurers
Energy Managers
Olfactory Measurement Operators
Environmental Specialists (Eco Test)
Registered examinerof the Center of Environmental Auditor Registration (CEAR)
Pollution ControlManagers
Lead Auditor
Auditor
Provisional Auditor
Air Classes 1-4
Water Classes 1-4
Noise/Vibration
Dioxins
Number of participants in Environmental Management Systems (EMS) internal auditor development/training courses
Quali�cations
Quali�cations
Headquarters
Sekisui Chemical Co., Ltd. Tsukuba R&D Site*Hokkaido Sekisui Heim Industry Co., Ltd.Tohoku Sekisui Heim Industry Co., Ltd.Kanto Sekisui Heim Industry Co., Ltd.Tokyo Sekisui Heim Industry Co., Ltd.Chubu Sekisui Heim Industry Co., Ltd.Kinki Sekisui Heim Industry Co., Ltd.Chushikoku Sekisui Heim Industry Co., Ltd.Kyushu Sekisui Heim Industry Co., Ltd.Sekisui Board Co., Ltd. Minakuchi PlantSekisui Board Co., Ltd. Gunma PlantSekisui-SCG Industry Co., Ltd.SCG-Sekisui Sales Co., Ltd.
Sekisui Chemical Co., Ltd. Shiga-Ritto PlantSekisui Chemical Co., Ltd. Gunma PlantSekisui Chemical Co., Ltd. Kyoto R & D LaboratoriesChiba Sekisui Industry Co., Ltd.Sekisui Chemical Hokkaido Co., Ltd.Toto Sekisui Co., Ltd. Ota PlantOkayama Sekisui Industry Co., Ltd.Shikoku Sekisui Co., Ltd.Kyushu Sekisui Industry Co., Ltd.Nara Sekisui Co., Ltd.Hanyu Sekisui Co., Ltd.Yamanashi Sekisui Co., Ltd.Sekisui Home Techno Co., Ltd.Nippon No-Dig Technology Co., Ltd.Sekisui Polymer Innovations, LLC.
Bloomsburg PlantSekisui Polymer Innovations, LLC.
Holland PlantSekisui Eslon B.V. Sekisui SPR Europe G.m.b.H. Sekisui SPR Europe G.m.b.H.
Schieder PlantSekisui SPR Europe G.m.b.H. Liege PlantSEKISUI SPR Czech s.r.o.SEKISUI SPR Romania s.r.l.SEKISUI SPR Germany G.m.b.H.Sekisui Rib Loc Australia Pty. Ltd.Sekisui Refresh Co., Ltd.Sekisui Industrial Piping Co., Ltd.Sekisui (Wuxi) Plastics Technology Co., Ltd.Yongchang-Sekisui Composites Co., Ltd.Sekisui (Qingdao) Plastic Co., Ltd.Sekisui (Shanghai) Environmental Technology Co., Ltd.
Sekisui Chemical Co., Ltd. Musashi PlantSekisui Chemical Co., Ltd. Shiga-Minakuchi Plant[Sekisui Fuller Co., Ltd. Shiga Plant]Sekisui Chemical Co., Ltd. Taga PlantSekisui Chemical Co., Ltd. Minase SiteSekisui Techno Molding Co., Ltd. Nara PlantSekisui Techno Molding Co., Ltd. Mie PlantSekisui Techno Molding Co., Ltd. Aichi PlantSekisui Film Co., Ltd. Sendai PlantSekisui Film Co., Ltd. Nagoya PlantSekisui Film Co., Ltd. Shinshu-Takato PlantSekisui Film Co., Ltd. Kyushu-Izumi PlantSekisui Fuller Co., Ltd. Hamamatsu PlantSekisui Medical Co., Ltd. Iwate PlantSekisui Medical Co., Ltd. Tsukuba PlantSekisui Medical Co., Ltd. Amagasaki PlantSekisui Medical Co., Ltd. ADME & Tox. Research Institute**Sekisui Nano Coat Technology Co., Ltd.Sekisui Techno Shoji Higashi Nihon Co., LtdSekisui TA Industries, LLC.Sekisui S-Lec B.V. Film PlantSekisui S-Lec B.V. Resin PlantSekisui Alveo B.V.Sekisui Alveo Ltd.Sekisui Alveo BS G.m.b.H.Sekisui S-Lec America, LLC.Sekisui Specialty Chemicals America, LLC.
Pasadena PlantSekisui Specialty Chemicals America, LLC.
Calvert City PlantSekisui Specialty Chemicals Europe, S.L.Sekisui S-Lec Mexico S.A. de C.V.Sekisui S-Lec (Thailand) Co., Ltd.Thai Sekisui Foam Co., Ltd.Sekisui Pilon Pty. Ltd.Sekisui Diagnostics (UK) Ltd.YoungBo Chemical Co., Ltd.YoungBo HPP (Lanfang) Co., Ltd.Sekisui High Performance Packaging (Langfang) Co., Ltd.Sekisui S-LEC (Suzhou) Co., Ltd.
Sekisui Chemical Co., Ltd. Development Center*Tokuyama Sekisui Industry Co., Ltd.Hinomaru Co., Ltd. Tosu PlantHinomaru Co., Ltd. Kanto PlantSekisui Seikei, Ltd. Chiba PlantSekisui Seikei, Ltd. Kanto PlantSekisui Seikei, Ltd. Hyogo PlantSekisui Seikei, Ltd. Hyogo-Takino PlantSekisui Seikei, Ltd. Izumo Plant
[ ]: Organizations in parentheses are included in the scope of certification. Some sites not shown above may include related sections that have attained ISO 14001 certification.
* The Sekisui Chemical Co., Ltd. Tsukuba R&D Site and Development Center share a single certification.
** Eco Action 21; others ISO 14001
Environmental Management
Environmental Management System Third-Party Certified Business Sites
P26
Fields of Manufacturing Development
Needs
Interviews
CategorizationReceiving complaints Investigation Response
Senior executives and related sections
Product planning
Development and design
Production and
constructionSurveys
Other
Factor analysis
Preventative Measures
Customerfeedback
Opinions and wishes
Complaints
HayamimiNetworkContact point
Customers
Collection
Resolving dissatisfaction
Analysis UtilizationCustomer feedback
Flow of Utilizing Customer Feedback in Management
CS & Quality
Quality Management System Third-Party Certified Business Sites
P35 - 40
Urban Infrastructure & Environmental Products CompanyHousing Company High Performance Plastics Company
Headquarters
Sekisui Chemical Co., Ltd. Housing Company (integrated certification)
Housing Product Research&Development DepartmentsTechnology DepartmentHokkaido Sekisui Heim Industry Co., Ltd.Tohoku Sekisui Heim Industry Co., Ltd.Kanto Sekisui Heim Industry Co., Ltd.Tokyo Sekisui Heim Industry Co., Ltd.Chubu Sekisui Heim Industry Co., Ltd.Kinki Sekisui Heim Industry Co., Ltd.Chushikoku Sekisui Heim Industry Co., Ltd.Kyushu Sekisui Heim Industry Co., Ltd.Sekisui Global Trading Co., Ltd.Sekisui Heim Supply Co., Ltd. Technology Department
Sekisui Board Co., Ltd. Gunma PlantSekisui Board Co., Ltd. Minakuchi Plant
Sekisui Chemical Co., Ltd. Gunma PlantSekisui Chemical Co., Ltd. Shiga-Ritto PlantSekisui Aqua Systems Co., Ltd.
Plant Engineering DivisionSekisui Aqua Systems Co., Ltd.
Civil Engineering & Water Treatment DivisionSekisui Aqua Systems Co., Ltd.
Water Supply & Drainage DivisionSekisui Home Techno Co., Ltd.Hanyu Sekisui Co., Ltd.Yamanashi Sekisui Co., Ltd.Sekisui Chemical Hokkaido Co., Ltd.Toto Sekisui Co., Ltd. Headquarters, Ota PlantChiba Sekisui Industry Co., Ltd.Okayama Sekisui Industry Co., Ltd.Shikoku Sekisui Co., Ltd.Kyushu Sekisui Industry Co., Ltd.Nippon No-Dig Technology Co., Ltd.Sekisui Polymer Innovations, LLC. Bloomsburg PlantSekisui Polymer Innovations, LLC. Holland PlantSekisui SPR Europe G.m.b.H.(integrated certification)
HeadquartersProduction Division (Schieder)Production Division (Liege)Division EngineeringSales and Engineering Office
Sekisui Rib Loc Australia Pty. Ltd.Sekisui SPR Construction G.m.b.H. Sekisui SPR Austria G.m.b.H.Sekisui SPR Czech s.r.o.Sekisui SPR Romania s.r.l.Sekisui SPR Germany G.m.b.H.Sekisui Eslon B.V.Sekisui Refresh Co., Ltd.Yongchang-Sekisui Composites Co., Ltd. (Xinjiang)Sekisui (Shanghai) Environmental Technology Co., Ltd.Yili Xiang Run Pipe Industry Co., Ltd.Sekisui (Wuxi) Plastics Technology Co., Ltd.Sekisui (Qingdao) Plastic Co., Ltd.Sekisui Industrial Piping Co., Ltd.
Sekisui Chemical Co., Ltd. Musashi PlantSekisui Chemical Co., Ltd. Shiga-Minakuchi PlantSekisui Chemical Co., Ltd. Taga PlantSekisui Techno Molding Co., Ltd. Aichi PlantSekisui Techno Molding Co., Ltd. Nara PlantSekisui Techno Molding Co., Ltd. Mie PlantSekisui Film Co., Ltd. Sendai PlantSekisui Film Co., Ltd. Shinshu-Takato PlantSekisui Film Co., Ltd. Nagoya PlantSekisui Film Co., Ltd. Kyushu-Izumi PlantSekisui Nano Coat Technology Co., Ltd.Sekisui Fuller Co., Ltd. (integrated certification)
Hamamatsu PlantShiga PlantTokyo OfficeOsaka Office
Sekisui Medical Co., Ltd. HeadquartersSekisui Polymatech Co., Ltd.Sekisui High Performance Packaging (Langfang) Co., Ltd.Sekisui Voltek, LLC. Lawrence PlantSekisui Voltek, LLC. Coldwater PlantSekisui Alveo(integrated certification)
Sekisui Alveo A.G.Sekisui Alveo G.m.b.H.Sekisui Alveo (Benelux) B.V.Sekisui-Alveo S.A.Sekisui Alveo S.r.L.Sekisui Alveo S.a.r.L.
Sekisui Alveo Ltd. Sekisui Alveo B.V. YoungBo Chemical Co., Ltd.Thai Sekisui Foam Co., Ltd. Sekisui Pilon Pty. Ltd. Sekisui S-Lec America, LLC. Sekisui S-Lec B.V. Sekisui Medical Technology (China) Ltd.Sekisui S-Lec (Thailand) Co., Ltd.Sekisui S-Lec Mexico S.A. de C.V.Sekisui Diagnostics,LLC. Sekisui Diagnostics,LLC. San DiegoSekisui Diagnostics,LLC. StamfordSekisui Diagnostics P.E.I. Inc. Sekisui Diagnostics(UK) Ltd. Sekisui Virotech G.m.b.H. Sekisui Specialty Chemicals America, LLC. Calvert City Plant Sekisui Specialty Chemicals America, LLC. Pasadena Plant Sekisui Specialty Chemicals America, LLC. Dallas HQ Sekisui Specialty Chemicals Europe, S.L. Tarragona Plant
Sekisui Chemical Co., Ltd. R&D Center, IM ProjectSekisui Seikei, Ltd. (integrated certification)
Chiba PlantKanto PlantHyogo PlantHyogo-Takino PlantIzumo Plant
Tokuyama Sekisui Industry Co., Ltd.Sekisui Insurance Service Co., Ltd.
15 16

Number of employees 23,886
By region
Japan 17,743
North America, Central and South America 1,579
Europe 1,425
Asia/Pacific (including China) 3,139
Number of employees 2,293
Male 1,982
Female 311
Average years of continuous service 17.2
Male 17.4
Female 15.4
0
40
0
1
2
3
Number of New-Graduate Hires/Percentage of Women Among New-graduate Hires (Sekisui Chemical Group in Japan)
0
1,000
500
1,500
2,000
Entered FY2013
(People)
0
20
10
30
40
(%)
(%)
22
Employment Ratio of People with Disabilities (Sekisui Chemical)
0
1.0
2.0
3.0
2010
Legally stipulated rate
2011
2.12
28
Entering FY2015Entered FY2014
30
2012 2013 2014
2.03 1.99
2.592.34
新卒女性採用比率(積水化学グループ 国内)
0
20
10
30
40
2009(2010年度入社)
(%)
(%)
21
障がい者雇用率(積水化学)
0
1.0
2.0
3.0
2009
2.18
*数値は毎年6月1日現在
2010(2011年度入社)
686 735 779
●外部損失費(検証)(指数)100
100
FY2014
Directors 1 (Sekisui Chemical Group)
Percentage of management positions (%)
1.9 (Sekisui Chemical Group in Japan)
FY2013 FY2014 Cumulative total since 2000
Recruitments (cases) 23 53 298
Employees recruited 55 172 686
Applicants 111 144 1,463
Employees transferred 23 30 295
FY2012 FY2013 FY2014
Monthly average per person 15.6 16.0 16.8
FY2012 FY2013 FY2014
Average per person(not including managers)
38.3 40.0 43.2
30s 40s 50s 57Total
Number ofParticipants
Themes byAge Groups
Self-establishment Market value
Continuingto work evenafter retirement
Preparednessand motivation
TrainingContent
Recognitionof abilities andinterviews withsuperiors oncareer-relatedmatters
Affirmation ofspecialization,values, and the meaning ofwork
Aiming tokeep workingat age 65and thinkingabout succession
Puttinginto wordsdesired stylesfor ages 60-69
Number ofparticipantsin FY2014
102 86 88 40 316
Cumulativetotalnumber ofparticipantsthroughFY2014
1,950 1,777 1,049 109 4,885
FY2012 FY2013 FY2014
Number of elderly employees reemployed
65 56 83
Reemployment rate (%) 72.2 87.5* 82.2*
Number of Elderly Employees Reemployed and Reemployment Rate (Sekisui Chemical)
0
40
0
1
2
3
Number of New-Graduate Hires/Percentage of Women Among New-graduate Hires (Sekisui Chemical Group in Japan)
0
1,000
500
1,500
2,000
Entered FY2013
(People)
0
20
10
30
40
(%)
(%)
22
Employment Ratio of People with Disabilities (Sekisui Chemical)
0
1.0
2.0
3.0
2010
Legally stipulated rate
2011
2.12
28
Entering FY2015Entered FY2014
30
2012 2013 2014
2.03 1.99
2.592.34
新卒女性採用比率(積水化学グループ 国内)
0
20
10
30
40
2009(2010年度入社)
(%)
(%)
21
障がい者雇用率(積水化学)
0
1.0
2.0
3.0
2009
2.18
*数値は毎年6月1日現在
2010(2011年度入社)
686 735 779
●外部損失費(検証)(指数)100
100
Employed in FY2010
Employed in FY2011
Employed in FY2012
Employee Turnover Rate in First Three Years of Employ-ment
3.3 8.6 5.7
Employee Turnover Rate in First Three Years of Employment (Sekisui Chemical)
Training DetailsNumber of
partici-pants inFY2012
Number ofpartici-pants inFY2013
Number ofpartici-pants inFY2014
Recruitment-TypeTraining
The SaijukuSchool
This program combines intensivecourses led by visiting universityprofessors with practice tasks sothat participants can improvetheir skills and knowledge tobecome globally oriented leaders.It is intended to develop the nextgeneration of leaders.
40 36 35
Selective-TypeTraining
OpenSemi-nars
These intra-group seminars aimto improve employees’ businessskills. Employees can select freelyseminars on skills that meet theirneeds, to acquire skills that can be applied immediately to their daily work.
190 104 100
Human Resources P43 - 50
Results of Intra-group Job Posting
Overtime Hours Worked (Sekisui Chemical)
Percentage of Paid Leave Used (Sekisui Chemical)
Number of Women Directors and Percentage of Management Positions Filled by Women
Main Recruitment and Selective-Type Training Programs
Number of Employees (Sekisui Chemical) Number of Employees (Sekisui Chemical Group)
Employees’ Years of Continuous Service (Sekisui Chemical)
Note: The reemployment rate for applicants is 100%.
(Years)
(Hours)
(%)
Career Plan Training by Age
System Main Content FY2012 FY2013 FY2014
Support for childcare
Childcare leaveLeave which previously extended only until the child was a year and a halfold now extends to the end of the month of the child’s third birthday.
24 (including6 males)
28 (including8 males)
31 (including9 males)
Shortened working hours
Period that previously extended until the child was three years old now extends until the child starts fourth grade.
19 23 26
Use of flexibleworking hours
Times of starting and finishing work may be moved earlier or later by upto 60 minutes until the child reaches junior high school age.
2 2 3
Other
support
Family leaveThree days of special paid leave per year granted until the child orgrandchild starts high school (this leave can be taken for reasons such aschildbirth-related events, parents day, athletic meets, and PTA meetings)
98 (including41 males)
101 (including35 males)
104 (including59 males)
Total number of system users 143 154 164
Main Programs for Promoting Diverse Working Styles and Program Usage (Sekisui Chemical)
0
20
40
60
2010
(Cases)
(Cases) (Cases)
0
20
40
100
80
60
2010 2011
58
2012
43
0
80
40
120
160
2010
Number of Occupational Accidents
Number of Cases of Extended Sick Leave* Number of Commuting Accidents*
* Extended sick leave: This refers to a new absence of 30 calendar days or longer due to illness or injury. Reoccurrences within six months of returning to work are not included in the above count. Absences due to occupational accidents are not considered extended sick leave.
2011
47
2012
43
2011
76
2012
129
* Number of Cases: Total number of cases in which injury was suffered or damage caused (including injury to the person and property damage).
2013
2013
69
2013
120
52
34
2014
0
1
2
4
3
2010
(Cases)
1
Number of Equipment-Related Accidents*
* Equipment-related accidents: Any accident that meets one or more of the following conditions (1) – (3) (Sekisui Chemical Group standards):
(1) Personnel-related injury: occupational accidents accompanied by 30 lost working days or more(2) Property damage: 10 million yen or more(3) Loss of opportunity: 20 million yen or more
2011
02012
02013
2
4
2014
2014
64
84
2014
139
36
0
20
40
60
2009
(件)
(件) (件)
0
20
40
80
60
2009
43
2010
58
2011
43
0
80
40
120
160
2009
99
労働災害発生件数
疾病長欠※件数 通勤災害発生件数※
※疾病長欠:疾病や怪我で暦日30日以上休業したもので、新たに発生したものをいう。出勤開始後 6ケ月以内の再発はカウントしない。ただし、労働災害が原因の場合は疾病長欠としない
2010
4749
2011
43
2010
76
2011
129
※発生件数:加害・被害総件数(自損、物損も含む)
2012
2012
69
2012
120
52
20130
1
2
3
2009
(件)
1
設備災害※発生件数
※設備災害の定義:下記①~③のいずれか1つ以上の項目 を満たす災害(積水化学グループ基準)
①人的被害:損失日数30日以上の休業災害 ②物的被害:10百万円以上 ③機会損失:20百万円以上
201000
20110
2012
2
2013
2013
64
2013
139
36
109
0
0.5
1.0
1.5
2010
0
0.1
0.2
0.3
2010
Frequency Rate1 Severity Rate2
1 Frequency rate = (number of deaths and injuries in occupational accidents with lost time / total work hours) × 1,000,0002 Severity rate = (number of work days lost / total work hours) × 1,0003 Sekisui Chemical Group data: 47 production sites and four R&D laboratories4 Source of information for Japanese manufacturing industry: Ministry of Health, Labour and Welfare Survey on Occupational Accidents
2011 2012
0.43
0.98
Average of domestic manufacturing industry4
Sekisui Chemical Group3
2011
0.09
0.019
2012
0.08
0.007
Average of domestic manufacturing industry4
Sekisui Chemical Group3
0.31
1.05
2013
0.420.30
1.00
0.54
0.94 1.06
2013
0.10 0.09
0.014
2014 2014
0.016
0.10
0.018
0
0.5
1.0
1.5
2009
0.33
0.99
0
0.1
0.2
0.3
2009
0.08
0.015
度数率※1の推移 強度率※2の推移
※1 度数率=(休業災害死傷者数/総労働時間)×百万 ※2 強度率=(労働損失日数/総労働時間)×1,000 ※3 積水化学グループデータ:46生産事業所、4研究所 ※4 全国製造業データ出所:厚生労働省「労働災害動向調査」
2010 2011
0.43
0.98
全国製造業平均※4
積水化学グループ※3
2010
0.09
0.019
2011
0.08
0.007
全国製造業平均※4
積水化学グループ※3
0.31
1.05
2012
0.42
0.54
1.00 0.94
2012
0.10 0.10
0.014
2013 2013
0.018
Safety P51 - 52
17 18

0
800
Item Sekisui Chemical Group*
Classi�cation DetailsExpenseamount
Investmentamount
項目 積水化学グループ※分類 内容 費用額 投資額
* Data above include 47 production sites/4 laboratories + all departments of Headquarters + back offices of division companies.
Health, Safety and Accident-Prevention Costs
1) Costs within business-site areas Health and safety measures, rescue and protective equipment, measurement of work environment, health management, workers’ accident compensation insurance, etc. 891 5,175
2) Administrative costs Establishment and implementation of OHSMS, safety education, personnel costs, etc. 1,809 ̶3) Other Safety awards, etc. 5 ̶
Total 2,705 5,175
0
20
60
40
0
5
10
15
2010
Expense and investment amounts (100 million yen) Rate (%)
Expenses and Investments Loss Costs*
0
200
400
800
600
2010
(Yen in millions)
* Loss costs: Expenses, including man-hours, required to respond to occupational accidents, equipment- related accidents, commuting accidents, and long-term illness absences.
(Millions of yen)
2011
12.0
6.5
22.5
2011
326
2012
383.6
2012
16.8
9.8
22.3
Investment amount
Proportion of health, safety and accident-prevention investments to the total investment amount
2013
19.6
12.6
23.0
2014
18.1
28.4
10.9
51.7
27.1
15.8
2013
775.4
2014
444.5
510.9
安全衛生・防災コスト
1) 事業所エリア内コスト 安全衛生対策、救護・保護具関係、作業環境測定、健康管理、労災保険など 958 1,811
2)管理活動コスト OHSMS構築・運用、安全教育、人件費など 1,880 ̶
(百万円)
Expense amount
Note: The number of accidents represents the total for the following four companies: Sekisui Home Techno Co., Ltd., Nippon No-Dig Technology Co., Ltd., Sekisui Aqua Systems Co., Ltd., and Seiryu Maintenance Co., Ltd.
※発生件数は、積水ホームテクノ(株)、日本ノーディッグテクノロジー(株)、積水アクアシステム(株)、(株)清流メンテナンスの4社の合計件数
0
10
20
30
2010
(Accidents) (Accidents)
0
10
20
30
2010
Safety Performance at Housing Company Construction Sites Safety Performance at Urban Infrastructure & Environmental Products Company Construction Sites
2011
Number ofoccupational accidents with losttime in the NewConstruction sector
Number of occupational accidents without lost time in the NewConstruction sector
Number of occupationalaccidents without lost time in the Fami S sector
Number of occupational accidents with lost time in the Fami Ssector
4
11
15
5
5
10
2011
Occupational accidents without lost time
Occupational accidents with lost time
5
16
2012
10
14
24
8
10
18
2012
4
26
2013
8
16
24
7
12
19
2013
202
2014
4
22
26
3
9
1218
26
6
5
11
2014
213
6
6
0
10
20
30
2009
(件) (件)
5
11
16
3
12
15
0
10
20
30
2009
314
住宅カンパニー施工現場における安全成績 環境・ライフラインカンパニー施工現場における安全成績
2010
ファミエス部門不休災害件数
新築部門休業災害件数
新築部門不休災害件数
ファミエス部門休業災害件数
4
11
15
5
5
10
2010
不休災害
休業災害5
16
2011
10
14
24
8
10
18
2011
4
26
2012
8
16
24
7
12
19
2012
202
2013
4
22
26
3
9
12
2013213
8
(Accidents)
0
40
80
120
160
Status of Occupational Accidents at Overseas Production Sites
2010 2011
27
45
6280
61
44
14
110
29
41
19
594
40
27
13181
17
31
94
61
2012 2013 2014
China
Asia
Europe
North America
(件)
0
40
80
120
160
2007 2008 2009 2010
61
50
14
12137
33
233564
51
63
7
18
139
52
37
5296
32
60
44100
33
18
18
5
28
44
13186
2011 2012 2013
中国アジア
欧州
北米
74
Environmental and Social Contribution Activities
Compliance
Recipients of Fiscal 2014 Sekisui Chemical Grants for Research on Manufacturing Based on Innovations Inspired by Nature
Researcher Affiliation/University, Title* Supported Research Theme
Yuji Kishima ProfessorLaboratory of Plant Breeding, Research Faculty of Agriculture, Hokkaido University
A method of producing virus-resistant rice focused on virus fossils mined from the rice genomes.
Tsuguyuki SaitoAssociate ProfessorDepartment of Biomaterials Science, Graduate School of Agricultural and Life Sciences, The University of Tokyo
Optically transmissive and thermally insulating porous materials made of a strong wood component
Ayako Gotoh Assistant professorDepartment of Biology, Faculty of Science and Engineering, Konan University Long-term sperm mechanisms learning from ant queens
Yuko IkedaAssociate ProfessorKyoto Institute of TechnologyGraduate School of Science and Technology
A key to creation of high-performance soft materials to learn from natural rubber
Atsushi HozumiGroup LeaderNational Institute of Advanced Industrial Science and Technology (AIST)Materials Research Institute for Sustainable Development
Pattern Formation on the Skin of a MelonDevelopment of high performance film artificially mimicking biological repairing system
Kunio Kimura ProfessorGraduate School of Environmental and Life Science, Okayama University
Development of novel methodology for morphological control of polymers :Quest for origin of helical structure-
Takeharu Haino ProfessorDepartment of Chemistry, Graduate School of Science, Hiroshima University Functionalization of nano graphene through chemical modification
Eiji Ihara ProfessorGraduate School of Science and Engineering, Ehime University
Synthesis of new functional polymers by precision polymerization of a variety of diazoacetates based on learning from relationship between structure and function of polypeptides
Takashi HayashiProfessorDepartment of Applied ChemistryGraduate School of Engineering, Osaka University
Generation of an artificial light harvesting system using a hemoprotein assembly
Yasushi Shigeri Principal Research Manager National Institute of Advanced Industrial Science and Technology (AIST), Kansai Center, Health Research Institute
Creation of nanodiscs and skin care materials based on learning from Xenopus tropicalis
Masayuki Endo Associate ProfessorInstitute for Integrated Cell-Material Sciences, Kyoto University Creation of an artificial signal transduction system inspired by the cellular receptors
Makoto Sato ProfessorBrain/Liver Interface Medicine Research Center, Kanazawa University Mathematical modeling and genetic analysis of the wave of differentiation
Song-Ju KimSpecial ResearcherAtomic Electronics Unit, WPI Center for Materials Nanoarchitectonics (MANA), National Institute for Materials Science (NIMS)
Intelligent nanostructure : amoeba-inspired efficient decision maker using atomic switches
Zensho YoshidaProfessorDepartment of Advanced Energy, Graduate School of Frontier SciencesThe University of Tokyo
VORTEX –an approach from fluctuation analysis
Cross-sector
collaborative research
Mitsuru Komatsu
Associate ProfessorDivision of Sustainability of Resources, Graduate School of Environmental and Life Science, Okayama UniversityWaste Management Research Center, Okayama University
Development of a rainfall infiltration monitoring system and hydrogeological model of groundwater recharge areas through lessons learnt from IKUSUI ; water resource rearing and preservation of rural natural environment.
Masato Futagawa
Associate ProfessorDepartment of Electrical and Electronic Engineering,Graduate School of Engineering, Shizuoka University
Hikofumi Suzuki
Vice-Director of Center, Associate ProfessorIntegrated Intelligence Center, Shinshu University
P55 - 56
Training Trainees Attendance
Regular training
Training for new managers New Sekisui Chemical Group managers 175
Training for new employees
New employees of Sekisui Chemical 84
Training for specific
employee ranks
Operating officer training Sekisui Chemical 3
Director training Sekisui Chemical Group company 30
Introductory management training
Sekisui Chemical Group company 123
Manufacturing section leader training
Sekisui Chemical Group manufacturing sections 26
Area-specific training
Compliance training Sekisui Chemical Group company 1,017
U.S. compliance training Sekisui Chemical Group companies (U.S.) 22
U.S. litigation response training
Sekisui Chemical Group business sections 27
China compliance training Sekisui Chemical Group business sections 26
Antimonopoly Law training Sekisui Chemical and Sekisui Chemical Group companies 181
Bribery prevention training Sekisui Chemical Group company 129
Harassment prevention training
Sekisui Chemical Group company 1,081
Product Liability Act Sekisui Chemical Group company 52
Act against Delay in Payment of Subcontract Proceed, etc. to Subcontractors training
Sekisui Chemical Group company 192
Misleading representations law training
Sekisui Chemical Group company 41
Training Trainees Attendance
Area-specific training
Labor Relations Act Sekisui Chemical Group company 181
Contract business basic training
Sekisui Chemical Group company 74
Confidential information management
Sekisui Chemical Group company 16
Accounting (accounts receivable)
Sekisui Chemical Group company 206
Inventory management training
Sekisui Chemical Group company 24
Stamp Tax Act training Sekisui Chemical Group company 53
Mental health training Sekisui Chemical Group company 67
International business contracts training
Sekisui Chemical Group company 17
Promotion codes Sekisui Chemical Group company 11
Safe driving Sekisui Chemical Group company 82
Economic Partnership Agreement (EPA) training
Sekisui Chemical Group company 14
Construction Industry Act Sekisui Chemical Group company 99
Global training
Training for overseas company presidents
Sekisui Chemical Group company (overseas) 51
Basic training for global personnel development
Employees engaged in work related to overseas business 12
Open seminars
Labor laws, subcontractor laws, export control
Sekisui Chemical and Sekisui Chemical Group companies 151
Main Training Implemented in Fiscal 2014
* Affiliations, universities, and titles shown are current as of the time the grant was provided.
P60
19 20

Site Program
Activities ofbusiness sites
in Japan
Tohoku Sekisui Heim Industry Co., Ltd. Japanese beech tree planting at Minamizaou
Kanto Sekisui Heim Industry Co., Ltd. Sekisui Children’s Nature Study Course (observing water bugs and testing water quality)
Tokyo Sekisui Heim Industry Co., Ltd. Green Trust Kurohama Lake Environs Outing (nature field trip for children)
Sekisui Heim Kyushu Co., Ltd. Forest conservation activities, terraced rice fields in Tsuzura, Ukiha, Fukuoka Prefecture
Chiba Sekisui Industry Co., Ltd. Uruoi no Mori (Moist Forest) woodland development project
Toto Sekisui Co., Ltd. Ota Plant Clean-up activities around Yadaijin-numa (Wakimizu-numa)
Sekisui Medical Co., Ltd. Iwate Plant Tree planting around Matsuo Kosan
Sekisui Film Co., Ltd. Shinshu-Takato Plant Tenryu river aquatic environment picnic (clean-up of Mibu river waterway)
Sekisui Seikei, Ltd. Izumo Plant Izumo Children Nature School (living organism observation)
Tokuyama Sekisui Industry Co., Ltd. Sekisui no Mori forest maintenance activities
Sekisui Chemical Co., Ltd. Gunma Plant Gunma Children’s Nature Class (nature field trip for children)
Tsukuba Site Afforestation activities at the base of Mt. Tsukuba and in the Kasumigaura headspring
Sekisui Chemical Co., Ltd. Tokyo Headquarters Tree-planting activities at Umi-no-Mori (Sea Forest) in Tokyo
Activities ofoverseas business
sites
Sekisui S-Lec B.V.Sekisui Alveo B.V.
Environmental preservation activities at De Meinweg National Park (Netherlands)
Sekisui SPR Europe G.m.b.H.KMG Pipe Technologies G.m.b.H.Sekisui Nordi Tube Technologies SE
Tree planting and birdhouse building (Germany)
Sekisui America Corporation Hackensack River eco-tour and clean-up activities (U.S.)
Sekisui Voltek, LLC. Coldwater River clean-up activities (U.S.)Manchester Street Park tree and plant preservation (U.S.)
Sekisui S-Lec (Thailand) Co., Ltd. Pattaya Beach clean-up activities (Thailand)
Sekisui Industrial Piping Co., Ltd. Wuqi Citizens Elementary School clean-up activities (Taiwan)
Sekisui DLJM Molding Private Ltd. New Delhi train station clean-up activities (India)
Sekisui S-LEC (Suzhou) Co., Ltd.Sekisui (Shanghai) International Trading Co., Ltd.Sekisui Medical Technology Ltd.Sekisui (Shanghai) Environmental Technology Co., Ltd.Sekisui (Wuxi) Plastics Technology Co., Ltd.Sekisui KNT (Hebei) Environmental Technology Co., Ltd.YoungBo HPP (Lanfang) Co., Ltd.
Tree planting in Yupingshan, Suzhou (China)
International exchange and cooperation 3%
Local communities and social welfare12%
Environment13%
Contributions:179 million yen
Others 4%
Health, medicine, sports 11%
Charitable Contributions
Academia, research, and education 57%
国際交流・協力 3%
地域社会・社会福祉 12%
環境 13% 寄付金1億79百万円
その他 15%
学術・研究・教育 57%
地域社会・社会福祉
%
学術・研究・教育
%
環境 %
国際交流・協力
%
寄付金
その他 %
寄付活動の内訳
災害援助%
Examples of Main Environmental Contribution Activities Conducted in Fiscal 2014
Main Social Contribution Activities Conducted in Fiscal 2014
Program FY2014 performance Performance to date
Heart+Action Times implemented 8 times Participants 169 persons Cumulative number of
times implemented 28 times Cumulativeparticipants 474 persons
TABLE FOR TWO Sites 12 sites
Number of schoolmeals providedin developingcountries
10,517 meals
Implementing sites 12 sites
Number of schoolmeals providedin developingcountries
115,995 meals
Amount of foodaid to the Tohokuregion
210,340 yenAmount of foodaid to the Tohokuregion*
439,570 yen
TABLE FOR TWO (Vending
machines)Sites 1 site
Number of schoolmeals providedin developingcountries
3,275 meals Implementing sites 1 siteNumber of schoolmeals providedin developingcountries
5,450 meals
Houses and the Environment
Learning Program
Implementingschools 17 schools Participating
students 2,171 persons Cumulative number ofimplementing schools 93 schools
Approx. cumulative number of participating students
approximetely11,500 persons
Chemical Classroom
Timesimplemented 23 times Participating
students 3,223 persons Cumulative number oftimes implemented 147 times
Cumulative numberof participatingstudents
16,985 persons
BOOK MAGIC Timesimplemented 12 times Amount donated 67,559 yen Cumulative number of
times implemented 84 times Cumulative amountdonated 742,785 yen
* Food assistance to the Tohoku region from April 2013 to December 2014
Sekisui Chemical Group’s CSR Management System
Board of Directors
President
President
President
President
President
CSR Committee/Subcommittee Structure
Chairperson: PresidentMembers: Division Company Presidents, Headquarters Directors, and Employee Representatives
(Three people including head of Labor Union and representative of female employees)
CS & Quality Management System
Environmental Management System
Human Resources System
Safety System
Reporting/Discussion
CSR Committee
EnvironmentalSubcommittee
CS & QualitySubcommittee
Human ResourcesSubcommittee
ComplianceSubcommittee
Safety Subcommittee
Production sites
Sales companies
After-sales service sections
Quality management sections
Customer Information & Consulting Services
Technology Department
Customer Information & Consulting ServicesCustomer Information & Consulting Services
CS & Quality sections at each division company
Division companies
Headquarters
CSR Committee
CS & Quality Subcommittee
Productivity Innovation Center’s CS & Quality Group
Production sites
Construction companies
Sections in charge of safety
Sections in charge of safety
Safety sections at each division company
Division companies
Headquarters
CSR Committee
Safety Subcommittee
Productivity Innovation Center, Safety Group
Production sites
Sales companies
Environmental sections
Environmental sections
Environmental sections at each division company
Division companies
Headquarters
CSR Committee
Environmental Subcommittee
Environmental Management Group, CSR Promotion Department
HR sections at production sites,laboratories, sales facilities,
HR sections at each division company
HR at Division Company/Headquarters
Eachlabor-management
committee
CSR Committee
Human Resources Subcommittee
Compliance Management System
Discussion of Sekisui Chemical Group’s basic policies on compliance and formulation of measures to be implemented in areas such as education and training.
Reporting
Reporting
Development of countermeasures for individual compliance issues, consideration of measures to prevent their reoccurrence, etc.
Promotion and developmentof measures Compliance
Promotion Manager (person responsible for promotion)
Compliance Promotion Committee
Headquarters/Division companies
CSR Committee
Compliance Advisory Board (to address problems that have actually occurred)
Promotion of policies and measures discussed in the Subcommittee and other matters Reporting Instruction and communication
Compliance Subcommittee
Environment
Safe environment
managers’ m
eeting
Energy m
anagement
Environment
brainstorming
sessions
Subcommittee Chairperson:Executive Officer in charge of Personnel Department
Subcommittee Members: Directors in charge of HR at each division company; Corporate Officers
Subcommittee Chairperson: Head of Productivity Innovation CenterSubcommittee Members: Directors in charge of safety at each divisi on company;
General Managers of safety sections; Corporate Officers
Subcommittee Chairperson: Head of Productivity Innovation Center Subcommittee Members: Directors in charge of CS & Quality at each division
company; General Managers of CS & Quality sections; Corporate Officers
Subcommittee Chairperson: Executive Officer in charge of CSR DepartmentSubcommittee Members: Directors in charge of environmental matters at each
division company; General Managers of environmental sections; Corporate Officers
Subcommittee Chairperson: Director in charge of Legal DepartmentSubcommittee Members: Directors in charge of compliance at each division company; Headquarters Directors; General Manager, Corporate Audit Department
21 22

Sekisui Chemical Group’s CSR Management Policies
Sekisui Chemical Group Environmental Management Policy
Mission
Basic Policy
We, Sekisui Chemical Group, aim to be a Global Environmental Top Runner that contributes to the realization of a sustainable society by enabling thecontinuous growth and co-existence of ecology and the economy.
Each company in Sekisui Chemical Group advances approaches that contribute to the prevention of global warming, the preservation of biologicaldiversity and the construction of a recycling-based society in all countries and regions where they have operations, in order to leave this beautiful Earth forour children in the future.
1. We contribute to the environment through our products and services, with consideration given to the environment at all stages of the product life cycle, from research to procurement, production, sales, use, and disposal as waste.
2. We carry out environmentally conscious business activities in all our workplaces and offices, and promote our approach to the environment through cooperation with our customers and business partners.
3. We make efforts to reduce the environmental impact of greenhouse gas emissions and hazardous chemicals, etc., and to prevent pollution by promoting the effective use of limited resources and energy.
4. We observe the relevant laws, regulations, international rules, etc.5. We make efforts to improve environmental consciousness through education and advance continual improvements by setting our own objectives and
targets.6. We enhance trust through close communications with society.7. We actively engage in social contribution activities such as nature conservation activities in each region.
Sekisui Chemical Group Safety Policy
Mission
Basic Policy
We, Sekisui Chemical Group, recognize that employee safety is essential to achieving sustainable growth. We aim to be a “Safe and Secure” enterprisethat establishes safe and secure work environments and has the full trust of its customers and the community as well as its employees.
Based on the concept of human dignity that “everyone is invaluable,” we “prioritize safety over anything else” as a basic rule in all of our business activitiesfrom development, production, construction to servicing. We are committed to promoting comprehensive safety activities with the aim of achieving zerooccupational accidents, facility accidents, commuting accidents or long-term sick leave.
1. We strive to develop a safe and comfortable workplace where everyone is taken care of both mentally and physically, which should lead to good health for each of our employees, whom we highly value.
2. We thoroughly disseminate the legal requirements concerning health and safety/disaster prevention to our employees to ensure compliance.3. We carry out risk assessment and promote risk reduction measures in a systematic way to eliminate hazardous factors that compromise health and
safety/disaster prevention.4. We strive to raise awareness regarding health and safety/disaster prevention through employee education/training and promote continuous
improvements by setting voluntary objectives/goals.5. We proactively disclose any necessary information as well as gain a higher level of trust by having close communication with public administrations and
local communities.
Sekisui Chemical Group Social Contribution Policy
As a good corporate citizen, we, Sekisui Chemical Group, engage in activities that focus on the environment, the next generation and local communities, while contributing not only to business activities but also to society. All employees working for the Sekisui Chemical Group are proactively involved in society and act so that they can serve as prominent human resources in society as well. In addition, their activities are supported by each company of the Group in order to generate synergistic effects.
Sekisui Chemical Group Human Resources and Human Rights Policy
Mission
Basic Policy on Human Resources
Based on our belief that “employees are precious assets bestowed on us by society,” we, Sekisui Chemical Group, are committed to developing anenvironment where employees can work enthusiastically. We also offer various opportunities through which we help individual employees enhance theirspecialties and grow as individuals. With the recognition that it is our social responsibility to protect individual human rights, we respect the diversity, personality and individuality of eachperson, promote various working styles and create safe and secure work environments in response to the conditions in each country and region.
1. Creating opportunities to take on challengesWe encourage employees to “positively set their own goals and
aggressively to take on challenges.”
2. Culture where employees learn and grow on their ownWe strive to enrich our education/training programs and develop a
culture where employees learn and grow on their own.
3. Enhancement of the performance-based remuneration systemWe emphasize our employees’ personal commitment and strive to
constantly improve the fairness and acceptance of our assessment
system regarding performance and processes.
4. Acceptance of various working stylesWe respect various values, develop workplaces where every employee
can work with enthusiasm, and help employees achieve a balance
between life and work.
5. Creating safe and secure work environmentsWe promote employees’ health enhancement and mental health care.
Basic Policy on Human Rights
1. Respect for human rights and the prohibition of discriminationBeing aware of our position as a member of the internationalcommunity, we appreciate and respect the cultures, customs, andvalues of each region and neither violate human rights ourselves norparticipate in any such violations. We also never become involved inany conduct that might lead to discrimination. We never discriminate on the grounds of race, color, gender, age,language, religion, creed, disability, sexual orientation, nationality,geographical or social origin, property, or other status or any similarbasis, and we neither violate human rights ourselves nor participate inany such violations.
2. Prohibition of harassmentWe never commit sexual harassment or other actions that stainpersonal character.1) We do not commit sexual harassment or any conduct that might be
misunderstood as sexual harassment.2) We do not misuse the power of a superior position nor use any
language or conduct that could sexually annoy any person. In addition, we prevent other employees from using such offensive language or conduct.
3. Prohibition of forced labor and child laborWe shall never accept forced labor or child labor in any country orregion.1) We comply with the laws for the minimum working age in each
country and region and do not use child labor.2) We do not carry out any form of forced labor in any of our corporate
activities.4. Respect for basic labor rights
We respect basic labor rights, including the right of workers to organize and to bargain, in accordance with the laws and customs of each country or region, and do not infringe on these rights.
Sekisui Chemical Group CS & Quality Management Policy
Mission
Basic Policy
We, Sekisui Chemical Group, consider CS & Quality as our central concept of management and will consistently innovate to maintain the quality ofproducts throughout all our activities, continuously provide value (products and services) that meet customer expectations, strive for selection by ourcustomers on an ongoing basis, and develop and grow with the customer over the long term.
We, Sekisui Chemical Group, consider Customer [p. 16] Feedback as a precious resource for management and strive to innovate with regard to the Quality of Products, Quality of People and Quality of Systems based on the motto “We consider customer’s feedback as the beginning of our manufacturing.” Furthermore, we contribute to the realization of a safe and affluent society by continuously providing our customers and their communities with new value.
1. Ensuring Basic QualitiesTo ensure the reliability and safety of our manufactured products, which form the basis of Product Quality, we effectively leverage customer feedbackand dedicate ourselves with a strong belief in forestalling any potential trouble and preventing any future recurrence throughout our entire value chain.
2. Creating Attractive QualitiesWe aim to share the emotional values of our customers by thoroughly pursuing “what the customers value” and constantly creating attractive productsand services that should realize such customer values.
3. Upgrading Technological CapabilitiesFor the sake of ensuring Basic Qualities and for creating Attractive Qualities, we are upgrading our technological capabilities in all fields in order to achievesuperb manufacturing development.
4. Enhancing CommunicationsWe value communication with our customers and the society and make sincere efforts when dealing with them as well as complying with therelevant laws and regulations in each country and region. We place special emphasis on resolving customer complaints or claims at an early stage byresponding promptly and empathetically.
5. Providing Thorough Employee EducationTo gain and maintain the full trust of and leave a lasting impression on our customers, we provide employees with continuous CS & Quality education and motivate them to achieve self-realization through customer satisfaction.
23 24
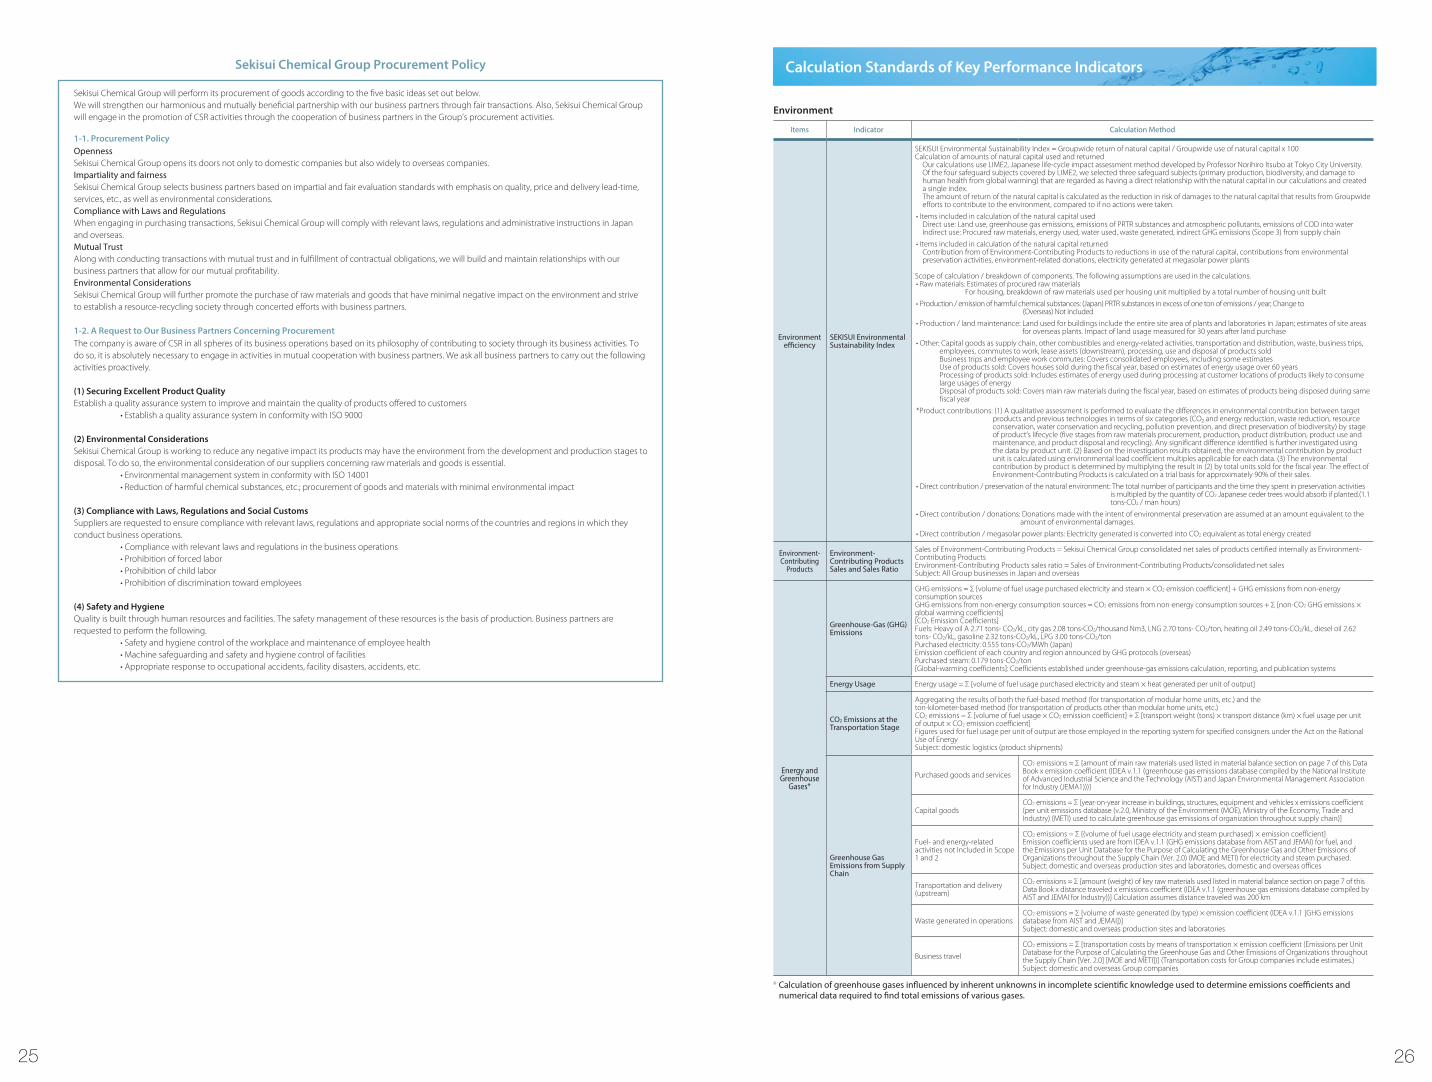
Sekisui Chemical Group Procurement Policy
Sekisui Chemical Group will perform its procurement of goods according to the five basic ideas set out below.We will strengthen our harmonious and mutually beneficial partnership with our business partners through fair transactions. Also, Sekisui Chemical Group will engage in the promotion of CSR activities through the cooperation of business partners in the Group’s procurement activities.
OpennessSekisui Chemical Group opens its doors not only to domestic companies but also widely to overseas companies.Impartiality and fairnessSekisui Chemical Group selects business partners based on impartial and fair evaluation standards with emphasis on quality, price and delivery lead-time, services, etc., as well as environmental considerations.Compliance with Laws and RegulationsWhen engaging in purchasing transactions, Sekisui Chemical Group will comply with relevant laws, regulations and administrative instructions in Japanand overseas.Mutual TrustAlong with conducting transactions with mutual trust and in fulfillment of contractual obligations, we will build and maintain relationships with ourbusiness partners that allow for our mutual profitability.Environmental ConsiderationsSekisui Chemical Group will further promote the purchase of raw materials and goods that have minimal negative impact on the environment and strive to establish a resource-recycling society through concerted efforts with business partners.
The company is aware of CSR in all spheres of its business operations based on its philosophy of contributing to society through its business activities. Todo so, it is absolutely necessary to engage in activities in mutual cooperation with business partners. We ask all business partners to carry out the followingactivities proactively.
(1) Securing Excellent Product QualityEstablish a quality assurance system to improve and maintain the quality of products offered to customers
• Establish a quality assurance system in conformity with ISO 9000
(2) Environmental ConsiderationsSekisui Chemical Group is working to reduce any negative impact its products may have the environment from the development and production stages to disposal. To do so, the environmental consideration of our suppliers concerning raw materials and goods is essential.
• Environmental management system in conformity with ISO 14001• Reduction of harmful chemical substances, etc.; procurement of goods and materials with minimal environmental impact
(3) Compliance with Laws, Regulations and Social CustomsSuppliers are requested to ensure compliance with relevant laws, regulations and appropriate social norms of the countries and regions in which theyconduct business operations.
• Compliance with relevant laws and regulations in the business operations• Prohibition of forced labor• Prohibition of child labor• Prohibition of discrimination toward employees
(4) Safety and HygieneQuality is built through human resources and facilities. The safety management of these resources is the basis of production. Business partners arerequested to perform the following.
• Safety and hygiene control of the workplace and maintenance of employee health• Machine safeguarding and safety and hygiene control of facilities• Appropriate response to occupational accidents, facility disasters, accidents, etc.
積水化学グループ「安全方針」
理 念
基本方針
積水化学グループは、従業員の安全確保なしに持続的発展はないものと認識し、安全で安心して働くことの出来る職場環境を構築し、従業員はもとよりお客様や地域の方々にも信頼される「安全・安心」企業を目指します。
「一人ひとりカケガエノナイひと」の人間尊重をベースに、開発から、生産、施工、サービスまでの全ての事業活動において、「安全を全てに優先させる」ことを基本とし、労働災害、設備災害、通勤災害、疾病長欠ゼロを目指したトータルセーフティー活動を推進します。1. 従業員一人ひとりを大切にし、心と体の両面に配慮し安全で快適な職場づくり・健康づくりを推進します。2. 安全衛生・防災に係る法的要求事項を従業員に周知徹底し、これを順守します。3. 安全衛生・防災の危険有害要因を排除するため、リスクアセスメントを実行し、計画的なリスク低減活動を推進します。4. 教育・訓練による啓発を通じて、安全衛生・防災に対する意識向上に努めるとともに、自主的な目的・目標を設定し、継続的改善を進めます。5. 行政や地域とのコミュニケーションを密にして信頼を高めるとともに、必要な情報開示を積極的に行います。
積水化学グループ「社会貢献活動方針」
積水化学グループは、良き企業市民として、「環境」「次世代」「地域コミュニティ」を視点に置いた活動に取り組み、事業活動だけでなく社会への貢献を果たします。 積水化学グループで働く全ての従業員は、積極的に社会とかかわり、社会でも際立つ人材となるよう活動します。また、会社はその活動を支援し、相乗効果を発揮することを目指します。
積水化学グループ「人材・人権方針」
理 念
人材に関する基本方針
積水化学グループは、「従業員は社会からお預かりした貴重な財産である」という考え方に基づき、従業員が活き活きと働くことができる環境づくりに取り組むとともに、一人ひとりが自分の“得意技”を磨き、成長していくことを支援するさまざまな機会を提供します。 また、個々人の人権を擁護することは社会的な責務であると認識し、一人ひとりの多様性、人格、個性を尊重するとともに、各国・地域に対応した多様な働き方・安心して働ける職場づくりを推進します。
1. チャレンジの場づくり「自ら手をあげ挑戦する」人を応援します。
2. 学び自ら成長する風土教育・研修制度を充実させ、学び自ら成長する風土づくりに努めます。
3. 成果主義の磨き上げコミットメントを重視し、成果とプロセスに対する評価への納得性・公平性を高めます。
4. 多様な働き方に応える多様な価値観を尊重し、すべての人が活き活きと働くことができる職場を作り、生活と仕事の両立を支援します。
5. 安心して働ける職場づくり従業員の健康増進とメンタルヘルスケアを推進します。
人権に関する基本方針1.人権の尊重と差別の禁止
国際社会の一員としての自覚を持ち、各地域の文化、習慣、価値観を理解、尊重し、人権侵害や人権侵害への加担をしません。また、あらゆる差別につながる行為を行いません。 人種、肌の色、性別、年齢、言葉、宗教、信条、障がい、性的指向、国籍、出身地、社会的出身、財産、その他の地位又はこれに類するあらゆる差別や人権侵害及び人権侵害への加担を行いません。
2.ハラスメントの禁止セクシャルハラスメントなど人格を傷つける行為は一切行いません。1)性的嫌がらせ、または他人に性的嫌がらせと誤解されるおそれ
のある行為は行いません。2)優位な立場の悪用や性的に不快感を与える言動や行為は、これ
を行わないとともに、他人がこれを行わないよう防止についても徹底します。
3.強制労働及び児童労働の禁止あらゆる国・地域において一切の強制労働や児童労働を認めませせん。1)各国・地域の最低年齢法を遵守し、児童労働は行いません。2)すべての企業活動において、いかなる形態の強制労働も行いません。
4.労働基本権の尊重各国・地域の法律及び習慣に従った労働者の団結権、団体交渉の権利など、労働基本権を尊重し、これを侵害しません。
1-1. Procurement Policy
1-2. A Request to Our Business Partners Concerning Procurement
Environment
Calculation Standards of Key Performance Indicators
Items Indicator Calculation Method
Environment efficiency
SEKISUI Environmental Sustainability Index
SEKISUI Environmental Sustainability Index = Groupwide return of natural capital / Groupwide use of natural capital x 100Calculation of amounts of natural capital used and returned
Our calculations use LIME2, Japanese life-cycle impact assessment method developed by Professor Norihiro Itsubo at Tokyo City University. Of the four safeguard subjects covered by LIME2, we selected three safeguard subjects (primary production, biodiversity, and damage to human health from global warming) that are regarded as having a direct relationship with the natural capital in our calculations and created a single index. The amount of return of the natural capital is calculated as the reduction in risk of damages to the natural capital that results from Groupwide efforts to contribute to the environment, compared to if no actions were taken.
• Items included in calculation of the natural capital usedDirect use: Land use, greenhouse gas emissions, emissions of PRTR substances and atmospheric pollutants, emissions of COD into water Indirect use: Procured raw materials, energy used, water used, waste generated, indirect GHG emissions (Scope 3) from supply chain
• Items included in calculation of the natural capital returnedContribution from of Environment-Contributing Products to reductions in use of the natural capital, contributions from environmental preservation activities, environment-related donations, electricity generated at megasolar power plants
Scope of calculation / breakdown of components. The following assumptions are used in the calculations.• Raw materials: Estimates of procured raw materials
For housing, breakdown of raw materials used per housing unit multiplied by a total number of housing unit built
• Production / emission of harmful chemical substances: (Japan) PRTR substances in excess of one ton of emissions / year; Change to (Overseas) Not included
• Production / land maintenance: Land used for buildings include the entire site area of plants and laboratories in Japan; estimates of site areas for overseas plants. Impact of land usage measured for 30 years after land purchase
• Other: Capital goods as supply chain, other combustibles and energy-related activities, transportation and distribution, waste, business trips, employees, commutes to work, lease assets (downstream), processing, use and disposal of products sold Business trips and employee work commutes: Covers consolidated employees, including some estimates Use of products sold: Covers houses sold during the fiscal year, based on estimates of energy usage over 60 years Processing of products sold: Includes estimates of energy used during processing at customer locations of products likely to consume large usages of energy Disposal of products sold: Covers main raw materials during the fiscal year, based on estimates of products being disposed during same fiscal year
*Product contributions: (1) A qualitative assessment is performed to evaluate the differences in environmental contribution between target products and previous technologies in terms of six categories (CO₂ and energy reduction, waste reduction, resource conservation, water conservation and recycling, pollution prevention, and direct preservation of biodiversity) by stage of product’s lifecycle (five stages from raw materials procurement, production, product distribution, product use and maintenance, and product disposal and recycling). Any significant difference identified is further investigated using the data by product unit. (2) Based on the investigation results obtained, the environmental contribution by product unit is calculated using environmental load coefficient multiples applicable for each data. (3) The environmental contribution by product is determined by multiplying the result in (2) by total units sold for the fiscal year. The effect of Environment-Contributing Products is calculated on a trial basis for approximately 90% of their sales.
• Direct contribution / preservation of the natural environment: The total number of participants and the time they spent in preservation activities is multipled by the quantity of CO2 Japanese ceder trees would absorb if planted.(1.1 tons-CO2 / man hours)
• Direct contribution / donations: Donations made with the intent of environmental preservation are assumed at an amount equivalent to the amount of environmental damages.
• Direct contribution / megasolar power plants: Electricity generated is converted into CO2 equivalent as total energy created
Environment-Contributing
Products
Environment-Contributing Products Sales and Sales Ratio
Sales of Environment-Contributing Products = Sekisui Chemical Group consolidated net sales of products certified internally as Environment-Contributing Products Environment-Contributing Products sales ratio = Sales of Environment-Contributing Products/consolidated net sales Subject: All Group businesses in Japan and overseas
Energy and Greenhouse
Gases*
Greenhouse-Gas (GHG)Emissions
GHG emissions = Σ [volume of fuel usage purchased electricity and steam × CO2 emission coefficient] + GHG emissions from non-energy consumption sourcesGHG emissions from non-energy consumption sources = CO2 emissions from non-energy consumption sources + Σ [non-CO2 GHG emissions ×global warming coefficients][CO2 Emission Coefficients]Fuels: Heavy oil A 2.71 tons- CO2/kL, city gas 2.08 tons-CO2/thousand Nm3, LNG 2.70 tons- CO2/ton, heating oil 2.49 tons-CO2/kL, diesel oil 2.62tons- CO2/kL, gasoline 2.32 tons-CO2/kL, LPG 3.00 tons-CO2/tonPurchased electricity: 0.555 tons-CO2/MWh (Japan)Emission coefficient of each country and region announced by GHG protocols (overseas)Purchased steam: 0.179 tons-CO2/ton[Global-warming coefficients]: Coefficients established under greenhouse-gas emissions calculation, reporting, and publication systems
Energy Usage Energy usage = Σ [volume of fuel usage purchased electricity and steam × heat generated per unit of output]
CO2 Emissions at theTransportation Stage
Aggregating the results of both the fuel-based method (for transportation of modular home units, etc.) and theton-kilometer-based method (for transportation of products other than modular home units, etc.)CO2 emissions = Σ [volume of fuel usage × CO2 emission coefficient] + Σ [transport weight (tons) × transport distance (km) × fuel usage per unitof output × CO2 emission coefficient]Figures used for fuel usage per unit of output are those employed in the reporting system for specified consigners under the Act on the RationalUse of Energy Subject: domestic logistics (product shipments)
Greenhouse Gas Emissions from Supply Chain
Purchased goods and services
CO2 emissions = Σ [amount of main raw materials used listed in material balance section on page 7 of this Data Book x emission coefficient (IDEA v.1.1 (greenhouse gas emissions database compiled by the National Institute of Advanced Industrial Science and the Technology (AIST) and Japan Environmental Management Association for Industry (JEMA1)))]
Capital goodsCO2 emissions = Σ [year-on-year increase in buildings, structures, equipment and vehicles x emissions coefficient (per unit emissions database (v.2.0, Ministry of the Environment (MOE), Ministry of the Economy, Trade and Industry) (METI) used to calculate greenhouse gas emissions of organization throughout supply chain)]
Fuel- and energy-relatedactivities not Included in Scope1 and 2
CO2 emissions = Σ [(volume of fuel usage electricity and steam purchased) × emission coefficient]Emission coefficients used are from IDEA v.1.1 (GHG emissions database from AIST and JEMAI) for fuel, andthe Emissions per Unit Database for the Purpose of Calculating the Greenhouse Gas and Other Emissions ofOrganizations throughout the Supply Chain (Ver. 2.0) (MOE and METI) for electricity and steam purchased.Subject: domestic and overseas production sites and laboratories, domestic and overseas offices
Transportation and delivery(upstream)
CO2 emissions = Σ [amount (weight) of key raw materials used listed in material balance section on page 7 of this Data Book x distance traveled x emissions coefficient (IDEA v.1.1 (greenhouse gas emissions database compiled by AIST and JEMAI for Industry))] Calculation assumes distance traveled was 200 km
Waste generated in operationsCO2 emissions = Σ [volume of waste generated (by type) × emission coefficient (IDEA v.1.1 [GHG emissionsdatabase from AIST and JEMAI])]Subject: domestic and overseas production sites and laboratories
Business travel
CO2 emissions = Σ [transportation costs by means of transportation × emission coefficient (Emissions per UnitDatabase for the Purpose of Calculating the Greenhouse Gas and Other Emissions of Organizations throughoutthe Supply Chain [Ver. 2.0] [MOE and METI])] (Transportation costs for Group companies include estimates.)Subject: domestic and overseas Group companies
* Calculation of greenhouse gases influenced by inherent unknowns in incomplete scientific knowledge used to determine emissions coefficients and numerical data required to find total emissions of various gases.
25 26
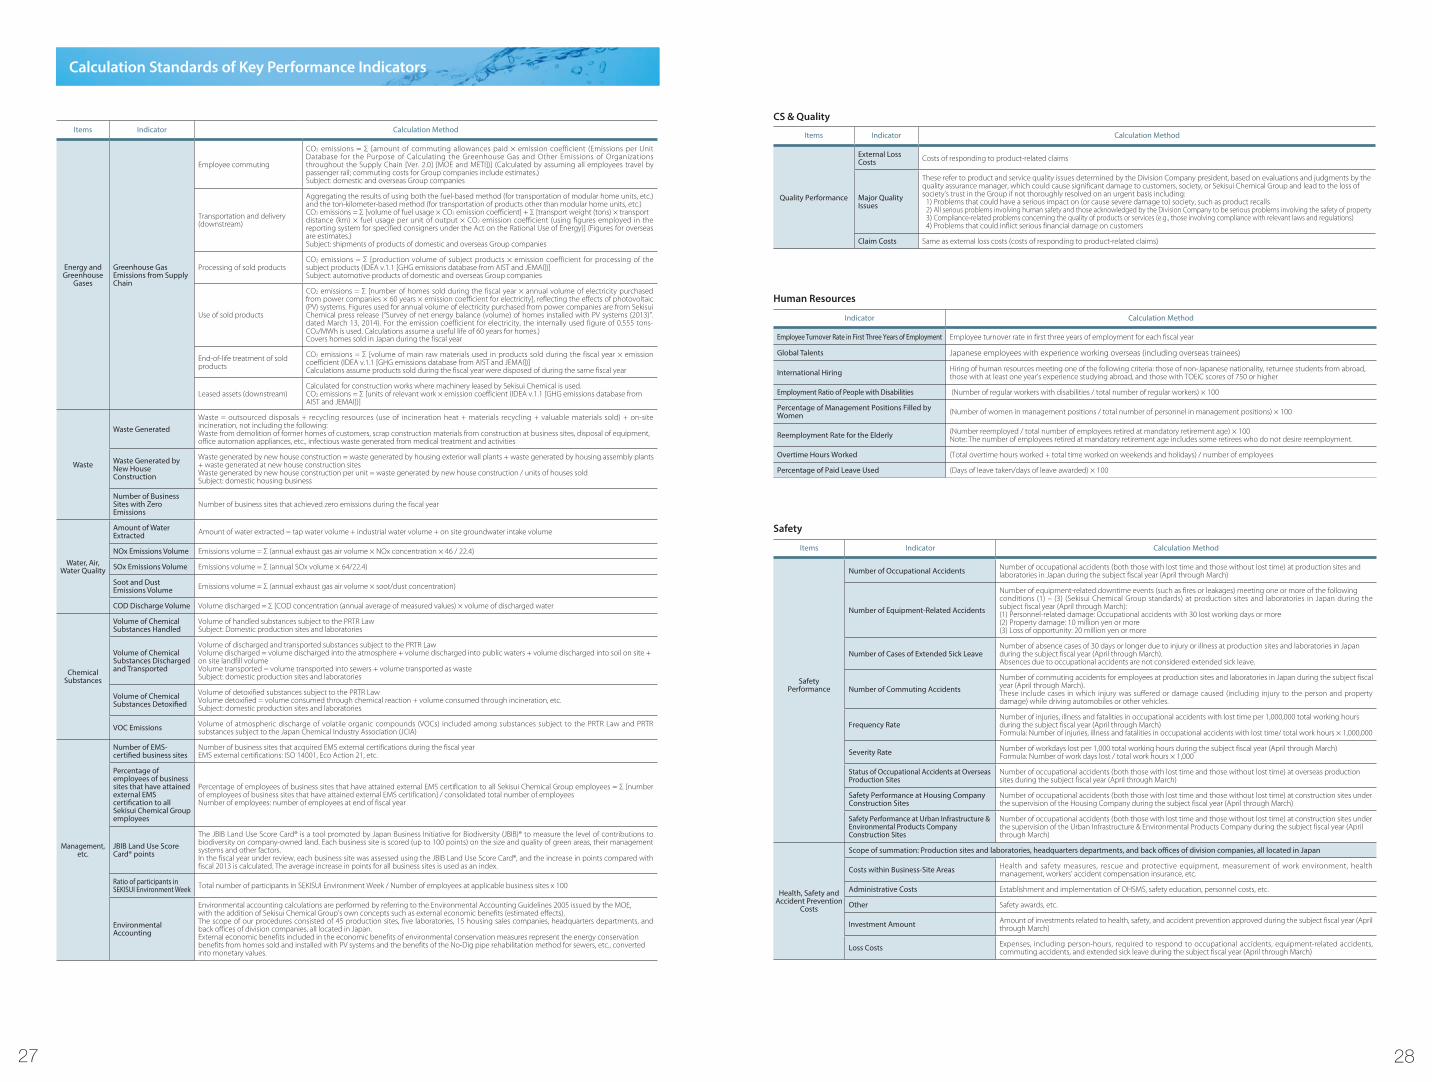
Calculation Standards of Key Performance Indicators
Items Indicator Calculation Method
Energy and Greenhouse
Gases
Greenhouse Gas Emissions from Supply Chain
Employee commuting
CO2 emissions = Σ [amount of commuting allowances paid × emission coefficient (Emissions per Unit Database for the Purpose of Calculating the Greenhouse Gas and Other Emissions of Organizations throughout the Supply Chain [Ver. 2.0] [MOE and METI])] (Calculated by assuming all employees travel by passenger rail; commuting costs for Group companies include estimates.)Subject: domestic and overseas Group companies
Transportation and delivery(downstream)
Aggregating the results of using both the fuel-based method (for transportation of modular home units, etc.) and the ton-kilometer-based method (for transportation of products other than modular home units, etc.)CO2 emissions = Σ [volume of fuel usage × CO2 emission coefficient] + Σ [transport weight (tons) × transportdistance (km) × fuel usage per unit of output × CO2 emission coefficient (using figures employed in the reporting system for specified consigners under the Act on the Rational Use of Energy)] (Figures for overseas are estimates.)Subject: shipments of products of domestic and overseas Group companies
Processing of sold productsCO2 emissions = Σ [production volume of subject products × emission coefficient for processing of the subject products (IDEA v.1.1 [GHG emissions database from AIST and JEMAI])]Subject: automotive products of domestic and overseas Group companies
Use of sold products
CO2 emissions = Σ [number of homes sold during the fiscal year × annual volume of electricity purchased from power companies × 60 years × emission coefficient for electricity], reflecting the effects of photovoltaic (PV) systems. Figures used for annual volume of electricity purchased from power companies are from Sekisui Chemical press release (“Survey of net energy balance (volume) of homes installed with PV systems (2013)”. dated March 13, 2014). For the emission coefficient for electricity, the internally used figure of 0.555 tons- CO2/MWh is used. Calculations assume a useful life of 60 years for homes.)Covers homes sold in Japan during the fiscal year
End-of-life treatment of soldproducts
CO2 emissions = Σ [volume of main raw materials used in products sold during the fiscal year × emission coefficient (IDEA v.1.1 [GHG emissions database from AIST and JEMAI])]Calculations assume products sold during the fiscal year were disposed of during the same fiscal year
Leased assets (downstream)Calculated for construction works where machinery leased by Sekisui Chemical is used.CO2 emissions = Σ [units of relevant work × emission coefficient (IDEA v.1.1 [GHG emissions database fromAIST and JEMAI])]
Waste
Waste GeneratedWaste = outsourced disposals + recycling resources (use of incineration heat + materials recycling + valuable materials sold) + on-site incineration, not including the following:Waste from demolition of former homes of customers, scrap construction materials from construction at business sites, disposal of equipment,office automation appliances, etc., infectious waste generated from medical treatment and activities
Waste Generated byNew House Construction
Waste generated by new house construction = waste generated by housing exterior wall plants + waste generated by housing assembly plants+ waste generated at new house construction sitesWaste generated by new house construction per unit = waste generated by new house construction / units of houses soldSubject: domestic housing business
Number of Business Sites with Zero Emissions
Number of business sites that achieved zero emissions during the fiscal year
Water, Air,Water Quality
Amount of WaterExtracted Amount of water extracted = tap water volume + industrial water volume + on site groundwater intake volume
NOx Emissions Volume Emissions volume = Σ (annual exhaust gas air volume × NOx concentration × 46 / 22.4)
SOx Emissions Volume Emissions volume = Σ (annual SOx volume × 64/22.4)
Soot and Dust Emissions Volume Emissions volume = Σ (annual exhaust gas air volume × soot/dust concentration)
COD Discharge Volume Volume discharged = Σ [COD concentration (annual average of measured values) × volume of discharged water
ChemicalSubstances
Volume of ChemicalSubstances Handled
Volume of handled substances subject to the PRTR LawSubject: Domestic production sites and laboratories
Volume of ChemicalSubstances Dischargedand Transported
Volume of discharged and transported substances subject to the PRTR LawVolume discharged = volume discharged into the atmosphere + volume discharged into public waters + volume discharged into soil on site +on site landfill volumeVolume transported = volume transported into sewers + volume transported as wasteSubject: domestic production sites and laboratories
Volume of ChemicalSubstances Detoxified
Volume of detoxified substances subject to the PRTR LawVolume detoxified = volume consumed through chemical reaction + volume consumed through incineration, etc.Subject: domestic production sites and laboratories
VOC Emissions Volume of atmospheric discharge of volatile organic compounds (VOCs) included among substances subject to the PRTR Law and PRTR substances subject to the Japan Chemical Industry Association (JCIA)
Management,etc.
Number of EMS-certified business sites
Number of business sites that acquired EMS external certifications during the fiscal yearEMS external certifications: ISO 14001, Eco Action 21, etc.
Percentage of employees of business sites that have attainedexternal EMS certification to all Sekisui Chemical Group employees
Percentage of employees of business sites that have attained external EMS certification to all Sekisui Chemical Group employees = Σ [number of employees of business sites that have attained external EMS certification] / consolidated total number of employeesNumber of employees: number of employees at end of fiscal year
JBIB Land Use Score Card® points
The JBIB Land Use Score Card® is a tool promoted by Japan Business Initiative for Biodiversity (JBIB)® to measure the level of contributions to biodiversity on company-owned land. Each business site is scored (up to 100 points) on the size and quality of green areas, their management systems and other factors. In the fiscal year under review, each business site was assessed using the JBIB Land Use Score Card®, and the increase in points compared with fiscal 2013 is calculated. The average increase in points for all business sites is used as an index.
Ratio of participants in SEKISUI Environment Week Total number of participants in SEKISUI Environment Week / Number of employees at applicable business sites x 100
EnvironmentalAccounting
Environmental accounting calculations are performed by referring to the Environmental Accounting Guidelines 2005 issued by the MOE,with the addition of Sekisui Chemical Group’s own concepts such as external economic benefits (estimated effects).The scope of our procedures consisted of 45 production sites, five laboratories, 15 housing sales companies, headquarters departments, and back offices of division companies, all located in Japan.External economic benefits included in the economic benefits of environmental conservation measures represent the energy conservationbenefits from homes sold and installed with PV systems and the benefits of the No-Dig pipe rehabilitation method for sewers, etc., convertedinto monetary values.
Indicator Calculation Method
Employee Turnover Rate in First Three Years of Employment Employee turnover rate in first three years of employment for each fiscal year
Global Talents Japanese employees with experience working overseas (including overseas trainees)
International Hiring Hiring of human resources meeting one of the following criteria: those of non-Japanese nationality, returnee students from abroad,those with at least one year’s experience studying abroad, and those with TOEIC scores of 750 or higher
Employment Ratio of People with Disabilities (Number of regular workers with disabilities / total number of regular workers) × 100
Percentage of Management Positions Filled byWomen (Number of women in management positions / total number of personnel in management positions) × 100
Reemployment Rate for the Elderly (Number reemployed / total number of employees retired at mandatory retirement age) × 100Note: The number of employees retired at mandatory retirement age includes some retirees who do not desire reemployment.
Overtime Hours Worked (Total overtime hours worked + total time worked on weekends and holidays) / number of employees
Percentage of Paid Leave Used (Days of leave taken/days of leave awarded) × 100
Items Indicator Calculation Method
SafetyPerformance
Number of Occupational Accidents Number of occupational accidents (both those with lost time and those without lost time) at production sites andlaboratories in Japan during the subject fiscal year (April through March)
Number of Equipment-Related Accidents
Number of equipment-related downtime events (such as fires or leakages) meeting one or more of the followingconditions (1) – (3) (Sekisui Chemical Group standards) at production sites and laboratories in Japan during the subject fiscal year (April through March):(1) Personnel-related damage: Occupational accidents with 30 lost working days or more(2) Property damage: 10 million yen or more(3) Loss of opportunity: 20 million yen or more
Number of Cases of Extended Sick LeaveNumber of absence cases of 30 days or longer due to injury or illness at production sites and laboratories in Japanduring the subject fiscal year (April through March).Absences due to occupational accidents are not considered extended sick leave.
Number of Commuting AccidentsNumber of commuting accidents for employees at production sites and laboratories in Japan during the subject fiscalyear (April through March).These include cases in which injury was suffered or damage caused (including injury to the person and property damage) while driving automobiles or other vehicles.
Frequency RateNumber of injuries, illness and fatalities in occupational accidents with lost time per 1,000,000 total working hoursduring the subject fiscal year (April through March)Formula: Number of injuries, illness and fatalities in occupational accidents with lost time/ total work hours × 1,000,000
Severity Rate Number of workdays lost per 1,000 total working hours during the subject fiscal year (April through March)Formula: Number of work days lost / total work hours × 1,000
Status of Occupational Accidents at OverseasProduction Sites
Number of occupational accidents (both those with lost time and those without lost time) at overseas productionsites during the subject fiscal year (April through March)
Safety Performance at Housing CompanyConstruction Sites
Number of occupational accidents (both those with lost time and those without lost time) at construction sites underthe supervision of the Housing Company during the subject fiscal year (April through March)
Safety Performance at Urban Infrastructure & Environmental Products Company Construction Sites
Number of occupational accidents (both those with lost time and those without lost time) at construction sites underthe supervision of the Urban Infrastructure & Environmental Products Company during the subject fiscal year (Aprilthrough March)
Health, Safety andAccident Prevention
Costs
Scope of summation: Production sites and laboratories, headquarters departments, and back offices of division companies, all located in Japan
Costs within Business-Site Areas Health and safety measures, rescue and protective equipment, measurement of work environment, health management, workers’ accident compensation insurance, etc.
Administrative Costs Establishment and implementation of OHSMS, safety education, personnel costs, etc.
Other Safety awards, etc.
Investment Amount Amount of investments related to health, safety, and accident prevention approved during the subject fiscal year (Aprilthrough March)
Loss Costs Expenses, including person-hours, required to respond to occupational accidents, equipment-related accidents, commuting accidents, and extended sick leave during the subject fiscal year (April through March)
Items Indicator Calculation Method
Quality Performance
External LossCosts Costs of responding to product-related claims
Major QualityIssues
These refer to product and service quality issues determined by the Division Company president, based on evaluations and judgments by thequality assurance manager, which could cause significant damage to customers, society, or Sekisui Chemical Group and lead to the loss ofsociety’s trust in the Group if not thoroughly resolved on an urgent basis including:
1) Problems that could have a serious impact on (or cause severe damage to) society, such as product recalls2) All serious problems involving human safety and those acknowledged by the Division Company to be serious problems involving the safety of property3) Compliance-related problems concerning the quality of products or services (e.g., those involving compliance with relevant laws and regulations)4) Problems that could inflict serious financial damage on customers
Claim Costs Same as external loss costs (costs of responding to product-related claims)
Safety
CS & Quality
Human Resources
27 28