Corporate social responsibility (CSR) and corporate responsibility (CR) February 2012

FIESP/CIESP
Social Action Department
Corporate Social
Responsibility:
Overview and Outlook
for the São Paulo State Industry
November 2003

1
Produced by
FIESP/CIESP – Federation and Center of
Industrial companies of the State of São Paulo
Planning and Coordination NAS - Social Action Department
Anne Louette
Tel (11) 3549-4465 / Fax (11) 3284-0214 e-mail:[email protected]
Survey Planning and Execution
PRATTEIN - Consultancy in Education and Social Development
Professionals in charge of the report Fábio Barbosa Ribas Jr. and Odair Prescivalle
Sponsorship
Natura Cosméticos S. A.
Souza Cruz S. A.
Graphic Design and Editing Luciano M. A. de Souza
Support Instituto Ethos de Empresas e Responsabilidade Social (Ethos Institute for
Corporate Social Responsibility)
Cristina Murachco
Centro de Voluntariado de São Paulo (São Paulo Center for Volunteering)
Rosemarie Tereza Nugent Setubal and Anísia Cravo Villas Bôas Sukadolnik
Circulation 7,000 copies
São Paulo, November 2003
Reproduction of this publication is permitted provided the source is mentioned. The whole survey is available on www.fiesp.org.br/pesquisarse

2
Words of the President of Fiesp/Ciesp The objective of this survey is to inform, instigate and engage everyone on the theme of the Corporate Social Responsibility. First of all, we can conclude that there has been progress in this area. Then, there are still huge contradictions in the way people act, and they need to be better worked on. Finally, it can be concluded that these very contradictions make room not only for reflection, but also for action. For the action of those industrialists that are less concerned with reflection, but willing to roll up their sleeves. And for the reflection of those intellectually excited industrialists who buy into the theme and, certainly, by taking it a little further, will find out something else for the ones that are in search of answers. I realize that the Third Sector entities that are in action today are a lot stronger and more powerful than they know, both in acting and in the response they get, and the level of compliance of the society is much higher than we thought. The theme of social responsibility is part of the Brazilian business agenda. Depending on the circumstances, it may or may not be a top priority on the agenda, but the theme is definitely part of the daily routine. It always comes up naturally in business discussions. Looking back, we see there was a first phase in which many heroic “Dom Quixotes” planted this seed to see how big it could grow. We are in a second phase, in which society, if not mobilized yet, is at least more knowledgeable, more aware, more enthusiastic. It is an extraordinary transformation. The data of this important survey could not be kept within Fiesp/Ciesp, for the new information it conveys will, somehow, allow larger advances and better results, increasingly proportional to the efforts put forth. It is very clear that a lot can be done, and that if we don't go this extra mile after realizing the changes that have taken place, if we don't buy in, if we don't allow criticism, if we don't cause imbalance, we won't get ahead. I am pleased to say that, among the many activities of Fiesp/Ciesp, the one that has paid me more emotional and personal dividends is this effort of working on the theme of social responsibility. The challenge is big, but the progress replenishes our enthusiasm. This is my belief, which is positively supported by the results of this business survey. I hope that all men and women of companies become increasingly aware that they have a key part to play in favor of the social well being.
Horácio Lafer Piva President of Fiesp/Ciesp

3
Words of the NAS Coordinator and 1st Vice-President of Fiesp/Ciesp We are millenial animals filled with instincts, and these instincts influence us in most of our actions. This shows exactly what companies are, for they are actually formed by a little of each one of us. However, we are currently in a course of development in which instincts are being replaced by rationality and the feelings that ennoble our actions. In this slow and relentless transformation lies our desired evolution. As individuals or as communities, we are better than the exceptions make us seem to be. However, we are still far from what we could be if we prioritized quality coexistence as a social-economic development factor. Therefore, we need to be active in this challenge, and stop counting solely on nature to cultivate society. We can and should take advantage of all the moments that give us opportunity for reflection. We should think over all this and see how this evolution from instinct to reason and feeling can be accelerated. A lot of what has motivated this survey results from this reflection. Let us think, let us perceive and let us insist on what is going on in the business community. This survey brings us new data and adds concepts and prospects that will enrich our horizons. How can we use these newly found instruments to develop even further? This survey is not just an instrument to bring up data, show situations and motivate studies. It will also be useful to motivate the educational spirit of interaction among the several actors of the process. Although it is a statistical sample of a limited amount of variables, it illuminates an extraordinary universe of potentialities. There are so many possible crossings among the variables that the possibilities of evaluations are today’s best data base available on the theme of corporate social responsibility in the state of São Paulo. Let us study in depth this work focused on the industry of São Paulo, hoping that we can spread this positive vibration throughout the Brazilian industry. We would like to invite the industrialists to be with us in the analysis of the evolution of this theme, so that the reflection on these evaluations can truly reach every one of us. In this way, we will be able to identify more clearly the routes to follow, and we will be filled with even more enthusiasm to plan the next steps, translating our efforts into the benefit of the whole society.
Carlos Roberto Liboni SAS Coordinator and
1st Vice President of Fiesp/Ciesp

4
Presentation Words of the Coordinator of the Survey The idea of corporate social responsibility has been gaining momentum in Brazil lately and is increasingly focused on the companies’ structure, activities and vision. Social responsibility is present in the relationship of companies with all their stakeholders –customers/consumers, employees, suppliers, shareholders, community, government and environment. In the current conditions of rapid change in the economic and social life, socially responsible business management is a strategic factor in order to maintain companies’ competitiveness and ability to respond to increasingly demanding markets, as well as to create a more just and sustainable social environment. In order to accomplish this, it is necessary to know what the companies are already doing in the social responsibility area, and also what is hindering or could facilitate a practical commitment of the companies to this concept. Then, it will be possible to draw an effective action plan that can help to increase the level of social responsibility in the industrial companies of São Paulo, always in line with the real needs of the different areas of the State. A lot is said about this issue, but little is known about the effective conditions of progress of this theme in companies on a day-to-day basis, especially as we leave the scope of large companies and business foundations and consider the wide range of the mid-sized and small companies spread across the State of São Paulo and throughout the country. In order to know more about this critical theme, aiming to strengthen the industrial companies located in the State of São Paulo, as well as for the development of society, FIESP, through its Social Action Department (whose mission is to spread the Social responsible practices throughout the State of São Paulo industry) devised this survey. The answers obtained will help us to understand the current trends in this area and, above all, to plan ways of support for companies interested in developing new knowledge and practices in the area of socially responsible business management. We must stress that the purpose of the survey was not to test knowledge or appraise conducts, but to know a little about the action and vision of industrial companies on aspects concerning corporate social responsibility. A study like the one suggested will set the basis for subsequent actions of FIESP affecting a large group of companies in the CSR area. Only then can we think of a CSR Network (and not just in the meritorious action of some few and large companies) - a broader effort to articulate economy and citizenship. The execution of this type of study is a task suitable for entities such as FIESP, which represents the industrialists and is the appropriate place to aggregate guidelines of interest to the all the business area, given its importance for the future of companies. The companies surveyed were randomly sampled in order to reflect the current situation in the group of industrial companies of all sizes and industrial companies established in the State of São Paulo. The obtained results were analyzed exclusively by FIESP, were made strictly confidential and will always be presented in a collective, rather than individual, way.
Anne Louette
NAS Executive

5
Summary
1. Direction and objectives of the survey
2. How the survey was carried out
3. Profile of surveyed industrial companies
4. Values and visions of the industrial companies on social responsibility
4.1. Code of ethics
4.2. Social report
4.3. Objectives aimed at by adopting CSR practices
5. What industrial companies are doing concerning their employees
5.1. Benefits not required by law
5.2. Differentiated employment and dismissal practices
5.3. Differentiated work management practices
5.4. CSR rate for “relationship with employees”
6. Relationship with suppliers and customers
6.1. Requirements and conditions offered in the relationship with suppliers
6.2. Requirements of suppliers and customers
6.3. Repercussions in the relationship chain
6.4. Practices adopted concerning customers
6.5. CSR rate for “relationship with suppliers”
7. Social actions for benefit of the community and volunteering
7.1. A widespread practice
7.2. Types of action and incidence areas
7.3. Partnerships
7.4. Perceived results
7.5. Invested resources and use of incentives
7.6. Incentive to volunteering
7.7. CSR rate for “relationship with the community”
8. Social responsibility in the relationship with the environment
8.1. Actions related to the intrinsic activities of the companies
8.2. Actions developed in the environmental area for the benefit of the community
8.3. CSR rate for “relationship with the environment”
9. Conclusions

6
1. Direction and objectives of the survey The theme of the social responsibility is becoming increasingly popular both in Brazil and in the world. Although the engagement of companies in non-profit social actions has always followed the path of Brazilian capitalism as a sort of secondary phenomenon, in the 90s a more systematic and strategic concern of companies about the issue of social responsibility starts to develop. In previous decades, the approaches concerning the social role of private initiative tended to reflect a context strongly marked by the capital/labor antagonism and by the ideologies legitimizing the interests of each one of these extremes. As of the nineties the theme of corporate social responsibility comes back in a new way, based on a set of ideas that see the capitalist company not as an agent of a necessarily predatory and excluding development anymore, but as an institution capable of articulating market and citizenship, economic development and social justice. What structural elements are behind this phenomenon? Or yet, putting the question in more practical terms, why is it so decisive nowadays for companies to formulate a new business ethic? The appropriate comprehension of the new concept of corporate social responsibility presupposes the understanding of the new requirements of rationality and system balance of the economy globalization process. It is in fact a very complex process, whose analysis goes beyond the scope of this introduction. For the purposes of this survey, it is enough to highlight the idea that the integration of the country in a market going global starts demanding of companies a new conduct that can not only lessen the negative effects of globalization, but also meet the growing demands of the market and society for an environmentally, economically and socially sustainable business activity1. Nowadays, the companies are being forced to face these challenges not just for “good guy status”, but for unavoidable requirements of competitiveness. Commenting on the increasing world interest in the issue of corporate social responsibility, Srour says:
“In the last quarter of the 20th century, the ethical issue became imperative in the scope of private companies and, as a result, of public organizations in the First World. (...) The reasons essentially lie in the fact that scandals have been brought to the surface due to the development of a plural media dedicated to investigation. Actions considered immoral or dishonest by the community were no longer hidden and tolerated. Society started to exercise effective pressure on companies. That is, given their vulnerability, customers increasingly try to assure the quality of products and services acquired. In their turn, competitors, suppliers, investors, government authorities, service providers and employees seek to know the ‘modus operandi' of the companies with whom they relate, aiming to hold back frauds and to turn down irresponsible actions.”2
As a consequence of this process, some ideas have spread over the Brazilian society: that the solution of social problems is a responsibility of all, and not just of the State; that 1 See: Gilberto Dupas: Economia global e exclusão social: pobreza, emprego, Estado e o futuro do capitalismo (Global economy and social exclusion: poverty, employment, the State and the future of capitalism) – Paz e Terra: São Paulo, 2001. 2 Robert H. Srour: Ética empresarial: a gestão da reputação – Rio de Janeiro: Editora Campus, 2003.

7
business cannot be developed unless everyone is provided with access to food, housing, education, health, employment, a healthy environment and other basic social benefits; that it is not possible anymore to accept the exclusion of a wide parcel of the population from these social benefits, as it still happens in Brazil; that only the companies that associate the strengthening of their business with these social concerns will be able to survive and grow in the near future. During the last decade, the concept of Corporate Social Responsibility (CSR) had different meanings, though not necessarily divergent. Thus, in the beginning of the 90s the companies tried to practice business philanthropy of emergency relief nature, in which donations were offered to the community without expecting that the community itself had self-help initiatives or capabilities that could be mobilized to trigger and sustain social improvement processes. In the mid 90s the concept of “private social investment” came up, characterized by the idea that companies should look for a higher level of professionalism in their non-profit social actions aiming at the community. From this moment on, there is an exponential growth in the interest of companies in carrying out different types of projects in different social areas (a movement impelled by the establishment, in 1995, of GIFE – Group of Institutes, Foundations and Companies). A decisive step in the enhancement of the concept of CSR in the country was taken by the establishment, in 1998, of Instituto Ethos de Empresas e Responsabilidade Social (Ethos Institute for Corporate Social Responsibility), responsible for the spreading of a vision on the theme as a strategic management tool and as a process permeating the relationships of companies with all its stakeholders. The path was clear for companies to adopt a more comprehensive attitude (but also subject to higher and more diversified levels of complexity) in the field of the social responsibility. In fact, the more comprehensive concept of CSR shows more clearly the relationships between the economic and social sides of the business activity, while stating more radically the possibility that companies can be co-participants and co-promoters of the process of creating a more just and sustainable society. It is worth stressing that the above mentioned process of conceptual development is not a linear movement in which one stage comes after the other. Actually, the resulting scenario is still characterized much more by the coexistence of diverse attitudes and concepts, which sometimes creates confusion and misunderstanding inside the business area and in the relationships among companies, social organizations and the State. The assimilation of the CSR concept in our environment is not independent of the cultural and economic traditions of the country. It is surely being influenced by the deepest morals in force in the Brazilian society, in which aspects such as integrity and opportunism, solidarity and individualism, altruism and partiality overlap in a complex and many times disconcerting way. More immediately, the assimilation of the CSR concept by the companies must reflect aspects of the mentality with which the Brazilian businessmen manage their businesses. In order to enable the analysis of the way the mentality of companies affects their level of adoption of social responsibility attitudes and practices, this survey took as reference three possible CSR paradigms: 1. Classical vision: In this perspective, the priority role of the company is to generate profit
and this objective shall subordinate all the decisions. In the words of Friedman: “There is one and only one social responsibility of business: to use its resources and engage in activities designed to increase its profits, so long as it stays within the rules of the game, which is to say, engages in open and free competition without deception of fraud.”1 Taken to its limit, this perspective according to which “the business of companies is to do
1 Milton Friedman: Capitalism and freedom – Chicago: University of Chicago Press, 1962.

8
business” states that social responsibility (as proposed in the following visions) is not a role of the company.
2. Instrumental-pragmatic vision: In this position, CSR is seen as a competitiveness factor
that can foster business strengthening. Social responsibility actions are taken, primarily, because they add value to the business in the short or even in the long term.
3. Instrumental-emancipating vision: In this perspective, CSR is justified, above all, for its
contribution to the well being of the community, of which the company is also part. Taken to its limit, this vision of CSR points to the possibility of a socially-oriented capitalism, capable of offering more effective responses for the challenges of social inclusion and social justice.
While the first paradigm expresses the classical reasoning of capitalism, the last two bring up the permanent stress existing between this reasoning (intrinsic and immanent to the market economy) and the reasoning of the collective interest. The second paradigm starts from the capitalist reasoning and tries to insert social responsibility in its internal postulates; the third paradigm also operates on the basic premise of capitalism, but understands it is necessary to subordinate the market mechanisms to the reasoning of democratic citizenship. Actually, both the second and the third paradigm adopt an ethic of responsibility to make decisions and choose courses of action to aim to articulate the particular interests of companies, the interests of stakeholders, and social well-being. However, while the second paradigm tends to address the reasons of business, the third one tries to turn the reasons of business into the reasons of community. Having this conceptual framework in mind, this survey tried both to meet the analytical requirements of the theme and to contribute to the programmed efforts that FIESP/CIESP intends to develop together with the São Paulo industrial companies in the CSR area. In this sense, the objectives of the study were the following:
• To analyze the current trends in the CSR area, offering a contribution to the understanding of the direction this theme is taking in the industrial environment.
• To offer material for the planning of ways to support industrial companies that are interested in developing new knowledge and practices concerning socially responsible management of business.
For this purpose, the questions guiding the survey were as follows:
• How do industrial companies define and express their values and their thought regarding CSR?
• What and how much are industrial companies doing in the following areas: - Relationship with their internal public (employees)? - Relationship with suppliers and customers? - Relationship with the community (social and volunteer actions)? - Relationship with the environment?
• What critical factors could explain the behavior of industrial companies in the CSR area?
• What aspects should be prioritized in a strategy towards the strengthening of socially responsible practices in the industrial environment?

9
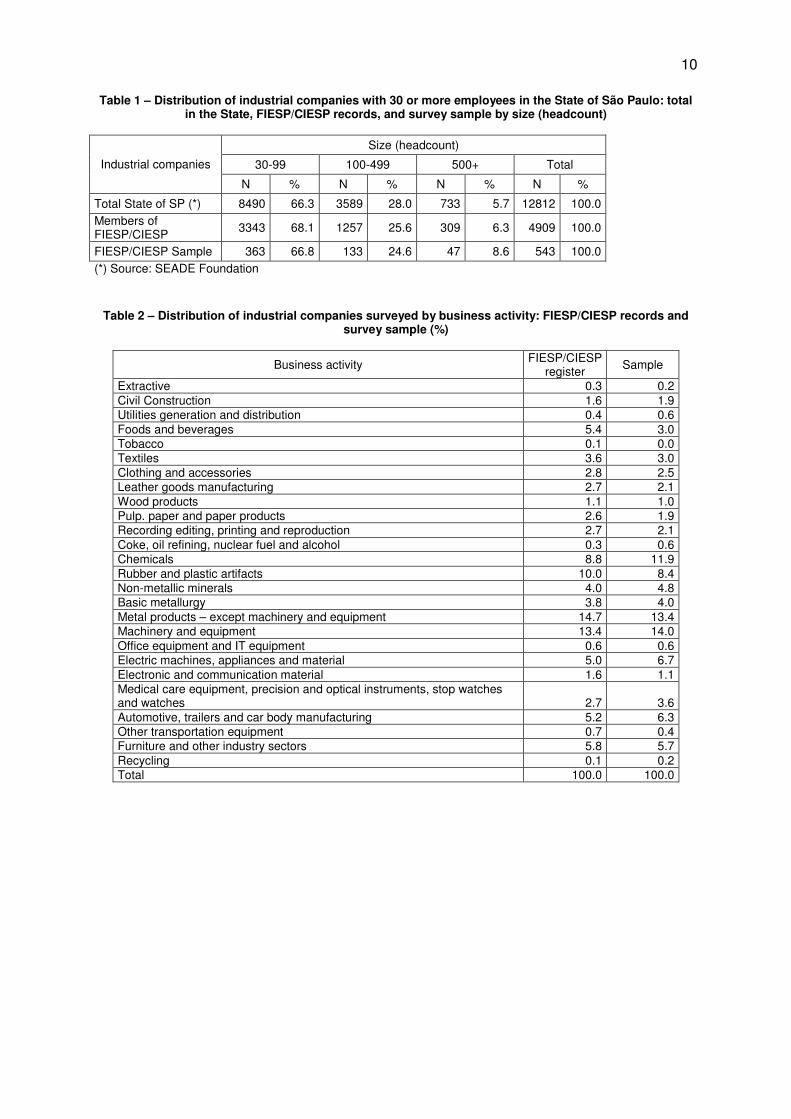
2. How the survey was carried out The data were collected between the August and September 2003 through a questionnaire containing 62 closed questions that addressed the following items: industrial companies’ profile, elaboration of code of ethics and social report; granting of non-compulsory benefits and adoption of differentiated practices in the relationship with employees; relationship with suppliers and customers; relationship with the community (social actions and incentive to employees’ community volunteering); relationship with the environment (environmental actions connected to industrial companies’ core business, and community-friendly actions in the environmental area). Besides the closed questions the questionnaire presented, for each item mentioned in the previous paragraph, a space for the company to make a statement on the issue or briefly report its experience in the area. The survey was sent to industrial companies with sites in the State of São Paulo registered at FIESP/CIESP in May 2003 totaling 4,909 industrial companies. This figure was reached after excluding companies with less than thirty employees (the so-called microcompanies and the smallest companies of the small business and smallest of mid-sized businesses). This procedure was based on two factors. First, the distribution by size of the 4,909 industrial companies registered greatly corresponds to the distribution of all the existing industrial companies (with more than 30 employees) in the State of São Paulo, which, within reason, allows some level of data projection for the total number of industrial companies in the State. Second, the previous tests of the questionnaire indicated that its length and conceptual complexity could make it hard for smaller companies to answer the questions, which would greatly limit further analysis of the results.1 The questionnaire was sent by mail to the 4,909 industrial companies registered at FIESP/CIESP at the end of July 2003, together with a letter of presentation, instructions on how to fill it out and a pre-paid envelope to send it back. At the same time, a sample of 1,200 industrial companies registered at FIESP/CIESP was randomly selected by drawing lots in each category (as defined by the headcount) and in each companies location extract. The industrial companies of this sample were contacted by telephone on August 11-15, 2003. In the contacts, reception of the questionnaire was confirmed and, in case of non reception, an electronic e-mail-attached version was made available. The industrial companies could straighten out doubts directly with the survey coordination team, either by telephone or e-mail. As a result, 543 industrial companies answered the questionnaire, a sample accounting for 11.1% of the industrial companies registered at FIESP/CIESP. The analysis of the size of the 543 surveyed industrial companies showed that they closely corresponded both to the profile of the 4,909 industrial companies registered at FIESP/CIESP and to the profile of the industrial companies of the State of São Paulo with over 30 employees (Table 1).2 The several areas of industrial activity appear in the surveyed sample with rates very close to the existing areas of activity in the FIESP/CIESP records (Table 2).
1 It should be stressed that the decision to focus only on manufacturers with over 30 employees resulted from a technical constraint, not solved in this survey, consisting of designing a tool to study social responsibility that would address the specific needs of smaller sized companies. Despite this gap, undoubtedly the issue of corporate social responsibility concerns organizations of all sizes or segments. 2 According to Fundação SEADE, in 1996 there was a total of 48,950 manufacturers based on the State of São Paulo, out of which 12,812 had 30 or more employees (PAEP – São Paulo State Economic Activity Survey)
10
Table 1 – Distribution of industrial companies with 30 or more employees in the State of São Paulo: total in the State, FIESP/CIESP records, and survey sample by size (headcount)
Size (headcount)
30-99 100-499 500+ Total Industrial companies
N % N % N % N %
Total State of SP (*) 8490 66.3 3589 28.0 733 5.7 12812 100.0 Members of FIESP/CIESP 3343 68.1 1257 25.6 309 6.3 4909 100.0
FIESP/CIESP Sample 363 66.8 133 24.6 47 8.6 543 100.0 (*) Source: SEADE Foundation
Table 2 – Distribution of industrial companies surveyed by business activity: FIESP/CIESP records and survey sample (%)
Business activity FIESP/CIESP register Sample
Extractive 0.3 0.2 Civil Construction 1.6 1.9 Utilities generation and distribution 0.4 0.6 Foods and beverages 5.4 3.0 Tobacco 0.1 0.0 Textiles 3.6 3.0 Clothing and accessories 2.8 2.5 Leather goods manufacturing 2.7 2.1 Wood products 1.1 1.0 Pulp. paper and paper products 2.6 1.9 Recording editing, printing and reproduction 2.7 2.1 Coke, oil refining, nuclear fuel and alcohol 0.3 0.6 Chemicals 8.8 11.9 Rubber and plastic artifacts 10.0 8.4 Non-metallic minerals 4.0 4.8 Basic metallurgy 3.8 4.0 Metal products – except machinery and equipment 14.7 13.4 Machinery and equipment 13.4 14.0 Office equipment and IT equipment 0.6 0.6 Electric machines, appliances and material 5.0 6.7 Electronic and communication material 1.6 1.1 Medical care equipment, precision and optical instruments, stop watches and watches
2.7
3.6
Automotive, trailers and car body manufacturing 5.2 6.3 Other transportation equipment 0.7 0.4 Furniture and other industry sectors 5.8 5.7 Recycling 0.1 0.2 Total 100.0 100.0

11
As for geographical distribution, the sample is well representative of FIESP/CIESP records (Chart 1).
Chart 1 - Distribution of industrial companies surveyed by area:
FIESP/CIESP records and survey sample (%)
11.4
6.4
20.3
8.7
53.2
12.1
7.2
23.1
8.2
49.3São Paulo
Metropolitan Area
Campinas, Vale do Paraíba and Piracicaba
Baurú, Itapetininga, Assis, Pres. Prudente andSouth Coast
Araçatuba, Marília, Rib. Preto, São José do RioPreto and Araraquara
FIESP/CIESP records Sample
Considering the number, size, geographical distribution and activity area of the industrial companies, those of the surveyed sample represents well the industrial companies of the FIESP/CIESP records and the whole of the industrial companies with 30 or more employees in the State of São Paulo. On the other hand, it is true that the final sample of 543 industrial companies was not randomly obtained, for it comprises companies that volunteered to answer the questionnaire. In light of this, it could be argued that the sample companies would be positively motivated by the theme (unlike those that did not answer the questionnaire), which would introduce a bias in the results. Such an argument can be answered by remembering that: a) many of the responding industrial companies either said they did not adopt many of the CSR practices investigated or did not have a defined CSR policy, which could suggest a profile of industrial companies not especially motivated for this theme (at least not more motivated than the average); b) most of the industrial companies of the sample (68.3%) are small size ones (up to 99 employees), this area being so far probably the one that has got the lowest level of publicity in the area of Corporate Social Responsibility. For this reason, we believe the data presented herein is relevant to understand the positioning of the industrial companies located in the State of São Paulo (with 30 or more employees) regarding the theme of Corporate Social Responsibility, and brings useful indications for devising strategies to spread this theme in the industry. Given that the questions of the questionnaire addressed different aspects of the manufacturers’ activity, the instructions requested that answers be given by the management or the department in charge of social responsibility (if any). The analysis of the profile of those responsible for filling out the questionnaires showed that in 80% of the cases the respondent was the owner, CEO, member of the top management or a manager in the company. In the remaining 20% the respondent was an assistant manager, a consultant, or a technical assistant designated by somebody in an executive position.

12
The quantitative results are presented in charts and tables. It is important to stress that, in some cases, the percentages shown are not aggregate (not totaling 100%), for in many questions of the survey the alternative answers were not exclusive (the industrial companies could carry out more than one practice simultaneously in a given area, or point out more than one reason to do it). The reader will recognize the cases in which the percentages are aggregate when the titles of charts or tables refer to frequency distribution of a given variable. Some comments made by the establishments surveyed are presented along the report, enabling the illustration of quantitative data and interrelations between the practices and the several different ways the vision of industrial companies is manifested.

13
3. Profile of the surveyed industrial companies The surveyed industrial companies were primarily characterized in relation to: size (measured by the number of employees); annual gross revenues; existence or not of corporate social responsibility management mechanisms; profitability of the business (measured by a company’s self-evaluation on its performance in the last three years and on its prospects for the next two years). The distribution of the size of companies, established by the information obtained in the questionnaire as for the number of employees, was not significantly changed in relation to the data previously available in the FIESP/CIESP records (presented in Table 1). As compared to Table 1, Chart 2 shows a slight decrease in the participation of small companies (from 66.8% to 64.3%), offset by a slight increase in the participation of the large companies (from 8.6% to 10.8%). The participation of mid-sized companies practically remained steady, going from 24.6% to 24.9%. The most significant data was a slightly higher participation of large companies in relation to the other two size categories. Another aspect that stands out is the fact that, in relation to the data of the register, some small companies showed a smaller number of employees. Two circumstances can explain this situation: the economic downturn context of the recent years and the increasing level of outsourcing at work (both of them favoring the reduction of legal work force).
Chart 2 - Distribution of industrial companies by
headcount (%)
10.824.9
64.3
Over 500100-499Up to 99
Headcount
The distribution of the surveyed industrial companies by revenue is consistent with the distribution by size. The lower level (up to R$6,125,000.00) includes most of the small companies. The following level (R$6,125,000.00-R$100,000,000.00) includes the mid-sized companies and the two levels of higher revenues include the large companies (Chart 3).
Chart 3 - Distribution of industrial companies according to gross revenue
(in reals) in 2002 (%)
54.4
35.7
6.8
2.6
0.4
Up to 6.125.000
6.125.001 to100.000.000
100.000.001 to1.000.000.000
Over 1.000.000.000
No answer
14
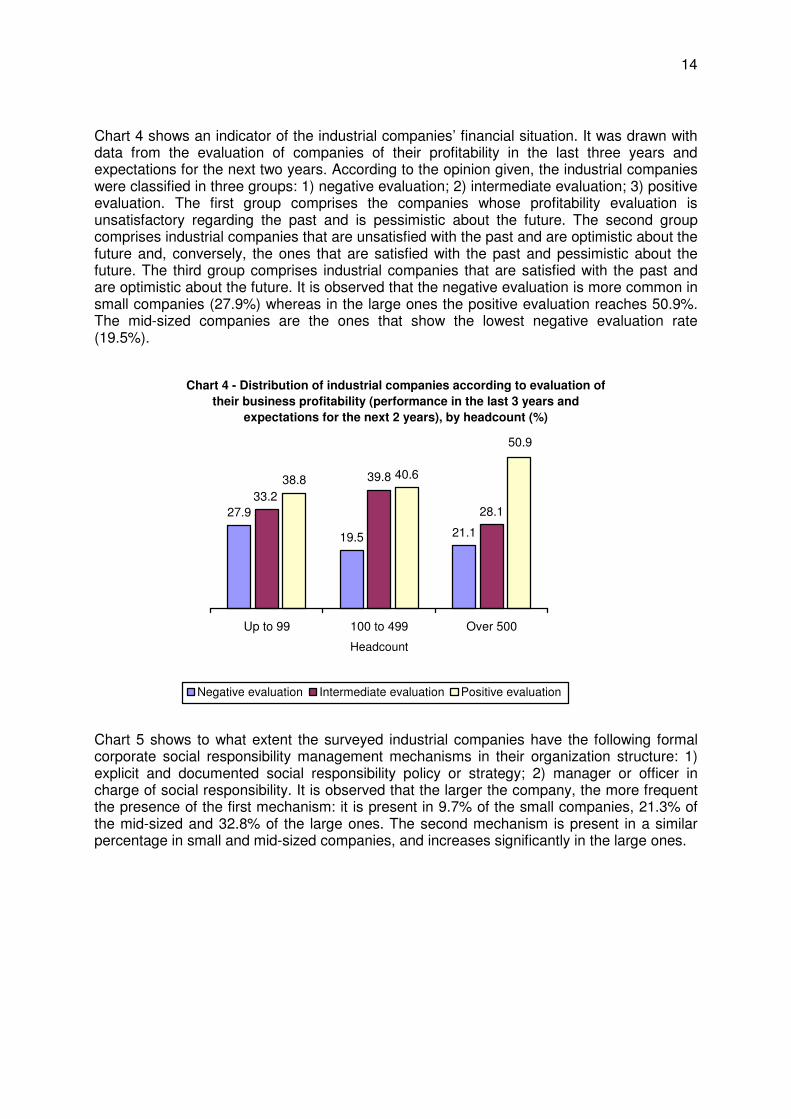
Chart 4 shows an indicator of the industrial companies’ financial situation. It was drawn with data from the evaluation of companies of their profitability in the last three years and expectations for the next two years. According to the opinion given, the industrial companies were classified in three groups: 1) negative evaluation; 2) intermediate evaluation; 3) positive evaluation. The first group comprises the companies whose profitability evaluation is unsatisfactory regarding the past and is pessimistic about the future. The second group comprises industrial companies that are unsatisfied with the past and are optimistic about the future and, conversely, the ones that are satisfied with the past and pessimistic about the future. The third group comprises industrial companies that are satisfied with the past and are optimistic about the future. It is observed that the negative evaluation is more common in small companies (27.9%) whereas in the large ones the positive evaluation reaches 50.9%. The mid-sized companies are the ones that show the lowest negative evaluation rate (19.5%).
Chart 4 - Distribution of industrial companies according to evaluation of
their business profitability (performance in the last 3 years and
expectations for the next 2 years), by headcount (%)
39.8
28.1
19.5 21.1
27.933.2
40.638.8
50.9
Up to 99 100 to 499 Over 500
Headcount
Negative evaluation Intermediate evaluation Positive evaluation
Chart 5 shows to what extent the surveyed industrial companies have the following formal corporate social responsibility management mechanisms in their organization structure: 1) explicit and documented social responsibility policy or strategy; 2) manager or officer in charge of social responsibility. It is observed that the larger the company, the more frequent the presence of the first mechanism: it is present in 9.7% of the small companies, 21.3% of the mid-sized and 32.8% of the large ones. The second mechanism is present in a similar percentage in small and mid-sized companies, and increases significantly in the large ones.

15
Chart 5 - Industrial companies that have CSR management
mechanisms (explicit policy and officer/manager), by
headcount (%)
12.4
27.6
21.3
32.8
9.713.2
Up to 99 100 to 499 Over 500
Headcount
Explicit and documented CSR policy or strategy CSR officer or manager
Considering that the increase in publicity of and interest for corporate social responsibility is a relatively recent phenomenon in the Brazilian society, these figures can be considered as quite significant. The theme advances in industrial companies’ agenda, even in the smaller ones. Besides, a number of industrial companies similar to that shown in Chart 5 say their social responsibility policies are currently in the planning phase. In industrial companies, the fact that a social responsibility policy is more commonly seen than a social responsibility officer or manager is significant: it may be showing that these companies understand social responsibility as something that should permeate all the organization and go through different decision-making processes, and not simply as an issue to be tackled by one single department. Chart 6 shows a first correlation between social responsibility and companies’ financial situation: the industrial companies that have CSR formalized in their structure also show a proportionally more positive evaluation of the profitability of their businesses.
Chart 6 - Industrial companies that have CSR management
mechanisms (explicit policy and officer/manager), by business
profitability evaluation (%)
12,9
17,3
10,9
20,9
8,812,2
Negative Intermediate Positive
Business profitability evaluation
Explicit and documented CSR policy or strategy CSR officer or manager

16
4. Values and visions of the industrial companies on social responsibility To what extent the industrial companies make their values and beliefs explicit in business codes of ethics? Have they tried to systematize and divulge their social responsible practices in social reports? And, regardless of having or not made explicit and documented their values and practices in codes of ethics or social reports, what do industrial companies think of the meaning of these instruments as guiding elements of the business activity? What types of objectives mobilize industrial companies for the adoption of social responsible practices? After all, to what extent is social responsibility a guiding value of the conduct of industrial companies?
4.1. Code of ethics The survey showed that 14.1% of the industrial companies surveyed said they had a code of ethics to guide their conduct made explicit in a document available for consultation (Chart 7). However, the interest for such instrument seems to be higher than this figure could suggest, for 15.9% of the industrial companies said their code of ethics is in the development phase and another 15.4% are willing to develop it soon. Among the remaining companies, only 4.2% explicitly downplay the importance of the code.
Chart 7 - Distribution of industrial companies according to their status
concerning code of ethics (%)
14.1
15.9
15.4
32.8
4.2
17.6
Have a documented code of ethics
Are developing a code of ethics
Do not have a code of ethics, but are willing todevelop it soon
Do not have a documented code, think it isimportant, but currently not a priority
Do not have a documented code and do not thinkit is important
Do not know
Large industrial companies (over 500 employees) are prevalent among those who have a documented code of ethics (Chart 8). The survey also shows that the adoption of this instrument has risen sharply among industrial companies in recent years: in more than half the cases the codes have been developed since 1999 (Chart 9).

17
Chart 8 - Industrial companies that have a
documented code of ethics, by headcount (%)
33.3
20.9
7.2
Over 500100 to 499Up to 99
Headcount
Chart 9 - Distribution of industrial companies that
have a code of ethics, according to the year such
code was implemented (%)
25.8
51.4
22.8
No data availableSince 1999Before 1998
Year
However, what can be said about the implicit guidance in these codes of ethics? Even though, due to the nature of this study, it has not been possible to analyze the content of the codes, some information collected allows inference on qualitative aspects. In this way, Table 3 shows that the most frequently mentioned public in the codes of ethics is the employees (mentioned in the vast majority of the cases) and the consumers/customers (mentioned in about 75.0% of the codes of industrial companies of all sizes.) The reference to suppliers and shareholders is generally higher in large companies (500 or more employees), and drops significantly in the mid-sized industrial companies (100-499 employees) and in the small ones (up to 99 employees.) The remainder of the public is less frequently mentioned (always keeping in mind that the proportionally higher percentage of reference is in the large companies.)
Table 3 – Types of public mentioned in the codes of ethics of industrial companies, by headcount (%)
Headcount
Public mentioned Total Up to 99
100-499
500+
Employees 95.7 100.0 92.6 94.7 Consumers/customers 77.1 75.0 77.7 78.9 Suppliers and service providers 64.3 58.3 55.5 84.2 Stockholders 58.6 37.5 59.2 84.2 Environment 40.0 29.1 33.3 63.1 Government 40.0 20.8 29.6 78.9 Surrounding community 34.3 25.0 25.9 57.9 Competitors 32.8 25.0 22.2 57.9 Unions 31.4 20.8 25.9 52.6 Employers’ associations 24.3 12.5 22.2 42.1 NGOs or civil society entities 20.0 8.3 18.5 26.8 Media 17.1 12.5 7.4 36.8 Minority stockholders 12.8 0.0 0.0 47.4

18
Considering now the public to which the codes of ethics is divulged, a clear prevalence of the internal public as priority focus of the companies can be equally observed: employees without a managerial role, officers and managers are mentioned by more than 90% of the industrial companies, whereas the others are mentioned in just over half of the cases.
Chart 10 - Types of public to whom industrial companies divulge their codes
of ethics (%)
92.8
92.8
57.1
55.7
54.3
15.7
Employees without amanagerial role
Officers and managers
Suppliers and serviceproviders
Stockholders
Customers
Others
These figures seem to make more sense when we examine the answers of the industrial companies to a question about the way the code of ethics is being used by them. Chart 11 shows the level of compliance of industrial companies with two possible (not exclusive) uses of the code: 1) Main use as an instrument to rule the relationships between company and employees, especially by standardizing the conduct in the workplace; 2) Use as an instrument aiming to improve the relationships the company establishes with the varied public with which it interacts. It is observed that in small industrial companies the role of ruling company-employee relationships clearly prevails over the role of improving relationships between the company and its public, whereas in mid-sized industrial companies the percentages regarding the second role are a lot higher and in the large ones the second role even prevails over the first.
Chart 11 - Use of the code of ethics by industrial companies on a day-to-
day basis, by headcount (%)
86.494.496.0
89.588.0
50.0
Up to 99 100 to 499 Over 500
Headcount
To rule relationships with employees and standardize conduct in the workplace (main use)
To improve relationships between the company and its different types of public

19
Thus, although most of the industrial companies surveyed attribute to the code of ethics a primarily ruling role focused on their internal public, with a secondary impact on customers and suppliers, there are indications that the codes might be gradually taking the strategic role of an instrument to manage the company’s relationship with its stakeholders. This trend can be only inferred among large companies, but stands out among those who have an explicit CSR policy (variable shown in Charts 5 and 6). Data collected showed that, among the latter, 89.7% said they use the code of ethics to improve relationships with several stakeholders; on the other hand, among those who do not have an explicit CSR policy, the use of the code of ethics for this broader purpose drops to 59.3%. The vision of industrial companies concerning the meaning of the code of ethics was also investigated. This was made by requesting the companies surveyed to express their level of agreement or disagreement with different statements about the meaning of the code of ethics (which refer to different paradigms on CSR mentioned in the initial chapter hereof.) All industrial companies were allowed to answer this question, whether or not they had a documented code of ethics. The results presented in Chart 12 show a high level of agreement of industrial companies with the statement that associates the code with the promotion of benefits that reach the community as a whole (0.88 in a scale ranging from 0 to 1), as well as with the statement that links the code of ethics to business strengthening (0.85 in a scale ranging from 0 to 1). At the same time, a medium level of agreement is observed (0.55 in a scale ranging from 0 to 1) for the statement that does not regard explicitness of the code of ethics as important and that limits the idea of social responsibility strictly to the legal field.
Chart 12 - Opinion of industrial companies about the meaning of the code of
ethics (rate ranging from 0 to 1, in which 0 = totally disagree and 1 = totally
agree)
0.55
0.85
0.88
Companies do not need to define their ethicalconduct rules in a document. The ethical
commitments of a company will be well compliedwith if it does not do what is forbidden by law,
complies with what the law determines and doeswhat is permitted by law
Public trust and reliability are more and morecompetitiveness factors. The code of ethics is aninstrument that helps create and keep a positive
corporate image as to these aspects, whichcauses positive repercussions for business
Companies that develop and divulge codes ofethics, informing their principles and commitments
to respect to the consumer, environment andsociety, help the spreading of a similar attitude,
which tends to improve ethical standards of societyas a whole
It is not a company's role
Strengthens business
Fosters social well-being
Here, two aspects stand out. First, industrial companies equally value the meaning of the code of ethics for the business and for the community, which might show that these ideas are not opposite. At the same time, a vision can be inferred that is ambiguous to a certain extent,

20
in that some of the companies that agreed with the most conservative statement, also agreed with the other two opposing ones when it comes to business management strategy and the acceptance of community balance as a wider principle of business legitimacy. Chart 13 data (showing the same results as in Chart 12, but now distributed according to the size of companies surveyed) shows that among the large industrial companies this ambiguity is lower, which might show the existence, in this area, of a more conscious compliance (at least in the plan of the ideas) with innovative corporate social responsibility attitudes.
Chart 13 - Opinion of industrial companies about the
meaning of the code of ethics, by headcount (rate ranging
from 0 to 1, in which 0 = totally disagree and 1 = totally
agree)
0.36
0.570.56
0.950.890.83
0.910.910.86
Up to 99 100 to 499 Over 500
Headcount
Not a company's role Strengthens business Fosters well-being
The following comments made by industrial companies surveyed exemplify several attitudes towards the meaning of the code of ethics and towards the importance of its being made explicit and divulged to the stakeholders:
“Several codes of ethics are pieces of advertising that are not complied with. We prefer a company without a code of ethics, but ethical, to one that has a code and doesn't act according to it.” (Mid-sized industrial company located in the area of Araraquara) “The code should be intrinsic, but when it’s published and divulged, it’s useful for redirecting and awareness-raising.” (Industry of medium size, located in the area of Campinas)
“I believe a code of ethics makes the company’s thought and objective explicit, thus causing the same things to be respected and pursued both inside and outside the organization.” (Small industrial company located in the Capital City of São Paulo)
4.2. Social report The survey showed this 10.8% of the industrial companies surveyed have already published their social report (Chart 14). By adding to these the 6.9% that showed intention of publishing the balance in the next period, we have a figure of 17.7% companies that seem to have already explicitly assimilated this value. It is important to observe the presence of a large group of industrial companies (32.1%) that value the balance, but rank it below other priorities, and of another equally significant group (30.3%) that has not formed an opinion on the theme.

21
Chart 14 - Distribution of industrial companies according to their status
regarding social report (%)
10.8
6.9
32.1
19.9
30.3
Have already published social report
Have never published it, but intend to do it in thenext period
Have never published it, think it is important, butother priorities might postpone this decision
Have never published it and do not think it isimportant
Do not know
As shown in Chart 15, the social report has been mainly adopted by large industrial companies: 41.5% of them have already published this document, against 9.0% of the mid-sized companies and 5.6% of the small ones.
Chart 15 - Industrial companies that have
already published their social report, by
headcount (%)
41.4
9.05.6
Up to 99 100 to 499 Over 500
Headcount
But what can be said about the content of social reports? Given the nature of the survey, it was not possible to make a direct analysis of the balances. However, a question was asked about the subjects contemplated by industrial companies in their latest published social report. As shown in Chart 16, the most frequent theme in the balances (mentioned by 43.6% of the industrial companies) refers to internal social indicators (investments aiming at the well being of employees in aspects such as food, private pension plans, health, education, day care, work safety, etc.). Still in the chapter regarding internal public, the staff indicators (headcount and number of new employees, participation in the staff of women, afro-descendants, people over 45, disabled and underage apprentices) appear as the third most frequent area, mentioned by 34.5% of the industrial companies surveyed. Figures similar to this are registered for the external social indicators (donations or investments directed to the

22
community outside the company, in areas such as education, culture, sport, social work, hunger relief, etc.) and for the environmental indicators (investments in the environmental area related to the company’s target activity or in projects for the community in the environmental area). The calculation basis (information on the net revenue, operating result and gross payroll of the company, critical for an objective evaluation of the company practices) is informed by a slightly lower number of industrial companies (29.1%). The performance improvement goals (item that shows the willingness of the company to improve practices based on the assessment of previous indicators) are the least common content in the balances (mentioned by only 18.2% of the industrial companies). This data suggests that, although social report already appears as a fact or concern in the agenda of many companies, it does not seem still to be organically inserted in strategic planning and progressive development of corporate social responsibility practices. The following comments made by industrial companies surveyed express a less rhetorical and more strategic understanding of the social report:
“The social report needs to be technically improved to become something more than a piece of advertising.” (Mid-sized industrial company located in the metropolitan area)
“Our company is developing a social report aiming to record and assess the annual actions of the company towards society and the environment. This tool will help us define the strategies that will make the evolution of such actions feasible in the following years.” (Large industrial company located in the metropolitan area)
Chart 16 - Aspects present in the latest social report of industrial
companies (%)
43.6
36.3
34.5
34.5
29.1
18.2
Internal social indicators
External social indicators
Staff indicators
Environmental indicators
Calculation basis
Performance improvement goals in one or moreindicators mentioned
In order to get an indicator of the vision of industrial companies on the meaning of social report, the companies surveyed were asked to express their level of agreement or disagreement with different statements about the meaning of such instrument (which refer to different paradigms on CSR mentioned in the initial chapter). All the industrial companies were allowed to answer this question, whether or not they had published a social report of their activities. Chart 17 shows a higher rate of agreement of the industrial companies with the statement that associates social report accomplishment and publication to the adoption of the

23
company’s commitments to keeping the balance of society as a whole (0.81 in a scale ranging from 0 to 1). The agreement with the statement that links the balance to business strengthening is slightly lower, although still high (0.74 in a scale ranging from 0 to 1). And the agreement with the statement that minimizes the importance of divulging the balance and expresses the idea that “the business of the company is to do business” shows a lower figure, but considerably above the mid point (0.60 in a scale ranging from 0 to 1).
Chart 17 - Opinion of industrial companies about the meaning of social
report (rate ranging from 0 to 1, in which 0 = totally disagree and 1 = totally
agree)
0.60
0.74
0.81
Companies social responsibility means payingtaxes, generating jobs and offering quality
products to the market. Companies must gobeyond that, but do not have to divulge their CSR
actions to be considered responsible.
Everything a company does that goes beyondwhat is determined by law, and that is positivelyvalued by society, must be widely divulged in a
social report, for it creates positive repercussionsfor its image and its competitiveness in the market.
The social report lets the company assess itsimpacts on society, and plan its evolution as
responsible company. The company’s financialresults will only have value if the society is not
threatened in its environment, safety and quality oflife.
It is not a company's role
Strengthens business
Fosters social well-being
Such results indicate a trend similar to that observed in the vision of industrial companies on the code of ethics (Chart 12), but they stress the relative ambiguity of the previously suggested vision. In other words, as far as social report is concerned, the industrial companies show a less clear and apparently more contradictory vision than when the theme in focus is code of ethics. Chart 18 data (showing the same results as in Chart 17, but now distributed according to the size of companies surveyed) show that, when it comes to social report, the vision of large industrial companies seems less ambiguous than that of companies of other sizes, although among the large companies this does not appear as clearly as when the issue was code of ethics.

24
Chart 18 - Opinion of industrial companies about the
meaning of social report, by headcount
(rate ranging from 0 to 1, in which 0 = totally disagree and 1
= totally agree)
0.450.580.63
0.820.710.73
0.880.850.78
Up to 99 100 to 499 Over 500
Headcount
Not a company's role Strengthens business Fosters well-being

25
4.3. Objectives pursued with the adoption of CSR practices What objectives do industrial companies pursue or would pursue to meet when adopting social responsible practices like the ones studied in this survey? This question was made to all the companies surveyed, no matter whether they adopted or not social responsible practices in the several areas surveyed. From the point of view of the analytical interests of the survey, it was supposed that the answers of industrial companies to this question could indicate the value they placed on the corporate social responsibility. Would industrial companies adopt (or consider adopting) socially responsible practices for reasons totally focused on the strengthening of their own competitiveness and on the preservation of their businesses, or would their motivation also express concern about the development of the community, able to harness the interests of maximized profits? When analysing the results that follow, it is useful to bear in mind that we are dealing with the visions of companies on their own motivations. In other topics, data will be presented regarding the practices that industrial companies say they actually adopt. The question asked of industrial companies requested that they rate the level of importance of objectives that can be classified into two large groups: 1) Those more closely connected to the interests of strengthening the business; 2) Those that express willingness to foster social well-being. Chart 19 shows data regarding the first group - objectives connected to strengthening the business. It is observed that the two objectives on which industrial companies place the most value refer to improvements in the human resources area (increasing the motivation of employees and attracting and keeping good employees). Improvements in corporate image and in relationship with customers come next and are also highly valued.
Chart 19 - Objectives pursued with the adoption of CSR practices:
value placed by industrial companies on factors linked to
strenghtening of business (scale ranging from 0 to 1, in which 0 = no
value and 1 = great value)
0,83
0,76
0,73
0,72
0,61
0,57
0,47
Increase motivation and engagement ofemployees and collaborators
Keep and attract good employees andcollaborators
Add value to the corporate image in societyand in the market
Increase customer/consumer satisfactionand loyalty
Obtain competitive edge in conquering andincreasing market share
Make the market and consumption moredynamic
Easier access to capital and loans

26
Chart 20 shows data regarding the second group - objectives linked to fostering social well-being. It is observed that all the objectives are regarded by industrial companies as quite important (over 0.70 in a scale ranging from 0 to 1), except for the item concerning promotion of minorities’ rights (that shows a 0.63 rate in a scale ranging from 0 to 1).
Chart 20 - Objectives pursued with the adoption of CSR practices:
value placed by industrial companies on factors linked to fostering
social well-being (rate ranging from 0 to 1, in which 0 = no value and 1
= great value)
0.82
0.82
0.76
0.74
0.73
0.70
0.63
To preserve natural resources and contributeto environmental sustainability
To contribute to reduce social problems
To improve ethical standards and democraticcoexistence in society
To reduce poverty / improve incomedistribution
To increase the level of social responsibilityin the production chain
To enhance job offers and income generation
To promote the rights of minorities
By synthesizing the results of the two previous charts, Chart 21 shows that both groups of objectives are regarded by most industrial companies as highly important, but the aspects related to the promotion of social well-being are prioritized (they are mentioned by 78.1% of industrial companies as highly important, against 66.2% recorded for the items regarding business strengthening). This data suggests that, at least in the plan of ideas, there is a significant number of industrial companies willing to adopt a business ethic that subordinates business health to community well being.
Chart 21 – Distribution of industrial companies according
to the importance attributed to two sets of objectives
(strengthening of business and fostering social well-being)
pursued with the adoption of CSR practices (%)
66.278.1
7.716.0 14.217.8
Strengthening of business Fostering social well-being
Sets of objectives
Low importance Average importance High importance
27
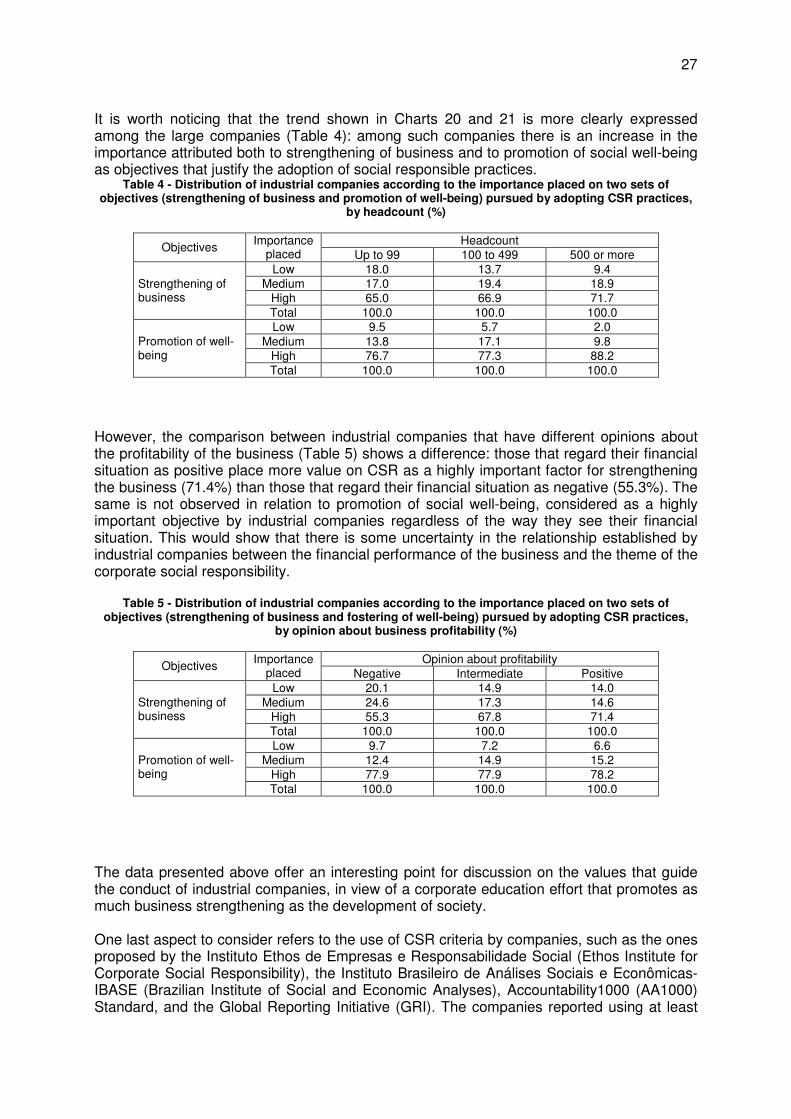
It is worth noticing that the trend shown in Charts 20 and 21 is more clearly expressed among the large companies (Table 4): among such companies there is an increase in the importance attributed both to strengthening of business and to promotion of social well-being as objectives that justify the adoption of social responsible practices.
Table 4 - Distribution of industrial companies according to the importance placed on two sets of objectives (strengthening of business and promotion of well-being) pursued by adopting CSR practices,
by headcount (%)
Headcount Objectives Importance placed Up to 99 100 to 499 500 or more
Low 18.0 13.7 9.4 Medium 17.0 19.4 18.9
High 65.0 66.9 71.7 Strengthening of business
Total 100.0 100.0 100.0 Low 9.5 5.7 2.0
Medium 13.8 17.1 9.8 High 76.7 77.3 88.2
Promotion of well-being
Total 100.0 100.0 100.0 However, the comparison between industrial companies that have different opinions about the profitability of the business (Table 5) shows a difference: those that regard their financial situation as positive place more value on CSR as a highly important factor for strengthening the business (71.4%) than those that regard their financial situation as negative (55.3%). The same is not observed in relation to promotion of social well-being, considered as a highly important objective by industrial companies regardless of the way they see their financial situation. This would show that there is some uncertainty in the relationship established by industrial companies between the financial performance of the business and the theme of the corporate social responsibility.
Table 5 - Distribution of industrial companies according to the importance placed on two sets of objectives (strengthening of business and fostering of well-being) pursued by adopting CSR practices,
by opinion about business profitability (%)
Opinion about profitability Objectives Importance placed Negative Intermediate Positive
Low 20.1 14.9 14.0 Medium 24.6 17.3 14.6
High 55.3 67.8 71.4 Strengthening of business
Total 100.0 100.0 100.0 Low 9.7 7.2 6.6
Medium 12.4 14.9 15.2 High 77.9 77.9 78.2
Promotion of well-being
Total 100.0 100.0 100.0 The data presented above offer an interesting point for discussion on the values that guide the conduct of industrial companies, in view of a corporate education effort that promotes as much business strengthening as the development of society. One last aspect to consider refers to the use of CSR criteria by companies, such as the ones proposed by the Instituto Ethos de Empresas e Responsabilidade Social (Ethos Institute for Corporate Social Responsibility), the Instituto Brasileiro de Análises Sociais e Econômicas-IBASE (Brazilian Institute of Social and Economic Analyses), Accountability1000 (AA1000) Standard, and the Global Reporting Initiative (GRI). The companies reported using at least

28
one of these criteria in stakeholder relationship management: 21.8% of the companies that published social report; 11.5% of those who have an explicit CSR policy; and 10.3% of those who developed a code of ethics. The most frequently mentioned criteria were those of the Instituto Ethos de Empresas e Responsabilidade Social and of the Instituto Brasileiro de Análises Sociais e Econômicas (IBASE). In order to strengthen the business, compliance with the principles of CSR cannot be a oneoff initiative or a fake one, developed with the purpose of generating immediate positive impact on the corporate image, but the result of a mature reflection and of a decision that reaches all the corporate policies and practices. The comment of one of the industrial companies surveyed expresses this perception, very different from a “selfish” view of the issue:
“We believe a lot of companies still use the marketing of responsibility in a deceiving way, and ideally social responsibility would not be spoken about with hypocrisy.” (Small industrial company located in the area of Campinas)
Another industrial company surveyed summarizes the kind of thought that underlies a business ethic of respect for the community:
“The companies live in the community and not off the community.” (Small industrial company located in the Capital City of São Paulo)

29
5. What industrial companies are doing concerning their employees How do industrial companies relate to their employees? What types of benefits not required by law or collective labor agreements have been granted by industrial companies to their employees and to what extent? How are the issues of diversity and respect for workers reflected in differentiated employment/dismissal and work management practices? What objectives and values do these practices convey? 5.1 Benefits not required by law The survey showed that, among the surveyed companies, 78.6% perform social actions not
required by law or collective labor agreements for the benefit of their employees. The larger the company, the higher the number of sites whose employees receive such benefits (Chart 22).
Chart 22 – Industrial companies that grant benefits not
required by law or collective labor agreements, by
headcount (%)
71.1
90.8 94.7
78.6
Up to 99 100 to 499 Over 500 Total
Headcount
As shown in Chart 23, the most frequent areas of non-compulsory benefits are food (mentioned by 72.9% of the industrial companies) and health (mentioned by 71.5% of them). At a smaller but still significant percentage comes professional training (57.4%) and education (45.4%). Sports, social work, subsidized loans and other surveyed benefits show proportionally lower percentages.

30
Chart 23 – Incidence areas of benefits not required by law or collective
labor agreements (%)
72.9
71.5
57.4
45.4
35.3
33.4
32.9
29.6
28.9
20.2
20.0
19.3
16.5
12.7
Food
Health
Professional training
Education
Sport
Social work
Subsidized loans
Leisure and recreation
Transport
Life quality program
Social security
Culture
Alcohol and drug addiction prevention program
Literacy program
According to Chart 24, the larger the company, the higher the percentage of benefits not required by law offered. It is worth mentioning, however, that in the two most frequent areas - food and health – there is only a slight difference between small companies and the others. In these two areas the percentage of mid-sized and large companies are very close (a little higher for the mid-sized ones as for food). Larger companies grant considerably more benefits in professional training, education, sports and social work. As for the subsidized loans, similarly to what was observed for food and health, the differences among the three company sizes are less significant. It is worth mentioning that “subsidized loans” rank fifth in frequency among small companies, above sports and social work.

31
Chart 24 – Main incidence areas of benefits not required by law or
collective labor agreements (%)
64.5
46.8
39.1
24.2
23.0
32.9
80.2
81.0
66.9
47.1
41.3
42.1
31.4
83.9
69.6
71.4
60.7
41.1
69.0
82.1
75.0Food
Health
Professional training
Education
Sport
Social work
Subsidized loans
Up to 99 100 to 499 Over 500
5.2. Differentiated employment and dismissal practices Table 6 shows that the differentiated practices most widely adopted by industrial companies concerning staff employment are: “learning program for underage apprentices” (33.9%) and “preferential employment policy for the unemployed” (30.9%). Next, at a decreasing percentage, comes: “retirement counseling service” (23.6%), “support, outplacement or training services for dismissed workers” (15.5%), “employment programs for the disabled” (11.7%), “work opportunity for former prisoners” (8.0%), “employment policy for people over 45” (5.0%) and, finally, employment policy for afro-descendants (2.7%).1 It is observed that the disabled, the apprentices and the employees approaching retirement are the groups most focused upon by the industrial companies that are planning practices in the area and, together with the dismissed and the people over 45, they are the groups most frequently mentioned by the industrial companies that are willing to get acquainted with alternative action in the area. On the other hand, the number of companies not willing to know more about the preferential employment policies for former prisoners (64.9%), people over 45 (66.2%) and afro-descendants (78.6%) is very high.
1 As far as afro-descendant recruiting is concerned, it is worth saying that the present survey does not have data allowing the establishment of a relationship between the existence or not of an affirmative recruitment policy for this area and the percentage of black or mulatto workers effectively hire by the industrial companies.

32
Table 6 – Distribution of industrial companies according to status concerning special employment and dismissal practices (%)
Status
Practices
In p
ract
ice
Pla
nnin
g st
age
Not
ado
pted
, but
co
mpa
ny
inte
rest
ed
Not
ado
pted
, and
co
mpa
ny n
ot
inte
rest
ed
No
answ
er
Training programs for underage apprentices 33.9 6.4 28.5 26.1 5.1
Employment policy for the unemployed 30.9 2.8 17.0 43.8 5.5
Retirement counseling 23.6 6.0 27.1 37.3 6.0
Support, outplacement and training services for dismissed workers
15.5 5.0 24.1 48.1 7.3
Employment policy for the disabled 11.7 8.7 32.7 39.4 7.5
Work opportunity for former prisoners 8.0 2.3 7.2 64.9 17.6
Employment policy for people over 45 5.0 2.2 21.0 66.2 5.6
Employment policy for afro-descendants 2.7 0.9 7.6 78.6 10.2
Chart 25 focuses on the most mentioned practices in Table 6, enabling an assessment of the behavior of industrial companies of different sizes. It is noticeable that the larger the company, the higher the percentage of professional training programs. Among the companies with 500 or more employees, this number reaches 76.3%. The largest companies are also the ones that most adopt employment programs for the disabled as well as support services, outplacement or training services for dismissed workers (40.7%, in both cases). However, company size seems to act the other way round when it comes to unemployed recruiting: the largest companies are those who adopt this practice the least, which occurs twice as much in mid-sized and small companies. As for retirement counseling and preparation, there are only slight differences among the three segments.

33
Chart 25 – Industrial companies that adopt differentiated employment
and dismissal practices, by headcount (%)
31.5
21.1
10.0
2.9
34.8
28.2
18.6
21.5
27.1
40.7
40.7
20.150.8
18.6
76.3Professional training program
Recruitment of unemployedpeople
Retirement counseling
Support/outplacement/trainingfor dismissed workers
Special program forrecruitment of disabled
people
Up to 99 100 to 499 Over 500
The data presented above shows that the disabled, the underage apprentices, the employees approaching retirement and the workers subject to dismissal are the groups most focused upon in the industrial companies’ current and future agenda. It is important to point out that employment programs for the disabled and underage apprentices are practices grounded on specific laws, which, to a certain extent, can explain the stronger interest devoted to them. Section 93 of Act no. 8.213/91 sets forth that companies with 100 or more employees shall fill in from two to five percent of their positions with rehabilitated beneficiaries or habilitated disabled, in the following proportions: up to 200 employees, 2%; from 201 to 500, 3%; from 501 to 1000, 4% and above 1000 employees, 5%. Section 36 of Decree no. 3.298/99, besides republishing that same article, assigns the Labor and Employment Department to inspect its fulfillment. Act no. 10.097/2000 sets forth that businesses of any nature shall hire and enroll in the National Services of Apprenticeship a number of apprentices equivalent to a minimum of five percent and a maximum of fifteen percent of the existing workers in each business whose functions require professional training. Table 7 has information on the volume of employed disabled in industrial companies. Considering the mid-sized and large companies only, (which are subject to Act 8.213/91), the disabled are absent in 29.6% and 8.7% of them, respectively. 36.2% of the mid-sized industrial companies and 28.3% of the large ones still are still at insufficient inclusion level, employing between 0.1% and 2% of disabled. These companies may be having difficulties in meeting the legal requirements, because, among other obstacles, they may be facing the well-known low education and professional training level of the disabled. Considering the urgent need to promote efforts in order to overcome prejudices and difficulties of practical and cultural nature that hinder the disabled integration to the productive sector, it is promising to verify in Table 6 that 11.7% of the industrial companies already carry out special employment programs for the disabled, 8.7% are planning on developing a program of this kind and 32.7% show interest in the issue.

34
Table 7 – Distribution of industrial companies according to the percentage of disabled employees, by headcount (%)
Headcount % of disabled employees Up to 99 100-499 500+
0% 77.5 29.6 8.7 0.1%-2.0% 6.2 36.2 28.3 2.1%-4.0% 7.7 28.5 26.1 Over 4.0% 8.6 5.7 36.9 Total 100.0 100.0 100.0
As for the underage apprentices, Table 8 shows they are absent in 73.2% of the small, 40.2% of the mid-sized and 11.6% of the large industrial companies. Here, the data analysis is hindered, once the Act 10.097/2000 sets forth that the companies should employ a number of apprentices corresponding to at least 5% of the occupations that require professional training. Given the extremely diversified nature of the industrial areas present in the survey sample and the intense occupational changes derived from the technological revolution, it is difficult to interpret the meaning of Table 8 figures, because a lot of companies may have a very small number of occupations in which the underage apprentices could fit. It is possible, however, as in the case of the disabled, to highlight the willingness, mainly of the large and mid-sized industrial companies, to develop programs to take on underage apprentices (Chart 25).
Table 8 – Distribution of industrial companies according to the percentage of underage apprentices, by headcount (%)
Headcount % of underage apprentices Up to 99 100-499 500+
0% 73.2 40.2 11.6 0.1%-1.0% - 30.9 62.8 Over 1.0% 26.8 28.9 25.6 Total 100.0 100.0 100.0
5.3. Differentiated work management practices Table 9 shows that the differentiated practices most adopted by industrial companies in the work management area are “programs of employees participation in the results” (64.2%), “participation of commissions formed by employees below managerial positions in internal decision-making processes” (42.4%), “ISO 9000 certification” (37.1%), “programs of recognition of suggestions made by employees for work processes improvement” (32.5%) and “organizational environment surveys” (30.7%). Among the companies that plan to adopt practices, the most mentioned are “programs of recognition of suggestions made by employees for work processes improvement” and “ISO 9000 certification.” These results show a prevailing interest of the industrial companies in participative management which articulate employees’ interests and business’ strengthening. On the other hand, when measures regarding social-cultural issues and protection against discrimination or sexual harassment are concerned, the adoption of differentiated practices is smaller. Policies to prevent discrimination in the workplace are adopted by 22.3% of the industrial companies and policies to prevent sexual harassment by 21.4%. As a rule, the survey identified that in this area, the size of the companies makes the difference again: in large companies the adoption of policies against discrimination in the workplace is of 39.7% and the adoption of policies to avoid sexual harassment is of 33.9%. Considering the existence of policies was surveyed, it is reasonable to admit a higher difficulty among the smaller companies for the formalization of rules of conduct. It is also worth mentioning that

35
safety and occupational health specific standards certification, such as AS 8000 or BS 8800, are already adopted by 5.7% of the surveyed industrial companies, most of them large ones – which can be explained by the fact that they are relatively recent international standards.
Table 9 - Distribution of industrial companies according to their status concerning special work management practices (%)
Status
Practices
In p
ract
ice
Pla
nnin
g st
age
Not
ado
pted
No
answ
er
Programs of employees´ participation in the results 64.2 9.2 24.9 1.7
Participation of commissions formed by employees below managerial positions in internal decision-making processes
42.4 5.8 46.0 5.8
ISO 9000 certification 37.1 16.5 45.3 1.1
Programs of recognition of suggestions made by employees for work processes improvement 32.5 20.9 43.0 3.6
Survey of organizational environment 30.7 7.1 58.7 3.5
Policies to prevent discrimination in the workplace 22.3 6.0 61.9 9.8
Policies to prevent sexual harassment 21.4 3.0 66.5 9.1
Safety and occupational health specific standards certification (such as S.A 8000 or BS 8800) 5.7 9.0 81.6 3.7
Table 10 presents the position of the industrial companies surveyed regarding four relationship situations with the labor unions. The data shows that the most common practice is the supply of information to the unions on the working conditions of the company (adopted under any condition by 55.7% of the surveyed companies and under certain conditions by 31.1%). Union representation within the workplace is also significantly adopted (predominantly with some restrictions). Periodic meetings to hear suggestions and negotiate claims as well as discussions on decisions or changes in perspectives within the company that might affect the workers are less frequent. However, it is worth highlighting that even these last two situations, which often involve interaction and negotiation around conflicting interests, are somewhat present in more than half of the industrial companies, suggesting the potential existence of a collaborative dialogue with the labor unions, which is consistent with a more advanced conception of Corporate Social Responsibility.
Table 10 - Distribution of industrial companies according to practices adopted in the relationship with labor unions (%)
Is the practice adopted by the company?
Practices Yes, under any
conditions
Yes, under certain
conditions No
Supply of information to the unions on working conditions in the company 55.7 31.1 13.2
Enables the unions’ representation within the workplace 32.0 49.0 19.0 Periodic meetings to hear suggestions and negotiate claims 25.6 32.0 42.4 Discussions on decisions or changes in perspectives within the company that might affect the workers 20.6 33.0 46.4

36
5.4. CSR rate for “relationship with employees” In order to obtain a clearer view of the extent of the industrial companies engagement in socially responsible practices investigated in this survey, a rate of Corporate Social Responsibility was created. This rate summarizes the answers of the industrial companies to the objective questionnaire used to find out which practices are being adopted and which are not. Devised for each industry participating in the survey, the rate varies according to the number of practices adopted. An indicator was obtained which allows one to distinguish how many companies present low, medium or high rate of socially responsible practices, in relation to each stakeholder focused upon in the survey - employees, suppliers, community and environment (due to limitations of the survey questionnaire, a rate of practices regarding customers was not devised). The data previously presented showed that, with some exceptions – many times important ones - the large industrial companies have conditions that enable them to perform broader actions than the mid-sized and small ones. Comparisons among industrial companies of different sizes are valid, because, this way, the influence of the size variable in the behavior of the companies can be assessed. However, it is equally important to make use of a criterion that allows offsetting the influence (clearly significant, in certain cases) of the company size, which will allow the evaluation of the proportion of companies that, in each size area, performs with more or less intensity. The CSR rate, created in this survey, allows the understanding of the diversity of industrial companies’ engagement in socially responsible practices among industrial companies homogeneous in size. This way, the rate allows a more accurate evaluation of possible existing relationships between the level of engagement of the companies with the CSR practices and critical variables such as the degree of formalization of CSR policies within the companies and the companies’ visions regarding the meaning of CSR. For the construction of the CSR rate the average number of practices stated by the industrial companies in each group of indicators was considered, in each size area. The distance of each industry from this average defined its position within a numeric scale ranging from 0 to 1. This way, it was possible to classify each company within its group and to distribute the group of industrial companies, for data presentation purposes, in three levels: low rate of practices (up to 0.39), medium rate of practices (0.40 to 0.59) and high rates of practice (0.60 or up). The CSR rate for “relationship with employees” is show in Figure 1. It is based on the number of practices adopted by the industrial companies in the following areas: granting of benefits not required by law or collective labor agreement; differentiated employment and dismissal practices; differentiated work management practices.
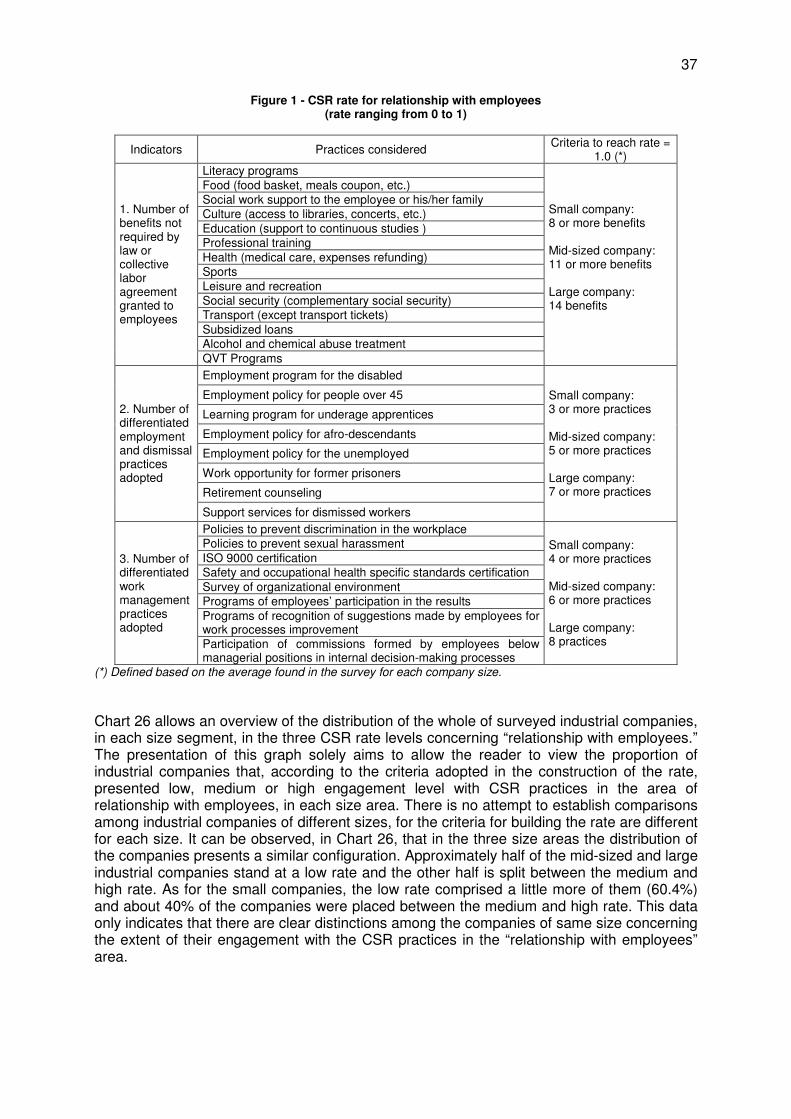
37
Figure 1 - CSR rate for relationship with employees (rate ranging from 0 to 1)
Indicators Practices considered Criteria to reach rate = 1.0 (*)
Literacy programs Food (food basket, meals coupon, etc.) Social work support to the employee or his/her family Culture (access to libraries, concerts, etc.) Education (support to continuous studies ) Professional training Health (medical care, expenses refunding) Sports Leisure and recreation Social security (complementary social security) Transport (except transport tickets) Subsidized loans Alcohol and chemical abuse treatment
1. Number of benefits not required by law or collective labor agreement granted to employees
QVT Programs
Small company: 8 or more benefits Mid-sized company: 11 or more benefits Large company: 14 benefits
Employment program for the disabled
Employment policy for people over 45
Learning program for underage apprentices
Employment policy for afro-descendants
Employment policy for the unemployed
Work opportunity for former prisoners
Retirement counseling
2. Number of differentiated employment and dismissal practices adopted
Support services for dismissed workers
Small company: 3 or more practices Mid-sized company: 5 or more practices Large company: 7 or more practices
Policies to prevent discrimination in the workplace Policies to prevent sexual harassment ISO 9000 certification Safety and occupational health specific standards certification Survey of organizational environment Programs of employees’ participation in the results Programs of recognition of suggestions made by employees for work processes improvement
3. Number of differentiated work management practices adopted
Participation of commissions formed by employees below managerial positions in internal decision-making processes
Small company: 4 or more practices Mid-sized company: 6 or more practices Large company: 8 practices
(*) Defined based on the average found in the survey for each company size.
Chart 26 allows an overview of the distribution of the whole of surveyed industrial companies, in each size segment, in the three CSR rate levels concerning “relationship with employees.” The presentation of this graph solely aims to allow the reader to view the proportion of industrial companies that, according to the criteria adopted in the construction of the rate, presented low, medium or high engagement level with CSR practices in the area of relationship with employees, in each size area. There is no attempt to establish comparisons among industrial companies of different sizes, for the criteria for building the rate are different for each size. It can be observed, in Chart 26, that in the three size areas the distribution of the companies presents a similar configuration. Approximately half of the mid-sized and large industrial companies stand at a low rate and the other half is split between the medium and high rate. As for the small companies, the low rate comprised a little more of them (60.4%) and about 40% of the companies were placed between the medium and high rate. This data only indicates that there are clear distinctions among the companies of same size concerning the extent of their engagement with the CSR practices in the “relationship with employees” area.

38
Chart 26 – Distribution of industrial companies according to
CSR rate concerning “relationship with employees”, by
headcount (%)
47.552.660.4
27.128.121.2 25.419.318.4
Up to 99 100 to 499 Over 500
Headcount
Low rate Average rate High rate
The following Charts allow an analysis of possible existing relationships between the level of engagement of the companies in CSR practices in the “relationship with employees” (measured by the CSR rate) and two critical variables: the degree of formalization of CSR policies within the industrial companies and the companies’ visions regarding the meaning of CSR. Chart 27 suggests the existence of the following correlation: the industrial companies that have explicit and documented CSR policies are also those who most develop actions in the relationship with employees. Whereas 48.7% of the industrial companies that have CSR explicit policies show high rates of practices in this area, only 11.1% of the ones that do not have such explicit policies present high rates. Inversely, whereas 29.5% of the companies that have explicit CSR policies present a low rate of CSR practices in the relationship with employees, of the ones that do not have these explicit policies the percentage climbs to 64.3%. This clear correlation is reinforced by two aspects previously mentioned that are not established by the CSR rate: industrial companies that have explicit and documented CSR policies are the ones that also present a proportionally more positive evaluation on their businesses profitability and a more intense relationship with the labor unions.
Chart 27 – Distribution of industrial companies according
to CSR rate concerning “relationship with employees”, by
existence of an explicit and documented CSR policy or
strategy (%)
64.3
43.029.5 24.525.321.8
11.1
31.6
48.7
Exists Planning stage Does not exist
Existence of documented CSR policy
Low rate Average rate High rate
The following testimonies offered by surveyed industrial companies exemplify a way of thinking that believes the performance of CSR actions regarding employees is a form of participation of the companies that transcend the strictly economic dimension and articulates the entrepreneurial action in broader results:

39
“The company generates 106 direct jobs, representing a group of approximately 500 people (employees and family). The decisions of the company also take into account the social commitment to this group. The maintenance of the employment agreements, in a moment of extreme difficulty which the telecommunications segment is going through, through negotiations with the union, has been an outstanding characteristic of our conduct.” (Mid-sized industrial company located in the Campinas area)
“The company that shows social responsibility, being careful in considering their employees, gives support to the society and creates a more united team.” (Small industrial company located in the Capital City of São Paulo)
Moving on to the analysis of the companies’ vision, Chart 28 suggests the existence of the following correlation: the industrial companies that give little value to the classical economic vision according to which, taken to its limit, CSR is not the company’s role, are also those that most develop CSR practices in the relationship with employees. Whereas 39.0% of the industrial companies that give little value to this vision present high rates of practice in the area, only 16.3% of the ones that highly value the classical vision present high rates of practices. On the other hand, whereas 35.6% of the companies that place the least value on the classical economic vision present a low rate of CSR practices in the relationship with employees, in the group of those who place the most value on this vision the percentage rises to 58.1%.
Chart 28 – Distribution of industrial companies according
to CSR rate concerning “relationship with employees”, by
degree of valorization of the classical economic vision –
“CSR is not a company’s role” (%)
58.158.2
35.625.624.625.4
16.317.2
39.0
Low value Average value High value
Degree of valorization of classical economic vision
Low value Average value High value
The following testimonies exemplify the understanding that CSR is not the role of the company:
Is social responsibility only meant for the companies? What do the state and federal government do? Until when will this fall solely on the companies? (Small industrial company, located in the Araçatuba area) “The company will have more social responsibility if the State fulfils its social responsibility.” (Small industrial company located in the São Paulo Metropolitan area)
Chart 29 shows that the CSR rate for relationship with employees does not seem to depend on higher or lower valorization of CSR as a business strengthening tool. Whatever the degree of valorization of this concept by the industrial companies may be, the engagement level with CSR practices in the relationship with employees remains the same.

40
Chart 29 – Distribution of industrial companies according
to CSR rate concerning “relationship with employees”, by
degree of valorization of CSR as a business strengthening
tool (%)
56.655.755.7
23.525.024.1 19.919.320.2
Low value Average value High value
Degree of valorization of CSR as a business strengthening tool
Low value Average value High value
The following testimonies exemplify the belief of some industrial companies that CSR actions regarding employees, focusing on the businesses strengthening, strongly depend on financial investment:
“I believe our social responsibility towards employees to be precarious. This practice is meant for large groups with financial resources, physical space and incentives.”
(Small industrial company located in the Capital City of São Paulo) “The economic crisis in the country is so severe that the only good thing I can do for my employees is to pay their wages on time.” (Large industrial company located in the Capital City of São Paulo)
“Unfortunately, considering the difficulties a company faces nowadays and the heavy taxation to which it is subjected, it is practically impossible to invest in social responsibility towards employees, although we are aware that such investment would bring benefits both to the employees and the business'.” (Small industrial company located in the Campinas area) “We are interested in motivating our employees and all social responsibility efforts are
motivation driven.” (Small industrial company located in the São Paulo Metropolitan area)
Finally, Chart 30 shows one more correlation between vision and practice, but now, contrary to what was recorded in Chart 28: the more the industrial companies value the CSR concept as a tool for promotion of social well-being, the higher their engagement level with actions in the “relationship with employees” area. Thus, 10.5% of the industrial companies that give little value to that concept, present high rates of practice addressed to the employees. On the other hand, among those presenting high valorization this number climbs to 21.7%.

41
Chart 30 – Distribution of industrial companies according
to CSR rate concerning “relationship with employees”, by
degree of valorization of CSR as a tool for the promotion of
social well-being (%)
54.961.457.8
23.422.931.6
21.715.710.5
Low value Average value High value
Degree of valorization of CSR as a tool for the promotion of social well-being (%)
Low value Average value High value
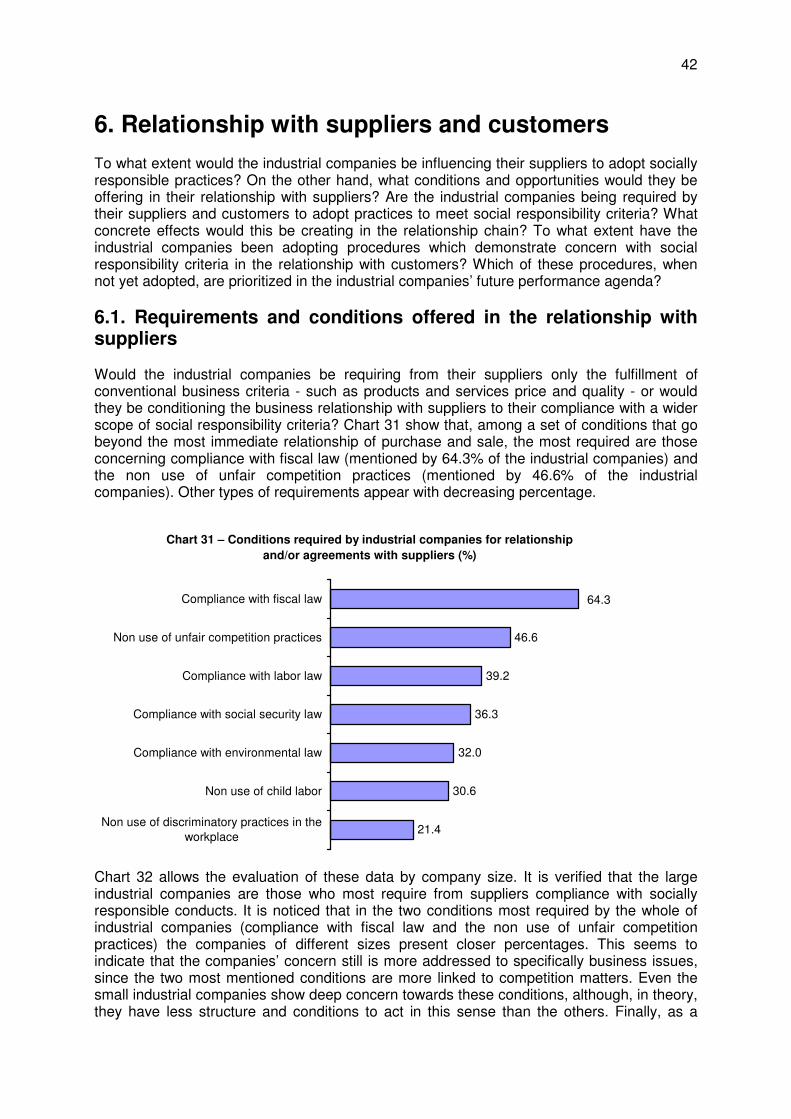
42
6. Relationship with suppliers and customers To what extent would the industrial companies be influencing their suppliers to adopt socially responsible practices? On the other hand, what conditions and opportunities would they be offering in their relationship with suppliers? Are the industrial companies being required by their suppliers and customers to adopt practices to meet social responsibility criteria? What concrete effects would this be creating in the relationship chain? To what extent have the industrial companies been adopting procedures which demonstrate concern with social responsibility criteria in the relationship with customers? Which of these procedures, when not yet adopted, are prioritized in the industrial companies’ future performance agenda? 6.1. Requirements and conditions offered in the relationship with suppliers Would the industrial companies be requiring from their suppliers only the fulfillment of conventional business criteria - such as products and services price and quality - or would they be conditioning the business relationship with suppliers to their compliance with a wider scope of social responsibility criteria? Chart 31 show that, among a set of conditions that go beyond the most immediate relationship of purchase and sale, the most required are those concerning compliance with fiscal law (mentioned by 64.3% of the industrial companies) and the non use of unfair competition practices (mentioned by 46.6% of the industrial companies). Other types of requirements appear with decreasing percentage.
Chart 31 – Conditions required by industrial companies for relationship
and/or agreements with suppliers (%)
46.6
39.2
36.3
32.0
30.6
21.4
64.3Compliance with fiscal law
Non use of unfair competition practices
Compliance with labor law
Compliance with social security law
Compliance with environmental law
Non use of child labor
Non use of discriminatory practices in theworkplace
Chart 32 allows the evaluation of these data by company size. It is verified that the large industrial companies are those who most require from suppliers compliance with socially responsible conducts. It is noticed that in the two conditions most required by the whole of industrial companies (compliance with fiscal law and the non use of unfair competition practices) the companies of different sizes present closer percentages. This seems to indicate that the companies’ concern still is more addressed to specifically business issues, since the two most mentioned conditions are more linked to competition matters. Even the small industrial companies show deep concern towards these conditions, although, in theory, they have less structure and conditions to act in this sense than the others. Finally, as a

43
general trend, the requirements become less frequent as they focus on more general issues
of social nature: environment, child labor and discrimination in the workplace.
Chart 32 – Conditions required by industrial companies for relationship
and/or agreements with suppliers, by headcount (%)
45.8
28.4
24.6
24.6
24.9
16.9
70.4
44.4
50.4
48.1
36.3
33.3
25.2
83.1
55.9
78.0
78.0
66.1
57.6
39.0
58.7Compliance with fiscal law
Non use of unfair competition practices
Compliance with labor law
Compliance with social security law
Compliance with environmental law
Non use of child labor
Non use of discriminatory practices in theworkplace
Up to 99 100 to 499 Over 500
What conditions are offered by the industrial companies in the relationship with suppliers? Chart 33 shows that the most frequent one is suppliers training (30.5%). The offering to the outsourced of benefits not required by law granted to employees and the possibility of the suppliers taking part in social actions of the company are shown next, mentioned by 18.9% and 16.1% of the industrial companies, respectively. Few industrial companies (6.1%) have been including local community groups (cooperatives and social entities) among their suppliers, which represents the initial grounds, although incipient, for strengthening the bonds between the industrial activity and the so-called solidary economy.

44
Chart 33 – Conditions offered by industrial companies for relationship
and/or agreements with suppliers (%)
30.5
18.9
16.1
10.4
6.1
2.2
Suppliers training
Offer to outsourced of benefits not required bylaw granted to employees
Possibility of suppliers taking part in socialactions of the company
Support for suppliers to carry out their own socialactions
Inclusion of local community groups amongsuppliers (cooperatives and social entities)
Others
Chart 34 allows this data evaluation by company size. Again, higher percentages are found among large industrial companies. It is observed that the offering to the outsourced of benefits not required by law granted to employees presents close percentage both in large and mid-sized companies, being a little higher for the latter - which may be explained by the adoption of more strict outsourcing strategies in large companies. The conditions offered to suppliers seem to follow a logic similar to the one recorded in the case of required conditions: those concerned with more general issues of social nature (possibility of the suppliers taking part in social actions of the company, support to suppliers so they can perform their own social actions, inclusion of local community groups among the suppliers) are less frequently offered, whereas a condition apparently more related to economic interest to the business (training) is more widely offered by companies.

45
Chart 34 – Conditions offered by industrial companies for relationship
and/or agreements with suppliers, by headcount (%)
21.9
13.0
9.8
7.5
4.9
1.4
40.7
30.4
19.3
11.1
5.9
1.5
57.6
27.1
45.8
25.4
13.6
8.5
Suppliers training
Offer to outsourced of benefits not required by lawgranted to employees
Possibility of suppliers taking part in social actionsof the company
Support for suppliers to carry out their own socialactions
Inclusion of local community groups amongsuppliers (cooperatives and social entities)
Others
Up to 99 100 to 499 Over 500
6.2. Requirements of suppliers and customers Who requires more of industrial companies in the social responsibility area: suppliers or customers? According to the statements made by the surveyed companies (Chart 35), customers present more requests than suppliers in the three size segments. The area most subject to customer requirements is the one of large industrial companies (34.5%), followed by the mid-sized (29.8%) and small (17.5%). The supplier requires equally of large (17.2%) and mid-sized industrial companies (17.4%) and a little less of small ones (10.2%). The data confirms the prevalence of requirements and requests on the part of buyers, revealing a more timid behavior on the part of suppliers. There is a clear growing trend of consumers' pressure on the companies for the adoption of socially responsible conducts.

46
Chart 35 – Industrial companies who claim they have been required by
suppliers and customers to make social responsible commitments, by
headcount (%)
29.8
34.5
17.4 17.2
10.2
17.5
Up to 99 100 to 499 Over 500
Headcount
Required by suppliers Required by customers
However, what requests are made to the companies by the suppliers? By the industrial companies’ answers for requirements already made by their suppliers, almost all of the surveyed conditions (shown in Chart 36) present a similar degree of requirement (slightly over 10.0% for the large industrial companies only). The less frequent requests are the non use of discrimination practices in the workplace and the non use of unfair competition practices.
Chart 36 – Requirements made by suppliers to industrial companies in the
area of social responsibility, by headcount (%)
5.5
4.4
5.0
4.4
2.3
2.0
0.3
9.1
9.1
10.6
7.6
7.6
6.1
4.5
0.8
12.1
10.3
12.1
10.3
10.3
6.9
5.2
1.7
5.3Compliance with labor law
Non use of child labor
Compliance with fiscal law
Compliance with social security law
Compliance with environmental law
Non use of discriminatory practices in theworkplace
Non use of unfair competition practices
Others
Up to 99 100 to 499 Over 500

47
What requests are made to the industrial companies by the customers? In this case, the percentages are a little higher, reflecting the situation (already mentioned) of higher demand from customers than from suppliers. By the industrial companies’ answers for requirements already made by their clients, almost all of the surveyed conditions (shown in Chart 37) present a similar degree of requirement (near 20% for the mid-sized and large industrial companies). Similarly to the suppliers, the less frequent requests are the non use of discrimination practices in the workplace and the non use of unfair competition practices (although, in this last case, the large companies are under considerable demands, for many customers are other companies).
Chart 37 – Requirements made by customers to industrial companies in
the area of social responsibility, by headcount (%)
10,4
9,8
9,8
9,8
5,3
4,4
1,5
22,1
22,1
22,1
19,1
19,8
12,2
9,9
2,3
20,7
24,1
20,7
20,7
17,2
6,9
17,2
12,1
11,0Compliance with fiscal law
Compliance with environmental law
Compliance with fiscal law
Non use of child labor
Compliance with social security law
Non use of discriminatory practices in theworkplace
Non use of unfair competition practices
Others
Up to 99 100 to 499 Over 500
6.3. Repercussions in the relationship chain As seen before, the industrial companies stated that, as customers, they establish several demands for the relationship with their suppliers. The most frequent demands are those more closely linked to business matters. The large companies are the most demanding. The industrial companies have also been under considerable demand from suppliers and customers, mainly the latter – who have increasingly used their weight as buyers. In this relationships network, in which the surveyed industrial companies are also, in many cases, customers or suppliers of other industrial companies, what significant impacts and repercussions from the social responsibility standpoint can be noticed? According to Chart 38, 14.0% of the large industrial companies state having already made investments in the social responsibility area as a result of customers’ pressure and 8.8% of customers’ and suppliers’ pressure. As for the mid-sized industrial companies, these percentages reach 13.6% and 12.1%, respectively, and in the small ones they reach 7.4% and 5.7%, respectively. Investments driven by demand from suppliers only are almost
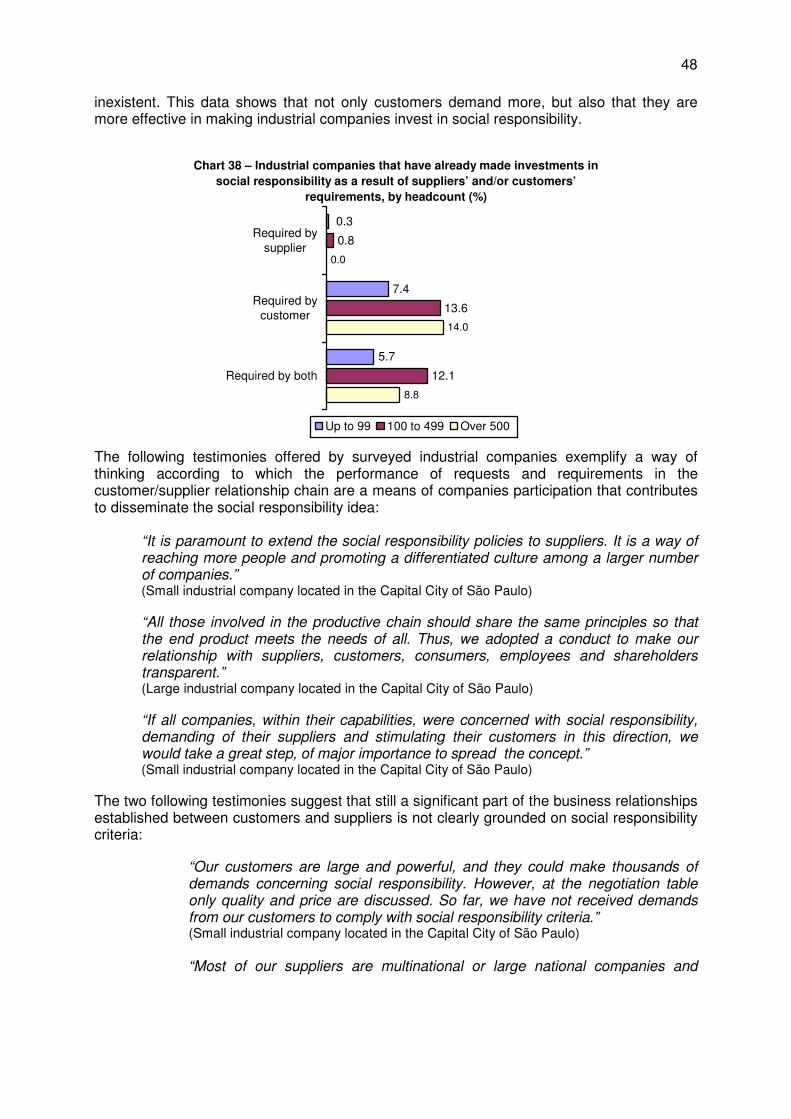
48
inexistent. This data shows that not only customers demand more, but also that they are more effective in making industrial companies invest in social responsibility.
Chart 38 – Industrial companies that have already made investments in
social responsibility as a result of suppliers’ and/or customers’
requirements, by headcount (%)
7.4
5.7
0.8
13.6
12.1
0.0
14.0
8.8
0.3Required by
supplier
Required bycustomer
Required by both
Up to 99 100 to 499 Over 500
The following testimonies offered by surveyed industrial companies exemplify a way of thinking according to which the performance of requests and requirements in the customer/supplier relationship chain are a means of companies participation that contributes to disseminate the social responsibility idea:
“It is paramount to extend the social responsibility policies to suppliers. It is a way of reaching more people and promoting a differentiated culture among a larger number of companies.” (Small industrial company located in the Capital City of São Paulo)
“All those involved in the productive chain should share the same principles so that the end product meets the needs of all. Thus, we adopted a conduct to make our relationship with suppliers, customers, consumers, employees and shareholders transparent.” (Large industrial company located in the Capital City of São Paulo)
“If all companies, within their capabilities, were concerned with social responsibility, demanding of their suppliers and stimulating their customers in this direction, we would take a great step, of major importance to spread the concept.” (Small industrial company located in the Capital City of São Paulo)
The two following testimonies suggest that still a significant part of the business relationships established between customers and suppliers is not clearly grounded on social responsibility criteria:
“Our customers are large and powerful, and they could make thousands of demands concerning social responsibility. However, at the negotiation table only quality and price are discussed. So far, we have not received demands from our customers to comply with social responsibility criteria.” (Small industrial company located in the Capital City of São Paulo)
“Most of our suppliers are multinational or large national companies and

ERROR: syntaxerrorOFFENDING COMMAND: %ztokenexec_continue
STACK:
-filestream-