CORPORATE RELOCATION SURVEY - crgglobal.com Annual Corporate... · 07 CORPORATE RELOCATION SURVEY....
56
ATLAS WORLD GROUP CORPORATE RELOCATION SURVEY Survey Highlights 2 Survey Responses 30 The Industry's Longest Running Survey
Transcript of CORPORATE RELOCATION SURVEY - crgglobal.com Annual Corporate... · 07 CORPORATE RELOCATION SURVEY....
ATLAS WORLD GROUP
CORPORATE RELOCATION SURVEY
Survey Highlights 2
Survey Responses 30
The Industry's Longest Running
Survey
HighlightsSURVEY
Atlas ® is pleased to bring you this special 50th edition of our annual
survey, the industry's first and longest-running investigation into
corporate relocation policies and practices.
ATLAS IS IN IT FOR THE LONG HAUL
As we have done every year since 1968, we consider the demographic,
geopolitical, and economic shifts affecting our industry. We analyze
the findings and uncover the trends to more clearly understand the
evolving challenges—and learn how we as relocation professionals
can answer them.
For complete results, interactive graphs and historical insights,
see atlasvanlines.com/relocation-surveys/corporate-relocation.
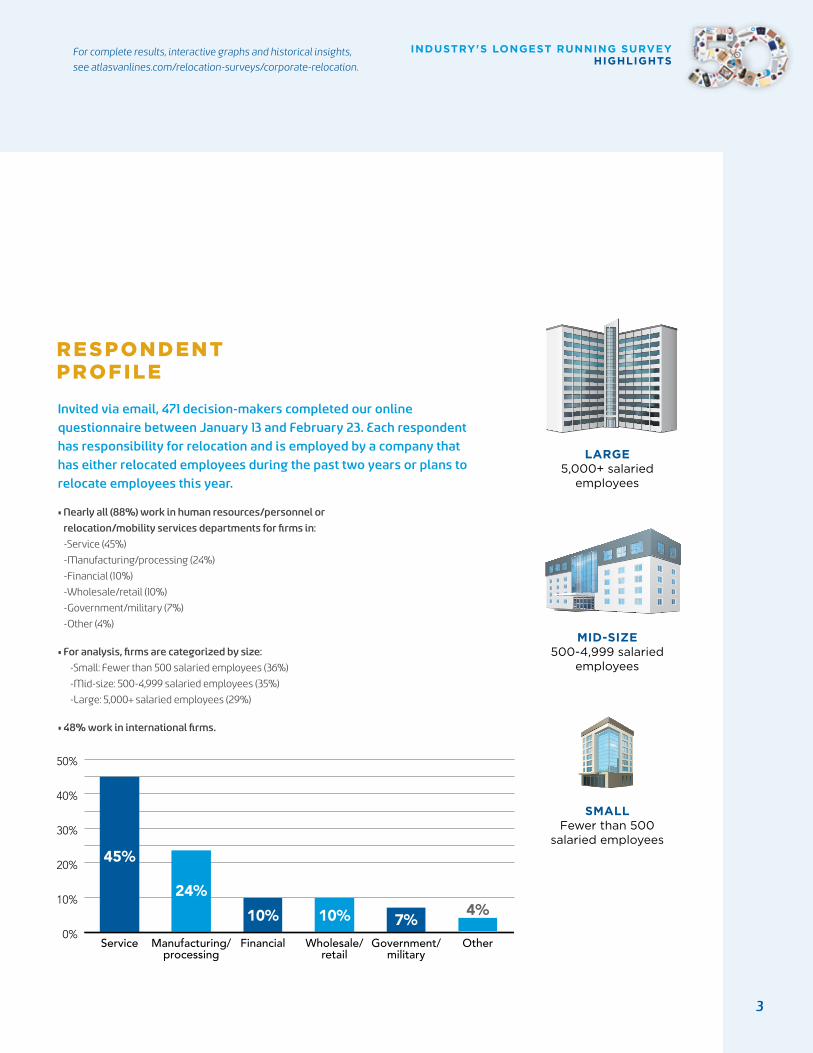
RESPONDENT PROFILE
Invited via email, 471 decision-makers completed our online
questionnaire between January 13 and February 23. Each respondent
has responsibility for relocation and is employed by a company that
has either relocated employees during the past two years or plans to
relocate employees this year.
• Nearly all (88%) work in human resources/personnel or
relocation/mobility services departments for firms in:
-Service (45%)
-Manufacturing/processing (24%)
-Financial (10%)
-Wholesale/retail (10%)
-Government/military (7%)
-Other (4%)
• For analysis, firms are categorized by size:
- Small: Fewer than 500 salaried employees (36%)
- Mid-size: 500-4,999 salaried employees (35%)
- Large: 5,000+ salaried employees (29%)
• 48% work in international firms.
0%
10%
20%
30%
40%
50%
25%
Financial
10%
Manufacturing/processing
24%
Service
45%
Wholesale/retail
10%
Government/military
7%Other
4%
SMALLFewer than 500
salaried employees
MID-SIZE500-4,999 salaried
employees
LARGE5,000+ salaried
employees
3
INDUSTRY'S LONGEST RUNNING SURVEY HIGHLIGHTS
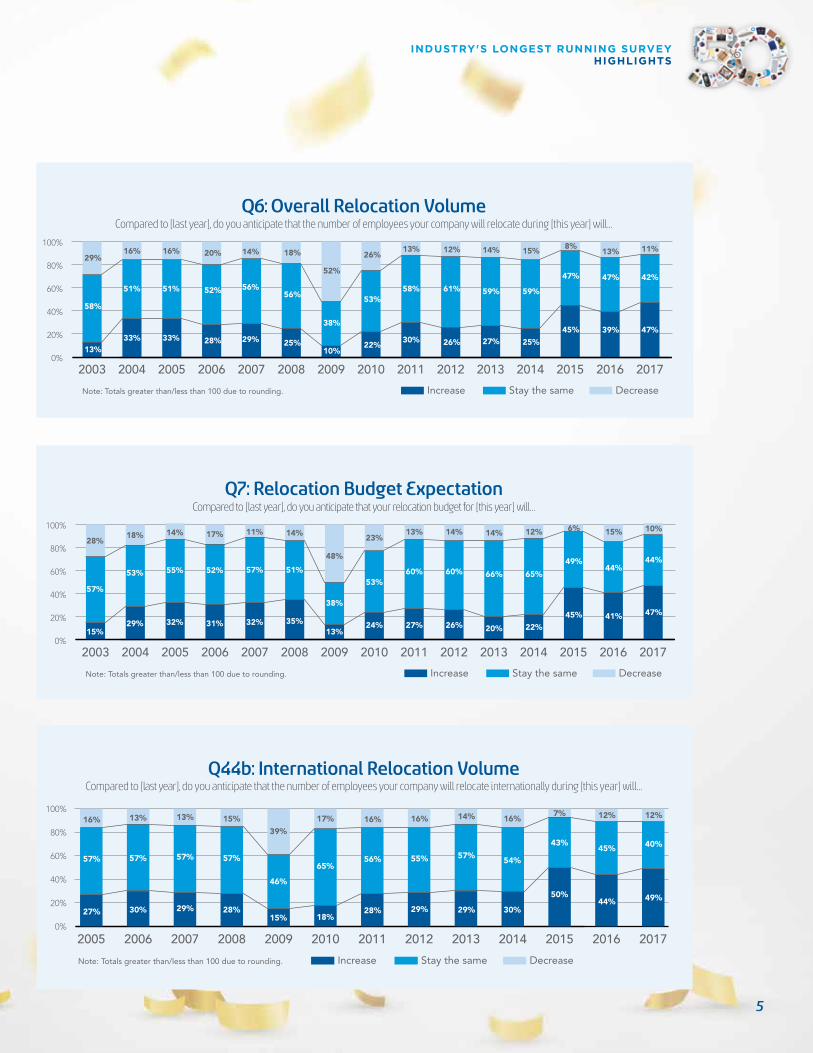
SUMMARYRelocation Volumes & Budgets — Overall & International More Relocations Last Year, More Expected in 2017, Budgets Continue Rebounding
In 2016, essentially half of companies across company size saw
increases in volume, mid-size firms (51%) more so than others.
Roughly half of firms relocating people internationally, regardless of
size, saw volumes increase as well. Few firms saw volume decreases
overall; however, 18% of large firms noted a decline. Mid-size and
large firms were more likely than small firms (16% & 14% vs. 6%)
to see a decline in international volume. Expectations for 2017 are
positive: around half of firms expect volumes to increase overall and
internationally, and roughly four out of ten expect stability compared
to 2016. There is a continued elevation in small percentages of firms
expecting decreases, but the values are well within historical, non-
recessionary ranges and not unexpected after a few years of growth.
As volumes increased in the years after the Great Recession, budgets
did not initially keep pace. However, for each of the past three years,
nearly half of companies report their relocation budgets increased
from the previous year, and 47% believe their budgets will again
increase in 2017. Last year, while half or more of small and mid-size
firms saw budget increases, slightly fewer (41%) large firms did.
Projections for 2017 are essentially in line with last year’s experiences
across company size. In general, firms of all sizes expect growth or
stability for budgets in 2017, and very few expect decreases.
• For the sixth straight year, the median numbers for relocations at large firms
(200-399) remained at historical, non-recessionary norms after dipping lower in
2010 (100-199). The median remained at normative levels for small firms (1-9) for
a second year after trending higher (10-19) in 2014. The median for mid-size firms
returned to its normative, non-recessionary range (20-49) after being higher
(50-99) the previous two years.
• While roughly half or more of firms across industries saw overall relocation
volumes increase, the biggest increases occurred with government/military/
public administration (56%) and for-profit service firms (50%). As well, 56%
and 53% of these firms saw budgets increase. Generally, expectations across
industries are similar for volumes and budgets.
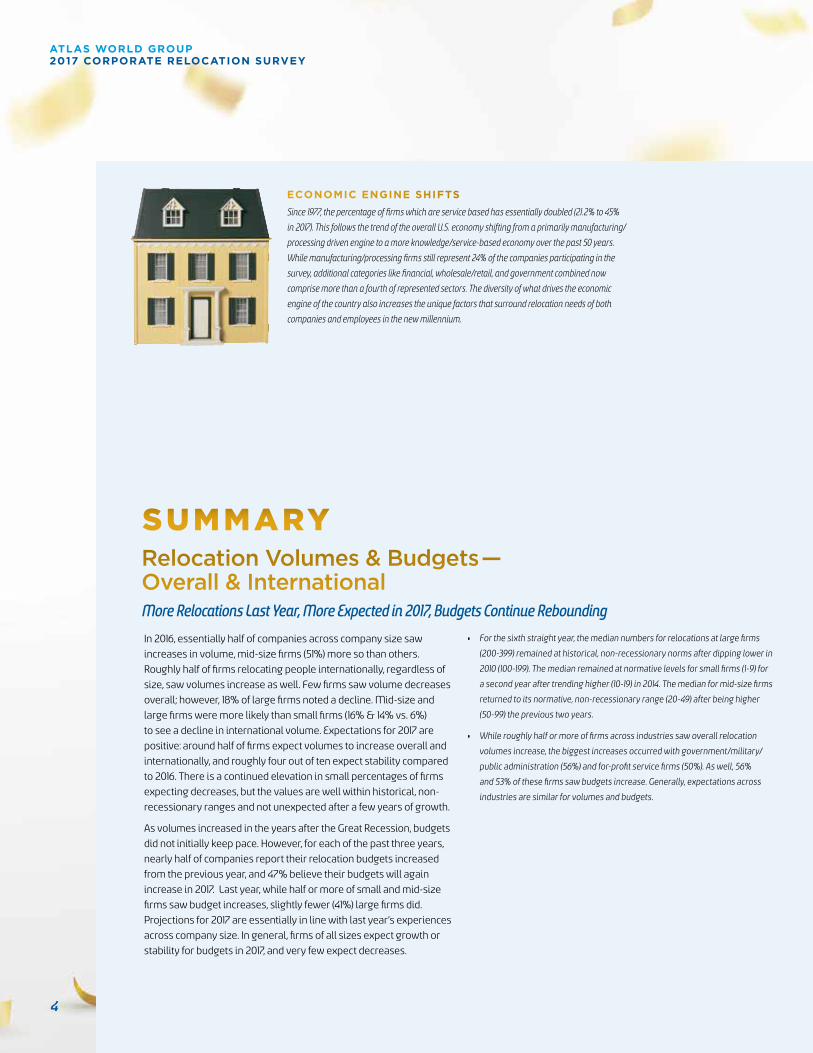
Since 1977, the percentage of firms which are service based has essentially doubled (21.2% to 45%
in 2017). This follows the trend of the overall U.S. economy shifting from a primarily manufacturing/
processing driven engine to a more knowledge/service-based economy over the past 50 years.
While manufacturing/processing firms still represent 24% of the companies participating in the
survey, additional categories like financial, wholesale/retail, and government combined now
comprise more than a fourth of represented sectors. The diversity of what drives the economic
engine of the country also increases the unique factors that surround relocation needs of both
companies and employees in the new millennium.
ECONOMIC ENGINE SHIFTS
4
ATLAS WORLD GROUP 2017 CORPORATE RELOCATION SURVEY
Compared to [last year], do you anticipate that your relocation budget for [this year] will…Q7: Relocation Budget Expectation
0%
20%
40%
60%
80%
100%
201720162015201420132012201120102009200820072006200520042003
Note: Totals greater than/less than 100 due to rounding. DecreaseStay the sameIncrease
28%
57%
15%
18%
53%
29%
14%
55%
32%
17%
52%
31%
11%
57%
32%
14%
51%
35%
48%
38%
13%
23%
53%
24%
13%
60%
27%
14%
60%
26%
14%
66%
20%
12%
65%
22%
6%
49%
45%
15%
44%
41%
10%
44%
47%
Q6: Overall Relocation VolumeCompared to [last year], do you anticipate that the number of employees your company will relocate during [this year] will…
0%
20%
40%
60%
80%
100%
201720162015201420132012201120102009200820072006200520042003
Note: Totals greater than/less than 100 due to rounding. DecreaseStay the sameIncrease
29%
58%
13%
16%
51%
33%
16%
51%
33%
20%
52%
28%
14%
56%
29%
18%
56%
25%
52%
38%
10%
26%
53%
22%
13%
58%
30%
12%
61%
26%
14%
59%
27%
15%
59%
25%
8%
47%
45%
13%
47%
39%
11%
42%
47%
Compared to [last year], do you anticipate that the number of employees your company will relocate internationally during [this year] will…Q44b: International Relocation Volume
0%
20%
40%
60%
80%
100%
2017201620152014201320122011201020092008200720062005
Note: Totals greater than/less than 100 due to rounding. DecreaseStay the sameIncrease
16%
57%
27%
13%
57%
30%
13%
57%
29%
15%
57%
28%
39%
46%
15%
17%
65%
18%
16%
56%
28%
16%
55%
29%
14%
57%
29%
16%
54%
30%
7%
43%
50%
12%
45%
44%
12%
40%
49%
5
INDUSTRY'S LONGEST RUNNING SURVEY HIGHLIGHTS
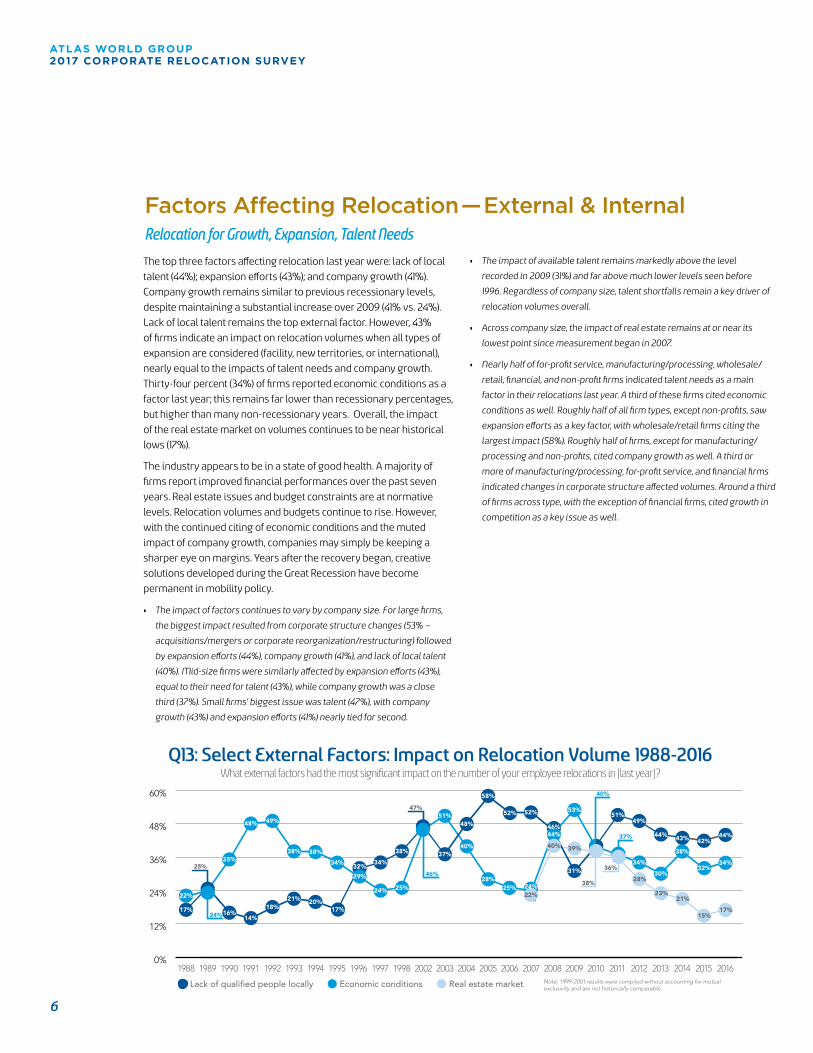
Factors Affecting Relocation — External & InternalRelocation for Growth, Expansion, Talent Needs
What external factors had the most significant impact on the number of your employee relocations in [last year]?Q13: Select External Factors: Impact on Relocation Volume 1988-2016
Lack of qualified people locally Economic conditions Real estate market Note: 1999-2001 results were compiled without accounting for mutual exclusivity and are not historically comparable.
0%
12%
24%
36%
48%
60%
20162015201420132012201120102009200820072006200520042003200219981997199619951994199319921991199019891988
22%
17%
25%
24%16%
35%
14%
48%
18%
49%
21%
38%
20%
38%
32%
29%
17%
34% 34%
24%
38%
25%
37%
51%48%
40%
58%
28%
52%
25%
52%
24%22%
46%
47%
44%
40%
46%
31%
39%
53%
49%
28%
34%
44%
23%
30%
43%
21%
38%
38%
40%
36%
37%
51%
42%
32%
15%
44%
34%
17%
The top three factors affecting relocation last year were: lack of local
talent (44%); expansion efforts (43%); and company growth (41%).
Company growth remains similar to previous recessionary levels,
despite maintaining a substantial increase over 2009 (41% vs. 24%).
Lack of local talent remains the top external factor. However, 43%
of firms indicate an impact on relocation volumes when all types of
expansion are considered (facility, new territories, or international),
nearly equal to the impacts of talent needs and company growth.
Thirty-four percent (34%) of firms reported economic conditions as a
factor last year; this remains far lower than recessionary percentages,
but higher than many non-recessionary years. Overall, the impact
of the real estate market on volumes continues to be near historical
lows (17%).
The industry appears to be in a state of good health. A majority of
firms report improved financial performances over the past seven
years. Real estate issues and budget constraints are at normative
levels. Relocation volumes and budgets continue to rise. However,
with the continued citing of economic conditions and the muted
impact of company growth, companies may simply be keeping a
sharper eye on margins. Years after the recovery began, creative
solutions developed during the Great Recession have become
permanent in mobility policy.
• The impact of factors continues to vary by company size. For large firms,
the biggest impact resulted from corporate structure changes (53% –
acquisitions/mergers or corporate reorganization/restructuring) followed
by expansion efforts (44%), company growth (41%), and lack of local talent
(40%). Mid-size firms were similarly affected by expansion efforts (43%),
equal to their need for talent (43%), while company growth was a close
third (37%). Small firms’ biggest issue was talent (47%), with company
growth (43%) and expansion efforts (41%) nearly tied for second.
• The impact of available talent remains markedly above the level
recorded in 2009 (31%) and far above much lower levels seen before
1996. Regardless of company size, talent shortfalls remain a key driver of
relocation volumes overall.
• Across company size, the impact of real estate remains at or near its
lowest point since measurement began in 2007.
• Nearly half of for-profit service, manufacturing/processing, wholesale/
retail, financial, and non-profit firms indicated talent needs as a main
factor in their relocations last year. A third of these firms cited economic
conditions as well. Roughly half of all firm types, except non-profits, saw
expansion efforts as a key factor, with wholesale/retail firms citing the
largest impact (58%). Roughly half of firms, except for manufacturing/
processing and non-profits, cited company growth as well. A third or
more of manufacturing/processing, for-profit service, and financial firms
indicated changes in corporate structure affected volumes. Around a third
of firms across type, with the exception of financial firms, cited growth in
competition as a key issue as well.
6
ATLAS WORLD GROUP 2017 CORPORATE RELOCATION SURVEY
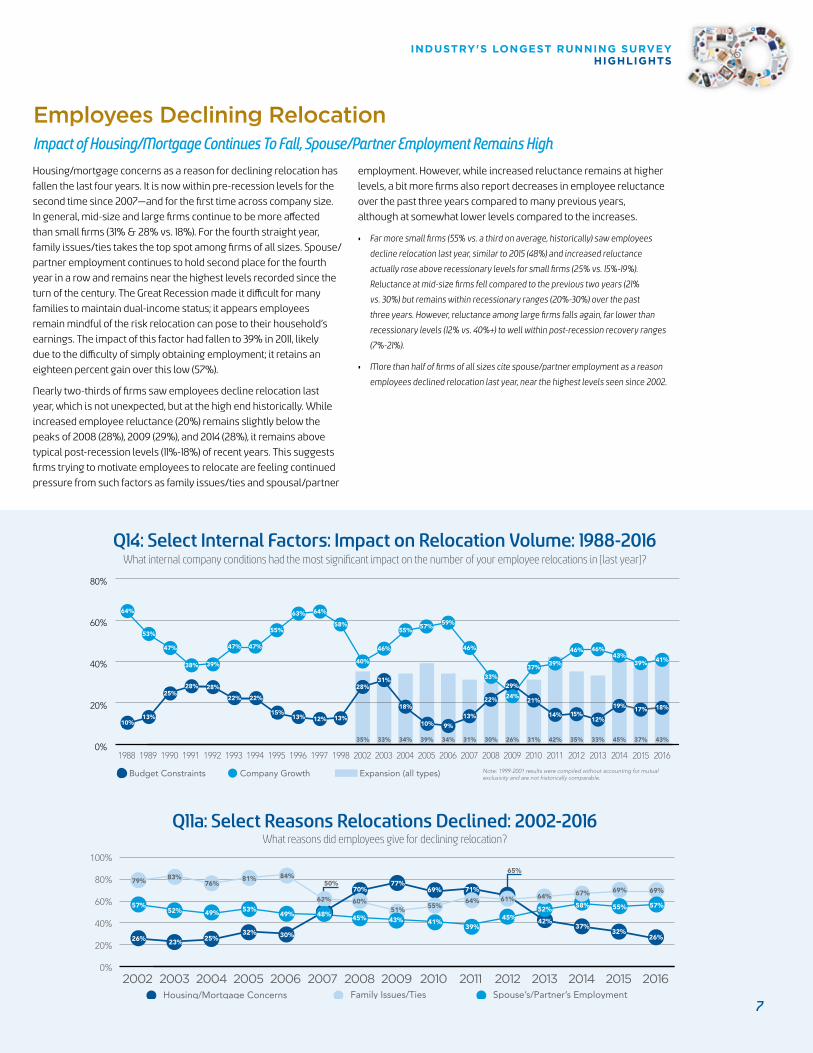
Employees Declining RelocationImpact of Housing/Mortgage Continues To Fall, Spouse/Partner Employment Remains High
Q14: Select Internal Factors: Impact on Relocation Volume: 1988-2016What internal company conditions had the most significant impact on the number of your employee relocations in [last year]?
0%
20%
40%
60%
80%
20162015201420132012201120102009200820072006200520042003200219981997199619951994199319921991199019891988
64%
10%13%
53%
25%
47%
28%
38%
28%
39%
22%
47%
22%
47%
13%
63%
15%
55%
12%
64%
13%
58%
31%
46%
13%
46%
18%
55%
10%
57%
9%
59%
28%
40%
22%
33%29%
24%21%
37%
14%
39%
15%
46%
12%
46%
19%
43%
17%
39%
18%
41%
35% 33% 34% 39% 34% 31% 30% 26% 31% 42% 35% 33% 45% 37% 43%
Budget Constraints Company Growth Note: 1999-2001 results were compiled without accounting for mutual exclusivity and are not historically comparable.
Expansion (all types)
Q11a: Select Reasons Relocations Declined: 2002-2016What reasons did employees give for declining relocation?
Family Issues/TiesHousing/Mortgage Concerns Spouse’s/Partner’s Employment
0%
20%
40%
60%
80%
100%
201620152014201320122011201020092008200720062005200420032002
70%
60%
45%
69%
55%
41%
64%
52%
42%
67%
58%
37%
71%
64%
39%
77%
51%43%
84%
49%
30%
81%
53%
32%
65%
45%
61%
49%
76%
25%
83%
52%
23%
79%
57%
26%
69%
55%
32%
69%
57%
26%
62%
48%
50%
Housing/mortgage concerns as a reason for declining relocation has
fallen the last four years. It is now within pre-recession levels for the
second time since 2007—and for the first time across company size.
In general, mid-size and large firms continue to be more affected
than small firms (31% & 28% vs. 18%). For the fourth straight year,
family issues/ties takes the top spot among firms of all sizes. Spouse/
partner employment continues to hold second place for the fourth
year in a row and remains near the highest levels recorded since the
turn of the century. The Great Recession made it difficult for many
families to maintain dual-income status; it appears employees
remain mindful of the risk relocation can pose to their household’s
earnings. The impact of this factor had fallen to 39% in 2011, likely
due to the difficulty of simply obtaining employment; it retains an
eighteen percent gain over this low (57%).
Nearly two-thirds of firms saw employees decline relocation last
year, which is not unexpected, but at the high end historically. While
increased employee reluctance (20%) remains slightly below the
peaks of 2008 (28%), 2009 (29%), and 2014 (28%), it remains above
typical post-recession levels (11%-18%) of recent years. This suggests
firms trying to motivate employees to relocate are feeling continued
pressure from such factors as family issues/ties and spousal/partner
employment. However, while increased reluctance remains at higher
levels, a bit more firms also report decreases in employee reluctance
over the past three years compared to many previous years,
although at somewhat lower levels compared to the increases.
• Far more small firms (55% vs. a third on average, historically) saw employees
decline relocation last year, similar to 2015 (48%) and increased reluctance
actually rose above recessionary levels for small firms (25% vs. 15%-19%).
Reluctance at mid-size firms fell compared to the previous two years (21%
vs. 30%) but remains within recessionary ranges (20%-30%) over the past
three years. However, reluctance among large firms falls again, far lower than
recessionary levels (12% vs. 40%+) to well within post-recession recovery ranges
(7%-21%).
• More than half of firms of all sizes cite spouse/partner employment as a reason
employees declined relocation last year, near the highest levels seen since 2002.
7
INDUSTRY'S LONGEST RUNNING SURVEY HIGHLIGHTS
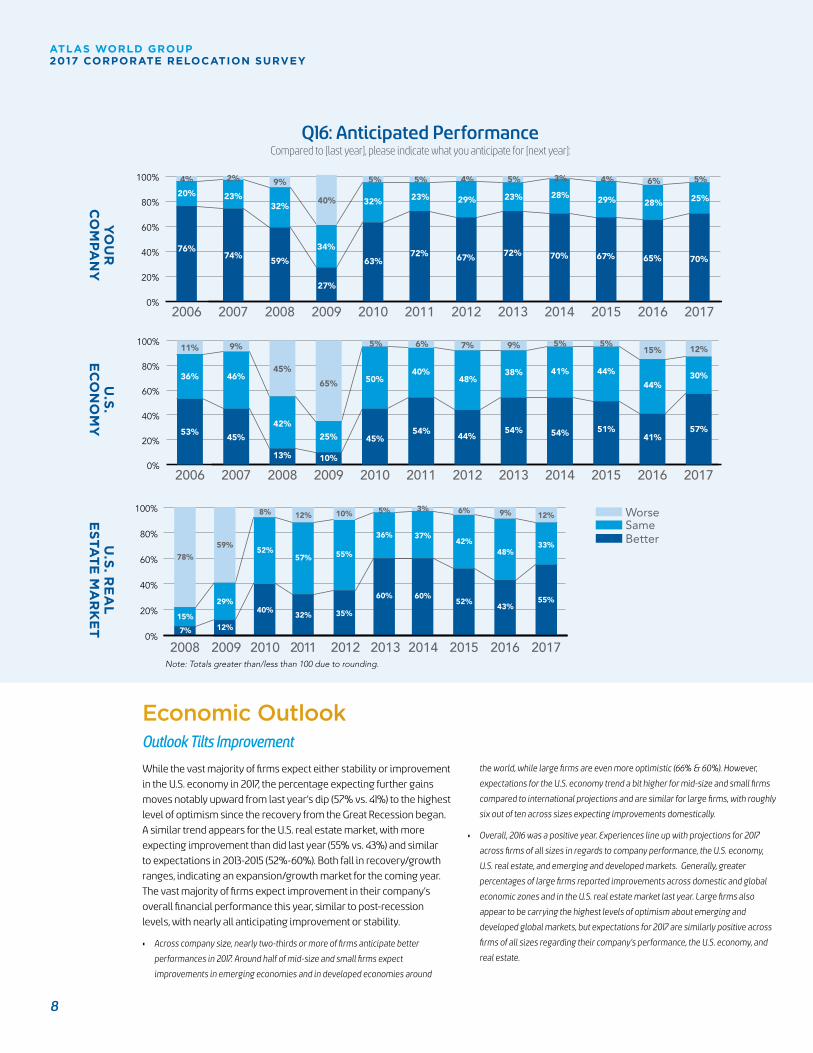
While the vast majority of firms expect either stability or improvement
in the U.S. economy in 2017, the percentage expecting further gains
moves notably upward from last year’s dip (57% vs. 41%) to the highest
level of optimism since the recovery from the Great Recession began.
A similar trend appears for the U.S. real estate market, with more
expecting improvement than did last year (55% vs. 43%) and similar
to expectations in 2013-2015 (52%-60%). Both fall in recovery/growth
ranges, indicating an expansion/growth market for the coming year.
The vast majority of firms expect improvement in their company’s
overall financial performance this year, similar to post-recession
levels, with nearly all anticipating improvement or stability.
• Across company size, nearly two-thirds or more of firms anticipate better
performances in 2017. Around half of mid-size and small firms expect
improvements in emerging economies and in developed economies around
the world, while large firms are even more optimistic (66% & 60%). However,
expectations for the U.S. economy trend a bit higher for mid-size and small firms
compared to international projections and are similar for large firms, with roughly
six out of ten across sizes expecting improvements domestically.
• Overall, 2016 was a positive year. Experiences line up with projections for 2017
across firms of all sizes in regards to company performance, the U.S. economy,
U.S. real estate, and emerging and developed markets. Generally, greater
percentages of large firms reported improvements across domestic and global
economic zones and in the U.S. real estate market last year. Large firms also
appear to be carrying the highest levels of optimism about emerging and
developed global markets, but expectations for 2017 are similarly positive across
firms of all sizes regarding their company’s performance, the U.S. economy, and
real estate.
Economic OutlookOutlook Tilts Improvement
Compared to [last year], please indicate what you anticipate for [next year]:Q16: Anticipated Performance
YO
UR
C
OM
PAN
Y
0%
20%
40%
60%
80%
100%
201720162015201420132012201120102009200820072006
4%
20%
76%
5%
32%
63%
5%
23%
72%
3%
28%
70%
4%
29%
67%
6%
28%
65%
5%
25%
70%
4%
29%
67%
5%
23%
72%
2%
23%
74%
9%
32%
59%
40%
34%
27%
U.S
. RE
AL
ESTA
TE M
AR
KE
T
BetterSameWorse
0%
20%
40%
60%
80%
100%
2017201620152014201320122011201020092008Note: Totals greater than/less than 100 due to rounding.
12%
57%
32%
10%
55%
35%
5%
36%
60%
3%
37%
60%
6%
52%
42%
8%
52%
40%
59%
29%
12%
78%
15%
7%
9%
43%
48%
12%
55%
33%
U.S
. E
CO
NO
MY
0%
20%
40%
60%
80%
100%
201720162015201420132012201120102009200820072006
11%
53%
36%
9%
45%
46%
42%
13%
45%
10%
25%
65%
45%
50%
5%
54%
40%
6%
54%
41%
5%
51%
44%
5%
41%
44%
15%
57%
30%
12%
54%
38%
9%
44%
48%
7%
8
ATLAS WORLD GROUP 2017 CORPORATE RELOCATION SURVEY
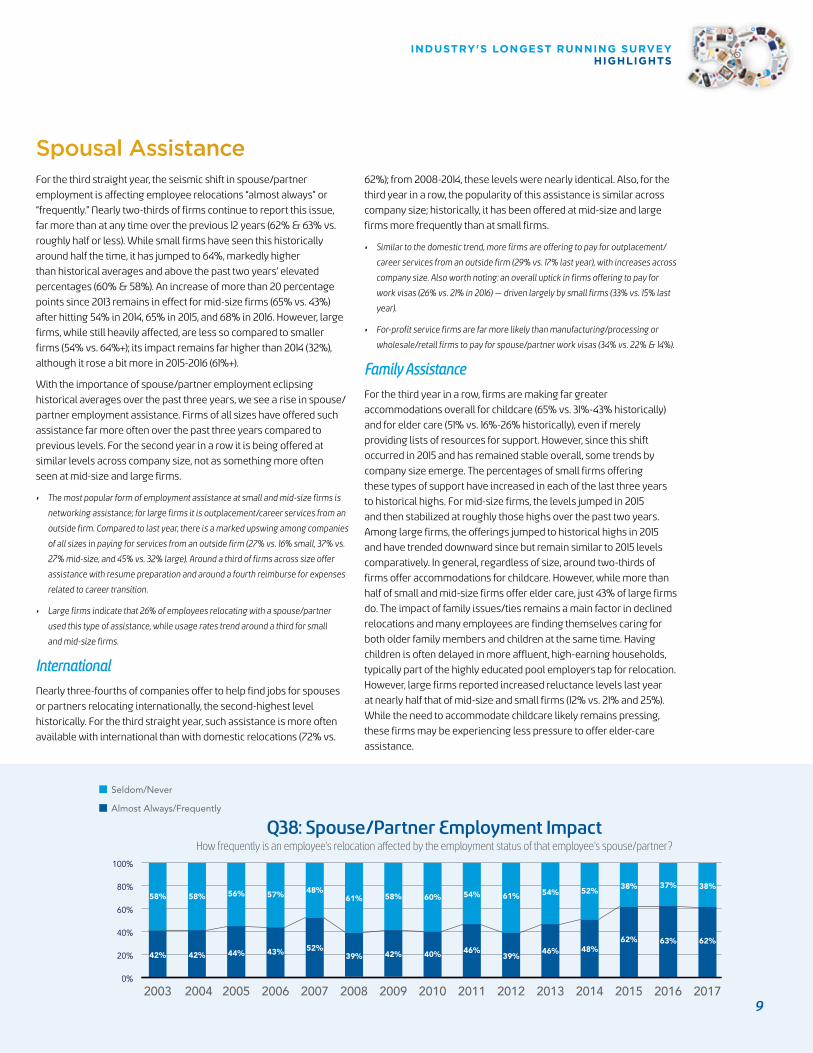
Spousal Assistance For the third straight year, the seismic shift in spouse/partner
employment is affecting employee relocations “almost always” or
“frequently.” Nearly two-thirds of firms continue to report this issue,
far more than at any time over the previous 12 years (62% & 63% vs.
roughly half or less). While small firms have seen this historically
around half the time, it has jumped to 64%, markedly higher
than historical averages and above the past two years’ elevated
percentages (60% & 58%). An increase of more than 20 percentage
points since 2013 remains in effect for mid-size firms (65% vs. 43%)
after hitting 54% in 2014, 65% in 2015, and 68% in 2016. However, large
firms, while still heavily affected, are less so compared to smaller
firms (54% vs. 64%+); its impact remains far higher than 2014 (32%),
although it rose a bit more in 2015-2016 (61%+).
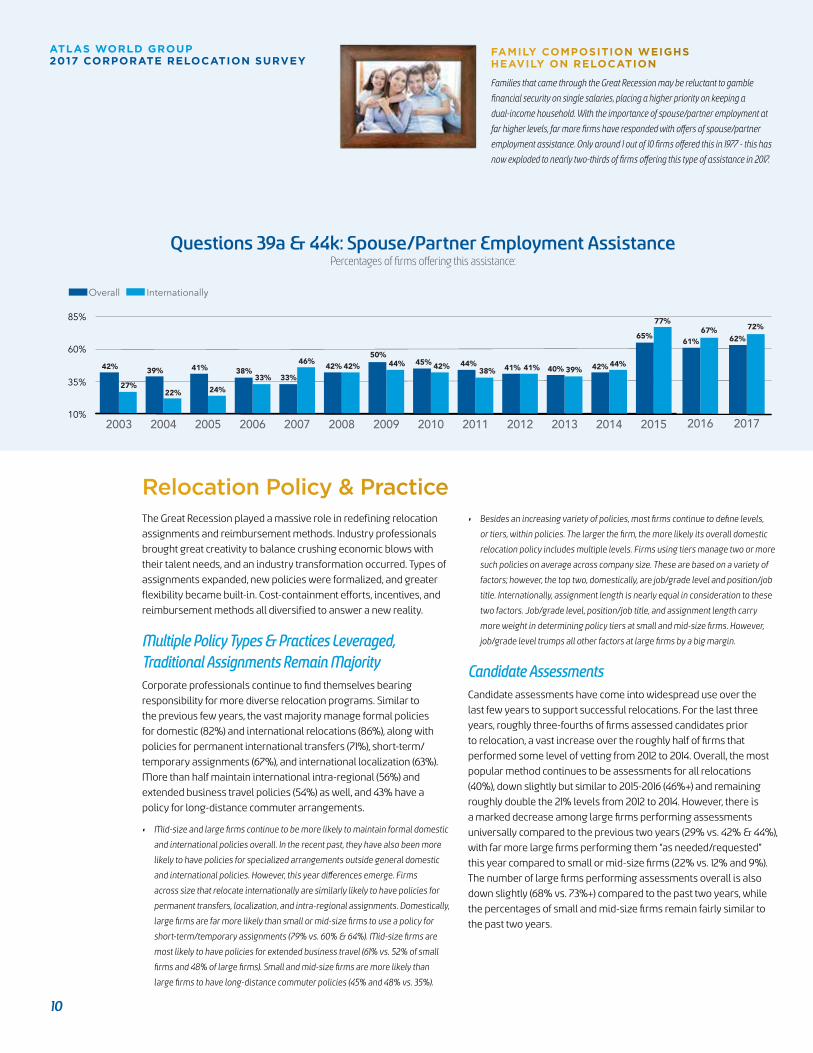
With the importance of spouse/partner employment eclipsing
historical averages over the past three years, we see a rise in spouse/
partner employment assistance. Firms of all sizes have offered such
assistance far more often over the past three years compared to
previous levels. For the second year in a row it is being offered at
similar levels across company size, not as something more often
seen at mid-size and large firms.
• The most popular form of employment assistance at small and mid-size firms is
networking assistance; for large firms it is outplacement/career services from an
outside firm. Compared to last year, there is a marked upswing among companies
of all sizes in paying for services from an outside firm (27% vs. 16% small, 37% vs.
27% mid-size, and 45% vs. 32% large). Around a third of firms across size offer
assistance with resume preparation and around a fourth reimburse for expenses
related to career transition.
• Large firms indicate that 26% of employees relocating with a spouse/partner
used this type of assistance, while usage rates trend around a third for small
and mid-size firms.
International
Nearly three-fourths of companies offer to help find jobs for spouses
or partners relocating internationally, the second-highest level
historically. For the third straight year, such assistance is more often
available with international than with domestic relocations (72% vs.
62%); from 2008-2014, these levels were nearly identical. Also, for the
third year in a row, the popularity of this assistance is similar across
company size; historically, it has been offered at mid-size and large
firms more frequently than at small firms.
• Similar to the domestic trend, more firms are offering to pay for outplacement/
career services from an outside firm (29% vs. 17% last year), with increases across
company size. Also worth noting: an overall uptick in firms offering to pay for
work visas (26% vs. 21% in 2016) — driven largely by small firms (33% vs. 15% last
year).
• For-profit service firms are far more likely than manufacturing/processing or
wholesale/retail firms to pay for spouse/partner work visas (34% vs. 22% & 14%).
Family Assistance
For the third year in a row, firms are making far greater
accommodations overall for childcare (65% vs. 31%-43% historically)
and for elder care (51% vs. 16%-26% historically), even if merely
providing lists of resources for support. However, since this shift
occurred in 2015 and has remained stable overall, some trends by
company size emerge. The percentages of small firms offering
these types of support have increased in each of the last three years
to historical highs. For mid-size firms, the levels jumped in 2015
and then stabilized at roughly those highs over the past two years.
Among large firms, the offerings jumped to historical highs in 2015
and have trended downward since but remain similar to 2015 levels
comparatively. In general, regardless of size, around two-thirds of
firms offer accommodations for childcare. However, while more than
half of small and mid-size firms offer elder care, just 43% of large firms
do. The impact of family issues/ties remains a main factor in declined
relocations and many employees are finding themselves caring for
both older family members and children at the same time. Having
children is often delayed in more affluent, high-earning households,
typically part of the highly educated pool employers tap for relocation.
However, large firms reported increased reluctance levels last year
at nearly half that of mid-size and small firms (12% vs. 21% and 25%).
While the need to accommodate childcare likely remains pressing,
these firms may be experiencing less pressure to offer elder-care
assistance.
Q38: Spouse/Partner Employment ImpactHow frequently is an employee's relocation affected by the employment status of that employee's spouse/partner?
Seldom/Never
0%
20%
40%
60%
80%
100%
2015201420132012201120102009200820072006200520042003 2016 2017
42%
58%
42%
58%
44%
56%
43%
57%
52%
48%
42%
58%
40%
60%
46%
54%
39%
61%
46%
54%
48%
52%
62%
38%
63%
37%
62%
38%
61%
39%
Almost Always/Frequently
Seldom/Never
0%
20%
40%
60%
80%
100%
2015201420132012201120102009200820072006200520042003 2016 2017
42%
58%
42%
58%
44%
56%
43%
57%
52%
48%
42%
58%
40%
60%
46%
54%
39%
61%
46%
54%
48%
52%
62%
38%
63%
37%
62%
38%
61%
39%
Almost Always/Frequently
9
INDUSTRY'S LONGEST RUNNING SURVEY HIGHLIGHTS
Relocation Policy & PracticeThe Great Recession played a massive role in redefining relocation
assignments and reimbursement methods. Industry professionals
brought great creativity to balance crushing economic blows with
their talent needs, and an industry transformation occurred. Types of
assignments expanded, new policies were formalized, and greater
flexibility became built-in. Cost-containment efforts, incentives, and
reimbursement methods all diversified to answer a new reality.
Multiple Policy Types & Practices Leveraged, Traditional Assignments Remain Majority Corporate professionals continue to find themselves bearing
responsibility for more diverse relocation programs. Similar to
the previous few years, the vast majority manage formal policies
for domestic (82%) and international relocations (86%), along with
policies for permanent international transfers (71%), short-term/
temporary assignments (67%), and international localization (63%).
More than half maintain international intra-regional (56%) and
extended business travel policies (54%) as well, and 43% have a
policy for long-distance commuter arrangements.
• Mid-size and large firms continue to be more likely to maintain formal domestic
and international policies overall. In the recent past, they have also been more
likely to have policies for specialized arrangements outside general domestic
and international policies. However, this year differences emerge. Firms
across size that relocate internationally are similarly likely to have policies for
permanent transfers, localization, and intra-regional assignments. Domestically,
large firms are far more likely than small or mid-size firms to use a policy for
short-term/temporary assignments (79% vs. 60% & 64%). Mid-size firms are
most likely to have policies for extended business travel (61% vs. 52% of small
firms and 48% of large firms). Small and mid-size firms are more likely than
large firms to have long-distance commuter policies (45% and 48% vs. 35%).
• Besides an increasing variety of policies, most firms continue to define levels,
or tiers, within policies. The larger the firm, the more likely its overall domestic
relocation policy includes multiple levels. Firms using tiers manage two or more
such policies on average across company size. These are based on a variety of
factors; however, the top two, domestically, are job/grade level and position/job
title. Internationally, assignment length is nearly equal in consideration to these
two factors. Job/grade level, position/job title, and assignment length carry
more weight in determining policy tiers at small and mid-size firms. However,
job/grade level trumps all other factors at large firms by a big margin.
Candidate AssessmentsCandidate assessments have come into widespread use over the
last few years to support successful relocations. For the last three
years, roughly three-fourths of firms assessed candidates prior
to relocation, a vast increase over the roughly half of firms that
performed some level of vetting from 2012 to 2014. Overall, the most
popular method continues to be assessments for all relocations
(40%), down slightly but similar to 2015-2016 (46%+) and remaining
roughly double the 21% levels from 2012 to 2014. However, there is
a marked decrease among large firms performing assessments
universally compared to the previous two years (29% vs. 42% & 44%),
with far more large firms performing them “as needed/requested”
this year compared to small or mid-size firms (22% vs. 12% and 9%).
The number of large firms performing assessments overall is also
down slightly (68% vs. 73%+) compared to the past two years, while
the percentages of small and mid-size firms remain fairly similar to
the past two years.
Percentages of firms offering this assistance:Questions 39a & 44k: Spouse/Partner Employment Assistance
Overall Internationally
42%
27%
42% 42% 42% 42% 44%44%45%46%39% 39%
22%
41% 41% 41% 40%38% 38%33% 33%
24%
44%50%
65%
77%
10%
35%
60%
85%
2015201420132012201120102009200820072006200520042003
61%67%
2016
62%
72%
2017
Overall Internationally
42%
27%
42% 42% 42% 42% 44%44%45%46%39% 39%
22%
41% 41% 41% 40%38% 38%33% 33%
24%
44%50%
65%
77%
10%
35%
60%
85%
2015201420132012201120102009200820072006200520042003
61%67%
2016
62%
72%
2017
Families that came through the Great Recession may be reluctant to gamble
financial security on single salaries, placing a higher priority on keeping a
dual-income household. With the importance of spouse/partner employment at
far higher levels, far more firms have responded with offers of spouse/partner
employment assistance. Only around 1 out of 10 firms offered this in 1977 - this has
now exploded to nearly two-thirds of firms offering this type of assistance in 2017.
FAMILY COMPOSITION WEIGHS HEAVILY ON RELOCATION
10
ATLAS WORLD GROUP 2017 CORPORATE RELOCATION SURVEY
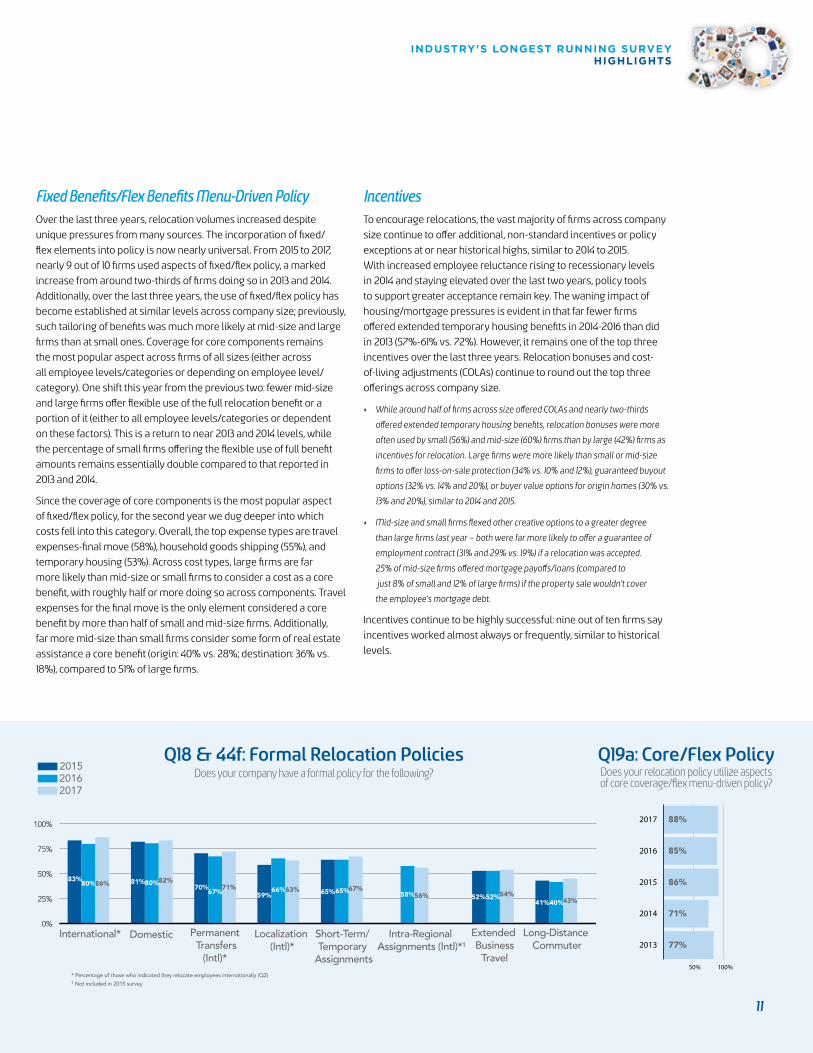
Fixed Benefits/Flex Benefits Menu-Driven PolicyOver the last three years, relocation volumes increased despite
unique pressures from many sources. The incorporation of fixed/
flex elements into policy is now nearly universal. From 2015 to 2017,
nearly 9 out of 10 firms used aspects of fixed/flex policy, a marked
increase from around two-thirds of firms doing so in 2013 and 2014.
Additionally, over the last three years, the use of fixed/flex policy has
become established at similar levels across company size; previously,
such tailoring of benefits was much more likely at mid-size and large
firms than at small ones. Coverage for core components remains
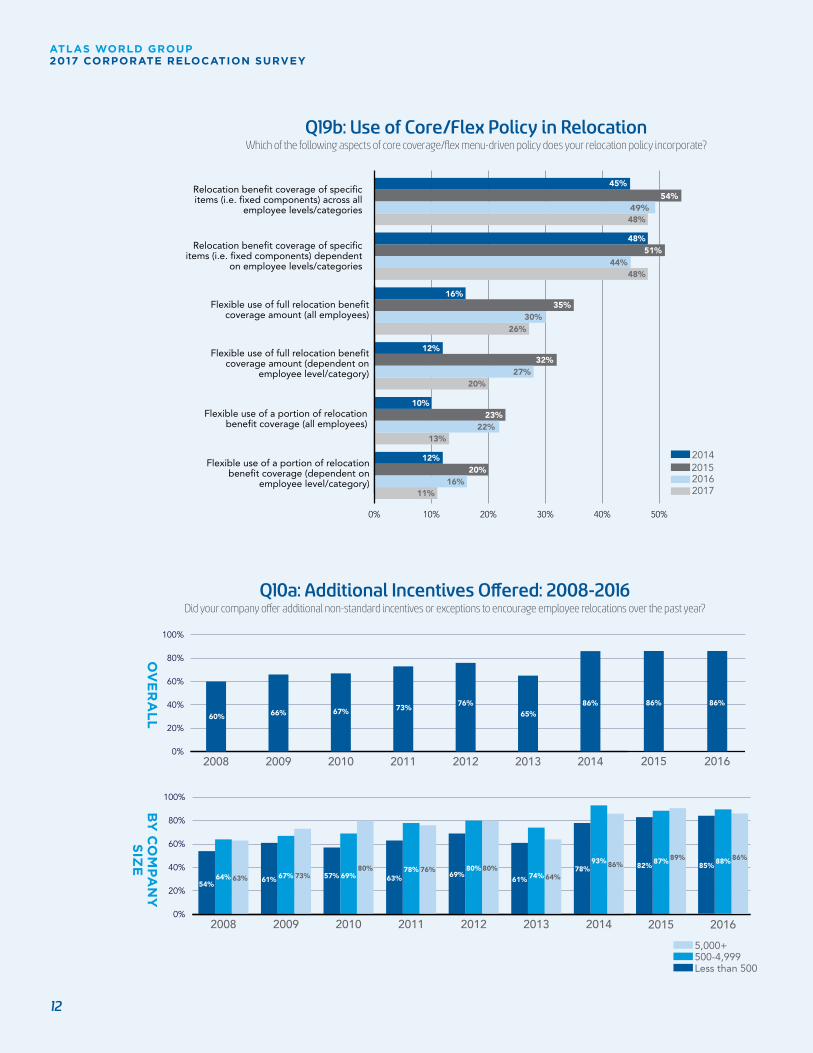
the most popular aspect across firms of all sizes (either across
all employee levels/categories or depending on employee level/
category). One shift this year from the previous two: fewer mid-size
and large firms offer flexible use of the full relocation benefit or a
portion of it (either to all employee levels/categories or dependent
on these factors). This is a return to near 2013 and 2014 levels, while
the percentage of small firms offering the flexible use of full benefit
amounts remains essentially double compared to that reported in
2013 and 2014.
Since the coverage of core components is the most popular aspect
of fixed/flex policy, for the second year we dug deeper into which
costs fell into this category. Overall, the top expense types are travel
expenses-final move (58%), household goods shipping (55%), and
temporary housing (53%). Across cost types, large firms are far
more likely than mid-size or small firms to consider a cost as a core
benefit, with roughly half or more doing so across components. Travel
expenses for the final move is the only element considered a core
benefit by more than half of small and mid-size firms. Additionally,
far more mid-size than small firms consider some form of real estate
assistance a core benefit (origin: 40% vs. 28%; destination: 36% vs.
18%), compared to 51% of large firms.
IncentivesTo encourage relocations, the vast majority of firms across company
size continue to offer additional, non-standard incentives or policy
exceptions at or near historical highs, similar to 2014 to 2015.
With increased employee reluctance rising to recessionary levels
in 2014 and staying elevated over the last two years, policy tools
to support greater acceptance remain key. The waning impact of
housing/mortgage pressures is evident in that far fewer firms
offered extended temporary housing benefits in 2014-2016 than did
in 2013 (57%-61% vs. 72%). However, it remains one of the top three
incentives over the last three years. Relocation bonuses and cost-
of-living adjustments (COLAs) continue to round out the top three
offerings across company size.
• While around half of firms across size offered COLAs and nearly two-thirds
offered extended temporary housing benefits, relocation bonuses were more
often used by small (56%) and mid-size (60%) firms than by large (42%) firms as
incentives for relocation. Large firms were more likely than small or mid-size
firms to offer loss-on-sale protection (34% vs. 10% and 12%), guaranteed buyout
options (32% vs. 14% and 20%), or buyer value options for origin homes (30% vs.
13% and 20%), similar to 2014 and 2015.
• Mid-size and small firms flexed other creative options to a greater degree
than large firms last year – both were far more likely to offer a guarantee of
employment contract (31% and 29% vs. 19%) if a relocation was accepted.
25% of mid-size firms offered mortgage payoffs/loans (compared to
just 8% of small and 12% of large firms) if the property sale wouldn’t cover
the employee’s mortgage debt.
Incentives continue to be highly successful: nine out of ten firms say
incentives worked almost always or frequently, similar to historical
levels.
Does your company have a formal policy for the following?
0%
25%
50%
75%
100%
Long-Distance Commuter
Extended Business
Travel
Localization (Intl)*
Short-Term/Temporary
Assignments
Permanent Transfers
(Intl)*
Domestic
* Percentage of those who indicated they relocate employees internationally (Q2)¹ Not included in 2015 survey
201520162017
International*
80%81% 82%
Intra-Regional Assignments (Intl)*¹
58%56% 52%54%52%40%41% 43%
66%63%59%
65%65% 67%67%70% 71%80%86%
83%
Q18 & 44f: Formal Relocation Policies Q19a: Core/Flex PolicyDoes your relocation policy utilize aspects of core coverage/flex menu-driven policy?
50% 100%
77%2013
71%2014
86%2015
85%2016
88%2017
11
INDUSTRY'S LONGEST RUNNING SURVEY HIGHLIGHTS
OV
ER
ALL
BY
CO
MPA
NY
SIZ
E
Did your company offer additional non-standard incentives or exceptions to encourage employee relocations over the past year?Q10a: Additional Incentives Offered: 2008-2016
5,000+500-4,999Less than 5000%
20%
40%
60%
80%
100%
2014201320122011201020092008
64% 63% 64%73%80% 80%
61%54%
67% 74%61%
86%93%78%
69%57% 63%78%
69%80%76%
2015
89%87%82%
2016
86%88%85%
5,000+500-4,999Less than 5000%
20%
40%
60%
80%
100%
2014201320122011201020092008
64% 63% 64%73%80% 80%
61%54%
67% 74%61%
86%93%78%
69%57% 63%78%
69%80%76%
2015
89%87%82%
2016
86%88%85%
0%
20%
40%
60%
80%
100%
2014201320122011201020092008
60% 66% 65%86%
67% 73%76%
2015
86%
2016
86%
Q19b: Use of Core/Flex Policy in RelocationWhich of the following aspects of core coverage/flex menu-driven policy does your relocation policy incorporate?
0% 10% 20% 30% 40% 50%
2014201520162017
Relocation benefit coverage of specific items (i.e. fixed components) dependent
on employee levels/categories
51%44%
48%
Flexible use of full relocation benefit coverage amount (all employees)
35%30%
16%
Flexible use of full relocation benefit coverage amount (dependent on
employee level/category)32%
27%
12%
Flexible use of a portion of relocation benefit coverage (all employees)
23%22%
10%
Flexible use of a portion of relocation benefit coverage (dependent on
employee level/category)20%
16%11%
12%
Relocation benefit coverage of specific items (i.e. fixed components) across all
employee levels/categories 49%54%
45%
13%
20%
26%
48%
48%
12
ATLAS WORLD GROUP 2017 CORPORATE RELOCATION SURVEY
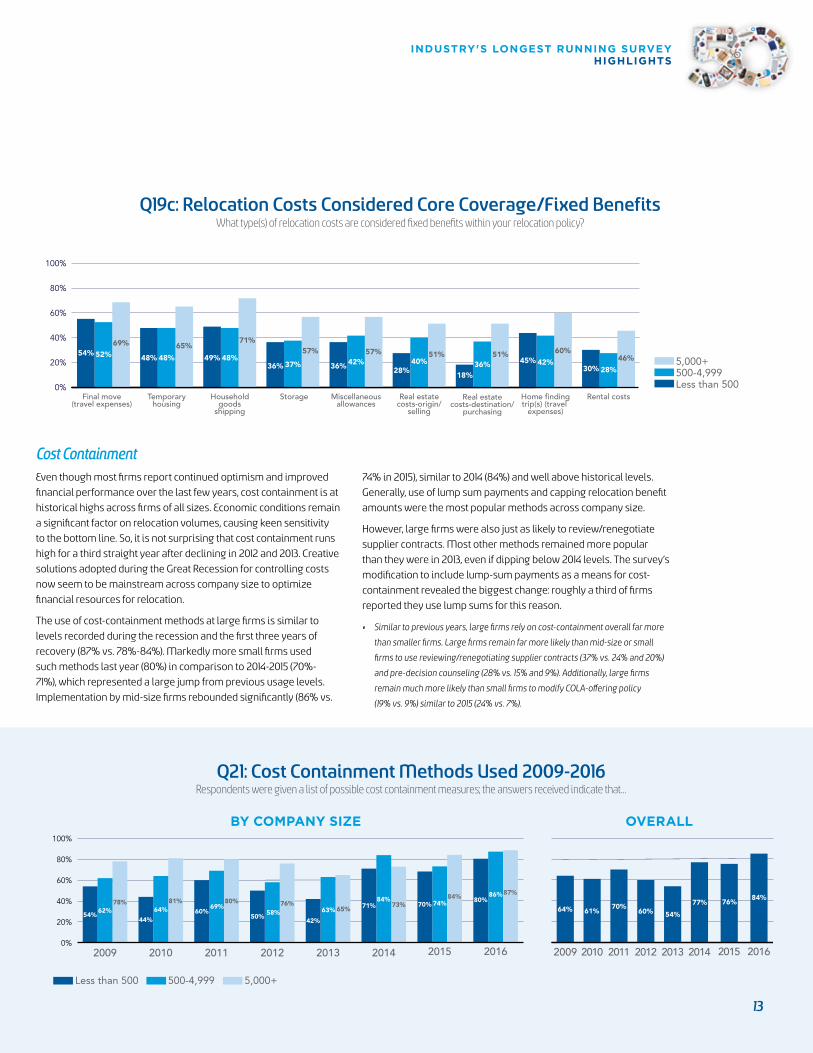
Cost ContainmentEven though most firms report continued optimism and improved
financial performance over the last few years, cost containment is at
historical highs across firms of all sizes. Economic conditions remain
a significant factor on relocation volumes, causing keen sensitivity
to the bottom line. So, it is not surprising that cost containment runs
high for a third straight year after declining in 2012 and 2013. Creative
solutions adopted during the Great Recession for controlling costs
now seem to be mainstream across company size to optimize
financial resources for relocation.
The use of cost-containment methods at large firms is similar to
levels recorded during the recession and the first three years of
recovery (87% vs. 78%-84%). Markedly more small firms used
such methods last year (80%) in comparison to 2014-2015 (70%-
71%), which represented a large jump from previous usage levels.
Implementation by mid-size firms rebounded significantly (86% vs.
74% in 2015), similar to 2014 (84%) and well above historical levels.
Generally, use of lump sum payments and capping relocation benefit
amounts were the most popular methods across company size.
However, large firms were also just as likely to review/renegotiate
supplier contracts. Most other methods remained more popular
than they were in 2013, even if dipping below 2014 levels. The survey’s
modification to include lump-sum payments as a means for cost-
containment revealed the biggest change: roughly a third of firms
reported they use lump sums for this reason.
• Similar to previous years, large firms rely on cost-containment overall far more
than smaller firms. Large firms remain far more likely than mid-size or small
firms to use reviewing/renegotiating supplier contracts (37% vs. 24% and 20%)
and pre-decision counseling (28% vs. 15% and 9%). Additionally, large firms
remain much more likely than small firms to modify COLA-offering policy
(19% vs. 9%) similar to 2015 (24% vs. 7%).
Q19c: Relocation Costs Considered Core Coverage/Fixed BenefitsWhat type(s) of relocation costs are considered fixed benefits within your relocation policy?
Respondents were given a list of possible cost containment measures; the answers received indicate that…Q21: Cost Containment Methods Used 2009-2016
Less than 500 500-4,999 5,000+
0%
20%
40%
60%
80%
100%
201420132012201120102009
73%65%
81% 80%63%60%64% 69%
50%58%
42%
84%71%76%
62%78%
44%54%
2015
74%84%
70%
201420132012201120102009
64% 61%70% 77%
60% 54%
2015
76%
2016
86% 87%80%
2016
84%
Less than 500 500-4,999 5,000+
0%
20%
40%
60%
80%
100%
201420132012201120102009
73%65%
81% 80%63%60%64% 69%
50%58%
42%
84%71%76%
62%78%
44%54%
2015
74%84%
70%
201420132012201120102009
64% 61%70% 77%
60% 54%
2015
76%
2016
86% 87%80%
2016
84%
BY COMPANY SIZE OVERALL
0%
20%
40%
60%
80%
100%
Real estatecosts-origin/
selling
Miscellaneousallowances
StorageHouseholdgoods
shipping
Home findingtrip(s) (travel
expenses)
Rental costsTemporaryhousing
Final move(travel expenses)
5,000+500-4,999Less than 500
Real estatecosts-destination/
purchasing
69%52%54%
65%
48%48%
71%
48%49%57%
37%36%
57%42%36%
51%36%
18%
51%40%
28%
46%
28%30%
60%
42%45%
13
INDUSTRY'S LONGEST RUNNING SURVEY HIGHLIGHTS
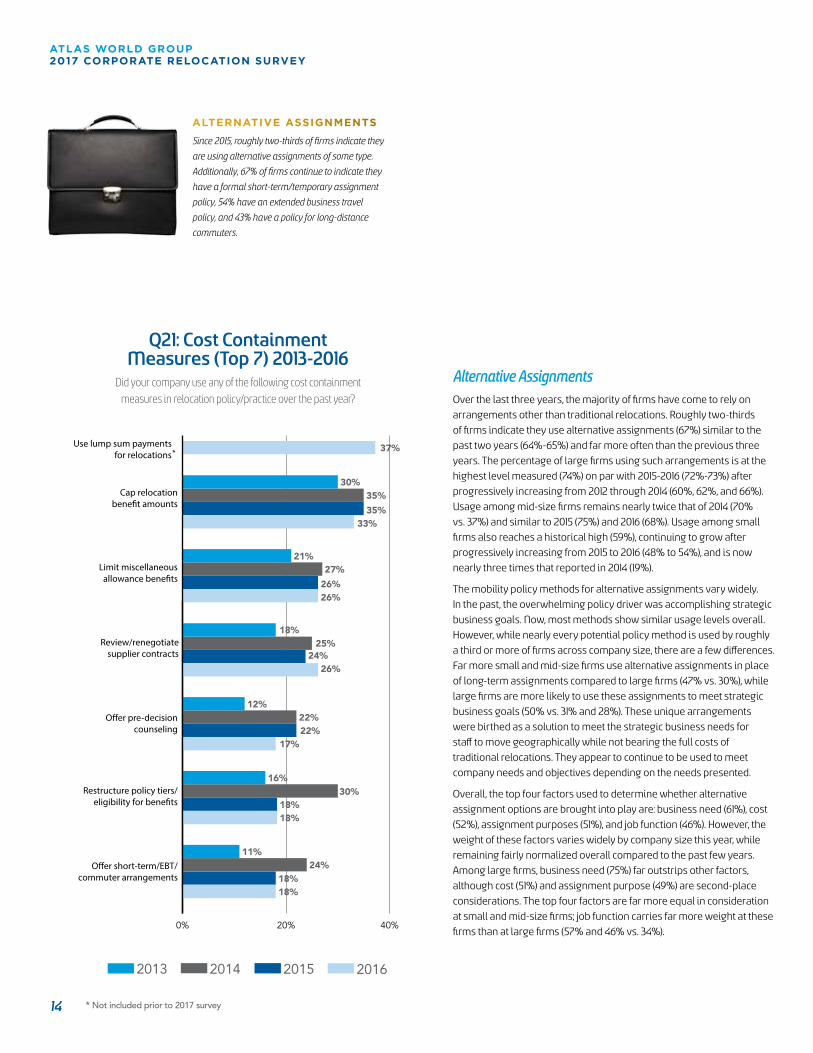
Alternative AssignmentsOver the last three years, the majority of firms have come to rely on
arrangements other than traditional relocations. Roughly two-thirds
of firms indicate they use alternative assignments (67%) similar to the
past two years (64%-65%) and far more often than the previous three
years. The percentage of large firms using such arrangements is at the
highest level measured (74%) on par with 2015-2016 (72%-73%) after
progressively increasing from 2012 through 2014 (60%, 62%, and 66%).
Usage among mid-size firms remains nearly twice that of 2014 (70%
vs. 37%) and similar to 2015 (75%) and 2016 (68%). Usage among small
firms also reaches a historical high (59%), continuing to grow after
progressively increasing from 2015 to 2016 (48% to 54%), and is now
nearly three times that reported in 2014 (19%).
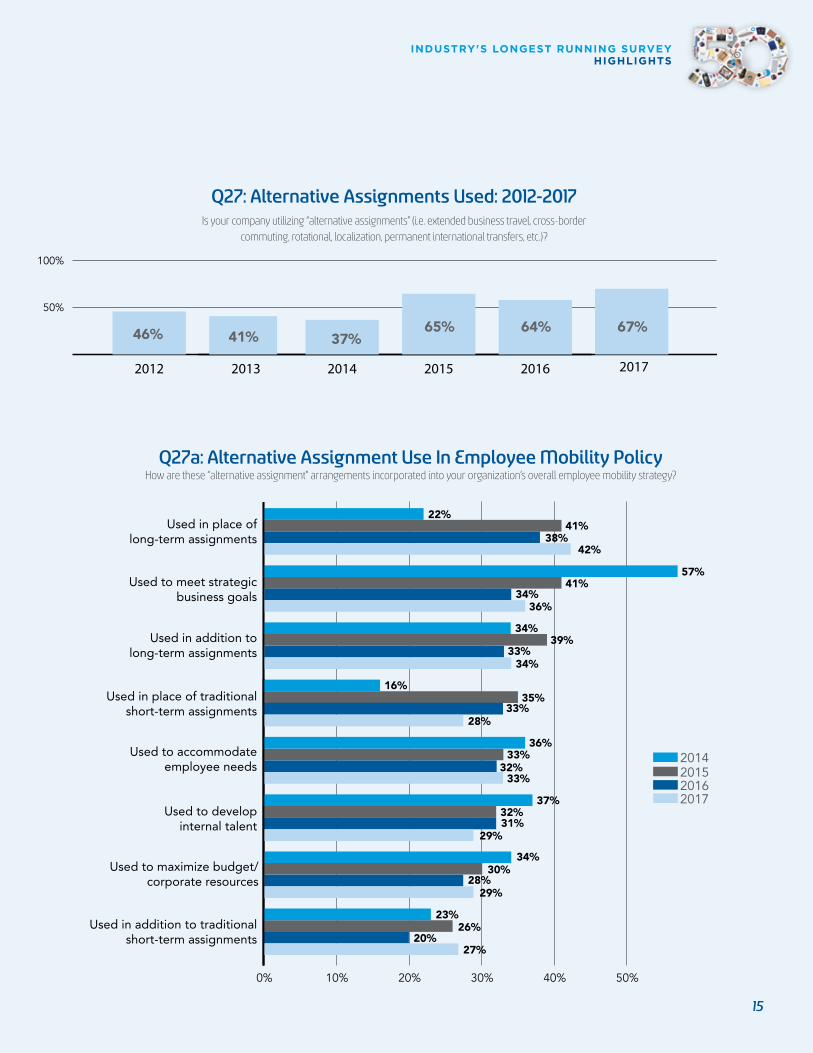
The mobility policy methods for alternative assignments vary widely.
In the past, the overwhelming policy driver was accomplishing strategic
business goals. Now, most methods show similar usage levels overall.
However, while nearly every potential policy method is used by roughly
a third or more of firms across company size, there are a few differences.
Far more small and mid-size firms use alternative assignments in place
of long-term assignments compared to large firms (47% vs. 30%), while
large firms are more likely to use these assignments to meet strategic
business goals (50% vs. 31% and 28%). These unique arrangements
were birthed as a solution to meet the strategic business needs for
staff to move geographically while not bearing the full costs of
traditional relocations. They appear to continue to be used to meet
company needs and objectives depending on the needs presented.
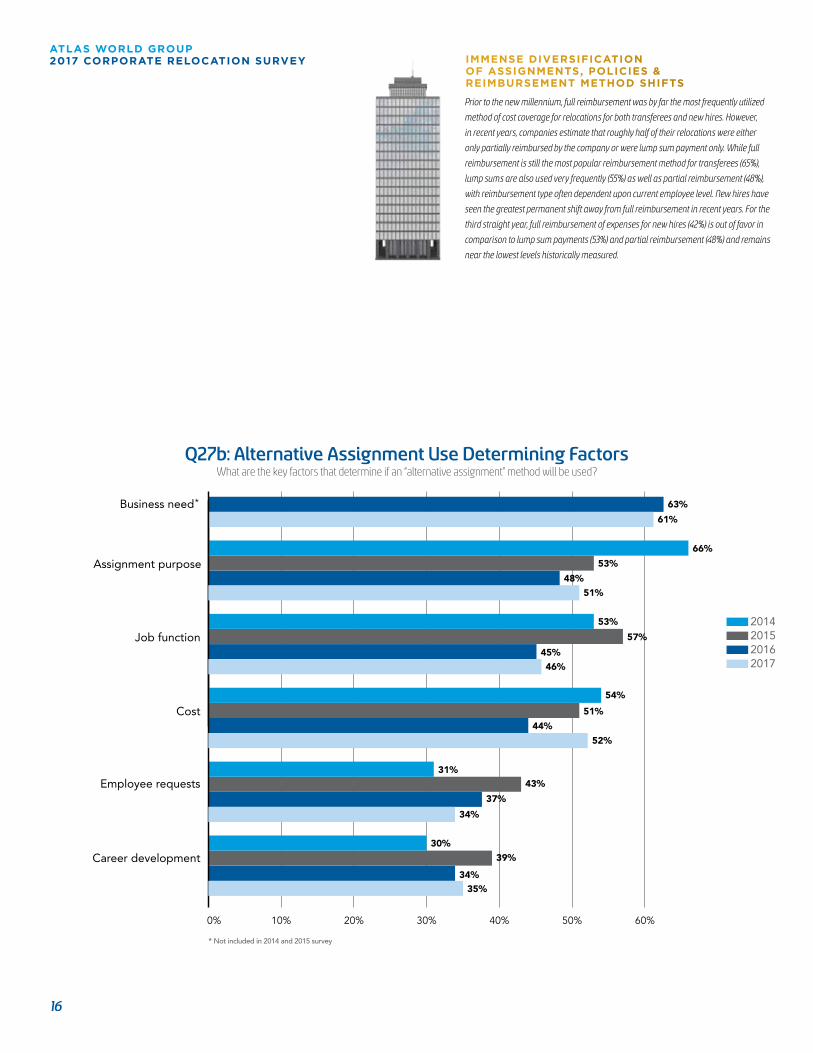
Overall, the top four factors used to determine whether alternative
assignment options are brought into play are: business need (61%), cost
(52%), assignment purposes (51%), and job function (46%). However, the
weight of these factors varies widely by company size this year, while
remaining fairly normalized overall compared to the past few years.
Among large firms, business need (75%) far outstrips other factors,
although cost (51%) and assignment purpose (49%) are second-place
considerations. The top four factors are far more equal in consideration
at small and mid-size firms; job function carries far more weight at these
firms than at large firms (57% and 46% vs. 34%).
Did your company use any of the following cost containment
measures in relocation policy/practice over the past year?
Q21: Cost Containment Measures (Top 7) 2013-2016
0% 20% 40%
2013201420152016
Cap relocationbene�t amounts
30%35%
35%33%
Use lump sum payments for relocations*
37%
Limit miscellaneousallowance bene�ts
21%27%
26%26%
Review/renegotiatesupplier contracts
18%25%
24%26%
O�er pre-decisioncounseling
12%22%22%
17%
Restructure policy tiers/eligibility for bene�ts
16%30%
18%18%
O�er short-term/EBT/commuter arrangements
11%24%
18%18%
* Not included prior to 2017 survey
Since 2015, roughly two-thirds of firms indicate they
are using alternative assignments of some type.
Additionally, 67% of firms continue to indicate they
have a formal short-term/temporary assignment
policy, 54% have an extended business travel
policy, and 43% have a policy for long-distance
commuters.
ALTERNATIVE ASSIGNMENTS
14
ATLAS WORLD GROUP 2017 CORPORATE RELOCATION SURVEY
50%
100%
2015201420132012
46% 41% 37%65%
2016
64% 67%
2017
Is your company utilizing “alternative assignments” (i.e. extended business travel, cross-border commuting, rotational, localization, permanent international transfers, etc.)?
Q27: Alternative Assignments Used: 2012-2017
0% 10% 20% 30% 40% 50%
2014201520162017
Used in place oflong-term assignments
22%41%
38%42%
Used to meet strategicbusiness goals
57%41%
34%
Used in addition tolong-term assignments
34%39%
33%
Used in place of traditionalshort-term assignments
16%35%
33%
Used to accommodateemployee needs
36%33%
32%
Used to developinternal talent
37%32%31%
Used to maximize budget/corporate resources
34%30%
28%
Used in addition to traditionalshort-term assignments
23%26%
20%
36%
34%
28%
33%
29%
29%
27%
Q27a: Alternative Assignment Use In Employee Mobility PolicyHow are these “alternative assignment” arrangements incorporated into your organization’s overall employee mobility strategy?
15
INDUSTRY'S LONGEST RUNNING SURVEY HIGHLIGHTS
Q27b: Alternative Assignment Use Determining FactorsWhat are the key factors that determine if an “alternative assignment” method will be used?
0% 10% 20% 30% 40% 50% 60%
201420152016
Business need* 63%
61%
53%
66%
Assignment purpose48%
53%
57%Job function45%
54%
51%Cost44%
39%
30%
Career development34%
43%31%
Employee requests37%
* Not included in 2014 and 2015 survey
2017
51%
46%
52%
34%
35%
Prior to the new millennium, full reimbursement was by far the most frequently utilized
method of cost coverage for relocations for both transferees and new hires. However,
in recent years, companies estimate that roughly half of their relocations were either
only partially reimbursed by the company or were lump sum payment only. While full
reimbursement is still the most popular reimbursement method for transferees (65%),
lump sums are also used very frequently (55%) as well as partial reimbursement (48%),
with reimbursement type often dependent upon current employee level. New hires have
seen the greatest permanent shift away from full reimbursement in recent years. For the
third straight year, full reimbursement of expenses for new hires (42%) is out of favor in
comparison to lump sum payments (53%) and partial reimbursement (48%) and remains
near the lowest levels historically measured.
IMMENSE DIVERSIFICATION OF ASSIGNMENTS, POLICIES & REIMBURSEMENT METHOD SHIFTS
16
ATLAS WORLD GROUP 2017 CORPORATE RELOCATION SURVEY
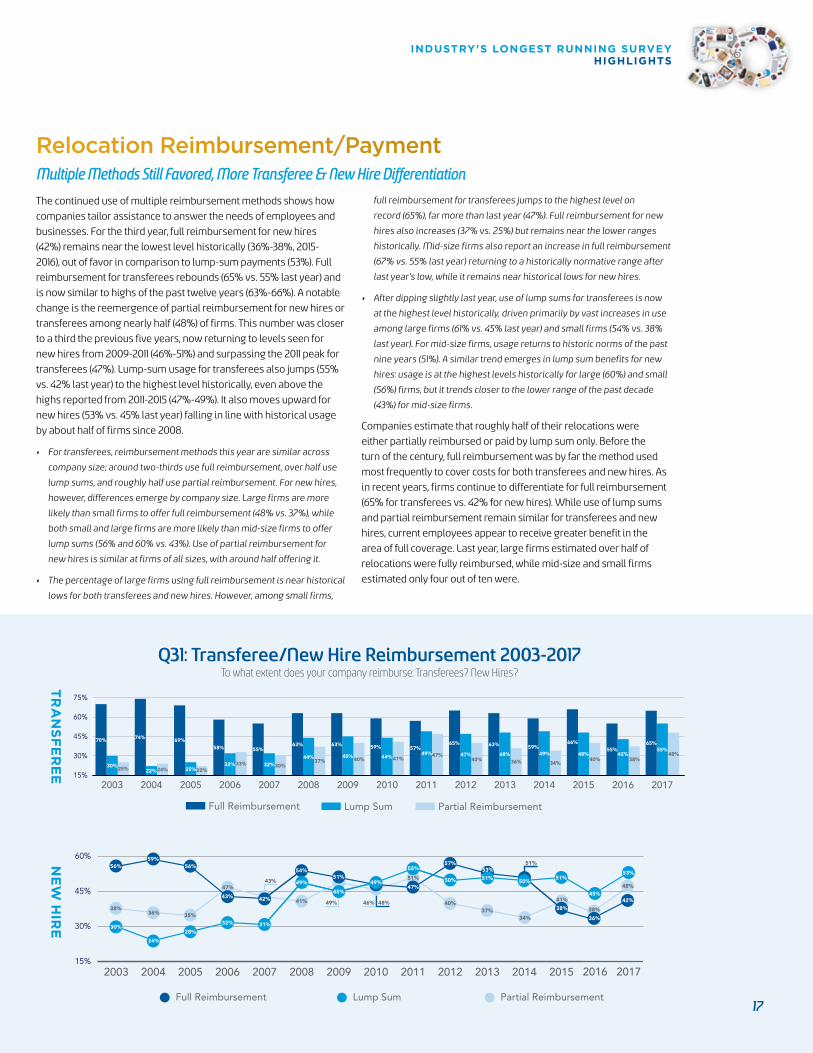
The continued use of multiple reimbursement methods shows how
companies tailor assistance to answer the needs of employees and
businesses. For the third year, full reimbursement for new hires
(42%) remains near the lowest level historically (36%-38%, 2015-
2016), out of favor in comparison to lump-sum payments (53%). Full
reimbursement for transferees rebounds (65% vs. 55% last year) and
is now similar to highs of the past twelve years (63%-66%). A notable
change is the reemergence of partial reimbursement for new hires or
transferees among nearly half (48%) of firms. This number was closer
to a third the previous five years, now returning to levels seen for
new hires from 2009-2011 (46%-51%) and surpassing the 2011 peak for
transferees (47%). Lump-sum usage for transferees also jumps (55%
vs. 42% last year) to the highest level historically, even above the
highs reported from 2011-2015 (47%-49%). It also moves upward for
new hires (53% vs. 45% last year) falling in line with historical usage
by about half of firms since 2008.
• For transferees, reimbursement methods this year are similar across
company size; around two-thirds use full reimbursement, over half use
lump sums, and roughly half use partial reimbursement. For new hires,
however, differences emerge by company size. Large firms are more
likely than small firms to offer full reimbursement (48% vs. 37%), while
both small and large firms are more likely than mid-size firms to offer
lump sums (56% and 60% vs. 43%). Use of partial reimbursement for
new hires is similar at firms of all sizes, with around half offering it.
• The percentage of large firms using full reimbursement is near historical
lows for both transferees and new hires. However, among small firms,
full reimbursement for transferees jumps to the highest level on
record (65%), far more than last year (47%). Full reimbursement for new
hires also increases (37% vs. 25%) but remains near the lower ranges
historically. Mid-size firms also report an increase in full reimbursement
(67% vs. 55% last year) returning to a historically normative range after
last year’s low, while it remains near historical lows for new hires.
• After dipping slightly last year, use of lump sums for transferees is now
at the highest level historically, driven primarily by vast increases in use
among large firms (61% vs. 45% last year) and small firms (54% vs. 38%
last year). For mid-size firms, usage returns to historic norms of the past
nine years (51%). A similar trend emerges in lump sum benefits for new
hires: usage is at the highest levels historically for large (60%) and small
(56%) firms, but it trends closer to the lower range of the past decade
(43%) for mid-size firms.
Companies estimate that roughly half of their relocations were
either partially reimbursed or paid by lump sum only. Before the
turn of the century, full reimbursement was by far the method used
most frequently to cover costs for both transferees and new hires. As
in recent years, firms continue to differentiate for full reimbursement
(65% for transferees vs. 42% for new hires). While use of lump sums
and partial reimbursement remain similar for transferees and new
hires, current employees appear to receive greater benefit in the
area of full coverage. Last year, large firms estimated over half of
relocations were fully reimbursed, while mid-size and small firms
estimated only four out of ten were.
Relocation Reimbursement/PaymentMultiple Methods Still Favored, More Transferee & New Hire Differentiation
To what extent does your company reimburse: Transferees? New Hires?Q31: Transferee/New Hire Reimbursement 2003-2017
TRA
NSF
ER
EE
NE
W H
IRE
15%
30%
45%
60%
75%
2015201420132012201120102009200820072006200520042003
70% 74% 69% 65% 63%63% 63%58% 59% 59%
66%57%55%
30%22%25% 24% 22%
33% 30%25%
32% 32%44%
37%45% 40% 40% 36% 34%
40%44% 41%49% 48% 49% 48%47% 47%
Partial ReimbursementLump SumFull Reimbursement
2016
55%
38%42%
2017
65%
48%55%
Full Reimbursement Lump Sum Partial Reimbursement
51%
15%
30%
45%
60%
2015201420132012201120102009200820072006200520042003
56%
38%
30%
59%
36%
24%
56%
35%
28%
47%
43% 42%
43%
54%51%
32% 31%
49%
45%
49%
41%
55%
50% 51% 50%
38%
41%
51%
57%53%
51%
40%37%
34%
47%
48%46%49%
45%
38%
36%
2016
53%
48%
42%
2017
15%
30%
45%
60%
75%
2015201420132012201120102009200820072006200520042003
70% 74% 69% 65% 63%63% 63%58% 59% 59%
66%57%55%
30%22%25% 24% 22%
33% 30%25%
32% 32%44%
37%45% 40% 40% 36% 34%
40%44% 41%49% 48% 49% 48%47% 47%
Partial ReimbursementLump SumFull Reimbursement
2016
55%
38%42%
2017
65%
48%55%
Full Reimbursement Lump Sum Partial Reimbursement
51%
15%
30%
45%
60%
2015201420132012201120102009200820072006200520042003
56%
38%
30%
59%
36%
24%
56%
35%
28%
47%
43% 42%
43%
54%51%
32% 31%
49%
45%
49%
41%
55%
50% 51% 50%
38%
41%
51%
57%53%
51%
40%37%
34%
47%
48%46%49%
45%
38%
36%
2016
53%
48%
42%
2017Full Reimbursement Lump Sum Partial Reimbursement
51%
15%
30%
45%
60%
2015201420132012201120102009200820072006200520042003
56%
38%
30%
59%
36%
24%
56%
35%
28%
47%
43% 42%
43%
54%51%
32% 31%
49%
45%
49%
41%
55%
50% 51% 50%
38%
41%
51%
57%53%
51%
40%37%
34%
47%
48%46%49%
45%
38%
36%
2016
53%
48%
42%
2017
17
INDUSTRY'S LONGEST RUNNING SURVEY HIGHLIGHTS
Continued Use as Supplemental and Full Program OptionsInitially used sparingly, lump sums appear to have solidified over the past
decade as a permanent piece of relocation policy and practice. Similar to
the last few years, firms report around a fourth of relocations were lump
sum payment only. However, lump sums are applied in myriad ways; some
cover specific costs in a supplemental manner. Our survey continues to
investigate which costs fall under lump-sum payments, and to whom and
to what types of relocations they are applied. Some notable trends have
emerged. Identical to last year, half of firms use lump sums to manage
temporary housing costs (50%), up notably from previous years (38%-
43%). For the third year in a row, nearly twice as many firms used lump
sums to cover real estate assistance/transactions (28% vs. 11%+) or rental
assistance/transactions (33% vs. 16%+) than did on average from
2011-2014. The percentage using lump sums to cover household
goods shipping/storage increased progressively from 2011 (28%) to
a historical high (44%) in 2016 and again this year. Roughly half of firms use
lump sums for four out of the seven cost types listed, indicating diversity
in how lump sums answer different situations in relocation management.
While 41% of firms use them for the entire relocation cost, supplemental use
occurs among these firms as well.
• Overall, small and mid-size firms are more likely than large firms to
use lump sums for household goods/shipping costs (53% and 46% vs.
32%), while large firms are more likely to use lump sums for miscellaneous
allowances compared to small or mid-size companies (71% vs 52% and 50%).
• In the past, far more differences existed among companies in how
lump sums were applied; in recent years, the frequencies of use
are mostly similar across company size.
Employee and Relocation Types Receiving Lump SumsThe vast majority of firms across company size indicate that lump sums are
most often applied for domestic relocations (87%). Around a third of firms
overall use them for short-term/temporary assignments or international
long-term assignments; about one sixth use them for alternative
assignments. Mid-size firms are slightly more likely than small or large
firms to use lump sums for international long-term assignments (41% vs.
29% and 33%), but use across company size and assignment type is similar
overall.
The use of lump sums across employee types continues to shift in
response to the changing environment of relocation. When first measured
in 2011, around half or more firms said most employee types, except for
homeowners, commonly received lump-sum payments. Gaps widened in
2012. In 2013 and 2014, new hires were more likely to receive lump sums than
transferees, and employee level was less a factor than new-hire status.
However, the landscape began changing in 2015. Far more firms from 2015
to 2017 than in prior years now use lump sums for executives (54%-59% vs.
32%+), and far fewer firms use lump sums for new hires (43%-49% vs. 59%+).
Despite these trends, underlying use by company size is shifting.
For executives, it has jumped to the highest levels historically for small firms
(66%) and to near-historical highs for mid-size firms
(59%), while dropping from last year’s increase among large firms (44%
vs. 63%). Usage for new hires remains lower among mid-size firms (39%),
rebounds markedly for small firms (50% vs. 39% last year), and remains
similar to last year’s historical normative levels for large firms (60% vs.
56%). Use of lump sums for experienced professionals remains similar to
historical norms (58%) overall. However, underlying shifts by company
size emerge here, too, with more small firms than mid-size or large firms
exercising lump sums for these employee types (65% vs. 54% and 53%).
Overall, usage of lump sums for entry level employees, renters, and
homeowners remains within historical norms over the last two years after
dipping in 2015.
• Among large firms, roughly half or more use lump sums across employee
levels and employee types; far fewer base lump-sum offerings on homeowner
(36%) status.
• New hires are more likely to receive lump sums from large and small firms
than from mid-size firms (60% and 50% vs. 39%).
• Small and mid-size firms are more likely than large firms to provide lump
sums to executives (66% and 59% vs. 44%), while large firms are more likely
than small or mid-size firms to offer these to entry-level employees (67% vs.
37% and 44%).
• Relocating homeowners or renters are the most likely to receive lump sums
from large firms compared to small or mid-size firms (36% vs. 22% and 25%,
48% vs. 41% and 34%).
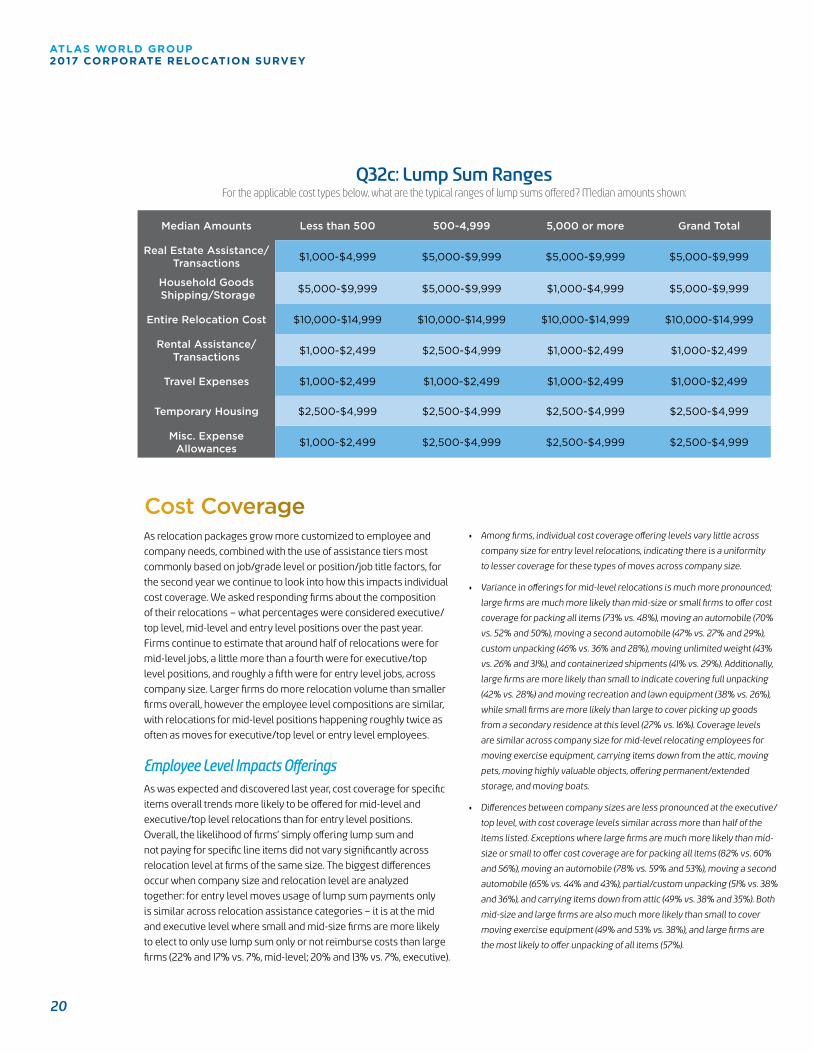
As lump-sum usage has grown, the survey has incorporated additional
questions about monetary ranges for the categories of reimbursement.
Compared to the past four years, most offerings are more frequent and
generous than in 2013 and on par with 2014, despite some dips below ranges
reached in 2015. The overall median ranges are the highest in five years for:
real estate assistance/transactions, household goods shipping/storage,
entire relocation cost, temporary housing, and miscellaneous expense
allowance. However, ranges offered for rental assistance/transactions and
travel expenses remain one range lower.
• The median amount offered by large and small firms were the same for rental
assistance/transactions ($1,000-$2,499); mid-size firms were slightly more generous.
• Median amounts offered by mid-size and large firms were the same for real estate
assistance/transactions ($5,000-$9,999) and miscellaneous expense allowances
($2,500-$4,999). Small firms were slightly less generous.
• The median amount offered for household goods shipping/storage was the same for
small and mid-size firms ($5,000-$9,999); large firms were slightly less generous.
• Median amounts across company size were the same for the following categories:
entire relocation cost ($10,000-$14,999), temporary housing ($2,500-$4,999), and travel
expenses ($1,000-$2,499).
Lump Sum
18
ATLAS WORLD GROUP 2017 CORPORATE RELOCATION SURVEY
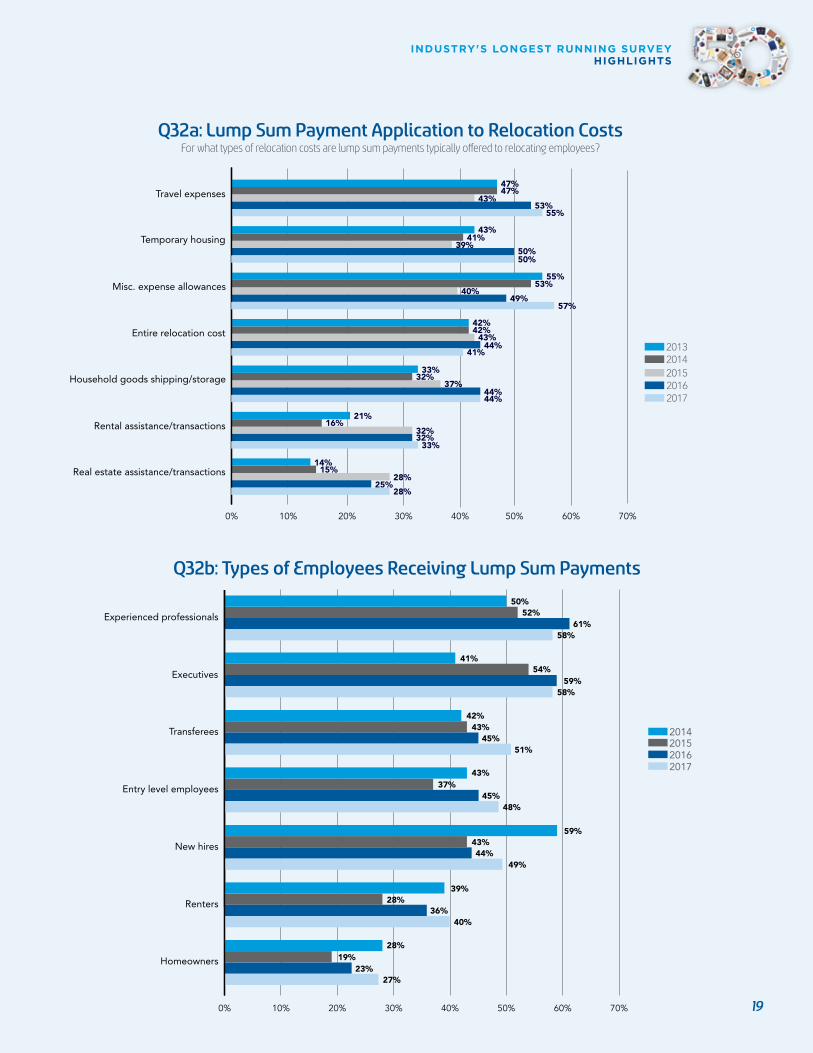
Q32b: Types of Employees Receiving Lump Sum Payments
For what types of relocation costs are lump sum payments typically offered to relocating employees?Q32a: Lump Sum Payment Application to Relocation Costs
20142015
0% 10% 20% 30% 40% 50% 60% 70%
20162017
50%52%Experienced professionals
61%58%
43%42%
Transferees45%
43%37%Entry level employees
45%
43%59%
New hires44%
39%28%Renters
36%
28%19%Homeowners
23%
41%54%Executives
59%58%
51%
48%
49%
40%
27%
201320142015
0% 10% 20% 30% 40% 50% 60% 70%
20162017
43%41%
39%Temporary housing50%
55%53%
40%Misc. expense allowances49%
42%42%
43%Entire relocation cost44%
32%16%
21%Rental assistance/transactions
32%
14%15%
28%Real estate assistance/transactions25%
47%47%
43%Travel expenses53%
55%
33%32%
37%Household goods shipping/storage44%
50%
57%
41%
44%
33%
28%
19
INDUSTRY'S LONGEST RUNNING SURVEY HIGHLIGHTS
As relocation packages grow more customized to employee and
company needs, combined with the use of assistance tiers most
commonly based on job/grade level or position/job title factors, for
the second year we continue to look into how this impacts individual
cost coverage. We asked responding firms about the composition
of their relocations – what percentages were considered executive/
top level, mid-level and entry level positions over the past year.
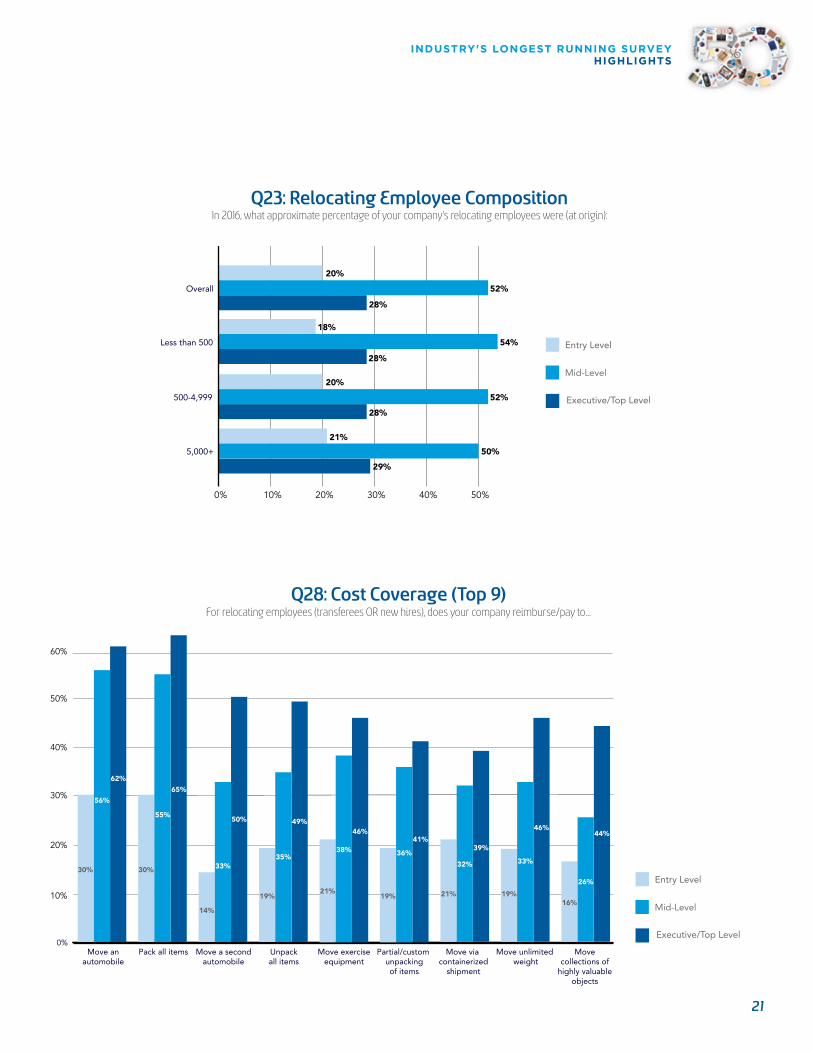
Firms continue to estimate that around half of relocations were for
mid-level jobs, a little more than a fourth were for executive/top
level positions, and roughly a fifth were for entry level jobs, across
company size. Larger firms do more relocation volume than smaller
firms overall, however the employee level compositions are similar,
with relocations for mid-level positions happening roughly twice as
often as moves for executive/top level or entry level employees.
Employee Level Impacts OfferingsAs was expected and discovered last year, cost coverage for specific
items overall trends more likely to be offered for mid-level and
executive/top level relocations than for entry level positions.
Overall, the likelihood of firms’ simply offering lump sum and
not paying for specific line items did not vary significantly across
relocation level at firms of the same size. The biggest differences
occur when company size and relocation level are analyzed
together: for entry level moves usage of lump sum payments only
is similar across relocation assistance categories – it is at the mid
and executive level where small and mid-size firms are more likely
to elect to only use lump sum only or not reimburse costs than large
firms (22% and 17% vs. 7%, mid-level; 20% and 13% vs. 7%, executive).
• Among firms, individual cost coverage offering levels vary little across
company size for entry level relocations, indicating there is a uniformity
to lesser coverage for these types of moves across company size.
• Variance in offerings for mid-level relocations is much more pronounced;
large firms are much more likely than mid-size or small firms to offer cost
coverage for packing all items (73% vs. 48%), moving an automobile (70%
vs. 52% and 50%), moving a second automobile (47% vs. 27% and 29%),
custom unpacking (46% vs. 36% and 28%), moving unlimited weight (43%
vs. 26% and 31%), and containerized shipments (41% vs. 29%). Additionally,
large firms are more likely than small to indicate covering full unpacking
(42% vs. 28%) and moving recreation and lawn equipment (38% vs. 26%),
while small firms are more likely than large to cover picking up goods
from a secondary residence at this level (27% vs. 16%). Coverage levels
are similar across company size for mid-level relocating employees for
moving exercise equipment, carrying items down from the attic, moving
pets, moving highly valuable objects, offering permanent/extended
storage, and moving boats.
• Differences between company sizes are less pronounced at the executive/
top level, with cost coverage levels similar across more than half of the
items listed. Exceptions where large firms are much more likely than mid-
size or small to offer cost coverage are for packing all items (82% vs. 60%
and 56%), moving an automobile (78% vs. 59% and 53%), moving a second
automobile (65% vs. 44% and 43%), partial/custom unpacking (51% vs. 38%
and 36%), and carrying items down from attic (49% vs. 38% and 35%). Both
mid-size and large firms are also much more likely than small to cover
moving exercise equipment (49% and 53% vs. 38%), and large firms are
the most likely to offer unpacking of all items (57%).
Cost Coverage
For the applicable cost types below, what are the typical ranges of lump sums offered? Median amounts shown:Q32c: Lump Sum Ranges
Median Amounts Less than 500 500-4,999 5,000 or more Grand Total
Real Estate Assistance/ Transactions $1,000-$4,999 $5,000-$9,999 $5,000-$9,999 $5,000-$9,999
Household Goods Shipping/Storage $5,000-$9,999 $5,000-$9,999 $1,000-$4,999 $5,000-$9,999
Entire Relocation Cost $10,000-$14,999 $10,000-$14,999 $10,000-$14,999 $10,000-$14,999
Rental Assistance/ Transactions $1,000-$2,499 $2,500-$4,999 $1,000-$2,499 $1,000-$2,499
Travel Expenses $1,000-$2,499 $1,000-$2,499 $1,000-$2,499 $1,000-$2,499
Temporary Housing $2,500-$4,999 $2,500-$4,999 $2,500-$4,999 $2,500-$4,999
Misc. Expense Allowances $1,000-$2,499 $2,500-$4,999 $2,500-$4,999 $2,500-$4,999
20
ATLAS WORLD GROUP 2017 CORPORATE RELOCATION SURVEY
Q23: Relocating Employee CompositionIn 2016, what approximate percentage of your company's relocating employees were (at origin):
Entry Level
Executives/Top Level
0% 10% 20% 30% 40% 50%
5,000+
500-4,999
Less than 500
20%
52%
29%
Mid-Level
Overall
28%
18%
54%
28%
20%
52%
28%
21%
50%
For relocating employees (transferees OR new hires), does your company reimburse/pay to…Q28: Cost Coverage (Top 9)
0% 10% 20% 30% 40% 50%
Move exercise equipment
Unpack all items
Move a second automobile
Pack all items
30%
56%
49%
35%
Move an automobile
62%
30%
55%
65%
14%
33%
50%
19%
46%
38%
21%
41%
36%
19%
60%
Executive/Top Level
Entry Level
Mid-Level
Partial/custom unpacking of items
Move via containerizedshipment
39%
32%
21%
Move unlimited weight
46%
33%
19%
Move collections ofhighly valuable objects
44%
26%
16%
62%
65%
Executive/Top Level
Entry Level
Mid-Level
0%
5,000+500-4,999Less than 500
Move anautomobile
Pack all items Move a secondautomobile
Unpackall items
Move exerciseequipment
Partial/custom unpackingof items
Move via containerized
shipment
Move unlimited weight
Movecollections of
highly valuableobjects
60%
50%
40%
30%
20%
10%
62%
56%
30%
65%
55%
30%
50%
33%
14%
49%
35%
19%
46%
38%
21%
41%
36%
19%
39%
32%
21%
46%
33%
19%
44%
26%
16%
0% 10% 20% 30% 40% 50%
Move exercise equipment
Unpack all items
Move a second automobile
Pack all items
30%
56%
49%
35%
Move an automobile
62%
30%
55%
65%
14%
33%
50%
19%
46%
38%
21%
41%
36%
19%
60%
Executive/Top Level
Entry Level
Mid-Level
Partial/custom unpacking of items
Move via containerizedshipment
39%
32%
21%
Move unlimited weight
46%
33%
19%
Move collections ofhighly valuable objects
44%
26%
16%
21
INDUSTRY'S LONGEST RUNNING SURVEY HIGHLIGHTS
The majority of firms, regardless of size, continue to offer assistance
to homeowners/renters. To deepen our understanding of these
benefits, for the second year we asked firms what types of assistance
they offered across employee levels, regardless of transferee or new
hire status.
HomeownersGenerally, homeowner assistance for specific items trends more
likely for mid-level and executive/top level relocations than for
entry-level positions. However, the overall likelihood of firms simply
offering a lump sum or no homeowner assistance varied little across
relocation levels. The biggest differences occur by company size.
Small firms are the most likely across levels to use a lump sum or to
not offer assistance, with roughly a fourth doing so, regardless
of employee level.
• Offering levels for homeowner assistance vary little across company
size for most entry-level relocations, although there are differences in
some categories. Similar to last year, far more mid-size and large firms
offer storage (27% and 31% vs. 18%) or temporary housing allowances
(30% and 32% vs. 21%) compared to small firms. This year they are also
more likely to offer cost coverage for home-finding trips as well (31% and
27% vs. 19%). Large firms remain more likely than small firms to offer
home marketing assistance (25% vs. 14%), and this year they are roughly
twice as likely as mid-size or small firms to reimburse/pay for federal tax
liability (20% vs. 11% and 12%).
• For mid-level employees, similar to last year, large firms are much more
willing to provide homeowner assistance across categories. The one
exception is mortgage subsidies or allowances, offered by about 20%
of firms across company size. Mid-size firms are much more generous
than small firms across a handful of categories: offering home finding
trips (52% vs. 35%), paying for home sale costs (34% vs. 22%), paying
home purchase costs (31% vs. 18%), and offering buyer-value option for
origin home (20% vs. 12%). But they share a similar likelihood of offering
all other types of assistance for homeowners.
• Trends in assistance for executive/top level homeowners and mid-
level homeowners are similar; large firms are the most likely to offer
individual types of assistance across nearly every category. The only
exception: assistance levels for mortgage subsidies or allowances are
similar regardless of company size, with around a fourth of firms offering
this (similar to last year). While mid-size and large firms show a similar
propensity for temporary housing allowances (66% vs. 56%), they are
much less likely to offer the majority of other assistance items (yet they
are much more likely to offer them than small firms are). Mid-size firms
share similarities with small firms for: paying home purchase costs (37%
vs. 27%), loss-on-sale (28% vs. 24%), mortgage subsidies/allowances
(25% vs. 24%), home marketing assistance (34% vs. 25%), offering a
qualified home sale program (26% vs. 19%), bonuses/incentives for
employee-generated home sales (23% vs. 21%), and duplicate housing
assistance (25% vs. 23%).
RentersGenerally, renter assistance for specific items trends more likely for
mid-level and executive/top level relocations than for entry-level
positions. However, the overall likelihood of firms simply offering a
lump sum or no renter assistance varied little across employee levels
at similar size firms. The biggest differences occur by company size.
Small and mid-size firms are the most likely across levels to offer only
lump sum or no assistance, with roughly a fifth doing so regardless of
employee level.
• For entry-level relocations, two-thirds of the renter-assistance types are offered
at similar levels across company size. However, large firms are more likely than
small firms are to pay for lease cancellation (38% vs. 24%) or apartment search/
finder’s fees (28% vs. 18%), while mid-size firms are more likely than large firms
to reimburse for hook-up fees (22% vs. 11%).
• For mid-level relocations, similar to last year, large firms are by far the most
likely to offer most renter-assistance categories. Additionally, the same four
renter-assistance exceptions are offered at similar frequencies across firm sizes:
rental subsidies/allowances (19% vs. 21% and 22%), reimburse/pay hook-up
fees (21% vs. 29% and 26%), reimburse/pay security deposits (25% vs. 27%), and
reimburse/pay for furniture rental (15% vs. 17% and 18%).
• For executive/top level employees, mid-size and large firms offer the majority
of renter-assistance categories roughly half the time or more, with large firms
offering them far more often than mid-size or small firms overall. However, three
assistance types are offered at similar levels, regardless of company size: paying
for hook-up fees (25%-29%), security deposits (24%-31%), and rental subsidies
or allowances (22%-25%). The one type of assistance mid-size firms offer more
often than large or small firms: reimbursement/payment for furniture rental
(27% vs. 15% and 17%).
Specialized Assistance for Homeowners/Renters
Prior to the new millennium, “lump sum” as a reimbursement option for full
relocations wasn’t even measured on the survey, but was more an option
reserved for reimbursing specific ad hoc costs related to specific aspects of
moving employees in a much more limited way. The transformation of lump
sum payments from a limited usage area to a method of payment flexed for
many reasons (to manage specific sections of policy, full relocation payments
and up to entire segments of some companies relocating workforces to simplify
management) over the course of the past fifteen years largely in response to the
pressures that unfolded during the Great Recession.
RISE OF LUMP SUM
22
ATLAS WORLD GROUP 2017 CORPORATE RELOCATION SURVEY
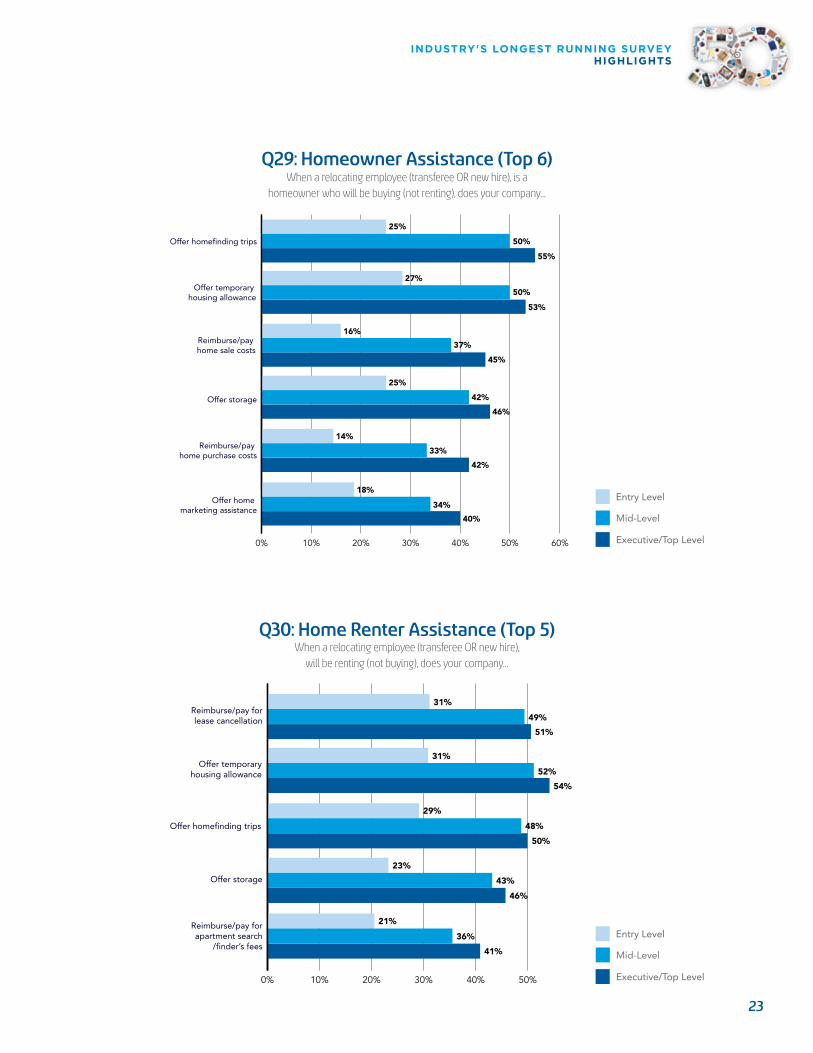
Executive/Top Level
Entry Level
0% 10% 20% 30% 40% 50%
Reimburse/pay forapartment search
/finder’s fees
Offer homefinding trips
Offer temporaryhousing allowance
31%
49%
46%
43%
Mid-Level
Reimburse/pay forlease cancellation
51%
31%
52%
54%
29%
48%
50%
23%
41%
36%
21%
Offer storage
60%
Q30: Home Renter Assistance (Top 5)When a relocating employee (transferee OR new hire),
will be renting (not buying), does your company…
Executive/Top Level
Entry Level
0% 10% 20% 30% 40% 50%
Reimburse/pay forapartment search
/finder’s fees
Offer homefinding trips
Offer temporaryhousing allowance
31%
49%
46%
43%
Mid-Level
Reimburse/pay forlease cancellation
51%
31%
52%
54%
29%
48%
50%
23%
41%
36%
21%
Offer storage
60%
Executive/Top Level
Entry Level
0% 10% 20% 30% 40% 50%
Reimburse/pay forapartment search
/finder’s fees
Offer homefinding trips
Offer temporaryhousing allowance
31%
49%
46%
43%
Mid-Level
Reimburse/pay forlease cancellation
51%
31%
52%
54%
29%
48%
50%
23%
41%
36%
21%
Offer storage
60%
Executive/Top Level
Entry Level
0% 10% 20% 30% 40% 50%
Reimburse/pay forapartment search
/finder’s fees
Offer homefinding trips
Offer temporaryhousing allowance
31%
49%
46%
43%
Mid-Level
Reimburse/pay forlease cancellation
51%
31%
52%
54%
29%
48%
50%
23%
41%
36%
21%
Offer storage
60%
Executive/Top Level
Entry Level
0% 10% 20% 30% 40% 50%
Reimburse/pay forapartment search
/finder’s fees
Offer homefinding trips
Offer temporaryhousing allowance
31%
49%
46%
43%
Mid-Level
Reimburse/pay forlease cancellation
51%
31%
52%
54%
29%
48%
50%
23%
41%
36%
21%
Offer storage
60%
Executive/Top Level
Entry Level
0% 10% 20% 30% 40% 50%
Reimburse/pay forapartment search
/finder’s fees
Offer homefinding trips
Offer temporaryhousing allowance
31%
49%
46%
43%
Mid-Level
Reimburse/pay forlease cancellation
51%
31%
52%
54%
29%
48%
50%
23%
41%
36%
21%
Offer storage
60%
Executive/Top Level
Entry Level
0% 10% 20% 30% 40% 50%
Reimburse/pay forapartment search
/finder’s fees
Offer homefinding trips
Offer temporaryhousing allowance
31%
49%
46%
43%
Mid-Level
Reimburse/pay forlease cancellation
51%
31%
52%
54%
29%
48%
50%
23%
41%
36%
21%
Offer storage
60%
Executive/Top Level
Entry Level
0% 10% 20% 30% 40% 50%
Reimburse/pay home purchase costs
Offer storage
Reimburse/pay home sale costs
Offer temporary housing allowance
25%
50%
46%
42%
Mid-Level
Offer homefinding trips
Offer home marketing assistance
55%
27%
50%
53%
16%
37%
45%
25%
42%
33%
14%
40%
34%
18%
60%
Q29: Homeowner Assistance (Top 6)When a relocating employee (transferee OR new hire), is a
homeowner who will be buying (not renting), does your company…
23
INDUSTRY'S LONGEST RUNNING SURVEY HIGHLIGHTS
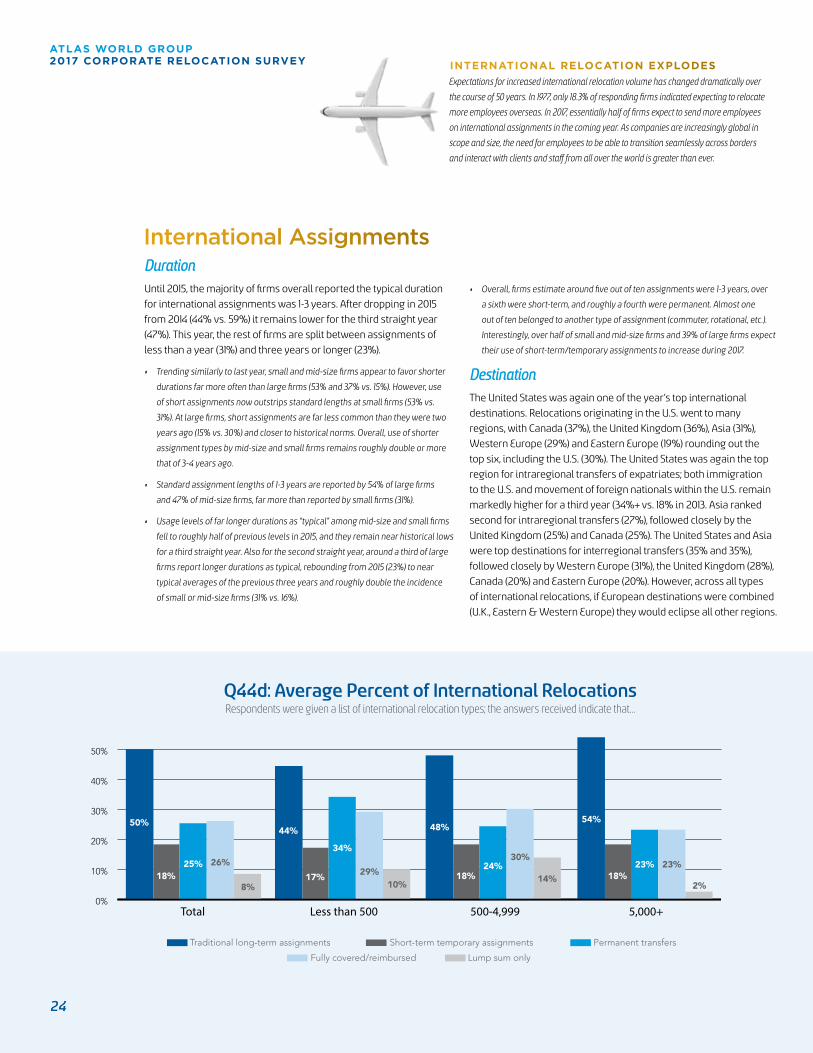
Respondents were given a list of international relocation types; the answers received indicate that…Q44d: Average Percent of International Relocations
0%
10%
20%
30%
40%
50%
5,000+500-4,999Less than 500Total
25%
8%
Lump sum onlyFully covered/reimbursed
Permanent transfersShort-term temporary assignmentsTraditional long-term assignments
60%
50%
25%18%
26%
8%
44%
34%
17% 29%10%
48%
24%18%
30%
14%
54%
23%18%
23%
2%
0%
10%
20%
30%
40%
50%
5,000+500-4,999Less than 500Total
25%
8%
Lump sum onlyFully covered/reimbursed
Permanent transfersShort-term temporary assignmentsTraditional long-term assignments
60%
50%
25%18%
26%
8%
44%
34%
17% 29%10%
48%
24%18%
30%
14%
54%
23%18%
23%
2%
DurationUntil 2015, the majority of firms overall reported the typical duration
for international assignments was 1-3 years. After dropping in 2015
from 2014 (44% vs. 59%) it remains lower for the third straight year
(47%). This year, the rest of firms are split between assignments of
less than a year (31%) and three years or longer (23%).
• Trending similarly to last year, small and mid-size firms appear to favor shorter
durations far more often than large firms (53% and 37% vs. 15%). However, use
of short assignments now outstrips standard lengths at small firms (53% vs.
31%). At large firms, short assignments are far less common than they were two
years ago (15% vs. 30%) and closer to historical norms. Overall, use of shorter
assignment types by mid-size and small firms remains roughly double or more
that of 3-4 years ago.
• Standard assignment lengths of 1-3 years are reported by 54% of large firms
and 47% of mid-size firms, far more than reported by small firms (31%).
• Usage levels of far longer durations as “typical” among mid-size and small firms
fell to roughly half of previous levels in 2015, and they remain near historical lows
for a third straight year. Also for the second straight year, around a third of large
firms report longer durations as typical, rebounding from 2015 (23%) to near
typical averages of the previous three years and roughly double the incidence
of small or mid-size firms (31% vs. 16%).
• Overall, firms estimate around five out of ten assignments were 1-3 years, over
a sixth were short-term, and roughly a fourth were permanent. Almost one
out of ten belonged to another type of assignment (commuter, rotational, etc.).
Interestingly, over half of small and mid-size firms and 39% of large firms expect
their use of short-term/temporary assignments to increase during 2017.
DestinationThe United States was again one of the year’s top international
destinations. Relocations originating in the U.S. went to many
regions, with Canada (37%), the United Kingdom (36%), Asia (31%),
Western Europe (29%) and Eastern Europe (19%) rounding out the
top six, including the U.S. (30%). The United States was again the top
region for intraregional transfers of expatriates; both immigration
to the U.S. and movement of foreign nationals within the U.S. remain
markedly higher for a third year (34%+ vs. 18% in 2013. Asia ranked
second for intraregional transfers (27%), followed closely by the
United Kingdom (25%) and Canada (25%). The United States and Asia
were top destinations for interregional transfers (35% and 35%),
followed closely by Western Europe (31%), the United Kingdom (28%),
Canada (20%) and Eastern Europe (20%). However, across all types
of international relocations, if European destinations were combined
(U.K., Eastern & Western Europe) they would eclipse all other regions.
International Assignments
Expectations for increased international relocation volume has changed dramatically over
the course of 50 years. In 1977, only 18.3% of responding firms indicated expecting to relocate
more employees overseas. In 2017, essentially half of firms expect to send more employees
on international assignments in the coming year. As companies are increasingly global in
scope and size, the need for employees to be able to transition seamlessly across borders
and interact with clients and staff from all over the world is greater than ever.
INTERNATIONAL RELOCATION EXPLODES
24
ATLAS WORLD GROUP 2017 CORPORATE RELOCATION SURVEY
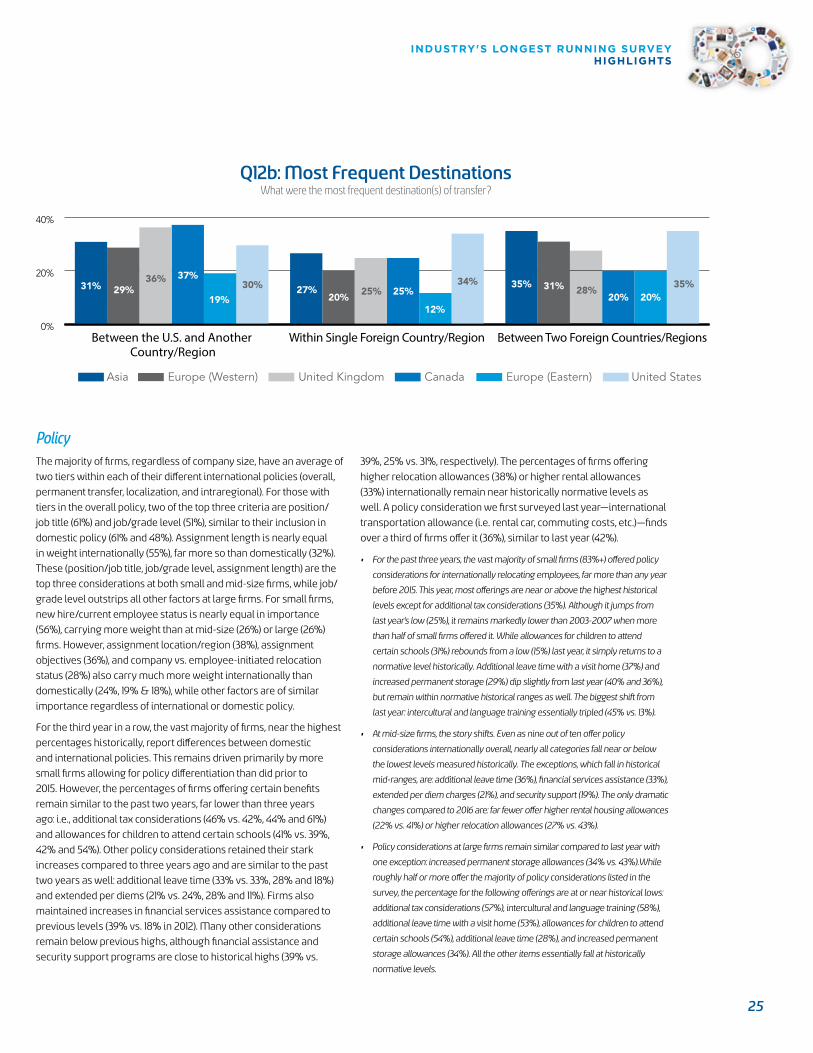
PolicyThe majority of firms, regardless of company size, have an average of
two tiers within each of their different international policies (overall,
permanent transfer, localization, and intraregional). For those with
tiers in the overall policy, two of the top three criteria are position/
job title (61%) and job/grade level (51%), similar to their inclusion in
domestic policy (61% and 48%). Assignment length is nearly equal
in weight internationally (55%), far more so than domestically (32%).
These (position/job title, job/grade level, assignment length) are the
top three considerations at both small and mid-size firms, while job/
grade level outstrips all other factors at large firms. For small firms,
new hire/current employee status is nearly equal in importance
(56%), carrying more weight than at mid-size (26%) or large (26%)
firms. However, assignment location/region (38%), assignment
objectives (36%), and company vs. employee-initiated relocation
status (28%) also carry much more weight internationally than
domestically (24%, 19% & 18%), while other factors are of similar
importance regardless of international or domestic policy.
For the third year in a row, the vast majority of firms, near the highest
percentages historically, report differences between domestic
and international policies. This remains driven primarily by more
small firms allowing for policy differentiation than did prior to
2015. However, the percentages of firms offering certain benefits
remain similar to the past two years, far lower than three years
ago: i.e., additional tax considerations (46% vs. 42%, 44% and 61%)
and allowances for children to attend certain schools (41% vs. 39%,
42% and 54%). Other policy considerations retained their stark
increases compared to three years ago and are similar to the past
two years as well: additional leave time (33% vs. 33%, 28% and 18%)
and extended per diems (21% vs. 24%, 28% and 11%). Firms also
maintained increases in financial services assistance compared to
previous levels (39% vs. 18% in 2012). Many other considerations
remain below previous highs, although financial assistance and
security support programs are close to historical highs (39% vs.
39%, 25% vs. 31%, respectively). The percentages of firms offering
higher relocation allowances (38%) or higher rental allowances
(33%) internationally remain near historically normative levels as
well. A policy consideration we first surveyed last year—international
transportation allowance (i.e. rental car, commuting costs, etc.)—finds
over a third of firms offer it (36%), similar to last year (42%).
• For the past three years, the vast majority of small firms (83%+) offered policy
considerations for internationally relocating employees, far more than any year
before 2015. This year, most offerings are near or above the highest historical
levels except for additional tax considerations (35%). Although it jumps from
last year’s low (25%), it remains markedly lower than 2003-2007 when more
than half of small firms offered it. While allowances for children to attend
certain schools (31%) rebounds from a low (15%) last year, it simply returns to a
normative level historically. Additional leave time with a visit home (37%) and
increased permanent storage (29%) dip slightly from last year (40% and 36%),
but remain within normative historical ranges as well. The biggest shift from
last year: intercultural and language training essentially tripled (45% vs. 13%).
• At mid-size firms, the story shifts. Even as nine out of ten offer policy
considerations internationally overall, nearly all categories fall near or below
the lowest levels measured historically. The exceptions, which fall in historical
mid-ranges, are: additional leave time (36%), financial services assistance (33%),
extended per diem charges (21%), and security support (19%). The only dramatic
changes compared to 2016 are: far fewer offer higher rental housing allowances
(22% vs. 41%) or higher relocation allowances (27% vs. 43%).
• Policy considerations at large firms remain similar compared to last year with
one exception: increased permanent storage allowances (34% vs. 43%).While
roughly half or more offer the majority of policy considerations listed in the
survey, the percentage for the following offerings are at or near historical lows:
additional tax considerations (57%), intercultural and language training (58%),
additional leave time with a visit home (53%), allowances for children to attend
certain schools (54%), additional leave time (28%), and increased permanent
storage allowances (34%). All the other items essentially fall at historically
normative levels.
Q12b: Most Frequent DestinationsWhat were the most frequent destination(s) of transfer?
0%
20%
40%
60%
Between Two Foreign Countries/RegionsWithin Single Foreign Country/RegionBetween the U.S. and Another Country/Region
31% 29%36% 37%
19%
30% 27%20%
25% 25%
12%
34% 35%28%
20% 20%35%
United StatesCanadaUnited KingdomEurope (Western) Europe (Eastern)Asia
31%
25
INDUSTRY'S LONGEST RUNNING SURVEY HIGHLIGHTS
OutsourcingMore than three-fourths of companies outsourced relocation
services in 2015 and 2016. These are the highest levels in more than
a decade, surpassing even the peaks in 2011 and 2014. Historically,
outsourcing remains near highs for large firms, in the higher range
for mid-size firms, and increases even further over the historic high
of 2014 (65% vs. 54%) for the second year in a row among small firms.
However, large firms outsource to a greater extent and with more
services than do mid-size or small firms.
Outsourcing for most service categories remained at levels similar to
2015 with slight increases. However, some categories saw significant
rises: real estate sales/marketing (39% vs. 28%), real estate purchase
(36% vs. 22%), and tax gross-up assistance (25% vs. 18%). These
returned to near 2013 levels (42%, 40%, and 28%) after successive
decreases in 2014 and 2015. Counseling about relocation planning &
details (34%) and counseling about company policy (29%) increased
notably from 2015 (26% and 20%), with planning & details counseling
returning to the second-highest level historically. However, even with
these shifts, outsourcing of most service categories fell between
historical lows and mid-ranges, down from the highest levels seen
in the past. As companies balance outsourcing which aspects of
relocation provide the best cost/benefit based on the needs of
employees and their in-house staff capabilities, services surrounding
certain relocation aspects may simply be less necessary, while others
are simply more likely to be handled in-house.
• Outsourcing at large firms increased dramatically for many categories
compared to 2015: real estate sales/marketing (62% vs. 40%), real estate
purchase (53% vs. 33%), relocation planning & details counseling (47% vs.
30%), company policy counseling (42% vs. 25%), orientation tours at new
location (47% vs. 28%), expense management/tracking/reimbursement
(47% vs. 32%), tax gross-up assistance (41% vs. 23%), and claims
preparation and submission assistance (32% vs. 21%). However, even with
these increases, outsourcing across these categories trends lower than
historical highs and mid-ranges. All other categories remain similar to
2015, either at lows or near the lower mid-ranges historically.
• At mid-size firms, outsourcing across nearly all categories stayed about
the same or decreased slightly from 2015; the exceptions were real estate
purchase (32% vs. 23%) and company policy counseling (29% vs. 21%),
which saw marked increases. Despite these increases, outsourcing runs
near or at the lowest levels historically across most categories, indicating
that mid-size firms are becoming more selective as to which services they
outsource.
• Among small firms, most outsourcing categories increased from 2015. The
most dramatic were real estate sales/marketing (26% vs. 15%), real estate
purchase (26% vs. 11%), relocation planning & details counseling (24% vs.
16%), and property management (18% vs. 10%). Mid-size firms appear to
be outsourcing less while small firms appear to be outsourcing more, with
their rates across categories becoming more similar. Overall, outsourcing
levels for small firms were at or near the highest historical levels for nearly
all categories.
InternationalSimilar to the previous three years, far more firms outsourced
internationally in 2016 than did overall (84% vs. 77%). International
outsourcing remains at historic highs. It is used heavily across firms
of all sizes, although large firms outsource a greater variety of
services than mid-size and small firms do.
• International outsourcing saw increases across most service categories
compared to 2015, with levels falling in the historical mid-range or higher.
The five areas which saw the greatest increases are: contract of household
goods carrier (44% vs. 32%), destination services/orientation tours (43% vs.
28%), arrangement of family’s temporary accommodations (42% vs. 27%),
coordination and monitoring of international shipment (41% vs. 28%), and
arrangement of family’s international transportation (31% vs. 22%).
• Similar to domestic trends, outsourcing across categories for small and large
firms mostly increased from 2015. Mid-size firms saw either declines or stability
across categories with one exception: far more outsourced destination services/
orientation tours (30% vs. 18%).
Among companies that outsourced relocation services domestically,
the percentage that also outsourced internationally is the second-
highest historically (95%), just under the record set in 2014 (98%).
For the third straight year, firms that outsource domestic services
and relocate internationally almost universally outsource services
abroad. Large firms continue to be the most active for outsourcing
internationally: around a third or more did so across all survey
categories.
26
ATLAS WORLD GROUP 2017 CORPORATE RELOCATION SURVEY
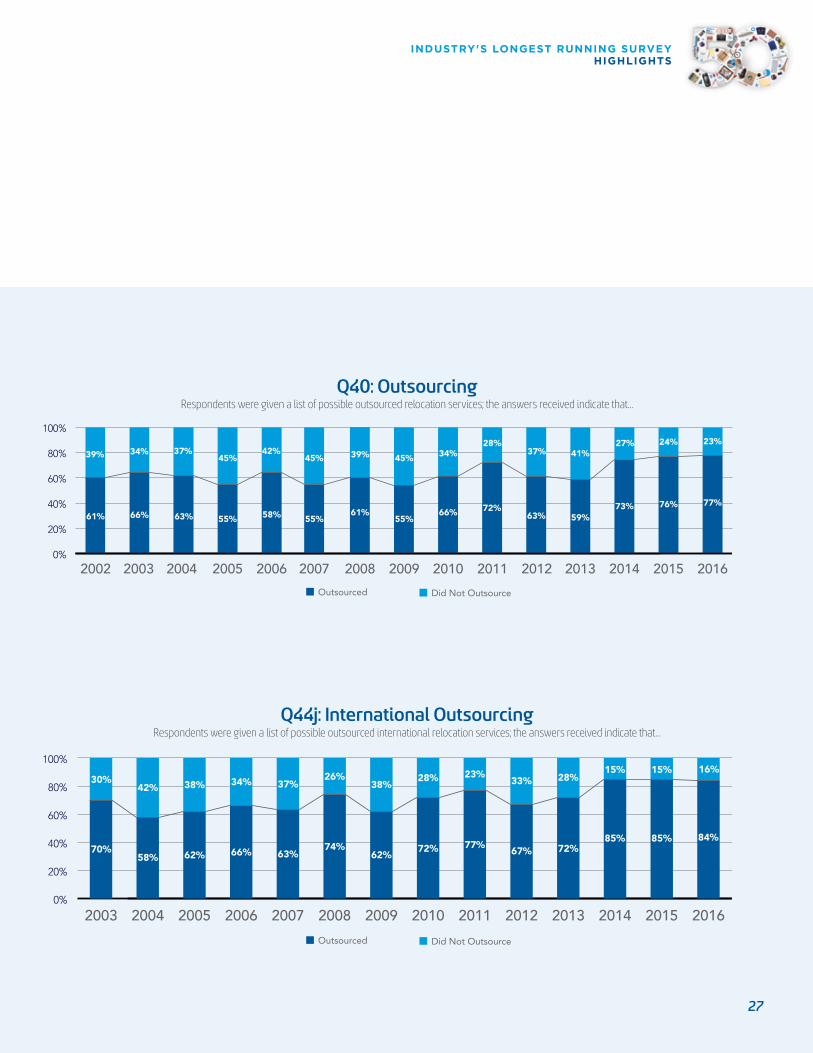
Q40: OutsourcingRespondents were given a list of possible outsourced relocation services; the answers received indicate that…
Did Not OutsourceOutsourced
0%
20%
40%
60%
80%
100%
2014201320122011201020092008200720062005200420032002 2015
42%61%
39%
66%
34%
63%
37%
55%
45%
58%
42%45%
55%55%
45%
61%
39%
55%
45%
66%
34%
72%
28%
63%
37%
59%
41%
73%
27%
76%
24%
2016
77%
23%
Q44j: International OutsourcingRespondents were given a list of possible outsourced international relocation services; the answers received indicate that…
Did Not Outsource
Outsourced
0%
20%
40%
60%
80%
100%
20162015201420132012201120102009200820072006200520042003
30%
70%
38%
62%
42%
58%
38%
62%
28%
72%
34%
66%
26%
74%
28%
72%
37%
63%
23%
77%
15%
85%
15%
85%
16%
84%
33%
67%
Did Not OutsourceOutsourced
0%
20%
40%
60%
80%
100%
2014201320122011201020092008200720062005200420032002 2015
42%61%
39%
66%
34%
63%
37%
55%
45%
58%
42%45%
55%55%
45%
61%
39%
55%
45%
66%
34%
72%
28%
63%
37%
59%
41%
73%
27%
76%
24%
2016
77%
23%
Did Not OutsourceOutsourced
0%
20%
40%
60%
80%
100%
2014201320122011201020092008200720062005200420032002 2015
42%61%
39%
66%
34%
63%
37%
55%
45%
58%
42%45%
55%55%
45%
61%
39%
55%
45%
66%
34%
72%
28%
63%
37%
59%
41%
73%
27%
76%
24%
2016
77%
23%
27
INDUSTRY'S LONGEST RUNNING SURVEY HIGHLIGHTS

• 225 human resource/relocation professionals:
-Work in human resources/personnel or relocation/mobility
services departments (91%)
-Work for firms that relocate employees between countries (87%)
• For analysis, firms are categorized by size:
- Small: Fewer than 500 salaried employees (18%)
- Mid-size: 500-4,999 salaried employees (37%)
- Large: 5,000+ salaried employees (45%)
More Relocations Last Year, Further Increase Expected in 2017In 2016, essentially half of international firms saw relocation volumes
increase overall and internationally. Few firms saw any volume
decreases. Expectations for 2017 are for more of the same with
roughly half expecting further increases overall and internationally.
Budgets Continue ReboundingIn 2016, half of international firms said relocation budgets increased
and around half believe budgets will increase again in 2017.
Factors Impacting Relocation VolumesExpansion efforts (47%), lack of local talent (44%), and company
growth (43%) were by far the factors international firms cited
most often as affecting relocation volumes last year.
Declined RelocationsSimilar to overall trends, the majority (69%) of international firms said
employees declined relocation last year; the top two reasons were
family issues/ties (74%) and spouse/partner employment (59%).
The majority offer spouse/partner employment assistance (68%)
and assistance with child care (67%), while nearly half (47%) offer
elder care assistance. These percentages are in line with general
survey trends.
Employee Status Impacts ReimbursementSimilar to overall trends, international firms are less likely to offer
full reimbursement for new hires (47%) compared to transferees
(72%). Partial and full reimbursement are equally likely for new
hires (45% & 47%), who are most likely to receive lump sums (55%).
For transferees, full reimbursement is most likely (72%), followed
by lump sums (59%) and partial reimbursement (44%).
Mobility Strategy & Assignment DiversityNearly all firms (92%) follow a formal, global-mobility policy.
Seventy-seven percent use alternative assignments of some kind
to meet strategic business goals (43%) and to answer employee
requests (40%), among other reasons. Additionally, 78% of firms
follow a formal, short-term/temporary assignment policy; 59% use
an extended business travel policy; and 44% maintain a policy for
long-distance commuters. Long-term or “permanent” relocations
are in the mix as well: over a fifth of international relocations were
permanent transfers. Many firms have formal policies covering
permanent transfers (73%) and localization (65%) also.
SnapshotINTERNATIONAL
28
ATLAS WORLD GROUP 2017 CORPORATE RELOCATION SURVEY
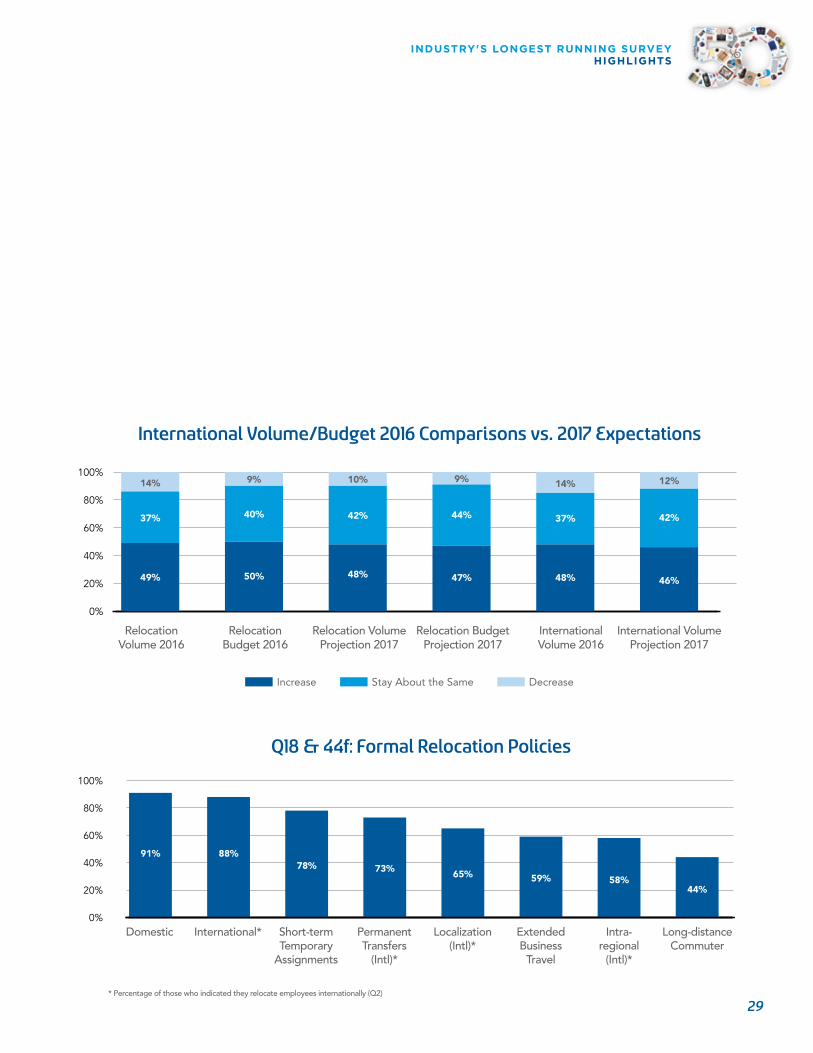
0%
20%
40%
60%
80%
100%
RelocationVolume 2016
RelocationBudget 2016
Relocation VolumeProjection 2017
Relocation BudgetProjection 2017
International VolumeProjection 2017
InternationalVolume 2016
47%
44%
9%
48%
37%
14%
46%
42%
12%
42%
48%
10%9%
50%
40%
14%
49%
37%
Increase Stay About the Same Decrease
0%
20%
40%
60%
80%
100%
Domestic International* Short-termTemporary
Assignments
PermanentTransfers
(Intl)*
Localization(Intl)*
ExtendedBusiness
Travel
Long-distanceCommuter
Intra-regional
(Intl)*
91% 88%78% 73% 65% 59% 58%
44%
* Percentage of those who indicated they relocate employees internationally (Q2)
International Volume/Budget 2016 Comparisons vs. 2017 Expectations
Q18 & 44f: Formal Relocation Policies
29
INDUSTRY'S LONGEST RUNNING SURVEY HIGHLIGHTS

SURVEY
Responses
For further details and graphical representations of all the data contained in this report, please go to http://www.atlasvanlines.com/survey
The following information is based upon the findings of Atlas ® World
Group’s 50th Annual Survey of Corporate Relocation Policies conducted
from January 14 through February 23, 2017 via the Internet. This year, 471
online questionnaires were completed. Unless otherwise noted, all data
refers to domestic relocations occurring in 2016. Multiple choice questions
add to 100% (+/– 1%) due to rounding, unless otherwise noted. Other
questions totaling above 100% are due to multiple responses.
Complete findings are as follows:
30
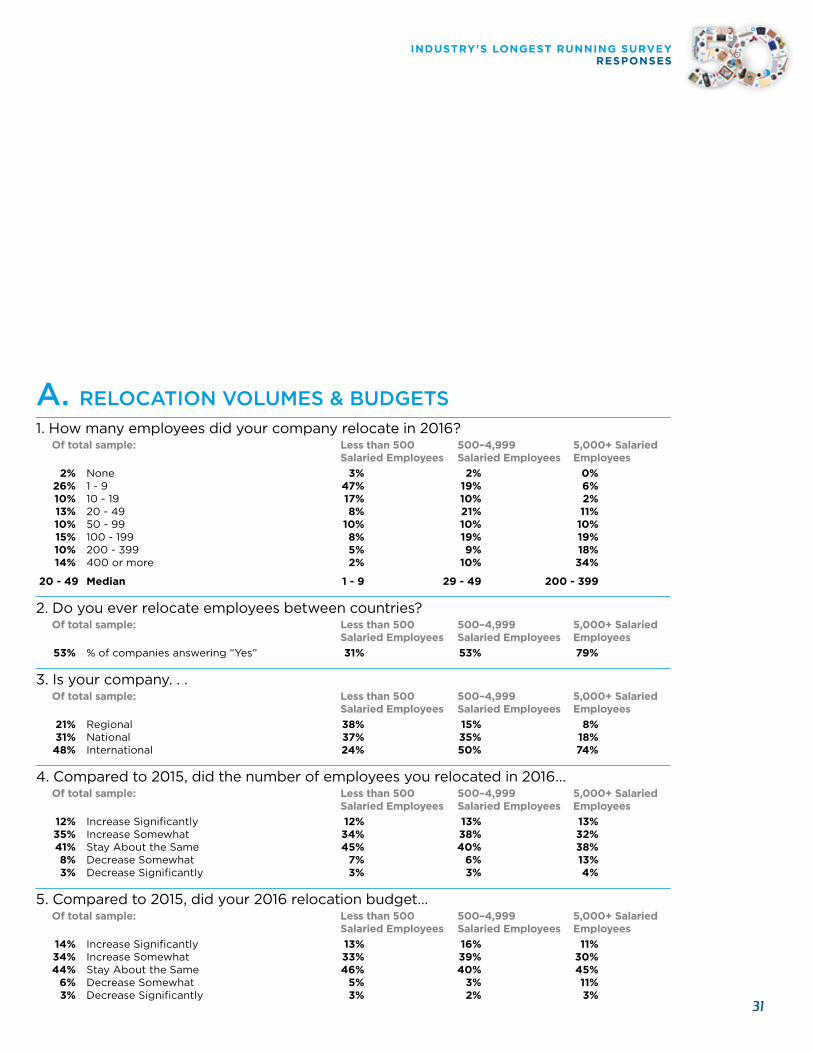
A. RELOCATION VOLUMES & BUDGETS1. How many employees did your company relocate in 2016? Of total sample: Less than 500 500–4,999 5,000+ Salaried Salaried Employees Salaried Employees Employees 2% None 3% 2% 0% 26% 1 - 9 47% 19% 6% 10% 10 - 19 17% 10% 2% 13% 20 - 49 8% 21% 11% 10% 50 - 99 10% 10% 10% 15% 100 - 199 8% 19% 19% 10% 200 - 399 5% 9% 18% 14% 400 or more 2% 10% 34%
20 - 49 Median 1 - 9 29 - 49 200 - 399
2. Do you ever relocate employees between countries? Of total sample: Less than 500 500–4,999 5,000+ Salaried Salaried Employees Salaried Employees Employees 53% % of companies answering “Yes” 31% 53% 79%
3. Is your company. . . Of total sample: Less than 500 500–4,999 5,000+ Salaried Salaried Employees Salaried Employees Employees 21% Regional 38% 15% 8% 31% National 37% 35% 18% 48% International 24% 50% 74%
4. Compared to 2015, did the number of employees you relocated in 2016… Of total sample: Less than 500 500–4,999 5,000+ Salaried Salaried Employees Salaried Employees Employees 12% Increase Significantly 12% 13% 13% 35% Increase Somewhat 34% 38% 32% 41% Stay About the Same 45% 40% 38% 8% Decrease Somewhat 7% 6% 13% 3% Decrease Significantly 3% 3% 4%
5. Compared to 2015, did your 2016 relocation budget… Of total sample: Less than 500 500–4,999 5,000+ Salaried Salaried Employees Salaried Employees Employees 14% Increase Significantly 13% 16% 11% 34% Increase Somewhat 33% 39% 30% 44% Stay About the Same 46% 40% 45% 6% Decrease Somewhat 5% 3% 11% 3% Decrease Significantly 3% 2% 3%
31
INDUSTRY'S LONGEST RUNNING SURVEY RESPONSES
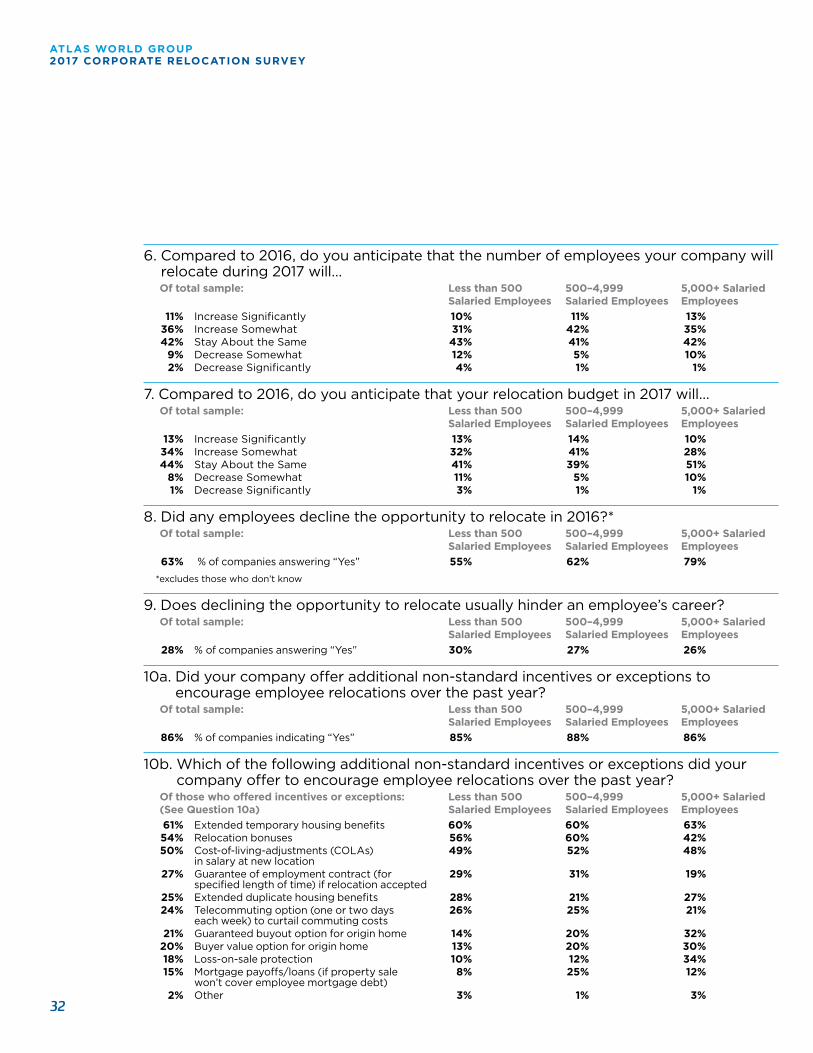
6. Compared to 2016, do you anticipate that the number of employees your company will relocate during 2017 will…
Of total sample: Less than 500 500–4,999 5,000+ Salaried Salaried Employees Salaried Employees Employees 11% Increase Significantly 10% 11% 13% 36% Increase Somewhat 31% 42% 35% 42% Stay About the Same 43% 41% 42% 9% Decrease Somewhat 12% 5% 10% 2% Decrease Significantly 4% 1% 1%
7. Compared to 2016, do you anticipate that your relocation budget in 2017 will… Of total sample: Less than 500 500–4,999 5,000+ Salaried Salaried Employees Salaried Employees Employees 13% Increase Significantly 13% 14% 10% 34% Increase Somewhat 32% 41% 28% 44% Stay About the Same 41% 39% 51% 8% Decrease Somewhat 11% 5% 10% 1% Decrease Significantly 3% 1% 1%
8. Did any employees decline the opportunity to relocate in 2016?* Of total sample: Less than 500 500–4,999 5,000+ Salaried Salaried Employees Salaried Employees Employees 63% % of companies answering “Yes” 55% 62% 79%
*excludes those who don’t know
9. Does declining the opportunity to relocate usually hinder an employee’s career? Of total sample: Less than 500 500–4,999 5,000+ Salaried Salaried Employees Salaried Employees Employees 28% % of companies answering “Yes” 30% 27% 26%
10a. Did your company offer additional non-standard incentives or exceptions to encourage employee relocations over the past year?
Of total sample: Less than 500 500–4,999 5,000+ Salaried Salaried Employees Salaried Employees Employees 86% % of companies indicating “Yes” 85% 88% 86%
10b. Which of the following additional non-standard incentives or exceptions did your company offer to encourage employee relocations over the past year?
Of those who offered incentives or exceptions: Less than 500 500–4,999 5,000+ Salaried (See Question 10a) Salaried Employees Salaried Employees Employees 61% Extended temporary housing benefits 60% 60% 63% 54% Relocation bonuses 56% 60% 42% 50% Cost-of-living-adjustments (COLAs) 49% 52% 48% in salary at new location 27% Guarantee of employment contract (for 29% 31% 19% specified length of time) if relocation accepted 25% Extended duplicate housing benefits 28% 21% 27% 24% Telecommuting option (one or two days 26% 25% 21% each week) to curtail commuting costs 21% Guaranteed buyout option for origin home 14% 20% 32% 20% Buyer value option for origin home 13% 20% 30% 18% Loss-on-sale protection 10% 12% 34% 15% Mortgage payoffs/loans (if property sale 8% 25% 12% won’t cover employee mortgage debt) 2% Other 3% 1% 3%
32
ATLAS WORLD GROUP 2017 CORPORATE RELOCATION SURVEY
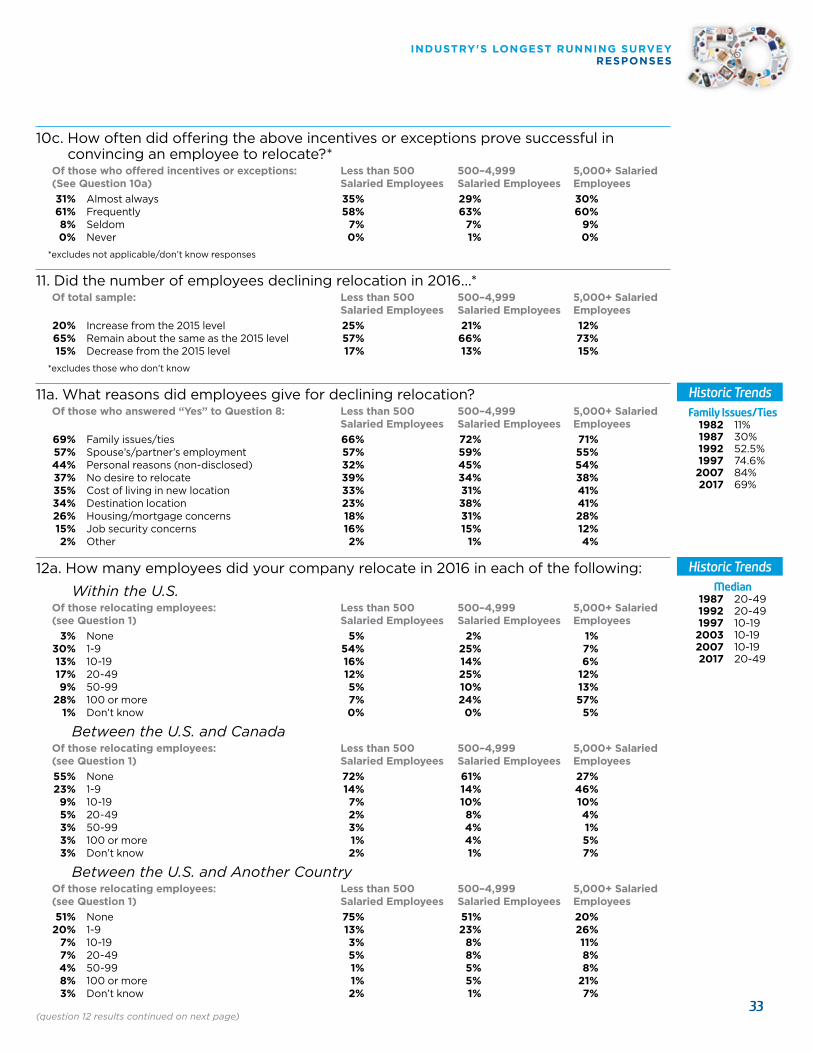
10c. How often did offering the above incentives or exceptions prove successful in convincing an employee to relocate?*
Of those who offered incentives or exceptions: Less than 500 500–4,999 5,000+ Salaried (See Question 10a) Salaried Employees Salaried Employees Employees 31% Almost always 35% 29% 30% 61% Frequently 58% 63% 60% 8% Seldom 7% 7% 9% 0% Never 0% 1% 0%
*excludes not applicable/don’t know responses
11. Did the number of employees declining relocation in 2016...* Of total sample: Less than 500 500–4,999 5,000+ Salaried Salaried Employees Salaried Employees Employees 20% Increase from the 2015 level 25% 21% 12% 65% Remain about the same as the 2015 level 57% 66% 73% 15% Decrease from the 2015 level 17% 13% 15%
*excludes those who don’t know
11a. What reasons did employees give for declining relocation? Of those who answered “Yes” to Question 8: Less than 500 500–4,999 5,000+ Salaried Salaried Employees Salaried Employees Employees 69% Family issues/ties 66% 72% 71% 57% Spouse’s/partner’s employment 57% 59% 55% 44% Personal reasons (non-disclosed) 32% 45% 54% 37% No desire to relocate 39% 34% 38% 35% Cost of living in new location 33% 31% 41% 34% Destination location 23% 38% 41% 26% Housing/mortgage concerns 18% 31% 28% 15% Job security concerns 16% 15% 12% 2% Other 2% 1% 4%
12a. How many employees did your company relocate in 2016 in each of the following:
Within the U.S. Of those relocating employees: Less than 500 500–4,999 5,000+ Salaried (see Question 1) Salaried Employees Salaried Employees Employees 3% None 5% 2% 1% 30% 1-9 54% 25% 7% 13% 10-19 16% 14% 6% 17% 20-49 12% 25% 12% 9% 50-99 5% 10% 13% 28% 100 or more 7% 24% 57% 1% Don’t know 0% 0% 5%
Between the U.S. and Canada Of those relocating employees: Less than 500 500–4,999 5,000+ Salaried (see Question 1) Salaried Employees Salaried Employees Employees 55% None 72% 61% 27% 23% 1-9 14% 14% 46% 9% 10-19 7% 10% 10% 5% 20-49 2% 8% 4% 3% 50-99 3% 4% 1% 3% 100 or more 1% 4% 5% 3% Don’t know 2% 1% 7%
Between the U.S. and Another Country Of those relocating employees: Less than 500 500–4,999 5,000+ Salaried (see Question 1) Salaried Employees Salaried Employees Employees 51% None 75% 51% 20% 20% 1-9 13% 23% 26% 7% 10-19 3% 8% 11% 7% 20-49 5% 8% 8% 4% 50-99 1% 5% 8% 8% 100 or more 1% 5% 21% 3% Don’t know 2% 1% 7%
(question 12 results continued on next page)
Historic Trends Median
1987 20-49 1992 20-49 1997 10-19 2003 10-19 2007 10-19 2017 20-49
Historic Trends Family Issues/Ties
1982 11% 1987 30% 1992 52.5% 1997 74.6% 2007 84% 2017 69%
INDUSTRY'S LONGEST RUNNING SURVEY RESPONSES
33
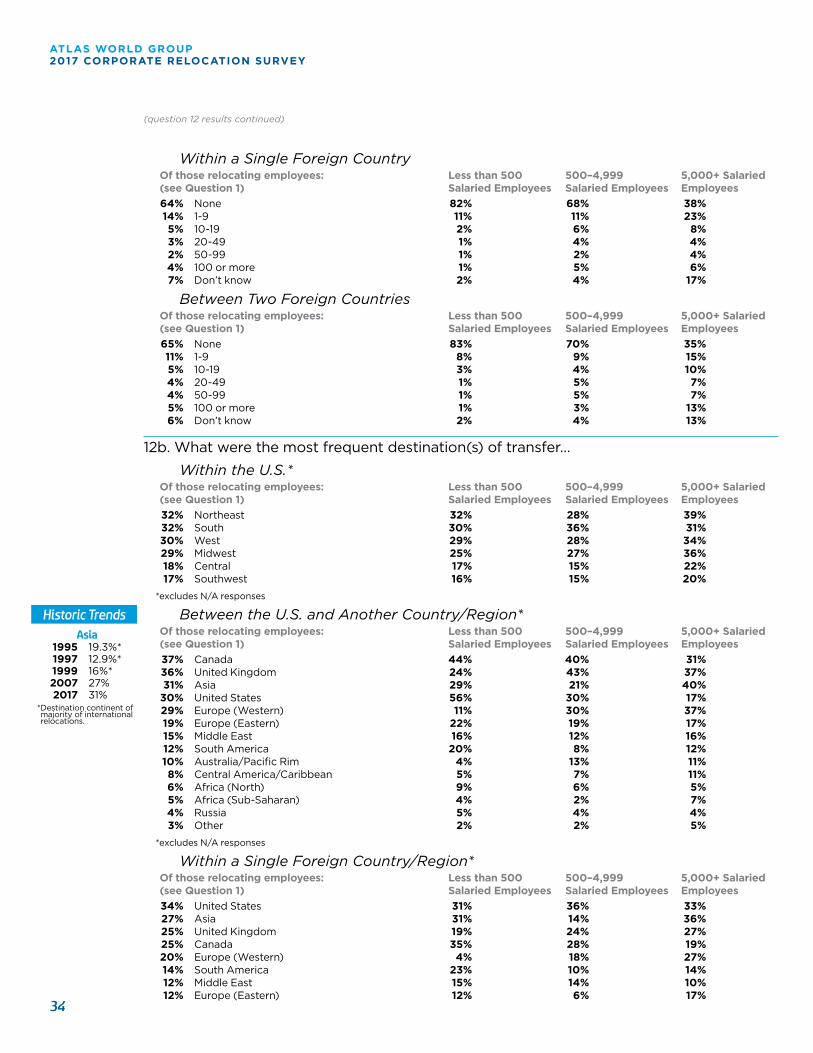
Within a Single Foreign Country
Of those relocating employees: Less than 500 500–4,999 5,000+ Salaried (see Question 1) Salaried Employees Salaried Employees Employees 64% None 82% 68% 38% 14% 1-9 11% 11% 23% 5% 10-19 2% 6% 8% 3% 20-49 1% 4% 4% 2% 50-99 1% 2% 4% 4% 100 or more 1% 5% 6% 7% Don’t know 2% 4% 17%
Between Two Foreign Countries Of those relocating employees: Less than 500 500–4,999 5,000+ Salaried (see Question 1) Salaried Employees Salaried Employees Employees 65% None 83% 70% 35% 11% 1-9 8% 9% 15% 5% 10-19 3% 4% 10% 4% 20-49 1% 5% 7% 4% 50-99 1% 5% 7% 5% 100 or more 1% 3% 13% 6% Don’t know 2% 4% 13%
12b. What were the most frequent destination(s) of transfer…
Within the U.S.* Of those relocating employees: Less than 500 500–4,999 5,000+ Salaried (see Question 1) Salaried Employees Salaried Employees Employees 32% Northeast 32% 28% 39% 32% South 30% 36% 31% 30% West 29% 28% 34% 29% Midwest 25% 27% 36% 18% Central 17% 15% 22% 17% Southwest 16% 15% 20%
*excludes N/A responses
Between the U.S. and Another Country/Region* Of those relocating employees: Less than 500 500–4,999 5,000+ Salaried (see Question 1) Salaried Employees Salaried Employees Employees 37% Canada 44% 40% 31% 36% United Kingdom 24% 43% 37% 31% Asia 29% 21% 40% 30% United States 56% 30% 17% 29% Europe (Western) 11% 30% 37% 19% Europe (Eastern) 22% 19% 17% 15% Middle East 16% 12% 16% 12% South America 20% 8% 12% 10% Australia/Pacific Rim 4% 13% 11% 8% Central America/Caribbean 5% 7% 11% 6% Africa (North) 9% 6% 5% 5% Africa (Sub-Saharan) 4% 2% 7% 4% Russia 5% 4% 4% 3% Other 2% 2% 5%
*excludes N/A responses
Within a Single Foreign Country/Region* Of those relocating employees: Less than 500 500–4,999 5,000+ Salaried (see Question 1) Salaried Employees Salaried Employees Employees 34% United States 31% 36% 33% 27% Asia 31% 14% 36% 25% United Kingdom 19% 24% 27% 25% Canada 35% 28% 19% 20% Europe (Western) 4% 18% 27% 14% South America 23% 10% 14% 12% Middle East 15% 14% 10% 12% Europe (Eastern) 12% 6% 17%
(question 12 results continued)
Historic Trends Asia
1995 19.3%* 1997 12.9%* 1999 16%* 2007 27% 2017 31%* Destination continent of majority of international relocations.
34
ATLAS WORLD GROUP 2017 CORPORATE RELOCATION SURVEY
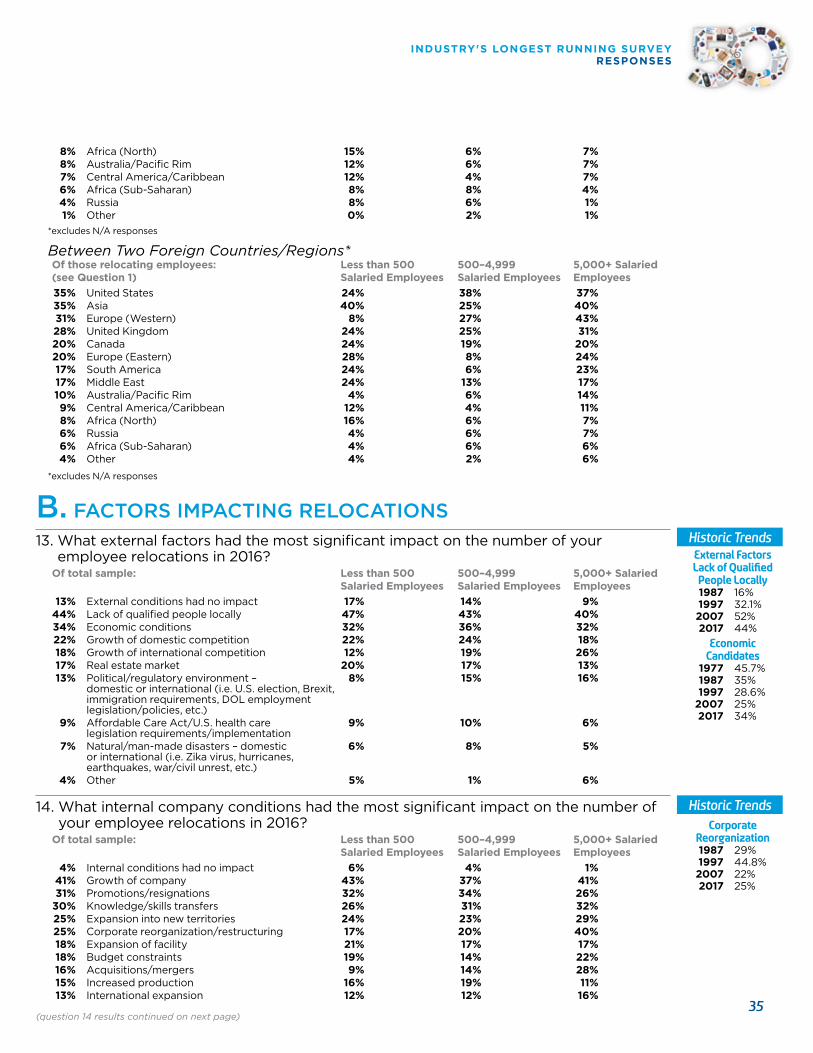
8% Africa (North) 15% 6% 7% 8% Australia/Pacific Rim 12% 6% 7% 7% Central America/Caribbean 12% 4% 7% 6% Africa (Sub-Saharan) 8% 8% 4% 4% Russia 8% 6% 1% 1% Other 0% 2% 1%
*excludes N/A responses
Between Two Foreign Countries/Regions* Of those relocating employees: Less than 500 500–4,999 5,000+ Salaried
(see Question 1) Salaried Employees Salaried Employees Employees 35% United States 24% 38% 37% 35% Asia 40% 25% 40% 31% Europe (Western) 8% 27% 43% 28% United Kingdom 24% 25% 31% 20% Canada 24% 19% 20% 20% Europe (Eastern) 28% 8% 24% 17% South America 24% 6% 23% 17% Middle East 24% 13% 17% 10% Australia/Pacific Rim 4% 6% 14% 9% Central America/Caribbean 12% 4% 11% 8% Africa (North) 16% 6% 7% 6% Russia 4% 6% 7% 6% Africa (Sub-Saharan) 4% 6% 6% 4% Other 4% 2% 6%
*excludes N/A responses
B. FACTORS IMPACTING RELOCATIONS13. What external factors had the most significant impact on the number of your
employee relocations in 2016? Of total sample: Less than 500 500–4,999 5,000+ Salaried Salaried Employees Salaried Employees Employees 13% External conditions had no impact 17% 14% 9% 44% Lack of qualified people locally 47% 43% 40% 34% Economic conditions 32% 36% 32% 22% Growth of domestic competition 22% 24% 18% 18% Growth of international competition 12% 19% 26% 17% Real estate market 20% 17% 13% 13% Political/regulatory environment – 8% 15% 16%
domestic or international (i.e. U.S. election, Brexit, immigration requirements, DOL employment legislation/policies, etc.) 9% Affordable Care Act/U.S. health care 9% 10% 6%
legislation requirements/implementation 7% Natural/man-made disasters – domestic 6% 8% 5%
or international (i.e. Zika virus, hurricanes, earthquakes, war/civil unrest, etc.) 4% Other 5% 1% 6%
14. What internal company conditions had the most significant impact on the number of your employee relocations in 2016?
Of total sample: Less than 500 500–4,999 5,000+ Salaried Salaried Employees Salaried Employees Employees 4% Internal conditions had no impact 6% 4% 1% 41% Growth of company 43% 37% 41% 31% Promotions/resignations 32% 34% 26% 30% Knowledge/skills transfers 26% 31% 32% 25% Expansion into new territories 24% 23% 29% 25% Corporate reorganization/restructuring 17% 20% 40% 18% Expansion of facility 21% 17% 17% 18% Budget constraints 19% 14% 22% 16% Acquisitions/mergers 9% 14% 28% 15% Increased production 16% 19% 11% 13% International expansion 12% 12% 16%
(question 14 results continued on next page)
Historic Trends Corporate
Reorganization 1987 29% 1997 44.8% 2007 22% 2017 25%
Historic Trends External Factors Lack of Qualified
People Locally 1987 16% 1997 32.1% 2007 52% 2017 44%
Economic Candidates
1977 45.7% 1987 35% 1997 28.6% 2007 25% 2017 34%
INDUSTRY'S LONGEST RUNNING SURVEY RESPONSES
35
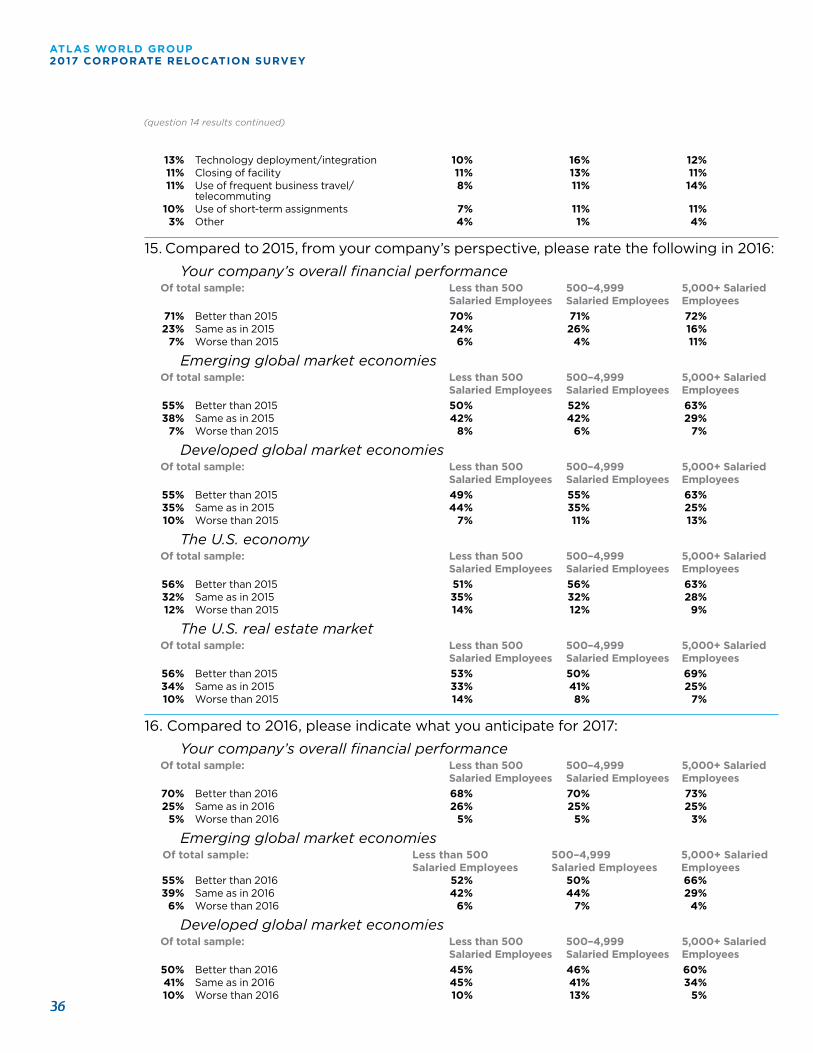
13% Technology deployment/integration 10% 16% 12% 11% Closing of facility 11% 13% 11% 11% Use of frequent business travel/ 8% 11% 14% telecommuting 10% Use of short-term assignments 7% 11% 11% 3% Other 4% 1% 4%
15. Compared to 2015, from your company’s perspective, please rate the following in 2016:
Your company’s overall financial performance Of total sample: Less than 500 500–4,999 5,000+ Salaried Salaried Employees Salaried Employees Employees 71% Better than 2015 70% 71% 72% 23% Same as in 2015 24% 26% 16% 7% Worse than 2015 6% 4% 11%
Emerging global market economies Of total sample: Less than 500 500–4,999 5,000+ Salaried Salaried Employees Salaried Employees Employees 55% Better than 2015 50% 52% 63% 38% Same as in 2015 42% 42% 29% 7% Worse than 2015 8% 6% 7%
Developed global market economies Of total sample: Less than 500 500–4,999 5,000+ Salaried Salaried Employees Salaried Employees Employees 55% Better than 2015 49% 55% 63% 35% Same as in 2015 44% 35% 25% 10% Worse than 2015 7% 11% 13%
The U.S. economy Of total sample: Less than 500 500–4,999 5,000+ Salaried Salaried Employees Salaried Employees Employees 56% Better than 2015 51% 56% 63% 32% Same as in 2015 35% 32% 28% 12% Worse than 2015 14% 12% 9%
The U.S. real estate market Of total sample: Less than 500 500–4,999 5,000+ Salaried Salaried Employees Salaried Employees Employees 56% Better than 2015 53% 50% 69% 34% Same as in 2015 33% 41% 25% 10% Worse than 2015 14% 8% 7%
16. Compared to 2016, please indicate what you anticipate for 2017:
Your company’s overall financial performance Of total sample: Less than 500 500–4,999 5,000+ Salaried Salaried Employees Salaried Employees Employees 70% Better than 2016 68% 70% 73% 25% Same as in 2016 26% 25% 25% 5% Worse than 2016 5% 5% 3%
Emerging global market economies Of total sample: Less than 500 500–4,999 5,000+ Salaried Salaried Employees Salaried Employees Employees 55% Better than 2016 52% 50% 66% 39% Same as in 2016 42% 44% 29% 6% Worse than 2016 6% 7% 4%
Developed global market economies Of total sample: Less than 500 500–4,999 5,000+ Salaried Salaried Employees Salaried Employees Employees 50% Better than 2016 45% 46% 60% 41% Same as in 2016 45% 41% 34% 10% Worse than 2016 10% 13% 5%
(question 14 results continued)
36
ATLAS WORLD GROUP 2017 CORPORATE RELOCATION SURVEY
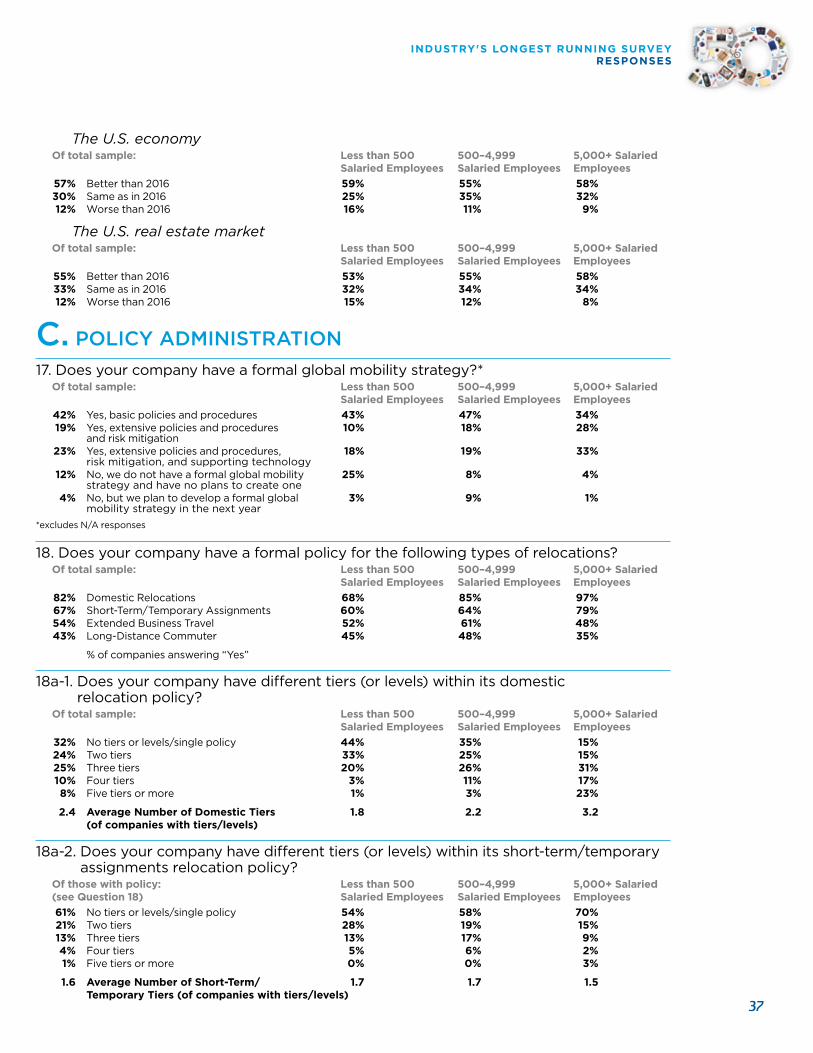
The U.S. economy Of total sample: Less than 500 500–4,999 5,000+ Salaried Salaried Employees Salaried Employees Employees 57% Better than 2016 59% 55% 58% 30% Same as in 2016 25% 35% 32% 12% Worse than 2016 16% 11% 9%
The U.S. real estate market Of total sample: Less than 500 500–4,999 5,000+ Salaried Salaried Employees Salaried Employees Employees 55% Better than 2016 53% 55% 58% 33% Same as in 2016 32% 34% 34% 12% Worse than 2016 15% 12% 8%
C. POLICY ADMINISTRATION17. Does your company have a formal global mobility strategy?* Of total sample: Less than 500 500–4,999 5,000+ Salaried Salaried Employees Salaried Employees Employees 42% Yes, basic policies and procedures 43% 47% 34% 19% Yes, extensive policies and procedures 10% 18% 28% and risk mitigation 23% Yes, extensive policies and procedures, 18% 19% 33% risk mitigation, and supporting technology 12% No, we do not have a formal global mobility 25% 8% 4% strategy and have no plans to create one 4% No, but we plan to develop a formal global 3% 9% 1% mobility strategy in the next year *excludes N/A responses
18. Does your company have a formal policy for the following types of relocations? Of total sample: Less than 500 500–4,999 5,000+ Salaried Salaried Employees Salaried Employees Employees 82% Domestic Relocations 68% 85% 97% 67% Short-Term/Temporary Assignments 60% 64% 79% 54% Extended Business Travel 52% 61% 48% 43% Long-Distance Commuter 45% 48% 35%
% of companies answering “Yes”
18a-1. Does your company have different tiers (or levels) within its domestic relocation policy?
Of total sample: Less than 500 500–4,999 5,000+ Salaried Salaried Employees Salaried Employees Employees 32% No tiers or levels/single policy 44% 35% 15% 24% Two tiers 33% 25% 15% 25% Three tiers 20% 26% 31% 10% Four tiers 3% 11% 17% 8% Five tiers or more 1% 3% 23%
2.4 Average Number of Domestic Tiers 1.8 2.2 3.2 (of companies with tiers/levels)
18a-2. Does your company have different tiers (or levels) within its short-term/temporary assignments relocation policy?
Of those with policy: Less than 500 500–4,999 5,000+ Salaried (see Question 18) Salaried Employees Salaried Employees Employees 61% No tiers or levels/single policy 54% 58% 70% 21% Two tiers 28% 19% 15% 13% Three tiers 13% 17% 9% 4% Four tiers 5% 6% 2% 1% Five tiers or more 0% 0% 3%
1.6 Average Number of Short-Term/ 1.7 1.7 1.5 Temporary Tiers (of companies with tiers/levels)
INDUSTRY'S LONGEST RUNNING SURVEY RESPONSES
37
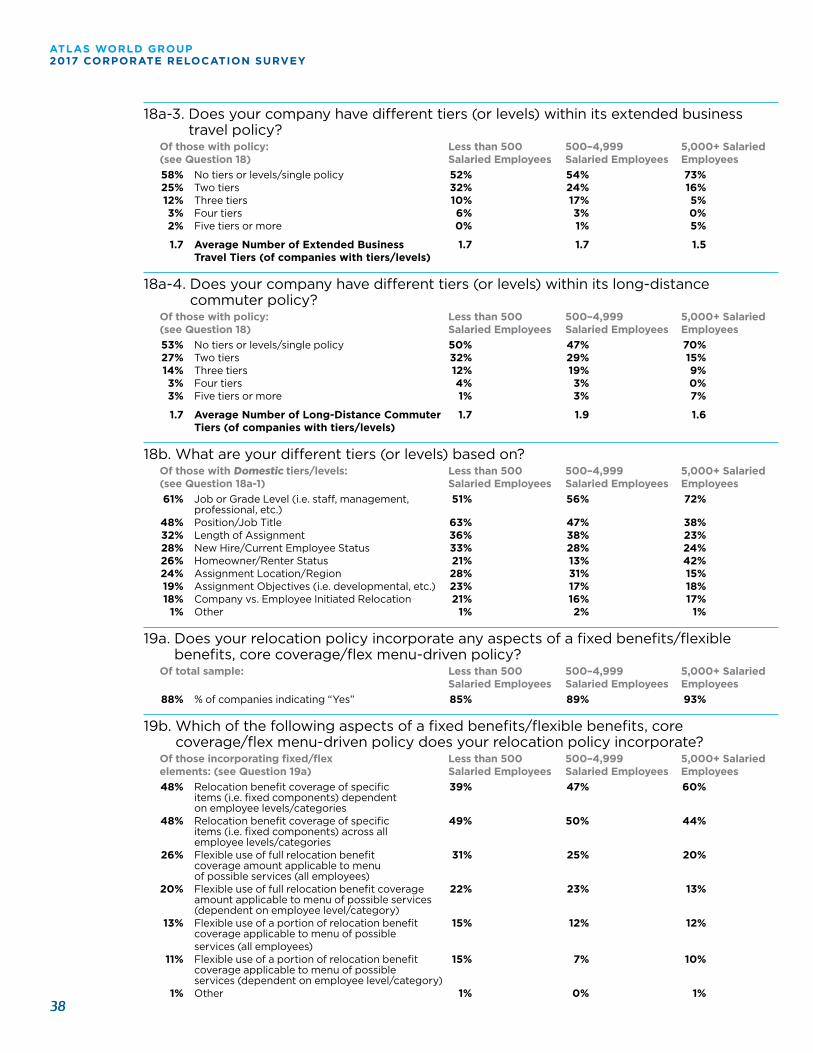
18a-3. Does your company have different tiers (or levels) within its extended business travel policy?
Of those with policy: Less than 500 500–4,999 5,000+ Salaried (see Question 18) Salaried Employees Salaried Employees Employees 58% No tiers or levels/single policy 52% 54% 73% 25% Two tiers 32% 24% 16% 12% Three tiers 10% 17% 5% 3% Four tiers 6% 3% 0% 2% Five tiers or more 0% 1% 5%
1.7 Average Number of Extended Business 1.7 1.7 1.5 Travel Tiers (of companies with tiers/levels)
18a-4. Does your company have different tiers (or levels) within its long-distance commuter policy?
Of those with policy: Less than 500 500–4,999 5,000+ Salaried (see Question 18) Salaried Employees Salaried Employees Employees 53% No tiers or levels/single policy 50% 47% 70% 27% Two tiers 32% 29% 15% 14% Three tiers 12% 19% 9% 3% Four tiers 4% 3% 0% 3% Five tiers or more 1% 3% 7%
1.7 Average Number of Long-Distance Commuter 1.7 1.9 1.6 Tiers (of companies with tiers/levels)
18b. What are your different tiers (or levels) based on? Of those with Domestic tiers/levels: Less than 500 500–4,999 5,000+ Salaried (see Question 18a-1) Salaried Employees Salaried Employees Employees 61% Job or Grade Level (i.e. staff, management, 51% 56% 72%
professional, etc.) 48% Position/Job Title 63% 47% 38% 32% Length of Assignment 36% 38% 23% 28% New Hire/Current Employee Status 33% 28% 24% 26% Homeowner/Renter Status 21% 13% 42% 24% Assignment Location/Region 28% 31% 15% 19% Assignment Objectives (i.e. developmental, etc.) 23% 17% 18% 18% Company vs. Employee Initiated Relocation 21% 16% 17% 1% Other 1% 2% 1%
19a. Does your relocation policy incorporate any aspects of a fixed benefits/flexible benefits, core coverage/flex menu-driven policy?
Of total sample: Less than 500 500–4,999 5,000+ Salaried Salaried Employees Salaried Employees Employees 88% % of companies indicating “Yes” 85% 89% 93%
19b. Which of the following aspects of a fixed benefits/flexible benefits, core coverage/flex menu-driven policy does your relocation policy incorporate?
Of those incorporating fixed/flex Less than 500 500–4,999 5,000+ Salaried elements: (see Question 19a) Salaried Employees Salaried Employees Employees
48% Relocation benefit coverage of specific 39% 47% 60% items (i.e. fixed components) dependent on employee levels/categories 48% Relocation benefit coverage of specific 49% 50% 44% items (i.e. fixed components) across all employee levels/categories 26% Flexible use of full relocation benefit 31% 25% 20% coverage amount applicable to menu of possible services (all employees) 20% Flexible use of full relocation benefit coverage 22% 23% 13% amount applicable to menu of possible services (dependent on employee level/category) 13% Flexible use of a portion of relocation benefit 15% 12% 12% coverage applicable to menu of possible services (all employees) 11% Flexible use of a portion of relocation benefit 15% 7% 10% coverage applicable to menu of possible services (dependent on employee level/category) 1% Other 1% 0% 1%
38
ATLAS WORLD GROUP 2017 CORPORATE RELOCATION SURVEY
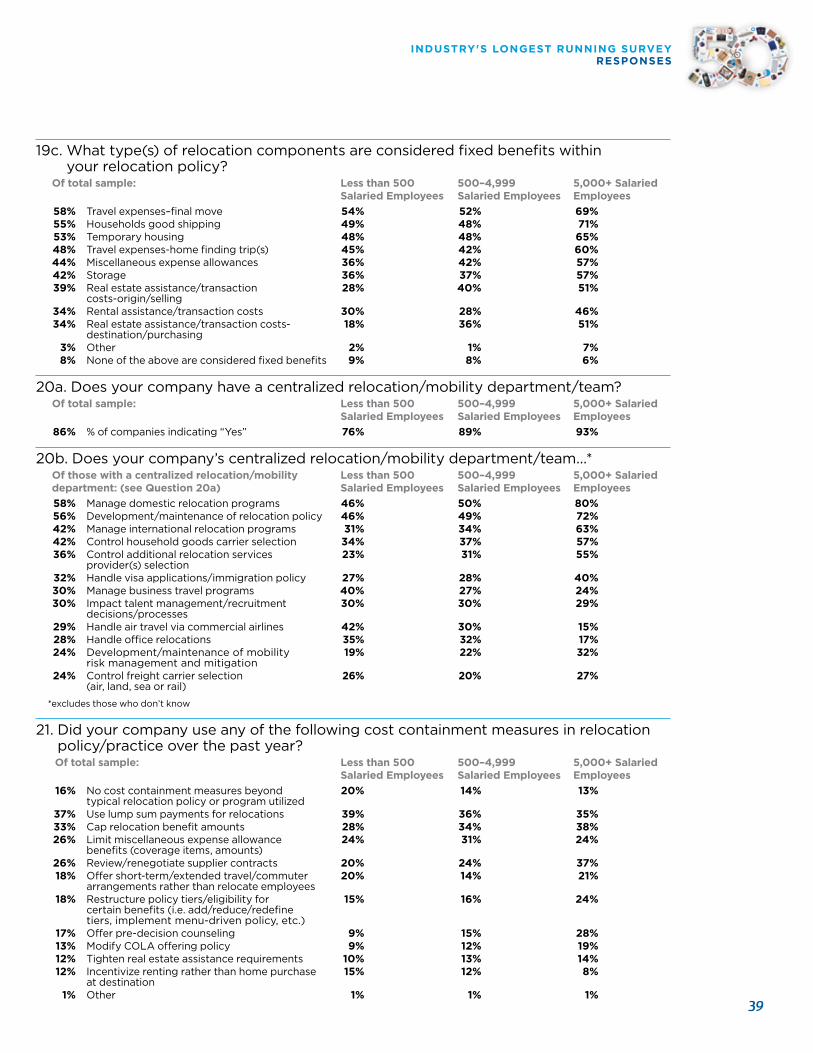
19c. What type(s) of relocation components are considered fixed benefits within your relocation policy?
Of total sample: Less than 500 500–4,999 5,000+ Salaried Salaried Employees Salaried Employees Employees 58% Travel expenses–final move 54% 52% 69% 55% Households good shipping 49% 48% 71% 53% Temporary housing 48% 48% 65% 48% Travel expenses-home finding trip(s) 45% 42% 60% 44% Miscellaneous expense allowances 36% 42% 57% 42% Storage 36% 37% 57% 39% Real estate assistance/transaction 28% 40% 51% costs-origin/selling 34% Rental assistance/transaction costs 30% 28% 46% 34% Real estate assistance/transaction costs- 18% 36% 51% destination/purchasing 3% Other 2% 1% 7% 8% None of the above are considered fixed benefits 9% 8% 6%
20a. Does your company have a centralized relocation/mobility department/team? Of total sample: Less than 500 500–4,999 5,000+ Salaried Salaried Employees Salaried Employees Employees 86% % of companies indicating “Yes” 76% 89% 93%
20b. Does your company’s centralized relocation/mobility department/team...* Of those with a centralized relocation/mobility Less than 500 500–4,999 5,000+ Salaried department: (see Question 20a) Salaried Employees Salaried Employees Employees 58% Manage domestic relocation programs 46% 50% 80% 56% Development/maintenance of relocation policy 46% 49% 72% 42% Manage international relocation programs 31% 34% 63% 42% Control household goods carrier selection 34% 37% 57% 36% Control additional relocation services 23% 31% 55% provider(s) selection 32% Handle visa applications/immigration policy 27% 28% 40% 30% Manage business travel programs 40% 27% 24% 30% Impact talent management/recruitment 30% 30% 29% decisions/processes 29% Handle air travel via commercial airlines 42% 30% 15% 28% Handle office relocations 35% 32% 17% 24% Development/maintenance of mobility 19% 22% 32% risk management and mitigation 24% Control freight carrier selection 26% 20% 27% (air, land, sea or rail)
*excludes those who don’t know
21. Did your company use any of the following cost containment measures in relocation policy/practice over the past year?
Of total sample: Less than 500 500–4,999 5,000+ Salaried Salaried Employees Salaried Employees Employees 16% No cost containment measures beyond 20% 14% 13% typical relocation policy or program utilized 37% Use lump sum payments for relocations 39% 36% 35% 33% Cap relocation benefit amounts 28% 34% 38% 26% Limit miscellaneous expense allowance 24% 31% 24% benefits (coverage items, amounts) 26% Review/renegotiate supplier contracts 20% 24% 37% 18% Offer short-term/extended travel/commuter 20% 14% 21%
arrangements rather than relocate employees 18% Restructure policy tiers/eligibility for 15% 16% 24% certain benefits (i.e. add/reduce/redefine tiers, implement menu-driven policy, etc.) 17% Offer pre-decision counseling 9% 15% 28% 13% Modify COLA offering policy 9% 12% 19% 12% Tighten real estate assistance requirements 10% 13% 14% 12% Incentivize renting rather than home purchase 15% 12% 8% at destination 1% Other 1% 1% 1%
INDUSTRY'S LONGEST RUNNING SURVEY RESPONSES
39
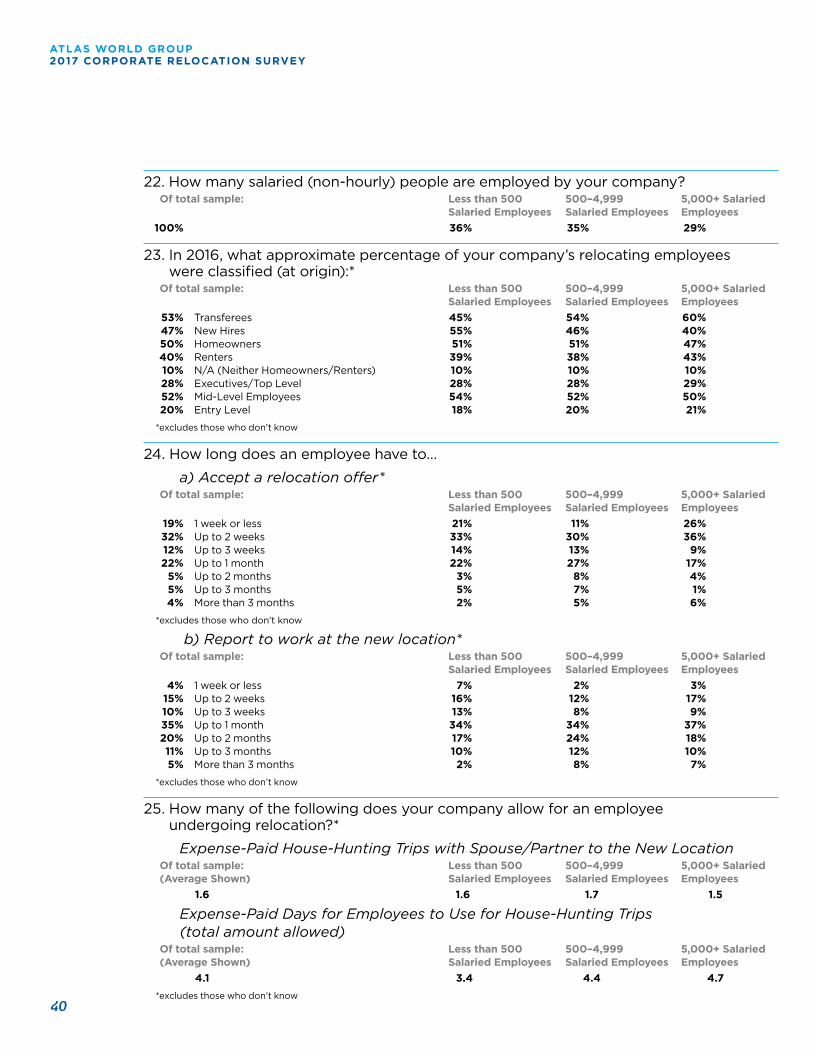
22. How many salaried (non-hourly) people are employed by your company? Of total sample: Less than 500 500–4,999 5,000+ Salaried Salaried Employees Salaried Employees Employees 100% 36% 35% 29%
23. In 2016, what approximate percentage of your company’s relocating employees were classified (at origin):*
Of total sample: Less than 500 500–4,999 5,000+ Salaried Salaried Employees Salaried Employees Employees 53% Transferees 45% 54% 60% 47% New Hires 55% 46% 40% 50% Homeowners 51% 51% 47% 40% Renters 39% 38% 43% 10% N/A (Neither Homeowners/Renters) 10% 10% 10% 28% Executives/Top Level 28% 28% 29% 52% Mid-Level Employees 54% 52% 50% 20% Entry Level 18% 20% 21%
*excludes those who don’t know
24. How long does an employee have to…
a) Accept a relocation offer* Of total sample: Less than 500 500–4,999 5,000+ Salaried Salaried Employees Salaried Employees Employees 19% 1 week or less 21% 11% 26% 32% Up to 2 weeks 33% 30% 36% 12% Up to 3 weeks 14% 13% 9% 22% Up to 1 month 22% 27% 17% 5% Up to 2 months 3% 8% 4% 5% Up to 3 months 5% 7% 1% 4% More than 3 months 2% 5% 6%
*excludes those who don’t know
b) Report to work at the new location* Of total sample: Less than 500 500–4,999 5,000+ Salaried Salaried Employees Salaried Employees Employees 4% 1 week or less 7% 2% 3% 15% Up to 2 weeks 16% 12% 17% 10% Up to 3 weeks 13% 8% 9% 35% Up to 1 month 34% 34% 37% 20% Up to 2 months 17% 24% 18% 11% Up to 3 months 10% 12% 10% 5% More than 3 months 2% 8% 7%
*excludes those who don’t know
25. How many of the following does your company allow for an employee undergoing relocation?*
Expense-Paid House-Hunting Trips with Spouse/Partner to the New Location Of total sample: Less than 500 500–4,999 5,000+ Salaried (Average Shown) Salaried Employees Salaried Employees Employees 1.6 1.6 1.7 1.5
Expense-Paid Days for Employees to Use for House-Hunting Trips (total amount allowed)
Of total sample: Less than 500 500–4,999 5,000+ Salaried (Average Shown) Salaried Employees Salaried Employees Employees 4.1 3.4 4.4 4.7
*excludes those who don’t know 40
ATLAS WORLD GROUP 2017 CORPORATE RELOCATION SURVEY
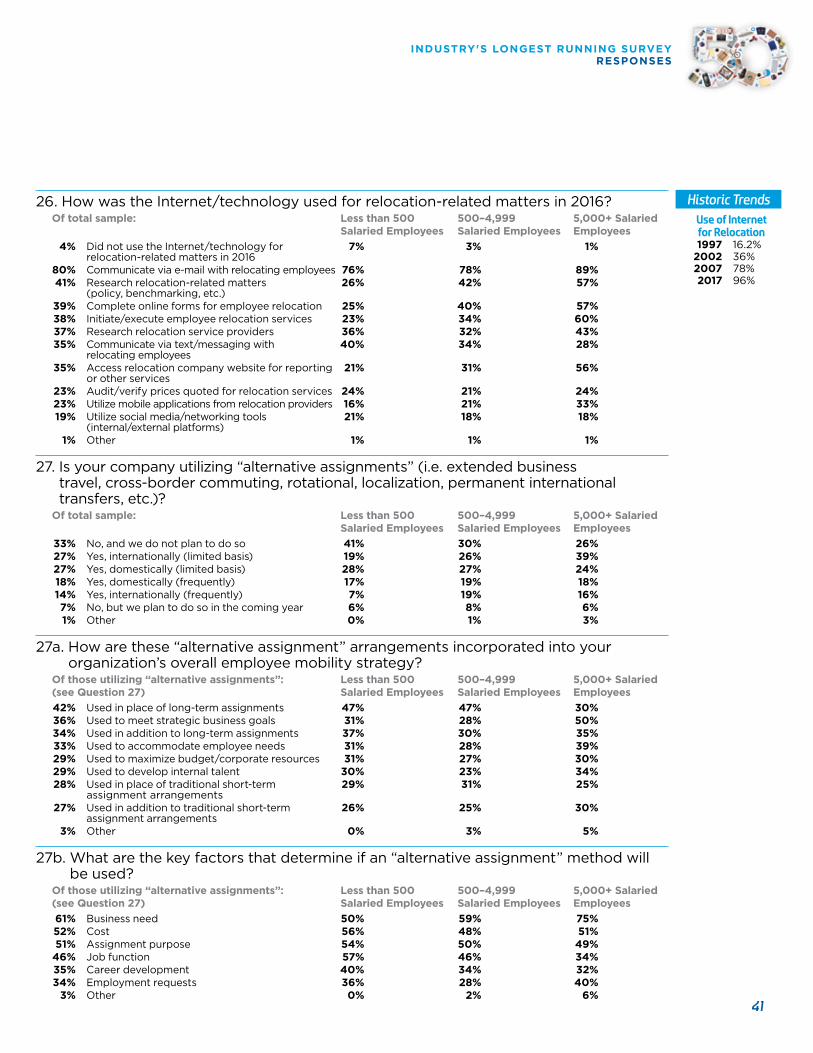
26. How was the Internet/technology used for relocation-related matters in 2016? Of total sample: Less than 500 500–4,999 5,000+ Salaried Salaried Employees Salaried Employees Employees 4% Did not use the Internet/technology for 7% 3% 1%
relocation-related matters in 2016 80% Communicate via e-mail with relocating employees 76% 78% 89% 41% Research relocation-related matters 26% 42% 57% (policy, benchmarking, etc.) 39% Complete online forms for employee relocation 25% 40% 57% 38% Initiate/execute employee relocation services 23% 34% 60% 37% Research relocation service providers 36% 32% 43% 35% Communicate via text/messaging with 40% 34% 28% relocating employees 35% Access relocation company website for reporting 21% 31% 56% or other services 23% Audit/verify prices quoted for relocation services 24% 21% 24% 23% Utilize mobile applications from relocation providers 16% 21% 33% 19% Utilize social media/networking tools 21% 18% 18% (internal/external platforms) 1% Other 1% 1% 1%
27. Is your company utilizing “alternative assignments” (i.e. extended business travel, cross-border commuting, rotational, localization, permanent international transfers, etc.)?
Of total sample: Less than 500 500–4,999 5,000+ Salaried Salaried Employees Salaried Employees Employees 33% No, and we do not plan to do so 41% 30% 26% 27% Yes, internationally (limited basis) 19% 26% 39% 27% Yes, domestically (limited basis) 28% 27% 24% 18% Yes, domestically (frequently) 17% 19% 18% 14% Yes, internationally (frequently) 7% 19% 16% 7% No, but we plan to do so in the coming year 6% 8% 6% 1% Other 0% 1% 3%
27a. How are these “alternative assignment” arrangements incorporated into your organization’s overall employee mobility strategy?
Of those utilizing “alternative assignments”: Less than 500 500–4,999 5,000+ Salaried (see Question 27) Salaried Employees Salaried Employees Employees 42% Used in place of long-term assignments 47% 47% 30% 36% Used to meet strategic business goals 31% 28% 50% 34% Used in addition to long-term assignments 37% 30% 35% 33% Used to accommodate employee needs 31% 28% 39% 29% Used to maximize budget/corporate resources 31% 27% 30% 29% Used to develop internal talent 30% 23% 34% 28% Used in place of traditional short-term 29% 31% 25% assignment arrangements 27% Used in addition to traditional short-term 26% 25% 30%
assignment arrangements 3% Other 0% 3% 5%
27b. What are the key factors that determine if an “alternative assignment” method will be used?
Of those utilizing “alternative assignments”: Less than 500 500–4,999 5,000+ Salaried (see Question 27) Salaried Employees Salaried Employees Employees 61% Business need 50% 59% 75% 52% Cost 56% 48% 51% 51% Assignment purpose 54% 50% 49% 46% Job function 57% 46% 34% 35% Career development 40% 34% 32% 34% Employment requests 36% 28% 40% 3% Other 0% 2% 6%
Historic Trends Use of Internetfor Relocation
1997 16.2% 2002 36% 2007 78% 2017 96%
INDUSTRY'S LONGEST RUNNING SURVEY RESPONSES
41
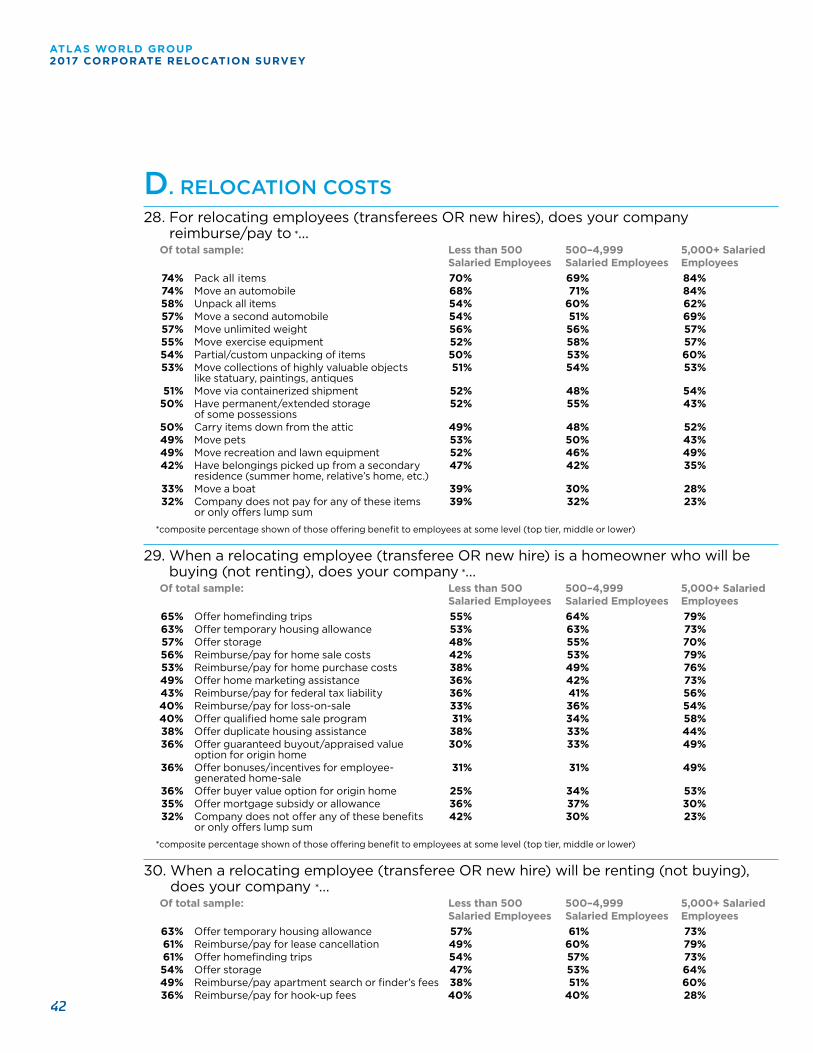
D. RELOCATION COSTS28. For relocating employees (transferees OR new hires), does your company
reimburse/pay to *... Of total sample: Less than 500 500–4,999 5,000+ Salaried Salaried Employees Salaried Employees Employees 74% Pack all items 70% 69% 84% 74% Move an automobile 68% 71% 84% 58% Unpack all items 54% 60% 62% 57% Move a second automobile 54% 51% 69% 57% Move unlimited weight 56% 56% 57% 55% Move exercise equipment 52% 58% 57% 54% Partial/custom unpacking of items 50% 53% 60% 53% Move collections of highly valuable objects 51% 54% 53% like statuary, paintings, antiques 51% Move via containerized shipment 52% 48% 54% 50% Have permanent/extended storage 52% 55% 43% of some possessions 50% Carry items down from the attic 49% 48% 52% 49% Move pets 53% 50% 43% 49% Move recreation and lawn equipment 52% 46% 49% 42% Have belongings picked up from a secondary 47% 42% 35% residence (summer home, relative’s home, etc.) 33% Move a boat 39% 30% 28% 32% Company does not pay for any of these items 39% 32% 23% or only offers lump sum
*composite percentage shown of those offering benefit to employees at some level (top tier, middle or lower)
29. When a relocating employee (transferee OR new hire) is a homeowner who will be buying (not renting), does your company *...
Of total sample: Less than 500 500–4,999 5,000+ Salaried Salaried Employees Salaried Employees Employees 65% Offer homefinding trips 55% 64% 79% 63% Offer temporary housing allowance 53% 63% 73% 57% Offer storage 48% 55% 70% 56% Reimburse/pay for home sale costs 42% 53% 79% 53% Reimburse/pay for home purchase costs 38% 49% 76% 49% Offer home marketing assistance 36% 42% 73% 43% Reimburse/pay for federal tax liability 36% 41% 56% 40% Reimburse/pay for loss-on-sale 33% 36% 54% 40% Offer qualified home sale program 31% 34% 58% 38% Offer duplicate housing assistance 38% 33% 44% 36% Offer guaranteed buyout/appraised value 30% 33% 49% option for origin home 36% Offer bonuses/incentives for employee- 31% 31% 49% generated home-sale 36% Offer buyer value option for origin home 25% 34% 53% 35% Offer mortgage subsidy or allowance 36% 37% 30% 32% Company does not offer any of these benefits 42% 30% 23% or only offers lump sum
*composite percentage shown of those offering benefit to employees at some level (top tier, middle or lower)
30. When a relocating employee (transferee OR new hire) will be renting (not buying), does your company *...
Of total sample: Less than 500 500–4,999 5,000+ Salaried Salaried Employees Salaried Employees Employees 63% Offer temporary housing allowance 57% 61% 73% 61% Reimburse/pay for lease cancellation 49% 60% 79% 61% Offer homefinding trips 54% 57% 73% 54% Offer storage 47% 53% 64% 49% Reimburse/pay apartment search or finder’s fees 38% 51% 60% 36% Reimburse/pay for hook-up fees 40% 40% 28%
42
ATLAS WORLD GROUP 2017 CORPORATE RELOCATION SURVEY
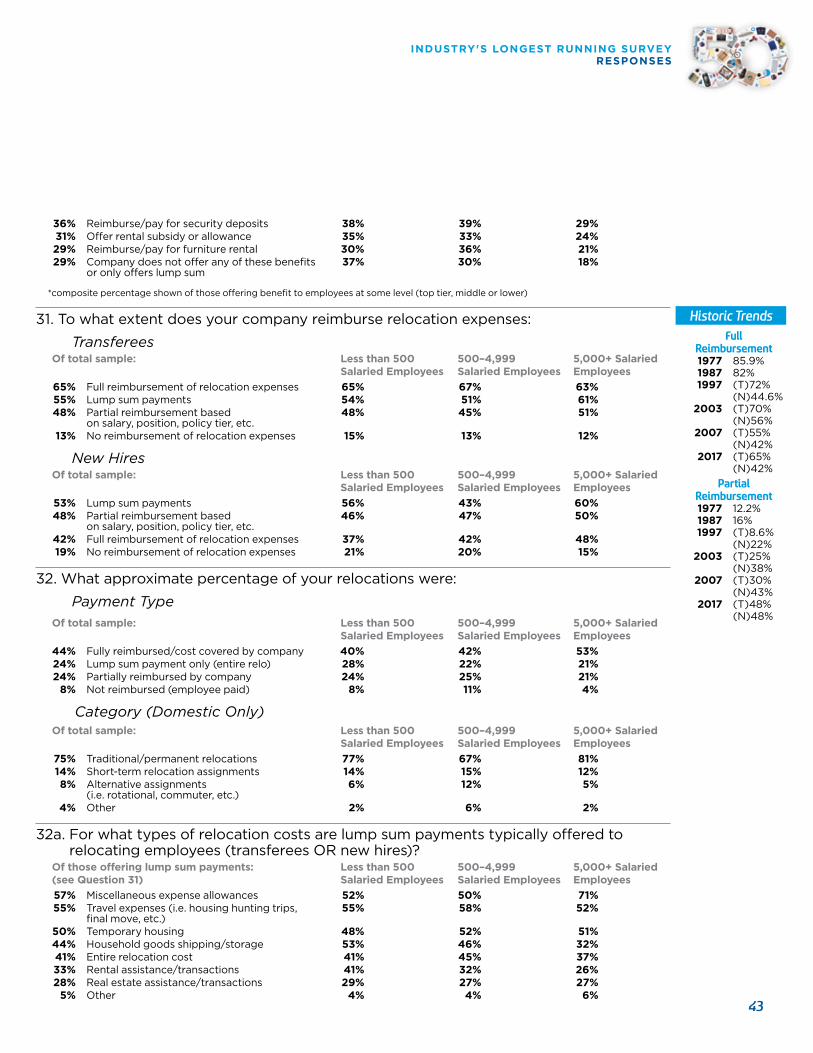
36% Reimburse/pay for security deposits 38% 39% 29% 31% Offer rental subsidy or allowance 35% 33% 24% 29% Reimburse/pay for furniture rental 30% 36% 21% 29% Company does not offer any of these benefits 37% 30% 18% or only offers lump sum
*composite percentage shown of those offering benefit to employees at some level (top tier, middle or lower)
31. To what extent does your company reimburse relocation expenses:
Transferees Of total sample: Less than 500 500–4,999 5,000+ Salaried Salaried Employees Salaried Employees Employees 65% Full reimbursement of relocation expenses 65% 67% 63% 55% Lump sum payments 54% 51% 61% 48% Partial reimbursement based 48% 45% 51% on salary, position, policy tier, etc. 13% No reimbursement of relocation expenses 15% 13% 12%
New Hires Of total sample: Less than 500 500–4,999 5,000+ Salaried Salaried Employees Salaried Employees Employees 53% Lump sum payments 56% 43% 60% 48% Partial reimbursement based 46% 47% 50% on salary, position, policy tier, etc. 42% Full reimbursement of relocation expenses 37% 42% 48% 19% No reimbursement of relocation expenses 21% 20% 15%
32. What approximate percentage of your relocations were:
Payment Type Of total sample: Less than 500 500–4,999 5,000+ Salaried Salaried Employees Salaried Employees Employees 44% Fully reimbursed/cost covered by company 40% 42% 53% 24% Lump sum payment only (entire relo) 28% 22% 21% 24% Partially reimbursed by company 24% 25% 21% 8% Not reimbursed (employee paid) 8% 11% 4%
Category (Domestic Only) Of total sample: Less than 500 500–4,999 5,000+ Salaried Salaried Employees Salaried Employees Employees 75% Traditional/permanent relocations 77% 67% 81% 14% Short-term relocation assignments 14% 15% 12% 8% Alternative assignments 6% 12% 5% (i.e. rotational, commuter, etc.) 4% Other 2% 6% 2%
32a. For what types of relocation costs are lump sum payments typically offered to relocating employees (transferees OR new hires)?
Of those offering lump sum payments: Less than 500 500–4,999 5,000+ Salaried (see Question 31) Salaried Employees Salaried Employees Employees 57% Miscellaneous expense allowances 52% 50% 71% 55% Travel expenses (i.e. housing hunting trips, 55% 58% 52% final move, etc.) 50% Temporary housing 48% 52% 51% 44% Household goods shipping/storage 53% 46% 32% 41% Entire relocation cost 41% 45% 37% 33% Rental assistance/transactions 41% 32% 26% 28% Real estate assistance/transactions 29% 27% 27% 5% Other 4% 4% 6%
Historic Trends Full
Reimbursement 1977 85.9% 1987 82% 1997 (T)72% (N)44.6% 2003 (T)70% (N)56% 2007 (T)55% (N)42% 2017 (T)65% (N)42%
PartialReimbursement
1977 12.2% 1987 16% 1997 (T)8.6% (N)22% 2003 (T)25% (N)38% 2007 (T)30% (N)43% 2017 (T)48% (N)48%
INDUSTRY'S LONGEST RUNNING SURVEY RESPONSES
43
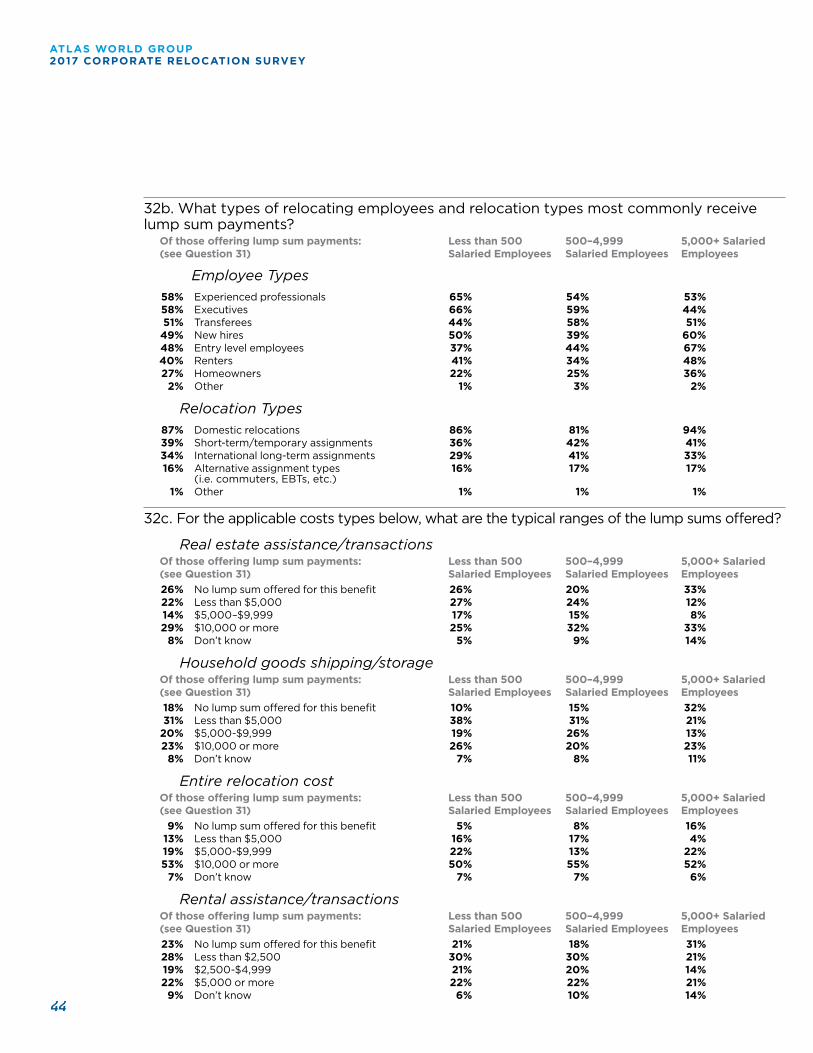
32b. What types of relocating employees and relocation types most commonly receive lump sum payments? Of those offering lump sum payments: Less than 500 500–4,999 5,000+ Salaried (see Question 31) Salaried Employees Salaried Employees Employees
Employee Types 58% Experienced professionals 65% 54% 53% 58% Executives 66% 59% 44% 51% Transferees 44% 58% 51% 49% New hires 50% 39% 60% 48% Entry level employees 37% 44% 67% 40% Renters 41% 34% 48% 27% Homeowners 22% 25% 36% 2% Other 1% 3% 2%
Relocation Types 87% Domestic relocations 86% 81% 94% 39% Short-term/temporary assignments 36% 42% 41% 34% International long-term assignments 29% 41% 33% 16% Alternative assignment types 16% 17% 17% (i.e. commuters, EBTs, etc.) 1% Other 1% 1% 1%
32c. For the applicable costs types below, what are the typical ranges of the lump sums offered?
Real estate assistance/transactions Of those offering lump sum payments: Less than 500 500–4,999 5,000+ Salaried (see Question 31) Salaried Employees Salaried Employees Employees 26% No lump sum offered for this benefit 26% 20% 33% 22% Less than $5,000 27% 24% 12% 14% $5,000–$9,999 17% 15% 8% 29% $10,000 or more 25% 32% 33% 8% Don’t know 5% 9% 14%
Household goods shipping/storage Of those offering lump sum payments: Less than 500 500–4,999 5,000+ Salaried (see Question 31) Salaried Employees Salaried Employees Employees 18% No lump sum offered for this benefit 10% 15% 32% 31% Less than $5,000 38% 31% 21% 20% $5,000-$9,999 19% 26% 13% 23% $10,000 or more 26% 20% 23% 8% Don’t know 7% 8% 11%
Entire relocation cost Of those offering lump sum payments: Less than 500 500–4,999 5,000+ Salaried (see Question 31) Salaried Employees Salaried Employees Employees 9% No lump sum offered for this benefit 5% 8% 16% 13% Less than $5,000 16% 17% 4% 19% $5,000-$9,999 22% 13% 22% 53% $10,000 or more 50% 55% 52% 7% Don’t know 7% 7% 6%
Rental assistance/transactions Of those offering lump sum payments: Less than 500 500–4,999 5,000+ Salaried (see Question 31) Salaried Employees Salaried Employees Employees 23% No lump sum offered for this benefit 21% 18% 31% 28% Less than $2,500 30% 30% 21% 19% $2,500-$4,999 21% 20% 14% 22% $5,000 or more 22% 22% 21% 9% Don’t know 6% 10% 14%
44
ATLAS WORLD GROUP 2017 CORPORATE RELOCATION SURVEY
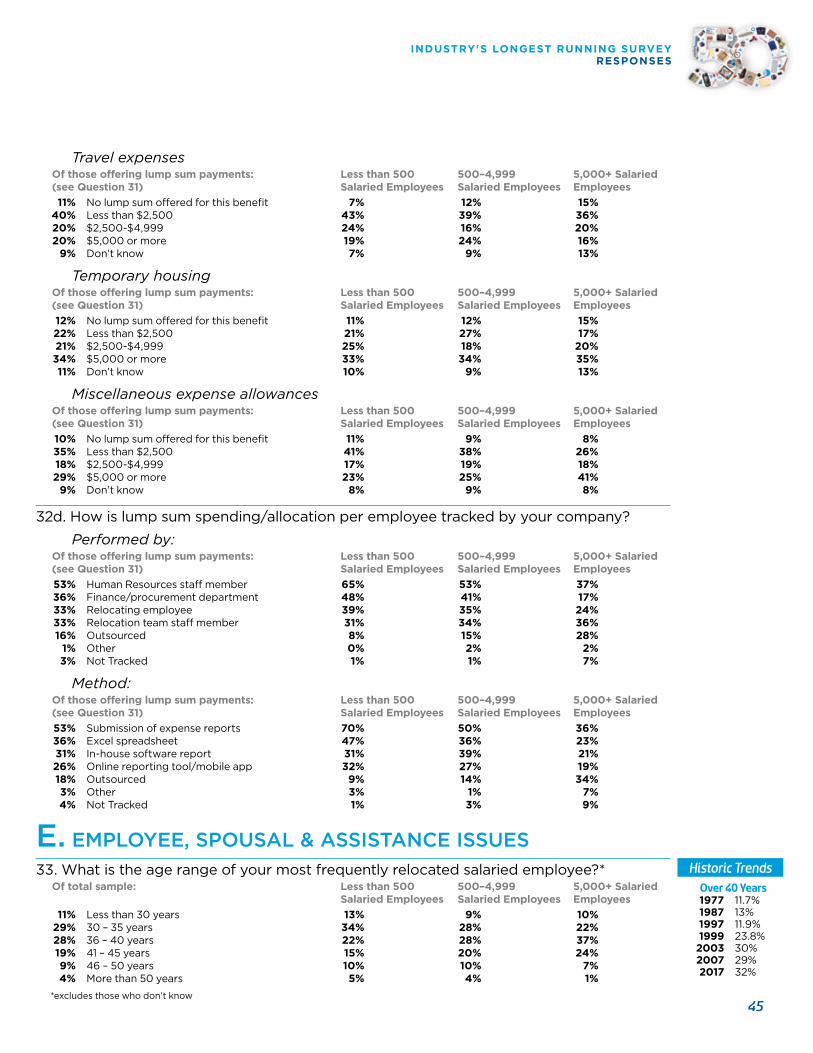
Travel expenses Of those offering lump sum payments: Less than 500 500–4,999 5,000+ Salaried (see Question 31) Salaried Employees Salaried Employees Employees 11% No lump sum offered for this benefit 7% 12% 15% 40% Less than $2,500 43% 39% 36% 20% $2,500-$4,999 24% 16% 20% 20% $5,000 or more 19% 24% 16% 9% Don’t know 7% 9% 13%
Temporary housing Of those offering lump sum payments: Less than 500 500–4,999 5,000+ Salaried (see Question 31) Salaried Employees Salaried Employees Employees 12% No lump sum offered for this benefit 11% 12% 15% 22% Less than $2,500 21% 27% 17% 21% $2,500-$4,999 25% 18% 20% 34% $5,000 or more 33% 34% 35% 11% Don’t know 10% 9% 13%
Miscellaneous expense allowances Of those offering lump sum payments: Less than 500 500–4,999 5,000+ Salaried (see Question 31) Salaried Employees Salaried Employees Employees 10% No lump sum offered for this benefit 11% 9% 8% 35% Less than $2,500 41% 38% 26% 18% $2,500-$4,999 17% 19% 18% 29% $5,000 or more 23% 25% 41% 9% Don’t know 8% 9% 8%
32d. How is lump sum spending/allocation per employee tracked by your company?
Performed by: Of those offering lump sum payments: Less than 500 500–4,999 5,000+ Salaried (see Question 31) Salaried Employees Salaried Employees Employees 53% Human Resources staff member 65% 53% 37% 36% Finance/procurement department 48% 41% 17% 33% Relocating employee 39% 35% 24% 33% Relocation team staff member 31% 34% 36% 16% Outsourced 8% 15% 28% 1% Other 0% 2% 2% 3% Not Tracked 1% 1% 7%
Method: Of those offering lump sum payments: Less than 500 500–4,999 5,000+ Salaried (see Question 31) Salaried Employees Salaried Employees Employees 53% Submission of expense reports 70% 50% 36% 36% Excel spreadsheet 47% 36% 23% 31% In-house software report 31% 39% 21% 26% Online reporting tool/mobile app 32% 27% 19% 18% Outsourced 9% 14% 34% 3% Other 3% 1% 7% 4% Not Tracked 1% 3% 9%
E. EMPLOYEE, SPOUSAL & ASSISTANCE ISSUES33. What is the age range of your most frequently relocated salaried employee?* Of total sample: Less than 500 500–4,999 5,000+ Salaried Salaried Employees Salaried Employees Employees 11% Less than 30 years 13% 9% 10% 29% 30 – 35 years 34% 28% 22% 28% 36 – 40 years 22% 28% 37% 19% 41 – 45 years 15% 20% 24% 9% 46 – 50 years 10% 10% 7% 4% More than 50 years 5% 4% 1%
*excludes those who don’t know
Historic Trends Over 40 Years
1977 11.7% 1987 13% 1997 11.9% 1999 23.8% 2003 30% 2007 29% 2017 32%
INDUSTRY'S LONGEST RUNNING SURVEY RESPONSES
45
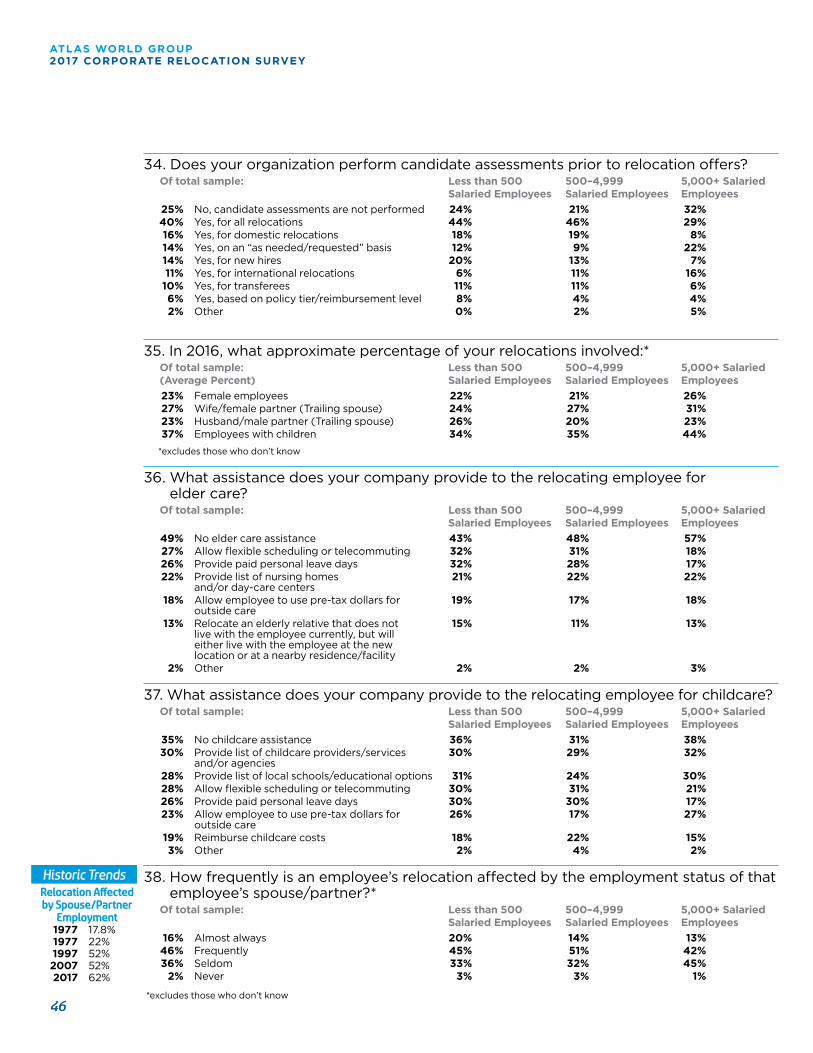
34. Does your organization perform candidate assessments prior to relocation offers? Of total sample: Less than 500 500–4,999 5,000+ Salaried Salaried Employees Salaried Employees Employees 25% No, candidate assessments are not performed 24% 21% 32% 40% Yes, for all relocations 44% 46% 29% 16% Yes, for domestic relocations 18% 19% 8% 14% Yes, on an “as needed/requested” basis 12% 9% 22% 14% Yes, for new hires 20% 13% 7% 11% Yes, for international relocations 6% 11% 16% 10% Yes, for transferees 11% 11% 6% 6% Yes, based on policy tier/reimbursement level 8% 4% 4% 2% Other 0% 2% 5%
35. In 2016, what approximate percentage of your relocations involved:* Of total sample: Less than 500 500–4,999 5,000+ Salaried (Average Percent) Salaried Employees Salaried Employees Employees 23% Female employees 22% 21% 26% 27% Wife/female partner (Trailing spouse) 24% 27% 31% 23% Husband/male partner (Trailing spouse) 26% 20% 23% 37% Employees with children 34% 35% 44%
*excludes those who don’t know
36. What assistance does your company provide to the relocating employee for elder care?
Of total sample: Less than 500 500–4,999 5,000+ Salaried Salaried Employees Salaried Employees Employees 49% No elder care assistance 43% 48% 57% 27% Allow flexible scheduling or telecommuting 32% 31% 18% 26% Provide paid personal leave days 32% 28% 17% 22% Provide list of nursing homes 21% 22% 22%
and/or day-care centers 18% Allow employee to use pre-tax dollars for 19% 17% 18% outside care 13% Relocate an elderly relative that does not 15% 11% 13% live with the employee currently, but will either live with the employee at the new location or at a nearby residence/facility 2% Other 2% 2% 3%
37. What assistance does your company provide to the relocating employee for childcare? Of total sample: Less than 500 500–4,999 5,000+ Salaried Salaried Employees Salaried Employees Employees 35% No childcare assistance 36% 31% 38% 30% Provide list of childcare providers/services 30% 29% 32% and/or agencies 28% Provide list of local schools/educational options 31% 24% 30% 28% Allow flexible scheduling or telecommuting 30% 31% 21% 26% Provide paid personal leave days 30% 30% 17% 23% Allow employee to use pre-tax dollars for 26% 17% 27%
outside care 19% Reimburse childcare costs 18% 22% 15% 3% Other 2% 4% 2%
38. How frequently is an employee’s relocation affected by the employment status of that employee’s spouse/partner?*
Of total sample: Less than 500 500–4,999 5,000+ Salaried Salaried Employees Salaried Employees Employees 16% Almost always 20% 14% 13% 46% Frequently 45% 51% 42% 36% Seldom 33% 32% 45% 2% Never 3% 3% 1%
*excludes those who don’t know
Historic Trends Relocation Affectedby Spouse/Partner
Employment 1977 17.8% 1977 22% 1997 52% 2007 52% 2017 62%
46
ATLAS WORLD GROUP 2017 CORPORATE RELOCATION SURVEY
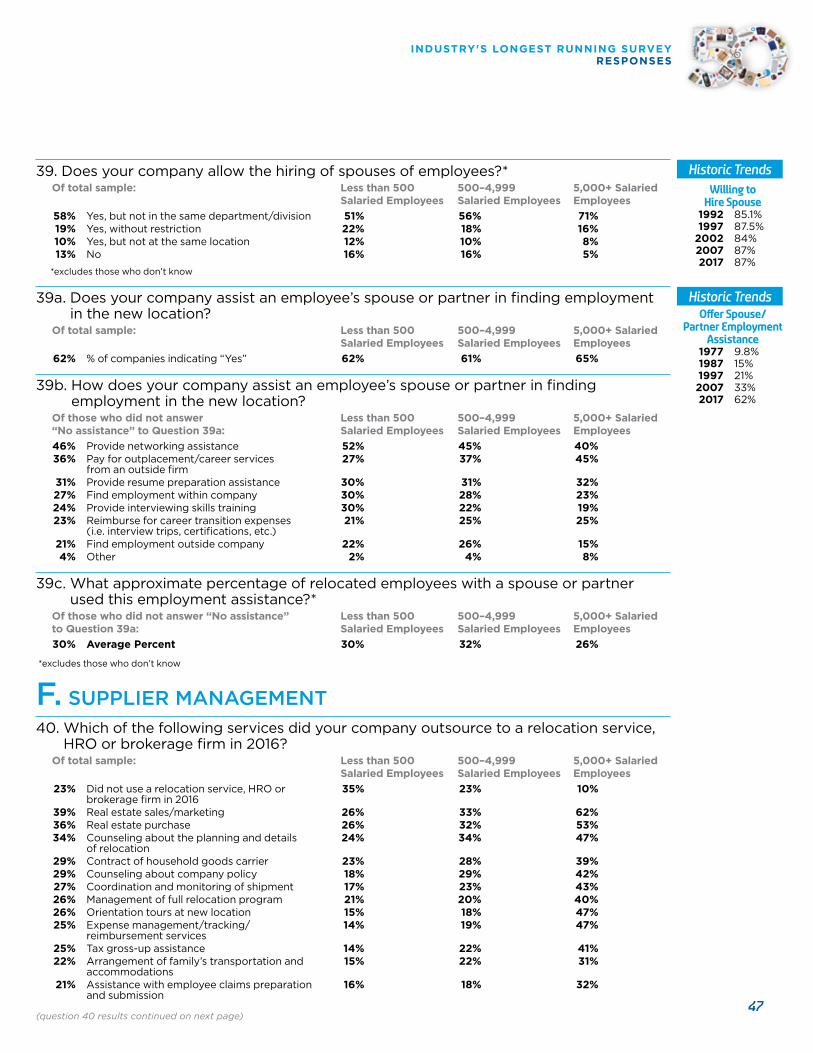
39. Does your company allow the hiring of spouses of employees?* Of total sample: Less than 500 500–4,999 5,000+ Salaried Salaried Employees Salaried Employees Employees 58% Yes, but not in the same department/division 51% 56% 71% 19% Yes, without restriction 22% 18% 16% 10% Yes, but not at the same location 12% 10% 8% 13% No 16% 16% 5%
*excludes those who don’t know
39a. Does your company assist an employee’s spouse or partner in finding employment in the new location?
Of total sample: Less than 500 500–4,999 5,000+ Salaried Salaried Employees Salaried Employees Employees 62% % of companies indicating “Yes” 62% 61% 65%
39b. How does your company assist an employee’s spouse or partner in finding employment in the new location?
Of those who did not answer Less than 500 500–4,999 5,000+ Salaried “No assistance” to Question 39a: Salaried Employees Salaried Employees Employees 46% Provide networking assistance 52% 45% 40% 36% Pay for outplacement/career services 27% 37% 45% from an outside firm 31% Provide resume preparation assistance 30% 31% 32% 27% Find employment within company 30% 28% 23% 24% Provide interviewing skills training 30% 22% 19% 23% Reimburse for career transition expenses 21% 25% 25% (i.e. interview trips, certifications, etc.) 21% Find employment outside company 22% 26% 15% 4% Other 2% 4% 8%
39c. What approximate percentage of relocated employees with a spouse or partner used this employment assistance?*
Of those who did not answer “No assistance” Less than 500 500–4,999 5,000+ Salaried to Question 39a: Salaried Employees Salaried Employees Employees 30% Average Percent 30% 32% 26%
*excludes those who don’t know
F. SUPPLIER MANAGEMENT40. Which of the following services did your company outsource to a relocation service,
HRO or brokerage firm in 2016? Of total sample: Less than 500 500–4,999 5,000+ Salaried Salaried Employees Salaried Employees Employees 23% Did not use a relocation service, HRO or 35% 23% 10%
brokerage firm in 2016 39% Real estate sales/marketing 26% 33% 62% 36% Real estate purchase 26% 32% 53% 34% Counseling about the planning and details 24% 34% 47% of relocation 29% Contract of household goods carrier 23% 28% 39% 29% Counseling about company policy 18% 29% 42% 27% Coordination and monitoring of shipment 17% 23% 43% 26% Management of full relocation program 21% 20% 40% 26% Orientation tours at new location 15% 18% 47% 25% Expense management/tracking/ 14% 19% 47% reimbursement services 25% Tax gross-up assistance 14% 22% 41% 22% Arrangement of family’s transportation and 15% 22% 31% accommodations 21% Assistance with employee claims preparation 16% 18% 32% and submission
(question 40 results continued on next page)
Historic Trends Willing to
Hire Spouse 1992 85.1% 1997 87.5% 2002 84% 2007 87% 2017 87%
Historic Trends Offer Spouse/
Partner EmploymentAssistance
1977 9.8% 1987 15% 1997 21% 2007 33% 2017 62%
INDUSTRY'S LONGEST RUNNING SURVEY RESPONSES
47
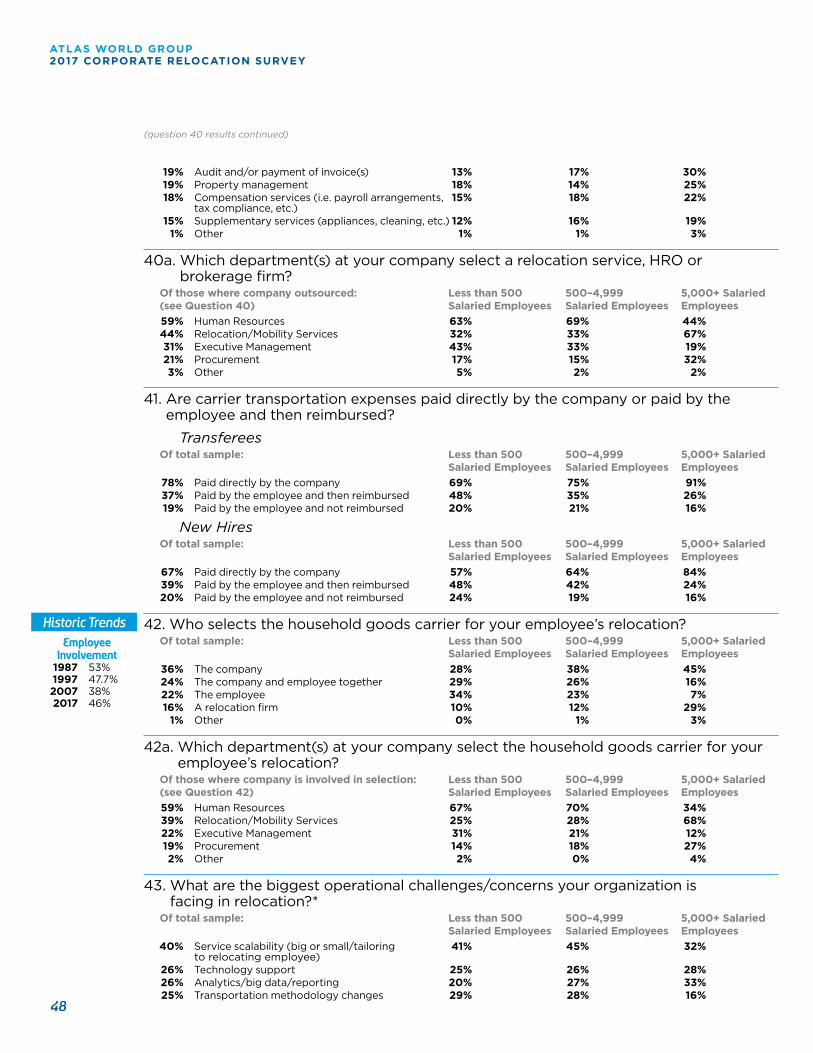
19% Audit and/or payment of invoice(s) 13% 17% 30% 19% Property management 18% 14% 25% 18% Compensation services (i.e. payroll arrangements, 15% 18% 22%
tax compliance, etc.) 15% Supplementary services (appliances, cleaning, etc.) 12% 16% 19% 1% Other 1% 1% 3%
40a. Which department(s) at your company select a relocation service, HRO or brokerage firm?
Of those where company outsourced: Less than 500 500–4,999 5,000+ Salaried (see Question 40) Salaried Employees Salaried Employees Employees 59% Human Resources 63% 69% 44% 44% Relocation/Mobility Services 32% 33% 67% 31% Executive Management 43% 33% 19% 21% Procurement 17% 15% 32% 3% Other 5% 2% 2%
41. Are carrier transportation expenses paid directly by the company or paid by the employee and then reimbursed?
Transferees Of total sample: Less than 500 500–4,999 5,000+ Salaried Salaried Employees Salaried Employees Employees 78% Paid directly by the company 69% 75% 91% 37% Paid by the employee and then reimbursed 48% 35% 26% 19% Paid by the employee and not reimbursed 20% 21% 16%
New Hires Of total sample: Less than 500 500–4,999 5,000+ Salaried Salaried Employees Salaried Employees Employees 67% Paid directly by the company 57% 64% 84% 39% Paid by the employee and then reimbursed 48% 42% 24% 20% Paid by the employee and not reimbursed 24% 19% 16%
42. Who selects the household goods carrier for your employee’s relocation? Of total sample: Less than 500 500–4,999 5,000+ Salaried Salaried Employees Salaried Employees Employees 36% The company 28% 38% 45% 24% The company and employee together 29% 26% 16% 22% The employee 34% 23% 7% 16% A relocation firm 10% 12% 29% 1% Other 0% 1% 3%
42a. Which department(s) at your company select the household goods carrier for your employee’s relocation?
Of those where company is involved in selection: Less than 500 500–4,999 5,000+ Salaried (see Question 42) Salaried Employees Salaried Employees Employees 59% Human Resources 67% 70% 34% 39% Relocation/Mobility Services 25% 28% 68% 22% Executive Management 31% 21% 12% 19% Procurement 14% 18% 27% 2% Other 2% 0% 4%
43. What are the biggest operational challenges/concerns your organization is facing in relocation?*
Of total sample: Less than 500 500–4,999 5,000+ Salaried Salaried Employees Salaried Employees Employees 40% Service scalability (big or small/tailoring 41% 45% 32% to relocating employee) 26% Technology support 25% 26% 28% 26% Analytics/big data/reporting 20% 27% 33% 25% Transportation methodology changes 29% 28% 16%
(question 40 results continued)
Historic Trends Employee
Involvement 1987 53% 1997 47.7% 2007 38% 2017 46%
48
ATLAS WORLD GROUP 2017 CORPORATE RELOCATION SURVEY
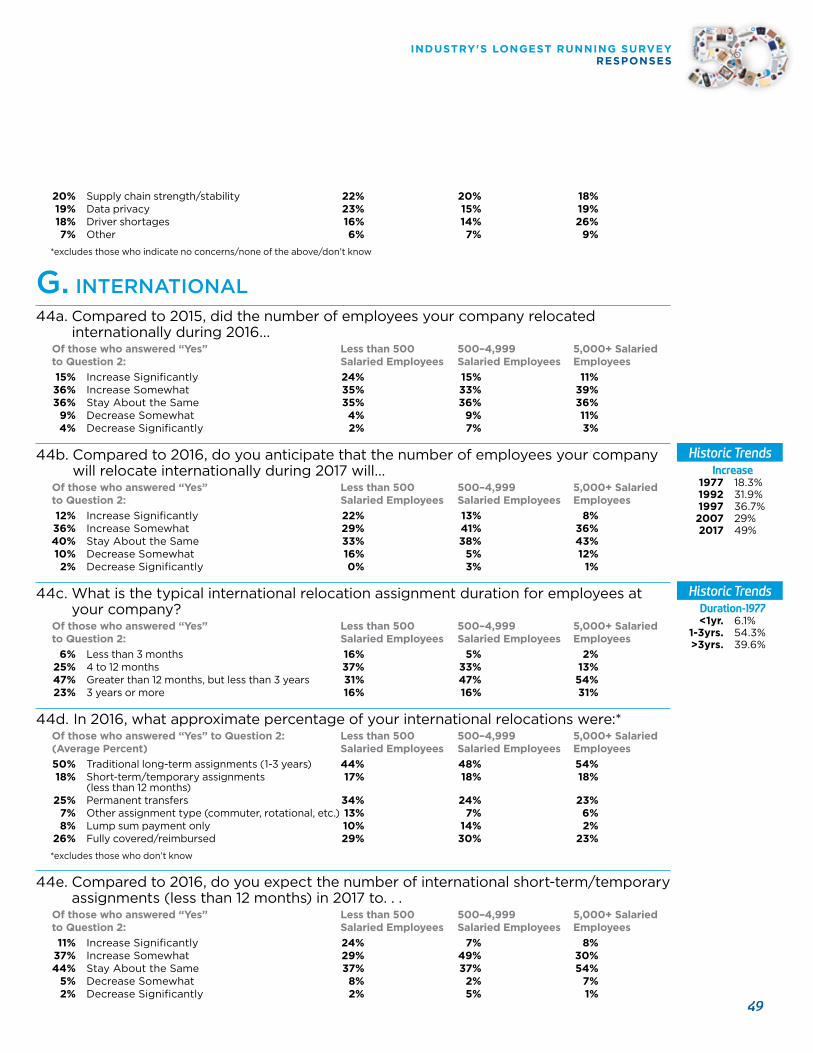
20% Supply chain strength/stability 22% 20% 18% 19% Data privacy 23% 15% 19% 18% Driver shortages 16% 14% 26% 7% Other 6% 7% 9%
*excludes those who indicate no concerns/none of the above/don’t know
G. INTERNATIONAL44a. Compared to 2015, did the number of employees your company relocated
internationally during 2016... Of those who answered “Yes” Less than 500 500–4,999 5,000+ Salaried to Question 2: Salaried Employees Salaried Employees Employees 15% Increase Significantly 24% 15% 11% 36% Increase Somewhat 35% 33% 39% 36% Stay About the Same 35% 36% 36% 9% Decrease Somewhat 4% 9% 11% 4% Decrease Significantly 2% 7% 3%
44b. Compared to 2016, do you anticipate that the number of employees your company will relocate internationally during 2017 will...
Of those who answered “Yes” Less than 500 500–4,999 5,000+ Salaried to Question 2: Salaried Employees Salaried Employees Employees 12% Increase Significantly 22% 13% 8% 36% Increase Somewhat 29% 41% 36% 40% Stay About the Same 33% 38% 43% 10% Decrease Somewhat 16% 5% 12% 2% Decrease Significantly 0% 3% 1%
44c. What is the typical international relocation assignment duration for employees at your company?
Of those who answered “Yes” Less than 500 500–4,999 5,000+ Salaried to Question 2: Salaried Employees Salaried Employees Employees 6% Less than 3 months 16% 5% 2% 25% 4 to 12 months 37% 33% 13% 47% Greater than 12 months, but less than 3 years 31% 47% 54% 23% 3 years or more 16% 16% 31%
44d. In 2016, what approximate percentage of your international relocations were:* Of those who answered “Yes” to Question 2: Less than 500 500–4,999 5,000+ Salaried (Average Percent) Salaried Employees Salaried Employees Employees 50% Traditional long-term assignments (1-3 years) 44% 48% 54% 18% Short-term/temporary assignments 17% 18% 18%
(less than 12 months) 25% Permanent transfers 34% 24% 23% 7% Other assignment type (commuter, rotational, etc.) 13% 7% 6% 8% Lump sum payment only 10% 14% 2% 26% Fully covered/reimbursed 29% 30% 23%
*excludes those who don’t know
44e. Compared to 2016, do you expect the number of international short-term/temporary assignments (less than 12 months) in 2017 to. . .
Of those who answered “Yes” Less than 500 500–4,999 5,000+ Salaried to Question 2: Salaried Employees Salaried Employees Employees 11% Increase Significantly 24% 7% 8% 37% Increase Somewhat 29% 49% 30% 44% Stay About the Same 37% 37% 54% 5% Decrease Somewhat 8% 2% 7% 2% Decrease Significantly 2% 5% 1%
Historic Trends Increase
1977 18.3% 1992 31.9% 1997 36.7% 2007 29% 2017 49%
Historic Trends Duration-1977
<1yr. 6.1% 1-3yrs. 54.3% >3yrs. 39.6%
INDUSTRY'S LONGEST RUNNING SURVEY RESPONSES
49
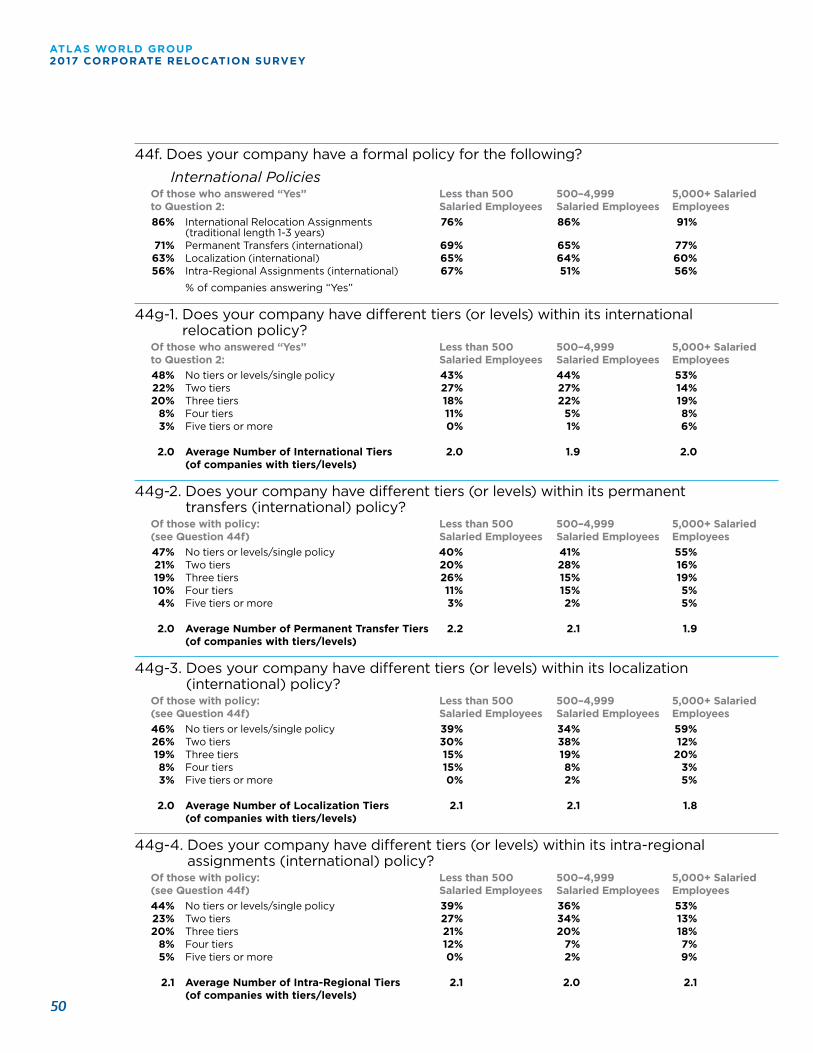
44f. Does your company have a formal policy for the following?
International Policies Of those who answered “Yes” Less than 500 500–4,999 5,000+ Salaried to Question 2: Salaried Employees Salaried Employees Employees 86% International Relocation Assignments 76% 86% 91%
(traditional length 1-3 years) 71% Permanent Transfers (international) 69% 65% 77% 63% Localization (international) 65% 64% 60% 56% Intra-Regional Assignments (international) 67% 51% 56%
% of companies answering “Yes”
44g-1. Does your company have different tiers (or levels) within its international relocation policy?
Of those who answered “Yes” Less than 500 500–4,999 5,000+ Salaried to Question 2: Salaried Employees Salaried Employees Employees 48% No tiers or levels/single policy 43% 44% 53% 22% Two tiers 27% 27% 14% 20% Three tiers 18% 22% 19% 8% Four tiers 11% 5% 8% 3% Five tiers or more 0% 1% 6%
2.0 Average Number of International Tiers 2.0 1.9 2.0 (of companies with tiers/levels)
44g-2. Does your company have different tiers (or levels) within its permanent transfers (international) policy?
Of those with policy: Less than 500 500–4,999 5,000+ Salaried (see Question 44f) Salaried Employees Salaried Employees Employees 47% No tiers or levels/single policy 40% 41% 55% 21% Two tiers 20% 28% 16% 19% Three tiers 26% 15% 19% 10% Four tiers 11% 15% 5% 4% Five tiers or more 3% 2% 5%
2.0 Average Number of Permanent Transfer Tiers 2.2 2.1 1.9 (of companies with tiers/levels)
44g-3. Does your company have different tiers (or levels) within its localization (international) policy?
Of those with policy: Less than 500 500–4,999 5,000+ Salaried (see Question 44f) Salaried Employees Salaried Employees Employees 46% No tiers or levels/single policy 39% 34% 59% 26% Two tiers 30% 38% 12% 19% Three tiers 15% 19% 20% 8% Four tiers 15% 8% 3% 3% Five tiers or more 0% 2% 5%
2.0 Average Number of Localization Tiers 2.1 2.1 1.8 (of companies with tiers/levels)
44g-4. Does your company have different tiers (or levels) within its intra-regional assignments (international) policy?
Of those with policy: Less than 500 500–4,999 5,000+ Salaried (see Question 44f) Salaried Employees Salaried Employees Employees 44% No tiers or levels/single policy 39% 36% 53% 23% Two tiers 27% 34% 13% 20% Three tiers 21% 20% 18% 8% Four tiers 12% 7% 7% 5% Five tiers or more 0% 2% 9%
2.1 Average Number of Intra-Regional Tiers 2.1 2.0 2.1 (of companies with tiers/levels)
50
ATLAS WORLD GROUP 2017 CORPORATE RELOCATION SURVEY
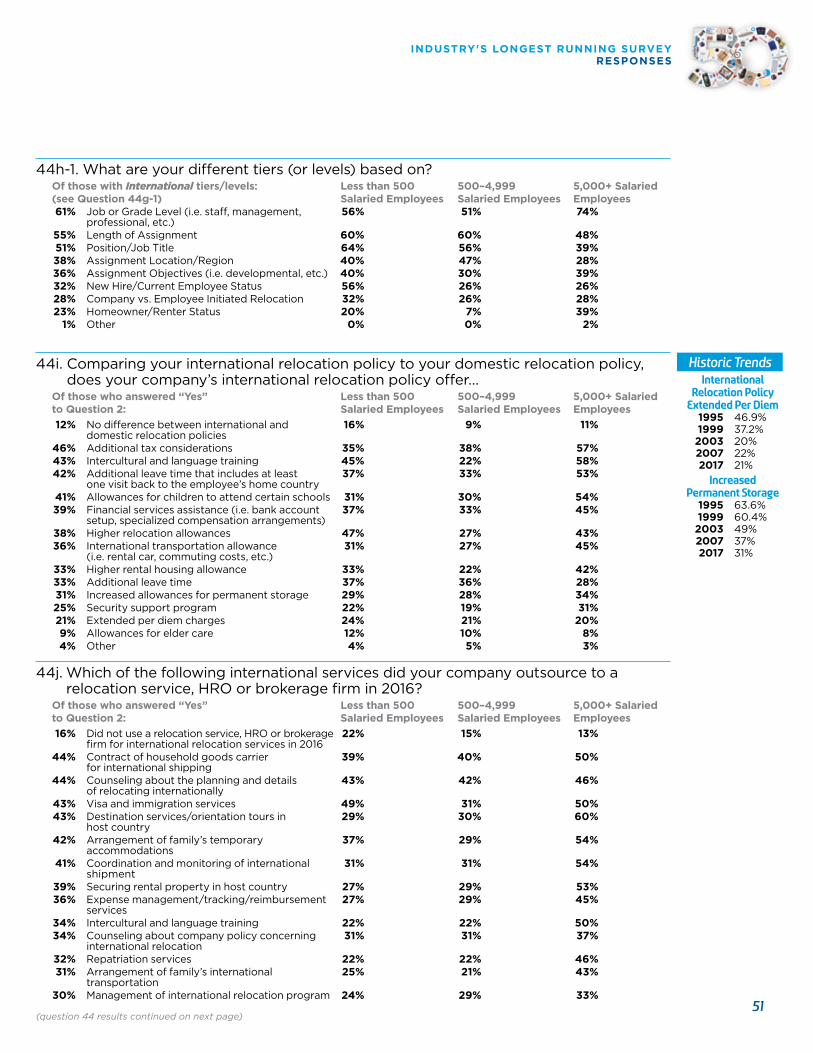
44h-1. What are your different tiers (or levels) based on? Of those with International tiers/levels: Less than 500 500–4,999 5,000+ Salaried (see Question 44g-1) Salaried Employees Salaried Employees Employees 61% Job or Grade Level (i.e. staff, management, 56% 51% 74% professional, etc.) 55% Length of Assignment 60% 60% 48% 51% Position/Job Title 64% 56% 39% 38% Assignment Location/Region 40% 47% 28% 36% Assignment Objectives (i.e. developmental, etc.) 40% 30% 39% 32% New Hire/Current Employee Status 56% 26% 26% 28% Company vs. Employee Initiated Relocation 32% 26% 28% 23% Homeowner/Renter Status 20% 7% 39% 1% Other 0% 0% 2%
44i. Comparing your international relocation policy to your domestic relocation policy, does your company’s international relocation policy offer…
Of those who answered “Yes” Less than 500 500–4,999 5,000+ Salaried to Question 2: Salaried Employees Salaried Employees Employees 12% No difference between international and 16% 9% 11%
domestic relocation policies 46% Additional tax considerations 35% 38% 57% 43% Intercultural and language training 45% 22% 58% 42% Additional leave time that includes at least 37% 33% 53% one visit back to the employee’s home country 41% Allowances for children to attend certain schools 31% 30% 54% 39% Financial services assistance (i.e. bank account 37% 33% 45% setup, specialized compensation arrangements) 38% Higher relocation allowances 47% 27% 43% 36% International transportation allowance 31% 27% 45% (i.e. rental car, commuting costs, etc.) 33% Higher rental housing allowance 33% 22% 42% 33% Additional leave time 37% 36% 28% 31% Increased allowances for permanent storage 29% 28% 34% 25% Security support program 22% 19% 31% 21% Extended per diem charges 24% 21% 20% 9% Allowances for elder care 12% 10% 8% 4% Other 4% 5% 3%
44j. Which of the following international services did your company outsource to a relocation service, HRO or brokerage firm in 2016?
Of those who answered “Yes” Less than 500 500–4,999 5,000+ Salaried to Question 2: Salaried Employees Salaried Employees Employees 16% Did not use a relocation service, HRO or brokerage 22% 15% 13%
firm for international relocation services in 2016 44% Contract of household goods carrier 39% 40% 50% for international shipping 44% Counseling about the planning and details 43% 42% 46% of relocating internationally 43% Visa and immigration services 49% 31% 50% 43% Destination services/orientation tours in 29% 30% 60% host country 42% Arrangement of family’s temporary 37% 29% 54% accommodations 41% Coordination and monitoring of international 31% 31% 54% shipment 39% Securing rental property in host country 27% 29% 53% 36% Expense management/tracking/reimbursement 27% 29% 45%
services 34% Intercultural and language training 22% 22% 50% 34% Counseling about company policy concerning 31% 31% 37%
international relocation 32% Repatriation services 22% 22% 46% 31% Arrangement of family’s international 25% 21% 43% transportation 30% Management of international relocation program 24% 29% 33%
(question 44 results continued on next page)
Historic Trends International
Relocation PolicyExtended Per Diem
1995 46.9% 1999 37.2% 2003 20% 2007 22% 2017 21%
IncreasedPermanent Storage
1995 63.6% 1999 60.4% 2003 49% 2007 37% 2017 31%
INDUSTRY'S LONGEST RUNNING SURVEY RESPONSES
51
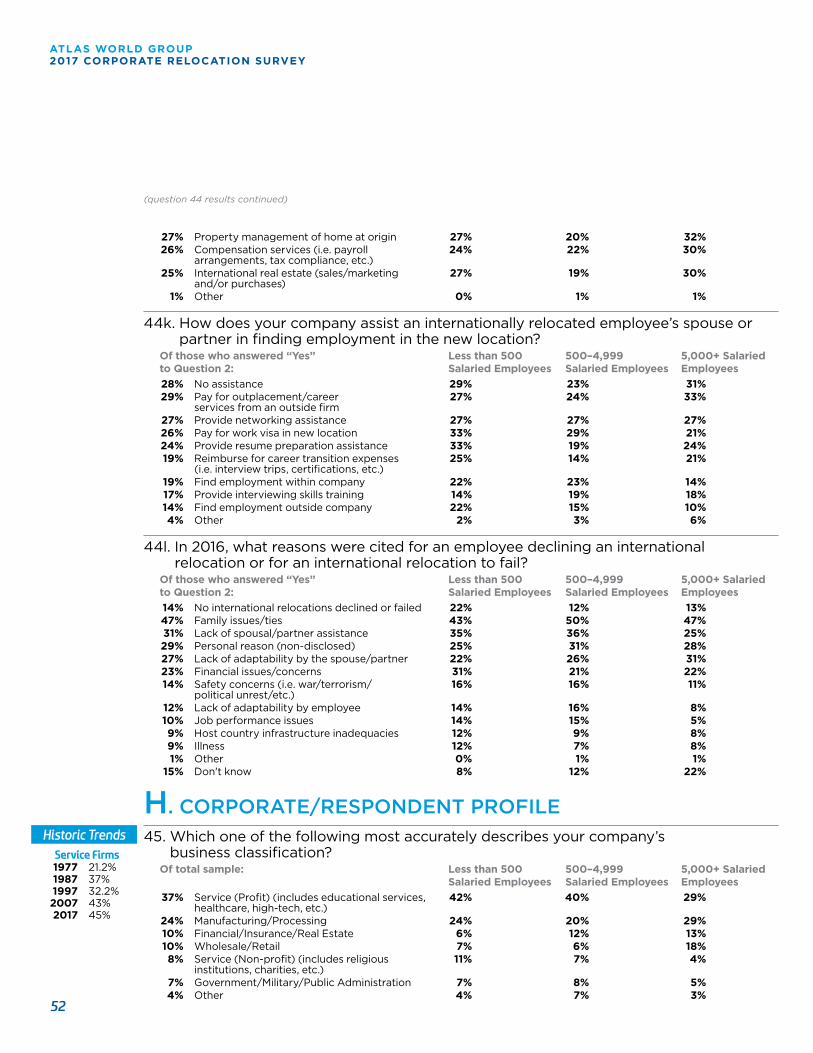
27% Property management of home at origin 27% 20% 32% 26% Compensation services (i.e. payroll 24% 22% 30% arrangements, tax compliance, etc.) 25% International real estate (sales/marketing 27% 19% 30% and/or purchases) 1% Other 0% 1% 1%
44k. How does your company assist an internationally relocated employee’s spouse or partner in finding employment in the new location?
Of those who answered “Yes” Less than 500 500–4,999 5,000+ Salaried to Question 2: Salaried Employees Salaried Employees Employees 28% No assistance 29% 23% 31% 29% Pay for outplacement/career 27% 24% 33% services from an outside firm 27% Provide networking assistance 27% 27% 27% 26% Pay for work visa in new location 33% 29% 21% 24% Provide resume preparation assistance 33% 19% 24% 19% Reimburse for career transition expenses 25% 14% 21% (i.e. interview trips, certifications, etc.) 19% Find employment within company 22% 23% 14% 17% Provide interviewing skills training 14% 19% 18% 14% Find employment outside company 22% 15% 10% 4% Other 2% 3% 6%
44l. In 2016, what reasons were cited for an employee declining an international relocation or for an international relocation to fail?
Of those who answered “Yes” Less than 500 500–4,999 5,000+ Salaried to Question 2: Salaried Employees Salaried Employees Employees 14% No international relocations declined or failed 22% 12% 13% 47% Family issues/ties 43% 50% 47% 31% Lack of spousal/partner assistance 35% 36% 25% 29% Personal reason (non-disclosed) 25% 31% 28% 27% Lack of adaptability by the spouse/partner 22% 26% 31% 23% Financial issues/concerns 31% 21% 22% 14% Safety concerns (i.e. war/terrorism/ 16% 16% 11% political unrest/etc.) 12% Lack of adaptability by employee 14% 16% 8% 10% Job performance issues 14% 15% 5% 9% Host country infrastructure inadequacies 12% 9% 8% 9% Illness 12% 7% 8% 1% Other 0% 1% 1% 15% Don't know 8% 12% 22%
H. CORPORATE/RESPONDENT PROFILE45. Which one of the following most accurately describes your company’s
business classification? Of total sample: Less than 500 500–4,999 5,000+ Salaried Salaried Employees Salaried Employees Employees 37% Service (Profit) (includes educational services, 42% 40% 29%
healthcare, high-tech, etc.) 24% Manufacturing/Processing 24% 20% 29% 10% Financial/Insurance/Real Estate 6% 12% 13% 10% Wholesale/Retail 7% 6% 18% 8% Service (Non-profit) (includes religious 11% 7% 4% institutions, charities, etc.) 7% Government/Military/Public Administration 7% 8% 5% 4% Other 4% 7% 3%
(question 44 results continued)
Historic Trends Service Firms
1977 21.2% 1987 37% 1997 32.2% 2007 43% 2017 45%
52
ATLAS WORLD GROUP 2017 CORPORATE RELOCATION SURVEY
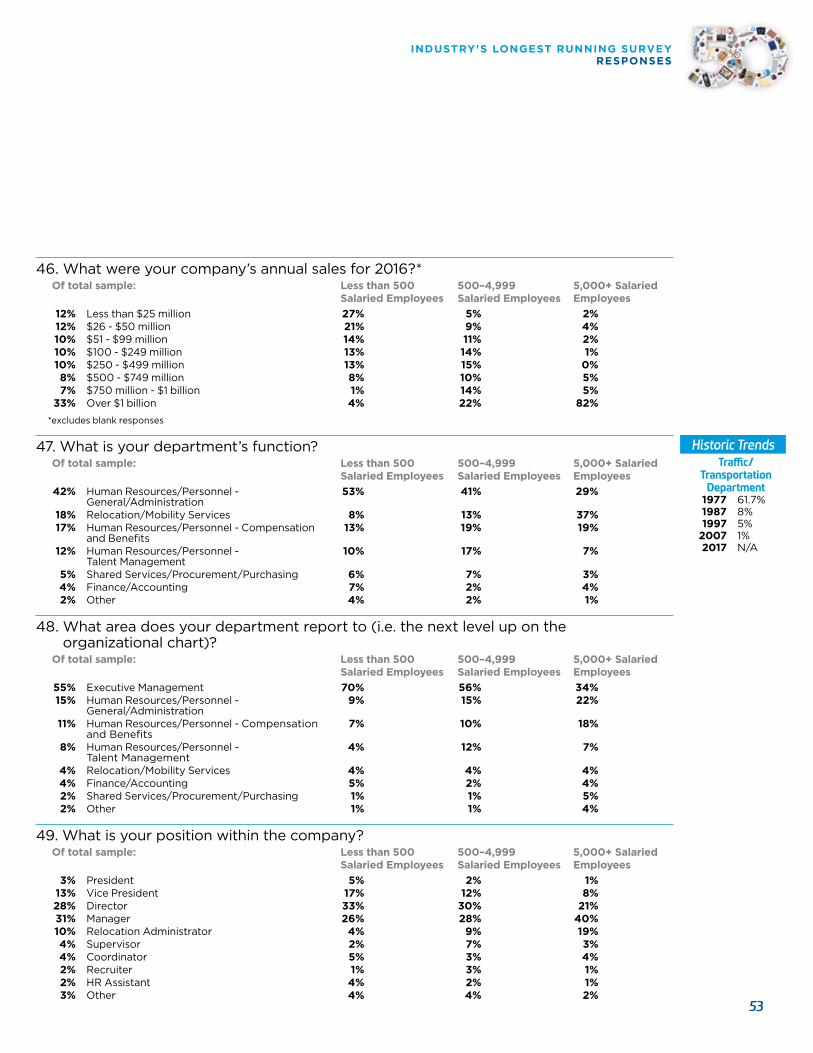
46. What were your company’s annual sales for 2016?* Of total sample: Less than 500 500–4,999 5,000+ Salaried Salaried Employees Salaried Employees Employees 12% Less than $25 million 27% 5% 2% 12% $26 - $50 million 21% 9% 4% 10% $51 - $99 million 14% 11% 2% 10% $100 - $249 million 13% 14% 1% 10% $250 - $499 million 13% 15% 0% 8% $500 - $749 million 8% 10% 5% 7% $750 million - $1 billion 1% 14% 5% 33% Over $1 billion 4% 22% 82%
*excludes blank responses
47. What is your department’s function? Of total sample: Less than 500 500–4,999 5,000+ Salaried Salaried Employees Salaried Employees Employees 42% Human Resources/Personnel - 53% 41% 29%
General/Administration 18% Relocation/Mobility Services 8% 13% 37% 17% Human Resources/Personnel - Compensation 13% 19% 19% and Benefits 12% Human Resources/Personnel - 10% 17% 7% Talent Management 5% Shared Services/Procurement/Purchasing 6% 7% 3% 4% Finance/Accounting 7% 2% 4% 2% Other 4% 2% 1%
48. What area does your department report to (i.e. the next level up on the organizational chart)?
Of total sample: Less than 500 500–4,999 5,000+ Salaried Salaried Employees Salaried Employees Employees 55% Executive Management 70% 56% 34% 15% Human Resources/Personnel - 9% 15% 22% General/Administration 11% Human Resources/Personnel - Compensation 7% 10% 18% and Benefits 8% Human Resources/Personnel - 4% 12% 7% Talent Management 4% Relocation/Mobility Services 4% 4% 4% 4% Finance/Accounting 5% 2% 4% 2% Shared Services/Procurement/Purchasing 1% 1% 5% 2% Other 1% 1% 4%
49. What is your position within the company? Of total sample: Less than 500 500–4,999 5,000+ Salaried Salaried Employees Salaried Employees Employees 3% President 5% 2% 1% 13% Vice President 17% 12% 8% 28% Director 33% 30% 21% 31% Manager 26% 28% 40% 10% Relocation Administrator 4% 9% 19% 4% Supervisor 2% 7% 3% 4% Coordinator 5% 3% 4% 2% Recruiter 1% 3% 1% 2% HR Assistant 4% 2% 1% 3% Other 4% 4% 2%
Historic Trends Traffic/
TransportationDepartment
1977 61.7% 1987 8% 1997 5% 2007 1% 2017 N/A
INDUSTRY'S LONGEST RUNNING SURVEY RESPONSES
53
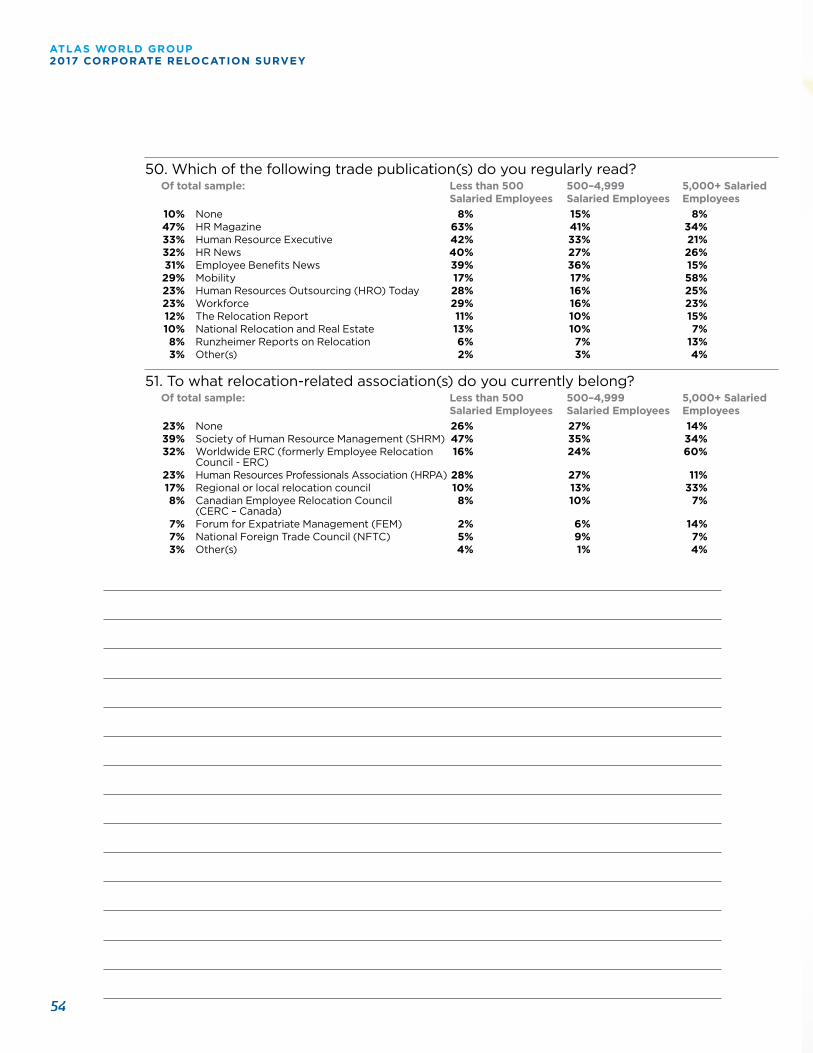
50. Which of the following trade publication(s) do you regularly read? Of total sample: Less than 500 500–4,999 5,000+ Salaried Salaried Employees Salaried Employees Employees 10% None 8% 15% 8% 47% HR Magazine 63% 41% 34% 33% Human Resource Executive 42% 33% 21% 32% HR News 40% 27% 26% 31% Employee Benefits News 39% 36% 15% 29% Mobility 17% 17% 58% 23% Human Resources Outsourcing (HRO) Today 28% 16% 25% 23% Workforce 29% 16% 23% 12% The Relocation Report 11% 10% 15% 10% National Relocation and Real Estate 13% 10% 7% 8% Runzheimer Reports on Relocation 6% 7% 13% 3% Other(s) 2% 3% 4%
51. To what relocation-related association(s) do you currently belong? Of total sample: Less than 500 500–4,999 5,000+ Salaried Salaried Employees Salaried Employees Employees 23% None 26% 27% 14% 39% Society of Human Resource Management (SHRM) 47% 35% 34% 32% Worldwide ERC (formerly Employee Relocation 16% 24% 60% Council - ERC) 23% Human Resources Professionals Association (HRPA) 28% 27% 11% 17% Regional or local relocation council 10% 13% 33% 8% Canadian Employee Relocation Council 8% 10% 7%
(CERC – Canada) 7% Forum for Expatriate Management (FEM) 2% 6% 14% 7% National Foreign Trade Council (NFTC) 5% 9% 7% 3% Other(s) 4% 1% 4%
54
ATLAS WORLD GROUP 2017 CORPORATE RELOCATION SURVEY
You’re invited to take part in next year’s survey.
Your perspective can help the world better see how our industry works. To be included in the 51st Annual Atlas Survey, sign up at:
AtlasVanLines.com/TakeSurvey
THE 50TH ANNUAL ATLAS CORPORATE RELOCATION SURVEY
The Industry’s Longest Running SurveyEvery year since 1966, Atlas has collected input from
corporate decision makers, analyzed it, and reported our findings. We illuminate the finer points of relocation to bring the
bigger picture into focus.
Visit us at atlasvanlines.com
Contact us at 800-852-6683

TM & © 2017 AWGI LLC Atlas Van Lines, Inc. 1212 St. George Rd., Evansville, IN 47711 Form No. CC012078
To see survey results from prior years – including charts and graphs for every question, visit: www.atlasvanlines.com/Corporate-Relocation/Surveyor contact: Katie Gross • 800-638-9797 e-mail: [email protected]