Corporate Presentation Material
31
AUSTRALIS OIL & GAS LIMITED ABN 34 609 262 937 Level 29, 77 St. George’s Terrace, Perth WA 6000, Australia • GPO Box 2548, Perth WA 6831 T +61 (8) 9220 8700 • F +61 (8) 9220 8799 www.australisoil.com ASX Announcement For Immediate Release 1 March 2021 Corporate Presentation Material Please find attached the investor presentation for the Australis Oil and Gas Limited capital raising. This ASX announcement was authorised for release by the Australis Disclosure Committee. For further information, please contact either: Ian Lusted Managing Director Australis Oil & Gas Limited +61 8 9220 8700 Graham Dowland Finance Director Australis Oil & Gas Limited +61 8 9220 8700
Transcript of Corporate Presentation Material

AUSTRALIS OIL & GAS LIMITED ABN 34 609 262 937
Level 29, 77 St. George’s Terrace, Perth WA 6000, Australia • GPO Box 2548, Perth WA 6831
T +61 (8) 9220 8700 • F +61 (8) 9220 8799
www.australisoil.com
ASX Announcement For Immediate Release
1 March 2021
Corporate Presentation Material
Please find attached the investor presentation for the Australis Oil and Gas Limited capital raising.
This ASX announcement was authorised for release by the Australis Disclosure Committee.
For further information, please contact either:
Ian Lusted
Managing Director
Australis Oil & Gas Limited
+61 8 9220 8700
Graham Dowland
Finance Director
Australis Oil & Gas Limited
+61 8 9220 8700

Capital RaiseFebruary 2021
ASX: ATS
NOT FOR DISTRIBUTION OR RELEASE IN THE US

Important Notice and Disclaimers
2
This presentation has been prepared by Australis Oil & Gas Limited ABN 34 609 262 937 (ASX: ATS) (Australis).
Australis means Australis Oil & Gas Limited and, where appropriate, all subsidiaries as at the date of this presentation.
Summary of information: This presentation contains general and background information about Australis’ activities current as at the date of the presentation and should not be considered to be comprehensive or to comprise all the information that an investor should consider when making an investment decision. The information is provided in summary form, has not been independently verified, and should not be considered to be comprehensive or complete. The information in this presentation remains subject to change without notice. Australis is not responsible for providing updated information and assumes no responsibility to do so.
Professional or Sophisticated Investor: This presentation is being provided to you on the basis that you are, and you represent and warrant that a) if you are in Australia, you are a “professional investor” or “sophisticated investor” (as those terms are used in section 708(11) and section 708(8) respectively of the Corporations Act 2001 (Cth) (“Corporations Act”)) and are also, in each case, a “wholesale client” (as defined in section 761A of the Corporations Act); or b) if you are outside Australia, you are a person to whom an offer and issue of securities can be made outside Australia without registration, lodgement or approval of a formal disclosure document or other filing in accordance with the laws of that foreign jurisdiction, and in either case, you are not in the United States and you are not a U.S. Person (as defined in Regulation S under the U.S. Securities Act of 1933, as amended) (“U.S. Person”) and you are not acting for the account or benefit of any U.S. Person.
Not financial product advice: This presentation is not financial product, investment advice or a recommendation to acquire Australis securities and has been prepared without taking into account the objectives, financial situation or needs of individuals. Before making an investment decision prospective investors should consider the appropriateness of the information having regard to their own objectives, financial situation and needs, and seek legal, taxation and financial advice appropriate to their jurisdiction and circumstances. Australis is not licensed to provide financial product advice in respect of its securities or any other financial products. Australis is not licensed to provide financial product advice in respect of its securities or any other financial products. Cooling off rights do not apply to the acquisition of Australis securities. Australis assumes that the recipient is capable of making its own independent assessment, without reliance on this document, of the information and any potential investment and will conduct its own investigation.
Disclaimer: Australis and its related bodies corporate and each of their respective directors, agents, officers, employees and advisers expressly disclaim, to the maximum extent permitted by law, all liabilities (however caused, including negligence) in respect of, make no representations regarding, and take no responsibility for, any part of this presentation and make no representation or warranty as to the currency, accuracy, reliability or completeness of any information, statements, opinions, conclusions or representations contained in this presentation. In particular, this presentation does not constitute, and shall not be relied upon as, a promise, representation, warranty or guarantee as to the past, present or the future performance of Australis.
Future performance: This presentation contains certain forward-looking statements and opinion. Generally, words such as “anticipates”, “expects”, “intends”, “plans”, “believes”, “seeks”, “estimates”, “potential” and similar expressions are intended to identify forward-looking statements. The forward-looking statements, opinion and estimates provided in this presentation are based on assumptions and contingencies which are subject to change without notice, as are statements about market and industry trends, which are based on interpretations of current market conditions. Forward-looking statements, including projections, forecasts and estimates, are provided as a general guide only and should not be relied on as an indication or guarantee of future performance and involve known and unknown risks, uncertainties and other factors, many of which are outside the control of Australis. Past performance is not necessarily a guide to future performance and no representation or warranty is made as to the likelihood of achievement or reasonableness of any forward-looking statements or other forecast.
Risks: An investment in Australis’ shares is subject to investment and other known and unknown risks, some of which are beyond the control of Australis. You should have regard to the ‘Risks’ section of this presentation (set out in slides 25 and 26) which outlines some of these risks.
Non-IFRS Measures: References are made within this presentation to certain financial measures that do not have a standardised meaning prescribed by Australian Accounting Standards and International Financial Reporting Standards (collectively, IFRS). Such measures are neither required by, nor calculated in accordance with IFRS, and therefore are considered Non–IFRS financial measures. Field Netback and EBITDA, as defined within the Glossary, are Non-IFRS financial measures commonly used in the oil and gas industry that Australis believes provide useful information to readers in assessing the financial performance and condition of the Company. Non-IFRS financial measures used by the Company, such as Field Netback and EBITDA, may not be comparable with the calculation of similar measures by other companies and should not be construed as an alternative to other financial measures determined in accordance with IFRS.
Not an offer: This presentation is for information purposes only. This presentation is not, and should not be considered as, an offer or an invitation to acquire securities in Australis or any other financial products and neither this document nor any of its contents will form the basis of any contract or commitment. This presentation is not a prospectus and does not contain all the information which would be required to be contained in a prospectus. Offers of securities in Australis will only be made in places in which, or to persons to whom it would be lawful to make such offers. Neither this presentation nor any of its contents may be reproduced or used for any other purpose without the prior written consent of Australis.
No Distribution in the US: This investor presentation is not an offer of securities for sale in the United States. Securities of Australis are not registered under the US Securities Act of 1933, as amended (the "US Securities Act") and may not be offered or sold in the United States absent registration or an exemption from registration under the US Securities Act. No public offer of the securities is being made in the United States and the information contained herein does not constitute an offer of securities for sale in the United States. This presentation is not for distribution directly or indirectly in or into the United States or to U.S. Persons.
Monetary values: Unless otherwise stated, all dollar values are in United States Dollars (US$). The information in this presentation remains subject to change without notice.
NOT FOR DISTRIBUTION OR RELEASE IN THE US

Australis – Compelling Strategic Opportunity
3
✓ Evolution of US unconventional industry accelerated by COVID 19 pandemic and shareholder pressure for capital returns and disciplined development – Tier 1 oil inventory shortage
✓ Scope for material production growth in developed plays limited to Permian but industry consolidation has concentrated Tier 1 acreage into fewer hands
✓ Players without significant Permian inventories have increasingly limited options as few undeveloped Tier 1 unconventional oil plays remain in the United States
2
✓ Tier 1 Productivity of the delineated TMS Core already proven by others and further demonstrated by Australis
✓ Base case well economics established with sources for significant potential upside identified
✓ ATS is the largest acreage holder in and has effective control of the TMS Core with over 100,000 contiguous net acres, representing ~400 future net well locations
✓ Large resource 2P + 2C mid case recoverable estimate of 170 MMbbls1 and opportunity for significant growth
1
✓ Achieved positive cash flows from operations each quarter in 2020 and maintained ability to pay down credit facility, even through downturn, due to:
✓ Disciplined cost management ✓ Execution of robust hedge programs✓ Continued strong well performance
✓ Increased PDP reserves to 3.7 MMbbl at YE 20201, with an NPV(10) of US$55mm2
✓ Changing market conditions raising the profile of ATS TMS assets as unique Tier 1 opportunity
✓ Timing is right for a modest capital raise to recommence leasing of the TMS core area mineral rights; general working capital purposes to aid any negotiations with potential partners, provide capacity for additional debt repayments if desirableA
and to pay the costs of the offer✓ Position ATS appropriately to take advantage of valuation re-rating
3
4
ATS holds a material position in a play with demonstrated Tier 1 productivity and economics
TMS Assets have performed throughout recent volatility and remain positioned for success
Changes in shale industry aligning with Australis strategy
Ability to solidify TMS position at entry cost levels exists today
NOT FOR DISTRIBUTION OR RELEASE IN THE US
A There is no obligation for the Company to accelerate existing debt repayments and there is currently no intention of doing so.
Equity Raising Overview & Timetable
4
Indicative Financing Timetable
Trading Halt Pre-open ASX trading Thursday, 25 February 2021
Australian and international placement opens
10:00 am (AEDT), Thursday 25 February 2021
Australian and international placement closes
4:00 pm (AEDT), Thursday 25 February 2021
ASX release of Placement and SPP and return to trading
Monday 1 March 2021
Settlement of Tranche 1 Friday 5 March 2021
Allotment of Tranche 1 Monday 8 March 2021
SPP Opens Monday 8 March 2021
SPP Closes Friday 26 March 2021
General Meeting to approve Tranche 2 (Director Participation)
AGM - Tuesday 11 May 2021
Settlement of Tranche 2 (Director Participation)
AGM – Thursday 13 May 2021
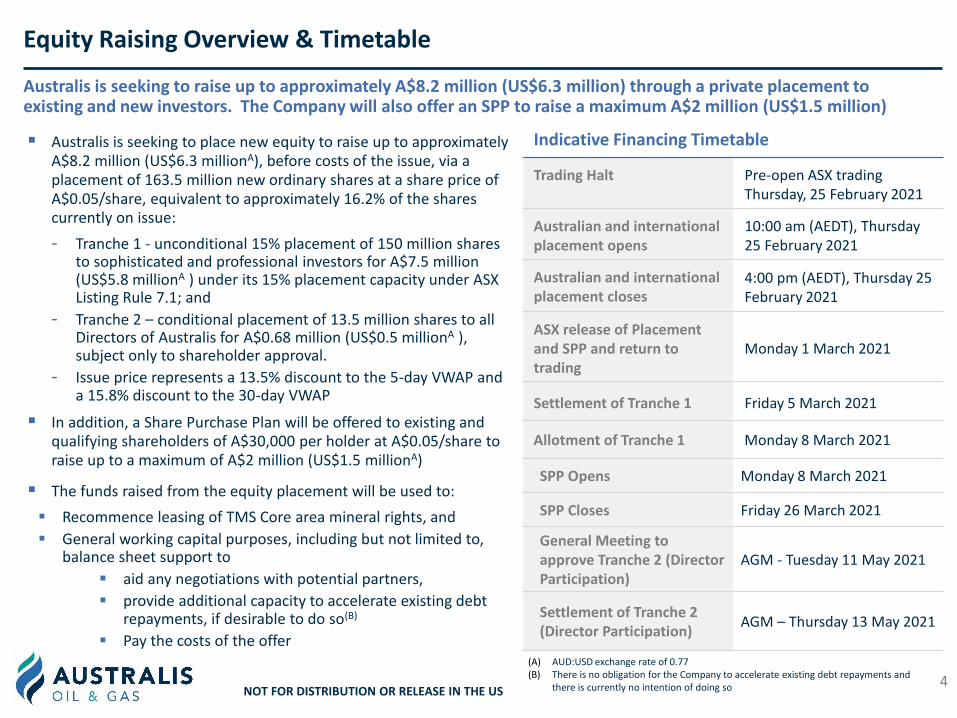
▪ Australis is seeking to place new equity to raise up to approximately A$8.2 million (US$6.3 millionA), before costs of the issue, via a placement of 163.5 million new ordinary shares at a share price of A$0.05/share, equivalent to approximately 16.2% of the shares currently on issue:
- Tranche 1 - unconditional 15% placement of 150 million shares to sophisticated and professional investors for A$7.5 million (US$5.8 millionA ) under its 15% placement capacity under ASX Listing Rule 7.1; and
- Tranche 2 – conditional placement of 13.5 million shares to all Directors of Australis for A$0.68 million (US$0.5 millionA ), subject only to shareholder approval.
- Issue price represents a 13.5% discount to the 5-day VWAP and a 15.8% discount to the 30-day VWAP
▪ In addition, a Share Purchase Plan will be offered to existing and qualifying shareholders of A$30,000 per holder at A$0.05/share to raise up to a maximum of A$2 million (US$1.5 millionA)
▪ The funds raised from the equity placement will be used to:
▪ Recommence leasing of TMS Core area mineral rights, and
▪ General working capital purposes, including but not limited to, balance sheet support to
▪ aid any negotiations with potential partners,
▪ provide additional capacity to accelerate existing debt repayments, if desirable to do so(B)
▪ Pay the costs of the offer(A) AUD:USD exchange rate of 0.77(B) There is no obligation for the Company to accelerate existing debt repayments and
there is currently no intention of doing soNOT FOR DISTRIBUTION OR RELEASE IN THE US
Australis is seeking to raise up to approximately A$8.2 million (US$6.3 million) through a private placement to existing and new investors. The Company will also offer an SPP to raise a maximum A$2 million (US$1.5 million)

▪ Proven oil productivity is on par or better than other established US Tier 1 oil shale basins
▪ Multiple wells across the field with 6 year production history, provides type curve confidence
▪ Australis PDP increased at YE20 (vs YE19) due to well performance and cost reductions
▪ ~107,500 net acres in the TMS Core - long life leases and low average royalties (<20%)
▪ Material asset with mid case recoverable estimate (2P + 2C) of 170 million barrels (net)1
and ability to scale further
▪ ~400 net future well locations each with NPV10 per well > US$3.9 million @ US$55/bblA
▪ Contiguous lease position enables scale & manufacturing approach to development
▪ Strategic location in heart of TMS Core ensures engagement with ATS is only viable entry route for a new entrant seeking a material position and potential for acreage expansion
▪ Field rules & lease life allow operator, currently ATS, control over pace of capital deployment
▪ TMS Core one of the few remaining undeveloped Tier 1 oil shale plays with scale and no federal leases.
▪ TMS production 95% oil weighted
▪ Quality light sweet crude sold at LLS pricing, achieved ~US$2.10/bbl premium to WTI (Feb 21)
▪ Access to oil sales infrastructure with capacity and proximity to multiple oil markets
Highly Productive Reservoir
Significant Acreage & Resource
Key Advantages
Premium Oil and Pricing
The TMS Core is a Unique Tier 1 Asset Proven productivity performance and key advantages sought by shale industry when replacing depleting Tier 1 oil inventory
5
A. See Slides 18 & 19 for more details
NOT FOR DISTRIBUTION OR RELEASE IN THE US

TMS Core – Substantial acreage position with scale and control
6
TMS Project Asset ProfileMississippi and Louisiana, USA
Net Acres~107,500
(37,700 HBP)
Producing Wells37 operated
17 non-operated
Net well locations
~400
▪ Large contiguous land position in the TMS Core with >100,000 net acres (none on federal lands)
▪ Ideal location – services, infrastructure, roads, pipelines etc
▪ Development flexibility – long lease life and favourable field rules
▪ Significant inventory of approx. 400 net well locations
▪ Opportunity to grow acreage position within TMS Core
▪ Third party activity in leasing and well permitting
▪ Potential for material acreage increase
Acreage Expiry Profile
37,700
34,000
22,500
13,300
HBP 2023+ 2022 2021
NOT FOR DISTRIBUTION OR RELEASE IN THE US

TMS Core - Significant oil reserve and resource
▪ PDP Reserves of 3.7MMbbls1; an increase over YE20193, due primarily to lower achieved operating costs
▪ PDP NPV(10) of ~US$47 million1, at a flat US$47.02 oil price, increases to US$55 million2 based on WTI strip at 22 February 2021.
▪ Undeveloped reserves based on very modest development in next 5 years of 58 gross (40 WI) wells on only 10,400 net acres – 10% of overall leasehold position
▪ Remaining net undeveloped leasehold acreage allocated to contingent resource
7
Australis TMS Reserves and Resources – as at 31 December 2020
Material mid case recoverable estimate of 170 million bbls independently verified (Ryder Scott LP)
Reserve and Resource categoryAustralis Net Oil
(MMbbls)
Reserves1
Proved Developed Producing (PDP) 3.7
Proved (1P) 10.4
Proved + Probable (2P) 21.0
Proved + Probable + Possible (3P) 27.5
Resources1
Low Contingent (1C) 20.8
Best Contingent (2C) 149.4
High Contingent (3C) 270.7
NOT FOR DISTRIBUTION OR RELEASE IN THE US
4
2020 Operational Performance and Results
Disciplined capital management and TMS asset performance drove strong 2020 results despite challenging market conditions
8
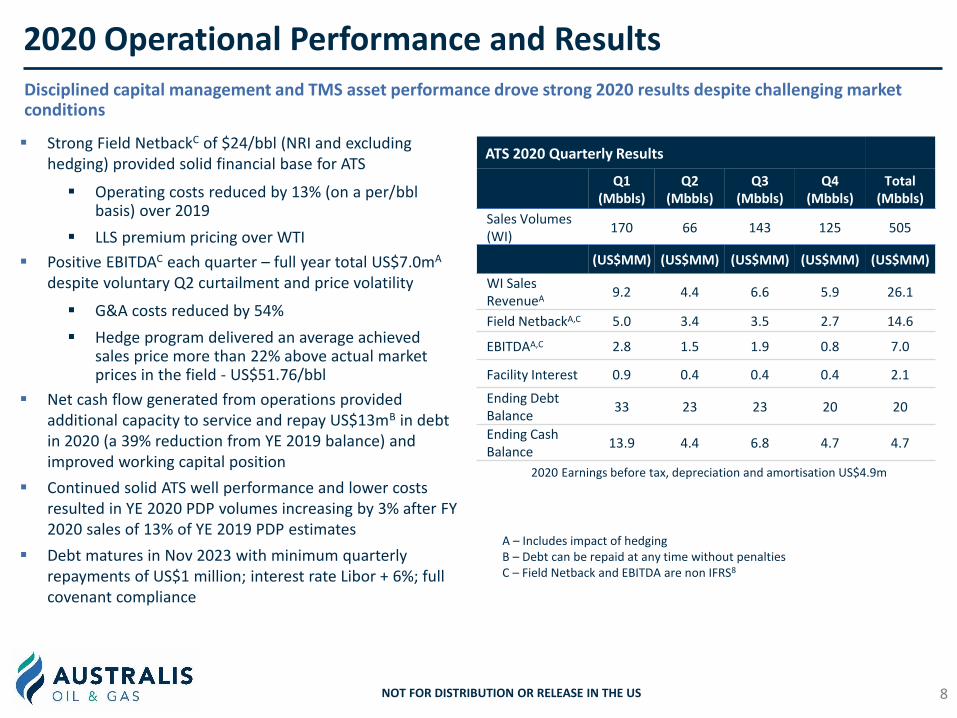
ATS 2020 Quarterly Results
Q1 (Mbbls)
Q2 (Mbbls)
Q3(Mbbls)
Q4(Mbbls)
Total(Mbbls)
Sales Volumes (WI)
170 66 143 125 505
(US$MM) (US$MM) (US$MM) (US$MM) (US$MM)
WI Sales RevenueA
9.2 4.4 6.6 5.9 26.1
Field NetbackA,C 5.0 3.4 3.5 2.7 14.6
EBITDAA,C 2.8 1.5 1.9 0.8 7.0
Facility Interest 0.9 0.4 0.4 0.4 2.1
Ending Debt Balance
33 23 23 20 20
Ending Cash Balance
13.9 4.4 6.8 4.7 4.7
▪ Strong Field NetbackC of $24/bbl (NRI and excluding hedging) provided solid financial base for ATS
▪ Operating costs reduced by 13% (on a per/bblbasis) over 2019
▪ LLS premium pricing over WTI
▪ Positive EBITDAC each quarter – full year total US$7.0mA
despite voluntary Q2 curtailment and price volatility
▪ G&A costs reduced by 54%
▪ Hedge program delivered an average achieved sales price more than 22% above actual market prices in the field - US$51.76/bbl
▪ Net cash flow generated from operations provided additional capacity to service and repay US$13mB in debt in 2020 (a 39% reduction from YE 2019 balance) and improved working capital position
▪ Continued solid ATS well performance and lower costs resulted in YE 2020 PDP volumes increasing by 3% after FY 2020 sales of 13% of YE 2019 PDP estimates
▪ Debt matures in Nov 2023 with minimum quarterly repayments of US$1 million; interest rate Libor + 6%; full covenant compliance
A – Includes impact of hedgingB – Debt can be repaid at any time without penaltiesC – Field Netback and EBITDA are non IFRS8
2020 Earnings before tax, depreciation and amortisation US$4.9m
NOT FOR DISTRIBUTION OR RELEASE IN THE US
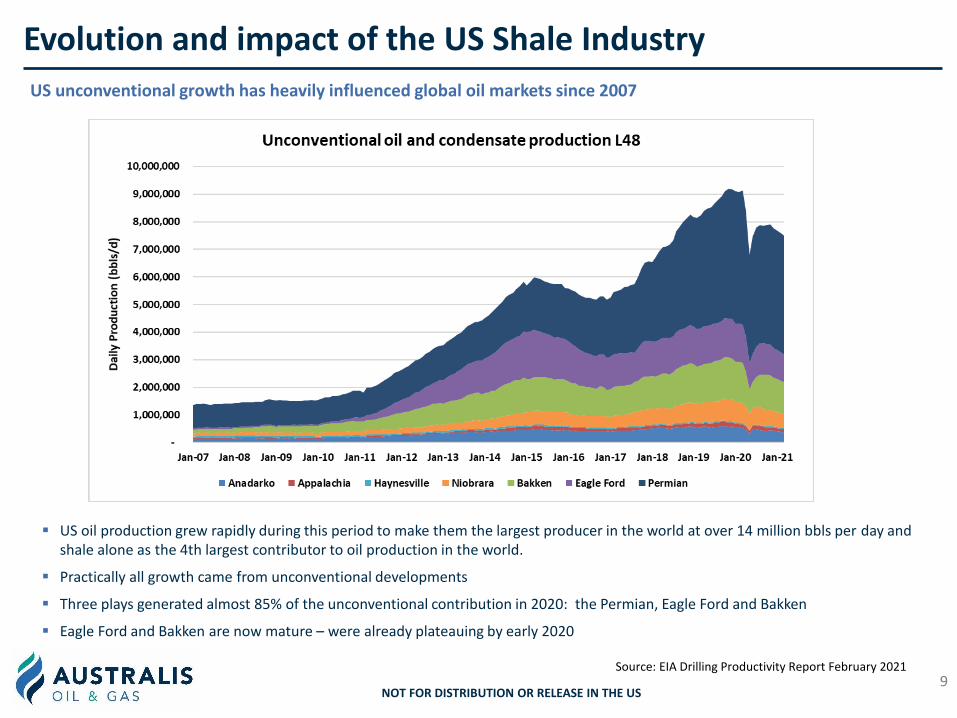
Evolution and impact of the US Shale Industry
US unconventional growth has heavily influenced global oil markets since 2007
9Source: EIA Drilling Productivity Report February 2021
▪ US oil production grew rapidly during this period to make them the largest producer in the world at over 14 million bbls per day and shale alone as the 4th largest contributor to oil production in the world.
▪ Practically all growth came from unconventional developments
▪ Three plays generated almost 85% of the unconventional contribution in 2020: the Permian, Eagle Ford and Bakken
▪ Eagle Ford and Bakken are now mature – were already plateauing by early 2020
NOT FOR DISTRIBUTION OR RELEASE IN THE US

0
500
1,000
1,500
2,000
2,500
3,000
2008 2009 2010 2011 2012 2013 2014 2015 2016 2017 2018 2019 2020
MB
OE/
Day
Eagle Ford Shale Production
Oil (mbbl/d) Condensate (mbbl/d) Gas (mboe/d)
Life Cycle of a Shale Play
Eagle Ford Shale – Delineation, Improvement, Growth then Plateau
10
Next 12,000 new wells
Plateau
Source: Texas Railroad Commission and Shale Profile
NOT FOR DISTRIBUTION OR RELEASE IN THE US

Consolidation Occurring in the PermianPermian Basin – Still plenty of Tier 1 inventory but industry consolidation limits entry opportunities for those companies without exposure
▪ Six material corporate deals in the Permian during 2H 2020 – over 1.1 million acres acquired for US$42.6 billion
▪ Public disclosure from these six transactions indicate a significant number of additional companies were also exploring consolidation opportunities.
▪ Consistent themes supporting the acquisitions include
− Increasing Tier-1 assets and drilling inventory to satisfy pressure for accelerating ROC vs. reinvestment/recycle
− Increasing size and scale
− Cost synergies – reducing operating and overhead costs
▪ By Jan 2021, following consolidation, the 10 largest acreage holders had amassed 62% of the 22 million acre greater Permian Basin.
▪ Opportunities to acquire a meaningful position have become more difficult in the Permian basin due to high cost and availability
▪ Australis believes more parties requiring Tier-1 inventory will have to look to non-Permian opportunities
11
Date Buyer SellerTransaction
TypeValue (US$B)
Existing Basin exposure
Permian Acres Purchased
Combined Permian Acres
Acreage Uplift
Jul-20 Chevron Noble Corp $13 Permian, DJ, others 92,000 1,700,000 6%
Sep-20 Devon WPXA Corp $5.6 Permian, Bakken 150,000 400,000 60%
Oct-20 ConocoPhillips Concho Corp $13.3 Permian 550,000 700,000 367%
Oct-20 Pioneer ParsleyA Corp $7.6 Permian 250,000 930,000 37%
Dec-20 Diamondback QEP & Guidon Corp $3 Permian 81,564 429,000 23%
Total $42.6 1,123,564 4,159,000 37%
“the best companies have been picked off in the past few weeks” “can’t see much more happening” (Scott Sheffield, CEO Pioneer Natural Resources on acquisition of Parsley Energy, 20 October 2020)
A: See slide 20 for case histories showing both purchased companies acting as consolidator during transactions which closed in Q1 2020.
NOT FOR DISTRIBUTION OR RELEASE IN THE US

TMS Core – Tier 1 Basin Productivity
TMS Type Curve well productivity and decline profile outperforms many of the best counties within the four major oil producing basins: the Permian, Eagle Ford, Williston (Bakken) and DJ - Niobrara
12
Source: “The Major Tight Oil Basins” from ShaleProfile Insights May 27 2020. ATS TMS 15 well average has been interposed onto the data.
Average Cum Oil Production v Months on ProductionBest Performing County in Each Oil Play
24 month cum. Oil Production (‘000 bbls)ATS TMS v best counties within major onshore oil US plays
Average Cum oil
production from 15
TMS Type Curve wells
ATS TMS- 15 Well
Average Cum oil
production from 15
TMS Type Curve wells
NOT FOR DISTRIBUTION OR RELEASE IN THE US

Australis strategy and timing
Valuation is always a product of asset quality and scarcity…….empirical data supports TMS Core quality and the US Shale evolution now driving the latter.
13
▪ Prior to COVID-19, the US shale industry was going through a structural shift with diminishing Tier 1 inventory locations due to asset maturity and limited access to capital
▪ Shareholder pressure grew for return of capital over recycling, the result being that shale oil production growth was already slowing prior to the COVID pandemic
▪ Options for acquiring Tier 1 inventory in developed plays are limited and opportunities in the biggest remaining basin, the Permian, have decreased due to ongoing consolidation
▪ With the US heavily explored over the last 14 years the TMS Core is one of the only remaining delineated but undeveloped shale plays with Tier 1 oil productivity
▪ Australis holds a controlling interest within the TMS Core and is custodian of practically all the historical data on the play
▪ The Company is in a position to drive value for this overlooked and undervalued asset in the evolving post COVID market
▪ Investing in Australis at current prices is an opportunity to acquire an interest in this asset at entry level / exploration level cost basis, a rare opportunity for a play with proven production – we trade at an enterprise value of US$0.03A per recoverable bbl in the ground. Our type curve well has an NPV(10) of US$8/bbl at WTI US$55/bblB
A: Value allocation assumes an EV of US$60m, an NPV(10) of PDP at US$55m2 and 170 MMbbls1 mid case recoverable (2P + 2C) B: This is the economics of a single well (see Slide 18), care should be taken if extrapolating across 400 net locations due to the likely scheduling of those wells and associated discount effect.
NOT FOR DISTRIBUTION OR RELEASE IN THE US
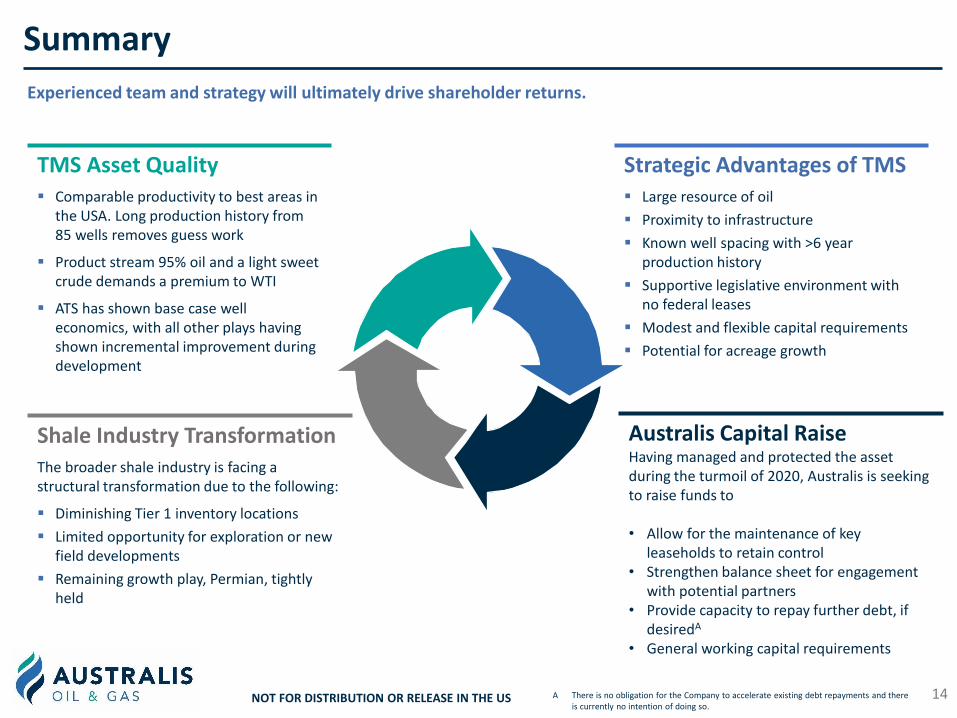
Summary
Experienced team and strategy will ultimately drive shareholder returns.
14
TMS Asset Quality▪ Comparable productivity to best areas in
the USA. Long production history from 85 wells removes guess work
▪ Product stream 95% oil and a light sweet crude demands a premium to WTI
▪ ATS has shown base case well economics, with all other plays having shown incremental improvement during development
Shale Industry TransformationThe broader shale industry is facing a structural transformation due to the following:
▪ Diminishing Tier 1 inventory locations
▪ Limited opportunity for exploration or new field developments
▪ Remaining growth play, Permian, tightly held
Strategic Advantages of TMS▪ Large resource of oil
▪ Proximity to infrastructure
▪ Known well spacing with >6 year production history
▪ Supportive legislative environment with no federal leases
▪ Modest and flexible capital requirements
▪ Potential for acreage growth
Australis Capital RaiseHaving managed and protected the asset during the turmoil of 2020, Australis is seeking to raise funds to
• Allow for the maintenance of key leaseholds to retain control
• Strengthen balance sheet for engagement with potential partners
• Provide capacity to repay further debt, if desiredA
• General working capital requirements
NOT FOR DISTRIBUTION OR RELEASE IN THE US A There is no obligation for the Company to accelerate existing debt repayments and there is currently no intention of doing so.

15
Additional Information
NOT FOR DISTRIBUTION OR RELEASE IN THE US
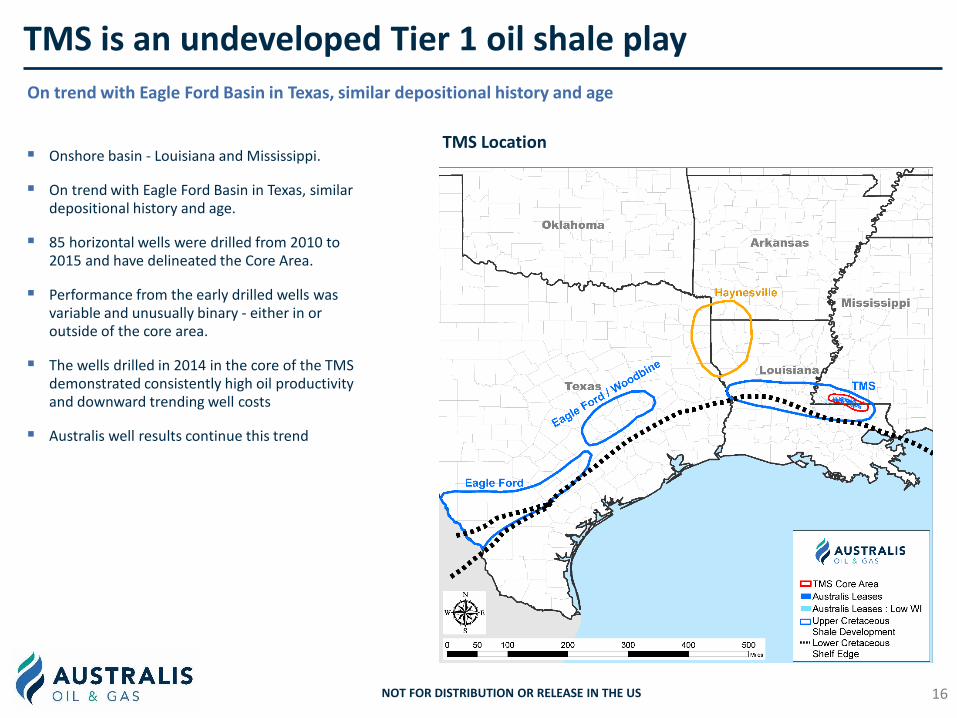
TMS is an undeveloped Tier 1 oil shale play
On trend with Eagle Ford Basin in Texas, similar depositional history and age
▪ Onshore basin - Louisiana and Mississippi.
▪ On trend with Eagle Ford Basin in Texas, similar depositional history and age.
▪ 85 horizontal wells were drilled from 2010 to 2015 and have delineated the Core Area.
▪ Performance from the early drilled wells was variable and unusually binary - either in or outside of the core area.
▪ The wells drilled in 2014 in the core of the TMS demonstrated consistently high oil productivity and downward trending well costs
▪ Australis well results continue this trend
16
TMS Location
NOT FOR DISTRIBUTION OR RELEASE IN THE US

Single Well TMS Type Curve
TMS Type Curve is a simple history match to averaged data from 15 ATS operated wells drilled in 2014
17
Type Curve Well EUR Basis
TMS Type Curve 656 MboeHistory match average of the 15 wells spudded by Encana in 2014 (~7,200 ft stimulated lateral)
TMS Productivity Upside 787 Mboe20% uplift of the TMS Type Curve which is less than the industry average improvement in well performance (normalised) since 2014
▪ Oil EUR – 610 Mbbls
▪ Gas EUR – 159 MMscf
▪ NGL EUR – 20 Mbbls
▪ EUR (30 yr) – 656 Mboe
(97% liquids)
-
50,000
100,000
150,000
200,000
250,000
1 2 3 4 5 6 7 8 9 10 11 12 13 14 15 16 17 18 19 20 21 22 23 24
Oil
Pro
du
ctio
n (
bb
l)
Production Month
TMS Completion wells TMS Core Type Curve
TMS Type Curve – Assumptions TMS Core Type Curve v TMS Production
NOT FOR DISTRIBUTION OR RELEASE IN THE US
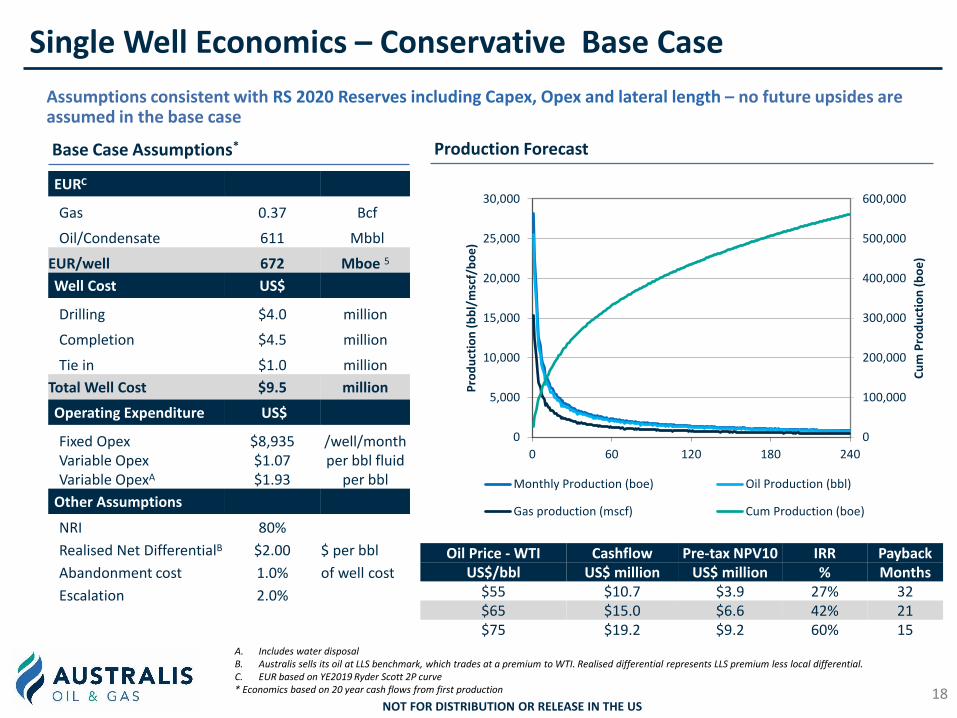
Single Well Economics – Conservative Base Case
Assumptions consistent with RS 2020 Reserves including Capex, Opex and lateral length – no future upsides are assumed in the base case
EURC
Gas 0.37 Bcf
Oil/Condensate 611 Mbbl
EUR/well 672 Mboe 5
Well Cost US$
Drilling $4.0 million
Completion $4.5 million
Tie in $1.0 million
Total Well Cost $9.5 million
Operating Expenditure US$
Fixed Opex $8,935 /well/monthVariable OpexVariable OpexA
$1.07$1.93
per bbl fluidper bbl
Other Assumptions
NRI 80%
Realised Net DifferentialB $2.00 $ per bbl
Abandonment cost 1.0% of well cost
Escalation 2.0%
Production ForecastBase Case Assumptions*
Oil Price - WTI Cashflow Pre-tax NPV10 IRR PaybackUS$/bbl US$ million US$ million % Months
$55 $10.7 $3.9 27% 32$65 $15.0 $6.6 42% 21$75 $19.2 $9.2 60% 15
A. Includes water disposalB. Australis sells its oil at LLS benchmark, which trades at a premium to WTI. Realised differential represents LLS premium less local differential.C. EUR based on YE2019 Ryder Scott 2P curve * Economics based on 20 year cash flows from first production 18
NOT FOR DISTRIBUTION OR RELEASE IN THE US
0
100,000
200,000
300,000
400,000
500,000
600,000
0
5,000
10,000
15,000
20,000
25,000
30,000
0 60 120 180 240
Cu
m P
rod
uct
ion
(b
oe
)
Pro
du
ctio
n (
bb
l/m
scf/
bo
e)
Monthly Production (boe) Oil Production (bbl)
Gas production (mscf) Cum Production (boe)

Large well inventory each with attractive economics
Australis has 400 net well locations - each with a base value of US$3.9 million @ $55/bbl (excluding upside)
19
$3.9
$2.8$0.5 $7.2
$3.2 $10.4
Single Well Economics:WTI @ $55/bbl$9.5MM/well
20% ProductivityIncrease
Well Cost Decrease to$9MM/well
Total WTI @ $65/bbl Total
Single Well Economics NPV10A (US$ million)
A. Assumes realised net LLS premium of $2 over WTI and is pre-tax
Stewart well drilled by ATS in
Q4 2018 at $55/bbl WTI
IRR 27% IRR 74%IRR 49%
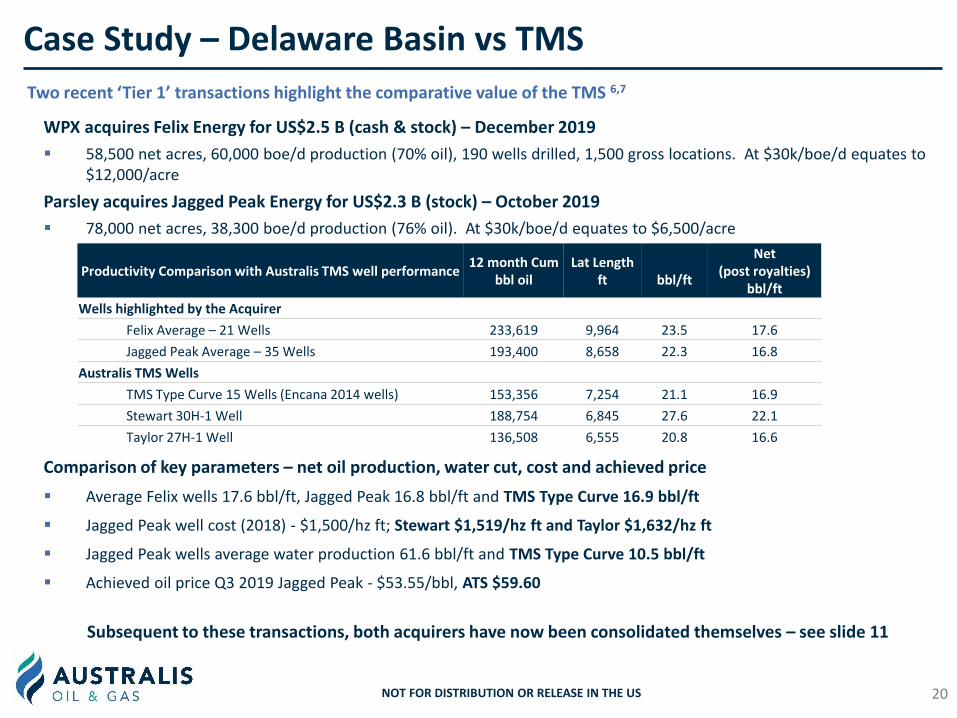
Case Study – Delaware Basin vs TMS
Two recent ‘Tier 1’ transactions highlight the comparative value of the TMS 6,7
WPX acquires Felix Energy for US$2.5 B (cash & stock) – December 2019
▪ 58,500 net acres, 60,000 boe/d production (70% oil), 190 wells drilled, 1,500 gross locations. At $30k/boe/d equates to $12,000/acre
Parsley acquires Jagged Peak Energy for US$2.3 B (stock) – October 2019
▪ 78,000 net acres, 38,300 boe/d production (76% oil). At $30k/boe/d equates to $6,500/acre
20
Productivity Comparison with Australis TMS well performance12 month Cum
bbl oilLat Length
ft bbl/ft
Net (post royalties)
bbl/ft
Wells highlighted by the Acquirer
Felix Average – 21 Wells 233,619 9,964 23.5 17.6
Jagged Peak Average – 35 Wells 193,400 8,658 22.3 16.8
Australis TMS Wells
TMS Type Curve 15 Wells (Encana 2014 wells) 153,356 7,254 21.1 16.9
Stewart 30H-1 Well 188,754 6,845 27.6 22.1
Taylor 27H-1 Well 136,508 6,555 20.8 16.6
Comparison of key parameters – net oil production, water cut, cost and achieved price
▪ Average Felix wells 17.6 bbl/ft, Jagged Peak 16.8 bbl/ft and TMS Type Curve 16.9 bbl/ft
▪ Jagged Peak well cost (2018) - $1,500/hz ft; Stewart $1,519/hz ft and Taylor $1,632/hz ft
▪ Jagged Peak wells average water production 61.6 bbl/ft and TMS Type Curve 10.5 bbl/ft
▪ Achieved oil price Q3 2019 Jagged Peak - $53.55/bbl, ATS $59.60
Subsequent to these transactions, both acquirers have now been consolidated themselves – see slide 11
NOT FOR DISTRIBUTION OR RELEASE IN THE US
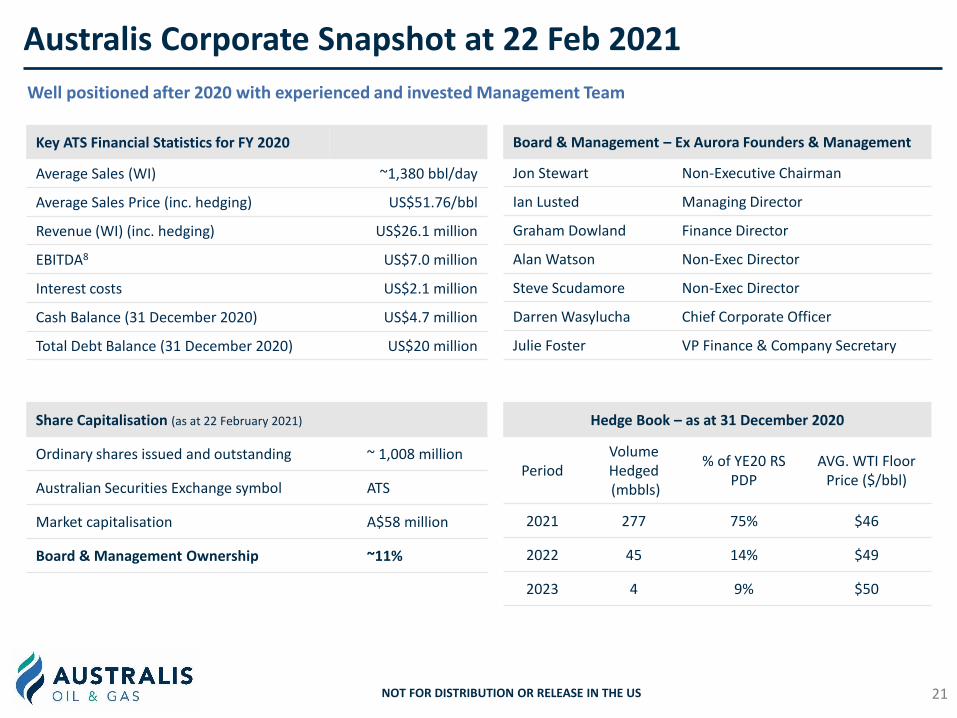
Australis Corporate Snapshot at 22 Feb 2021
21
Key ATS Financial Statistics for FY 2020
Average Sales (WI) ~1,380 bbl/day
Average Sales Price (inc. hedging) US$51.76/bbl
Revenue (WI) (inc. hedging) US$26.1 million
EBITDA8 US$7.0 million
Interest costs US$2.1 million
Cash Balance (31 December 2020) US$4.7 million
Total Debt Balance (31 December 2020) US$20 million
Share Capitalisation (as at 22 February 2021)
Ordinary shares issued and outstanding ~ 1,008 million
Australian Securities Exchange symbol ATS
Market capitalisation A$58 million
Board & Management Ownership ~11%
Board & Management – Ex Aurora Founders & Management
Jon Stewart Non-Executive Chairman
Ian Lusted Managing Director
Graham Dowland Finance Director
Alan Watson Non-Exec Director
Steve Scudamore Non-Exec Director
Darren Wasylucha Chief Corporate Officer
Julie Foster VP Finance & Company Secretary
Well positioned after 2020 with experienced and invested Management Team
Hedge Book – as at 31 December 2020
PeriodVolume Hedged(mbbls)
% of YE20 RS PDP
AVG. WTI Floor Price ($/bbl)
2021 277 75% $46
2022 45 14% $49
2023 4 9% $50
NOT FOR DISTRIBUTION OR RELEASE IN THE US

Indicative Capital Structure post the Placement & SPP
22
Assumes
- Tranche 1: 150 million shares issued at 5c to raise A$7.5 million before costs,
- Tranche 2: 13.5 million shares issued at 5c to raise A$0.675 million, and
- The SPP: 40 million new shares being issued at 5 cents to raise A$2.0 million - assuming existing shareholders subscribe to at least the A$2 million cap.
SharesExisting Shares
PlacementsProforma Post
Placements
SPP(subscribed to the A$2
million cap)A
Pro forma on issue
A$ Raised
ATS shares (millions) A$’000
Tranche 1 Tranche 2
Directors & Employees 112 13.5 125.5 125.5 $675
Other existing Shareholders & new investors
896 150 1,046 40 936 $9,500
Total 1,008 150 13.5 1,171.5 40 1,211.5 $10,175
A: Assumes valid applications received for the capped amount of A$2 million.
There is no guarantee of any amount being raised under the SPP.
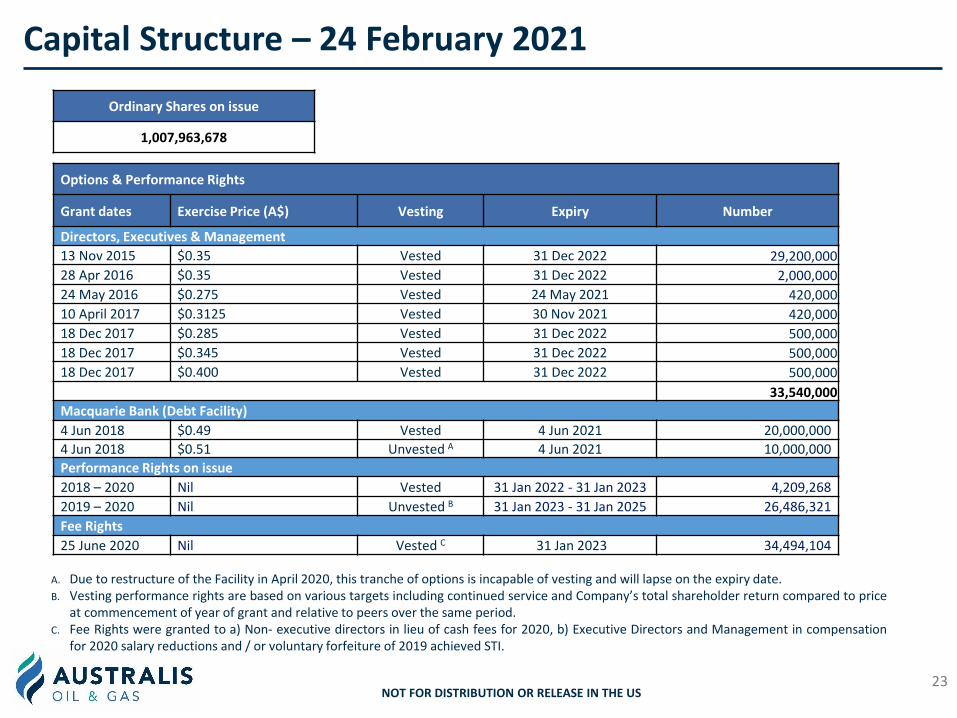
Capital Structure – 24 February 2021
23
Ordinary Shares on issue
1,007,963,678
Options & Performance Rights
Grant dates Exercise Price (A$) Vesting Expiry Number
Directors, Executives & Management
13 Nov 2015 $0.35 Vested 31 Dec 2022 29,200,000
28 Apr 2016 $0.35 Vested 31 Dec 2022 2,000,000
24 May 2016 $0.275 Vested 24 May 2021 420,000
10 April 2017 $0.3125 Vested 30 Nov 2021 420,000
18 Dec 2017 $0.285 Vested 31 Dec 2022 500,000
18 Dec 2017 $0.345 Vested 31 Dec 2022 500,000
18 Dec 2017 $0.400 Vested 31 Dec 2022 500,000
33,540,000
Macquarie Bank (Debt Facility)
4 Jun 2018 $0.49 Vested 4 Jun 2021 20,000,000
4 Jun 2018 $0.51 Unvested A 4 Jun 2021 10,000,000
Performance Rights on issue
2018 – 2020 Nil Vested 31 Jan 2022 - 31 Jan 2023 4,209,268
2019 – 2020 Nil Unvested B 31 Jan 2023 - 31 Jan 2025 26,486,321
Fee Rights
25 June 2020 Nil Vested C 31 Jan 2023 34,494,104
A. Due to restructure of the Facility in April 2020, this tranche of options is incapable of vesting and will lapse on the expiry date.B. Vesting performance rights are based on various targets including continued service and Company’s total shareholder return compared to price
at commencement of year of grant and relative to peers over the same period.C. Fee Rights were granted to a) Non- executive directors in lieu of cash fees for 2020, b) Executive Directors and Management in compensation
for 2020 salary reductions and / or voluntary forfeiture of 2019 achieved STI.
NOT FOR DISTRIBUTION OR RELEASE IN THE US
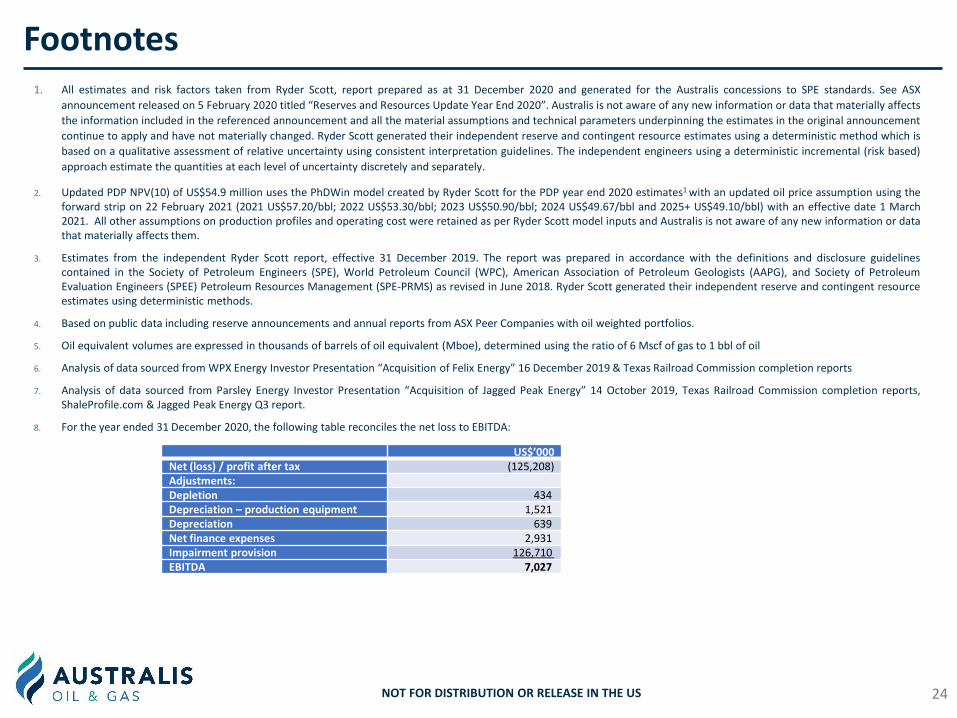
Footnotes1. All estimates and risk factors taken from Ryder Scott, report prepared as at 31 December 2020 and generated for the Australis concessions to SPE standards. See ASX
announcement released on 5 February 2020 titled “Reserves and Resources Update Year End 2020”. Australis is not aware of any new information or data that materially affects
the information included in the referenced announcement and all the material assumptions and technical parameters underpinning the estimates in the original announcement
continue to apply and have not materially changed. Ryder Scott generated their independent reserve and contingent resource estimates using a deterministic method which is
based on a qualitative assessment of relative uncertainty using consistent interpretation guidelines. The independent engineers using a deterministic incremental (risk based)
approach estimate the quantities at each level of uncertainty discretely and separately.
2. Updated PDP NPV(10) of US$54.9 million uses the PhDWin model created by Ryder Scott for the PDP year end 2020 estimates1 with an updated oil price assumption using theforward strip on 22 February 2021 (2021 US$57.20/bbl; 2022 US$53.30/bbl; 2023 US$50.90/bbl; 2024 US$49.67/bbl and 2025+ US$49.10/bbl) with an effective date 1 March2021. All other assumptions on production profiles and operating cost were retained as per Ryder Scott model inputs and Australis is not aware of any new information or datathat materially affects them.
3. Estimates from the independent Ryder Scott report, effective 31 December 2019. The report was prepared in accordance with the definitions and disclosure guidelinescontained in the Society of Petroleum Engineers (SPE), World Petroleum Council (WPC), American Association of Petroleum Geologists (AAPG), and Society of PetroleumEvaluation Engineers (SPEE) Petroleum Resources Management (SPE-PRMS) as revised in June 2018. Ryder Scott generated their independent reserve and contingent resourceestimates using deterministic methods.
4. Based on public data including reserve announcements and annual reports from ASX Peer Companies with oil weighted portfolios.
5. Oil equivalent volumes are expressed in thousands of barrels of oil equivalent (Mboe), determined using the ratio of 6 Mscf of gas to 1 bbl of oil
6. Analysis of data sourced from WPX Energy Investor Presentation “Acquisition of Felix Energy” 16 December 2019 & Texas Railroad Commission completion reports
7. Analysis of data sourced from Parsley Energy Investor Presentation “Acquisition of Jagged Peak Energy” 14 October 2019, Texas Railroad Commission completion reports,ShaleProfile.com & Jagged Peak Energy Q3 report.
8. For the year ended 31 December 2020, the following table reconciles the net loss to EBITDA:
24NOT FOR DISTRIBUTION OR RELEASE IN THE US
US$’000 Net (loss) / profit after tax (125,208)Adjustments:Depletion 434Depreciation – production equipment 1,521Depreciation 639Net finance expenses 2,931Impairment provision 126,710EBITDA 7,027
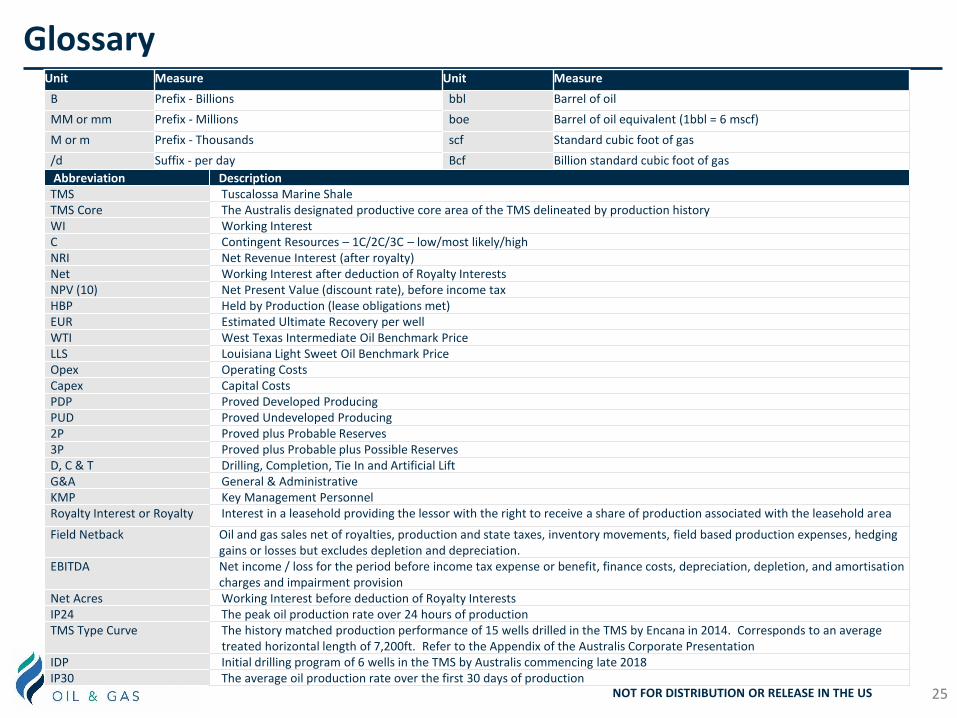
Glossary
25
Unit Measure Unit Measure
B Prefix - Billions bbl Barrel of oil
MM or mm Prefix - Millions boe Barrel of oil equivalent (1bbl = 6 mscf)
M or m Prefix - Thousands scf Standard cubic foot of gas
/d Suffix - per day Bcf Billion standard cubic foot of gas
Abbreviation DescriptionTMS Tuscalossa Marine ShaleTMS Core The Australis designated productive core area of the TMS delineated by production historyWI Working InterestC Contingent Resources – 1C/2C/3C – low/most likely/highNRI Net Revenue Interest (after royalty)Net Working Interest after deduction of Royalty InterestsNPV (10) Net Present Value (discount rate), before income taxHBP Held by Production (lease obligations met)EUR Estimated Ultimate Recovery per wellWTI West Texas Intermediate Oil Benchmark PriceLLS Louisiana Light Sweet Oil Benchmark PriceOpex Operating CostsCapex Capital CostsPDP Proved Developed ProducingPUD Proved Undeveloped Producing2P Proved plus Probable Reserves3P Proved plus Probable plus Possible ReservesD, C & T Drilling, Completion, Tie In and Artificial LiftG&A General & AdministrativeKMP Key Management PersonnelRoyalty Interest or Royalty Interest in a leasehold providing the lessor with the right to receive a share of production associated with the leasehold area
Field Netback Oil and gas sales net of royalties, production and state taxes, inventory movements, field based production expenses, hedging gains or losses but excludes depletion and depreciation.
EBITDA Net income / loss for the period before income tax expense or benefit, finance costs, depreciation, depletion, and amortisation charges and impairment provision
Net Acres Working Interest before deduction of Royalty InterestsIP24 The peak oil production rate over 24 hours of productionTMS Type Curve The history matched production performance of 15 wells drilled in the TMS by Encana in 2014. Corresponds to an average
treated horizontal length of 7,200ft. Refer to the Appendix of the Australis Corporate PresentationIDP Initial drilling program of 6 wells in the TMS by Australis commencing late 2018IP30 The average oil production rate over the first 30 days of production
NOT FOR DISTRIBUTION OR RELEASE IN THE US

Investing in the placement involves inherent risks. Prospective investors should carefully consider, among other things, the risk factors set out below before making an investment decision. The list of risk factors is not exhaustive and there may be other risks relevant to Australis which are not stated herein. For a more comprehensive list of risk factors, please refer to the Annual Report for the year ended 31 December 2020. A prospective investor should carefully consider all the risks related to Australis, and should consult his or her own expert advisors as to the suitability of an investment in Australis. An investment Australis entails significant risks and is suitable only for investors who understand the risk factors associated with this type of investment and who can afford a loss of all or part of the investment. Against this background, an investor should make a careful assessment of Australis and its prospects before deciding to invest.
Offer Risk. The proposed placement is not underwritten, and there is no guarantee applicants will settle. If settlement does not occur with respect to the placement, there is no assurance that Australis will be able to access and secure additional funding on reasonable terms or at all.
Australis is exposed to commodity risk. Australis develops onshore oil and gas assets. The prices of oil and gas are outside the control of Australis and fluctuate; the prices impact the availability and costs of opportunities for Australis, and any future revenue and profitability from the sale of oil and gas. Australis’ strategy is predicated on the belief that the fundamental drivers are in place for a potential increase in oil prices in due course. There is no guarantee the oil price will increase.
Australis is exposed to financing risk. The assets and companies in which Australis invests in are capital intensive and require equity and debt financing in order to develop the projects in which they are involved. If Australis, or the assets or companies in which Australis invests in, are unable to obtain financing on beneficial terms it could have a material adverse effect on Australis's financial condition. The Company has incurred indebtedness under the credit agreement with Macquarie Bank Limited, which may adversely affect its cash flows and ability to operate its business and remain in compliance with and repay such indebtedness. As such Australis is exposed to interest risk on interest bearing current and non current liabilities following a placement of debt.
Australis is exposed to production risk. Within the TMS assets there are a number of producing wells that were drilled and operated by third parties, and many of these are now operated by Australis. Australis has drilled and completed 6 wells which it now operates and produces from. There can be no guarantee that these wells will continue to, or any new wells drilled, will produce at the expected rates and / or for the predicted duration. Physical risks from climate change are those arising from an increase in severity and/or frequency of weather events such as hurricanes and flooding. Weather events, including hurricanes and ice storms, have proven to cause substantial disruptions to hydrocarbon production and as a result of such weather, the Company’s (i) facilities may be substantially damaged and (ii) any oil and gas production may be reduced or interrupted entirely.
Australis is exposed to operational risk. Australis’ future financial condition and results of operations will depend on the success of its exploration, development and production activities. Oil, condensate, and natural gas exploration and production activities are subject to numerous risks, including the risk that drilling will result in dry holes or not result in commercially feasible oil or natural gas production. Selecting a drilling location is influenced by the interpretation of geological, geophysical, and seismic data, which is a subjective science and has varying degrees of success. New wells drilled may not be productive, or may not recover all or any portion of the Company’s investment in such wells. The cost of drilling, completing, equipping and operating wells is typically uncertain before drilling commences.
Australis is exposed to leasing / title risk. Australis has acquired and will continue to acquire Working Interests in leaseholds from mineral rights owners in Louisiana and Mississippi, USA. Certain TMS Leases are, at Australis’ election, capable of renewal or extension. There is no guarantee that existing leases will be renewed, extended or reacquired prior to expiry or that leases on new areas will be acquired. The process of confirming defensible title on leases for oil and gas exploration and production has been performed by experts acting for Australis. If at any time title cannot be determined, it may have a financial impact on the value of that lease.
Australis is exposed to environmental risk. Investments in oil & gas assets involves an inherent exposure to environmental risk which may reduce profitability of certainprojects. Significant liability could be imposed on Australis for damages, clean-up costs or penalties in the event of certain discharges into the environment, environmental damage caused by previous owners of properties purchased or used by Australis, acts of sabotage by third parties or non-compliance with environmental laws or regulations by Australis.
Australis is exposed to legal and regulatory risk. Changes in laws and regulations relating to ownership and the development of land could have an adverse effect on Australis's business. New laws may be introduced which may be retrospective and affect environmental planning, land use and development regulations. Furthermore, changes in tax legislation and/or increases in tax rates could have a material adverse effect on Australis's financial condition.
Risk Factors
26Equity Raising Presentation
NOT FOR DISTRIBUTION OR RELEASE IN THE US

Australis is exposed to key personnel risk. Australis’ success depends in large measure on certain key personnel. The loss of the services of such key personnel may have a material adverse effect on Australis’ business, financial condition, results of operations and prospects. The contributions of the existing management team to the immediate and near term operations are likely to be of central importance. There can be no assurance that Australis will be able to continue to attract and retain all personnel necessary for the implementation, development and operation of its business strategy.
Australis is exposed to resource and reserve estimation risk. There are inherent risks in the estimation of prospective and contingent resources and reserves. There is a risk that such estimations will not convert into reserves or any actual production may significantly vary from such estimates.
Australis is exposed to exchange rate risk. The Company operates in multiple currencies and exchange rates are constantly fluctuating. Australis does not hedge currencies but the current policy is to convert the majority of its cash balances to USD.
Australis is exposed to Competition Risk. The Company competes with numerous other organisations in the search for, and the acquisition of, oil and gas assets. The
Company’s competitors include oil and gas companies that have substantially greater financial resources, staff and facilities than those of the Company. The
Company’s ability to increase its reserves in the future will depend not only on its ability to explore and develop the TMS leases, but also on its ability to select and
acquire suitable producing properties or prospects for drilling.
Risk Factors
27Equity Raising Presentation
NOT FOR DISTRIBUTION OR RELEASE IN THE US

International Offer Restrictions
This document does not constitute an offer of new ordinary shares ("New Shares") of Australis in any jurisdiction in which it would be unlawful. In particular, this document may not be distributed to any person, and the New Shares may not be offered or sold, in any country outside Australia except to the extent permitted below.
No Distribution in the US and No Distribution to the US News Wires Services : This investor presentation is not an offer of securities for sale in the United States. Any securities to be issued by Australis have not been and will not be registered under the US Securities Act of 1933, as amended (the "US Securities Act") and may not be offered or sold in the United States absent registration or an exemption from registration under the US Securities Act. No public offer of the securities is being made in the United States and the information contained herein does not constitute an offer of securities for sale in the United States. This investor presentation is not for distribution directly or indirectly in or into the United States or to US persons.
New Zealand: This document has not been registered, filed with or approved by any New Zealand regulatory authority under the Financial Markets Conduct Act 2013 (the "FMC Act"). Shares are not being offered or sold in New Zealand (or allotted with a view to being offered for sale in New Zealand) other than to a person who: (i) is an investment business within the meaning of clause 37 of Schedule 1 of the FMC Act; (ii) meets the investment activity criteria specified in clause 38 of Schedule 1 of the FMC Act; (iii) is large within the meaning of clause 39 of Schedule 1 of the FMC Act; (iv) is a government agency within the meaning of clause 40 of Schedule 1 of the FMC Act; or (v) is an eligible investor within the meaning of clause 41 of Schedule 1 of the FMC Act.
28NOT FOR DISTRIBUTION OR RELEASE IN THE US

International Offer Restrictions
United Kingdom: Neither the information in this document nor any other document relating to the offer has been delivered for approval to the Financial Conduct Authority in the United Kingdom and no prospectus (within the meaning of section 85 of the Financial Services and Markets Act 2000, as amended ("FSMA")) has been published or is intended to be published in respect of shares. This document is issued on a confidential basis to "qualified investors" (within the meaning of section 86(7) of the FSMA) in the United Kingdom, and shares may not be offered or sold in the United Kingdom by means of this document, any accompanying letter or any other document, except in circumstances which do not require the publication of a prospectus pursuant to section 86(1) of the FSMA. This document should not be distributed, published or reproduced, in whole or in part, nor may its contents be disclosed by recipients to any other person in the United Kingdom. Any invitation or inducement to engage in investment activity (within the meaning of section 21 of the FSMA) received in connection with the issue or sale of the shares has only been communicated or caused to be communicated and will only be communicated or caused to be communicated in the United Kingdom in circumstances in which section 21(1) of the FSMA does not apply to Australis. In the United Kingdom, this document is being distributed only to, and is directed at, persons (i) who have professional experience in matters relating to investments falling within Article 19(5) (investment professionals) of the Financial Services and Markets Act 2000 (Financial Promotions) Order 2005 ("FPO"), (ii) who fall within the categories of persons referred to in Article 49(2)(a) to (d) (high net worth companies, unincorporated associations, etc.) of the FPO or (iii) to whom it may otherwise be lawfully communicated (together "relevant persons"). The investments to which this document relates are available only to, and any invitation, offer or agreement to purchase will be engaged in only with, relevant persons. Any person who is not a relevant person should not act or rely on this document or any of its contents.
Hong Kong: WARNING: This document has not been, and will not be, registered as a prospectus under the Companies (Winding Up and Miscellaneous Provisions) Ordinance (Cap. 32) of Hong Kong, nor has it been authorised by the Securities and Futures Commission in Hong Kong pursuant to the Securities and Futures Ordinance (Cap. 571) of the Laws of Hong Kong (the "SFO"). No action has been taken in Hong Kong to authorise or register this document or to permit the distribution of this document or any documents issued in connection with it. Accordingly, shares have not been and will not be offered or sold in Hong Kong other than to "professional investors" (as defined in the SFO). No advertisement, invitation or document relating to shares has been or will be issued, or has been or will be in the possession of any person for the purpose of issue, in Hong Kong or elsewhere that is directed at, or the contents of which are likely to be accessed or read by, the public of Hong Kong (except if permitted to do so under the securities laws of Hong Kong) other than with respect to shares that are or are intended to be disposed of only to persons outside Hong Kong or only to professional investors (as defined in the SFO and any rules made under that ordinance). No person allotted shares may sell, or offer to sell, such securities in circumstances that amount to an offer to the public in Hong Kong within six months following the date of issue of such securities. The contents of this document have not been reviewed by any Hong Kong regulatory authority. You are advised to exercise caution in relation to the offer. If you are in doubt about any contents of this document, you should obtain independent professional advice.
29NOT FOR DISTRIBUTION OR RELEASE IN THE US

International Offer Restrictions
Singapore: This document and any other materials relating to the shares have not been, and will not be, lodged or registered as a prospectus in Singapore with the Monetary Authority of Singapore. Accordingly, this document and any other document or materials in connection with the offer or sale, or invitation for subscription or purchase, of shares, may not be issued, circulated or distributed, nor may shares be offered or sold, or be made the subject of an invitation for subscription or purchase, whether directly or indirectly, to persons in Singapore except pursuant to and in accordance with exemptions in Subdivision (4) Division 1, Part XIII of the Securities and Futures Act, Chapter 289 of Singapore (the "SFA"), or as otherwise pursuant to, and in accordance with the conditions of any other applicable provisions of the SFA. This document has been given to you on the basis that you are (i) an existing holder of the Company’s shares, (ii) an "institutional investor" (as defined in the SFA) or (iii) a "relevant person" (as defined in section 275(2) of the SFA). In the event that you are not an investor falling within any of the categories set out above, please return this document immediately. You may not forward or circulate this document to any other person in Singapore. Any offer is not made to you with a view to the shares being subsequently offered for sale to any other party. There are on-sale restrictions in Singapore that may be applicable to investors who acquire shares. As such, investors are advised to acquaint themselves with the SFA provisions relating to resale restrictions in Singapore and comply accordingly.
30NOT FOR DISTRIBUTION OR RELEASE IN THE US