Corporate Presentation FY2012 Financial Results
16
Corporate Presentation FY2012 Financial Results 26 February 2013
Transcript of Corporate Presentation FY2012 Financial Results

Corporate Presentation FY2012 Financial Results
26 February 2013

Disclaimer
• The presentation is prepared by AVIC International Investments Limited (the “Company”). The information contained in this presentation is subject to change without notice, its accuracy is not guaranteed and it may not contain all material information concerning the Company. Neither the Company nor any of its affiliates, advisors or representatives make any representation regarding, and assumes no responsibility or liability whatsoever (in negligence or otherwise) for, the accuracy or completeness of, or any errors or omissions in, any information contained herein nor for any loss howsoever arising from any use of these materials.
• The information contained in these materials has not been independently verified. No representation or warranty, expressed or implied, is made as to, and no reliance should be placed on the fairness, accuracy, completeness or correctness of, the information or opinions contained herein. It is not the intention to provide, and you may not rely on these materials as providing, a complete or comprehensive analysis of the Company's financial or trading position or prospects. The information and opinions contained in these materials are provided as at the date of this presentation and are subject to change without notice.
• In addition, the information contain projections and forward-looking statements that reflect the Company’s current views with respect to future events and financial performance. These views are based on a number of estimates and current assumptions which are subject to business, economic and competitive uncertainties and contingencies as well as various risks and these may change over time and in many cases are outside the control of the Company and its directors. No assurance can be given that future events will occur, that projections will be achieved, or that the Company’s assumptions are correct. Actual results may differ materially from those forecast and projected.
2

FY2012 Financial Highlights

16.0 4.5
32.2 27.1 5.6
22.3 11.3
33.3
45.1
73.7
101.2
0
40
80
120
160
4Q2011 4Q2012 FY2011 FY2012
Service Fee Income Management Service Fee Income Commission Income Shipbuilding Income
Revenue
4
RMB’m
↑ : 40.2% ↑ : 42.7%
54.9
99.6
139.6
Higher revenue achieved in FY2012 due to:
(i) Recognition of shipbuilding revenue for the construction of five vessels (three units of ASD tugboats, one unit of diver boat and one unit of bunkering tanker).
(ii) Increase was offset by lower service fee income derived from the provision of shipbuilding project management and consultancy services (“M&C Service”) due to fewer milestones achieved, lower management services fee income and absence of commission income.
78.2

19.4%
8.1%
72.5%
Service Fee Income Management Service Fee Income Commission Income Shipbuilding Income
32.4%
22.4%
45.2%
Revenue by business segment
5
FY2011 FY2012
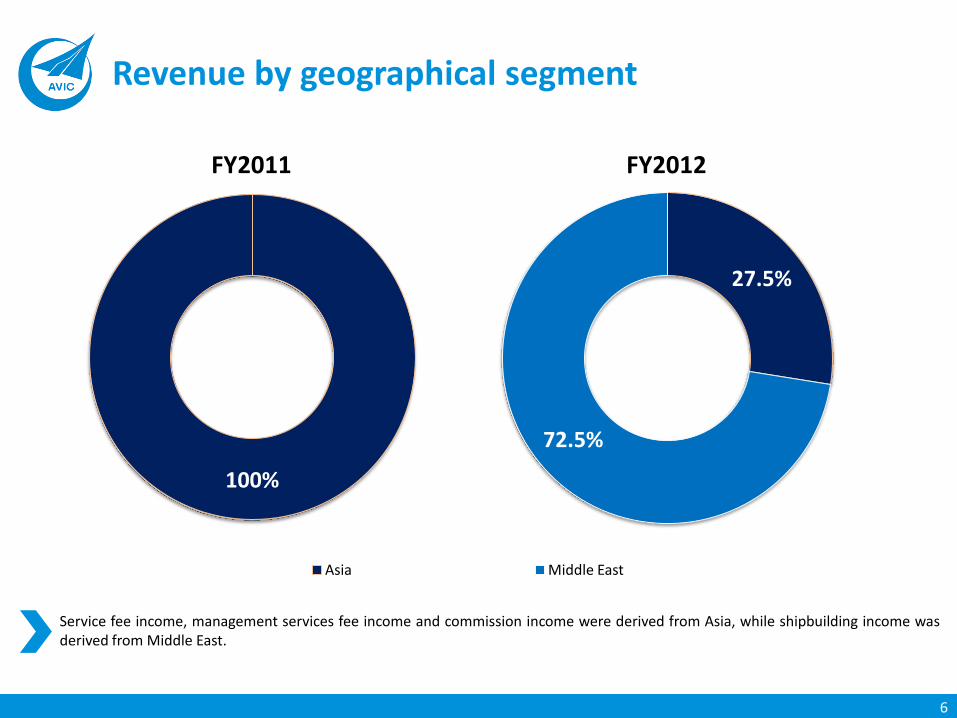
27.5%
72.5%
Asia Middle East
100%
Revenue by geographical segment
6
FY2011 FY2012
Service fee income, management services fee income and commission income were derived from Asia, while shipbuilding income was derived from Middle East.

27.0
0.1
43.2
7.8 0
20
40
60
4Q2011 4Q2012 FY2011 FY2012
Net profit
7
RMB’m
↓ : 99.5% ↓ : 81.9%
Factors affecting FY2012 net profit:
(i) Increase in contract cost in FY2012 mainly due to the commencement of construction work for five vessels. No contract cost was recorded in FY2011 as no shipbuilding revenue was recognised in that period.
(ii) On an operating level, employee benefits, office rental, office expenses and other operating expenses rose due to the increase in headcounts, costs incurred for maintaining the Group’s facilities and increased activities, following its listing on Mainboard of the SGX-ST.

8
Cash flow
Cash Flow (RMB’m) 4Q2011 4Q2012 FY2011 FY2012
Net cash from operating activities 44.5 33.9 67.1 68.7
Net cash used in investing activities (0.2) (216.8) (4.6) (217.0)
Net cash from financing activities 65.9 238.8 83.6 358.2
Cash and cash equivalents at the end of the period 145.2 355.3 145.2 355.3

Key financial indicators
Profitability Ratios 4Q2011 4Q2012 FY2011 FY2012
Earnings Per Share (RMB cents) 9.44* 0.05 15.11* 2.73
Weighted average number of shares 285,576,000* 285,576,000 285,576,000* 285,576,000
Profitability Ratios As at 31 Dec 2011 As at 31 Dec 2012
Net Asset Value Per Share (RMB cents) 49.84 56.42
Number of ordinary shares in issue 285,576,000 285,576,000
Liquidity Ratios As at 31 Dec 2011 As at 31 Dec 2012
Current Ratio (times) (Defined as current assets / current liabilities)
4.5 6.5
Debt to Equity Ratio (%) (Defined as total debt / total equity)
28.1 264.6
9
* The earnings per ordinary share for three months and for the year ended 31 December 2011 would be 9.44 RMB cents and 15.11 RMB cents respectively, based on 285,576,000 weighted average number of ordinary shares, if the Compliance Placement as described in Company’s announcement dated 6 October 2011 had been completed since 1 January 2011.

Business Updates
Acquisition of Deltamarin Oy to strengthen in-house ship-design capabilities
11
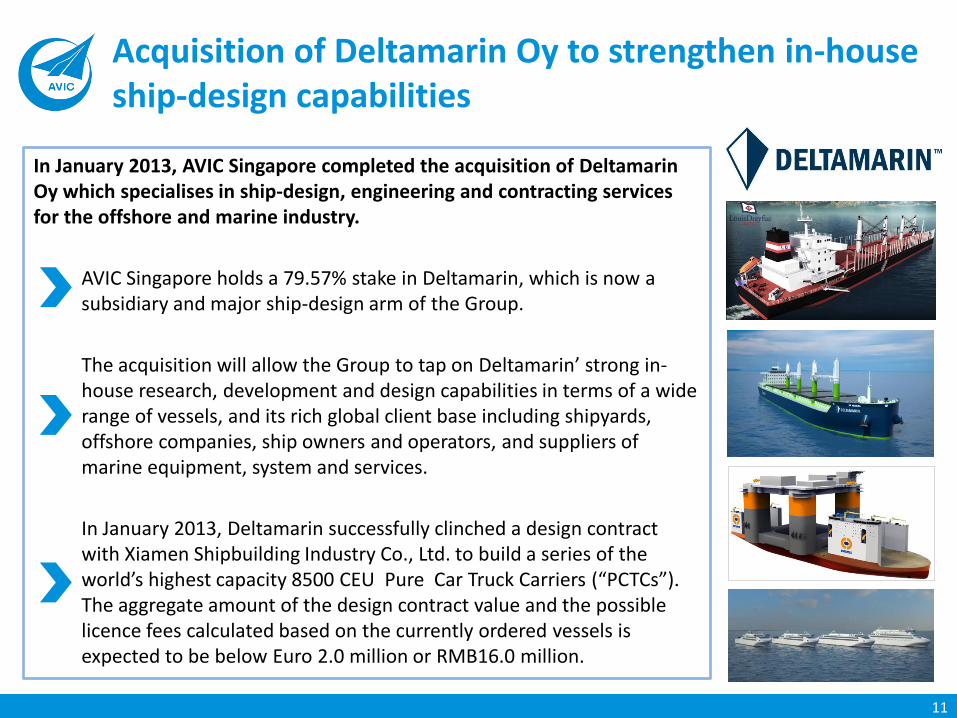
In January 2013, AVIC Singapore completed the acquisition of Deltamarin Oy which specialises in ship-design, engineering and contracting services for the offshore and marine industry.
AVIC Singapore holds a 79.57% stake in Deltamarin, which is now a subsidiary and major ship-design arm of the Group.
The acquisition will allow the Group to tap on Deltamarin’ strong in-house research, development and design capabilities in terms of a wide range of vessels, and its rich global client base including shipyards, offshore companies, ship owners and operators, and suppliers of marine equipment, system and services.
In January 2013, Deltamarin successfully clinched a design contract with Xiamen Shipbuilding Industry Co., Ltd. to build a series of the world’s highest capacity 8500 CEU Pure Car Truck Carriers (“PCTCs”). The aggregate amount of the design contract value and the possible licence fees calculated based on the currently ordered vessels is expected to be below Euro 2.0 million or RMB16.0 million.

Integration of AVIC International’s shipbuilding and ship-trading related businesses under AVIC Singapore
12
Incorporated new subsidiaries for the purpose of facilitating the future business integration; in the process of obtaining the approval from relevant authorities on its restructuring plans so as to implement the Proposed Consolidation.
Group Structure as at 26 February 2013 (1) For further details on the Deltamarin Group, please refer to page 13 of the Circular to Shareholders in relation to The Proposed Acquisition of the Entire Issued and Paid-up Share Capital of Deltamarin Oy dated 10 December 2012
Market consultancy
Shipbuilding M&C
Ship-design Shipbuilding Ship-trading
AVIC International Investments Limited
AVIC Kaixin (Beijing) Ship
Industry Co., Ltd. AVIC Ship
Investments Limited
AVIC International
Offshore Pte. Ltd.
AVIC International Ship Development Pte. Ltd.
AVIC International
Ship Development (Guangzhou)
Co., Ltd.
AVIC Ship (Xiamen) Co.,
Ltd.
AVIC International Ship Engineering
Pte. Ltd.
AVIC International Marine Engineering
Pte. Ltd.
Deltamarin Group (1)
AVIC International Marine Engineering
(Lux), S.à r.l.
100% 100%
100%
100%
Kaixin Industrial Pte. Ltd.
AVIC International
Ship Development
(China) Co., Ltd.
100% 100% 100% 100%
100% 79.57%
100%
100%
Singapore
Outside Singapore

Outlook and Strategies

Outlook and Strategies
14
Challenging shipping industry
Preparing for the eventual upturn of the industry

Key investment merits
15
We are a member of the AVIC Group, one of the largest industrial groups owned by the PRC Central Government
We have an experienced and driven management team with in-depth industry knowledge
As a member of the AVIC Group, we have strong backing from major PRC financial institutions
The PRC remains one of the world’s largest shipbuilding countries

Thank You