


Corporate Presentation -...
25
zargon.ca Corporate Presentation January 6, 2017
Transcript of Corporate Presentation -...

Forward Looking-Advisory
Forward-Looking Statements - This presentation offers our assessment of Zargon's future plans and operations as at January 5, 2017, and contains forward-looking statements. Such statements are generally identified by the use of words such as "anticipate", "continue", "estimate", "expect", "forecast", "may", "will", "project", "should", "plan", "intend", "believe" and similar expressions (including the negatives thereof). In particular, this presentation contains forward-looking information as to Zargon’s corporate strategy and business plans, Zargon’s oil exploration project inventory and development plans, Zargon’s expectations for the debenture restructuring proposal, Zargon’s dividend policy and the amount of future dividends, future commodity prices, Zargon’s expectation for uses of funds from financing, Zargon’s capital expenditure program and the allocation and the sources of funding thereof, Zargon’s cash flow and dividend model and the assumptions contained therein and the results there from, anticipated payout rates, 2017 and beyond production and other guidance and the assumptions contained therein, estimated tax pools, Zargon’s reserve estimates, Zargon’s hedging policies, Zargon’s drilling, development and exploitation plans and projects and the results there from and Zargon’s ASP project plans 2017 and beyond, strategic alternatives review process, the source of funding for our 2017 and beyond capital program including ASP, capital expenditures, costs and the results therefrom. By their nature, forward-looking statements are subject to numerous risks and uncertainties, some of which are beyond our control, including such as those relating to results of operations and financial condition, general economic conditions, industry conditions, changes in regulatory and taxation regimes, volatility of commodity prices, escalation of operating and capital costs, currency fluctuations, the availability of services, imprecision of reserve estimates, geological, technical, drilling and processing problems, environmental risks, weather, the lack of availability of qualified personnel or management, stock market volatility, the ability to access sufficient capital from internal and external sources and competition from other industry participants for, among other things, capital, services, acquisitions of reserves, undeveloped lands and skilled personnel. Risks are described in more detail in our Annual Information Form, which is available on our website. Forward-looking statements are provided to allow investors to have a greater understanding of our business.You are cautioned that the assumptions, including, among other things, future oil and natural gas prices; future capital expenditure levels; future production levels; future exchange rates; the cost of developing and expanding our assets; our ability to obtain equipment in a timely manner to carry out development activities; our ability to market our oil and natural gas successfully to current and new customers; the impact of increasing competition; our ability to obtain financing on acceptable terms; and our ability to add production and reserves through our development and acquisition activities used in the preparation of such information, although considered reasonable at the time of preparation, may prove to be imprecise and, as such, undue reliance should not be placed on forward-looking statements. Our actual results, performance, or achievement could differ materially from those expressed in, or implied by, these forward-looking statements. We can give no assurance that any of the events anticipated will transpire or occur, or if any of them do, what benefits we will derive from them. The forward-looking information contained in this presentation is expressly qualified by this cautionary statement. Our policy for updating forward-looking statements is that Zargondisclaims, except as required by law, any intention or obligation to update or revise any forward-looking statements, whether as a result of new information, future events or otherwise.Barrels of Oil Equivalent - Natural gas is converted to a barrel of oil equivalent (“Boe”) using six thousand cubic feet of gas to one barrel of oil. In certain circumstances, natural gas liquid volumes have been converted to a thousand cubic feet equivalent (“Mcfe”) on the basis of one barrel of natural gas liquids to six thousand cubic feet of gas. Boes and Mcfes may be misleading, particularly if used in isolation. A conversion ratio of one barrel to six thousand cubic feet of natural gas is based on an energy equivalency conversion method primarily applicable at the burner tip and does not represent a value equivalency at the wellhead. Given that the value ratio based on the current price of crude oil as compared to natural gas is significantly different from the energy equivalency of 6:1, utilizing a conversion ratio on a 6:1 basis may be misleading as an indication of value. The estimates of reserves and future net revenue for individual properties may not reflect the same confidence level as estimates of reserves and future net revenue for all properties, due to the effects of aggregation. Estimated reserve values disclosed in this presentation do not represent fair market value. Discovered Petroleum Initially-In-Place (“DPIIP”) is that quantity of petroleum that is estimated, as of a given date, to be contained in known accumulations prior to production. The recoverable portion of discovered petroleum initially in place includes production, reserves, and contingent resources; the remainder is unrecoverable.The aggregate of the exploration and development costs incurred in the most recent financial year and the change during that year in estimated future development costs generally will not reflect total finding and development costs related to reserves additions for that year.
2

Debenture Restructuring Proposal
Rationale
3
Zargon is seeking approval to amend Zargon’s outstanding $57.5 million of 6% Convertible Debentures by:
extending the maturity date of the Debentures from June 30, 2017 to December 31, 2019
increasing the interest rate of the Debentures from 6.0% per annum to 8.0% per annum
reducing the conversion price in effect for each common share of Zargon to be issued upon the conversion of the Debentures from $18.80 to $1.25
providing debenture holders a “put right” to redeem up to $19 million of Debentures at a cash price set by a “Dutch auction” with minimum and maximum prices of $890 and $1,000 per Debenture.
Proposal
Debenture Holders obtain partial liquidity, and improvements to both their underlying bond value (increased interest rate) and the embedded conversion option value (the lower conversion price, extended term, and extended call protection mechanisms).
Macquarie Capital has provided a verbal fairness opinion that, subject to review of the final form of documents, that the amendments are fair to the Debenture Holders, from a financial point of view.
The proposal provides common shareholders with financing on acceptable terms, thereby avoiding the need to allocate existing cash or raise additional capital to repay the Debentures in June 2017 at time when commodity markets may continue to be depressed or when such cash could be better applied to the Company's operating and development activities.

Debenture Restructuring Proposal (Cont.)
Rationale
4
Projected timeline for the debenture restructuring proposal:
Mid-January 2017: Call Debenture Holder meeting and mail materials
Mid-February 2017: Hold Debenture Holder meeting and vote on amendment proposal
By March 31, 2017: If amendment proposal is approved, partially redeem debentures pursuant to debenture “put right” tender elections
Next Steps
Pro Forma BalanceSheet
Pursuant to debenture holder approval of the proposed debenture restructuring amendment, Zargon’scapital structure will be (as of March 31, 2017):
Bank debt – $nil (Zargon will negotiate a First Lien Banking arrangement to support the Company's ongoing hedging, operating and development activities)
Working Capital – Positive $2.5 million (approximate; dependent on oil/gas prices and capital programs)
Outstanding amended December 2019 Convertible Debentures (dependent on “Put Right” elections)
– $38.5 million (assumes $19.0 million of redemptions at a price of $1,000 per debenture)
– $36.2 million (assumes $19.0 million of redemptions at a price of $890 per debenture)

2017 Outlook
2017 Projections
5
Based on the $7.8 million 2017 capital budget, Zargon projects stable production volumes throughout calendar 2017 at Q4 2016 guidance levels. 2,500 boe/d comprised of 2,050 bbl/d and 2.7 mmcf/d
The 2017 capital budget is expected to be fully funded from corporate funds flow at oil prices of $52 US per barrel (WTI) or better (reflects existing 650 bbl/d of 2017 hedges at $66.98 Cdn. per barrel).
With current hedges, Zargon estimates that its 2017 corporate funds flow will increase approximately $0.6 million for every $1 US per barrel (WTI) increase in oil price.
Complete debenture restructuring proposal to provide a stable financial position, thereby enabling Zargon to undertake its long term value creation initiatives.
Recognizing that Zargon’s assets are relatively inexpensively priced and provide significant unrecognized oil price option value, Zargon will continue with its strategic alternatives process that may include, a financing, merger or other business combination, a sale of all or part of the company, as well as the continued execution of the company's business plan.
2017 Next Steps
2017 Capital Budget
Zargon’s $7.8 million 2017 capital budget is allocated to $2.7 million for Little Bow polymer chemical purchases, $1.5 million of non discretionary land retention costs and $3.6 million to property/well reactivations, recompletions, waterflood modifications.
Contingent on oil prices and/or Zargon’s financial outlook, this budget may be expanded to include undeveloped oil exploitation wells and/or the reactivation of Alkaline Surfactant injections at Little Bow.

Key Investment Highlights
6
Oil Exploitation Focus• Zargon is an oil-weighted company focused on the exploitation of mature oil properties• Following a 2012-16 divestment program, Zargon’s remaining operated oil reservoirs continue to be
characterized by significant oil-in-place, low recovery factors and low oil production declines
Low Decline Oil Production • Zargon’s current blended corporate oil decline of 12% is enabled by reservoir pressure support from natural aquifers, waterfloods and tertiary floods.
Oil Exploitation Opportunities
• Zargon’s properties provide waterflood optimization opportunities plus exploitation drilling opportunities that enable improved reservoir recovery factors in existing pools
• The McDaniel reserve report books 12 P+P exploitation locations with average per well parameters of 60 Mbbl oil reserves, 48 bbl/d initial rate and $0.90 MM all-in costs
Control of Properties &Key Infrastructure
• Very high working interest and operatorship across core operating areas, batteries and facilities.• Majority of batteries and facilities have been upgraded in the last five years• An actively managed abandonment and reclamation program
Little Bow ASP Project• At higher oil prices, the existing ASP infrastructure can be utilized to resume AS injections in high-graded
areas and for multiple other ASP phases and Polymer only projects seeking a 10 percent incremental oil recovery on over 80 million barrels of working interest oil-in-place.
Other Corporate Attributes
• Zargon holds ~$187 million of high quality tax pools (September 30, 2016), including $129 million of non-capital losses
• Zargon has retained a TSX listing, plus strong operating, accounting, land and finance capabilities, and can readily manage additional assets with minimal additional costs.
Zargon provides exceptional torque to higher oil prices, in addition to offering a variety of attractive oil exploitation opportunities including oil exploitation horizontal infill drills and a long term Southern Alberta tertiary recovery project.
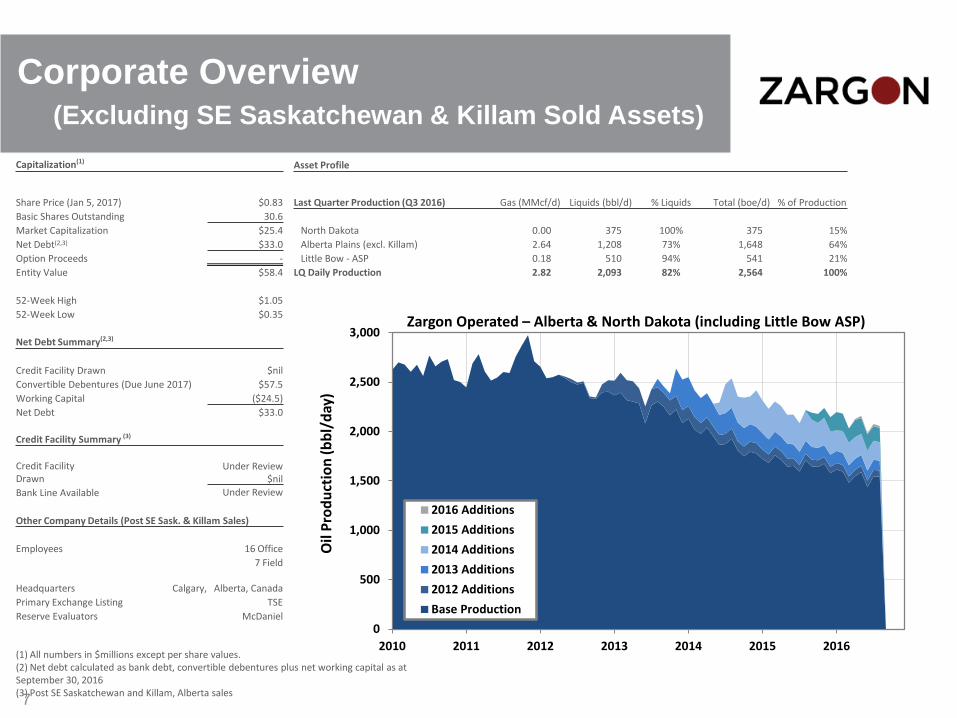
Corporate Overview (Excluding SE Saskatchewan & Killam Sold Assets)
Capitalization(1) Asset Profile
Share Price (Jan 5, 2017) $0.83 Last Quarter Production (Q3 2016) Gas (MMcf/d) Liquids (bbl/d) % Liquids Total (boe/d) % of ProductionBasic Shares Outstanding 30.6 Market Capitalization $25.4 North Dakota 0.00 375 100% 375 15% Net Debt(2,3) $33.0 Alberta Plains (excl. Killam) 2.64 1,208 73% 1,648 64% Option Proceeds - Little Bow - ASP 0.18 510 94% 541 21% Entity Value $58.4 LQ Daily Production 2.82 2,093 82% 2,564 100%
52-Week High $1.05 52-Week Low $0.35
Net Debt Summary(2,3)
Credit Facility Drawn $nil Convertible Debentures (Due June 2017) $57.5 Working Capital ($24.5) Net Debt $33.0
Credit Facility Summary (3)
Credit Facility Under ReviewDrawn $nil Bank Line Available Under Review
Other Company Details (Post SE Sask. & Killam Sales)
Employees 16 Office 7 Field
Headquarters Calgary, Alberta, Canada Primary Exchange Listing TSE Reserve Evaluators McDaniel
(1) All numbers in $millions except per share values.(2) Net debt calculated as bank debt, convertible debentures plus net working capital as atSeptember 30, 2016(3) Post SE Saskatchewan and Killam, Alberta sales7
0
500
1,000
1,500
2,000
2,500
3,000
2010 2011 2012 2013 2014 2015 2016
Oil
Prod
uctio
n (b
bl/d
ay)
2016 Additions2015 Additions2014 Additions2013 Additions2012 AdditionsBase Production
Zargon Operated – Alberta & North Dakota (including Little Bow ASP)

Alberta Plains (excluding Little Bow ASP)
9
The Alberta Plains properties provide low decline oil volumes with the potential for further development
• Q3 2016 production of 1,648 boe/d
– 73% liquids-weighted (16 - 32º API)
– Average WI ~72%,
– ~98% operated
– No drilling in 2015-16 due to capital allocation decisions
– Drilling programs of prior years had been successful in managing overall production decline
• Multiple exploitation and development opportunities have been identified throughout Zargon’s asset base including:
– 8 booked infill and exploitation drilling opportunities (McDaniel locations)
– Good 3D seismic coverage over key properties support an additional 8+ un-booked locations
Q3 2016Production
% Liquids API OOIP
Recoveryto Date
Gross UndevelopedLocations
(boe/d) (%) ( ⁰ ) (MMbbl) (%) McDaniel Additional
Bellshill Lake 464 95% 27 16 32% 5 1+
Taber 455 98% 16-24 27 15% 3 5+
Little Bow (Conventional) 343 66% 21 82 25% - tbd
Alberta Other 386 21% 18-32 n.a. n.a. - 2+
Total 1,648 73% 16-32 125+ 24% 8 8+
T 1 W4
T 10
T 20
T 30
T 40
R 10R 20
Bellshill Lake
Little Bow
Taber
Alberta Plains

0
500
1,000
1,500
2,000
2,500
2010 2011 2012 2013 2014 2015 2016
Oil
Prod
uctio
n (b
bl/d
ay)
2014 Additions
2013 Additions
2012 Additions
Base Production
10
Alberta Plains Properties Overview (Excluding Little Bow ASP)
Operating Summary – Q3/2016Production 1,208 bbl/d (1,648 boe/d)
Forecast Q4 Op. cost $3.10 million
Reserves: McDaniel has recognized 8 gross (8.0) P+PUD locations and there is the potential of an additional 8+ locations
0
1,000
2,000
3,000
4,000
5,000
Q1 Q2 Q3 Q4 Q1 Q2 Q3
2015 2016 Forecast
Qua
rter
ly E
xpen
se ($
M)
Alberta Operating Cost Trend (excluding ASP)
Major R&M Base Opex Total Opex
Forecast Q4 2016 Op. cost of $3.1 million
Liquids(Mbbl)
Total(Mboe)
PV 10%($MM)
PDP 3,034 3,596 48.7
TP 3,300 4,197 53.8
P+PDP 4,008 4,791 63.3
P+P * 4,489 6,204 75.9
McDaniel Reserve Summary (December 2015)
* Includes new wells, tie-ins and reactivations

0
100
200
300
400
500
600
700
800
900
2010 2011 2012 2013 2014 2015 2016
Oil
Prod
uctio
n (b
bl/d
ay)
2014 Additions2013 Additions2012 AdditionsBase Production
Alberta Plains – Bellshill Lake
Bellshill Lake produces low-decline oil with remaining infill drilling potential
− Low production declines− Historical capital programs have kept production flat since 2010 − Yearly programs have continued to make positive impacts on
production given the maturity of the field • Zargon operated, high working interest
− 100% Working interest in all Dina production • Areally extensive Dina sand with aquifer pressure support
− Additional vertical wells in partially drained localized closures, would provide quick production gains
− 27° API oil
Oil(Mbbl)
Total(Mboe)
PV 10%($MM)
PDP 918 965 12.3
TP 918 981 12.4
P+P 1,432 1,546 20.2
McDaniel Reserve Summary (December 2015)
McDaniel has recognized 5 P+PUD locationsZargon has defined 4 additional locations11

Alberta Plains – Taber Mannville
• Sunburst development is seismically defined − 30 horizontal wells drilled since 2007 − 25 on production, 5 on injection
• South pool is seeing stabilizing rates due to waterflood (vertical well historical production was negligible due to higher density oil)
− Estimated recovery to date ~10.1% − Ultimate forecasted 2PDP recovery ~18% − Estimated OOIP of 15.5 MMbbl
• North pool receives pressure maintenance from two vertical flank water injectors
− Estimated recovery to date ~ 16%, higher due to lower density oil (and vertical well recoveries)
− Ultimate forecasted 2PDP recovery ~ 21.7% − Estimated OOIP of 6.7 MMbbl
Taber is Zargon’s largest oil producing asset outside of the ASP project, and offers low-decline production with remaining development potential
Oil(Mbbl)
Total(Mboe)
PV 10%($MM)
PDP 1,237 1,308 30.3
TP 1,466 1,515 34.1
P+P 1,986 2,051 43.3
McDaniel Reserve Summary (December 2015)
12

North Dakota Properties
• Long life conventional oil properties, average of 27 API gravity oil- Stable production, more than 15 MMbbl oil produced to date - Infrastructure and water disposal in place
• Established waterflood and unitized production − Production optimization opportunities − Includes undeveloped land with exploration opportunities
• Total 2P Reserves NPV10 ~$26.6 MM (McDaniel year end 2015)− 4 PUD locations
• Large OOIP with bypassed pay opportunities- Infill drilling potential in all of the properties - Opportunities to increase drilling density, no downspacingregulations - Similar properties in Saskatchewan have up to 20 wells/section
Undercapitalized area with high working interest, undeveloped land and horizontal drilling opportunities
North Dakota Williston Basin geology is directly analogous to the offsetting Southeast Saskatchewan Williston Basin geology, however activity levels are substantially lower and the properties are less developed.
Q3 2016Production OOIP
Recoveryto Date Decline
Gross UndevelopedLocations
(boe/d) (MMbbl) (%) (%) McDaniel Additional
Haas 188 51 23% 3% 1 5+Mackobee Coulee 92 17 12% 12% 3 7Truro 95 30 4% 11% None 2
Total 375 98 15% 7% 4 14+
0100200300400500600700800900
Q1 Q2 Q3 Q4 Q1 Q2 Q3
2015 2016 Forecast
Qua
rter
ly E
xpen
se ($
M)
North Dakota Operating Cost Trend
Major R&M Base Opex Total Opex
Forecast Q4 2016 Op. cost of $0.7 million
13

Little Bow ASPEOR in a mature Southern Alberta Waterflood
Zargon constructed an Alkaline Surfactant Polymer (“ASP”) facility at Little Bow, Alberta, which enables the injection of dilute chemicals in a water solution to flush out undrained oil in existing reservoirs.
At higher oil prices, the existing ASP infrastructure can be utilized for multiple ASP and Polymer only projects seeking a 10 percent incremental oil recovery on over 80 million barrels of working interest oil-in-place.
15
Zargon W.I.(%)
W.I. OIIP(mmbbl)
ASP Phase 1 (‘I’ Pool)North and Central 100 15
Southern Area 100 8Future Potential Phases
Remaining portions I&P Pools 97 16U&W Unit (D8D/H9H Pools) 97 26
G Unit (B8B Pool) 95 10MM Unit (E8E Pool) 100 5
C8C / X8X Pool 100 9Total 89
ASP Facility & Gas Plant
Zargon Battery site
ASP Central Facility
Future ASP Phase
Future PolymerProject
ASP Phase 1
ASP Phase 1 ConformanceRemediation & Extension
ASP Modified Phase 2 Area
Future ASP Phase

Little Bow ASP Project
16
Zargon’s Little Bow ASP project has shown good oil banking, but the combination of low oil prices and Zargon’s weakened financial condition has forced Zargon to “idle” the project in a manner that preserves future recoveries when reactivated.
• Phase 1 Alkali and Surfactant (“AS”) injections were suspended in Q1 2016, to reduce capital outflows during a very low oil price period. In September 2016, high water cut Phase 1 producers in AS under-treated areas were suspended, thereby bypassing the untreated reservoir and permitting full AS recoveries upon reactivation.
• With higher oil prices, AS injections will initially be resumed in high-graded Phase 1 areas and then a modified (truncated) phase 2 area.
• With these operating adjustments, polymer and operating costs have been significantly reduced to $0.7 million and $1.0 million per quarter, respectively.
0
500
1,000
1,500
2,000
Q1 Q2 Q3 Q4 Q1 Q2 Q3
2015 2016 Forecast
Qua
rter
ly E
xpen
se ($
M)
ASP - Phase 1 Operating Cost Trend
Major R&M Base Opex Total Opex
Pipeline repairs
Forecast Q4 2016 Op. cost of $1.0 million
High water cut producers suspended, reducing fluid and oil production, but preserving ASP recovery opportunity for higher prices
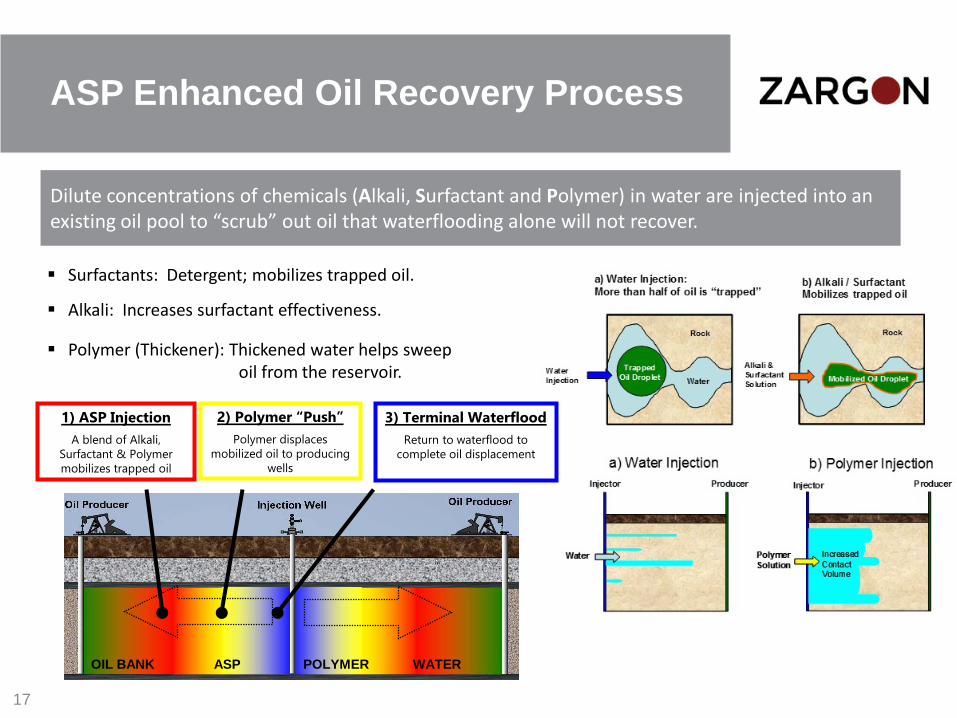
ASP Enhanced Oil Recovery Process
Dilute concentrations of chemicals (Alkali, Surfactant and Polymer) in water are injected into an existing oil pool to “scrub” out oil that waterflooding alone will not recover.
Surfactants: Detergent; mobilizes trapped oil.
Alkali: Increases surfactant effectiveness.
Polymer (Thickener): Thickened water helps sweep oil from the reservoir.
17
1) ASP InjectionA blend of Alkali,
Surfactant & Polymer mobilizes trapped oil
2) Polymer “Push”Polymer displaces
mobilized oil to producing wells
3) Terminal WaterfloodReturn to waterflood to
complete oil displacement
OIL BANK ASP POLYMER WATER

Husky Taber Mannville “B” ASP Husky Gull Lake ASP
Analog ASP Performance (The Prize)
The Taber Mannville B and Gull Lake ASP projects are good analogs to our Little Bow ASP project. Successful ASP projects provide stable production volumes for many years after the first three years
of cost intensive AS injections are completed. With higher oil prices, and the reactivation of AS injections in phase 1 and subsequent phases, we
continue to foresee many years of production growth followed by many years of free cash generating stable production for our Little Bow property.
18

Zargon – Calendar 2017 Cash Flow Parameters
Oil 2,050 bbl/d Gas 2.70 mmcf/d Equiv. 2,500 boe/d (82 % oil and liquids). Royalties 8% Alberta, 24% North Dakota (includes state and severance taxes)
Oil Prices WTI – WCS diff.: $15.0 US/bbl; Zargon Field – WCS diff.: $0.50 US/bbl premium Gas Prices $3.06/mcf Alberta average field price Exchange 0.75 $US/$Cdn. G&A Costs $4.5 million – after reorganization and severance Interest $3.0 million – debenture cost, no interest on cash balances
Production
Costs & Capital
Other Parameters
20
Operating $18.8 million Abd. & Reclam. $1.5 million US Taxes $ nil ASP Capital $2.7 million chemical costs Main. Capital $1.5 million non-discretionary land and other costs Conv. Capital $3.6 million (reactivations, recompletion and facility upgrades)

Zargon – Calendar 2017 Projected Cash Flows
21
WTI Pricing(US/bbl)
Field Pricing (Cdn./bbl)
Field Cash Flow (million)
Corporate Cash Flow (million)
Free Cash Flow After All Capital
(million)
$45 $40.50 $11.2 $ 3.9 ($3.9)
$50 $47.17 $15.7 $ 6.8 ($1.0)
$55 $53.83 $20.1 $ 9.7 $ 1.9
$60 $60.50 $24.6 $12.6 $ 4.8
$65 $67.17 $29.1 $15.4 $ 7.6
0
10
20
30
40
40 50 60 70
Ca
sh F
low
($
mil
lio
ns)
WTI Oil Price ($US/bbl)
Zargon Cash Flow
Field Cash Flow
Corporate Cash Flow
Zargon’s cash flows are exceptionally sensitive to oil prices.
Including hedges, Zargon’s assets provide a positive corporate cash flow down to less than $45 US/bbl WTI.
At higher prices, Zargon’s assets provide significant free cash flow that can be used to retire debt, reactivation and facility modification projects, drill high-graded horizontal oil exploitation wells and reinstate/initiate Little Bow ASP/Polymer floods.

Valuation Using Forecast 2017 Field Cash Flows
22
WTI Pricing (US/bbl)
Field Cash Flow (million)
4.5 Times Field Cash Flow
(million)
Zargon Pro Forma Net Debt
(million)
Attributed to Zargon Shares
(million)
Calculated Zargon Value
(per share)
$45 $11.2 $ 50.4 $ 33.9 $ 16.5 $0.54
$50 $15.7 $ 70.6 $ 33.9 $ 36.7 $1.20
$55 $20.1 $ 90.5 ($ 2.5) $ 93.0 $1.56
$60 $24.6 $110.7 ($ 2.5) $113.2 $1.90
$65 $29.1 $131.0 ($ 2.5) $133.5 $2.24
Calculations assume: - successful debenture restructuring and $19.0 million of redemptions
at an assumed price of $900 per debenture, - for $55+ cases, $36.4 million of remaining debentures are assumed
to convert into Zargon shares at a $1.25 conversion price (29.1 million shares) taking the total outstanding shares to 59.7 million.
Zargon’s long-life oil reserves provide investor’s with exceptional torque (both operational and financial leverage) to future increases in oil prices.
A corporate valuation based on a 4.5 times property cash flow multiple suggests that significantly higher share prices may be realizable if/when WTI oil prices rebound to higher levels.
0.00
0.50
1.00
1.50
2.00
2.50
40 50 60 70Sh
are
Pri
ce (
$ p
er
sha
re)
WTI Oil Price ($US/bbl)
Zargon Share Value - 4.5 Times Property Cash Flow

Zargon Enterprise Value – Jan. 5, 2017 Prices
Zargon Valuation with Discounted Debentures (Jan. 5 pricing)Common Shares (30.61 million @$0.83 @ Jan. 5, 2017) $ 25.4 millionDebentures (57.5 thousand @$890 @ Jan 5, 2017) $ 51.2 millionSubtract Positive Working Capital (Sept. 30, 2016) ($ 24.5 million)
Total Enterprise Value $52.1 million
2017 Prod. Guidance (2,500 boe/d – 89% oil/liquids) $20,800 per boe/d2015 YE Reserves PDP (6.90 mmboe – 87% oil/liquids) $ 7.55 per boe2015 YE Reserves TP (8.87 mmboe – 87% oil/liquids) $ 5.87 per boe2015 YE Reserves 2PDP (9.12 mmboe – 88% oil/liquids) $ 5.71 per boe2015 YE Reserves 2P (15.09 mmboe – 88% oil/liquids) $ 3.45 per boe
23
Zargon Valuation with Debentures at Face ValueCommon Shares (30.61 million @$0.83 @ Jan. 5, 2017) $ 25.4 millionDebentures (57.5 thousand @$1,000 face value) $ 57.5 millionSubtract Positive Working Capital (Sept. 30, 2016) ($ 24.5 million)
Total Enterprise Value $58.4 million
2017 Prod. Guidance (2,500 boe/d – 82% oil/liquids) $23,400 per boe/d2015 YE Reserves PDP (6.90 mmboe – 89% oil/liquids) $ 8.46 per boe2015 YE Reserves TP (8.87 mmboe – 87% oil/liquids) $ 6.58 per boe2015 YE Reserves 2PDP (9.12 mmboe – 88% oil/liquids) $ 6.40 per boe2015 YE Reserves 2P (15.09 mmboe – 88% oil/liquids) $ 3.87 per boe
Zargon’s low decline oil assets continue to be valued at low levels when compared to industry peers.
Key Considerations
Zargon’s Board and management believe that Zargon’s share price has not been reflective of the fundamental value inherent in the Company.
A broad marketing process resulted in the sale of Zargon’s Williston Basin Saskatchewan and Killam, Alberta assets, thereby eliminating all bank debt.
Zargon is seeking approval to amend Zargon’s $57.5 million of 6% Convertible Debentures, in a manner that will provide a stable financial position that will enable Zargon to proceed with its long term value creation initiatives.
Strategic Process Ongoing
Deep Discount to NAV
24
Assuming a $52 US/bbl WTI oil price in 2017, Zargon expects to deliver 2017 stable production volumes with all capital funded by cash flow. This forecast is based on $7.8 million of 2017 capital, which includes $3.6 million of reactivations, recompletions and facility upgrades that were not pursued in the prior two years due to financial constraints.
With a sustainable 2017 business plan, investor’s are able to wait another year for materially higher oil prices (and the substantial upside to Zargon share price) without any erosion of the underlying asset base.
Exceptional Torque to Higher oil Prices
Sustainable 2017 Corporate Model
Investors buy Zargon at a discount to the proved developed producing net asset value when evaluated at prices at (or above) current strip.
Zargon’s long-life oil reserves provide investor’s exceptional torque to higher oil prices: Financial – Although improved, Zargon’s balance sheet remains over-levered where small changes in
underlying corporate value result in large inferred changes in share price. Operational – Zargon’s production tends to be from mature low-decline, low-rate wells with
relatively higher operating costs. Small improvements in oil prices result in significantly improved cash flows.
Exploitation – Zargon’s exploitation opportunities are significant, but generally require higher prices.