Corporate Presentation Comments on Strategy …...Corporate Presentation Comments on Strategy...
28
Corporate Presentation Comments on Strategy December 2013
Transcript of Corporate Presentation Comments on Strategy …...Corporate Presentation Comments on Strategy...

Corporate Presentation Comments on Strategy
December 2013

2
THIS DOCUMENT IS STRICTLY CONFIDENTIAL AND IS BEING PROVIDED TO YOU SOLELY FOR YOUR INFORMATION BY AMGADVANCED METALLURGICAL GROUP N.V. (THE “COMPANY”) AND MAY NOT BE REPRODUCED IN ANY FORM OR FURTHERDISTRIBUTED TO ANY OTHER PERSON OR PUBLISHED, IN WHOLE OR IN PART, FOR ANY PURPOSE. FAILURE TO COMPLYWITH THIS RESTRICTION MAY CONSTITUTE A VIOLATION OF APPLICABLE SECURITIES LAWS.
This presentation does not constitute or form part of, and should not be construed as, an offer to sell or issue or the solicitation of an offer tobuy or acquire securities of the Company or any of its subsidiaries nor should it or any part of it, nor the fact of its distribution, form the basisof, or be relied on in connection with, any contract or commitment whatsoever.
This presentation has been prepared by, and is the sole responsibility of, the Company. This document, any presentation made in conjunctionherewith and any accompanying materials are for information only and are not a prospectus, offering circular or admission document. Thispresentation does not form a part of, and should not be construed as, an offer, invitation or solicitation to subscribe for or purchase, ordispose of any of the securities of the companies mentioned in this presentation. These materials do not constitute an offer of securities forsale in the United States or an invitation or an offer to the public or form of application to subscribe for securities. Neither this presentation noranything contained herein shall form the basis of, or be relied on in connection with, any offer or commitment whatsoever. The informationcontained in this presentation has not been independently verified. No representation or warranty, express or implied, is made as to, and noreliance should be placed on, the fairness, accuracy or completeness of the information or the opinions contained herein. The Company andits advisors are under no obligation to update or keep current the information contained in this presentation. To the extent allowed by law,none of the Company or its affiliates, advisors or representatives accept any liability whatsoever (in negligence or otherwise) for any losshowsoever arising from any use of this presentation or its contents or otherwise arising in connection with the presentation.
Certain statements in this presentation constitute forward-looking statements, including statements regarding the Company's financialposition, business strategy, plans and objectives of management for future operations. These statements, which contain the words "believe,”“expect,” “anticipate,” “intends,” “estimate,” “forecast,” “project,” “will,” “may,” “should” and similar expressions, reflect the beliefs andexpectations of the management board of directors of the Company and are subject to risks and uncertainties that may cause actual resultsto differ materially. These risks and uncertainties include, among other factors, the achievement of the anticipated levels of profitability,growth, cost and synergy of the Company’s recent acquisitions, the timely development and acceptance of new products, the impact ofcompetitive pricing, the ability to obtain necessary regulatory approvals, and the impact of general business and global economic conditions.These and other factors could adversely affect the outcome and financial effects of the plans and events described herein.
Neither the Company, nor any of its respective agents, employees or advisors intend or have any duty or obligation to supplement, amend,update or revise any of the forward-looking statements contained in this presentation.
The information and opinions contained in this document are provided as at the date of this presentation and are subject to change withoutnotice.
This document has not been approved by any competent regulatory or supervisory authority.
Cautionary Note

3
OverviewListed: NYSE-Euronext Amsterdam: AMG
Founded: 2006
LTM Revenues: $1,149.6M
LTM EBITDA: $80.4M
LTM OperatingCashflow: $89.5M
Employees: 3,137
Facilities:Netherlands, Germany, France, Czech Republic, Poland, UK,USA, Brazil, Mexico, China, India, Sri Lanka, Turkey, Zimbabwe, Mozambique
Market Cap: €202M ($278M)
Enterprise Value: €319M ($438M)
EV / EBITDA 5.5x
Shares outstanding: 27.6M
52 week range: €5.88–€8.35
Recent share price: €7.35 (December 16, 2013)
Note: LTM values are September YTD

4
AMG - Three Divisions
Metals & alloys Coating materials
Capital equipment & service for high purity materials
Concentrates
AMG Processing AMG EngineeringAMG Mining
AMG’s conversion and recycling based businesses
AMG’s vacuum systems and services business
Integrated AMG’s mine based businesses
5
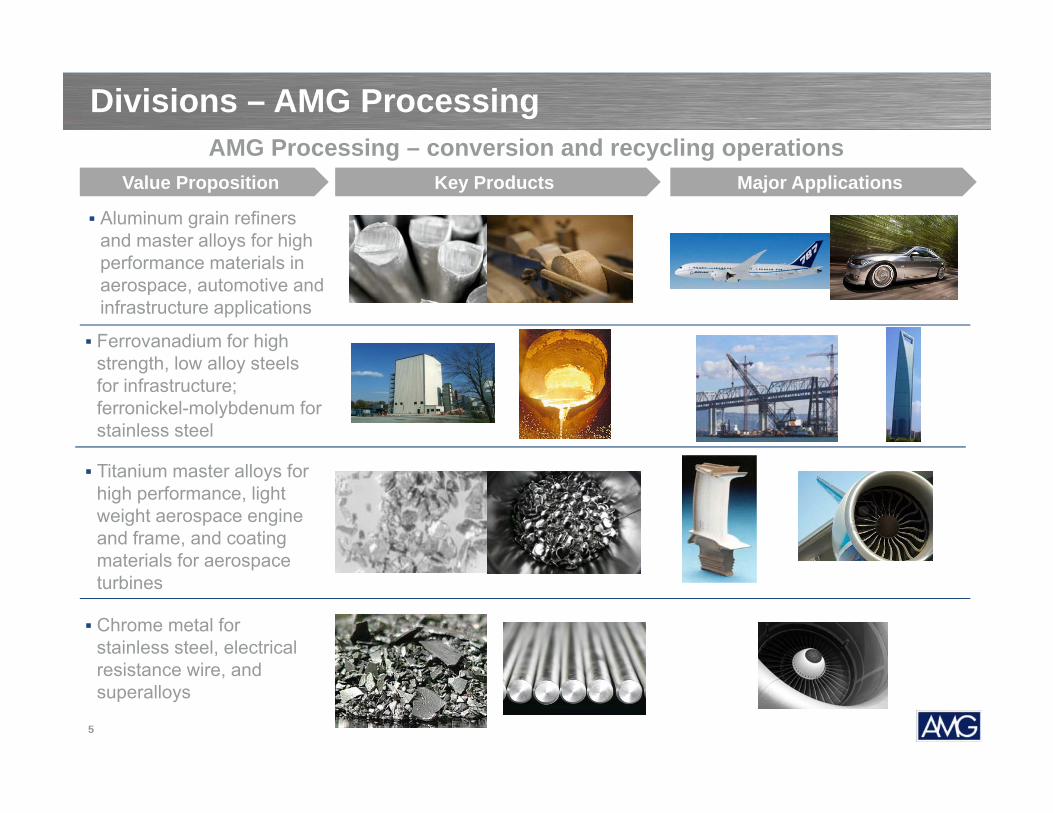
Divisions – AMG Processing
Aluminum grain refiners and master alloys for high performance materials in aerospace, automotive and infrastructure applications
Value Proposition
Ferrovanadium for high strength, low alloy steels for infrastructure; ferronickel-molybdenum for stainless steel
Titanium master alloys for high performance, light weight aerospace engine and frame, and coating materials for aerospace turbines
Major ApplicationsKey Products
AMG Processing – conversion and recycling operations
Chrome metal for stainless steel, electrical resistance wire, and superalloys

6
Divisions – AMG Mining
Antimony trioxide and master batches for flame retardant on electronics, paints, and plastics
Value Proposition
Conflict-free tantalum concentrate for tantalum capacitors used on portable electronics
Natural graphite for building insulation materials, energy storage, li-ion batteries for electrical vehicle, and lubricants
Silicon metal for aluminum production and solar panel materials
Major ApplicationsKey Products
AMG Mining – mine based value chains
Tantalum and niobium superalloys for aerospace engines and industrial gas turbines

7
Divisions – AMG Engineering
Vacuum melting and re-melting furnaces for high-performance titanium, steel and alloys, and purification of rare metals and alloys
Value Proposition
Vacuum heat treatment furnaces and services for high-performance materials of aerospace and automotive applications
Vacuum coating furnace for aerospace turbine blade coatings
Vacuum sintering and annealing furnaces for nuclear fuel productions
Major ApplicationsKey Products
AMG Engineering – vacuum systems and services

8
AMG Global Locations
area enlarged
above
Offices

9
Critical Raw Materials
Fe
The EU identified 14 critical raw materials* to the European economy – focusing on two determinants – economic importance and supply risk
Note: *European Commission Annex V to the Report of the Ad-hoc Working Group on defining critical raw materials
Materials mined or processed by AMG, or treated in AMG vacuum systems
Materials treated by AMG vacuum systems
REE
Li
Al
V
Sb
Cr
Ni
CTa
Nb
Ti SiMo

10
Critical Raw Materials – Definition*
A critical raw material is one whose risk of supply shortage and itsimpacts on the economy are higher compared with most of the other rawmaterials
Demand for these raw materials is driven by the growth of developingeconomies and new emerging technologies
Two types of risks are considered when determining which raw materialsqualify as critical:
Supply risk, which takes into account: Political-economic stability of the producing countries Level of concentration of production(high share of the world’s production
comes from a few countries) Potential for substitution Recycling rate
Environmental country risk, which considers the measures that might be takenby countries with weak environmental performance in order to protect theenvironment and thus possibly endanger the supply of raw materials
Note: *European Commission Report of the Ad-hoc Working Group on defining critical raw materials

11
Furnace assembly
Core CompetencesInput OutputUpgrading
AM
G P
roce
ssin
gA
MG
Min
ing
AM
G E
ngin
eerin
g
Al, Mn, Cr, Fe, Ti, B etc. Al Master Alloys & Grain Refiners
Cr oxide, Al powder Cr MetalPyrometallurgy(smelting)
V-contained spent catalyst& slag FeV, FeNiMo, and V chemicals
Ti, V, Nb, Mo, Al Ti Master Alloys/Ti Alloys
Ta/Nb ore, FeTaNb Ta/Nb concentrate
Natural graphite ore Advanced graphite products
Antimony metal ATO & masterbatches
Quartz, wood chips, coal Silicon metal
Design elements,Furnace components
High-performance metallurgical furnaces
Mining
Mineral Processing
Hydrometallurgy
Pyrometallurgy (smelting, oxidation)
Heat-treated partsEngine components
Pyrometallurgy (roasting, smelting)
Pyrometallurgy (smelting), Alloying
Pyrometallurgy, Alloying
Ta/Nb concentrate Ta/Nb oxide
Heat treatment services
Focus on Proprietary Technologies

12
AMG’s Strategy - The Complexity Issue
Complexity - Vertical
EngineeringMaterials
Complexity -Horizontal
Vacuum Furnaces96.0
MOLYBDENUM
58.7NICKEL

13
AMG’s Strategy - The Uniqueness Challenge
Type 1RARE
Quality of Strategy
Ease
of A
sses
smen
t
Type 2
Type 3
LowHigh
Low
High
■ Quality of Strategy■ Ability to generate cash
over the long run■ Ease of Assessment
■ Effort required to estimate future performance
Significant L-T Improvement
Achieved
Ongoing Strategic Projects
Source: Harvard Business Review, November 2013, Company modified
- - - -- - - --$2.1 -$1.6
$45.0
$65.6$57.3
2009 2010 2011 2012 Sep YTD2013
( in USD millions)
Measurement of Strategy
Cash Flow from Operations
14
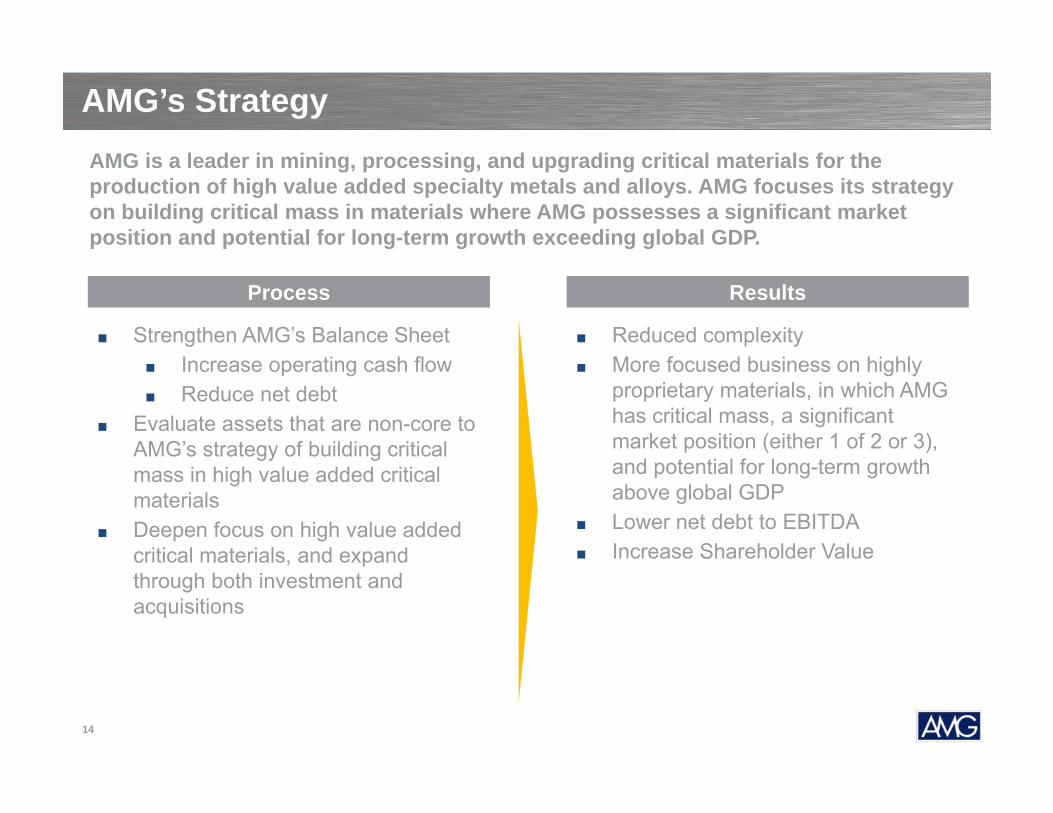
AMG’s StrategyAMG is a leader in mining, processing, and upgrading critical materials for the production of high value added specialty metals and alloys. AMG focuses its strategy on building critical mass in materials where AMG possesses a significant market position and potential for long-term growth exceeding global GDP.
Process Results
■ Strengthen AMG’s Balance Sheet■ Increase operating cash flow ■ Reduce net debt
■ Evaluate assets that are non-core to AMG’s strategy of building critical mass in high value added critical materials
■ Deepen focus on high value added critical materials, and expand through both investment and acquisitions
■ Reduced complexity■ More focused business on highly
proprietary materials, in which AMG has critical mass, a significant market position (either 1 of 2 or 3), and potential for long-term growth above global GDP
■ Lower net debt to EBITDA■ Increase Shareholder Value

15
Strategy - Industry Consolidation Horizontal – Aluminum AMG acquired KB Alloys in February 2011
AMG was the market leader in Europe and South America KB Alloys was the market leader in North America
Combination created the #1 global player
PrimaryAluminum
PrimaryAluminum
Aluminum Alloys
Aluminum Alloys
Grain Refiners &
Master Alloys
Grain Refiners &
Master Alloys
AMG(#1)AMG(#1)
KB Alloys(#2)
KB Alloys(#2)
KBM(Netherlands)
KBM(Netherlands)
Aleastur(Spain)
Aleastur(Spain)
World leader inaluminum master alloys
and grain refiners
BauxiteBauxite
Increased market share with global footprint giving AMG critical mass in the aluminum industry Cost synergies and expansion of best practices and core competencies leading to:
SG&A down 12% EBITDA up 130% Working capital down 60%

16
Financial Highlights

17
Revenue
$69.1 $84.9
$110.1
$84.8 $81.6
2009 2010 2011 2012 LTM2013
Financial Highlights – 5 Year
$867.4 $990.5
$1,351.3 $1,215.6 $1,149.6
2009 2010 2011 2012 LTM2013
Gross Profit
EBITDA
(in USD millions)
$165.6 $178.6
$238.0
$196.5 $178.1
2009 2010 2011 2012 LTM2013
(in USD millions)
(in USD millions)
10.5%11.9%
15.1%
9.5% 8.9%
2009 2010 2011 2012 LTM2013
ROCE
18
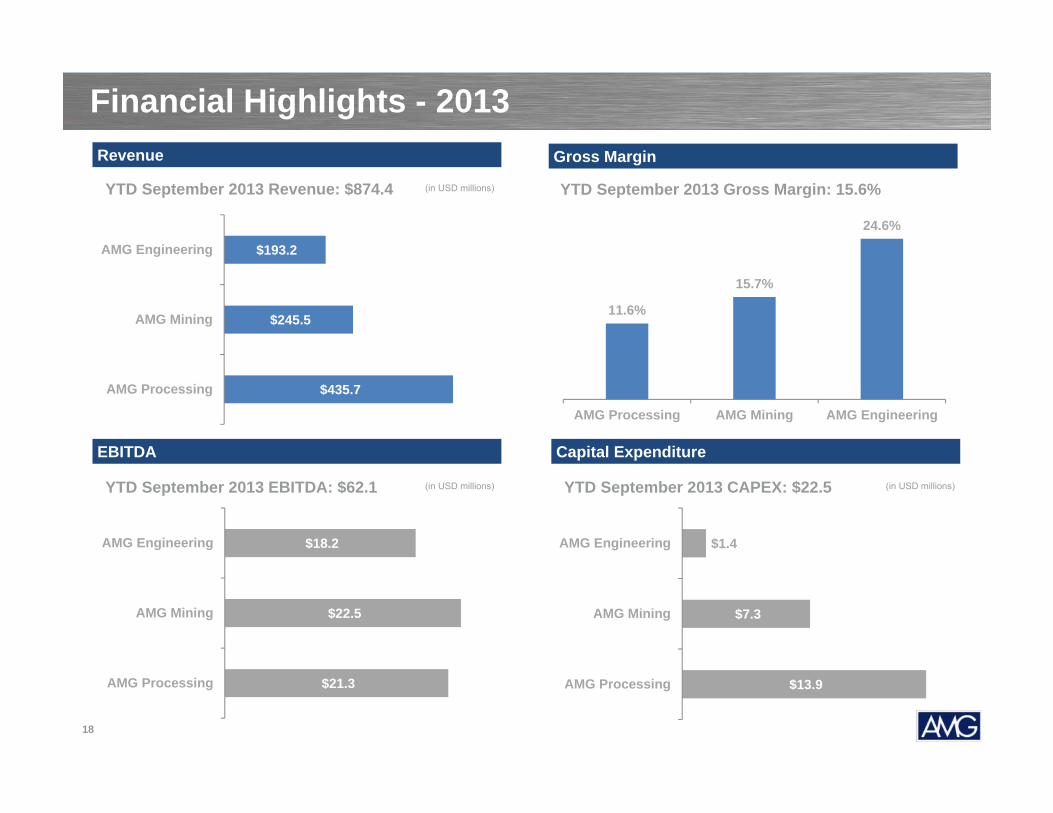
Financial Highlights - 2013 Revenue
EBITDA
(in USD millions)
(in USD millions)YTD September 2013 EBITDA: $62.1
YTD September 2013 Revenue: $874.4 YTD September 2013 Gross Margin: 15.6%
Gross Margin
Capital Expenditure
(in USD millions)YTD September 2013 CAPEX: $22.5
$435.7
$245.5
$193.2
AMG Processing
AMG Mining
AMG Engineering
$21.3
$22.5
$18.2
AMG Processing
AMG Mining
AMG Engineering
11.6%
15.7%
24.6%
AMG Processing AMG Mining AMG Engineering
$13.9
$7.3
$1.4
AMG Processing
AMG Mining
AMG Engineering

19
Capital Base
■ Net debt: $163.6M■ A reduction of $16.4 million in Q3’13■ Debt to capitalization: 0.67x■ Net Debt to LTM EBITDA: 2.01x
■ Revolver availability: $73.7M■ Total liquidity: $190.0M
■ AMG’s primary debt facility is a $370 million term loan and revolving credit facility■ 5 year term – until 2016■ Obtained waiver for tangible net
worth covenant as of June 30, 2013■ Currently in compliance with all debt
covenants
■ YTD Q3’13 $57.3M Cash Flows from Operations, up 71% compared to YTD Q3’12
$147.2
$189.0 $194.2
$163.6
Dec-10 Dec-11 Dec-12 Sep. 2013
( in USD millions)
Net Debt

20
End Markets
Aerospace - 9%vs. YTD Sep. 2012
Titanium alloys and Chrome metal revenue
decreased
Aerospace - 9%vs. YTD Sep. 2012
Titanium alloys and Chrome metal revenue
decreased
YTD September 2013: $874.4
Revenue Gross Profit
YTD September 2013: $136.7( in USD millions) ( in USD millions)
Aerospace40.7%
Infrastructure12.2%
Energy18.1%
Specialty Metals & Chemicals
29.0%
Aerospace45.4%
Energy17.2%
Specialty Metals & Chemicals
27.6
Infrastructure9.8%
Aerospace - 2%vs. YTD Sep. 2012
Focusing on higher margin products for
Aerospace
Aerospace - 2%vs. YTD Sep. 2012
Focusing on higher margin products for
Aerospace
Appendix:AMG’s Critical Materials for Aerospace
& Critical Materials Prices

22
■ AMG’s Aerospace Revenue consists of a diversified mix of high value added products and services
AMG - Aerospace
Energy18.1%
Aerospace40.7%
Infrastructure12.2%
Specialty Metals & Chemicals
29.0%
Ti Alloys & Coatings
6.0%
Superalloys3.7% Aluminum
Alloys9.3%
Ferrovanadium2.5%
Engineering19.2%
Note: YTD 2013 Revenue
Revenue by End Market Aerospace Revenue by Division

23
AMG – Aerospace
Ti-64 Ti-6246 Ti-834 Ni-basedSuperalloys
Example
Operating temperature [°C] up to 550 up to 600 1,230 - 730 up to 730up to 400
TiAl

24
AMG – AerospaceCOMPRESSOR BLADES
CobaltChromiumNiobiumTantalum
TitaniumTungsten
Vanadium (Ti Alloys)
COMPRESSOR DISCSCobalt
ChromiumHafnium
TantalumTitaniumTungsten
Vanadium (Ti Alloys)
LP TURBINE BLADESCobalt
ChromiumNiobiumTantalum
Tungsten
HP TURBINE DISCSCobalt
ChromiumTantalum
Tungsten
EXHAUSTCobalt
ChromiumRare Earths
Tungsten
LP TURBINE DISCSCobalt
ChromiumNiobiumTantalum
Tungsten
COMBUSTORCobalt
ChromiumRare Earths
Tungsten
HP TURBINE BLADESCobalt
ChromiumHafniumPlatinumRhenium
Rare EarthsTantalum
Tungsten
ANCILLARIES & CONTROLSYSTEMS
CobaltRare EarthsTantalum
Materials produced by AMG

25
AMG – Aerospace
New AMG Product: Vacuum-coated transducers are applied to the bolts on the 3 Bearing Swivel Module of the Joint Strike Fighter F-35B
26
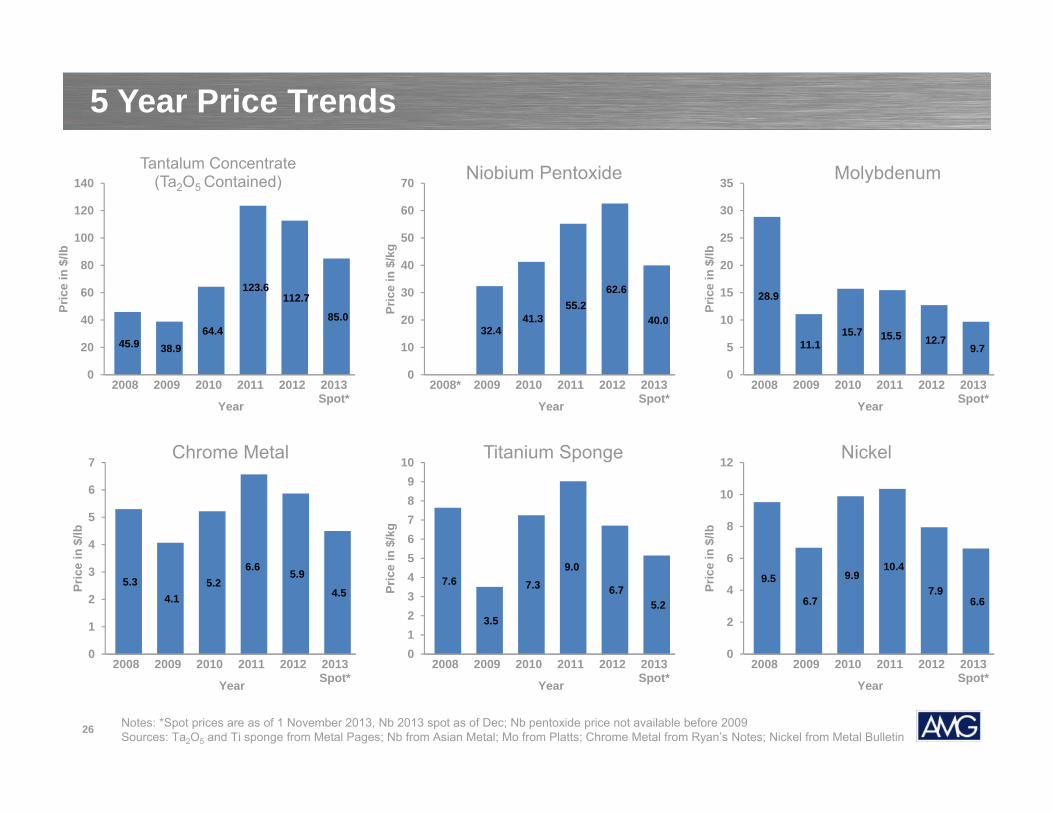
5 Year Price Trends
45.9 38.9 64.4
123.6 112.7
85.0
0
20
40
60
80
100
120
140
2008 2009 2010 2011 2012 2013Spot*
Pric
e in
$/lb
Year
Tantalum Concentrate (Ta2O5 Contained)
Notes: *Spot prices are as of 1 November 2013, Nb 2013 spot as of Dec; Nb pentoxide price not available before 2009 Sources: Ta2O5 and Ti sponge from Metal Pages; Nb from Asian Metal; Mo from Platts; Chrome Metal from Ryan’s Notes; Nickel from Metal Bulletin
32.4 41.3
55.2 62.6
40.0
0
10
20
30
40
50
60
70
2008* 2009 2010 2011 2012 2013Spot*
Pric
e in
$/k
gYear
Niobium Pentoxide
28.9
11.1 15.7 15.5 12.7
9.7
0
5
10
15
20
25
30
35
2008 2009 2010 2011 2012 2013Spot*
Pric
e in
$/lb
Year
Molybdenum
5.3 4.1
5.2 6.6 5.9
4.5
0
1
2
3
4
5
6
7
2008 2009 2010 2011 2012 2013Spot*
Pric
e in
$/lb
Year
Chrome Metal
7.6
3.5
7.3 9.0
6.7 5.2
0123456789
10
2008 2009 2010 2011 2012 2013Spot*
Pric
e in
$/k
g
Year
Titanium Sponge
9.5
6.7
9.9 10.4
7.9 6.6
0
2
4
6
8
10
12
2008 2009 2010 2011 2012 2013Spot*
Pric
e in
$/lb
Year
Nickel

27
5 Year Price Trends
2,567
1,670 2,173 2,395 2,018 1,817
0
500
1,000
1,500
2,000
2,500
3,000
2008 2009 2010 2011 2012 2013Spot*
Pric
e in
$/m
t
Year
Aluminum
933
530 635 700
582 523
0100200300400500600700800900
1,000
2008 2009 2010 2011 2012 2013Spot*
Pric
e in
$/m
t
Year
Carbon Steel
174
125 143
161 131 124
020406080
100120140160180200
2008 2009 2010 2011 2012 2013Spot*
Pric
e in
cen
ts/lb
Year
Silicon
6,141 5,210
9,047
14,722 12,863
10,350
0
2,000
4,000
6,000
8,000
10,000
12,000
14,000
16,000
2008 2009 2010 2011 2012 2013Spot*
Pric
e in
$/m
t
Year
Antimony
30.9
10.9 14.5 14.8 14.9 12.3
0
5
10
15
20
25
30
35
2008 2009 2010 2011 2012 2013Spot*
Pric
e in
$/lb
Year
Ferrovanadium
Note: *Spot prices are as of 1 November 2013Source: FeV from Ryan’s Notes; Al, Carbon Steel, Si and Sb from Metal Bulletin; Graphite from Industrial Minerals
784 710 845
1,462 1,454
950
0
200
400
600
800
1,000
1,200
1,400
1,600
2008 2009 2010 2011 2012 2013Spot*
Pric
e in
$/m
tYear
Graphite